Article

Empirical Research on the Evaluation Model and Method of Sustainability of the Open Source Ecosystem

1
School of Software, Central South University, Changsha 410075, China
2
Department of Information Management, Hunan University of Finance and Economics, Changsha 410075, China
3
Department of Computing, School of Computing, Engineering and Built Environment, Glasgow Caledonian University, Glasgow G4 0BA, UK
4
Department of Computer Science, Missouri State University, Springfield, MO 65897, USA
5
School of Information Science and Engineering, Central South University, Changsha 410075, China
*
Author to whom correspondence should be addressed.
Submission received: 13 November 2018 / Revised: 4 December 2018 / Accepted: 10 December 2018 / Published: 13 December 2018

Abstract

:
The development of open source brings new thinking and production modes to software engineering and computer science, and establishes a software development method and ecological environment in which groups participate. Regardless of investors, developers, participants, and managers, they are most concerned about whether the Open Source Ecosystem can be sustainable to ensure that the ecosystem they choose will serve users for a long time. Moreover, the most important quality of the software ecosystem is sustainability, and it is also a research area in Symmetry. Therefore, it is significant to assess the sustainability of the Open Source Ecosystem. However, the current measurement of the sustainability of the Open Source Ecosystem lacks universal measurement indicators, as well as a method and a model. Therefore, this paper constructs an Evaluation Indicators System, which consists of three levels: The target level, the guideline level and the evaluation level, and takes openness, stability, activity, and extensibility as measurement indicators. On this basis, a weight calculation method, based on information contribution values and a Sustainability Assessment Model, is proposed. The models and methods are used to analyze the factors affecting the sustainability of Stack Overflow (SO) ecosystem. Through the analysis, we find that every indicator in the SO ecosystem is partaking in different development trends. The development trend of a single indicator does not represent the sustainable development trend of the whole ecosystem. It is necessary to consider all of the indicators to judge that ecosystem’s sustainability. The research on the sustainability of the Open Source Ecosystem is helpful for judging software health, measuring development efficiency and adjusting organizational structure. It also provides a reference for researchers who study the sustainability of software engineering.

1. Introduction

The Open Source Ecosystem (OSE) is an interconnected, interrelated whole formed by open source participants in accordance with a certain organizational approach, through an Internet-based public technology platform for development activities and the production of open source software [1]. After proposing the concept of OSE, it attracted a large number of researchers to study the various fields of OSE, including the composition, structure, characteristics and health. Among them, the health of the OSE is an important research content. Manikas K. et al. [2] defined OSE’s health as the ability to maintain variables and productivity over time, while proposing healthy characteristics that are liveliness, activity, and longevity. Jansen et al. [3] provided the Open Source Ecosystem Health Operationalization (OSEHO) to assess the health of the OSE using productivity, robustness and niche creation. Lu Y. et al. [4] considered sustainability to be a key factor in the research characteristics of Open Source Ecosystem health. Wan Jiangping et al. [5] believes that a healthy OSE must include qualities that are sustainable. The traditional software systems are primarily concerned with the progress and budget, and the OSE pays more attention to the state of the entire system [6]. For investors, what is important is whether the ecosystem is developing. Developers or participants are concerned with whether the selected ecosystem is active. Managers want to know if the state of the ecosystem needs to make adjustments to management techniques and methods to ensure its sustainability. Regardless of investors, developers, participants, and managers, the greatest concern is whether the system can sustainably develop to ensure that it can serve users for an extended period of time. Therefore, sustainability is an important aspect of Open Source Ecosystem health research. At present, progress has been made in the understanding and measurement of the sustainability of OSE. Researchers have interpreted the definition and measurement indicators of sustainability of OSE from different perspectives. Penzenstadler et al. [7] proposed that the definition of sustainability is to maintain the functionality of a system over a defined time span and determine the three variables: The system, function and time, to discuss the sustainability of the software. Weiss et al. [8] proposed the “Sustainability Guidelines” to provide guidance for the sustainability of the system design, development, operation and maintenance. However, there are still a number of problems. First, the research on the sustainable development of OSE focuses on open source projects, but the project does not equal the system. Therefore, it is difficult to fully explain the sustainable development status of OSE based on the sustainable development status of the project. Second, the lack of a universal measurement model and methodology for the sustainability of OSE makes it difficult to provide a targeted explanation of the measurement results of a sustainable state. Therefore, it is necessary to construct a universal Evaluation Indicator System and measurement method, which can provide reference for researchers aiming to study the goals related to ecosystem sustainability, such as improving ecosystem activities, assessing the health status of ecosystems, and identify weaknesses in the ecosystem allows the ecosystem manager to take management measures as soon as possible. In addition, better decisions can be made for ecosystem participants, developers, investors, and stakeholders associated with OSE organizations to choose healthy and sustainable ecosystems. It laid the foundation for studying the sustainability of the OSE.
To solve the above problems, this paper mainly makes three contributions: Firstly, this paper proposes a definition of the sustainability of the OSE. Based on the definition of sustainability and the evaluation indicators of natural ecosystem sustainability, openness, stability, activity, and extension are identified as indicators for measuring the sustainability of the OSE. At the same time, with reference to the hierarchical structure for the sustainability measurement model of natural ecosystems, an Evaluation Indicators System, including the target level, the guideline level and the evaluation level, is established. Then, according to the indicators, the measurement model and method of open source ecosystem sustainability are established. The indicator weight of open source ecosystem sustainability is measured by analyzing the information contribution value contained in the indicators, and the Sustainability Assessment Model is proposed to comprehensively evaluate the sustainability of the OSE, providing companies, participants and managers with a basis for collaborative development decision-making. Finally, this paper selects the currently popular open source platform Stack Overflow (SO) for empirical research on sustainability, which is used to verify the applicability of the Evaluation Indicators System, the assessment method and model. SO has been highly popular with software developers and end users. SO is a standard Q&A website on computer science and programming topics and is considered to be one of the most successful OSEs [9]. Between the establishment of SO in 2008 and April 2017, over 6.2 million users registered and over 335,531,000 posts were published, helping over 3.6 million users solve technical problems. In SO, the different roles of questioners, answerers, voters, and commentators collaborate to form an open source community, which is fully consistent with the definition of OSE. Therefore, the research on the sustainable development of OSE using SO is typical and representative.
The paper is organized as follows. Section 2 describes the literature on the sustainability of OSE; Section 3 defines the sustainability of OSE and provides the Evaluation Indicators System and measurement method; Section 4 introduces the SO ecosystem and establishes the SO ecosystem sustainability evaluation indicators system. In Section 5, experimental results on the sustainable development of SO ecosystem are presented and analyzed. The last section presents the paper’s conclusions.

2. Related Work

Analogous to the natural ecosystem, Dhungana et al. [10] proposed that the most important quality of the software ecosystem is sustainability. As a result, researchers defined and assessed the sustainability of software ecosystems from different perspectives. Srba et al. [11,12] found increasingly abundant low quality content in the open source Q&A community and therefore proposed to maintain the long-term sustainability of the ecosystem through a strong reputation mechanism and answerer-recommended methods. Sethanandha et al. [13] proposed to manage the contribution of open source software “patches” (source code and document changes) to help improve the sustainability of open source projects. In addition, Fotrousi et al. [14] evaluated SECO’s health and sustainability by using Key Performance Indicators (KPI). Monteith et al. [15] proposed the sustainability of software development through ecosystem strategies including gatekeepers, planning and road maps, gatekeepers, and business models in response to problems in personnel, technology, software development and science. Gamalielsson et al. [16,17] analyzed the details of the developer of LibreOffice, a branch of the open source project OpenOffice.org, and its impact on ecosystem sustainability from the evolution of project activity, long-term participants and organizational impact. Linus Nyman et al. [18] argue that the possibility to fork serves as the invisible hand of sustainability that ensures that code remains open and that the code that best serves the community lives on. Matragkas et al. [19] ensured the stability of the community by analyzing the diversity of members of the open source software project community, thus enabling the open source community sustainable development. Sahu et al. [20] studied bugs in the github project and quickly solved bugs by publishing them to SO, speeding up the development process of open source projects. Sun Lianshan et al. [21] proposed that the sustainability of the software ecosystem depends on the close cooperation of many organizations, market demands and the timeliness of providing users with more, better, and lower-priced functions and services and proposed to evaluate the sustainability of software ecosystems from three different aspects: Business quality model, product quality model and collaborative quality model. Li Bing et al. [22] proposed that open source ecosystem sustainability is a process, or state, that can be maintained for an extended period of time. Dayu He et al. [23] analyze the characteristics of issues in the Github Open Source Ecosystem through visualization technology to help managers manage and allocate project resources more effectively, reduce software failures, and promote the sustainable development of ecosystems.
Lee et al. [24] studied interdisciplinary sustainable development ecosystems, including software development, software business, and the ecology of music education, promoted interdisciplinary software development, and discovered that interdisciplinary and knowledge transfer are the key conditions for creating sustainable ecosystems. Joo et al. [25] managed business ecosystem sustainability by balancing and coordinating the diversity of roles in the firm. These interdisciplinary methods of evaluating the sustainability of the ecosystem also provide reference values for the design of an OSE’s sustainable evaluation indicator system.
Based on the above analysis, we find that the current research on the sustainability of OSE is to analyze the development status of ecosystems from different perspectives but lacks a universal measurement framework and methodology. Therefore, we construct the Evaluation Indicators System to measure the overall state of the ecosystem.

3. Construction of the Evaluation Indicators System

This section primarily describes the definition of the sustainability and the factors involved in the sustainability of OSE. Next, sustainability metrics of OSE are proposed, and an Evaluation Indicators System is constructed based on the hierarchical structure for the sustainability measurement model of the natural ecosystem.

3.1. Definition of Sustainability

The term “sustainability” was proposed by ecologists, which is called “ecological sustainability.” It is intended to illustrate the balance between natural resources and their development and utilization. Studies have shown that natural ecosystems have a heuristic effect on OSE. Many aspects of OSE can be extended from natural ecosystems. For example, Dhungana et al. [10] compared the natural ecosystem with the OSE in terms of diversity, sustainability, and energy flow in the ecology, pointing out that the OSE is highly similar to the natural ecosystem. Moreover, sustainability is defined as a system that can increase or maintain a community of its users or developers over a longer period of time and can withstand sudden changes. Li Bing et al. [22] discussed the composition, structure, model and characteristics of the OSE ecosystem with reference to the natural ecosystem, proposed the knowledge chain structure of OSE for the food chain of the natural ecosystem, and further proposed that sustainability refers to a process or state that can be maintained for a long time. In addition, Wan Jiangping et al. [5] proposed that the sustainability of OSE means that the system can continuously tap its inherent potential. Penzenstadler et al. [7] proposed that sustainability can be defined as maintaining the functionality of a system over a defined time span. In general, “sustainability” refers to the ability to maintain or support an objective thing permanently or indefinitely. In a dynamic sense, it means the ability to sustain or support the healthy existence and development of a system, persistently or indefinitely. For a sustainable ecosystem, interaction with the environment ultimately promotes systemic health and development, rather than degradation or extinction. Accordingly, we define open source ecosystem sustainability as the potential initiative of the software ecosystem to permanently sustain or support its own dynamic health and its evolutionary evolution. This definition includes two meanings: First, the system is now in a state of steady development; second, the system will continue to be in that state in the future.

3.2. Evaluation Indicators System for the Sustainability of OSE

The Evaluation Indicators System of OSE sustainability is a set of indicators that reflects the overall development status from different aspects. In the natural ecosystem, researchers propose different factors for assessing sustainability, such as openness [22,26], stability [27,28], integrity [29], productivity [30,31], regulation [22], resistance [4], diversity [26,31,32], drivers [4], organizational structure [33], a propensity for growth [2], and in line with development trends [14]. Table 1 shows the meaning of these influencing factors. Inspired by the assessment of the sustainability of natural ecosystems, this article analyzes and studies the factors affecting the sustainability of OSE. Based on the description of the sustainability assessment factors for natural ecosystems in Table 1, we find that some of these concepts have similarities and overlaps. Among them, openness and integrity emphasize the relationship between ecosystems and external or internal, so we classify openness and integrity as openness. The meaning of stability includes the avoidance, tolerance and resilience. When assessing the stability of the ecosystem, the most common indicators are organizational structure and diversity, therefore, we generalize the related factors such as regulation, resistance, diversity, and organizational structure, and define it as stability. Productivity and drivers represent the frequency of species activity within an ecosystem, so it is defined as activity; The propensity for growth and the ability to conform to development trend represent the capacity of ecosystem development, so it is defined as extensibility.
Among these factors, openness is the prerequisite for the sustainable development of ecosystems and represents the communication function of the entire ecosystem within the external environment; stability is the basis of sustainability and represents a relatively stable state in the long-term development of the system; activity is a power assessment of sustainability, representing the frequency of species activity within the system, that is, the vitality of the system; extensibility reflects the possibility of the future development of ecosystems and represents the system’s ability to develop into the future. In addition, these four factors also reflect the meaning of sustainability. Openness and stability reflect the stable development status of the definition of ecosystem sustainability, while activity and extensibility reflect an extension of the development capability within that same definition. As a reference, we choose openness, stability, activity and extensibility as indicators to measure the sustainability of OSE. 
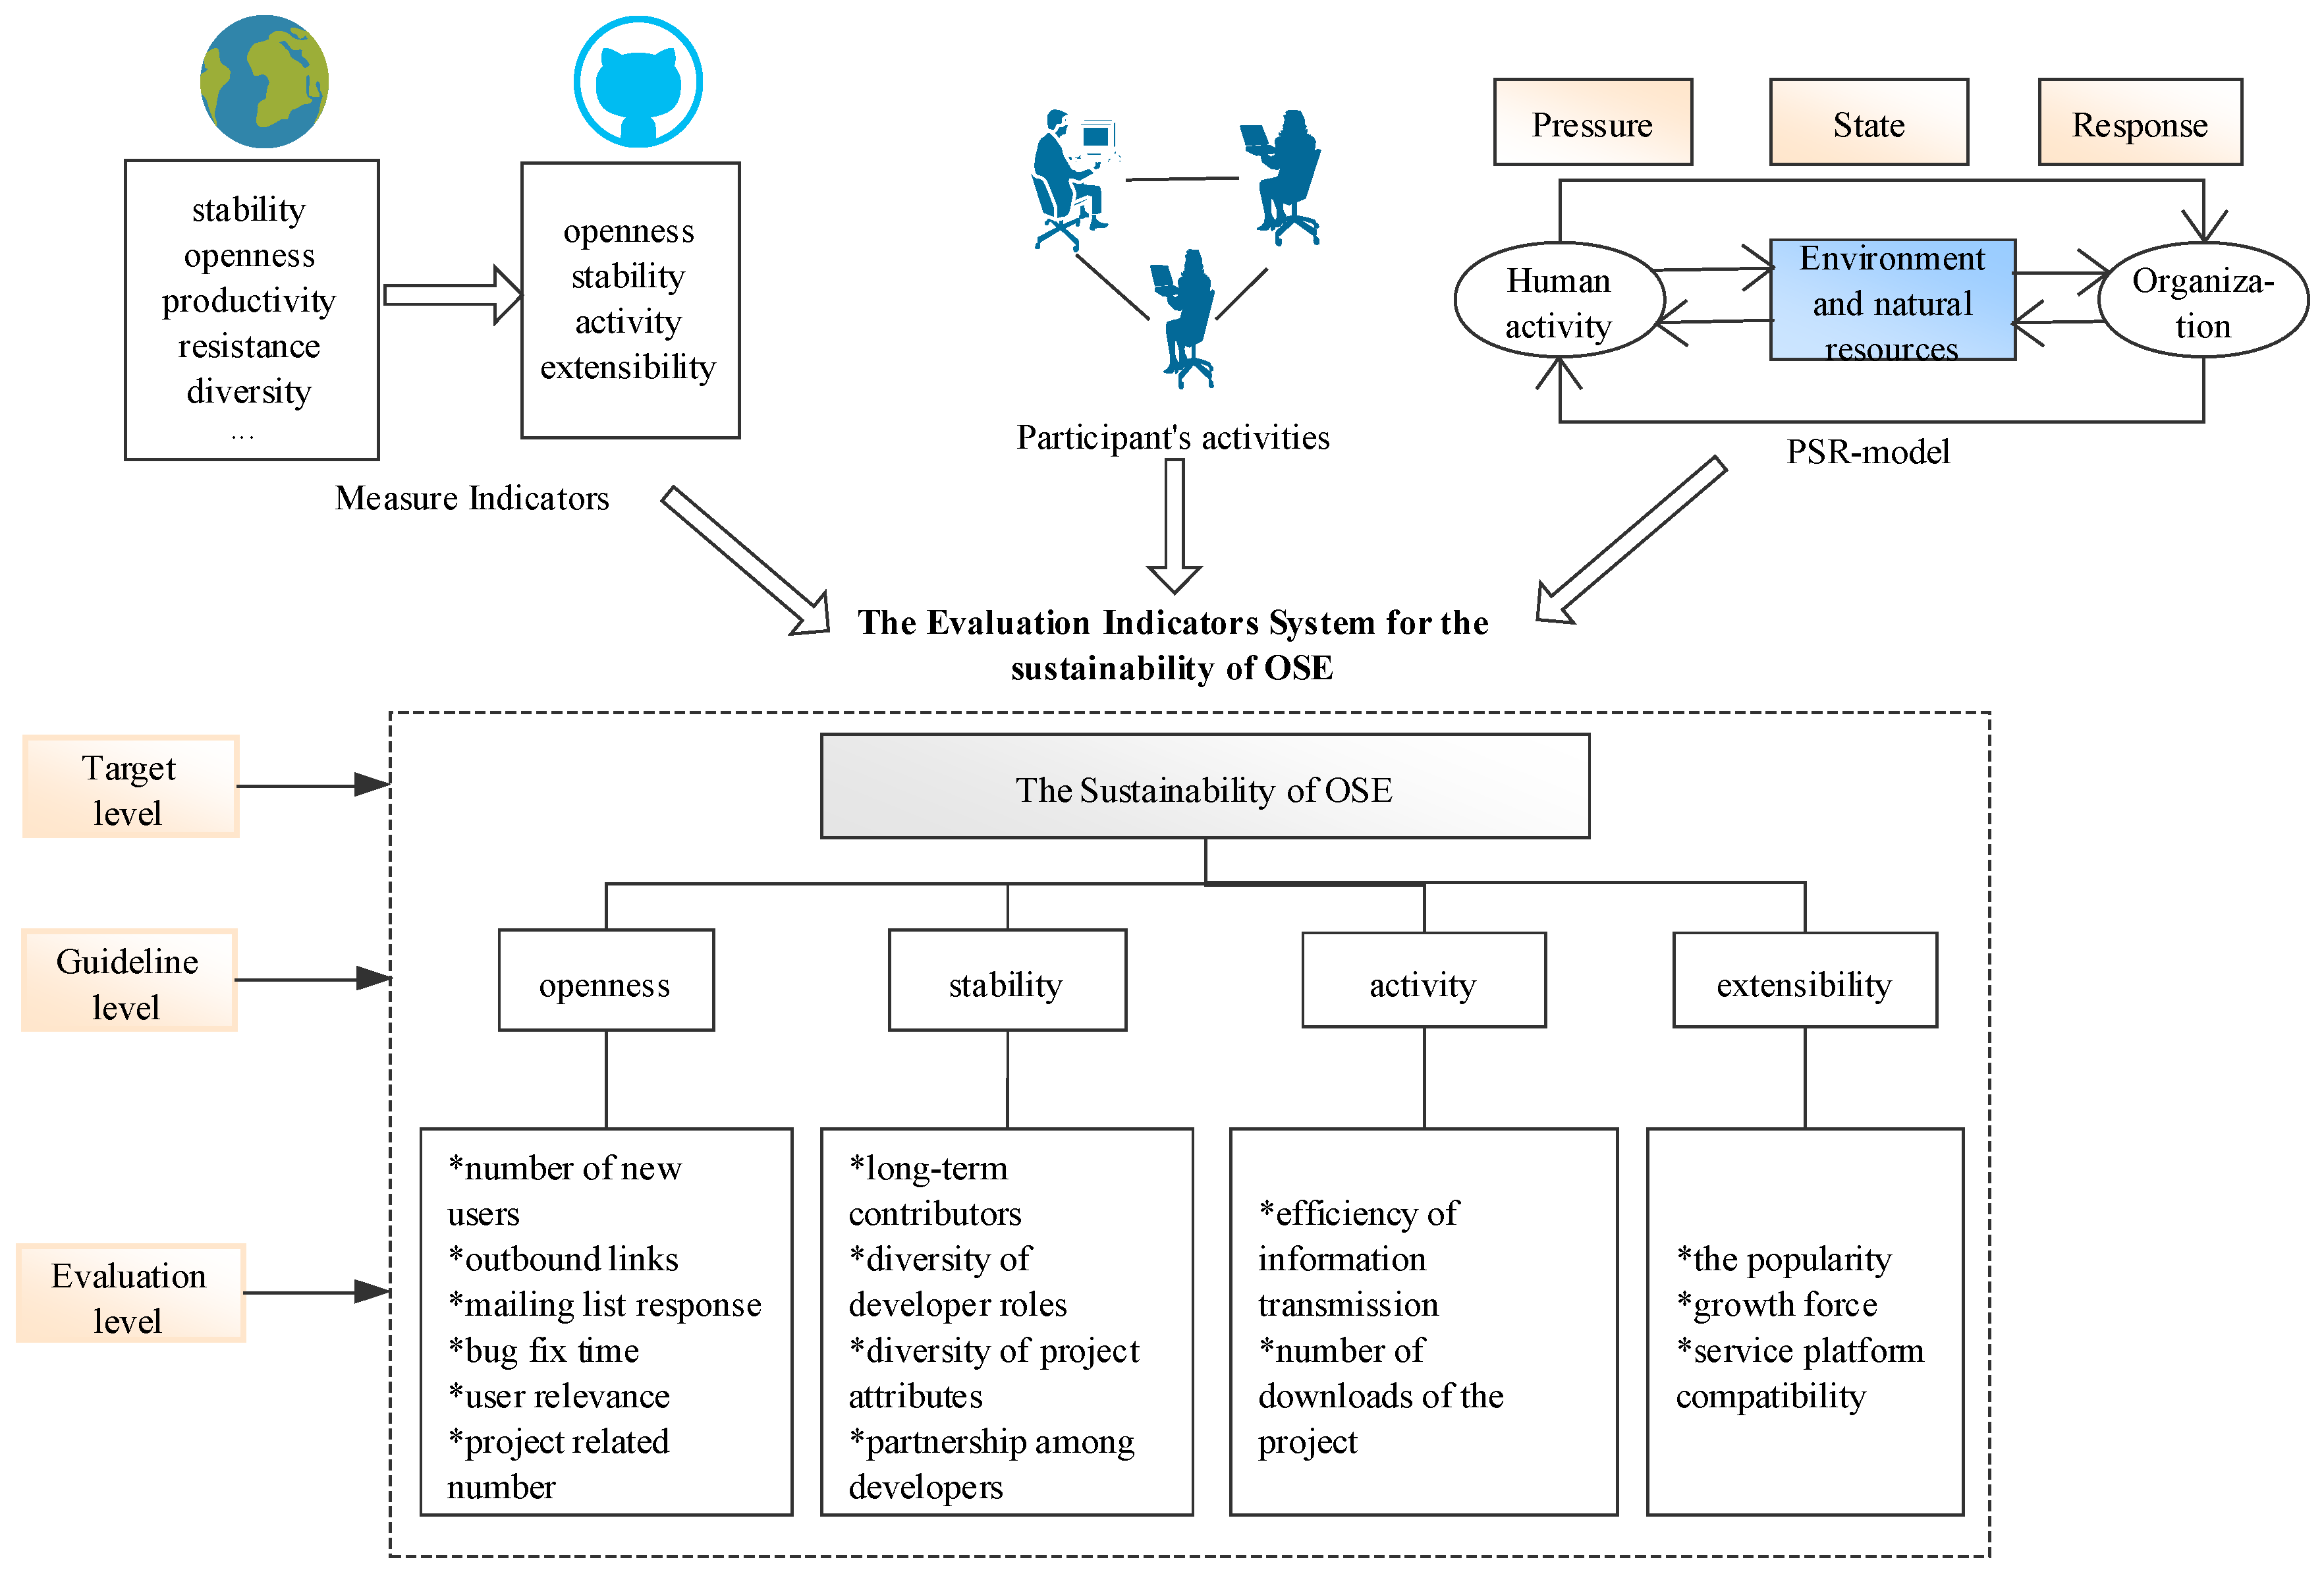
Figure 1 shows the indicators for assessing ecosystem sustainability.
Based on these characteristics, with reference to the PSR (Pressure-State-Response) model [34] of the sustainability of natural ecosystems, three levels of target, guideline, and evaluation are established to analyze the sustainability of OSE. The target level indicates that the main purpose of the evaluation system is to measure the sustainability of OSE; the guideline level is the guiding principle that is followed to achieve the goal of measuring the sustainability of OSE. This paper uses openness, stability, activity, and extensibility as indicators of the guideline level. The evaluation level indicators are based on the participants’ activities to determine the influencing factors. In the ecosystem, the participants’ activities are actually the reflection of group collaboration. In the Internet environment, the participants with dispersed, independent and different backgrounds are openly convened by specific organizations or individuals, and voluntarily form network teams relying on common interests and perceptions, and then collaborate to complete high-quality and complex team work. At present, group collaboration is also an important mechanism for the operation of OSE. Therefore, the evaluation level is used to determine the factors that influence the indicators of the guideline level according to the various activities of the ecosystem participants in order to measure the sustainability of OSE. This also makes the Evaluation Indicators System suitable for more OSE with group cooperation mechanism, such as Github, StackOverflow, SourceForge, Topcoder and other OSE. Figure 2 shows the Evaluation Indicators System for the sustainability of OSE. The following describes each indicator in detail.

3.2.1. Openness

Openness represents the ability of the entire ecosystem to communicate with the outside environment or the ability of users within the ecosystem to participate. Therefore, this paper evaluates the openness of OSE from these two perspectives. The communication between the ecosystem and the external environment is mainly reflected in the interaction between the personnel and the ecosystem. Anyone can register, submit content, view questions, download code, or engage in other related activities. The community is likely to have new users join at any time, so it is possible to communicate with the outside at any time. In addition, outbound links to other software ecosystems also indicate the links between the ecosystem and other ecosystems, and other ecosystems rely exclusively upon it. For example, bugs in the GitHub project are quickly resolved by posting to Stack Overflow, which accelerates the project development process. This speedy resolution indicates that there is communication and mutual promotion between the GitHub ecosystem and the Stack Overflow ecosystem. Therefore, this paper uses the number of new users and outbound links as indicators for measuring the ability of the ecosystem to communicate openly with the outside environment.
Internal communication in the ecosystem is primarily reflected in the internal interaction of users in OSE. The open source ecosystem provides users with interactive channels, such as mailing lists, bug libraries, and forums. The more active a mailing list response, the more users may contribute and use the project. Bug fix time represents the speed of reporting and solving problems in the ecosystem. The relevance of users to each other within the forum represents the degree of intimacy between users. At the same time, the project related number is also an important index for evaluating the internal openness of the ecosystem. The project related number refers to the number of connections between software products and other projects and represents the exchange and sharing of information between projects. The relationship between projects can be roughly divided into three categories, namely, similarity, co-use and dependence. Similarity means that there are common functional modules between two projects; co-use refers to multiple projects that are related to a common goal; “project A dependent project B” refers to project B as a dependent library, framework, or other necessary component of project A. Therefore, this article uses the mailing list response, bug fix time, user relevance, and the project related number to evaluate the indicators of internal communication within the ecosystem.

3.2.2. Stability

Stability means that the state of the ecosystem does not fluctuate strongly over time and instead remains stable. First, long-term contributors are significant to the stable development of the ecosystem. In OSE, only a small number of users actively participate in the project, solve project problems in a timely manner, accelerate project progress, and make long-term contributions to the stability of the ecosystem. In addition, the diversity of developer roles and the diversity of project attributes help enhance the resistance and recovery capabilities of the software ecosystem. Through the diversity of roles, the task can be temporarily represented by other developers of similar roles when they are disturbed; through the diversity of project attributes, if the only developer with a certain role in a team leaves, the alternate member with the ability to fill that role can be introduced from a wider scope such that the project development process can return to normal sooner. If there is a partnership among developers and a network of developers forms, the lost number of developers will be reduced, and the stability of the ecosystem will be maintained. For example, the developers on GitHub are all gathered on the website for the development of the project; therefore, naturally, it is possible to build the developers network with the project as a link. Developers who develop the same project belong to the same social network. The more public projects there are, the closer the two developers are. Therefore, the long-term contributors, the diversity of developer roles, the diversity of project attributes, and the partnership among developers can be used as important indicators for measuring ecosystem stability.

3.2.3. Activity

Activity is a comprehensive manifestation of the overall life and functioning status of the ecosystem, in which the internal members are the performers of the ecosystem vitality, and the constant sharing and exchange of information among user members keep the ecosystem in an active state of development. Therefore, this paper uses the efficiency of information transmission in the ecosystem as an evaluation criterion for activity. The efficiency of information transmission indicates the frequency and contribution of developers’ activities. For example, developers constantly update and increase the number of lines of code or solve problems in a project in a timely manner, passing this information to other developers to better update the project. At the same time, the greater the number of downloads is for the project, the more end users use the product, thereby demonstrating the activity of the project.

3.2.4. Extensibility

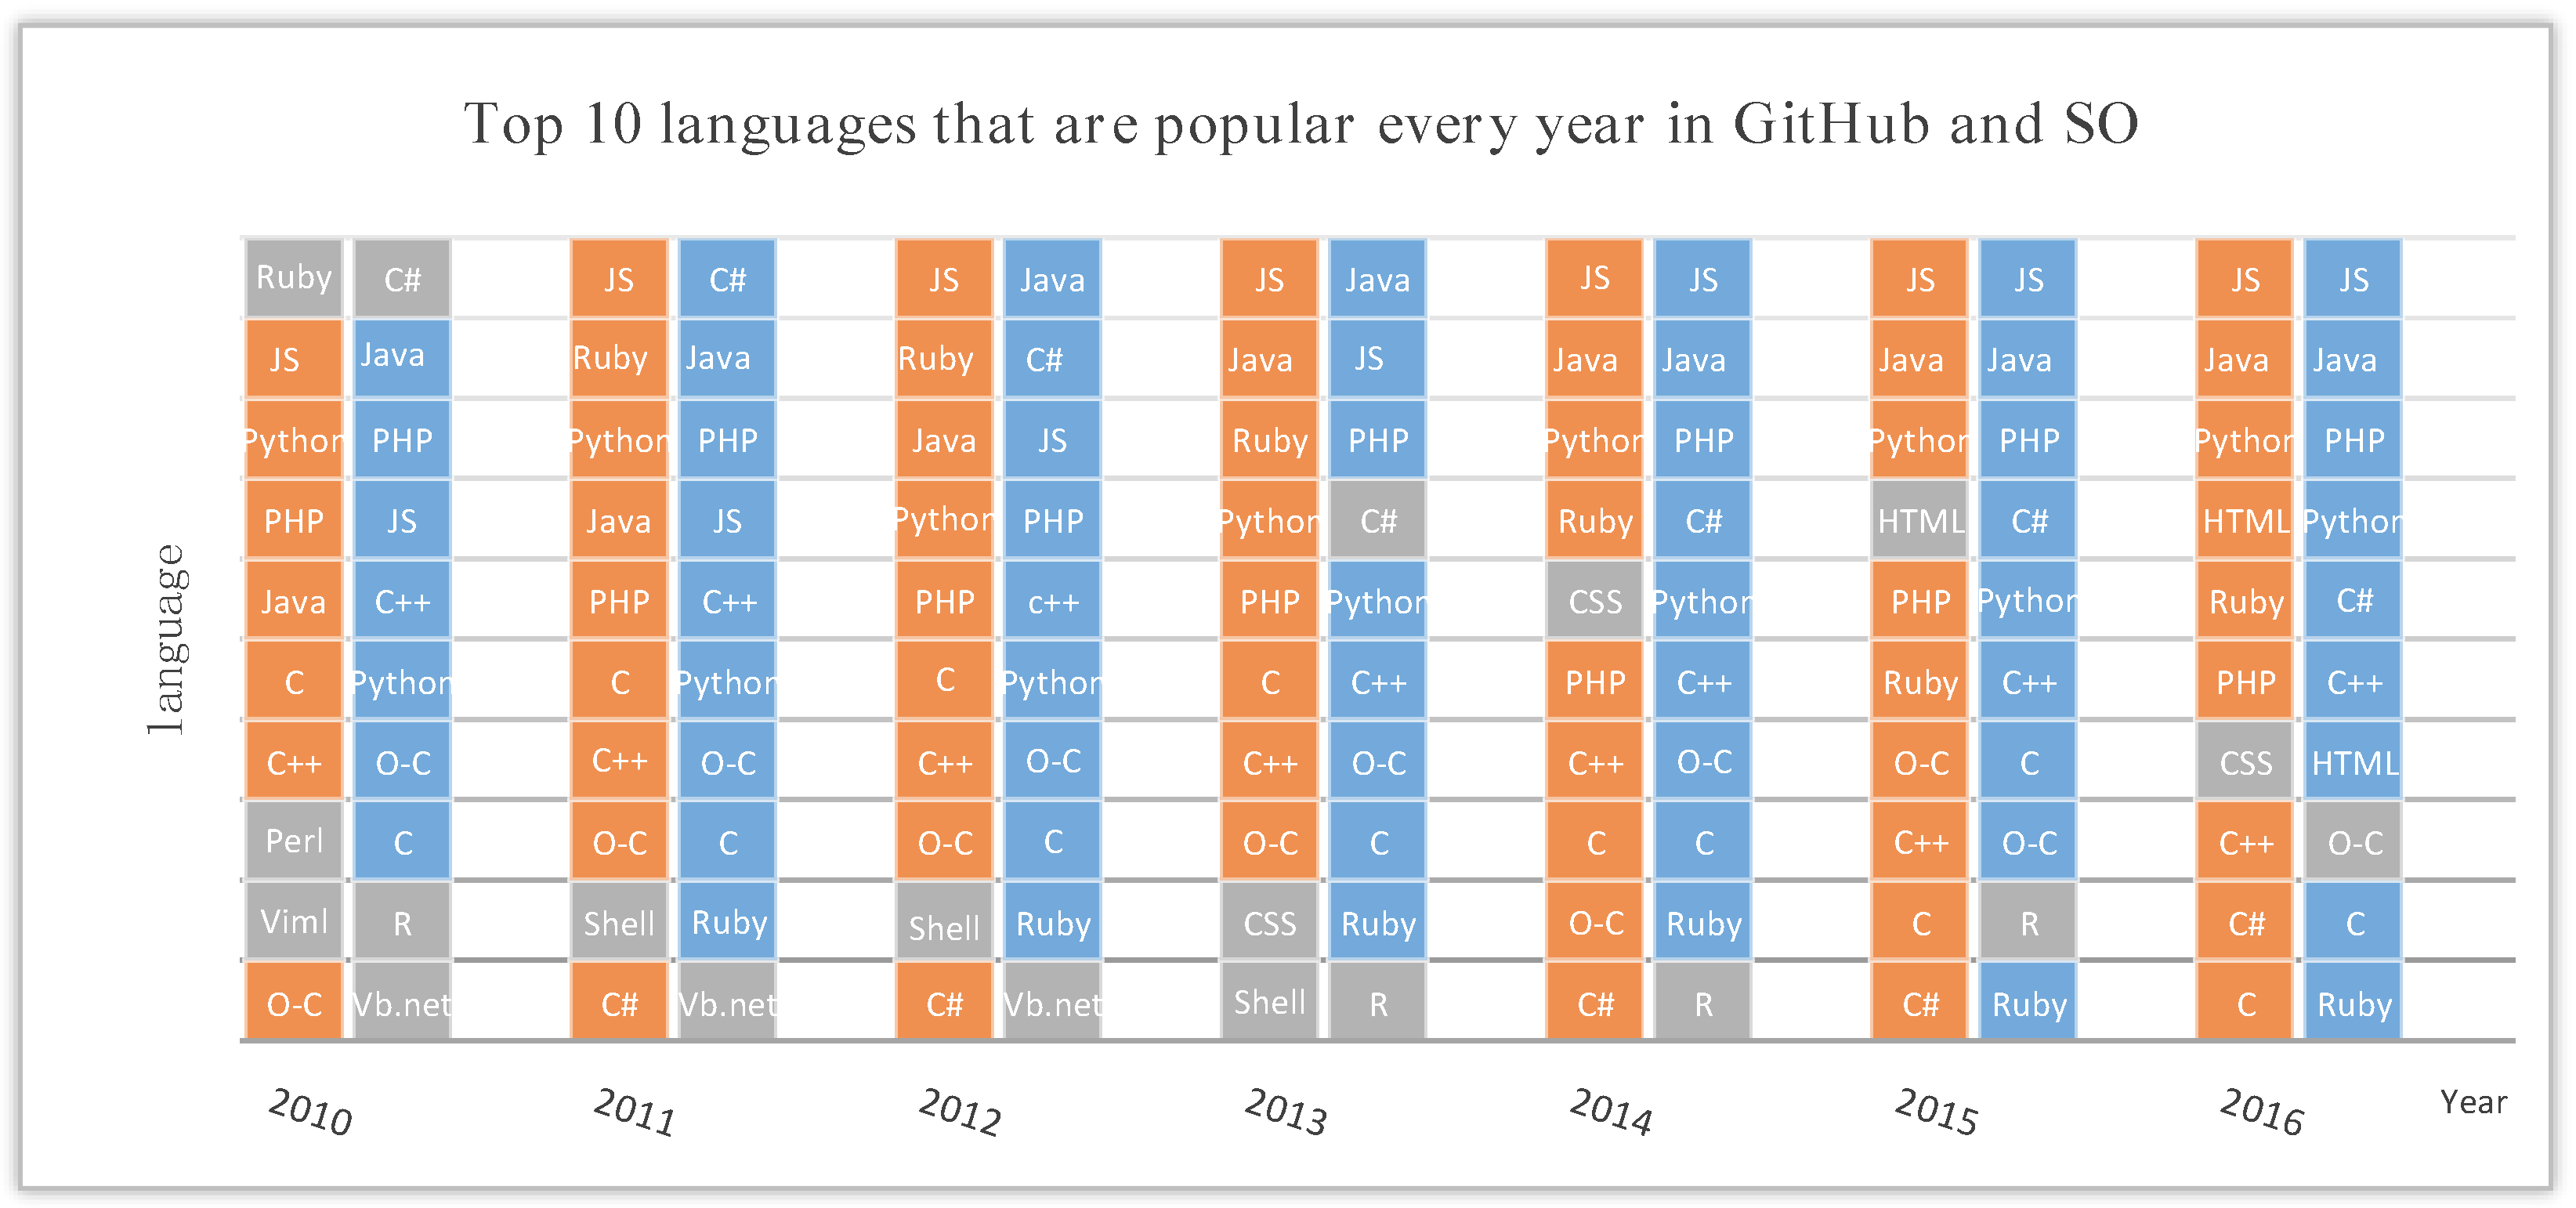
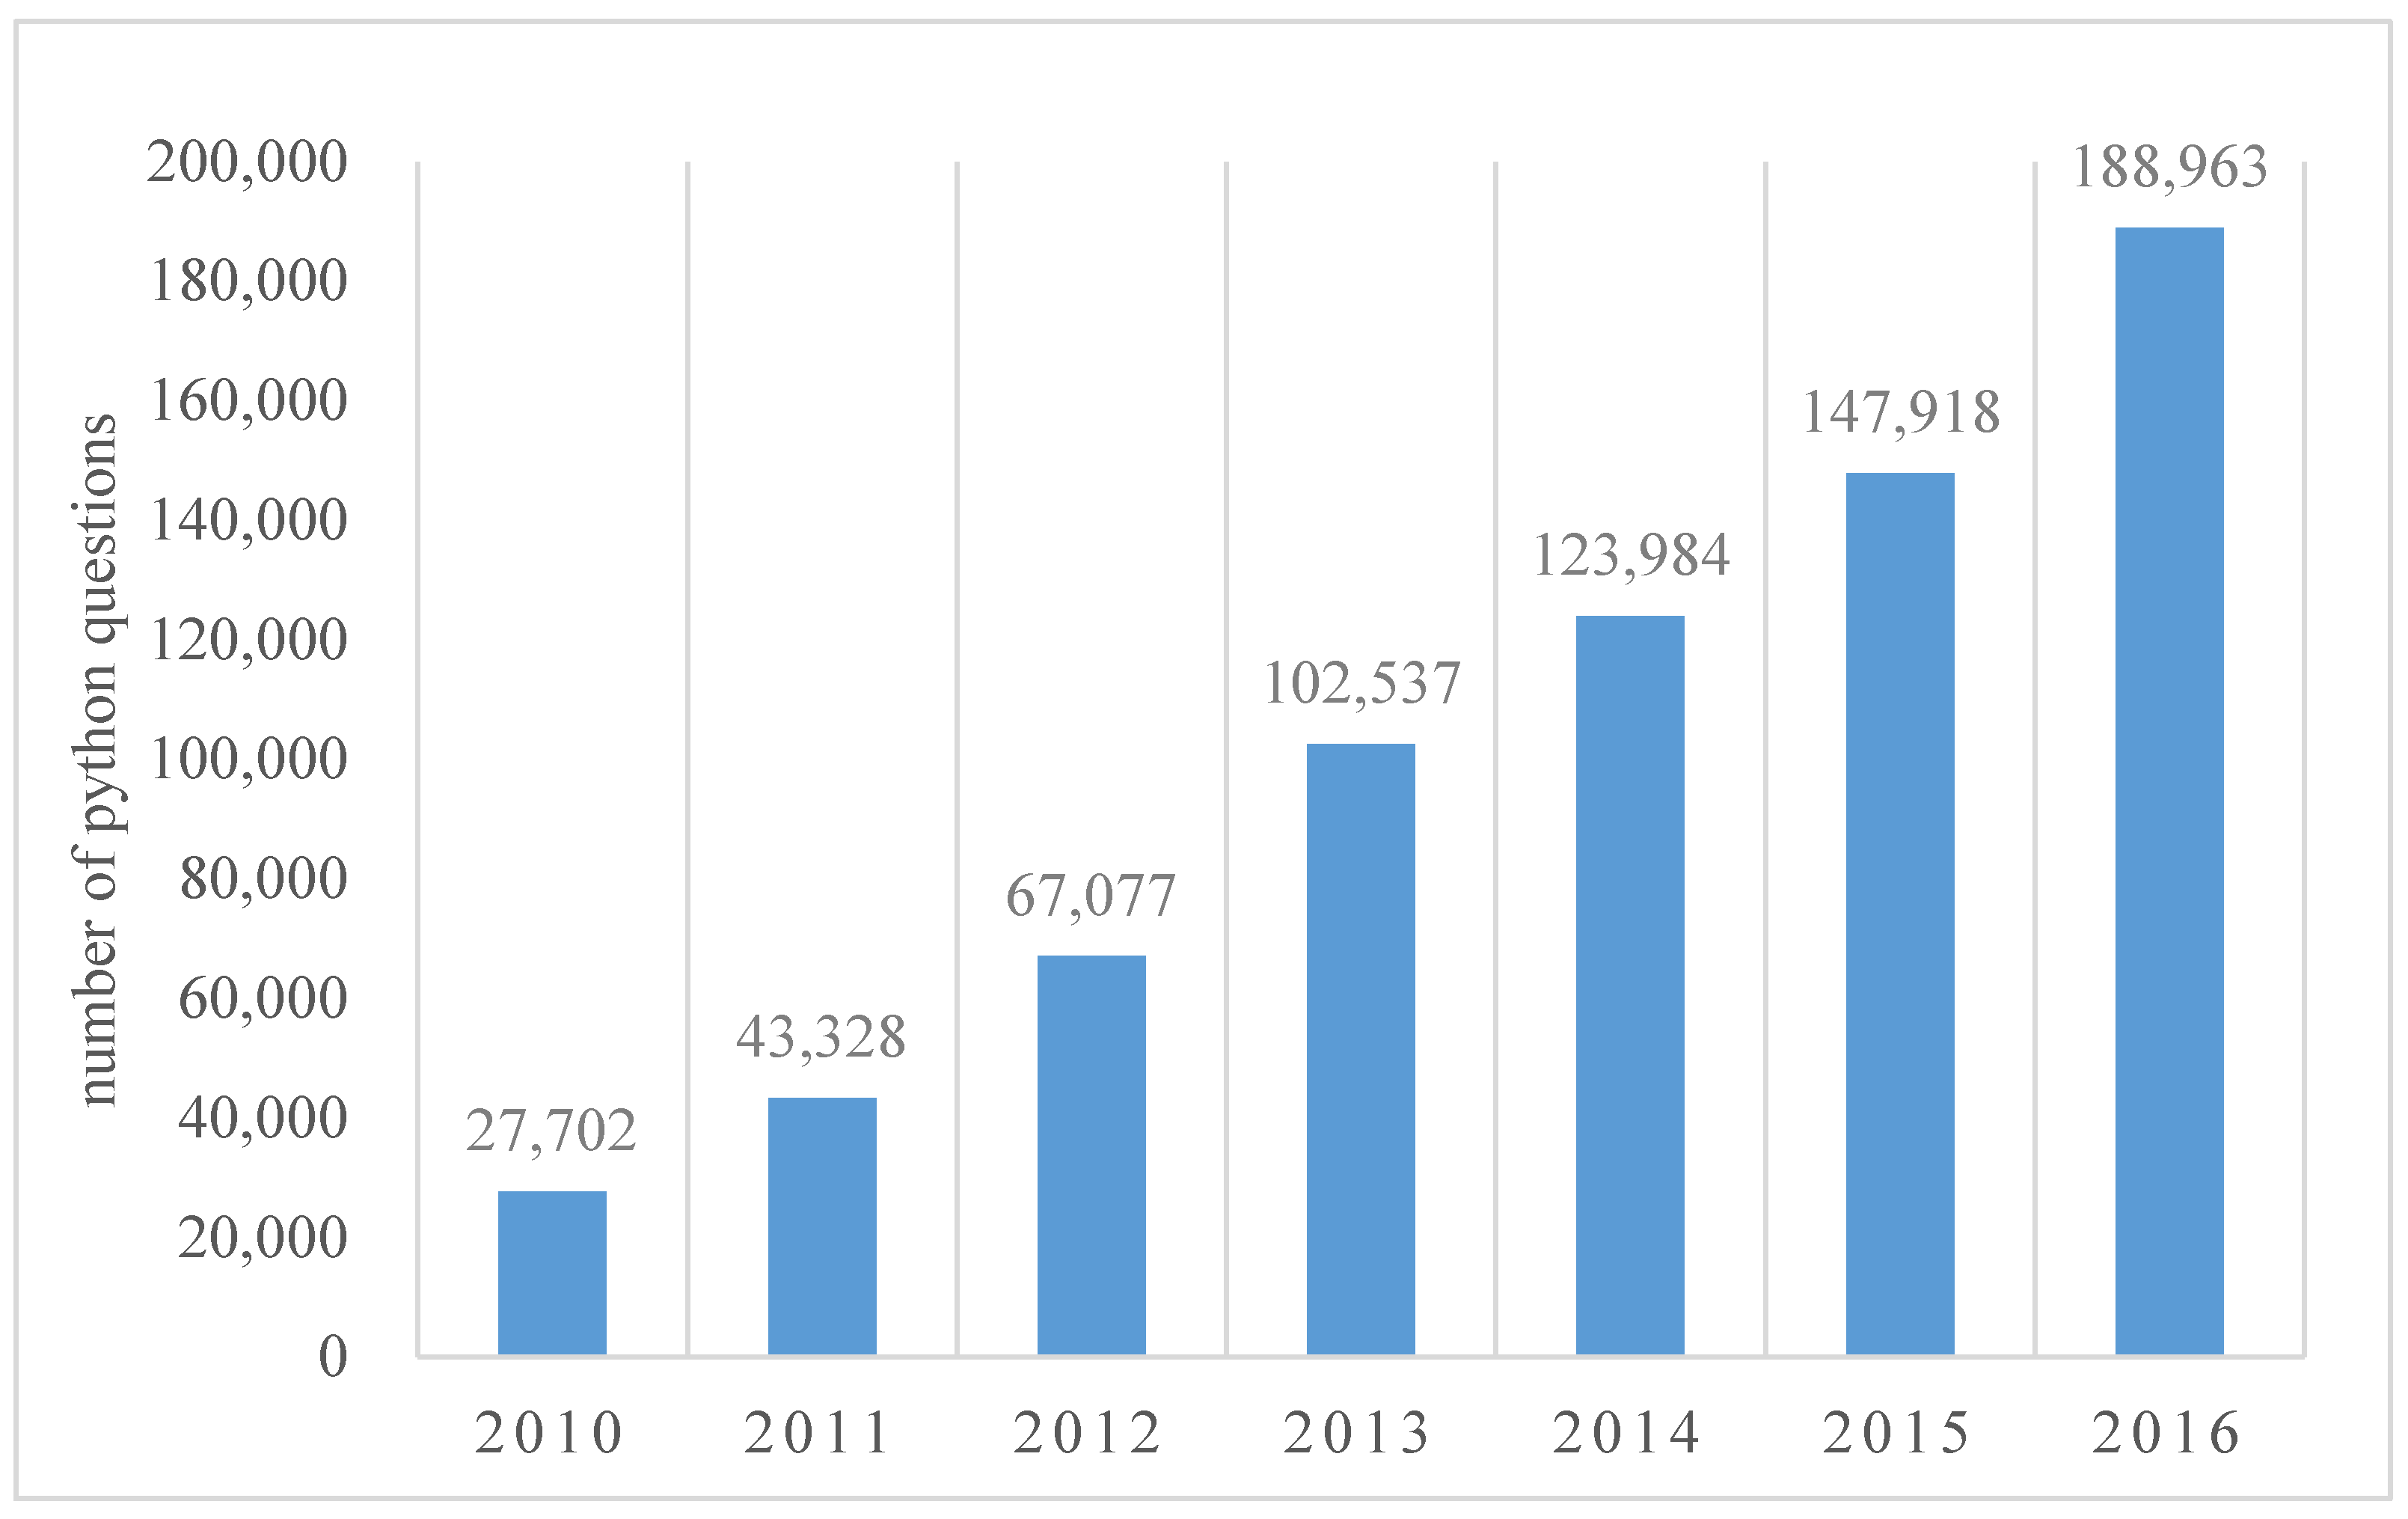
Extensibility indicates the dynamics of ecosystem development and growth ability. Extensibility is mainly evaluated in terms of three aspects, namely, popularity, growth force and service platform compatibility. Popularity shows the evolutionary trend of OSE. Taking programming languages as an example, if the language in the open source community project is consistent with the language that was popular at the time, defining the popularity of the open source community is in line with the development trend, which also indicates that OSE has developed dynamically over time. Growth force means the growth ability of emerging languages in OSE. In recent years, the rise of emerging languages such as Swift and Python (a language that quickly became everyone’s favorite) will serve to indicate whether OSE can keep pace with the progress of the times. That is, whether the number of projects related to Swift and Python will increase and therefore whether the dynamic development of OSE can be measured by analyzing the number of projects related to emerging languages in OSE. Service platform compatibility is an important indicator for measuring the quality of software. If the software can run on multiple platforms, then it is demonstrated to have good scalability. For example, projects in GitHub can run on such operating systems as Windows, OSX, and Linux. Therefore, they do not need to be recompiled or changed according to different operating system platforms. This means that the project has a very good extension, and can be widely used in different platforms. The service platform compatibility indicator can measure whether a piece of software can provide services across platforms.

3.3. Sustainability Measurement Method

For the sustainability measurement of the Open Source Ecosystem, Sun Lianshan et al. [21] further decompose the sustainability of the Open Source Ecosystem into three different aspects: Commercial quality model, product quality model and collaborative quality model, and conduct qualitative analysis. Srba et al. [11,12] conducted a case study of the negative development of the SO community, suggesting a long-term sustainability of the Q&A ecosystem through a strong reputation mechanism and adaptive support for respondents. Weiss et al. [8] proposed the “Guidelines for Sustainability,” using software engineering methods to provide guidance for system sustainability measurement. At present, the research on ecosystem sustainability is mainly based on the theoretical research and does not quantitatively analyze the sustainability of OSE. Therefore, based on the Evaluation Indicators System for the sustainability of OSE, this paper provides the method for quantitative analysis of the sustainable state of ecosystems. According to the Evaluation Indicator System, the weights of each indicator are calculated, and a sustainability assessment model is proposed for a comprehensive assessment of the sustainability of the ecosystem in question.

3.3.1. Weight Calculation Method Based on Information Contribution Value

The evaluation of the sustainability of open source ecosystems is a multi-indicator quantitative comprehensive evaluation process. For the sustainability of open source ecosystems, there are certain differences in the degree of impact of different evaluation indicators. In order to reflect this difference, it is necessary to assign a certain weight to each evaluation indicator.
As the types of indicators in the indicators system are complex, and the unit sizes are quite different, the original data is mapped by the Range Method [35] in the interval [0,1].
The original data matrix is X = (xij)m×n, and the normalized matrix is X = (xij)m×n. The specific formula is:
Xij = (xij − min xj)/(max xj − min xj),
where xij, xij respectively represent the original and standardized value of the j-th sample of the i-th indicator; max xj, min xj respectively represent the standardized maximum value and standardized minimum value of the j-th sample.
According to the definition of sustainability, we find that the sustainable development of the SO ecosystem is dynamic rather than static; therefore, if the value of the indicator changes more, the contribution of the indicator to sustainability is greater, and we define the contribution of the indicator as the contribution value. The contribution value, as a discrete degree of an indicator, means that the greater the degree of dispersion of the indicator, and the greater the contribution value, the greater the impact on the sustainability of the indicator, and the corresponding weight is larger. The contribution value of the indicator is formulated as
C i = k j = 1 n p i j ln p i j + θ ,
where p i j ln p i j is the discrete degree of contribution between j samples of the i-th indicator, p i j = x i j + ε j = 1 n ( x i j + ε ) indicates the j-th sample contribution of the i-th indicator, in order to eliminate the contribution being 0, we introduce the parameter ε ( 0 ε < 1 ); j = 1 n p i j ln p i j is the total contribution of all samples of the i-th indicator, k = 1 ln n , θ = 1 as the adjustment factor, to ensure that Ci is between [0,1].
For the value of ε , we will discuss the following. The parameter ε is introduced to eliminate the case where pij is 0. The value of pij depends on the value of xij, so we need to judge xij. There are two cases:
  • When xij> 0 of the original data xij is normalized, pij > 0, so setting ε = 0;
  • When xij = 0 of the original data xij is normalized, pij = 0, the value of lnpij cannot be calculated, so ε = 0.1 is set, and the purpose is to eliminate the case of pij = 0.
    { p i j = x i j + ε j = 1 n ( x i j + ε ) , x i j = 0 p i j = x i j j = 1 n x i j , x i j > 0 .
After the contribution value of the indicator is determined, the weight wi of the i-th indicator can be calculated according to the following formula:
ω i = C i i = 1 m C i ,
where i = 1 m C i is the total contribution value of all the indicators.
According to Equations (2)–(4), we first calculate the weight of the indicators included in the evaluation level. On this basis, we can use the additive of the contribution value of the indicator of the evaluation level to calculate the contribution value of the indicator of the corresponding guideline level, and write it as Hk (k = 1, 2...). Thus, the weight of the indicator of the corresponding guideline level is
ω k = H k i = 1 m C i .

3.3.2. Sustainability Assessment Model

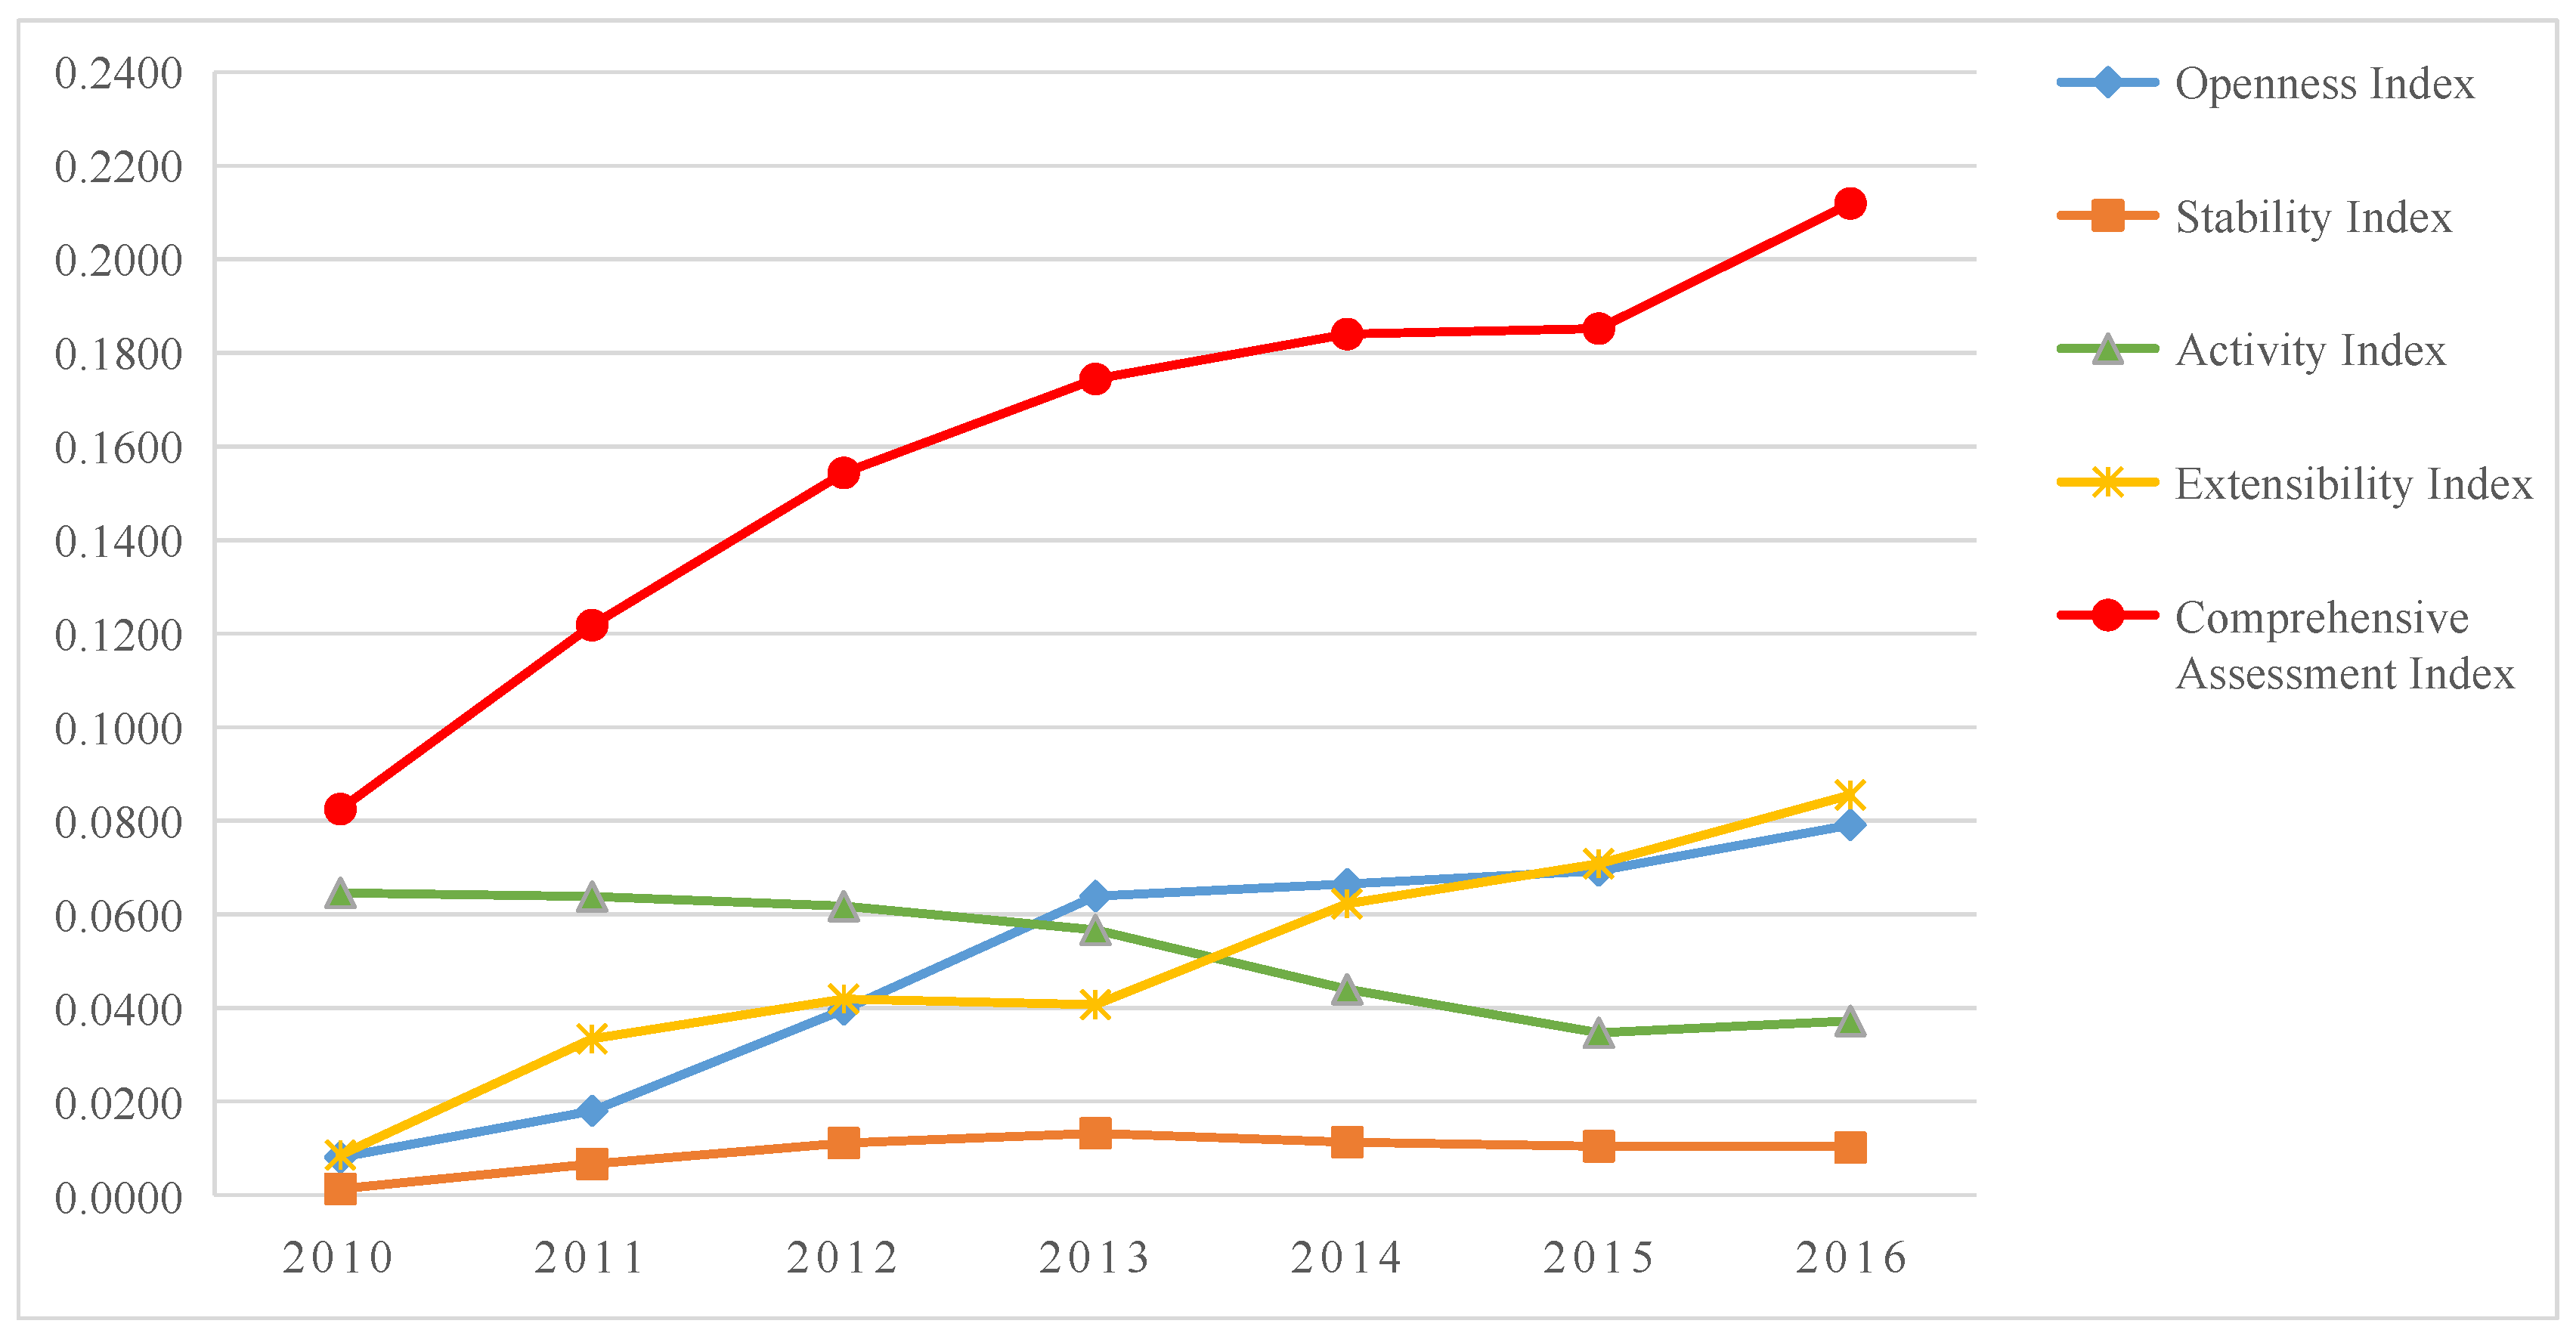
The sustainable evaluation of Open Source Ecosystems is not only a unilateral analysis and the evaluation of an indicator, but also to quantify and form a quantitative scientific comprehensive evaluation result, such that we can comprehensively consider the development status of the ecosystem. Therefore, in order to assess the development status of each indicator and the development status of ecosystem sustainability, this paper integrates multiple indicators to comprehensively evaluate the sustainability of an Open Source Ecosystem and proposes a Sustainability Assessment Model. The expression of that model is
F = i = 1 t w i × ( j = 1 r x i j × w i j ) ,
where F is the composite index of the sustainability of the open source ecosystem; wi—the weight of the i-th guideline level; wij—the weight of the j-th evaluation level indicator in the i-th guideline level; t—the total number of indicators in the guideline level; r—the number of indicators of evaluation level contained in the i-th guideline level. The larger the F value, the better the sustainable development of the open source ecosystem.

4. SO Introduction

This paper uses SO as an example to analyze the sustainability of OSE. In this section, the SO ecosystem dataset is described, and the Evaluation Indicators System of SO ecosystem sustainability is determined, based on the participants’ activities, as well as the Evaluation Indicators System of the ecosystem sustainability proposed.

4.1. User Activities in SO

SO is an open computer programming knowledge learning community where anyone can register, ask questions, answer questions or browse questions. Any community member can post new questions by providing a title, a detailed description and tags. The questioner can add no more than five tags to mark the questions raised, indicating the knowledge area to which the question belongs. Once the question is posted, all other members of the community can post answers to the question, vote for the best answer, and can comment on the question and answers. After the best answer is accepted, if other users seek answers to similar questions, they can use the content of the question or a specific tag to search. User activities in the SO ecosystem are shown in Figure 3a,b.

4.2. Data Description

In this paper, the data from 2010 to 2016 in SO is used to measure the sustainable development of the SO ecosystem, with one year as a time period. The Stack Overflow dataset is publicly available through a data dump and the stack exchange data explorer, including all the data from August 2008 to March 2017. We extracted seven years of data in the comment, post, tag, user, vote table from 1 January 2010 to 31 December 2016. The data includes 12,516,714 questions. When a user posts a question in the SO, the user will mark the question by adding tags, indicating the domain or technology to which the problem belongs. When the data is collected, the tags will also be included in the user’s question post. For example, if the user adds the tags <css> and <html> to the question post, it represents the problem related to the design of the web interface. The data also contains 19,464,870 answers answered by the user, more than 6,384,954 users, and the dataset’s size is approximately 58 GB. The total data in the SO ecosystem is shown in Table 2. Since there are many contents in the tag table, only some of the tags are listed in Table 2.

4.3. Evaluation Indicators System for Sustainability of the SO Ecosystem

According to the Evaluation Indicators System of the sustainability of OSE and the user activities of the SO ecosystem, the evaluation indicators for SO sustainability are analyzed. As SO is relatively simple, and there is no content that is dependent on such factors as system platform compatibility, this paper intends to simplify the sustainability evaluation system of SO, as shown in Table 3.

5. Sustainability Analysis of the SO Ecosystem

In this section, we first analyze the indicators of the Evaluation Indicators System of the SO ecosystem and subsequently analyze the impact of the four indicators on the sustainability of the SO ecosystem through the calculation of weights and Sustainability Assessment Models. Finally, the sustainability of the SO ecosystem in the next five years is predicted.

5.1. Evaluation Indicators Analysis

This section analyzes the openness, stability, activity, and extensibility of, as well as the indicators of, the evaluation level in the Evaluation Indicators System for sustainability of the SO ecosystem constructed in Section 4.3.

5.1.1. Openness Analysis

SO is a program-related IT technical Q&A site on which anyone can register, submit questions, browse questions, search questions, answer questions and engage in other related activities. The community is likely to have new users to joining at any time, indicating that it is possible to communicate with the outside world at any time. Therefore, we use the number of new users as an indicator of the ability of the system to openly communicate with the outside environment.
N U = { N U ( 1 ) , N U ( 2 ) , N U ( 3 ) , N U ( i ) } ,
where NU is the total set of the number of new users and NU(i) is the number of new users in the i-th year.
In the SO, the most intuitive method of users’ communication is question and answer. When a user posts a question, other users can answer, indicating communication between the users. This paper used the number of questions with answers as a measure of the ability of internal members of the system to participate in openness.
A N = { A N ( 1 ) , A N ( 2 ) , A N ( 3 ) , A N ( i ) } ,
where AN is the total set of the number of questions with the answers and AN(i) is the number of questions with answers in the i-th year.
According to the above description, openness is expressed as
O P ( i ) = a 1 × N U ( i ) + b 1 × A N ( i ) ,
where OP(i) is the openness of ecosystem in the i-th year, α1 is the weight of the number of new users and β1 is the weight of the number of questions with answers. The α1, β1 values are calculated according to the Equations (2)–(4) proposed in Section 3.3.1.
Analyzing the number of new users registered in SO by Equation (7), we find that the number of new users of the system shows a substantial increase. As shown in Figure 4, the number of new users increased from 199,547 in 2010 to 1,569,322 in 2016, an increase of 7.86 times. The system’s growth trend reflects the ability of the ecosystem to constantly attract new users. Then, the number of questions with answers that has been found through the Equation (8) continues to increase from 2010 to 2014, rising from 687,724 in 2010 to 1,907,776 in 2014, and the number of questions with answers remains stable between 2015 and 2016. The number of questions with answers indicates the ability of the users in the system to participate. This number shows that the system constantly attracts new users to join the system, and increasingly numerous questions are answered. This increase means that the user’s opportunity to participate in the system is increasing. Subsequent experiments will further describe the openness development of SO ecosystems.

5.1.2. Stability Analysis

In the SO ecosystem, through the processing and analysis of SO data, users posting more than 60 times per year are defined as long-term contributing users, also known as stable users. These users promptly issue answers to other users’ questions, put forward high-quality questions and contribute to the SO ecosystem over a long period of time, making the system stable. Therefore, this paper used the number of stable users (SU) to measure the stability of the SO ecosystem.
S U = { S U ( 1 ) , S U ( 2 ) , S U ( 3 ) , S U ( i ) } ,
where SU is the total set of stable users and SU(i) is the number of stable users in the i-th year.
This paper used the Equation (10) to measure the stability of the ecosystem by counting the number of stable users, and analyzed the number of stable users through the X ¯ S control chart [36]. We conclude that the average number of stable users in the SO ecosystem in 2010–2016 is X ¯ = 24,569, the standard deviation is S = 5479, and the maximum number of fluctuations in the number of stable users, that is, control on-line, is U C L = X ¯ + 2 × S = 35,654, the minimum fluctuation of the number of stable users, that is, the control off-line, is L C L = X ¯ 2 × S = 35,654. According to the control chart, the number of stable users in a controlled and stable state is determined. The control chart of the stability is shown in Figure 5. We found that in 2010–2016, the number of stable users remains between (13,664–35,654) in a controlled state, meaning that the ecosystem was running relatively stably.

5.1.3. Activity Analysis

Activity is a comprehensive manifestation of the overall life function of the system. The members of the ecosystem are the performers of the vitality of the system. The information sharing and communication between the user members keeps the system in an active state of development. The activity of the SO ecosystem is mainly reflected in the problem-centered, sharing and communication of information between users. User interaction begins with a question posed by the user in SO, and when other users answer the question or post insightful comments on the question, indicating that the information exchange can be expanded. Through these activities, information is exchanged between users, so this paper followed the response rate of questions, and the average number of comments, to assess the activity of the SO ecosystem.
The response rate of questions is the ratio of the number of questions with answers to the total number of questions in the ecosystem, and the response rate is defined as
R E S ( i ) = A N ( i ) / Q U E ( i ) ,
where RES(i) is the response rate of the i-th year, AN(i) is the number of questions with answers in the i-th year, and QUE(i) is the total number of the questions in the i-th year.
The average number of comments is the average number of comments for all posts, defined as
A V G C ( i ) = j = 1 T P ( i ) C O M ( p ( i ) ) / T P ( i ) ,
where AVGC(i) is the average number of comments for all posts in the i-th year, j = 1 T P ( i ) C O M ( p ( i ) ) is the sum of the number of comments for each post in the i-th year, COM (p(j)) is the number of comments for the j-th post, and TP(i) is the total number of posts in the i-th year.
According to the above description, activity is expressed as
A C T ( i ) = a 2 × R E S ( i ) + b 2 × A V G C ( i ) ,
where ACT(i) is the activity of ecosystem in the i-th year, and α2 is the weight of the response rate of questions and β2 is the weight of the average number of comments. The α2, β2 values are calculated according to Equations (2)–(4) proposed in Section 3.3.1.
Figure 6a shows an area chart of the response rate of the questions, and the response rate calculated by Equation (11) shows a tendency of decreasing. From 2010 to 2016, the response rate of SO decreases from 0.9844 to 0.8445, but it does not indicate that users could not handle the increasing problems. We should consider the possibility that the users could handle the increasing problems, but they were able to do so with fewer answers. Figure 6b shows the average number of comments in posts. Calculating the average number of comments using Equation (12) found that the average number of comments increased from 1.3098 to 1.7383 between 2010 and 2016, showing that the communication between users was increasing. Subsequent experiments will further describe the activity development of SO ecosystems.

5.1.4. Extensibility Analysis

For the study of popularity, this paper selected the representative GitHub Open Source Ecosystem as a reference and used the dataset of the GHTorrent project before 31 December 2016, which contains approximately 13,914,686 users and 37,728,657 pieces of project information. Applied to that dataset is the project-languages table which contains four attributes: project_id, language, bytes, and create_at. Comparing the top 10 most popular languages in the GitHub project with the top 10 languages popular in SO, the results are shown in Figure 7.
By calculating the similarity between the top 10 languages in SO and the top 10 languages in GitHub to determine the popularity of the SO ecosystem, the similarity is calculated using the Jaccard coefficient [37].
P O P ( i ) = | S ( i ) G ( i ) | | S ( i ) G ( i ) | ,
where POP(i) is the popularity of the SO ecosystem in the i-th year, S(i) is the set of the top 10 languages of SO posts in the i-th year, and G(i) is the set of the top 10 languages of GitHub project in the i-th year.
According to Figure 7 and Equation (14), we calculated the popularity from 2010 to 2016. The results are shown in Table 4.
We find that from 2010 to 2016, the similarity between the top 10 popular languages in SO and the top 10 popular languages in GitHub was [0.7,0.9], indicating that the SO ecosystem, like other currently popular ecosystems, can meet the needs of users well and be highly popular.
For the analysis of the growth of the SO ecosystem, we used the number of questions about emerging languages within the system to measure the dynamic development of SO.
N Q = { N Q ( 1 ) , N Q ( 2 ) , N Q ( 3 ) , N Q ( i ) } ,
where NQ is the total set of the number of questions in an emerging language and NQ(i) is the number of questions in an emerging language in the i-th year.
Through Equation (15) on the analysis of growth force, as shown in Figure 8, we chose the popular Python language in recent years. The number of Python questions in SO rapidly rose from 27,702 in 2010 to 188,936 in 2016, indicating the dynamic development of emerging languages in SO.
According to the above description, extensibility is expressed as:
E X ( i ) = a 3 × P O P ( i ) + b 3 × N Q ( i ) ,
where EX(i) is the extensibility of ecosystem in the i-th year, α3 is the weight of the popularity and β3 is the weight of the growth force. The α3, β3 values were calculated according to Equations (2)–(4) proposed in Section 3.3.1.
Through the study of popularity and growth power, we observe that the SO ecosystem has good extensibility, which means that the SO ecosystem has a good capability of development, can adapt to the current environment, and can keep up with the trend of the times to meet the needs of users.

5.2. SO Sustainability Measurement Results and Analysis

Through the analysis of openness, stability, activity, and extensibility, the weight of each indicator is calculated according to the evaluation indicators system. Then, the sustainability of the Open Source Ecosystem is evaluated by the Sustainability Assessment Model. Finally, the development of the SO ecosystem over the next five years is predicted.

5.2.1. Calculate the Weight of the Indicator

According to the Evaluation Indicators System in Table 3 and the statistical data from 2010 to 2016, the data was standardized. According to the size of the standardized values, and the weight calculation method proposed in Section 3.3.1, these are used to determine the weight of indicators, as the result of Table 5.
From the distribution of the weight of the SO ecosystem sustainable development evaluation indicators, the indicators that have an important impact on the sustainable development of SO ecosystem are: The indicator of the number of new users reflecting the openness of the SO ecosystem, the average number of comments reflecting the activity of the SO ecosystem, and the popularity that reflects the extensibility of the SO ecosystem. For the SO ecosystem, the impact of the number of stable users is relatively small, and it also reflects the stability of the number of stable users.

5.2.2. Results of Comprehensive Assessment and Analysis

We first calculated the value of openness, stability, activity and extension through Equations (9), (10), (13) and (16), and then obtained the comprehensive assessment value of the sustainability of the SO ecosystem and the composite index of the guideline indicators through the Sustainability Assessment Model (6) and the results are shown in Table 6. The trend is shown in Figure 9.
As can be seen from Figure 9,
(1)
the openness index showed an overall upward trend from 2010 to 2016, increasing from 0.0081 in 2011 to 0.791 in 2016, indicating that the openness of the SO ecosystem was in a good state from 2010 to 2016.
(2)
The overall curve of the stability index was at its peak during the period from 2010 to 2016. The stability index rose from 0.0013 in 2010 to 0.0132 in 2013 with a sharp peak in 2013 and decreased to 0.0101 in the following three years but with a smaller decrease, meaning that the stability of the ecosystem maintained its level of development with minor fluctuations.
(3)
The overall activity index shows a downward trend, indicating that the current active status of the SO ecosystem has deteriorated, and the interaction of the user should be strengthened. From 2010 to 2015, the activity index decreased from 0.0646 to 0.0347; then, from 2015 to 2016, the activity index increased from 0.0347 to 0.0372.
(4)
The extensibility index of the SO ecosystem increased from 2010 to 2016 as a whole, except for 2013. The expansibility index increased year by year, and the level of development increased rapidly. From 2010 to 2012, the extensibility index increased from 0.0084 to 0.0419. From 2013 to 2016, the activity index increased from 0.0407 to 0.0855. The increase of the extensibility index was conducive to the improvement of the SO ecosystem’s sustainable development.
From Figure 9 and Table 6, the overall comprehensive assessment index of the SO ecosystem was on the rise, and the improvement trend indicated that the sustainable development of SO ecosystems would be further improved. From 2010 to 2014, the curve showed a straight upward trend at a 45 degree angle with a large increase. The comprehensive assessment index increased from 0.0825 in 2010 to 0.1840 in 2014, and the sustainable development of the ecosystem has continuously improved. In 2014–2015, the curve showed a horizontal and slow growth, and the ecosystem developed slowly. In 2015–2016, the curve started to rise again, and the comprehensive assessment index increased from 0.1852 in 2015 to 0.2120 in 2016, showing an upward trend in the level of sustainable development, indicating that SO was in a good state of development.

5.3. Prediction Results and Analysis

The Gray Prediction Model [38] is a prediction of the gray system. It is a prediction method that constructs a mathematical model and makes predictions with equal time-infrared observations through a small amount of incomplete information. The model uses a small amount of original information for prediction. It not only has high prediction accuracy, but also applies to short-term, medium-term and long-term time series problems. The comprehensive value calculated in this paper is the equidistant value in the unit of year. Therefore, this paper uses the Gray Prediction Model for the SO ecosystem to predict the comprehensive assessment value of the sustainability of the SO ecosystem from 2017 to 2021. The modeling steps are as follows.
  • Data preprocessing: The original array x(0) = (x(0)(1), x(0)(2), …, x(0)(n)) is accumulated and a new sequence x(1) = (x(1)(1), x(1)(2), …, x(1)(n)) is obtained, where each data in x(1)(t) represents the accumulation of the corresponding previous data.
    x ( 1 ) ( t ) = k = 1 t x ( 0 ) ( k ) , t = 1 , 2 , , n .
  • Establishing first order linear differential:
    d x ( 1 ) d t + a x ( 1 ) = u ,
    where a, and u are the undetermined coefficient, and are called the development coefficient and gray action quantity respectively
  • Average-generating arithmetic operators: The mean of the series x(1), which generates B and the constant vector YN:
    B = [ 0.5 ( x ( 1 ) ( 1 ) + x ( 1 ) ( 2 ) ) 0.5 ( x ( 1 ) ( 2 ) + x ( 1 ) ( 3 ) ) 0.5 ( x ( 1 ) ( n 1 ) + x ( 1 ) ( n ) ) 1 1 1 ] .
    Y N = ( x ( 0 ) ( 2 ) , x ( 0 ) ( 3 ) , , x ( 0 ) ( n ) ) T .
  • Calculating a, u: Calculated using the least square method
    a ^ = ( B T B ) 1 B T Y N = [ a , u ] T .
  • Time response model: The grey parameter gray parameter a ^ is substituted into d x ( 1 ) d t + a x ( 1 ) = u , and the time response model is obtained.
    x ^ ( 1 ) ( t + 1 ) = x ( 0 ) ( 1 ) u a e a t + u a .
  • Establishing prediction model: Discretize the function expressions x ^ ( 1 ) ( t + 1 ) and x ^ ( 1 ) ( t ) make the difference to restore the original sequence of x(0) to obtain the approximate data sequence x ^ ( 0 ) ( t + 1 ) as follows:
    x ^ ( 1 ) ( t + 1 ) = x ( 0 ) ( 1 ) u a e a t + u a .
This paper uses the comprehensive assessment value of the sustainability of the SO ecosystem from 2010 to 2016 in Table 6 as the original data: x ( 0 ) = [ 0.0825 , 0.1218 , 0.1544 , 0.1744 , 0.1840 , 0.1852 , 0.2120 ] , and the prediction model of the comprehensive assessment value of the sustainability is calculated as follows:
x ^ ( 0 )   ( t + 1 ) = ( 1 e a ) [ x ( 0 ) ( 1 ) u a ] e a t = 0.0856 × [ 1.4512   e 0.0895 t ] .
In this paper, the validity of the prediction model is verified by the Residual Method [39]. The relative error between x ( 0 ) ( t ) and x ^ ( 0 ) ( t ) is
r = | x ( 0 ) ( t ) x ^ ( 0 ) ( t ) | x ( 0 ) ( t ) .
The average relative error is
a v g r = 1 n i = 1 n | x ( 0 ) ( t ) x ^ ( 0 ) ( t ) | x ( 0 ) ( t ) .
The method considers that this prediction model is available if avgr < 0.05 and r < 0.05, where n represents the total number of years, x ( 0 ) ( t ) represents the actual value, and x ^ ( 0 ) ( t ) represents the predicted value calculated from the prediction model.
Therefore, the predicted value of the comprehensive assessment value from 2010 to 2016 is calculated by Equation (24), and the relative error and average relative error between the comprehensive assessment value of the sustainability (actual value) and predicted value are calculated by Equations (25) and (26). The calculation results are shown in Table 7.
From Table 7, the average relative error is 4.39%, indicating the high accuracy of the prediction model. In addition, the posterior-variance-test [40] was used to test the precision of the prediction model again. The variance ratio of the test results C = 0.0333 < 0.35 and the probability of small residuals P = 1 > 0.95 are in the range of “excellent” of the model accuracy test. Therefore, the model has a highly predictive effect and can be used to predict the comprehensive assessment value of the sustainability of the SO ecosystem.
Therefore, the prediction model was used to predict the comprehensive assessment value of the sustainability of the SO ecosystem from 2017 to 2021, and the prediction results are as follows: [0.2325,0.2543,0.2781,0.3041,0.3326]. As shown in Figure 10, the curve of the comprehensive assessment value of the sustainability of the SO ecosystem in 2010–2016 and that of the predicted value of the comprehensive assessment value basically match, and the comprehensive assessment value of the sustainability of the SO ecosystem shows a steady upward trend from 2017 to 2021, indicating that the sustainability of the SO ecosystems is increasing.

6. Discussion and Conclusions

In recent years, sustainability has become a topic of considerable concern to ecologists. A large number of discussions on “sustainability” or “sustainable development” appear in the literature on ecology, economy and society. These discussions mainly focus on their theoretical level, and generally regard sustainability as the goal of ecosystem management. However, there is no overall and universal measurement system, nor is there a method for the sustainability of ecosystems and the overall sustainability of the ecosystem, and these discussions do not take into account the future development of the ecosystem. In response to these issues, we mainly make the following contributions:
First, this paper proposes a definition and the Evaluation Indicators System for ecosystem sustainability, which is a preliminary discussion of quantitative measurement of ecosystem sustainability. The Evaluation Indicators System is more general for the sustainability assessment of OSE, and its contribution is that it is a comprehensive overview of the sustainability assessment indicators. It can also provide a reference for researchers studying ecosystem sustainability related goals, such as improving ecosystem activities, assessing the sustainability of ecosystems, or identifying weaknesses in ecosystems to make them healthier.
Second, based on the Evaluation Indicators System, the measurement model and method of the sustainability status of OSE are established. The indicator weight of the sustainability of OSE is measured by analyzing the information contribution value included in the indicator, and the sustainability assessment model is proposed to comprehensively evaluate the sustainability of OSE. These methods objectively and scientifically calculate the comprehensive value of sustainability from a quantitative perspective, providing companies, participants and managers with a basis for coordinated development decisions. Investors can choose to develop an ecosystem project; developers or participants can choose an active ecosystem; and managers can understand whether the state of the ecology requires adjustments to management techniques and methods to ensure continuity.
Third, this paper takes the SO ecosystem as an example to analyze the impact of the openness, stability, activity and extensibility on ecosystem sustainability, and initially validates the effectiveness of the Evaluation Indicators System and assessment method. These studies provide a reference for long-term research to assess ecosystem sustainability, including the selection of evaluation indicators, the use of the Evaluation Indicators System and assessment methods, and the prediction of ecosystem development.
Based on the discussion in this paper, we can do the following work in the future. Firstly, the sustainable evaluation system proposed in this paper will only conduct empirical research in the context of an SO ecosystem. The Evaluation Indicators System will assess the sustainability of more OSEs in future work. Since the evaluation indicators of our proposed Evaluation Indicators System are based on the interaction and cooperation between users, we have organized OSE with a group collaboration operation mechanism. These OSE can use the Evaluation Indicators System, as shown in Table 8. In the follow-up work, we will conduct an empirical study. Secondly, sustainability needs to select and integrate corresponding measurement methods and measurement indicators from a certain level of hierarchy and scale within a clear ecological background or under certain ecological constraints. The proposed evaluation indicators need to be replaced or added or subtracted in the actual operation. For example, there is “no bug fix time” in the SO ecosystem, so we remove this indicator when we evaluate the SO ecosystem. The next step is to verify the fitness and reliability of the model in other open source websites and continue to complement the content of the sustainability evaluation system to make it more widely applicable. Finally, based on the sustainability evaluation system and methodology established in this paper, we hope to implement a sustainability measurement tool to achieve measurement of all indicators. When developing a sustainability measurement tool, the user experience will be considered [41,42], which will facilitate the user’s measurement of the sustainability of OSE. In addition, the Evaluation Indicators System proposed in this paper can also be used in research fields such as ecosystem recommendation and prediction of ecosystem sustainability.

Author Contributions

All the authors discussed the algorithm required to complete the manuscript. Z.L. and X.F. conceived the paper. L.D. performed the experiments and wrote the paper. X.Q. and Y.Z. (Yun Zhou) checked for typos; Y.Z. (Yan Zhang) and H.L. discussed the impact of the indicators and revised the paper. All authors have read and approved the final manuscript.

Funding

The works that are described in this paper are supported by NSF 61876190, Ministry of Science and Technology: Key Research and Development Project (2018YFB003800, Hunan Provincial Key Laboratory of Finance & Economics Big Data Science and Technology (Hunan University of Finance and Economics) 2017TP1025 and HNNSF 2018JJ2535, The scientific research project of the Hunan Provincial Education Department No.: 13C095.

Acknowledgments

We would like to thank the referees for their valuable comments and suggestions.

Conflicts of Interest

The authors declare no conflict of interest.

References

  1. Bosch, J.; Bosch-Sijtsema, P. From Integration to Composition: On the Impact of Software Product Lines Global Development and Ecosystems. J. Syst. Softw. 2010, 83, 67–76. [Google Scholar] [CrossRef]
  2. Manikas, K.; Hansen, K.M. Reviewing the Health of Software Ecosystems—A Conceptual Framework Proposal. CEUR Workshop Proc. 2013, 987, 26–37. [Google Scholar]
  3. Jansen, S. Measuring the health of open source software ecosystems: Beyond the scope of project health. Inf. Softw. Technol. 2014, 56, 1508–1519. [Google Scholar] [CrossRef]
  4. Lu, Y.; Wang, R.; Zhang, Y.; Su, H.; Wang, P.; Jenkins, A.; Ferrier, R.; Bailey, M.; Squire, G. Ecosystem health towards sustainability. Ecosyst. Health Sustain. 2016, 1, 1–15. [Google Scholar] [CrossRef]
  5. Wan, J.; Zhu, S.; Huali, S. Some Considerations of China’s Software Industry Business Ecosystem. Sci. Technol. Manag. Res. 2009, 29, 130–132. [Google Scholar]
  6. Jin, Z.; Zhou, M.; Zhang, Y. Open source software and its ecosystems: Today and tomorrow. Sci. Technol. Rev. 2016, 34, 42–48. [Google Scholar]
  7. Penzenstadler, B. Towards a definition of sustainability in, and for, software engineering. In Proceedings of the 28th Annual ACM Symposium on Applied Computing, Coimbra, Portugal, 18–22 March 2013; pp. 1183–1185. [Google Scholar]
  8. Durdik, Z.; Klatt, B.; Koziolek, H.; Krogmann, K.; Stammel, J.; Weiss, R. Sustainability guidelines for long-living software systems. In Proceedings of the IEEE International Conference on Software Maintenance, Trento, Italy, 23–28 September 2012; pp. 517–526. [Google Scholar]
  9. An, L.; Mlouki, O.; Khomh, F.; Antonio, G. SO: A code lSUndering platform? In Proceedings of the 24th IEEE International Conference on Software Analysis, Evolution, and Reengineering (SANER), Klagenfurt, Austria, 20–24 February 2017; pp. 283–293. [Google Scholar]
  10. Dhungana, D.; Groher, I.; Schludermann, E.; Biffl, S. Software ecosystems vs. natural ecosystems: Learning from the ingenious mind of nature. In Proceedings of the Software Architecture, European Conference, Ecsa 2010, Copenhagen, Denmark, 23–26 August 2010; pp. 96–102. [Google Scholar]
  11. Srba, I.; Bielikova, M. Why SO Fails? Preservation of Sustainability in Community Question Answering. IEEE Softw. 2016, 33, 1. [Google Scholar] [CrossRef]
  12. Srba, I. Promoting Sustainability and Transferability of Community Question Answering. Inf. Sci. Technol. Bull. ACM Slovakia 2011, 8, 1–7. [Google Scholar]
  13. Sethanandha, B.D.; Massey, B.; Jones, W. Managing open source contributions for software project sustainability. In Proceedings of the Technology Management for Global Economic Growth, Phuket, Thailand, 18–22 July 2012; pp. 1–9. [Google Scholar]
  14. Fotrousi, F.; Fricker, S.A.; Fiedler, M.; Le-Gall, F. KPIs for Software Ecosystems: A Systematic Mapping Study. In Proceedings of the International Conference of Software Business. Springer International Publishing, Paphos, Cyprus, 16–18 June 2014; pp. 194–211. [Google Scholar]
  15. Monteith, J.Y.; Mcgregor, J.D.; Ingram, J.E. Scientific Research Software Ecosystems. In Proceedings of the 2014 European Conference on Software Architecture Workshops (ECSAW ’14). ACM, New York, NY, USA, 25–29 August 2014; pp. 1–6. [Google Scholar] [CrossRef]
  16. Gamalielsson, J.; Lundell, B. Sustainability of Open Source software communities beyond a fork: How and why has the LibreOffice project evolved? J. Syst. Softw. 2014, 89, 128–145. [Google Scholar] [CrossRef]
  17. Gamalielsson, J.; Lundell, B. Long-Term Sustainability of Open Source Software Communities beyond a Fork: A Case Study of LibreOffice. In Proceedings of the IFIP International Conference on Open Source Systems; Springer: Berlin/Heidelberg, Germany, 2017; pp. 29–47. [Google Scholar]
  18. Nyman, L.; Mikkonen, T.; Lindman, J.; Fougère, M. Perspectives on Code Forking and Sustainability in Open Source Software. IFIP Adv. Inf. Commun. Technol. 2012, 378, 274–279. [Google Scholar] [Green Version]
  19. Matragkas, N.; Williams, J.R.; Kolovos, D.S.; Paige, R.F. Analysing the ‘biodiversity’ of open source ecosystems: The GitHub case. In Proceedings of the 11th Working Conference on Mining Software Repositories, Hyderabad, India, 31 May–1 June 2014. [Google Scholar]
  20. Sahu, T.P.; Nagwani, N.K.; Verma, S. An Empirical Analysis on Reducing Open Source Software Development Tasks using SO. Indian J. Sci. Technol. 2016, 9. [Google Scholar] [CrossRef]
  21. Sun, L.; Li, J. A role model and quality model of software ecosystems. Shanxi Univ. Sci. Technol. 2011, 29, 93–95. [Google Scholar]
  22. Zhang, D.; Li, B.; He, P.; Zhou, H. Characteristic Study of Open-source Community Based on Software Ecosystem. Comput. Eng. 2015, 41, 106–113. [Google Scholar]
  23. Liao, Z.; Dayu, H.; Chen, Z.; Fan, X.; Zhang, Y.; Liu, S. Exploring the Characteristics of Issue-related Behaviors in GitHub Using Visualization Techniques. IEEE Access 2018, 6, 24003–24015. [Google Scholar] [CrossRef]
  24. Lee, C. A Model of Sustainable Ecosystem for Software Development: Software Business and Music Education. 2013. Available online: http://repository.lib.eduhk.hk/jspui/handle/2260.2/16637 (accessed on 1 December 2018).
  25. Joo, J.; Eom, M.; Shin, M. Executive practices for corporate sustainability: A business ecosystems perspective. Int. J. Bus. Res. 2016. [Google Scholar] [CrossRef]
  26. Qiang, F.U.; Fan, D.P. Green Values and the Holistic Optimization of Socio-ecological Systems: From the Perspective of Philosophy of Complexity Science. Stud. Dialectics Nat. 2017, 33. [Google Scholar] [CrossRef]
  27. Wang, S.; Loreau, M. Biodiversity and ecosystem stability across scales in metacommunities. Ecol. Lett. 2016, 19, 510–518. [Google Scholar] [CrossRef] [Green Version]
  28. Ramírez-Carrillo, E.; López-Corona, O.; Toledo-Roy, J.C.; Lovett, J.C.; de León-González, F.; Osorio-Olvera, L.; Equihua, J.; Robredo, E.; Frank, A.; Dirzo, R.; et al. Assessing sustainability in North America’s ecosystems using criticality and information theory. PLoS ONE 2018, 13, e0200382. [Google Scholar] [CrossRef]
  29. Aguilar, B.J. Applications of Ecosystem Health for the Sustainability of Managed Systems in Costa Rica. Ecosyst. Health 1999, 5, 36–48. [Google Scholar] [CrossRef]
  30. Ahkami, A.H.; White, R.A., III; Handakumbura, P.P.; Jansson, C. Rhizosphere Engineering: Enhancing Sustainable Plant Ecosystem Productivity in a Challenging Climate. Rhizosphere 2017, 3, 233–243. [Google Scholar] [CrossRef]
  31. Wen-Jing, M.A.; Zhang, Q.; Niu, J.M.; Kang, S.; Liu, P.T.; He, X.; Yang, Y.; Zhang, Y.N.; Wu, J.G. Relationship of ecosystem primary productivity to species diversity and functional group diversity: Evidence from Stipa breviflora grassland in Nei Mongol. Chin. J. Plant Ecol. 2013, 37, 620–630. [Google Scholar]
  32. Forsius, M.; Akujärvi, A.; Mattsson, T.; Holmberg, M.; Punttila, P.; Posch, M.; Liski, J.; Repo, A.; Virkkala, R.; Vihervaara, P. Modelling impacts of forest bioenergy use on ecosystem sustainability: Lammi LTER region, southern Finland. Ecol. Indic. 2016, 65, 66–75. [Google Scholar] [CrossRef]
  33. De Kruijf, H.A.M.; Van Vuuren, D.P. Following Sustainable Development in Relation to the North-South Dialogue: Ecosystem Health and Sustainability Indicators. Ecotoxicol. Environ. Saf. 1998, 40, 4. [Google Scholar] [CrossRef] [PubMed]
  34. Niu, M.; Wang, J.; Binduo, X.U. Assessment of the ecosystem health of the Yellow River Estuary based on the pressure-state-response model. Acta Ecol. Sin. 2017, 37, 942–952. [Google Scholar]
  35. Neto, E.D.A.L.; de Carvalho, F.D.A. Centre and Range method for fitting a linear regression model to symbolic interval data. Comput. Stat. Data Anal. 2008, 52, 1500–1515. [Google Scholar] [CrossRef]
  36. Oprime, P.C.; Mendes, G.H.D.S. The X-bar control chart with restriction of the capability indices. Int. J. Q. Reliab. Manag. 2017, 34, 38–52. [Google Scholar] [CrossRef]
  37. Mohamad, D.; Ibrahim, S.Z. Decision making procedure based on jaccard similarity measure with Z-numbers. Pertanika J. Sci. Technol. 2017, 25, 561–574. [Google Scholar]
  38. Kuang, L.; Yu, L.; Huang, L.; Wang, Y.; Ma, P.; Li, C.; Zhu, Y. A Personalized QoS Prediction Approach for CPS Service Recommendation Based on Reputation and Location-Aware Collaborative Filtering. Sensors (Basel) 2018, 18, 1556. [Google Scholar] [CrossRef]
  39. Gwozdz-Lason, M. Analysis by the Residual Method for Estimate Market Value of Land on the Areas with Mining Exploitation in Subsoil under Future New Building. In IOP Conference Series: Earth and Environmental Science; IOP Publishing: Bristol, UK, 2017. [Google Scholar]
  40. Guo, T.; He, B.H.; Chen, J.J. Study on soc forecast model in regions of hilly purple soil by water erosion. Adv. Mater. Res. 2011, 391-392, 982–987. [Google Scholar] [CrossRef]
  41. Schrepp, M.; Hinderks, A.; Thomaschewski, J. Construction of a Benchmark for the User Experience Questionnaire (UEQ). Int. J. Interact. Multimed. Artif. Intell. 2017, 4, 40–44. [Google Scholar] [CrossRef]
  42. Bader, F.; Schön, E.M.; Thomaschewski, J. Heuristics Considering UX and Quality Criteria for Heuristics. Int. J. Interact. Multimed. Artif. Intell. 2017, 4, 48–53. [Google Scholar] [CrossRef]
Figure 1. The Evaluation Indicators for the sustainability of the Open Source Ecosystem (OSE).
Symmetry 10 00747 g001
Figure 2. Evaluation Indicators System for Sustainability of OSE (the indicators system establishes the target level, guideline level, and evaluation level based on the Pressure-State-Response (PSR) model, determines indicators at the guideline level through measures of natural ecosystem sustainability, and determines evaluation level indicators through participant activities.).
Symmetry 10 00747 g002
Figure 3. (a) User activities in the SO ecosystem (Step 1 indicates that the user creates a question; Step 2 indicates that the answerer answers the question; Step 3 indicates that the reviewers comment on the question and answers; Step 4 indicates that the user accepts a satisfactory answer; Step 5 indicates that the searcher searches for the question through question content and tags); (b) post in SO (users, questions, answers, tags, comments, vote are marked by arrows).
Symmetry 10 00747 g003
Figure 4. Openness analysis (in which the blue line with diamonds represents the number of new users registered for the SO system each year, and the orange line with triangles represents the number of questions with the answers per year).
Symmetry 10 00747 g004
Figure 5. Control chart of the number of stable users.
Symmetry 10 00747 g005
Figure 6. (a) The response rate of questions; (b) average number of comments.
Symmetry 10 00747 g006
Figure 7. Top 10 popular languages for each years of 2010–2016 in GitHub and SO. (The bar chart on the left of each year shows the top 10 popular languages in GitHub, ranked from top to bottom according to the number of languages used by the GitHub project; the bar chart on the right represents the top 10 most popular languages in SO, ranked from top to bottom according to the number of questions raised by users in the SO system. Grey represents different popular languages in the GitHub and SO, where O-C stands for Objective-C).
Symmetry 10 00747 g007
Figure 8. Number of python questions.
Symmetry 10 00747 g008
Figure 9. Comprehensive assessment of SO ecosystem sustainability.
Symmetry 10 00747 g009
Figure 10. Line chart of the actual value and the predicted value.
Symmetry 10 00747 g010
Table 1. Meaning of influencing factors.
Influencing FactorsMeaning
opennessThe ability of the entire ecosystem to communicate and transformation with the outside environment or within the ecosystem.
stabilityThe anti-interference ability of the structure, state and behavior of the ecosystem. Including avoidance, tolerance and resilience.
integrityThe internal composition, structure and function of an ecosystem and the integrity of its external biophysical environment.
productivityThe biological production capacity of the ecosystem.
regulationThe ecosystem has certain resistance to interference and has a certain ability to recover after being disturbed. It can coordinate and maintain stability.
resilienceThe ability of ecosystems to maintain function under pressure.
diversityRich and balanced species within the ecosystem.
driversNatural or man-made disturbances or stress on ecosystems that change ecosystems.
organizational structureComponents and structures in the ecosystem.
a propensity for growthEcosystem growth is good.
conform to development trendThe ability to meet the needs of contemporary people.
Table 2. Total data in the SO ecosystem.
YearThe Number of New UsersTotal Number of PostsTotal Number of CommentsTag
2010199,5472,174,1952,847,812<css>,<html>,<java>...
2011360,0353,510,6225,135,270<java>,<JavaScript>,<c++>...
2012686,5474,518,2747,217,973<c++>,<c>,<c#>...
20131,126,7385,425,8229,172,187<java>,<c++>,<c>...
20141,181,1625,406,3349,209,145<css>,<js>,<html>...
20151,261,6035,412,4649,328,299<ruby>,<python>,<c++>...
20161,569,3225,617,9749,765,734<java>,<c++>,<c#>...
Table 3. Evaluation Indicators System of the sustainability of the SO ecosystem.
Target LevelGuideline LevelEvaluation Level
Sustainability of SO ecosystemopennessthe number of new users
the number of questions with the answers
stabilitythe number of stable users
activitythe response rate of questions
the average number of comments
extensibilitypopularity
growth force
Table 4. Similarity between the top 10 popular languages of SO and GitHub.
Year2010201120122013201420152016
Similarity0.70.90.90.80.90.90.9
Table 5. Weight of indicators.
Target LevelGuideline LevelEvaluation LevelGuideline Level (weight)Evaluation Level (weight)
Sustainability of SO ecosystemopennessthe number of new users0.28610.1728
the number of questions with the answers0.1085
stabilitythe number of stable users0.14820.0889
activitythe response rate of questions0.28140.1104
the average number of comments0.2184
extensibilitypopularity0.28420.2031
growth force0.0978
Table 6. Comprehensive assessment value of the sustainability and the composite index of the guideline indicators.
YearOpenness IndexStability IndexActivity IndexExtensibility IndexComprehensive Assessment Index
20100.00810.00130.06460.00860.0825
20110.01800.00660.06380.03340.1218
20120.03960.01110.06180.04190.1544
20130.06390.01320.05670.04070.1744
20140.06650.01130.04400.06230.1840
20150.06930.01040.03470.07080.1852
20160.07910.01010.03720.08550.2120
Table 7. Comparison of predicted value and actual value.
YearActual ValuePredicted ValueRelative ErrorAverage Relative Error
20100.08250.08250.00000.0439
20110.12180.13590.1157
20120.15440.14860.0373
20130.17440.16260.0678
20140.18400.17780.0339
20150.18520.19440.0496
20160.21200.21260.0030
Table 8. Open Source Ecosystem based on group collaboration.
Open Source CommunityCommunity FunctionCommunity Introduction
Githubopen source code hostingGitHub is a web-based hosting service that uses Git for version control, providing access control and multiple collaboration features for each project, such as bug tracking, feature requests, task management, and wiki.
Sourceforgeopen source code hostingSourceforge is a web-based service that provides software developers with a centralized online platform to control and manage open source software projects.
QuoraQ&A CommunityQuora is a knowledge market, Quora brings together many questions and answers, allowing users to collaboratively edit questions and answers.
Topcodercrowdsourcing platformTopcoder is a mass outsourcing company with an open global community of designers, developers, data scientists and competitive programmers, and pays for the work of community members on projects, as well as providing services to businesses, medium-sized enterprises and small business customer sales communities.

