Probabilistic Modeling of Speech in Spectral Domain using Maximum Likelihood Estimation

1
Electrical Engineering Department, King Khalid University, Asir-Abha 61421, Saudi Arabia
2
Computer Engineering Department, King Khalid University, Asir-Abha 61421, Saudi Arabia
*
Author to whom correspondence should be addressed.
Symmetry 2018, 10(12), 750; https://0-doi-org.brum.beds.ac.uk/10.3390/sym10120750
Submission received: 15 November 2018
/
Revised: 9 December 2018
/
Accepted: 13 December 2018
/
Published: 14 December 2018
Abstract
:The performance of many speech processing algorithms depends on modeling speech signals using appropriate probability distributions. Various distributions such as the Gamma distribution, Gaussian distribution, Generalized Gaussian distribution, Laplace distribution as well as multivariate Gaussian and Laplace distributions have been proposed in the literature to model different segment lengths of speech, typically below 200 ms in different domains. In this paper, we attempted to fit Laplace and Gaussian distributions to obtain a statistical model of speech short-time Fourier transform coefficients with high spectral resolution (segment length >500 ms) and low spectral resolution (segment length <10 ms). Distribution fitting of Laplace and Gaussian distributions was performed using maximum-likelihood estimation. It was found that speech short-time Fourier transform coefficients with high spectral resolution can be modeled using Laplace distribution. For low spectral resolution, neither the Laplace nor Gaussian distribution provided a good fit. Spectral domain modeling of speech with different depths of spectral resolution is useful in understanding the perceptual stability of hearing which is necessary for the design of digital hearing aids.
1. Introduction
Several speech processing methods such as speech coding, speaker/speech recognition, speech synthesis, speech enhancement, voice activity detection (VAD), independent component analysis (ICA), speaker diarization, etc. require the statistical modeling of speech signals. The performance of these speech processing applications depends on the accurate modeling of the probability distribution of speech signals [1]. Many results available in the literature attribute speech with a Gamma distribution (γ-D), Gaussian distribution (GD), Generalized Gaussian distribution (GGD), Laplacian distribution (LD) as well as multivariate Gaussian and Laplacian distributions [1,2,3,4,5,6,7,8]. The probability distribution that best model speech samples depends on various factors such as the domain of speech representation (such as time domain or frequency domain), segment length, silence periods in the speech as well as noise. Important findings available in the literature are discussed below to highlight the fact that there are several probability distributions that can be used to model speech signals under different conditions.
The following findings have been reported in [1]: The time domain representation of speech signals follows the Laplace distribution, when the silence intervals (pauses in speech) are omitted. Furthermore, the de-correlated representation of speech, where the correlation between successive samples of speech is removed using the Karhunen–Loève transform, has a multivariate LD. In the presence of silence intervals along with voice activity, γ-D is a good fit. Short segments (<2.5 ms) of speech in the time domain have been shown to follow a GD, whereas for longer time domain segments (>5 ms), LD is shown to provide a better fit. For time domain speech segment lengths of the order of several seconds, γ-D or GGD is preferred.
De-correlated speech segments are also shown to follow LD with different distribution parameters [2]. In [3,4], it was concluded that the voiced component of speech followed LD and the unvoiced component followed GD. The generalized γ-D (Gγ-D) has also been proposed as a more efficient and accurate parametric model of speech probability distribution [6,7].
In the spectral domain, the power spectral density of speech, obtained using linear predictive coding (LPC) has been shown to be best described by a Rayleigh distribution for frequency components around formant frequencies and by a Gaussian distribution for frequency components away from formant frequencies [9]. The frequency components around which acoustic energy is concentrated are formant frequencies. Frequency components that are not near formant frequencies have low concentrations of acoustic energy. Time domain segments of lengths 20–200 ms have been shown to fit LD but for segments shorter than 20 ms, GD is considered better. The distribution of discrete Fourier transform (DFT) coefficients of speech segments around 30 ms has been shown to fit a GD [10], which is in contradiction to [11,12],where the authors suggest that an LD or γ-D provides a better fit for the DFT coefficients. The authors of [10] attribute this contradiction to longer segment lengths and the multiple speaker samples used in [11,12].
The design of digital hearing aids requires an understanding of the probabilistic model of long segments of speech in the spectral domain, i.e., with high spectral resolution. A type of hearing aid, called a cochlear implant provides the sense of sound to people with profound hearing loss. Early version of cochlear implants discarded the fine spectral details and used only the coarse details. The performance of cochlear implants improves progressively by including more spectral details [13]. Hence, the need to model speech spectral parameters with high spectral resolution. While results are available in the literature for representing long segments of speech in the time domain, there is a void of such representation in spectral domain as there are no available results in the literature that provide a statistical model of spectral representation of long segments of speech. In this paper, we show that the distribution of short-time Fourier transform (STFT) coefficients (spectral domain) of speech segments over durations greater than 500 ms can be modeled accurately by LD, having a small RMS error for the estimated LD parameters, which validates the estimated parameters. The Cramer–Rao bound (CRB) for the estimated parameter was also evaluated and the RMS error, which represents the variance of the estimated parameter, was found to be close to CRB, indicating that the maximum likelihood (ML) estimation is an efficient algorithm for the proposed distribution parameter. It was also found that for low spectral resolution, both LD and GD were not accurate distribution models.
The rest of the paper is organized as follows. In Section 2, the ML estimation of LD and GD parameters and the error bound, which represents estimation optimality, is presented. Removal of direct current (DC) bias and VAD to remove silence intervals is discussed in Section 3. In Section 4, experimental details and results corresponding to fitting LD and GD are presented along with their analysis and interpretation. Conclusions and future work are presented in Section 5.
2. Maximum Likelihood Estimation of Laplacian Distribution (LD) and Gaussian Distribution (GD) Parameters
In ML estimation, based on the observation of STFT coefficients of speech, which are assumed to be independently and identically distributed (IID), the distribution parameters which maximize their likelihood function are estimated. It is a standard assumption in the literature that DFT coefficients of speech are IID [10,11,12]. Since STFT coefficients are computed as the DFT of windowed segments, it follows that the assumption of STFT coefficients to be IID is also valid. ML estimation is chosen due to its low implementation complexity and for being a minimum variance unbiased estimator (MVUE) as the observation sample length increases [14]. Laplace distribution has a probability density function (PDF) defined as
with parameters and b which are to be estimated. The likelihood function for the Laplace model parameters and b is defined as
and the corresponding log-likelihood is defined as
The ML estimate of is given as the median of the observed samples i.e., an efficient estimator for the parameter is the median of the observed samples [15]. Due to the symmetric nature of LD, the median is equal to the mean:
The ML estimate of b is obtained by differentiating the log-likelihood function with respect to w.r.t b and equating the derivative to zero.
i.e.,
Similarly, the Gaussian distribution has a PDF defined as
where and σ denote the mean and standard deviation of GD. The corresponding efficient estimators and are obtained by following similar procedures as the estimation of LD parameters and are given as
CRB provides a limit to the performance optimality of unbiased estimators and is used to measure the performance of estimators [16]. CRB gives the lower bound on the variance of any unbiased estimator. An unbiased estimator that achieves this bound is said to be fully efficient. In the context of this work, the CRB for the estimated LD parameter b is defined as
where
The corresponding CRB values for and σ of GD are defined as
where I(b), I(),and I(σ2) denote the Fisher information associated with the estimated parameters [17].
3. Direct Current (DC) Removal and Voice Activity Detection
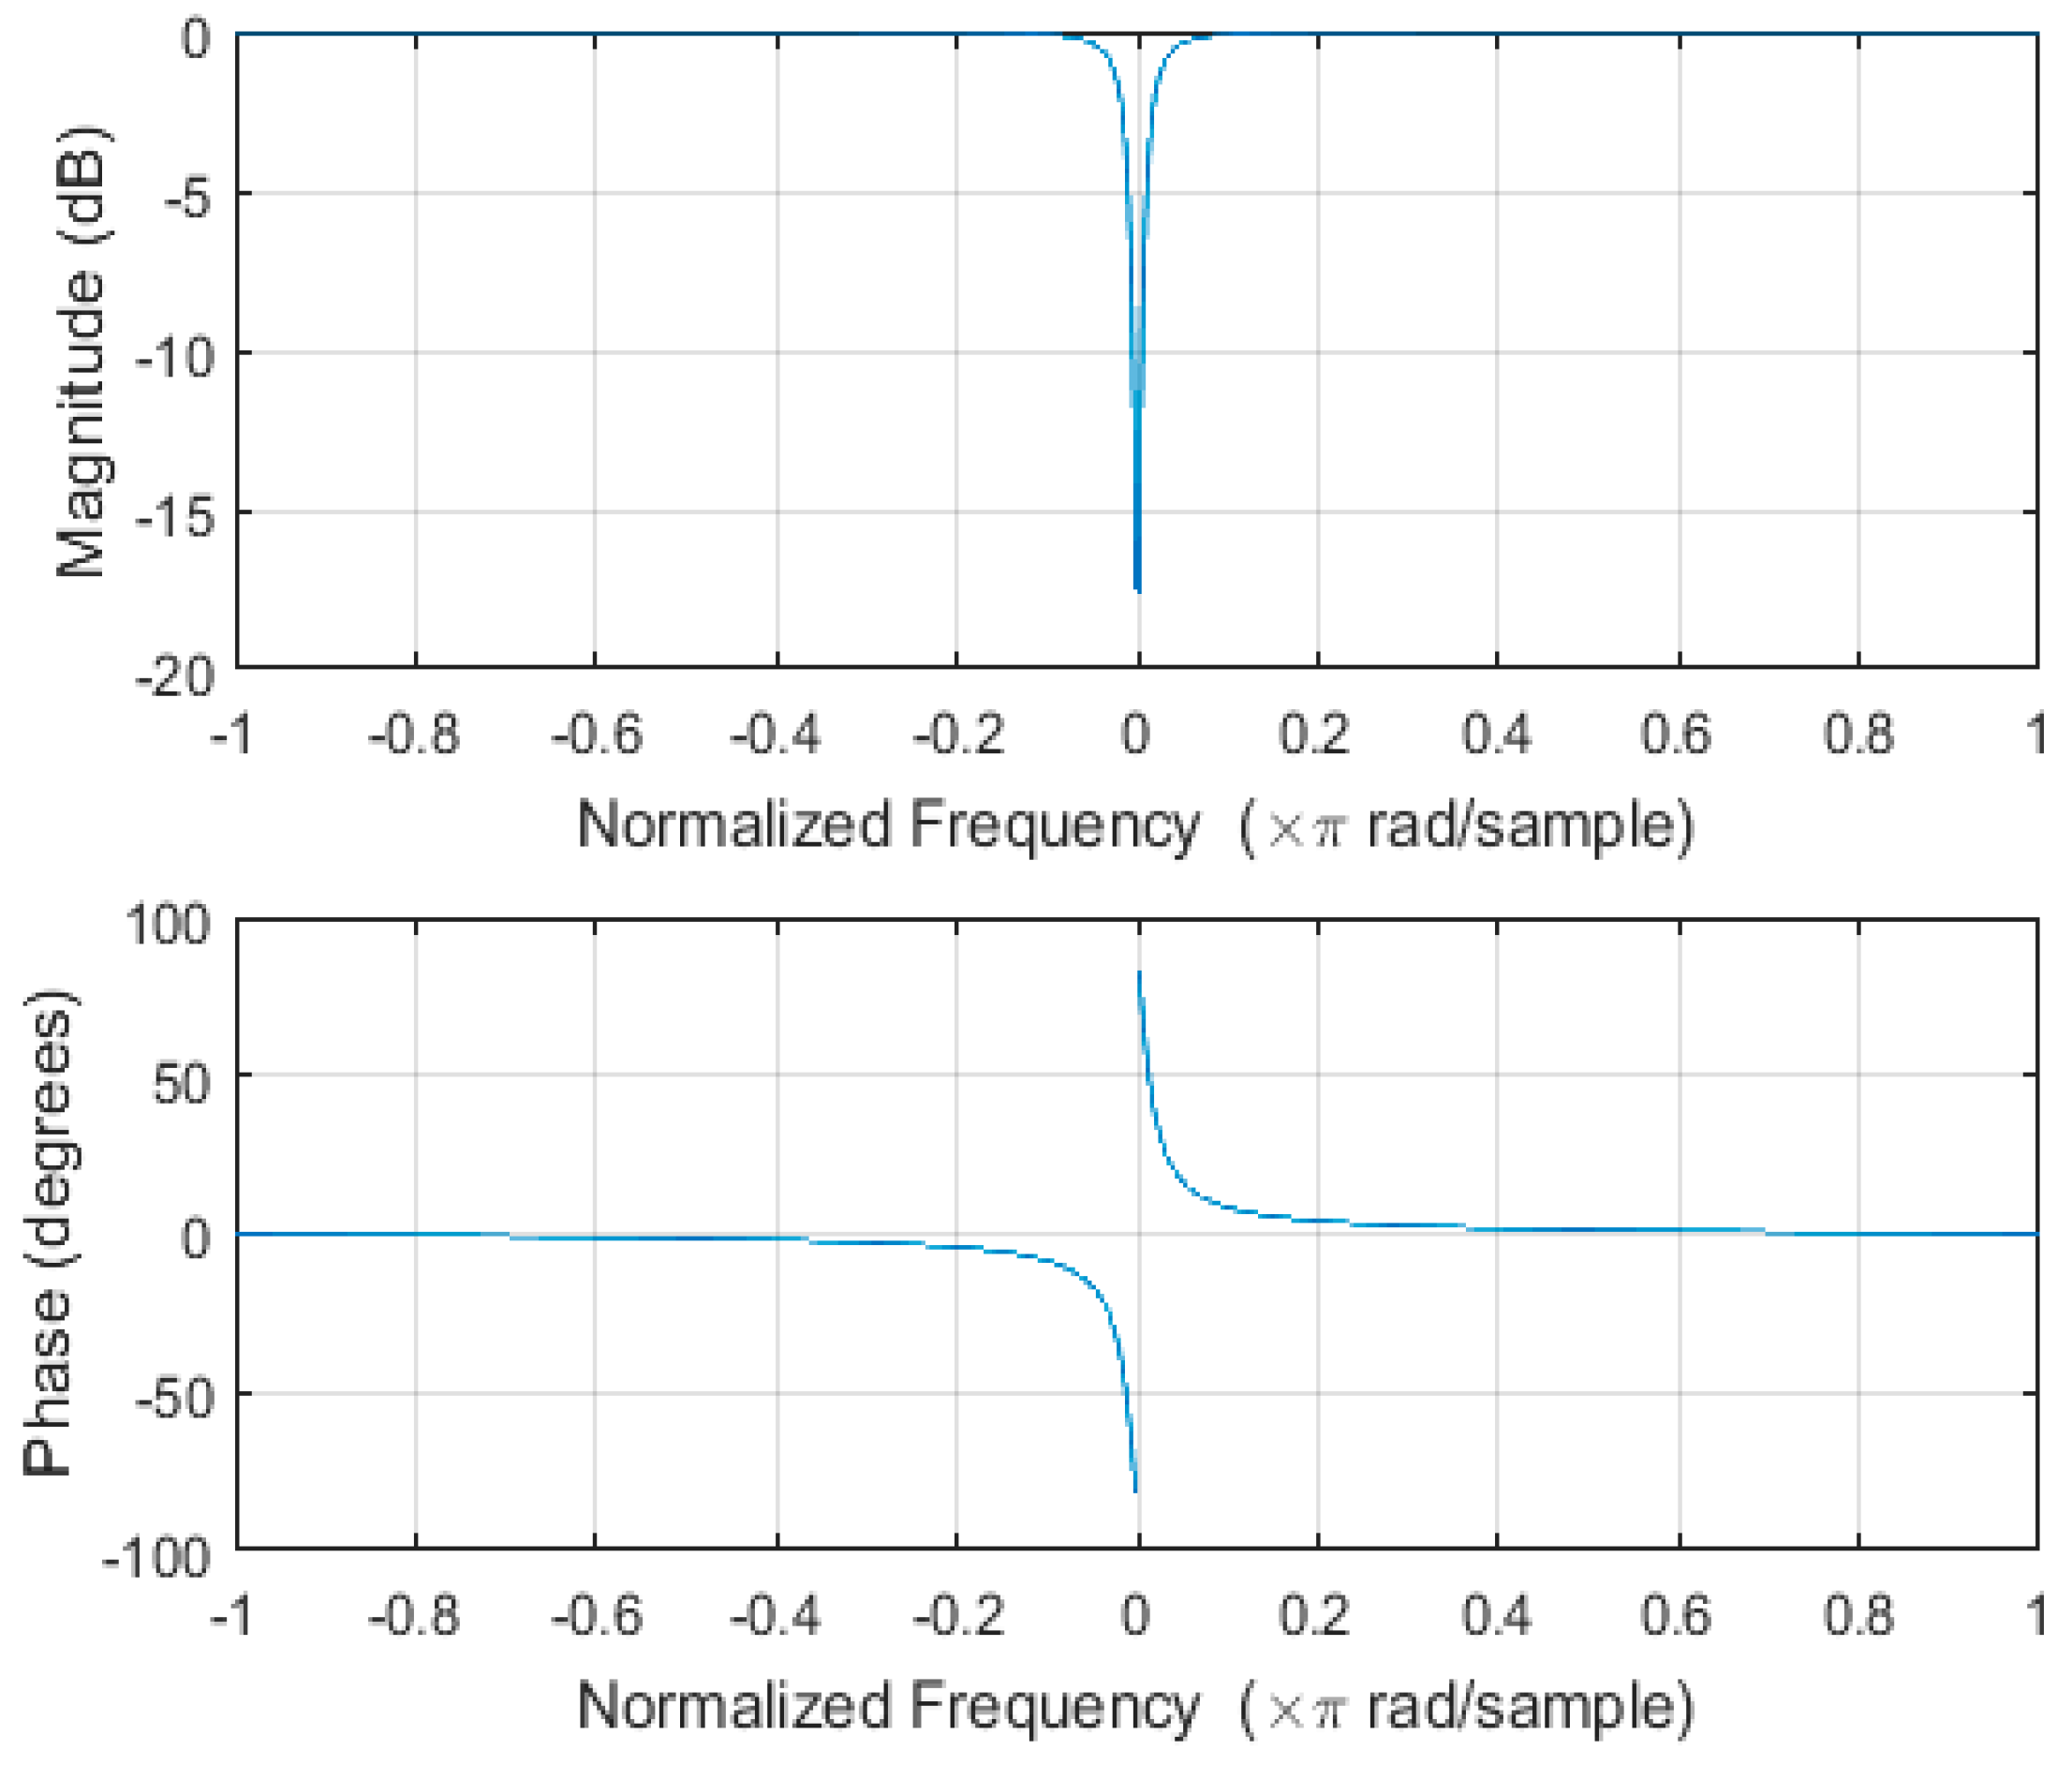
Speech samples used in this work were recorded in non-controlled environments to depict typical application scenarios. Many audio cards introduce a DC offset component to the recordings [18] which can adversely affect the estimated parameters of the fitted distribution by introducing bias. In order to avoid this, a first-order DC removal infinite impulse response (IIR) filter was used to remove the DC component. The response of the DC removal filter used in this work is shown in Figure 1 and its transfer function is given below.
Voice activity detection (VAD) is used to remove ‘silence’ intervals in the recorded speech. Speech signals contain voice activity as well as pauses in voice activity, between words or between sentences, during which no voice activity is present. These constitute silence intervals which are removed using VAD. In this paper, VAD is performed using a frame based approach where frames containing voice activity alone are selected and concatenated in accordance with the procedure described in [19], thereby removing silence intervals.
4. Experimental Procedure and Discussion of Results
Speech samples are recorded in typical office and residential environments rather than in a controlled environment such as an anechoic chamber, using a single microphone at a sample rate equal to 16,000 samples per second. This sample rate is standard in speech processing research and corresponds to a wideband representation of speech that faithfully restores all frequency components of the speech signal. A lower sample rate can cause a loss of information in fricative components of speech signal. DC offset is first removed, followed by VAD to remove silence intervals. Since the spectral components of speech are time varying, computing STFT depicts the variation of spectral components with time. The STFT of speech containing only voice activity is computed and ML estimation is used to estimate the parameters of the fitted distribution. Accuracy of the fitted distribution is determined by computing the RMS error and effectiveness of the fitting algorithm i.e., MLE is determined by computing the CRB on the estimation error.
We computed a narrowband STFT using a wide Hamming window, providing a frequency resolution below 5 Hz. Speech processing with high frequency resolution is useful in several applications such as speech enhancement, improved VAD, speech de-noising, analysis of speech intonation to detect emotion, speech recognition, and automatic speech restoration (ASR) to improve speech intelligibility and in the design of hearing aids and cochlear implants for people with a hearing disability [13,20,21,22,23]. A less obvious but important application is to model the perceptual stability of human listening capability, which allows humans to perceive speech reliably under a wide range of acoustic conditions [24]. While speech is generally considered as a non-stationary signal over segment lengths longer than 20–30 ms, the perceptual stability of the human auditory system motivates the need for an invariant representation of speech over long segment lengths which has application in the design of digital hearing aids.
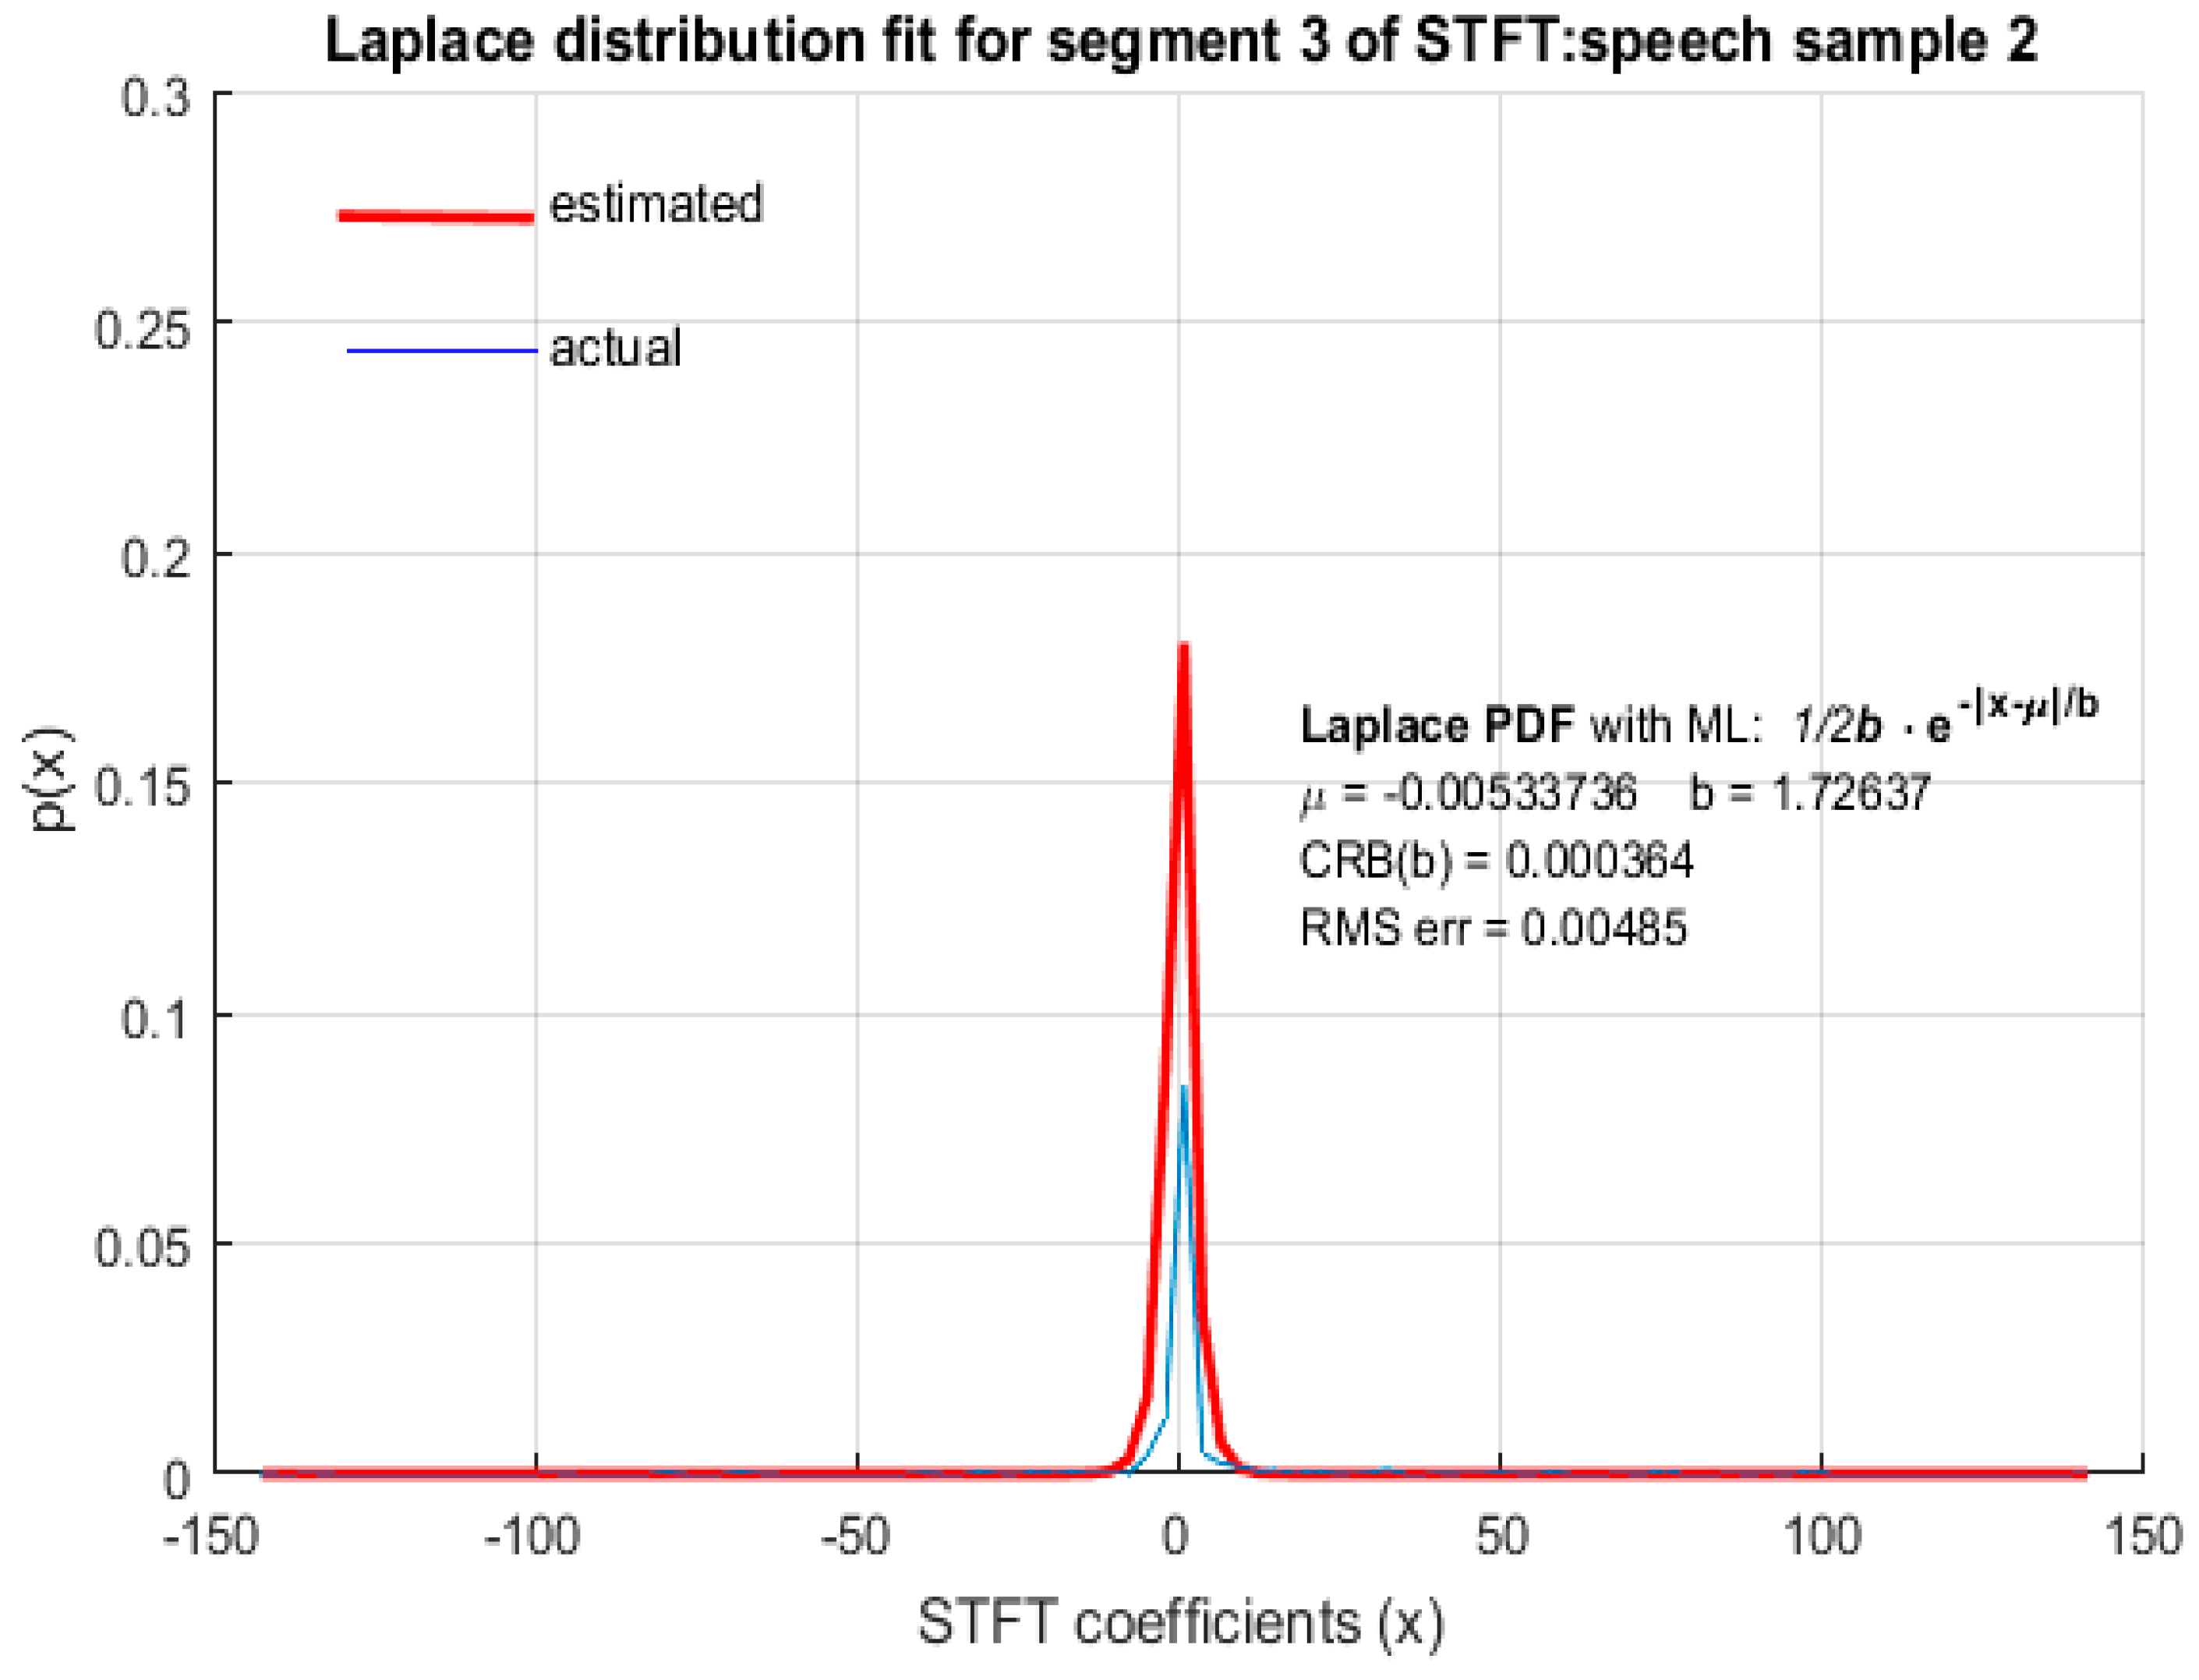
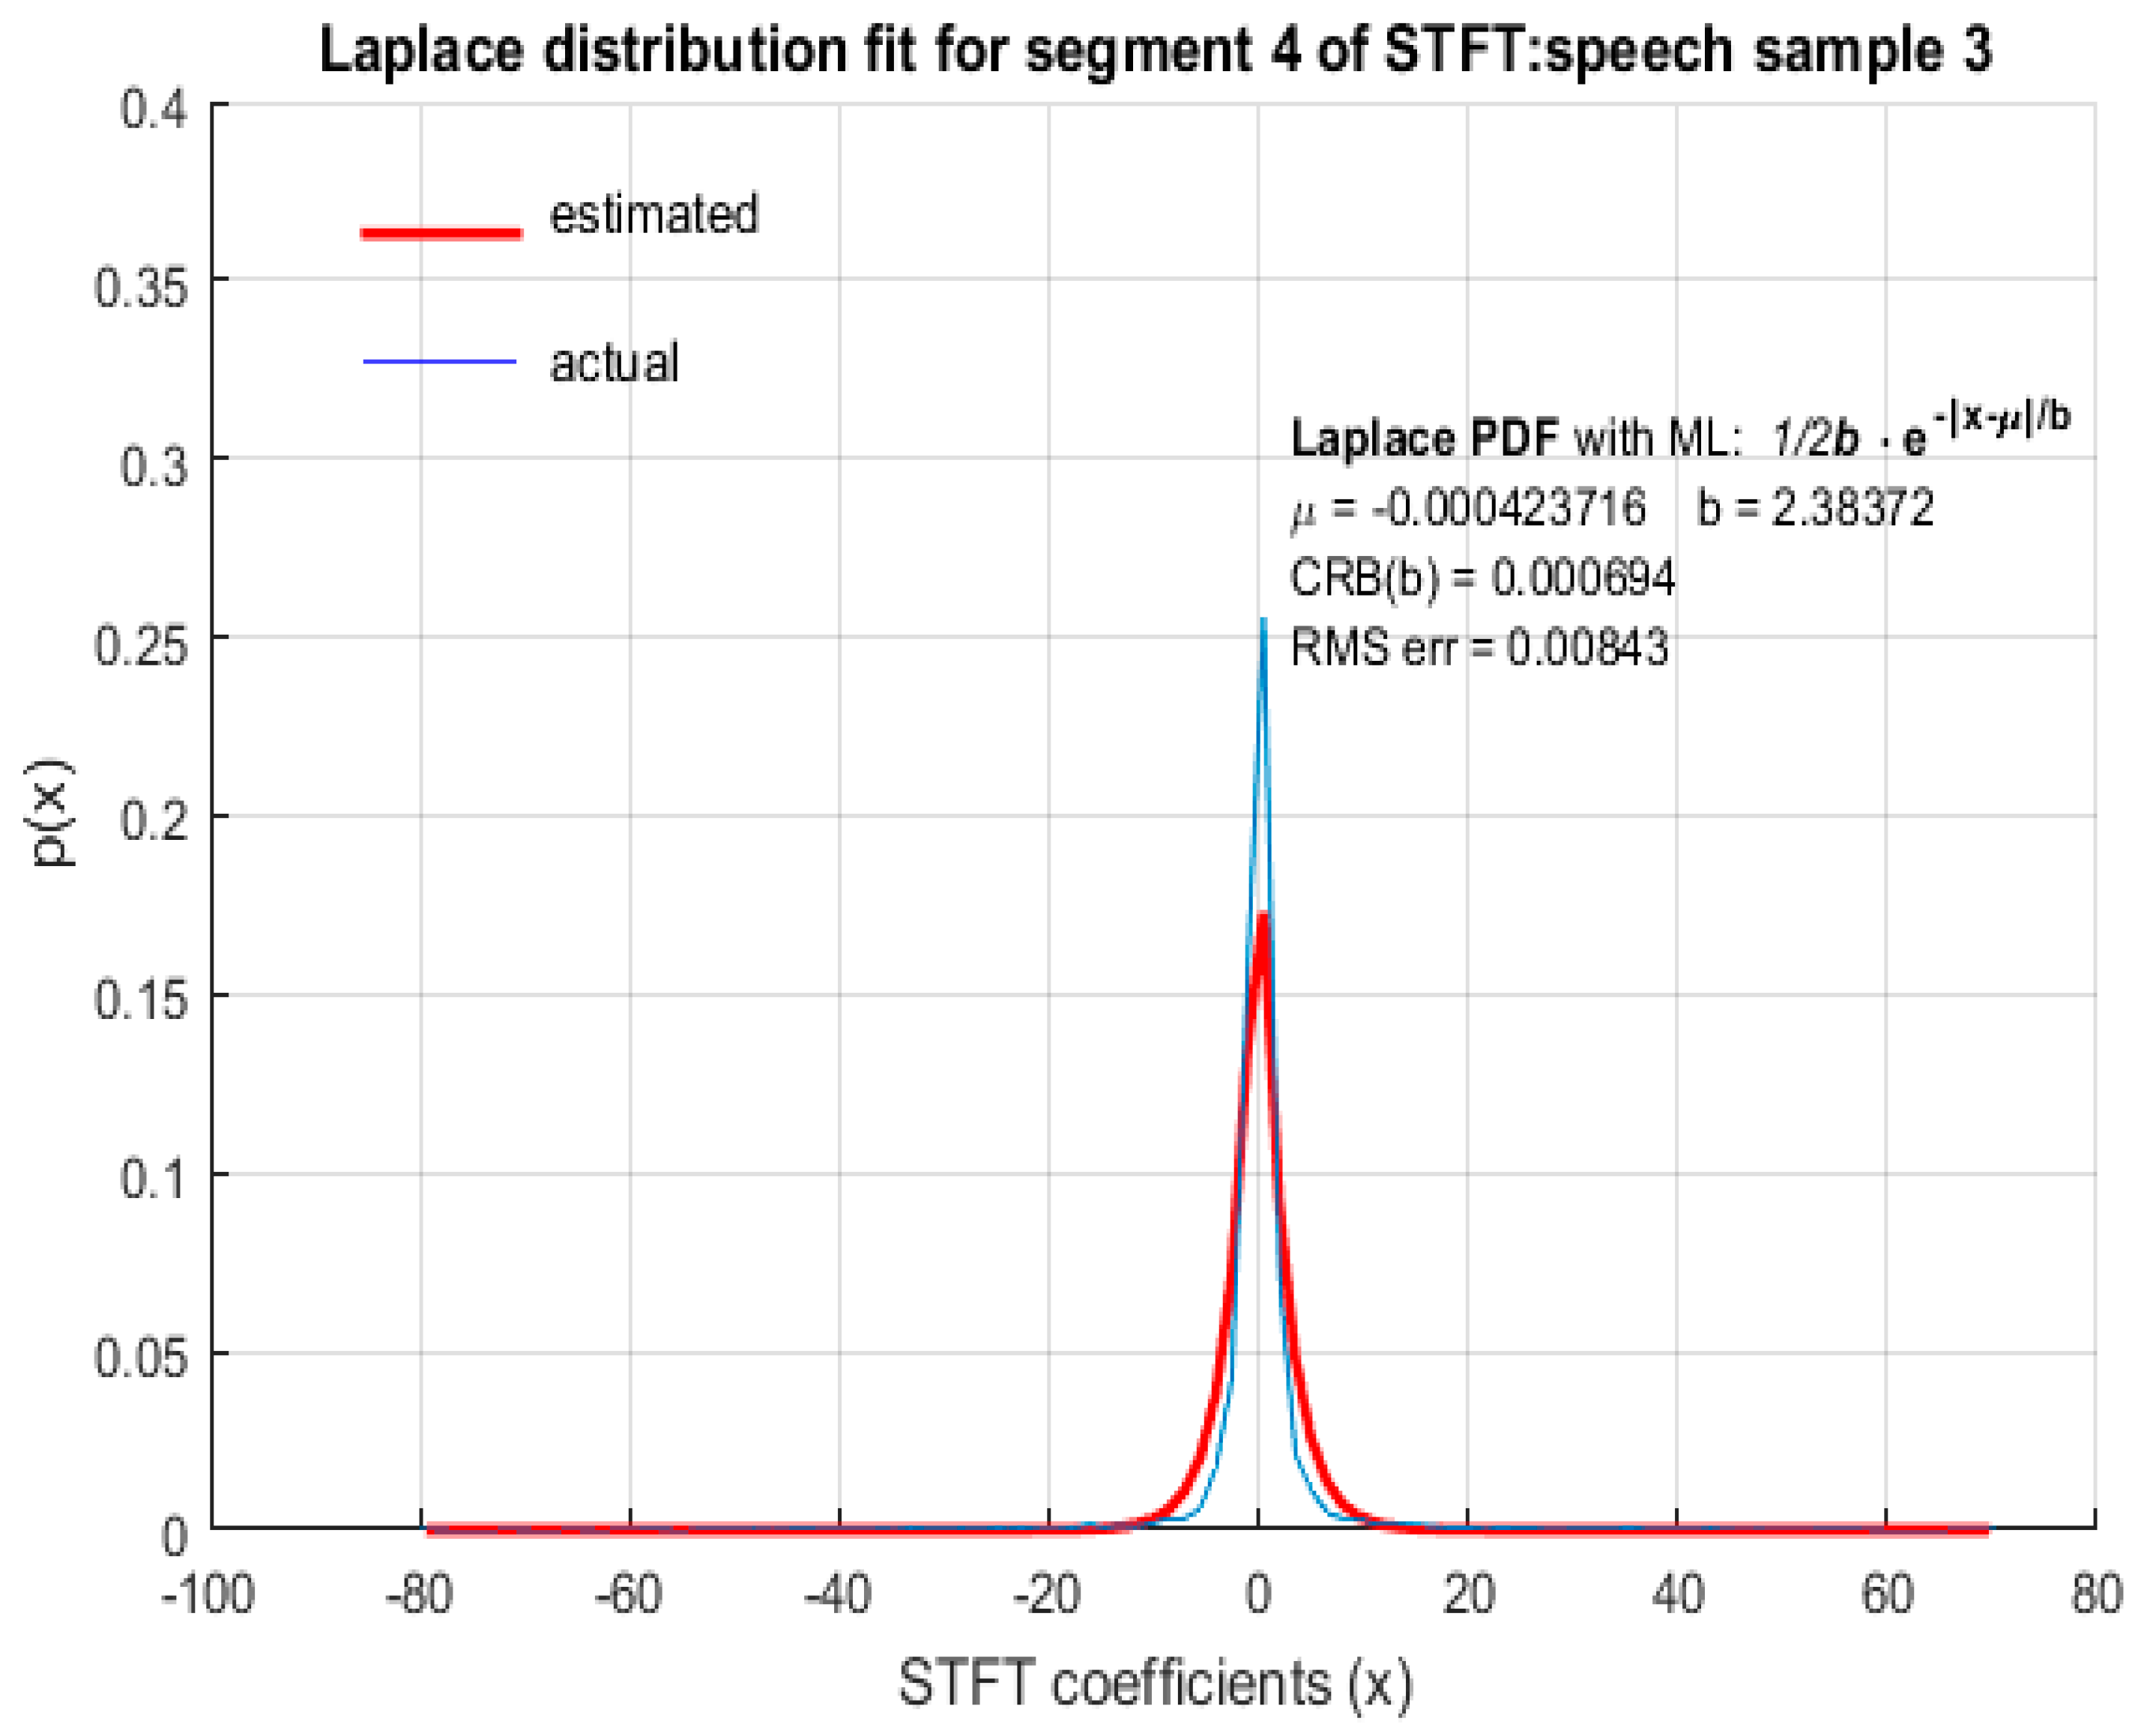
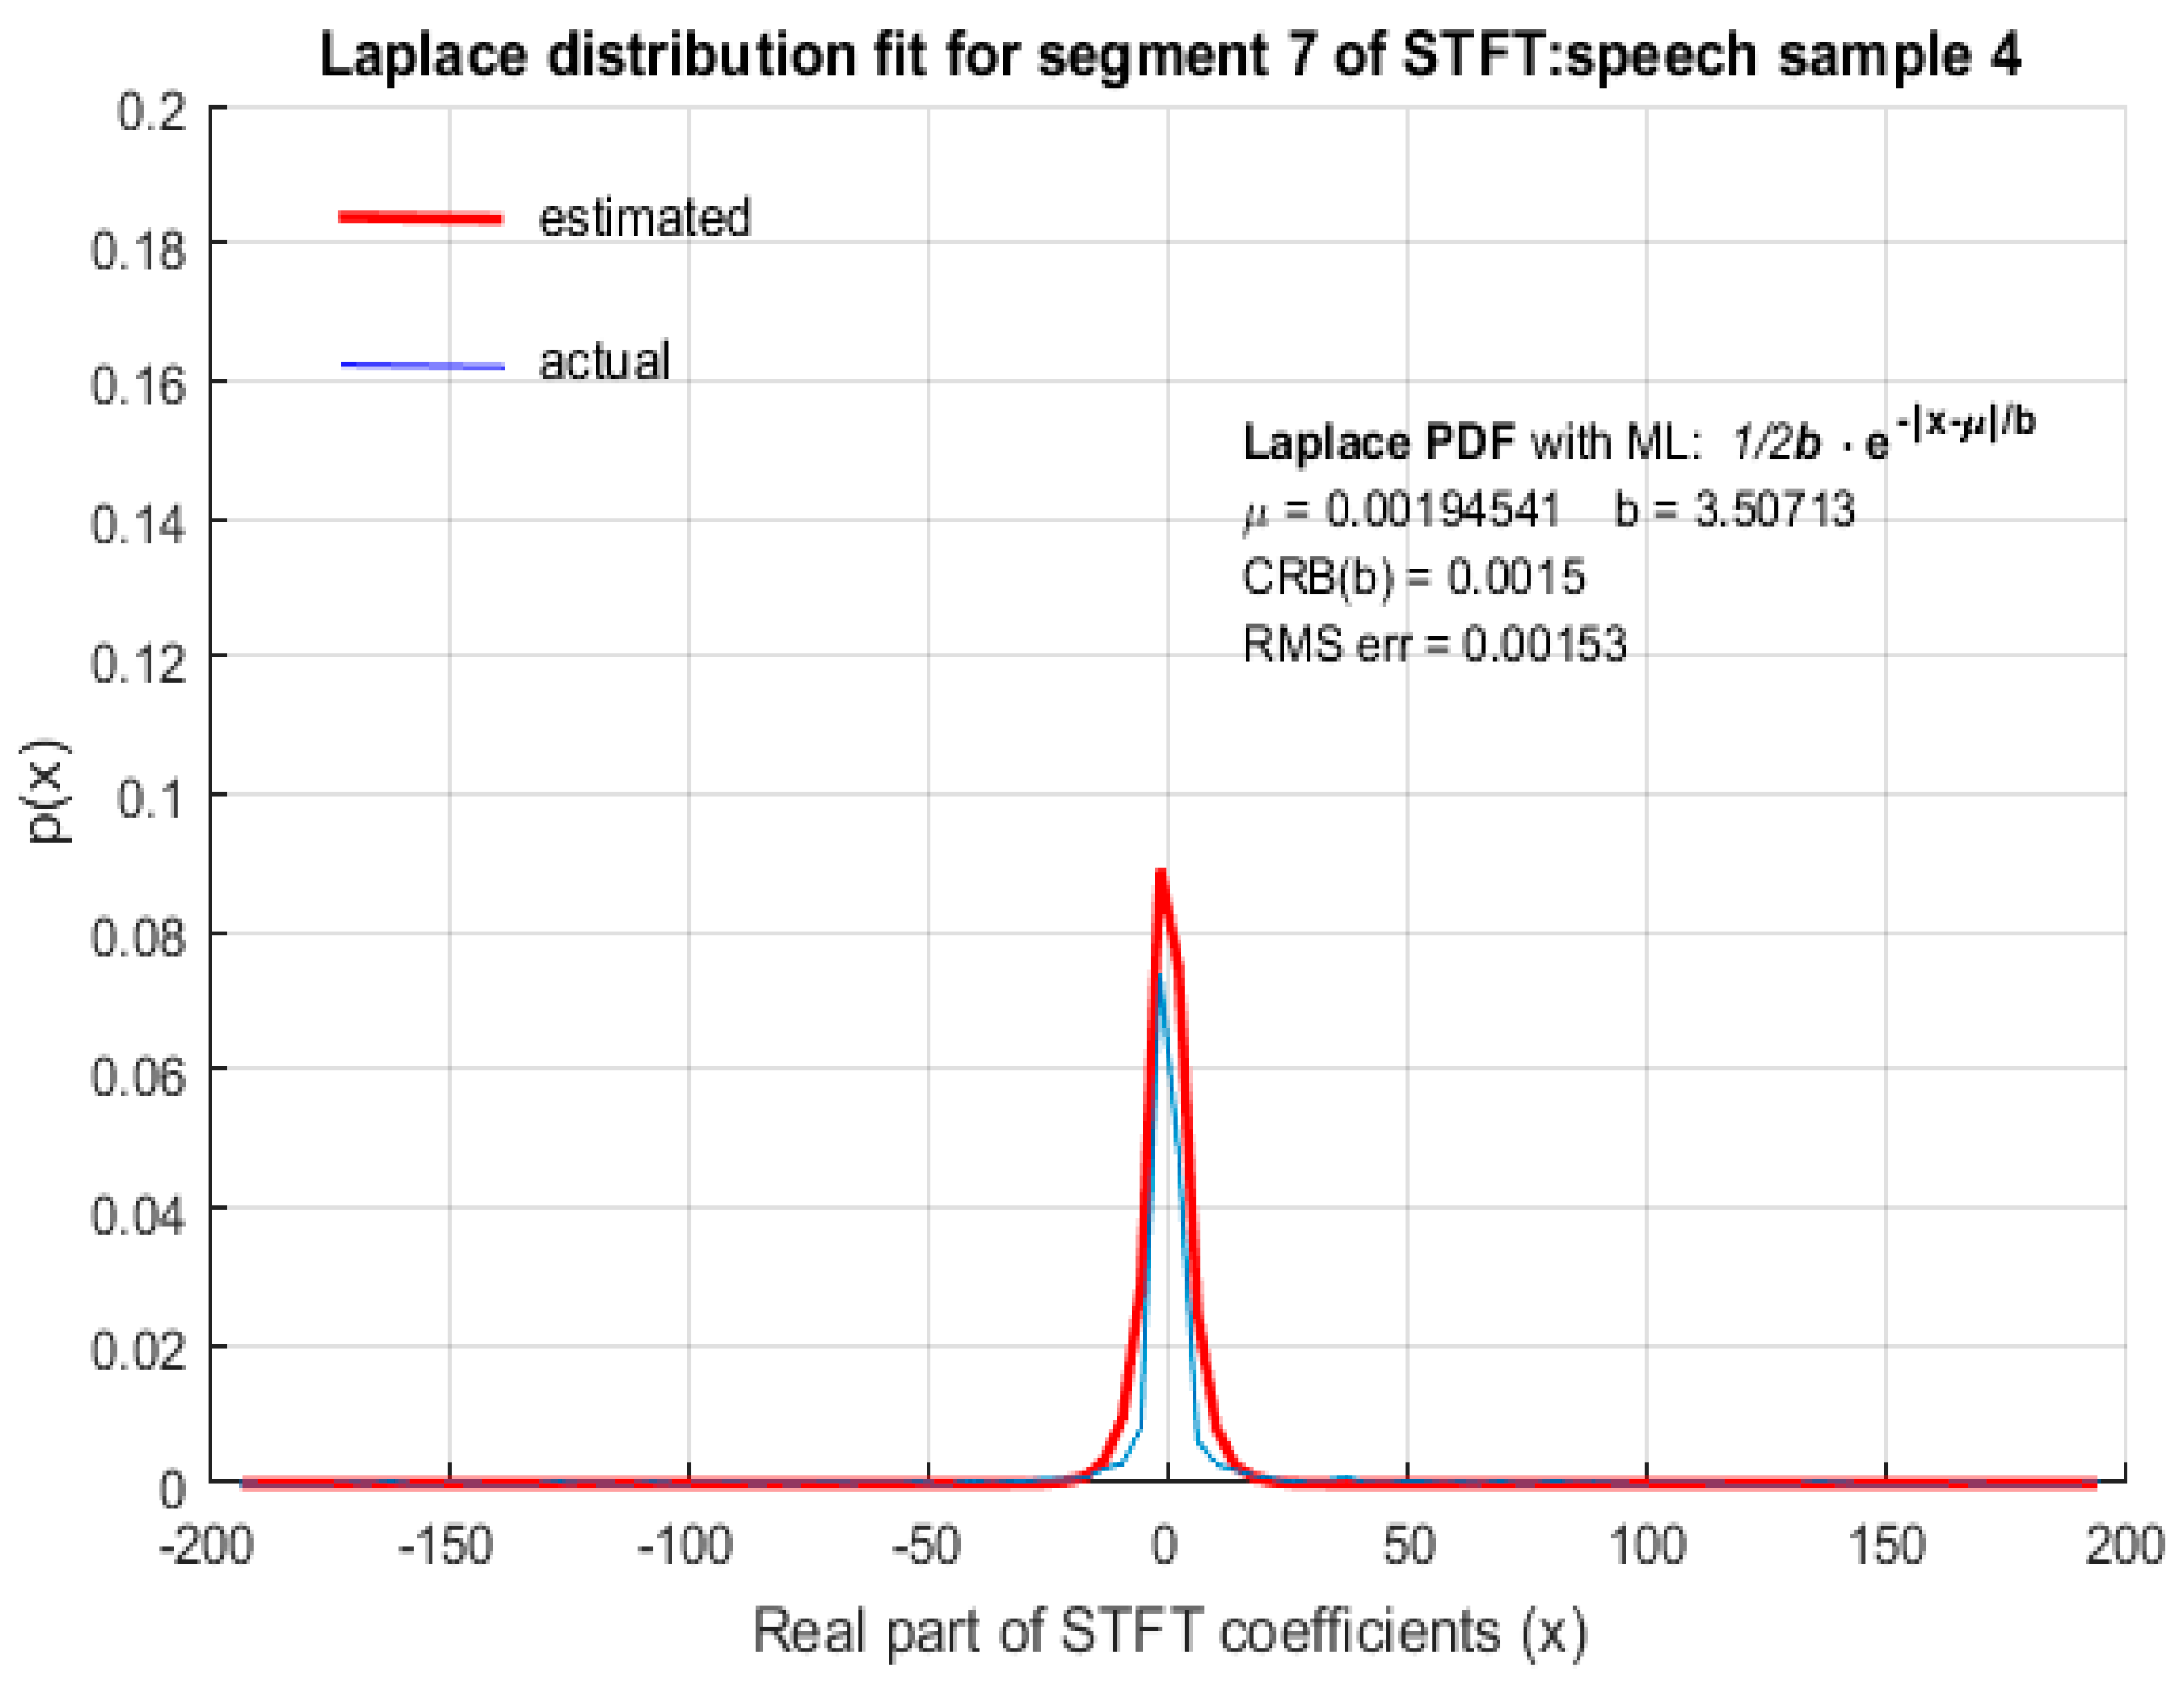
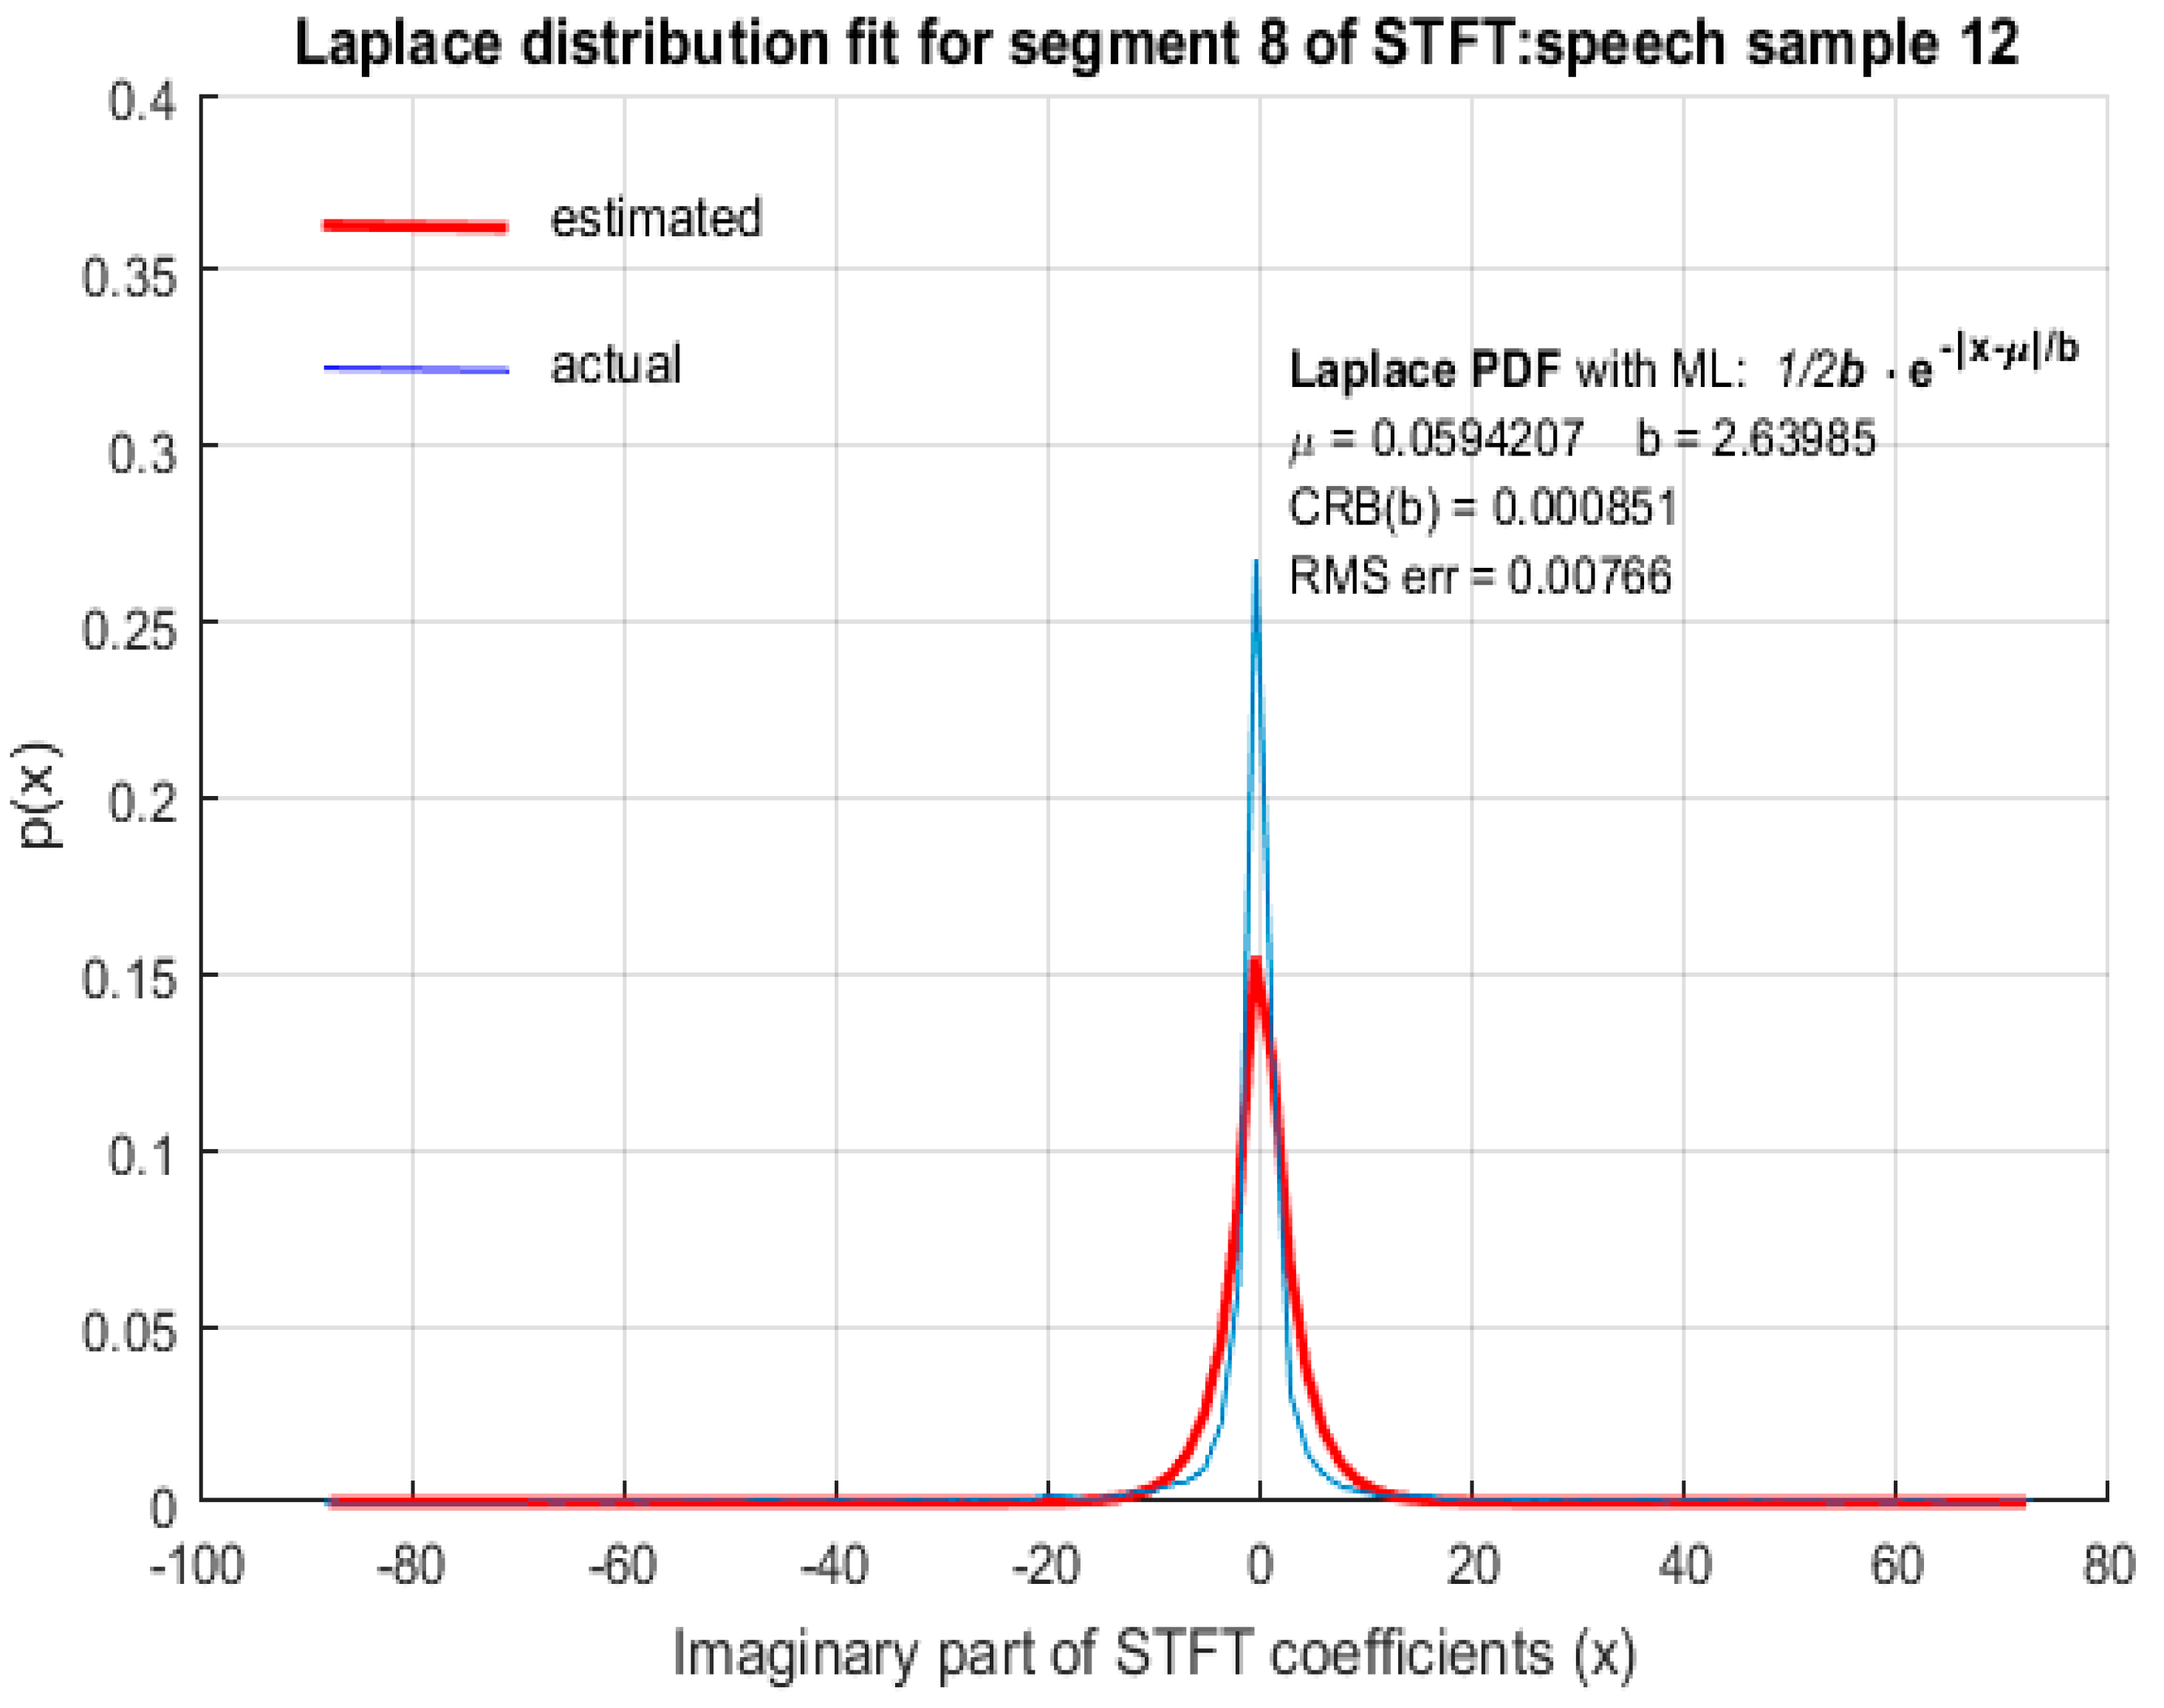
In this paper, we demonstrate through computer simulation that STFT coefficients of speech with high spectral resolution fit reasonably accurately to LD as shown in Figure 2, Figure 3, Figure 4 and Figure 5 for arbitrary speech segments of different individuals. The PDF’s wereobtained by plotting the envelope of histograms of STFT coefficients by dividing their entire range into 100 equally spaced bins. The envelope was obtained by joining the peak of each bin in the histogram. In all the figures that follow, the red (thick) curve represents the fitted distribution based on MLE of distribution parameters and the blue (thin) curve is the actual distribution of the corresponding STFT coefficients. The RMS error of the estimated LD parameter as well as the CRB was small, indicating that MLE is an efficient estimator for LD scale parameter b. It is therefore argued that STFT coefficients of long speech segments (>500 ms) where silence intervals have been removed are modeled accurately by LD. This conclusion was found to be valid for ‘female’ (Figure 2) and ‘male’ (Figure 3) speech as well as for both the ‘real’ (Figure 4) and ‘imaginary’ (Figure 5) parts of the STFT coefficients.
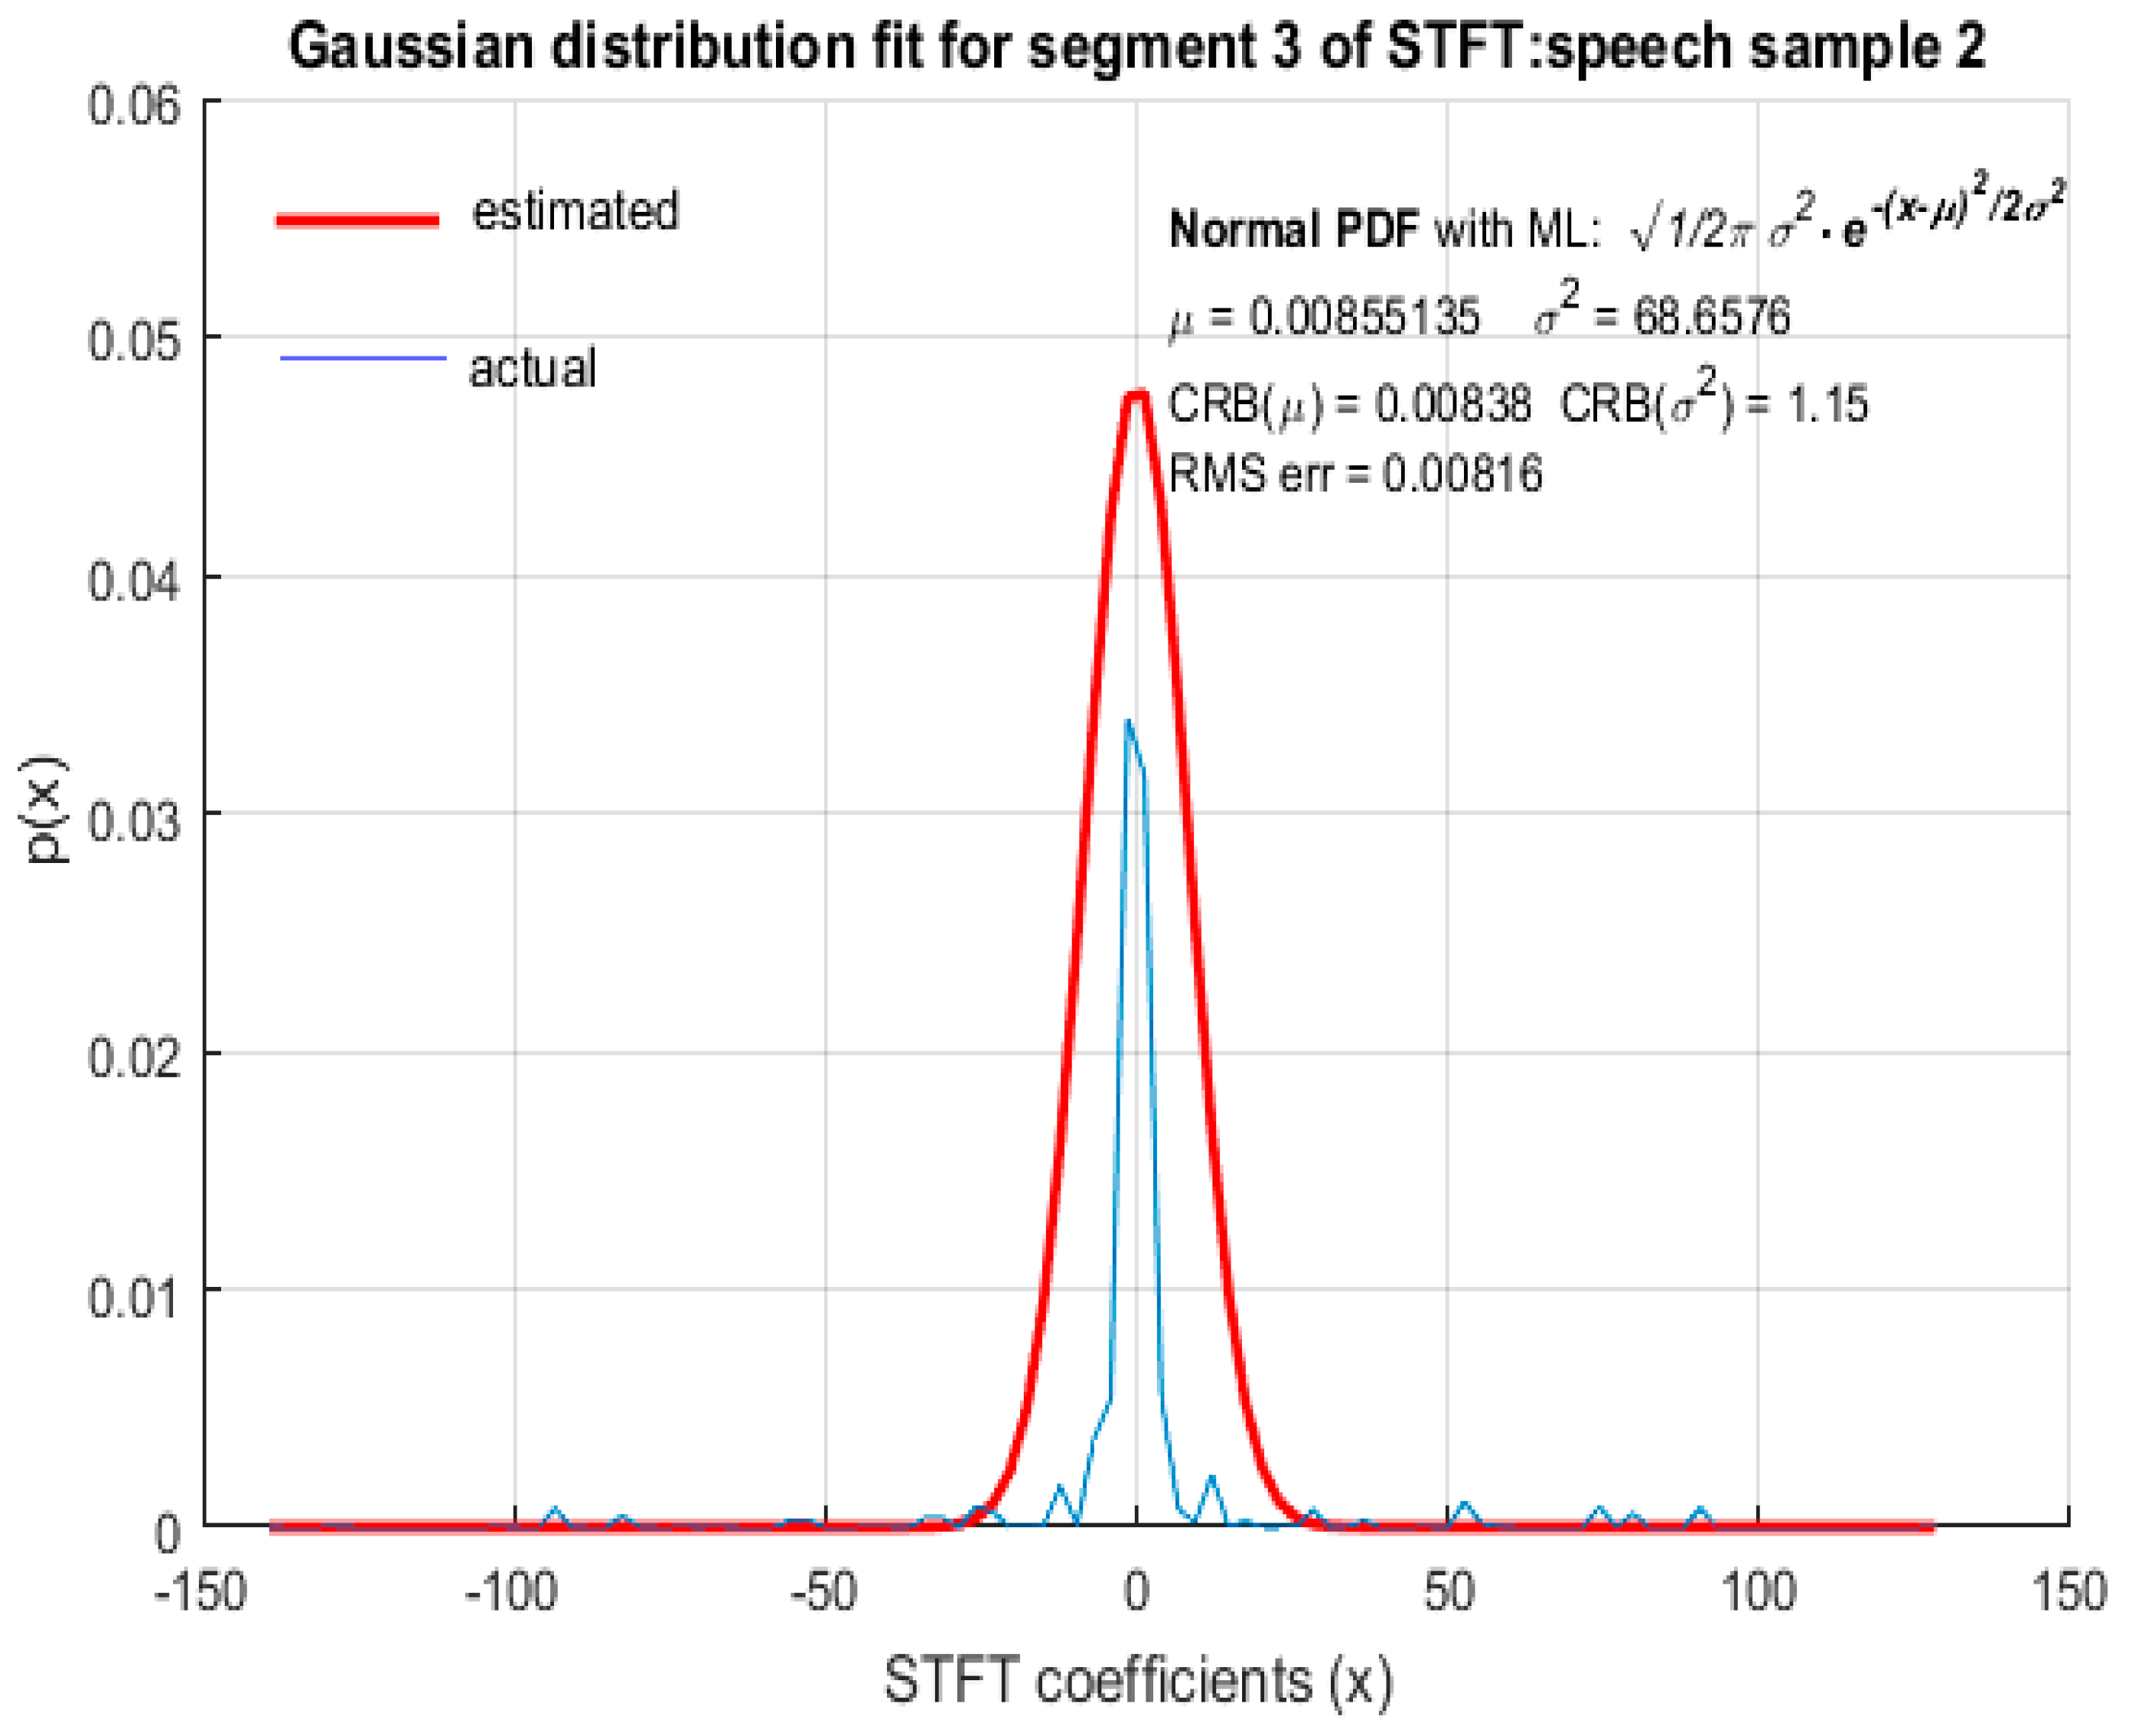
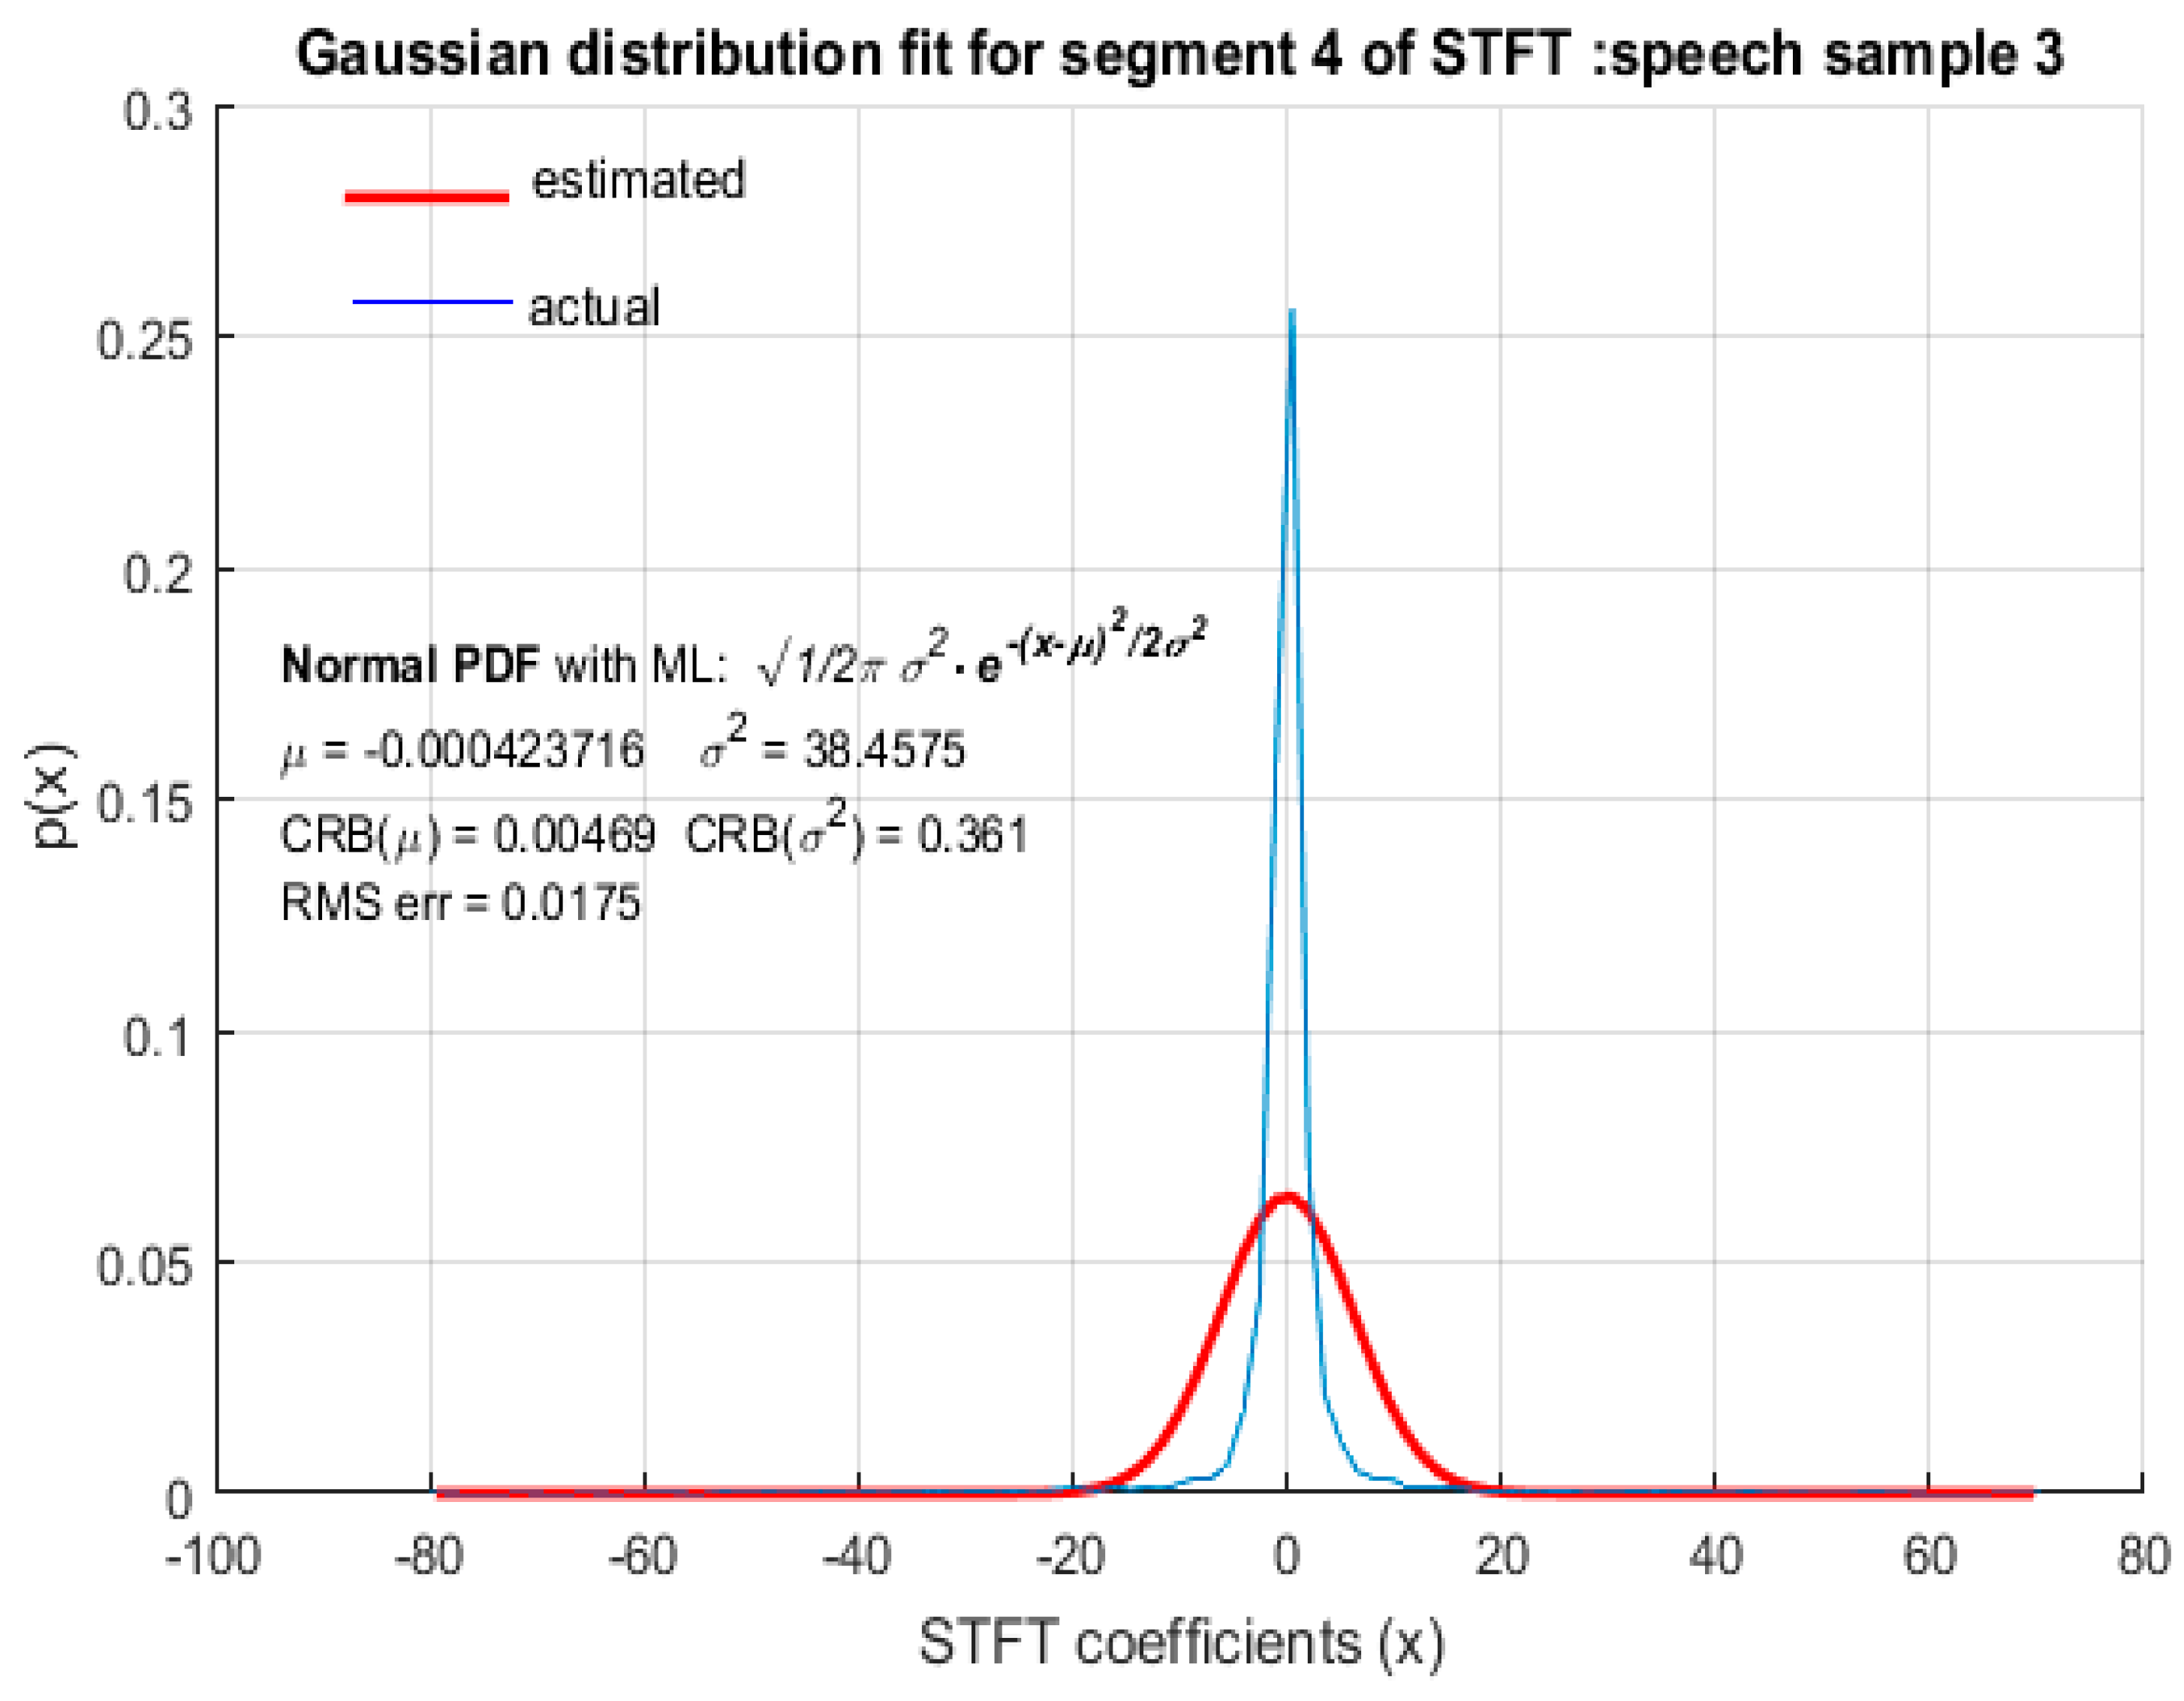
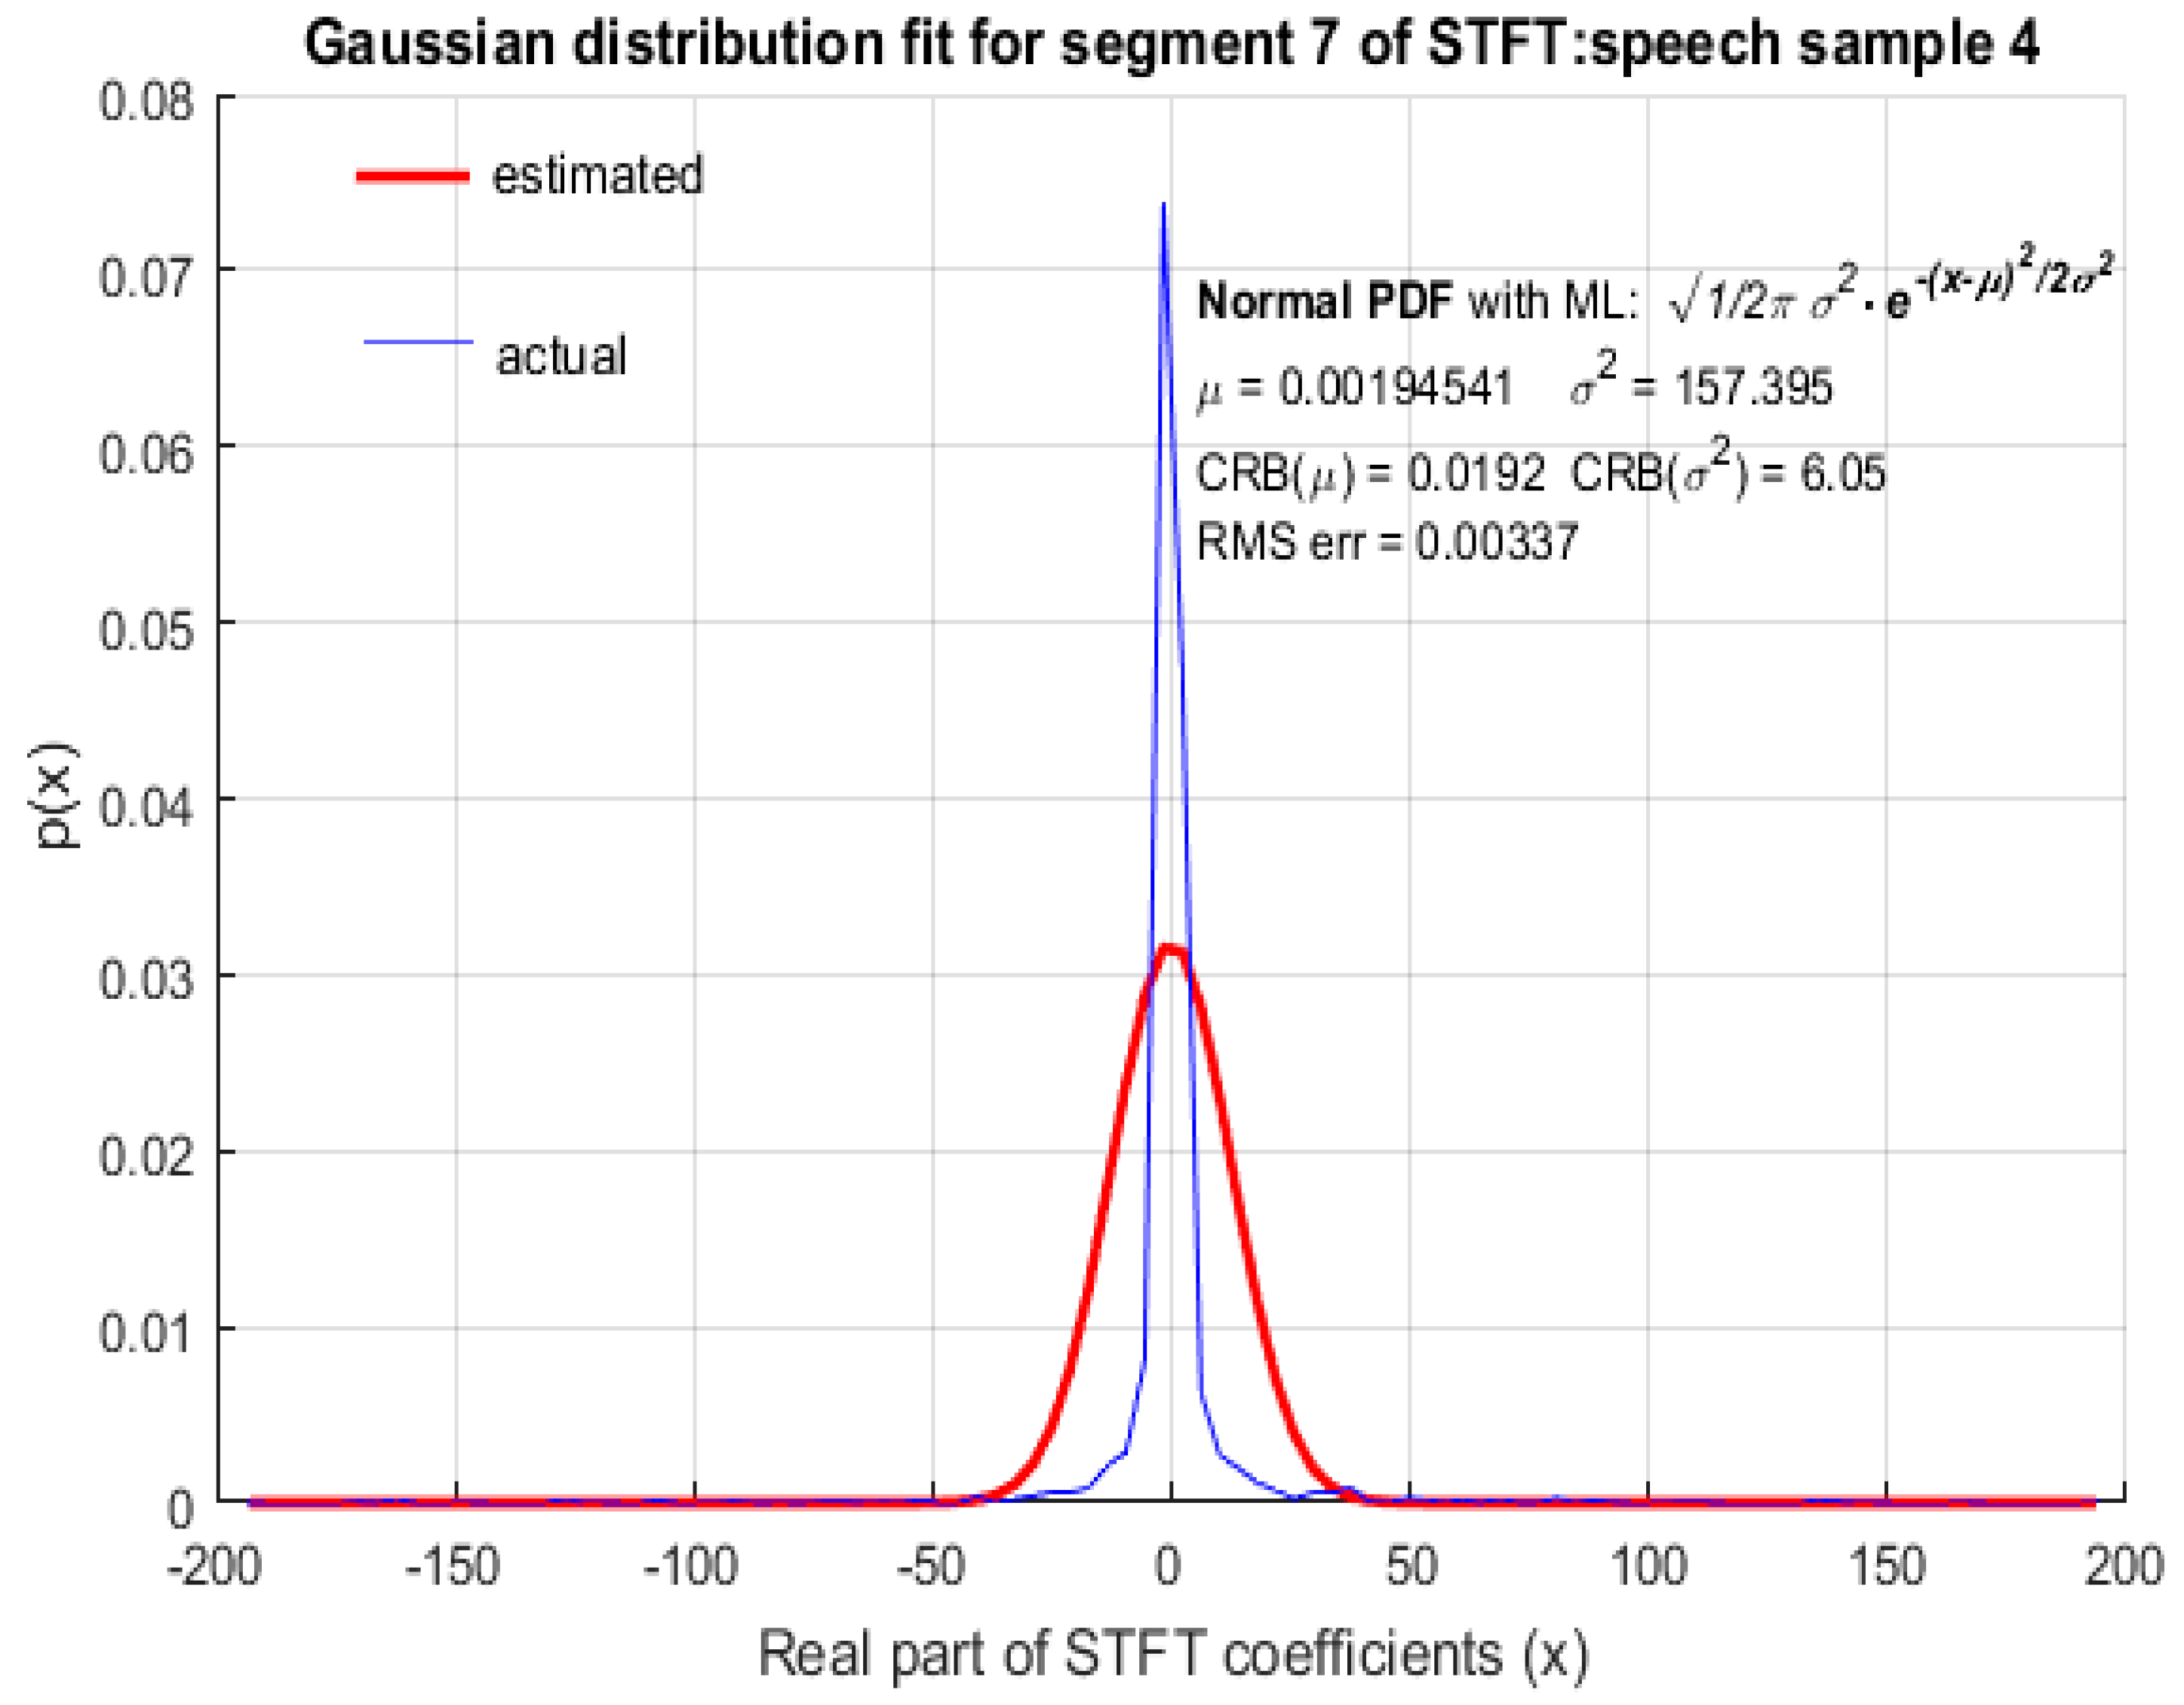
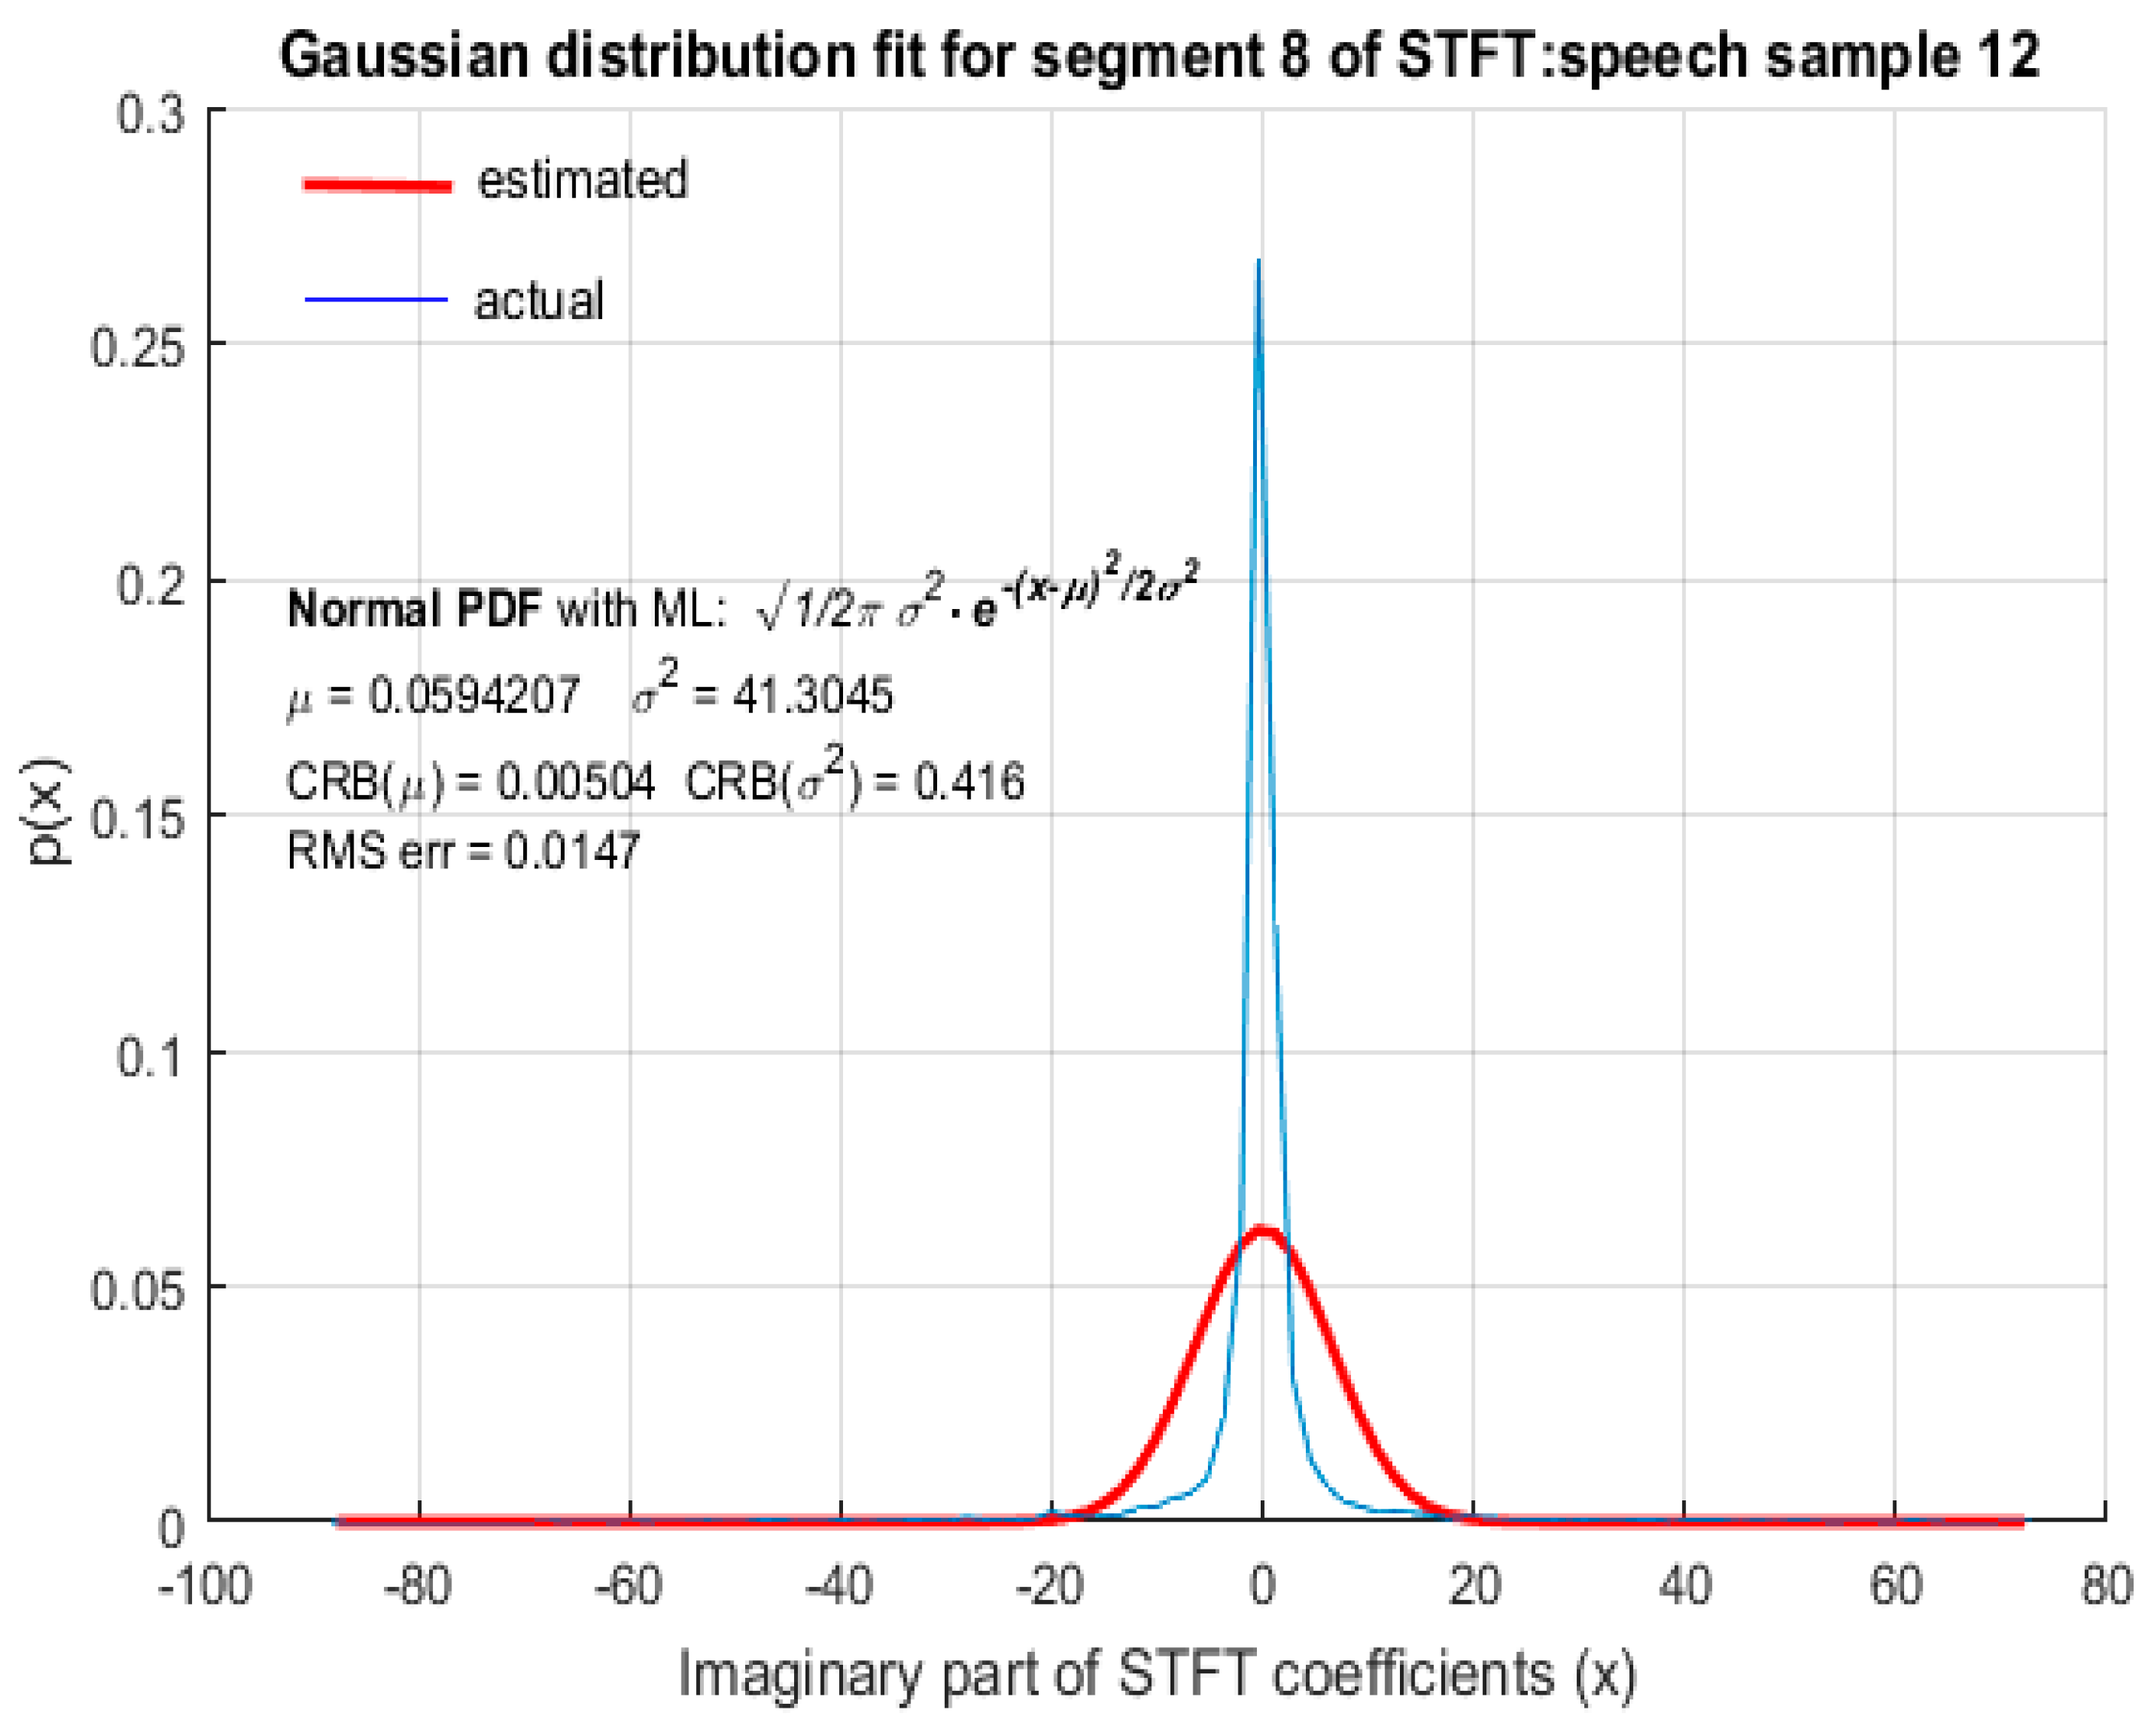
For the purpose of comparison, GD was also fitted to STFT coefficients as shown in Figure 6, Figure 7, Figure 8 and Figure 9 from which it is clear that the STFT coefficients of speech were not accurately modeled by GD. The RMS error of the fitted GD was small (but larger compared to fitting LD) and the MLE of the mean of GD was also reasonably accurate, but the estimated value of variance , using MLE, deviated quite significantly from the actual variance of STFT coefficients with . It is therefore concluded that speech STFT coefficients with a high spectral resolution are not accurately represented by GD and that LD provides a better fit than GD. This wasfound to be the case for ‘female’ (Figure 6) and ‘male’ (Figure 7) speech as well as for ‘real’ (Figure 8) and ‘imaginary’ (Figure 9) parts of STFT coefficients.
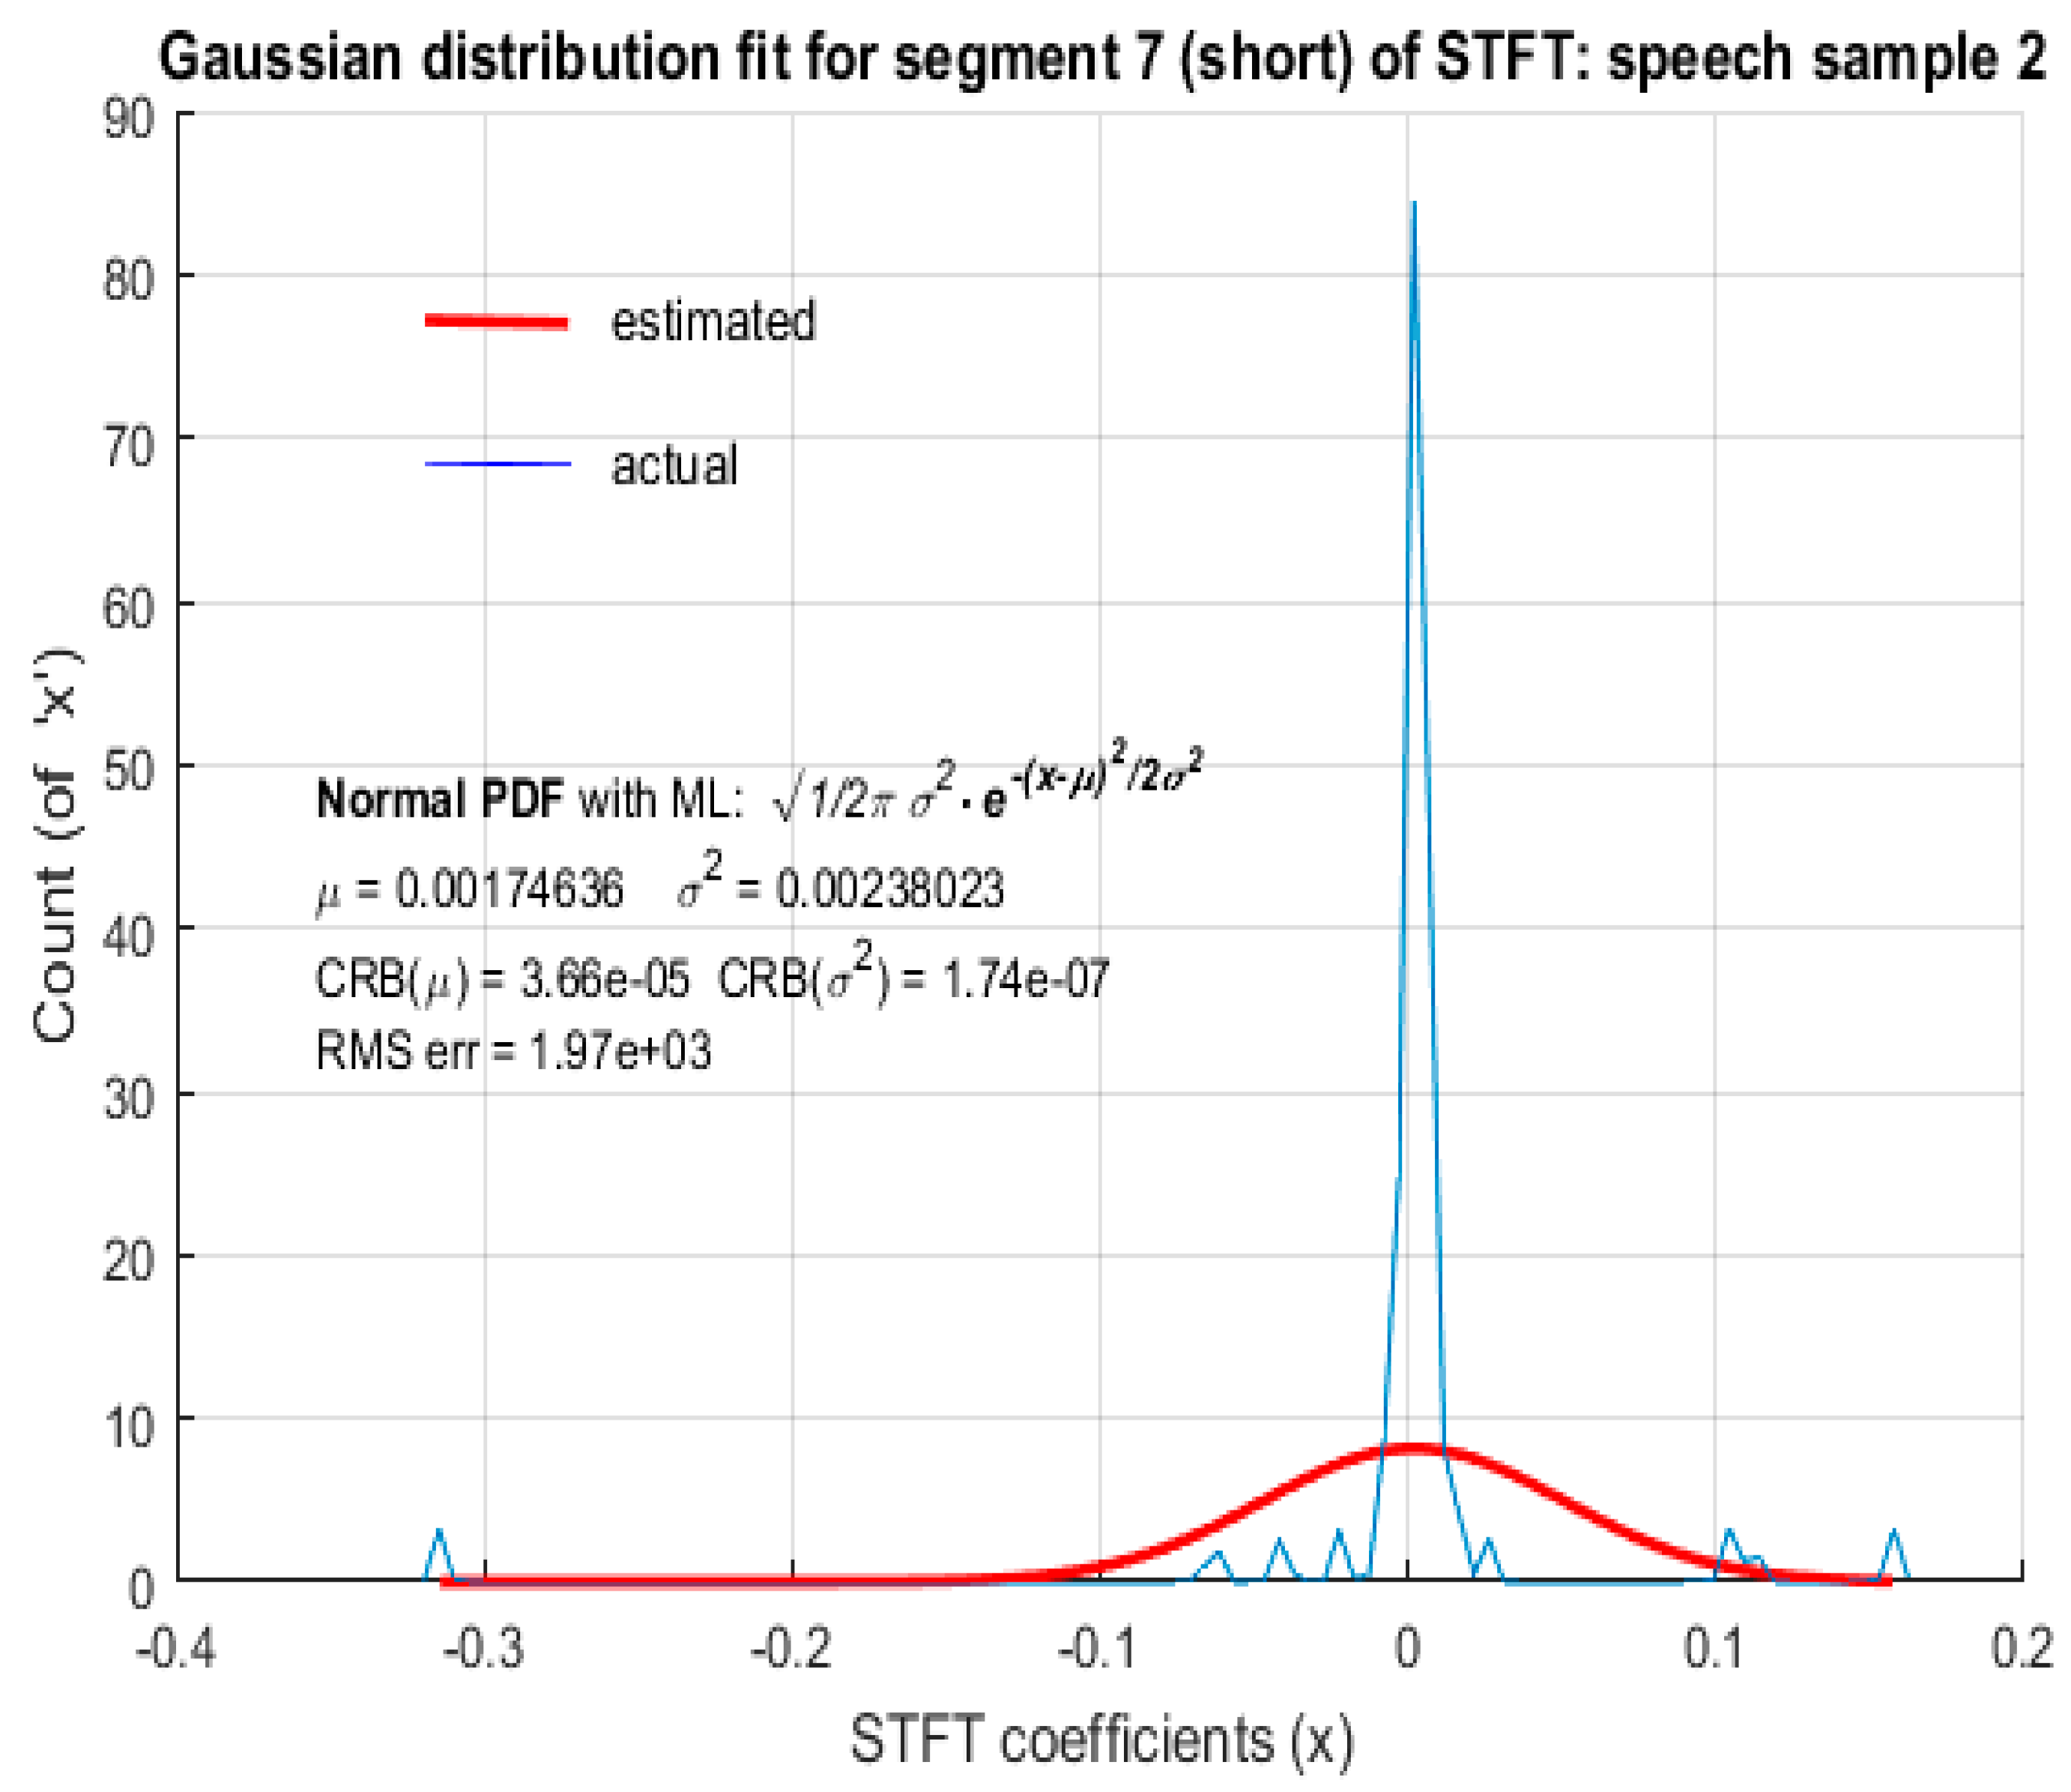
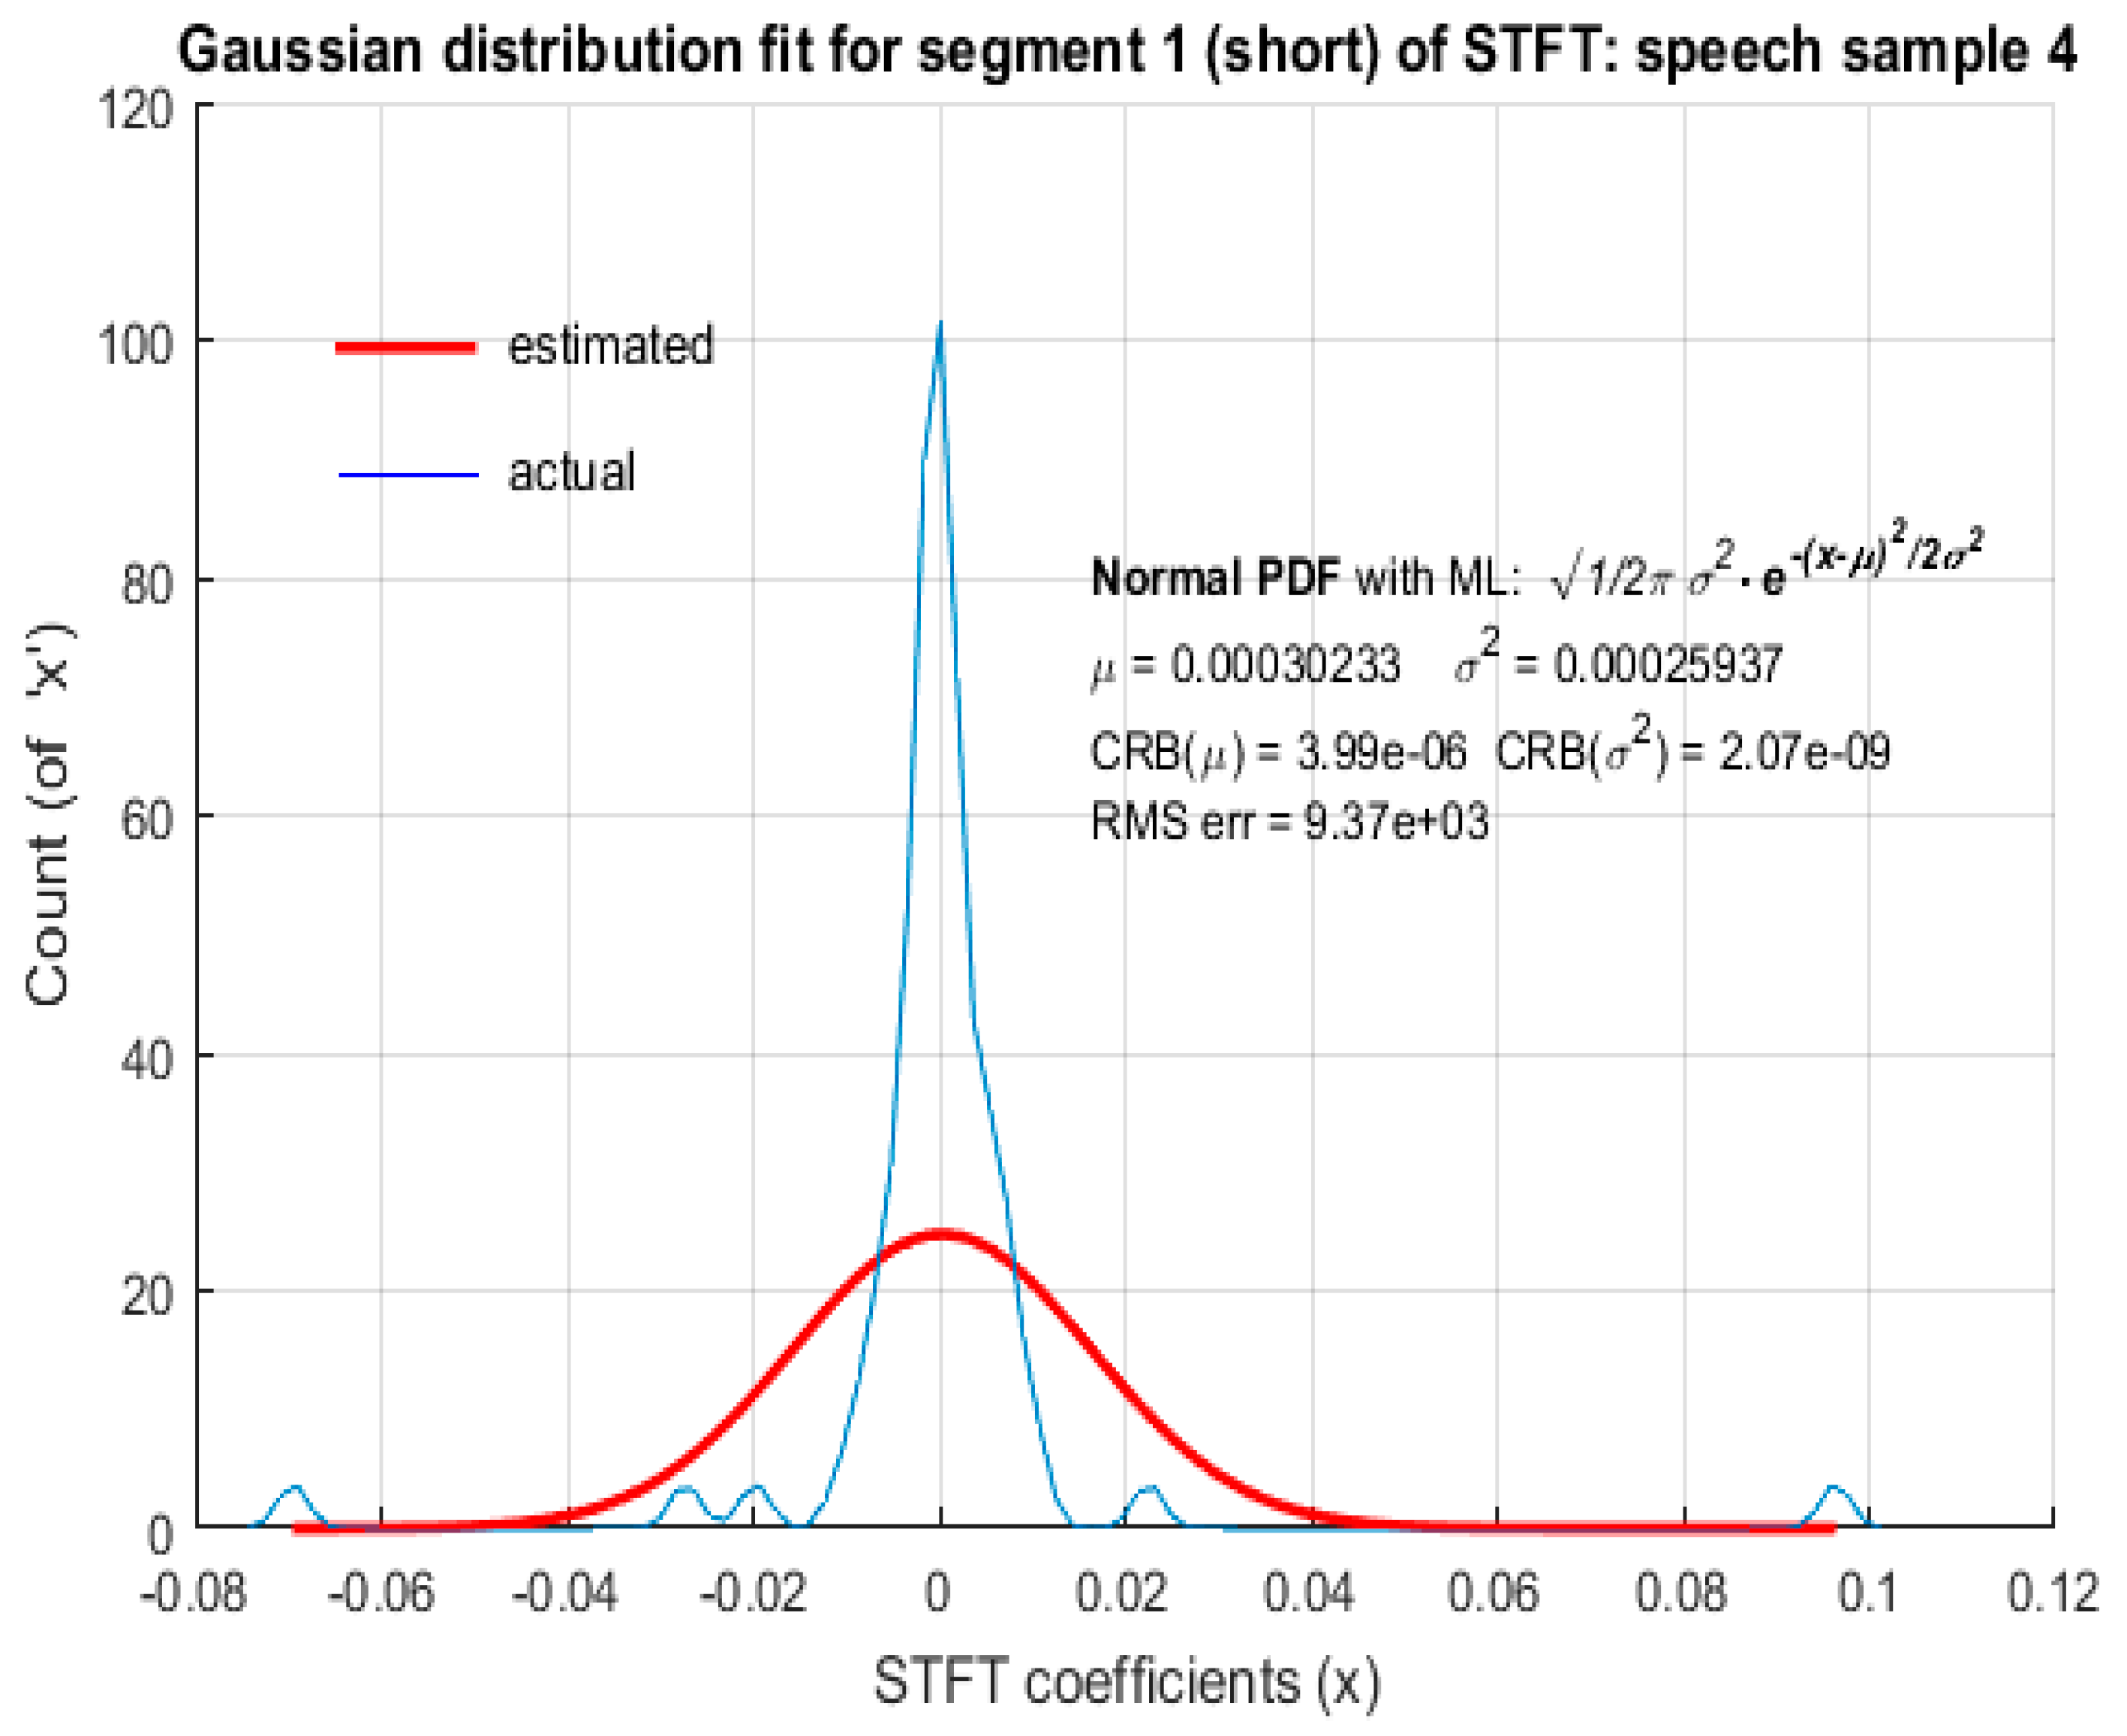
For a short segment length of 8 ms corresponding to low spectral resolution (125 Hz), neither LD nor GD provided an accurate model for the distribution of STFT coefficients of speech. The plots in Figure 10 and Figure 11 depict the fitted distributions corresponding to LD and the plots in Figure 12 and Figure 13 depict the fitted distributions corresponding to GD for STFT coefficients with low spectral resolution. It should be noted that the ordinates in Figure 10, Figure 11, Figure 12 and Figure 13 represent the actual count due to the short segment lengths, rather than the probabilities as in Figure 2, Figure 3, Figure 4, Figure 5, Figure 6, Figure 7, Figure 8 and Figure 9.The abscissa of all plots in Figure 2, Figure 3, Figure 4, Figure 5, Figure 6, Figure 7, Figure 8, Figure 9, Figure 10, Figure 11, Figure 12 and Figure 13 denotes the actual values (real/imaginary parts) of the STFT coefficients.
For low spectral resolution STFT coefficients of both male and female speech, LD and GD fitting based on MLE yielded a significantly large RMS error. The ML estimated value of the scale parameter of LD and corresponding scale parameter of GD was large in comparison to the actual scale parameters b and ′, respectively, resulting in the RMS error being too large. Hence, LD and GD cannot be considered as favorable probabilistic models to represent speech STFT coefficients with low spectral resolution. Further investigation is required to identify the probabilistic models that best represent short segments of speech as STFT coefficients.
In Figure 2, Figure 3, Figure 4 and Figure 5, both the RMS error and CRB values were small, indicating that LD was an appropriate fit and MLE was an efficient estimation algorithm. In Figure 6, Figure 7, Figure 8 and Figure 9, although the RMS error was small, the CRB values corresponding to the estimation of ‘’ was large. This indicates that the choice of distribution is appropriate, but the ML estimation did not yield accurate parameters to represent the distribution, based on the observed data. Hence, a different estimation algorithm needed to be chosen. Since the CRB values in Figure 10, Figure 11, Figure 12 and Figure 13 were small, it indicates that the ML estimation is an efficient algorithm to fit the model parameters. However, the large value of the RMS error indicates that the distributions hypothesized as potential fits i.e., LD and GD, are not suitable. These observations are summarized in Table 1. As CRB represents the lower bound on the estimation error of an estimation algorithm, a small value of CRB indicates the better efficiency of the estimation algorithm.
There are applications that require the appropriate probabilistic modeling of speech signals in spectral domain with high spectral resolution. STFT transforms signals from the time domain to frequency domain with the flexibility to control resolution depth. In order to find the best probabilistic model that represents speech STFT coefficients, it is important to hypothesize the correct distribution and to also choose an appropriate estimation algorithm. Speech STFT coefficients with high spectral resolution can be accurately represented as LD using MLE to estimate LD parameters. While GD makes a valid hypothesis, MLE does not accurately estimate the parameters of the fitted GD. It should still be noted that LD is a better fit than GD. For STFT coefficients with a low spectral resolution, both LD and GD are invalid hypotheses, even though MLE is an accurate estimation algorithm. It was therefore necessary to include other probability distributions in our hypothesis and also investigate alternative estimation algorithms to MLE in our pursuit to model speech by a representation that is relatively invariable, as needed by several applications. The work presented in this article used speech samples in English, spoken by healthy individuals in the age group of 20–40 years of Asian origin. Certain features of speech such as ‘pitch’, mel frequency cepstral coefficients (MFCC), and perceptual linear predictive (PLP) features depend on language, age, and race. For example, the variation of pitch for different languages for both male and female speakers of various ethnic origins is presented in [25], which concludes that certain languages are inherently high pitched while certain others are low pitched. While there is a variation of pitch between males and females, the amount of variation is different for different languages. It is also hypothesized that the nativity of the speaker also affects the pitch frequency. MFCC has been used in published literature for language identification [26,27]. In [28], both MFCC and PLP were used for language identification. Speech recognition for four different languages (German, Danish, Finnish, and Spanish) based on adapted versions of MFCC and PLP was discussed in [29] and MFCC was used for Arabic speech recognition in [30], indicating that MFCC and PLP features depend on language. MFCC was also used in [31,32] for age classification to classify speakers as adults or kids. In [33], statistical modeling of speech spectral coefficients was used to discriminate the speech of patients with Parkinson’s disease from that of healthy individuals. The effect of language, race, and age on the statistical distribution of speech STFT coefficients is not available in the literature and needs to be investigated.
5. Conclusions
Several probabilistic distributions have been proposed in the literature to model speech in different domains and with different segment lengths, typically below 200 ms. It is evident from the existing literature that different probabilistic models are applicable to speech under different conditions and each has utility in different applications. Some applications such as the design of digital hearing aids require the stable modeling of speech over longer durations due to the perceptual stability of human listening capability. In particular, it is required to find a probabilistic model for speech signals in the spectral domain with high spectral resolution. In this work, a probabilistic model for frequency domain representation of speech, where silence intervals were removed, was proposed. It was shown that STFT coefficients of speech segments greater than 500 ms, corresponding to a high spectral resolution, were accurately modeled by LD for which the distribution scale parameter wasobtained using MLE. Fitting a GD also yielded a small RMS error, but the MLE of variance of the fitted GD was much larger than the actual variance, leading to the conclusion that LD provides a better fit than GD to accurately model speech STFT coefficients with a high spectral resolution. In the case of STFT coefficients with low spectral resolution (short segments), neither LD nor GD provided an accurate representation as the RMS error was too large. These conclusions are valid for both the male and female speech samples as well as for both the real and imaginary parts of STFT coefficients. In order to find the best distribution, it is important to hypothesize the correct distribution and also use an appropriate estimation algorithm to estimate the distribution parameters. The conclusion that speech STFT coefficients with high spectral resolution are modeled by LD is useful in improving the design of digital hearing aids to make their performance stable and better under a wide range of ambient conditions as the inclusion of fine spectral details is necessary to improve their performance. Future work shall investigate more probabilistic distributions as well as other estimation algorithms to obtain the distribution and parameters that can provide accurate models for speech under different conditions. The presented results are for speech samples in English, spoken by individuals of Asian origin in the age group of 20–40 years. The effect of speaker language, speaker race, noise, and resolution of the transducer shall also be investigated in future.
Author Contributions
Conceptualization, M.U.; Data curation, S.J.; Formal analysis, M.U., M.Z., M.S. and P.R.; Funding acquisition, M.U. and M. Z.; Investigation, M.U.; Methodology, M.U. and M.Z.; Project administration, M.U. and M.Z.; Resources, S.J.; Software, M.U., M.S. and P.R.; Supervision, M.U.; Validation, M.U., M.Z., M.S., P.R. and S.J.; Writing—original draft, M.U.; Writing—review & editing, M.Z., M.S., P.R. and S.J.
Funding
This work was supported by the College of Engineering Scientific Research Center under the Deanship of Scientific Research of King Khalid University under Grant No. 364
Conflicts of Interest
The authors declare no conflict of interest.
References
- Gazor, S.; Zhang, W. Speech probability distribution. IEEE Signal Process. Lett. 2003, 10. [Google Scholar] [CrossRef]
- Rezayee, A.; Gazor, S. An adaptive KLT approach for speech enhancement. IEEE Trans. Speech Audio Process. 2001, 9, 87–95. [Google Scholar] [CrossRef]
- Backstrom, T. Estimation of the Probability Distribution of Spectral Fine Structure in the Speech Source. In Proceedings of the Interspeech: Annual Conference of the International Speech Communication Association, International Speech Communication Association, Stockholm, Sweden, 20–24 August 2017; pp. 344–348. [Google Scholar] [CrossRef]
- Backstrom, T. Speech Coding with Code-Excited Linear Prediction, 1st ed.; Springer: Cham, Switzerland, 2017. [Google Scholar] [CrossRef]
- Xavier, A.; Simon, B.; Nicholas, E.; Corinne, F.; Gerald, F.; Oriol, V. Speaker diarization: A review of recent research. IEEE Trans. Audio Speech Lang.Process. 2012, 20, 356–370. [Google Scholar] [CrossRef]
- Shin, J.W.; Chang, J.H.; Kim, N.S. Speech probability distribution based on generalized gamma distribution. In Proceedings of the 8th International Conference on Spoken Language Processing, Jeju Island, Korea, 4–8 October 2004. [Google Scholar]
- Shin, J.W.; Chang, J.H.; Kim, N.S. Statistical Modeling of speech signals based on generalized gamma distribution. IEEE Signal Process. Lett. 2005, 12, 258–261. [Google Scholar] [CrossRef]
- Richards, D. L. Statistical properties of speech signals. Proc. Inst. Elect. Eng. 1964, 111, 941–949. [Google Scholar] [CrossRef]
- Gazor, S.; Far, R.R. Probability distribution of speech signal spectral envelope. In Proceedings of the Canadian Conference on Electrical and Computer Engineering (CCECE) 2004, (IEEE Cat No. 04CH37513), Niagara Falls, ON, Canada, 2–5 May 2004; Volume 4, pp. 2267–2270. [Google Scholar] [CrossRef]
- Jensen, J.; Batina, I.; Hendriks, R.C.; Heusdens, R. A study of the distribution of time-domain speech samples and discrete Fourier coefficients. In Proceedings of the 1st BENELUX/DSP Valley Signal Processing Symposium, Antwerp, Belgium, 19–20 April 2005; pp. 155–158. [Google Scholar]
- Martin, R. Speech enhancement using MMSE short time spectral estimation with gamma distributed speech priors. In Proceedings of the 2002 IEEE International Conference on Acoustics, Speech, and Signal Processing, Orlando, FL, USA, 13–17 May 2002; pp. 253–256. [Google Scholar] [CrossRef]
- Martin, R.; Breithaupt, C. Speech enhancement in the DFT domain using Laplacian speech priors. In Proceedings of the International Workshop on Acoustics Echo and Noise Control (IWAENC), Kyoto, Japan, 8–11 September 2003; pp. 87–90. [Google Scholar]
- Zeng, F. G.; Rebscher, S.; Harrison, W.; Sun, X.; Feng, H. Cochlear implants: system design, integration, and evaluation. IEEE Rev. Biomed. Eng. 2008, 1, 115–142. [Google Scholar] [CrossRef] [PubMed]
- NIST/SEMATECH e-Handbook of Statistical Methods. Available online: http://www.itl.nist.gov/div898/handbook/ (accessed on 15 April2018).
- Norton, R.M. The Double Exponential Distribution: Using Calculus to Find a Maximum Likelihood Estimator. Am. Statist. 1984, 38, 135–136. [Google Scholar] [CrossRef]
- Ijyas, V.P.T.; Sameer, S.M. Cramér-Rao bound for joint estimation problems. Electron. Lett. 2013, 49, 427–428. [Google Scholar] [CrossRef]
- Hald, A. On the history of maximum likelihood in relation to inverse probability and least squares. Statist. Sci. 1999, 14, 214–222. [Google Scholar] [CrossRef]
- Partila, P.; Vozňák, M.; Mikulec, M.; Zdralek, J. Fundamental Frequency Extraction Method using Central Clipping and its Importance for the Classification of Emotional State. Advan. Electr. Electron. Eng. 2012, 10, 270–275. [Google Scholar] [CrossRef]
- Tan, Z.H.; Lindberg, B. Low-complexity variable frame rate analysis for speech recognition and voice activity detection. IEEE J. Sel. Top. Signal Process. 2010, 4, 798–807. [Google Scholar] [CrossRef]
- Fu, Q.J.; Shannon, R.V.; Wang, X. Effects of noise and spectral resolution on vowel and consonant recognition: Acoustic and electric hearing. J. Acoust. Soc. Am. 1998, 104, 3586. [Google Scholar] [CrossRef] [PubMed]
- Clarke, J.; Başkent, D.; Gaudrain, E. Pitch and spectral resolution: A systematic comparison of bottom-up cues for top-down repair of degraded speech. J. Acoust. Soc. Am. 2016, 139, 395–405. [Google Scholar] [CrossRef] [PubMed]
- Yoshizawa, T.; Hirobayashi, S.; Misawa, T. Noise reduction for periodic signals using high-resolution frequency analysis. EURASIP J. Audio Speech Music Process. 2011, 1. [Google Scholar] [CrossRef]
- Graf, S.; Zaidi, N.; Herbig, T.; Buck, M.; Schmidt, G. Detection of voiced speech and pitch estimation for application with low spectral resolution. In Proceedings of the DAGA 2017, Kiel, Germay, 6–9 March 2017. [Google Scholar]
- Greenberg, S.; Kingsbury, B.E.D. The modulation spectrogram: in pursuit of an invariant representation of speech. In Proceedings of the IEEE International Conference on Acoustics, Speech, and Signal Processing, Munich, Germany, 21–24 April 1997; pp. 1647–1650. [Google Scholar] [CrossRef]
- Bernhardsson, E. Language Pitch. Available online: https://erikbern.com/2017/02/01/language-pitch.html, 1-Feb-2017 (accessed on 7December 2018).
- Kooagudi, S.G.; Rastogi, D.; Rao, K.S. Identification of language using Mel Frequency Cepstral Coefficients (MFCC). Proceedia Eng. 2012, 38, 3391–3398. [Google Scholar] [CrossRef]
- Gunawan, T.S.; Husain, R.; Kartiwi, M. Development of language identification system using MFCC and vector quantization. In Proceedings of the IEEE 4th International Conference on Smart Instrumentation, Measurement and Application (ICSIMA), Putrajaya, Malaysia, 28–30 November 2017. [Google Scholar]
- Yin, B.; Ambikairajah, E.; Chen, F. Combining Cepstral and Prosodic features in language identification. In Proceedings of the 18th International Conference on Pattern Recognition (ICPR’06), Hong Kong, China, 20–24 August 2006. [Google Scholar]
- Holberg, M.; Gelbart, D.; Hemmert, W. Automatic speech recognition with an adaptation model motivated by auditory processing. IEEE Trans. Audio Speech Lang. Process. 2006, 14, 43–49. [Google Scholar] [CrossRef]
- Alsulaiman, M.; Muhammad, G.; Ali, Z. Comparison of voice features for Arabic speech recognition. In Proceedings of the Sixth International Conference on Digital Information Management, Melbourne, Australia, 26–28 September 2011. [Google Scholar]
- Naini, A.S.; Homayounpour, M.M. Speaker age interval and sex identification based on jitters, shimmers and mean mfcc using supervised and unsupervised discriminative classification methods. In Proceedings of the 8th International conference on signal processing, Beijing, China, 16–20 November2006. [Google Scholar]
- Katrenchuk, D. Age group classification with speech and metadata multimodality fusion. In Proceedings of the 15th Conference of the European Chapter of the Association for Computational Linguistics, Valencia, Spain, 3–7 April 2017; Volume 2, pp. 188–193. [Google Scholar]
- Kodrasi, I.; Bourlard, H. Statistical modeling of speech spectral coefficients in patients with Parkinson’s disease. In Proceedings of the ITG Conference on Speech Communication, Oldenburg, Germany, 10–12 October 2018. [Google Scholar]
Figure 1.
Magnitude and phase response of the direct current (DC) removal filter.

Figure 2.
LD fit for STFT coefficients with a high spectral resolution: female speech sample.

Figure 3.
LD fit for STFT coefficients with a high spectral resolution: male speech sample.

Figure 4.
LD fit for STFT coefficients with a high spectral resolution: real part of STFT coefficients.
Figure 4.
LD fit for STFT coefficients with a high spectral resolution: real part of STFT coefficients.

Figure 5.
LD fit for STFT coefficients with a high spectral resolution: imaginary part of STFT coefficients.
Figure 5.
LD fit for STFT coefficients with a high spectral resolution: imaginary part of STFT coefficients.

Figure 6.
GD fit for STFT coefficients with a high spectral resolution: female speech sample.

Figure 7.
GD fit for STFT coefficients with a high spectral resolution: male speech sample.

Figure 8.
GD fit for STFT coefficients with a high spectral resolution: real part of STFT coefficients.
Figure 8.
GD fit for STFT coefficients with a high spectral resolution: real part of STFT coefficients.

Figure 9.
GD fit for STFT coefficients with a high spectral resolution: imaginary part of STFT coefficients.
Figure 9.
GD fit for STFT coefficients with a high spectral resolution: imaginary part of STFT coefficients.

Figure 10.
LD fit for STFT coefficients with a low spectral resolution:male speech sample.

Figure 11.
LD fit for STFT coefficients with a low spectral resolution: female speech sample.

Figure 12.
GD fit for STFT coefficients with a low spectral resolution: female speech sample.

Figure 13.
GD fit for STFT coefficients with a low spectral resolution: male speech sample.


Table 1.
Observation on the validity of the hypothesized distribution and efficiency of MLE.
| RMS Error | CRB | Hypothesized Distribution (s) | Validity of Distribution | Efficiency of MLE |
|---|---|---|---|---|
| Small | Small | LD | Valid | Efficient |
| Small | Large | GD | Valid | Inefficient |
| Large | Small | LD and GD | Invalid | Efficient |
© 2018 by the authors. Licensee MDPI, Basel, Switzerland. This article is an open access article distributed under the terms and conditions of the Creative Commons Attribution (CC BY) license (http://creativecommons.org/licenses/by/4.0/).
Share and Cite
MDPI and ACS Style
Usman, M.; Zubair, M.; Shiblee, M.; Rodrigues, P.; Jaffar, S. Probabilistic Modeling of Speech in Spectral Domain using Maximum Likelihood Estimation. Symmetry 2018, 10, 750. https://0-doi-org.brum.beds.ac.uk/10.3390/sym10120750
AMA Style
Usman M, Zubair M, Shiblee M, Rodrigues P, Jaffar S. Probabilistic Modeling of Speech in Spectral Domain using Maximum Likelihood Estimation. Symmetry. 2018; 10(12):750. https://0-doi-org.brum.beds.ac.uk/10.3390/sym10120750
Chicago/Turabian StyleUsman, Mohammed, Mohammed Zubair, Mohammad Shiblee, Paul Rodrigues, and Syed Jaffar. 2018. "Probabilistic Modeling of Speech in Spectral Domain using Maximum Likelihood Estimation" Symmetry 10, no. 12: 750. https://0-doi-org.brum.beds.ac.uk/10.3390/sym10120750
Note that from the first issue of 2016, this journal uses article numbers instead of page numbers. See further details here.