1. Introduction
Short implants (SI), defined in recent years as implants of less than 10 mm in length [
1], seem to have some advantages in certain clinical situations, such as atrophy of the alveolar processes, poor bone quality, and pneumatization of the maxillary sinus [
2]. SI are less invasive, simpler to use in the hands of the average clinician, and their surgery is shorter, with a lower morbidity, lower costs and lesser biological complications [
1,
3,
4,
5,
6,
7]. More recently, Ultrashort or Extra-short (<6 mm) implants have been proposed [
8,
9,
10,
11]. Alternatives to the use of SI are sinus augmentation procedures, the use of zygomatic implants, guided bone regeneration procedures, onlay grafts, inlay grafts, distraction osteogenesis, and lateralization of the inferior alveolar nerve [
4,
12]. Several recent systematic reviews, some of them with a metanalysis of the data, have shown:
no differences in the in the survival rate between SI and standard length implants (ST);
no differences in marginal bone loss (MBL);
lower biological complications in SI;
good primary stability in SI;
Primary dental implant stability (PS), i.e., an absence of micromotion of the implant immediately after implant placement, has been reported to have an important role in implant osseointegration [
17,
18,
19]. PS seemed to be closely correlated to bone quality and quantity, implant macrostructure, implant length and diameter, surgical technique, and the fitting of the implant into the site [
17,
18,
19,
20,
21]. Bone density has been correlated to the amount of bone-to-implant contact (BIC) [
19], and BIC to the PS [
17]. Bone density has been measured with the use of different techniques: insertion torque (IT), removal torque (RT), and resonance frequency analysis (RFA), producing a value giving the implant stability quotient (ISQ) [
22]. Polyurethane foam has been recognized as a standard material for testing instruments by the American Society for Testing and Materials (ASTM F-1839-08) (“Standard specification for Rigid Polyurethane Foam for Use as a Standard Material for Test Orthopaedic Devices for Instruments”). Polyurethane foam has been widely used as an alternative material in biomechanical tests evaluating, for example, dental implants. It presents consistent mechanical characteristics, has features similar to bone tissue, is very reliable and easy to use, requiring no special handling, and is characterized by linearly elastic and constitutive isotropic symmetry [
22,
23,
24].
The scope of the present pilot study was to evaluate the insertion torque, pull-out torque and ISQ of SI and ST implants, positioned into polyurethane foam blocks.
2. Materials and Methods
2.1. Dental Implants
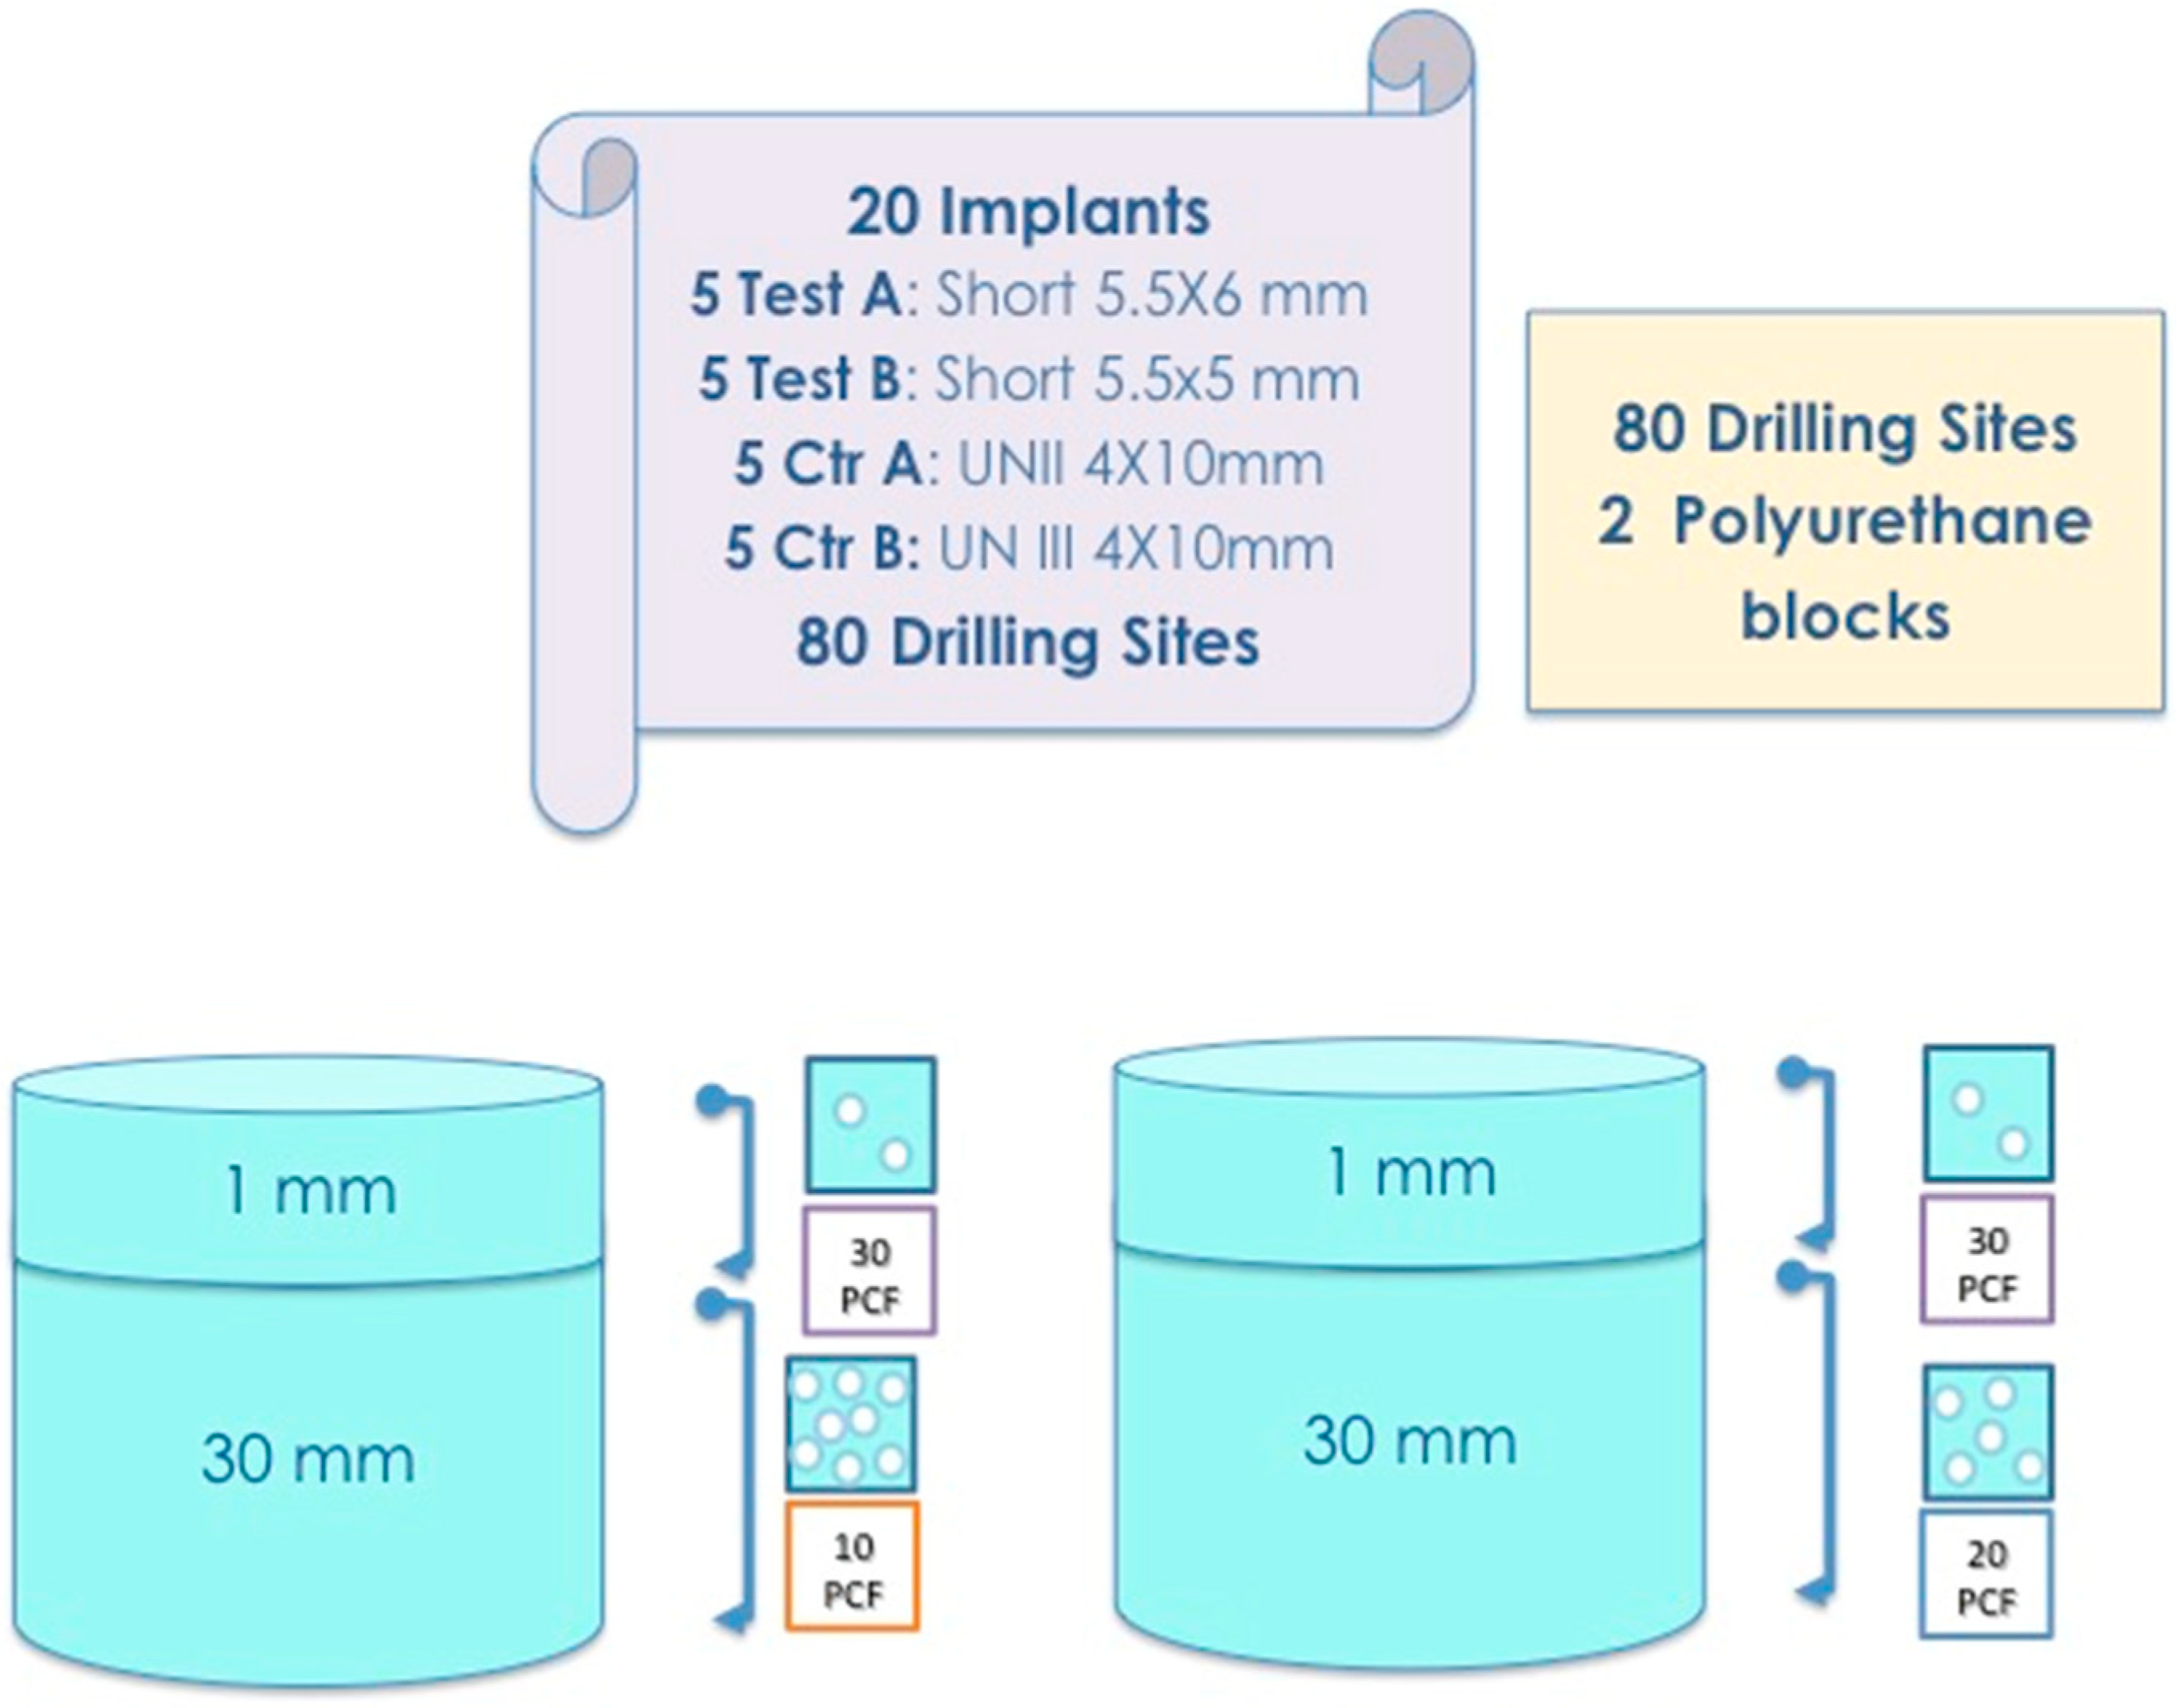
The short dental titanium implants with a Cone Morse connection and a conical shape (Implacil De Bortoli, Sao Paulo, Brasil) (Test Implants: Test Implant A—diameter 5.5 mm and length 6 mm) (Test Implant B—diameter 5.5 mm and length 5 mm) were used for the in vitro experimental study. Universal II (UN II) implants (4 mm diameter and 10 mm length), with a Cone Morse connection and a conical shape (Implacil De Bortoli, Sao Paulo, Brasil), were used as Control Implant A, and Universal III (UN III) implants, also with a Cone Morse connection and a conical shape (Implacil De Bortoli, Sao Paulo, Brasil), were used as Control Implants B. These two latter implants differed in their macro design. The UN III macro design differed from the UN II implants regarding its larger thread, the lack of double thread pitch, having a round apex not self-tapping, and in the chambers’ patterns between the cutting surface of the threads.
2.2. Study Design
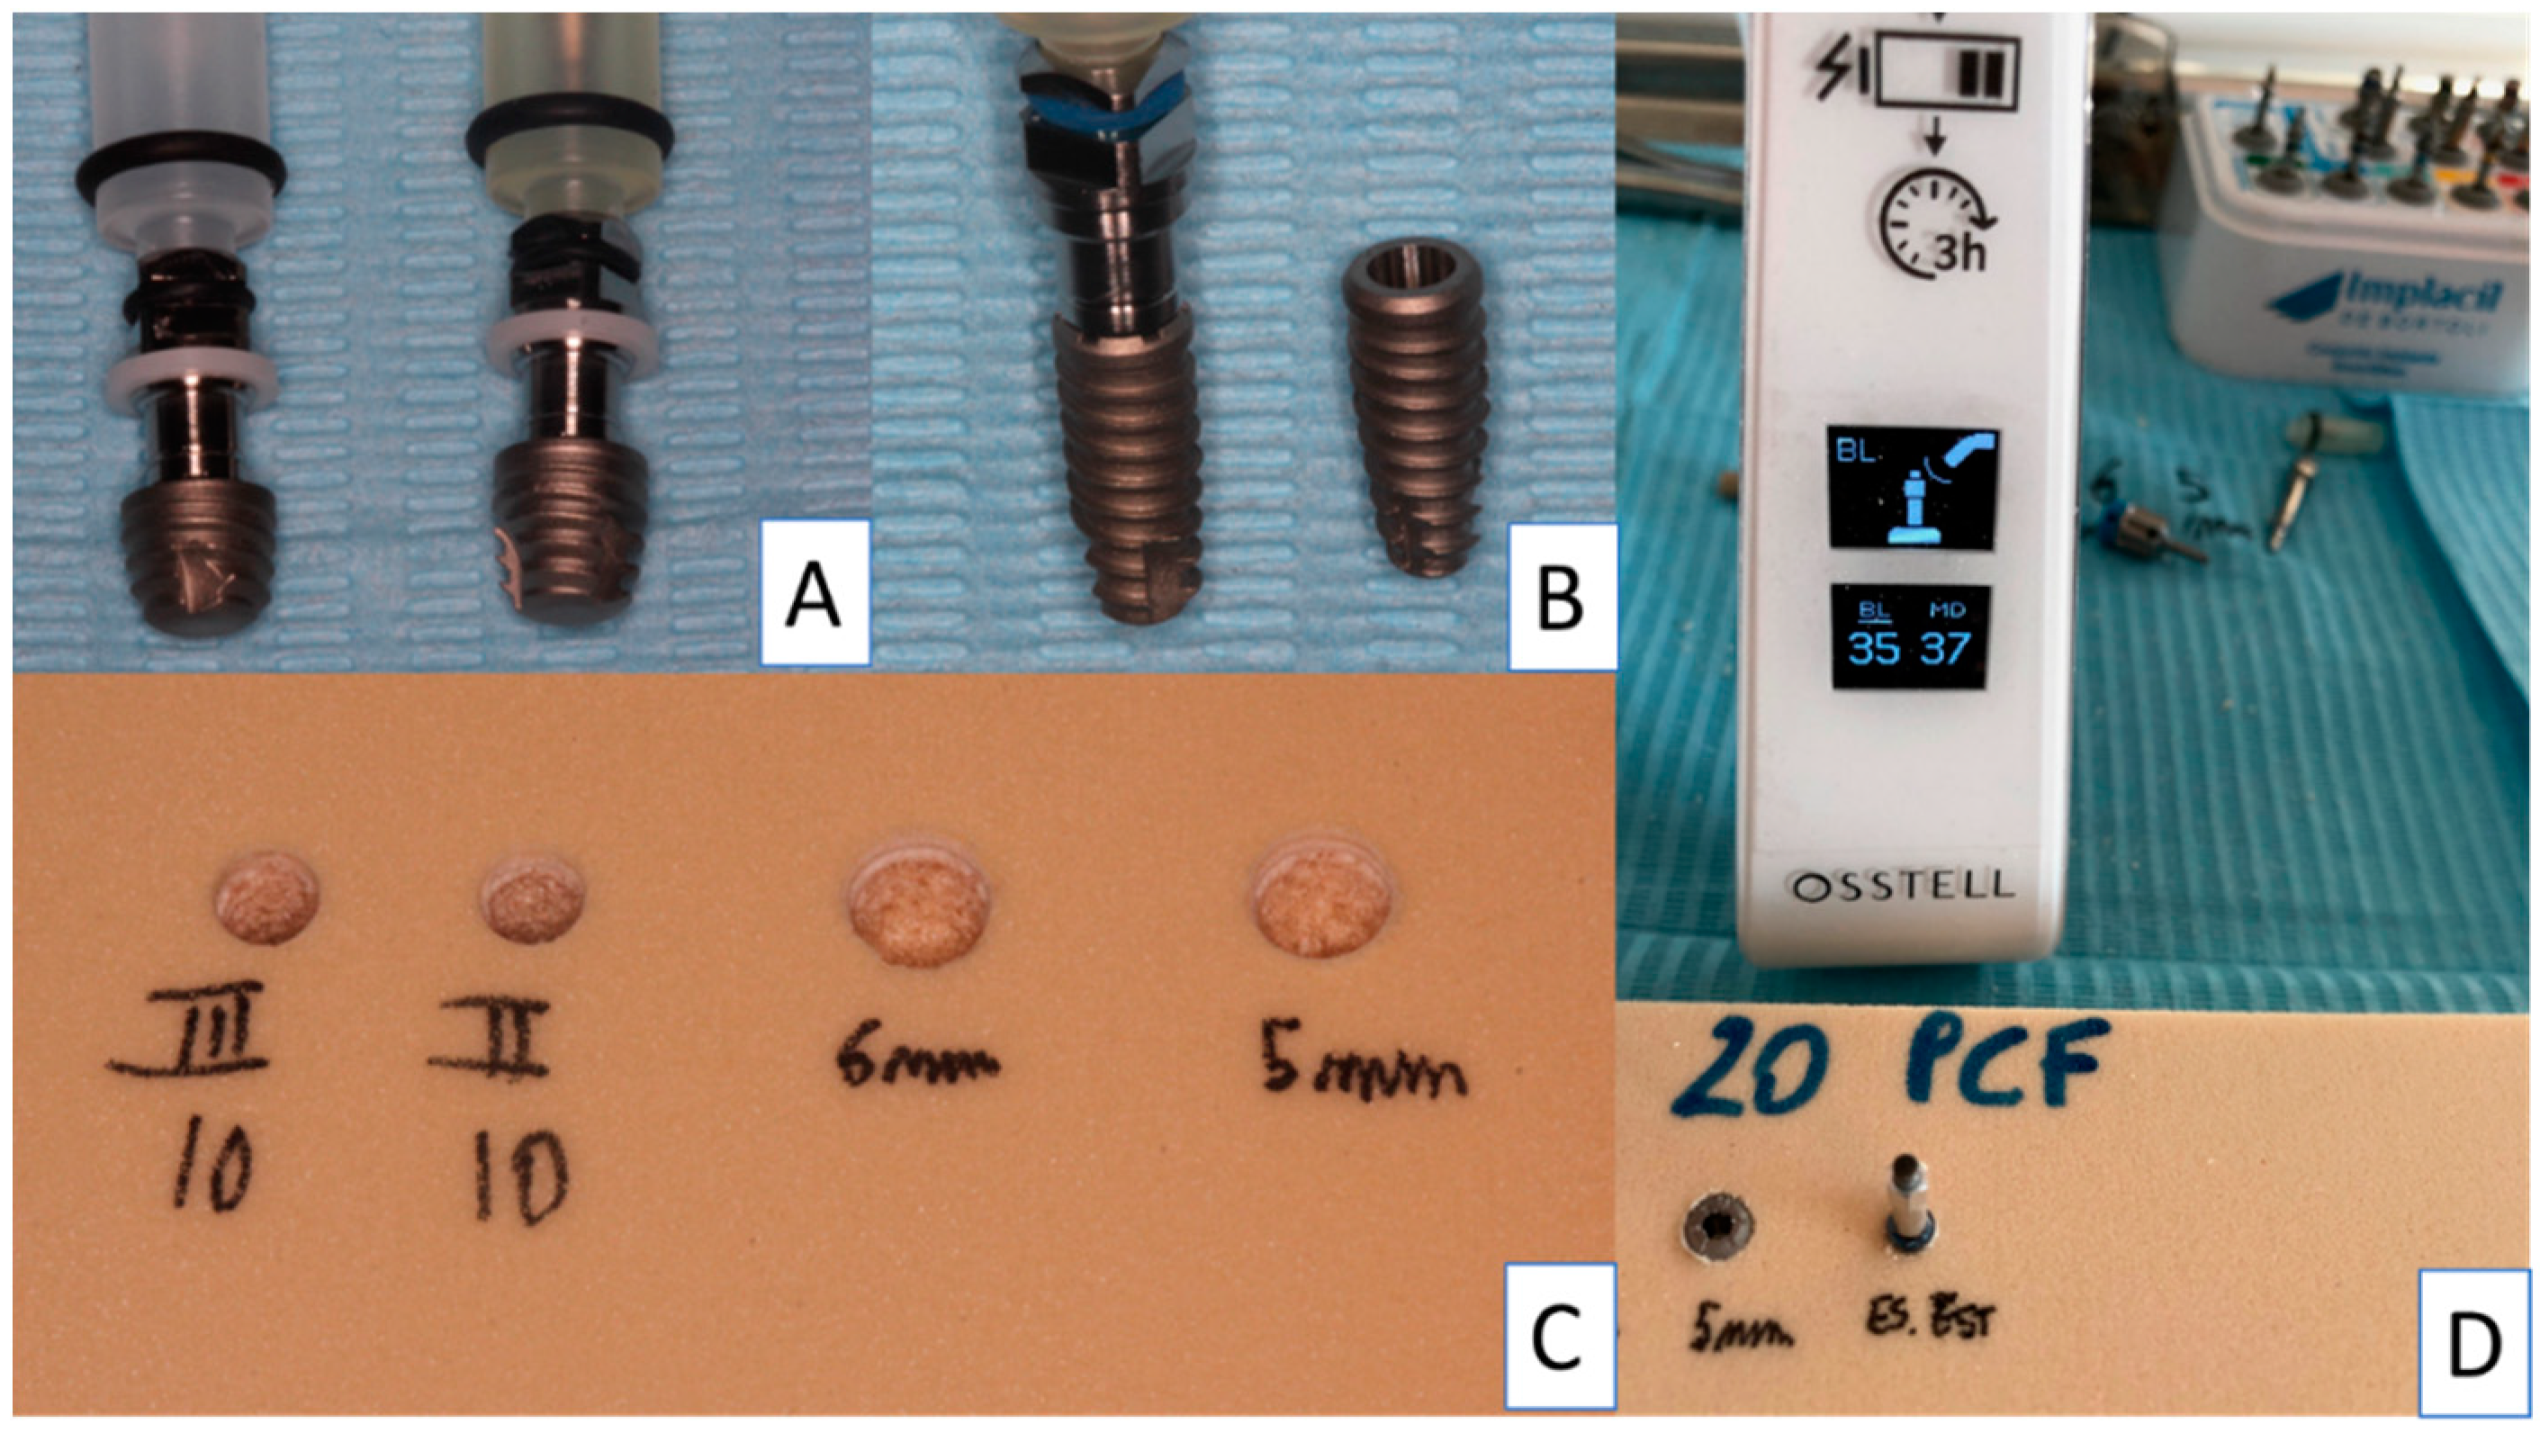
A total of 20 implants (5 Test A, 5 Test B, 5 Control A and 5 Control B) were used in the present investigation. The control implants were inserted following the protocol of the manufacturer: implant lance drill, 2 mm drill (1200 rpm) and 3.5 mm final drill (800 rpm) (
Figure 1 and
Figure 2). The test implants were inserted following the protocol of the manufacturer: implant lance drill, 2 mm drill (1200 rpm), 3.5 mm conical drill for SI and 4.5 mm final conical drill for SI (800 rpm).
The insertion of the implants was made by the handpiece calibrated to 20 rpm speed and a torque of 30 Ncm. The torque peaks were recorded by the software package (ImpDat Plus, East Lansing, Michigan) installed on a digital card. The insertion torque (IT, Ncm) peaks indicated the force of the maximum clockwise movement of the dental fixture positioned into the material. The research was performed by a single operator (LC), recording the fixture insertion and the pull-out torque peaks of the Test A, Test B, Control A and Control B Implants positioned into polyurethane foam blocks in different sizes and densities.
Different types of solid rigid polyurethane foam (SawBones H, Pacific Research Laboratories Inc, Vashon, Washington, USA) with homogeneous densities were selected for the present investigation. The polyurethane foam blocks presented a size of “120 mm × 70 mm × 31 mm”.
The block densities of polyurethane samples used in the present investigation were: 16.01 kgm3 (10 PCF), similar to D3 bone quality, 32.02 kgm3 (20 PCF), corresponding with and similar to D2 bone; moreover, a 1 mm sheet of polyurethane with a 48.03 kgm3 (30 PCF) density, similar to D1 bone, was present to simulate a layer of cortical bone. Ten implant site perforations were performed for each type of implant (Test A, Test B, Control A and Control B) for both polyurethane densities (14.88–29.76 kgm3), for a total of 80 implant site preparations.
2.3. Implant Drill
Test A and Test B implants were inserted following a suggested drill protocol using a lance drill, then a 2 mm bur at 1200 rpm, then a 3.5 mm conical bur, and subsequently a 4.5 mm conical bur (both at 300 rpm) with the implant insertion at 20 Rpm. Control A and Control B Implants were inserted using a surgical lance drill, then a 2 mm bur, and subsequently a conical 3.5 mm bur at 800 Rpm with the implant insertion at 20 rpm.
2.4. Insertion Torque and Pull-Out Torque
The comparative research evaluating the insertion torque and pull-out peaks was conducted using a calibrated torque ratchet (Implacil De Bortoli, Sao Paulo, Brasil) provided by a torque range of 5–80 N/cm. The final 1 mm insertion torque of the implants into the polyurethane blocks was evaluated using a calibrated torque ratchet (Implacil De Bortoli, Sao Paulo, Brasil). In the present investigation, the mechanical torque gauges were used to assess the insertion torque and the pull-out strength values.
2.5. Resonance Frequency Evaluation
After the fixture positioning, the primary stability was evaluated using Resonance Frequency analysis (RFA) values expressed in the implant stability quotient (ISQ) by a hand-screwed Smart-Pegs type 7 for test implants (Osstell Mentor Device, Integration Diagnostic AB, Savadelen, Sweden) (
Figure 2). The ISQ values ranged from 0 to 100 (measured by a frequency in the range 3500–85,000 Hz), and was classified into Low (less than 60 ISQ), Medium (in the range 60–70 ISQ), and High stability rate (more than 70 ISQ) [
25]. Moreover, RFA evaluation was repeated twice for each sample evaluated. The RFA evaluation was performed following two different orientations separated by a 90-degree angle, and the mean ISQ peaks were calculated.
2.6. Statistical Analysis
The Shapiro–Wilks test was performed to evaluate data normality. Moreover, the differences between the peaks of insertion torque, pull-out strength and the RFA of the study groups were evaluated using a two-way analysis of variance (ANOVA), followed by the Tukey post-hoc test. A p-value < 0.05 was considered statistically significant. The research data and the statistical analysis were performed using the software package Excel (Microsoft Office, Redmond, USA) and GraphPad 6 (Prism, San Diego, USA).
3. Results
The results are similar when comparing the Test A and Test B implants. The test implants had very good stability in polyurethane 14.88–29.76 kgm
3 density blocks (
Figure 3 and
Figure 4).
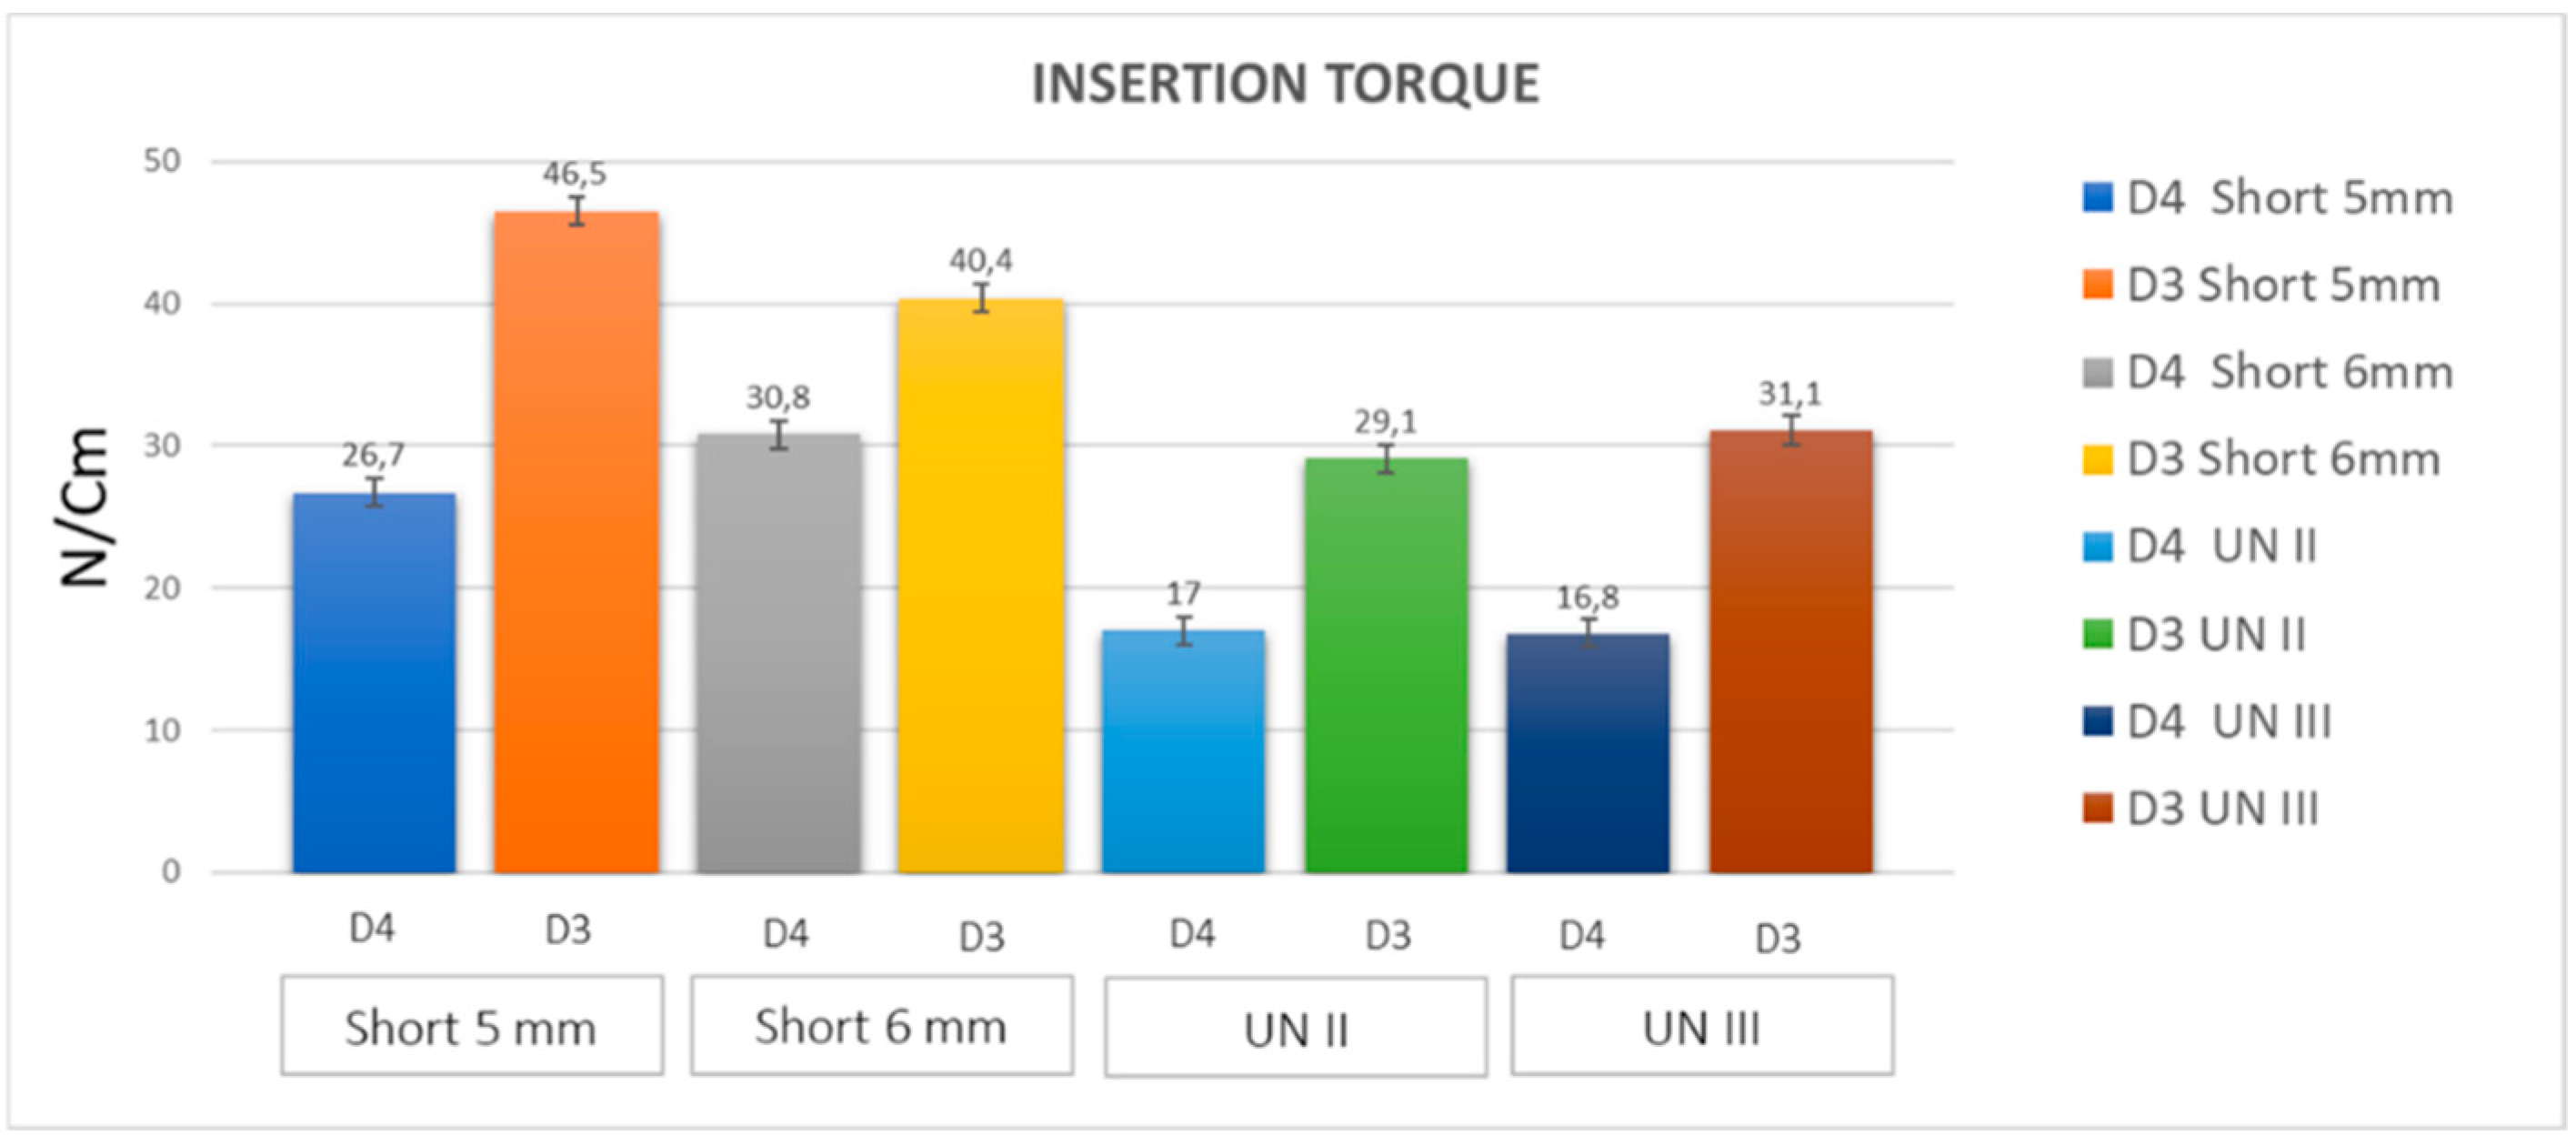
The insertion torque values were very high for both types of test implant (25–32 Ncm on 14.88 kgm
3 blocks, and up to 45 Ncm in 29.76 kgm
3 blocks) (
Figure 3;
Table 1 and
Table 2).
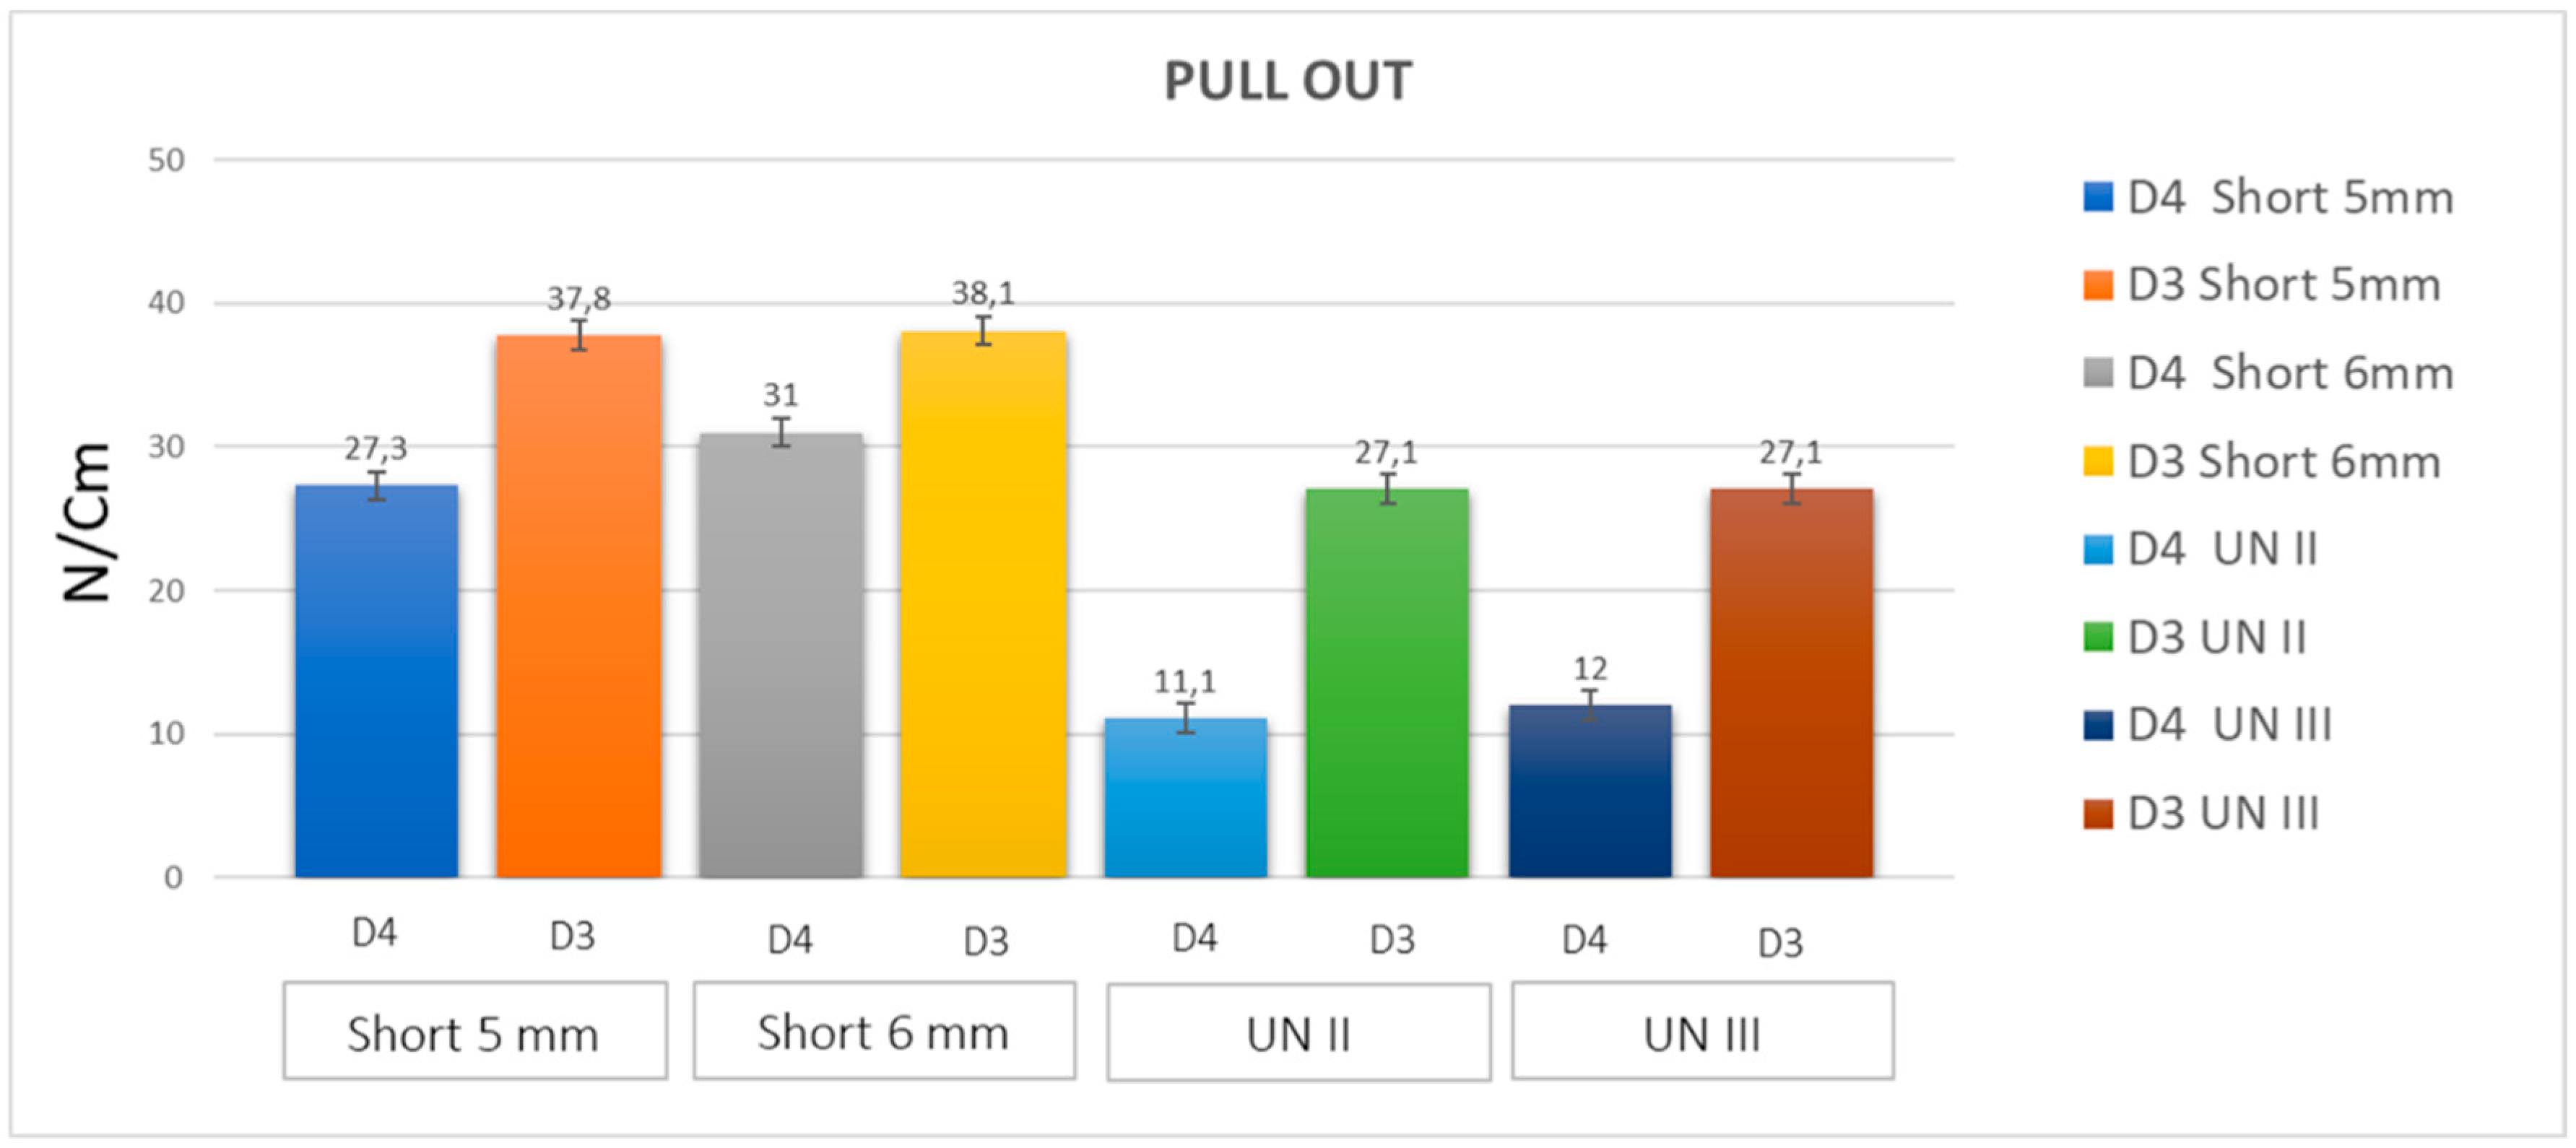
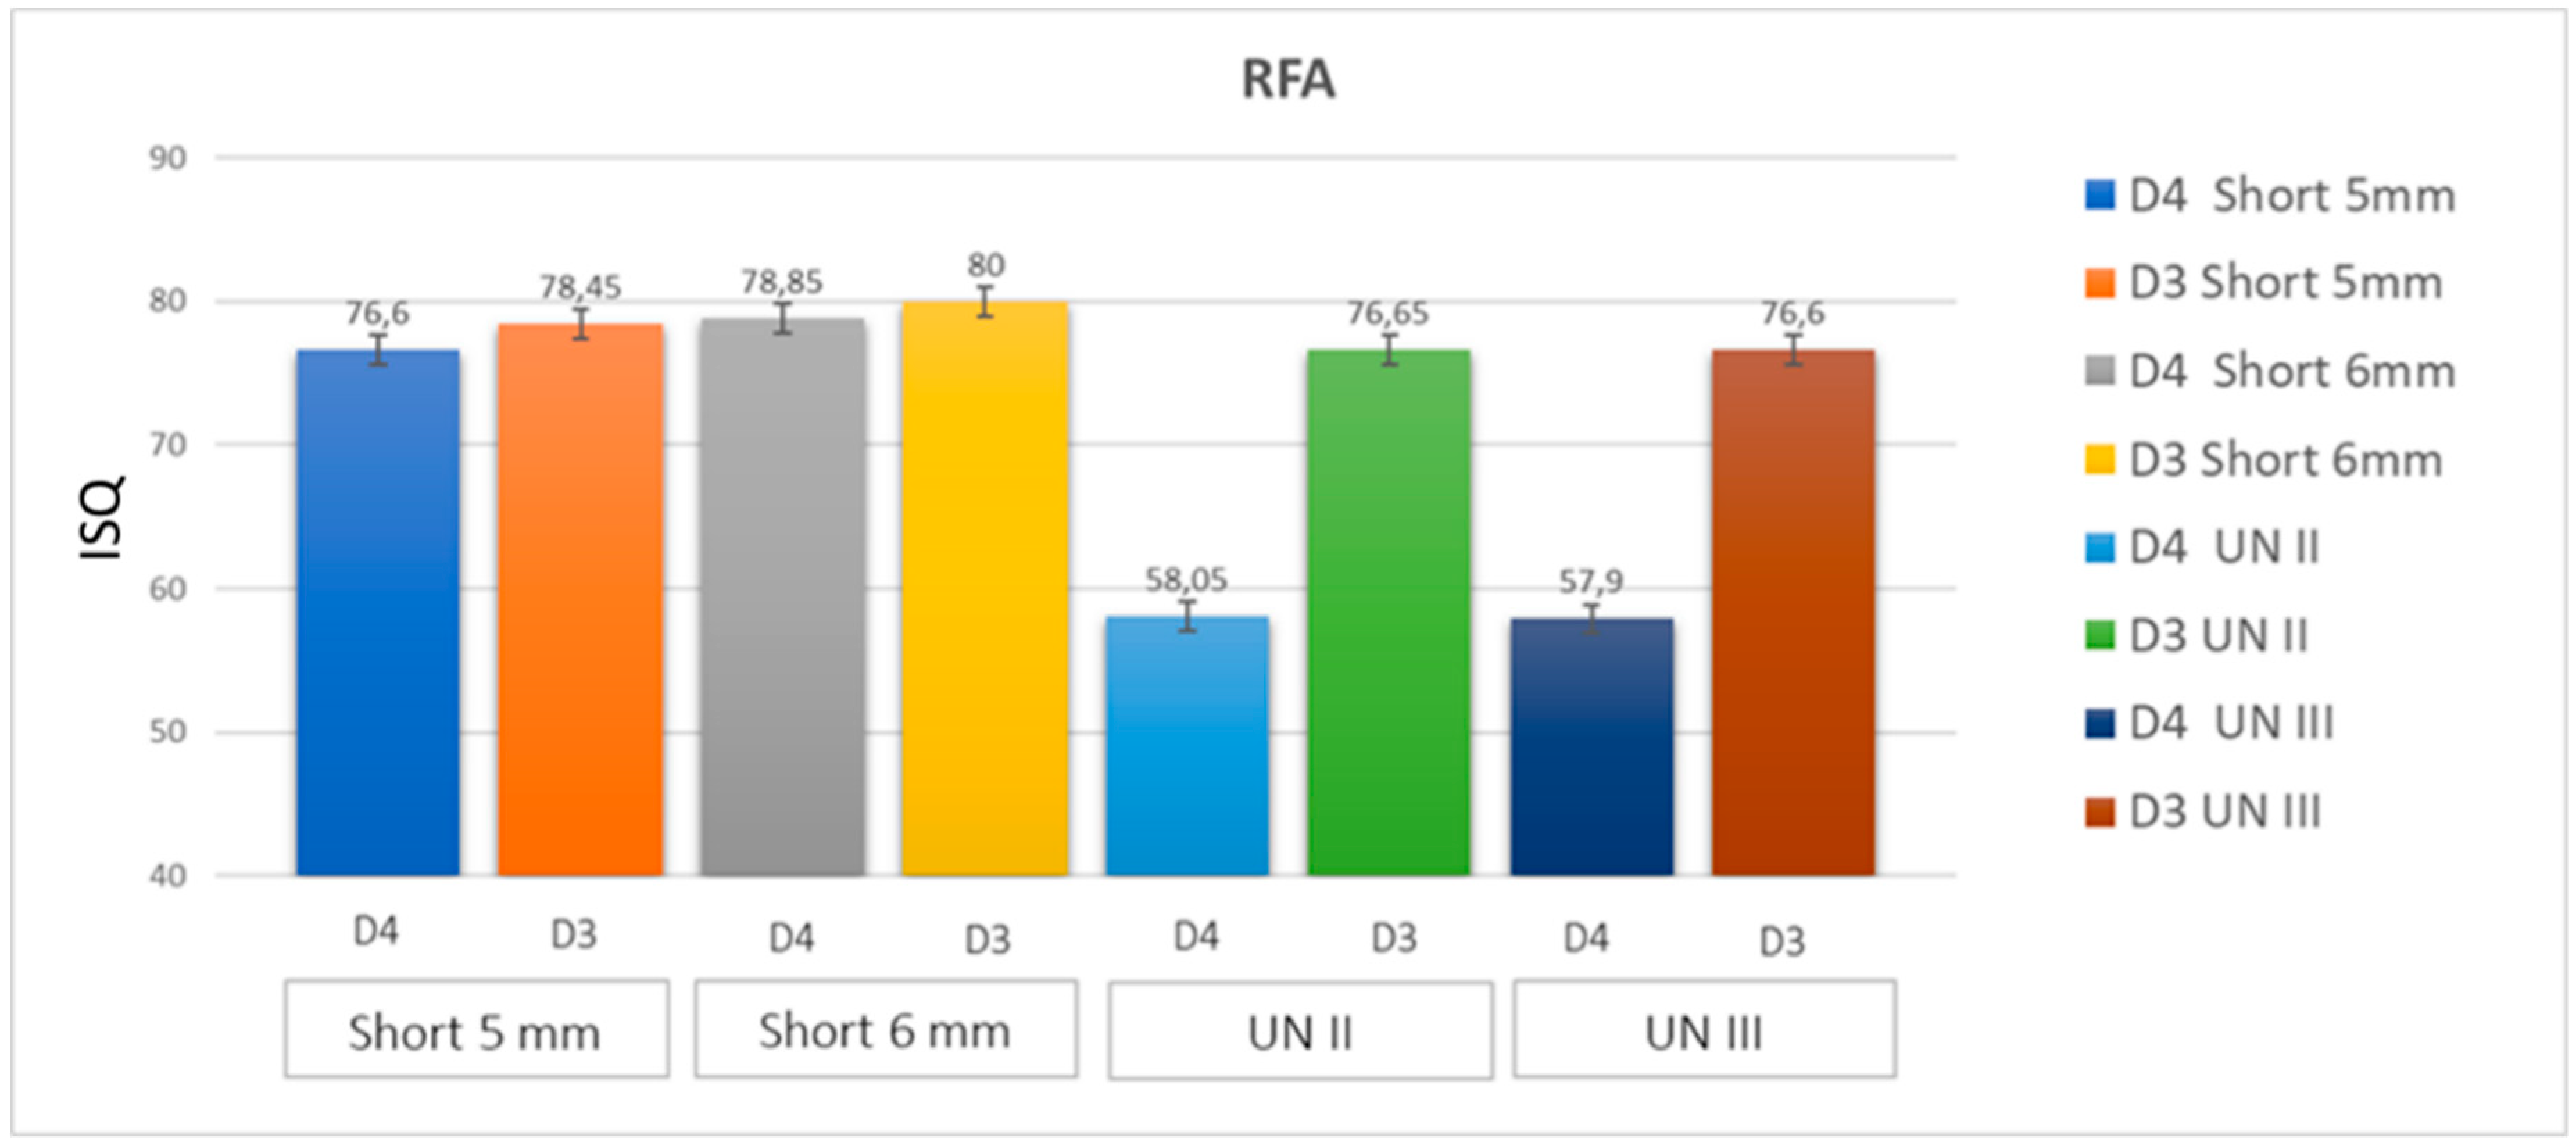
The pull-out test values were very similar to the insertion torque values (
Figure 4). The ISQ values were significantly high with 75–80 in 14.88 kgm
3 blocks, and 78–83 in 29.76 kgm
3 blocks (
Table 3 and
Table 4).
The clinical sensation of the very good stability of the implant was felt at the initial insertion into the polyurethane blocks. No differences were found in the values of the Control A and Control B implants (
Table 1,
Table 2,
Table 3 and
Table 4). In both these implants, the insertion torque was quite low in the 14.88 kgm
3 blocks (16–28 Ncm) (
Table 1 and
Table 2). Better results were found in the 29.76 kgm
3 blocks, with significantly good stability of the implants. The pull-out values for these control implants were slightly lower than the insertion torque values. High ISQ values were found in both control implants (57–80) (
Figure 5;
Table 5 and
Table 6).
4. Discussion
The atrophy of the posterior regions of the jaws with reduced bone quality and quantity could limit the use of standard length implants (≥10 mm), without doing an invasive sinus grafting procedure. Recently, it has been reported in a few systematic reviews with meta-analysis that, in these cases, short implants could be a suitable alternative [
2,
3,
4,
5,
6,
7,
8,
12,
13]. These reviews have reported, for short implants, survival rates similar to those of standard length implants and the capability to osseointegrate and to bear a functional load [
8]. In recent years, a reduction in the implant length of short implants has been reported in the literature [
1,
7,
8,
12]. Polyurethane foam could be an alternative useful material to provide biomechanical tests substituting, for example, animal bone. (“Standard specification for Rigid Polyurethane Foam for Use as a Standard Material for Test Orthopaedic Devices for Instruments”). Polyurethane presents a cellular structure with constant mechanical characteristics, and similar properties to bone. In the present study, very good stability was obtained for both test and control implants. In the test implants, insertion torque, pull-out torque and ISQ values were all very high, showing the very good stability of both types of SI. Also, all the values for the ST implants were quite high, with better results, and then better stability, in higher density polyurethane blocks. The density of polyurethane blocks is similar to the structure of the bone in the posterior regions in humans. The conical shape of all these implants was probably instrumental in achieving such good levels of stability.
The main reason for measuring the implant primary stability concerns the ability to predict the prognosis of the dental implant procedure. Comuzzi et al., in vitro, reported that in polyurethane foam, ISQ, insertion torque, and pull-out measuring provide the high repeatability and reproducibility that represent suitable indicators for implant stability [
26]. In the present investigation, the implant primary stability was evaluated in a controlled reproducible study design and without the variables correlated to the use of animal bone.
The study effectiveness showed that the types of polyurethane used in the present in vitro study were shown to be constituted by a homogenous material.
Moreover, implants with a conical shape have a high stability even in blocks with a low density (D4 Density) and no differences were found between 5 mm and 6 mm long implants, where reasonable values of insertion torque and pull-out tests were found in short implants in both polyurethane densities. Comuzzi et al. reported in vitro that a conical shape, rather than a cylindrical design, provided increased values of insertion torque and pull-out strength [
26]. Thus, the ISQ values of both short implants were great, with an increased clinical sensation of the high stability of the implants.
The posterior maxilla is an anatomical region often characterized by poor bone quality and quantity. Thus, the 5 mm short implant could probably be more useful for insertion in this area in cases of reduced bone volume and density.
In fact, the choice of a short implant is clinically indicated as an alternative to more invasive regenerative procedures in cases of bone atrophy of the posterior ridge’s regions [
3].
The standard length implants had slightly lower values of insertion torque and pull-out torque, and very high ISQ values, where the conometric connection of all the types of implants seemed to also resist quite well to very high torque values (up to 60–80 Ncm).


