Race Walking Ground Reaction Forces at Increasing Speeds: A Comparison with Walking and Running


1
Laboratory of Physiomechanics of Locomotion, Department of Pathophysiology and Transplantation, University of Milan, Via Mangiagalli 32, I-20133 Milan, Italy
2
Department for Health, University of Bath, Bath BA2 7AY, UK
3
Department of Biomedical Sciences for Health, University of Milan, Milano, Via G. Colombo 71, I-20133 Milan, Italy
*
Author to whom correspondence should be addressed.
Symmetry 2019, 11(7), 873; https://0-doi-org.brum.beds.ac.uk/10.3390/sym11070873
Submission received: 10 June 2019
/
Revised: 24 June 2019
/
Accepted: 1 July 2019
/
Published: 3 July 2019
(This article belongs to the Special Issue Biomechanics Energetics of Natural Assisted Human Comparative Movement Locomotion)
Abstract
:Race walking has been theoretically described as a walking gait in which no flight time is allowed and high travelling speed, comparable to running (3.6–4.2 m s−1), is achieved. The aim of this study was to mechanically understand such a “hybrid gait” by analysing the ground reaction forces (GRFs) generated in a wide range of race walking speeds, while comparing them to running and walking. Fifteen athletes race-walked on an instrumented walkway (4 m) and three-dimensional GRFs were recorded at 1000 Hz. Subjects were asked to performed three self-selected speeds corresponding to a low, medium and high speed. Peak forces increased with speeds and medio-lateral and braking peaks were higher than in walking and running, whereas the vertical peaks were higher than walking but lower than running. Vertical GRF traces showed two characteristic patterns: one resembling the “M-shape” of walking and the second characterised by a first peak and a subsequent plateau. These different patterns were not related to the athletes’ performance level. The analysis of the body centre of mass trajectory, which reaches its vertical minimum at mid-stance, showed that race walking should be considered a bouncing gait regardless of the presence or absence of a flight phase.
1. Introduction
Ground reaction forces (GRFs) have often been used in biomechanical studies to describe human locomotion [1,2] because they show that the forces exerted by the foot on the ground are a key determinant of the final gait kinematics. Ground reaction force analysis is nowadays used also for the detection of pathological gaits [3,4], gait asymmetry [5,6], injury prevention [7] and in the estimation of muscles force [8]. Moreover, the analysis of GRF peaks and the timing of peaks occurrence can explain how velocity is generated and increased, which could be important in sport activity such as running (e.g., [9]).
Ground reaction forces double integration is also used to compute body centre of mass (BCoM) trajectory and describe locomotion mechanics [10]. In race walking, the BCoM trajectory can be correctly computed only by using a forward dynamics approach, whereas inverse dynamics computation has been shown to be biased [11]. Thus, the measurement and analysis of GRFs at increasing speed is key to investigating race walking mechanics, even more than in walking and running. Each animal or human gait has its own “locomotor signature”, ultimately represented by the trajectory of the body centre of mass (BCoM), with its asymmetry and related energies [12], and race-walking trajectory has never been analysed in such a fashion due to the lack of consistent GRF datasets. Starting from the ground reaction forces recorded during a stride, it is also possible to represent the “locomotor signature” by showing the Lissajous contour [12] also for race walking gait.
Race walking is an Olympic discipline where athletes are required to complete the distance in the shortest time according to two constrains: no flight time can occur between steps and the knee has to be locked in extension from touch down to mid-stance. This rule induces race walking to manage a different kinematics compared with walking and running that causes, also, somewhat different ground reaction forces patterns [13,14,15]. However, race walking dynamics have been less studied when compared with walking and running [16], and often investigations have been focused on one speed only, missing potentially relevant information about velocity generation.
The aim of this study was to analyse the ground reaction forces and BCoM trajectory during race walking on a wide range of speeds and to compare the three components of GRFs (i.e., forward, lateral, vertical) with walking and running.
2. Materials and Methods
Fifteen male athletes (mean ± SD, 23.0 ± 5.5 years old, 1.78 ± 0.05 m height, 64.7 ± 5.2 kg body mass and with a 10,000 m personal best of 44:26 ± 3:34 min:s) participated in this study. All subjects gave their informed consent for inclusion before they participated in the study. The study was conducted in accordance with the Declaration of Helsinki, and the protocol was approved by the Ethics Committee of the University of Milan.
The “dynamometric corridor” was composed of five 3D strain gauge platforms (Bertec, USA) in order to obtain a 4 m long and 0.4 m wide footpath placed in the middle of a 40 m walkway where athletes could race walk at a constant speed. Athletes were asked to perform three trials at each self-chosen low, medium and high speed, hence, each subject completed 9 trials.
Ground reaction forces were recorded at 1000 Hz and normalised to athlete’s body weight (BW) and as a percentage of stance time. Stance phase was defined using a 10 N threshold on vertical (FZ) force. The inversion between braking and propulsive on antero-posterior (FX) force was set when the force from negative (braking) became positive (propulsive). Speeds were clustered when within 3% of the target speed (2.78, 3.06, 3.33, 3.61, 3.89, 4.17 m s−1), similar to the cluster used in Nillson and Thorstensson [17]. Walking and running GRF values were also taken from the Nillson and Thorstensson [17] study for comparison purposes.
The BCoM position was computed by double integration of the 3D acceleration, obtained by the force signal, according to Cavagna [10]; the integration constants were calculated as described in the Appendix of Saibene and Minetti [18]. The obtained BCoM trajectory was transformed in local coordinates (as the sampling occurred over an instrumented treadmill). The resulting 3D contour included several consequent strides, each of which was forced to become a closed loop and centred on (0, 0, 0) by subtracting average 3D coordinates to allow a description based on a Fourier Series with 6 harmonics [12]. Walking and running BCoM data were extracted from our cumulated database on subjects matched for anthropometry and age (n = 10).
Statistical differences across speeds and multiple peaks were tested by a two-way ANOVA using a Bonferroni post-hoc test, whereas differences between the two main gait patterns (see Results) were tested using a t-test and the significant level was set at p < 0.05 (SPSS 19, IBM).
3. Results
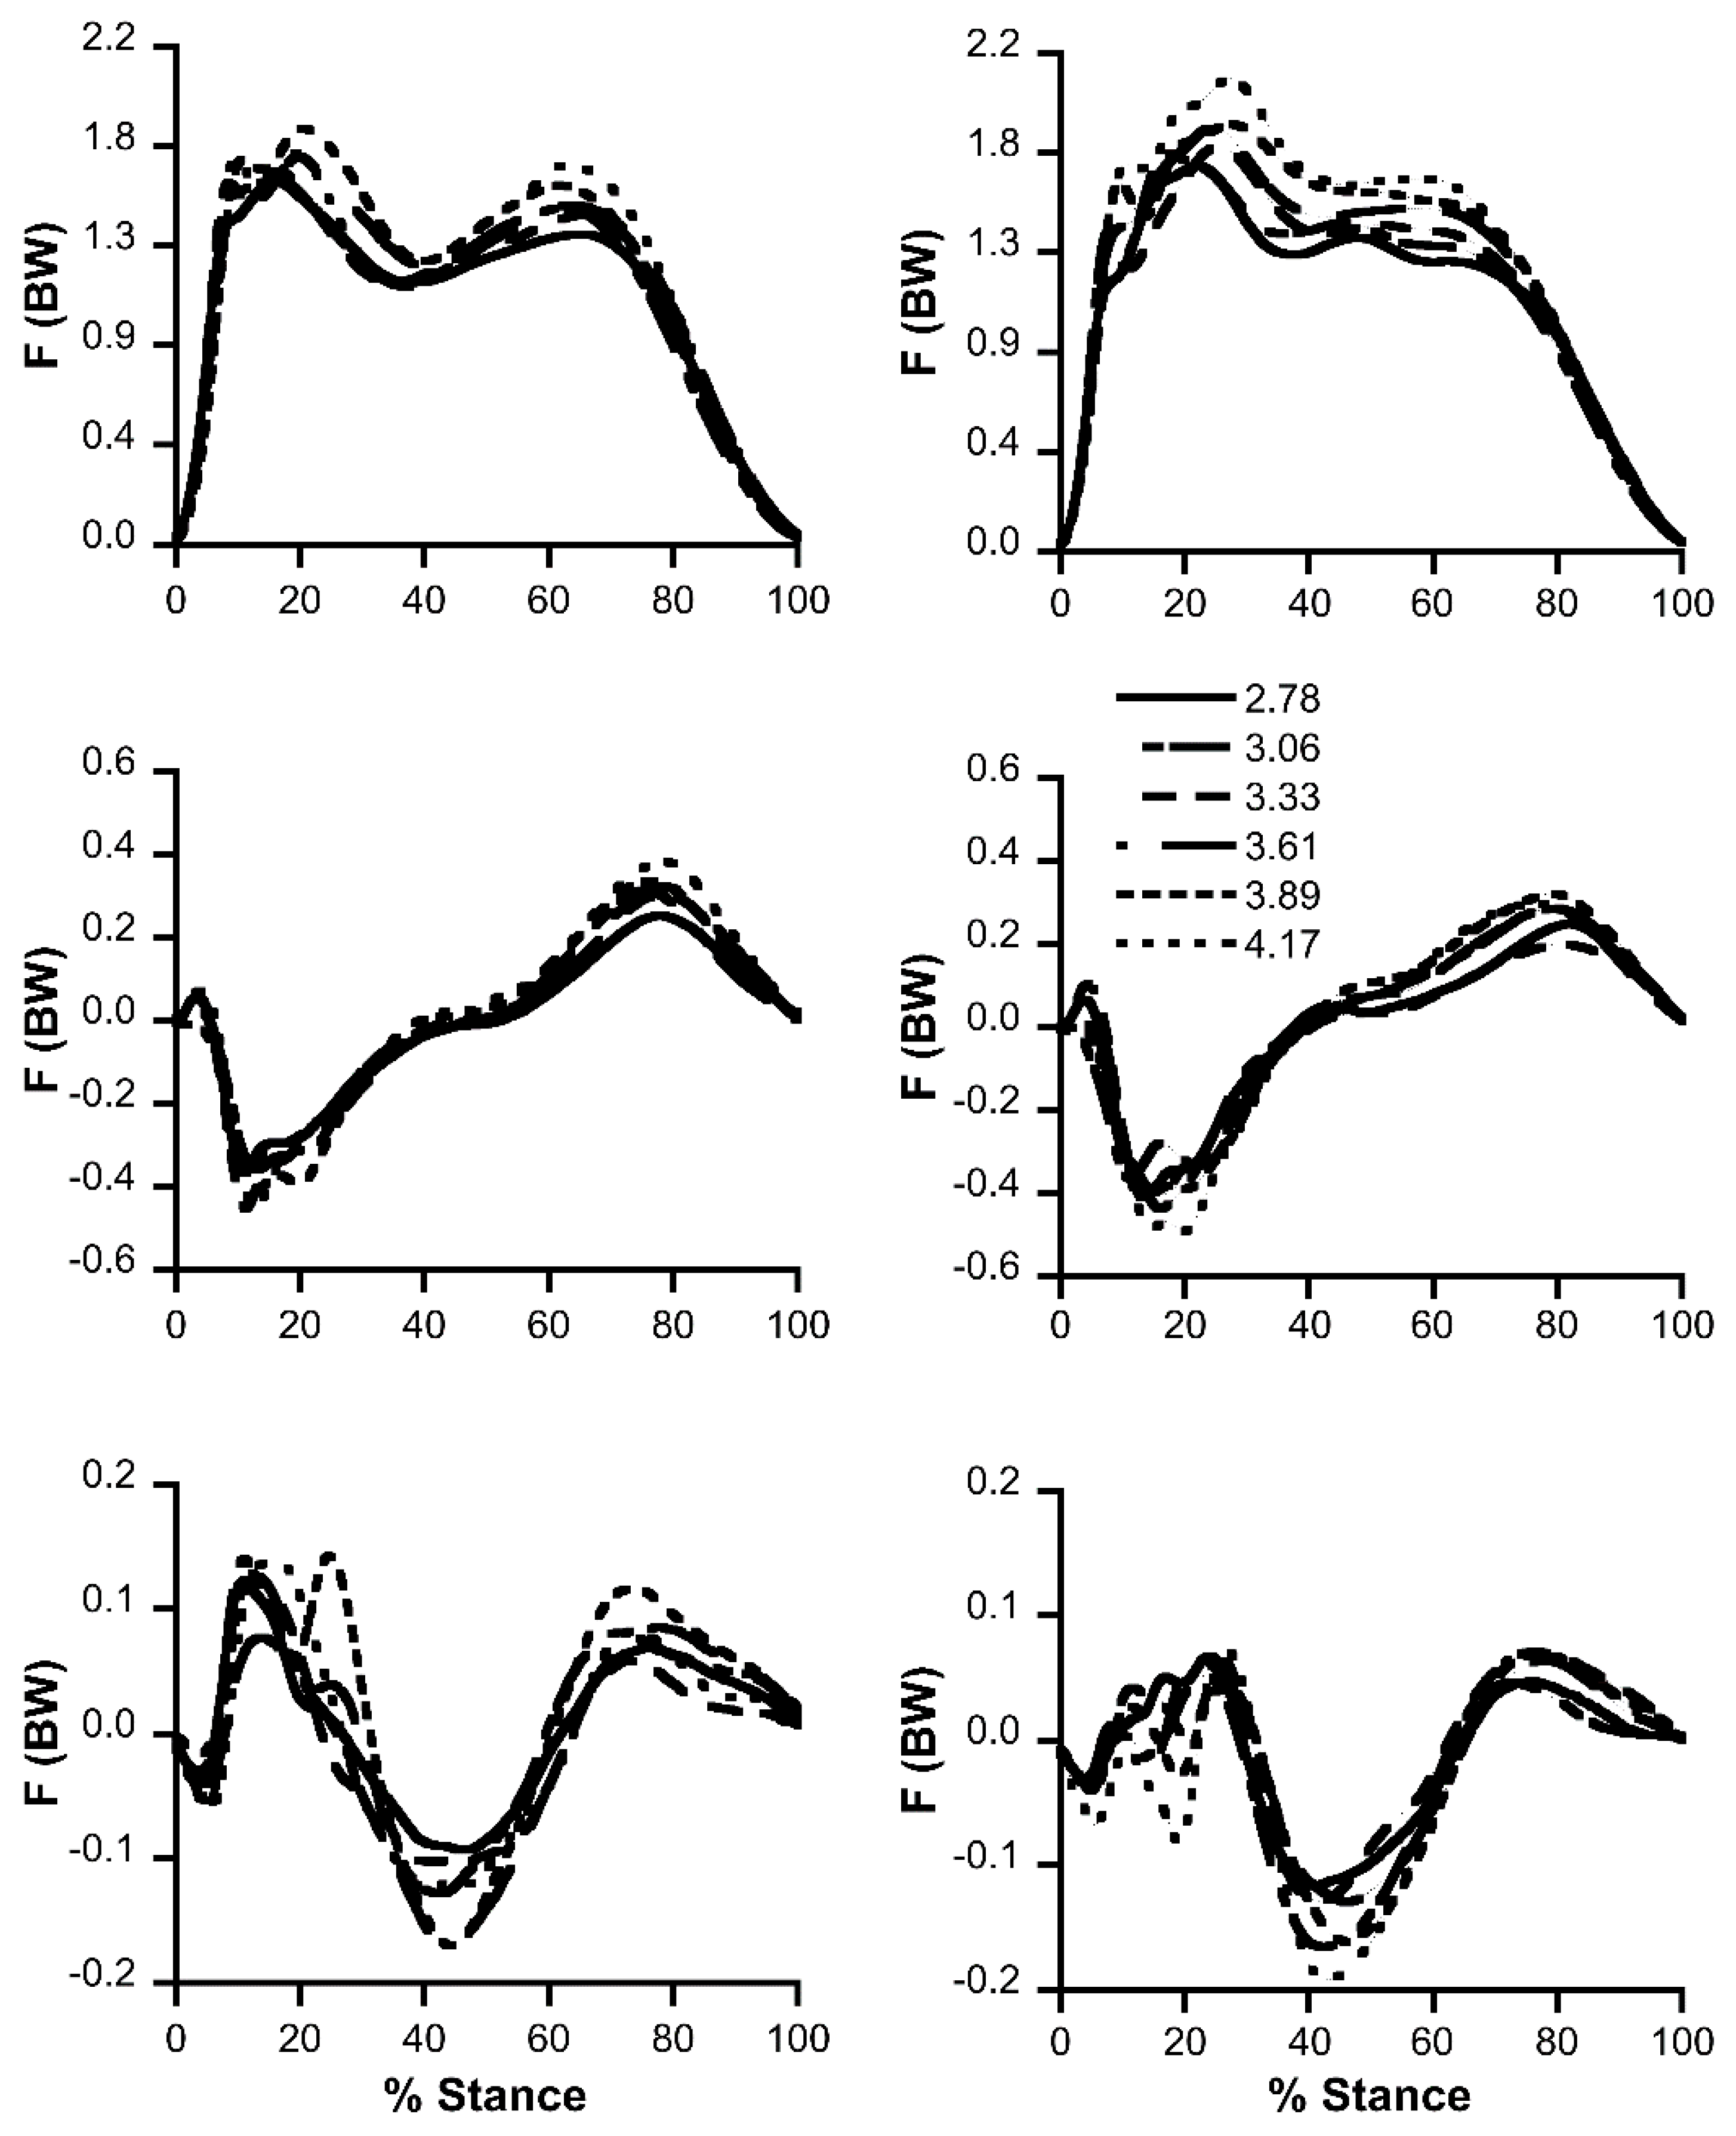
Mean curves of vertical (Fz), antero-posterior (Fx) and medio-lateral (Fy) ground reaction forces during race walking stance phase are presented in Figure 1. Subjects were clustered in two different groups according to different Fz curves: (i) M shape (Figure 1) that was similar to walking, displaying two peaks and a valley and (ii) N shape (Figure 1) that showed a huge first peak followed by a plateau. The Fx curve showed a first negative braking peak and a smaller propulsive peak near the end of stance phase, without substantial differences on the Fx curve among the two groups. Braking and propulsive impulse (i.e., the area of the two phases delimited by the abscissa at 0 value) were always very similar denoting a substantially constant inter-strides speed. The Fy curves were averaged between right and left stance since they were specular with no significant differences. After a first medial small peak, the force was lateral, medial at mid stance and lateral again at two-thirds of the stance. The two groups reached the first lateral peak with two different shapes, more consistently for the M shape group.
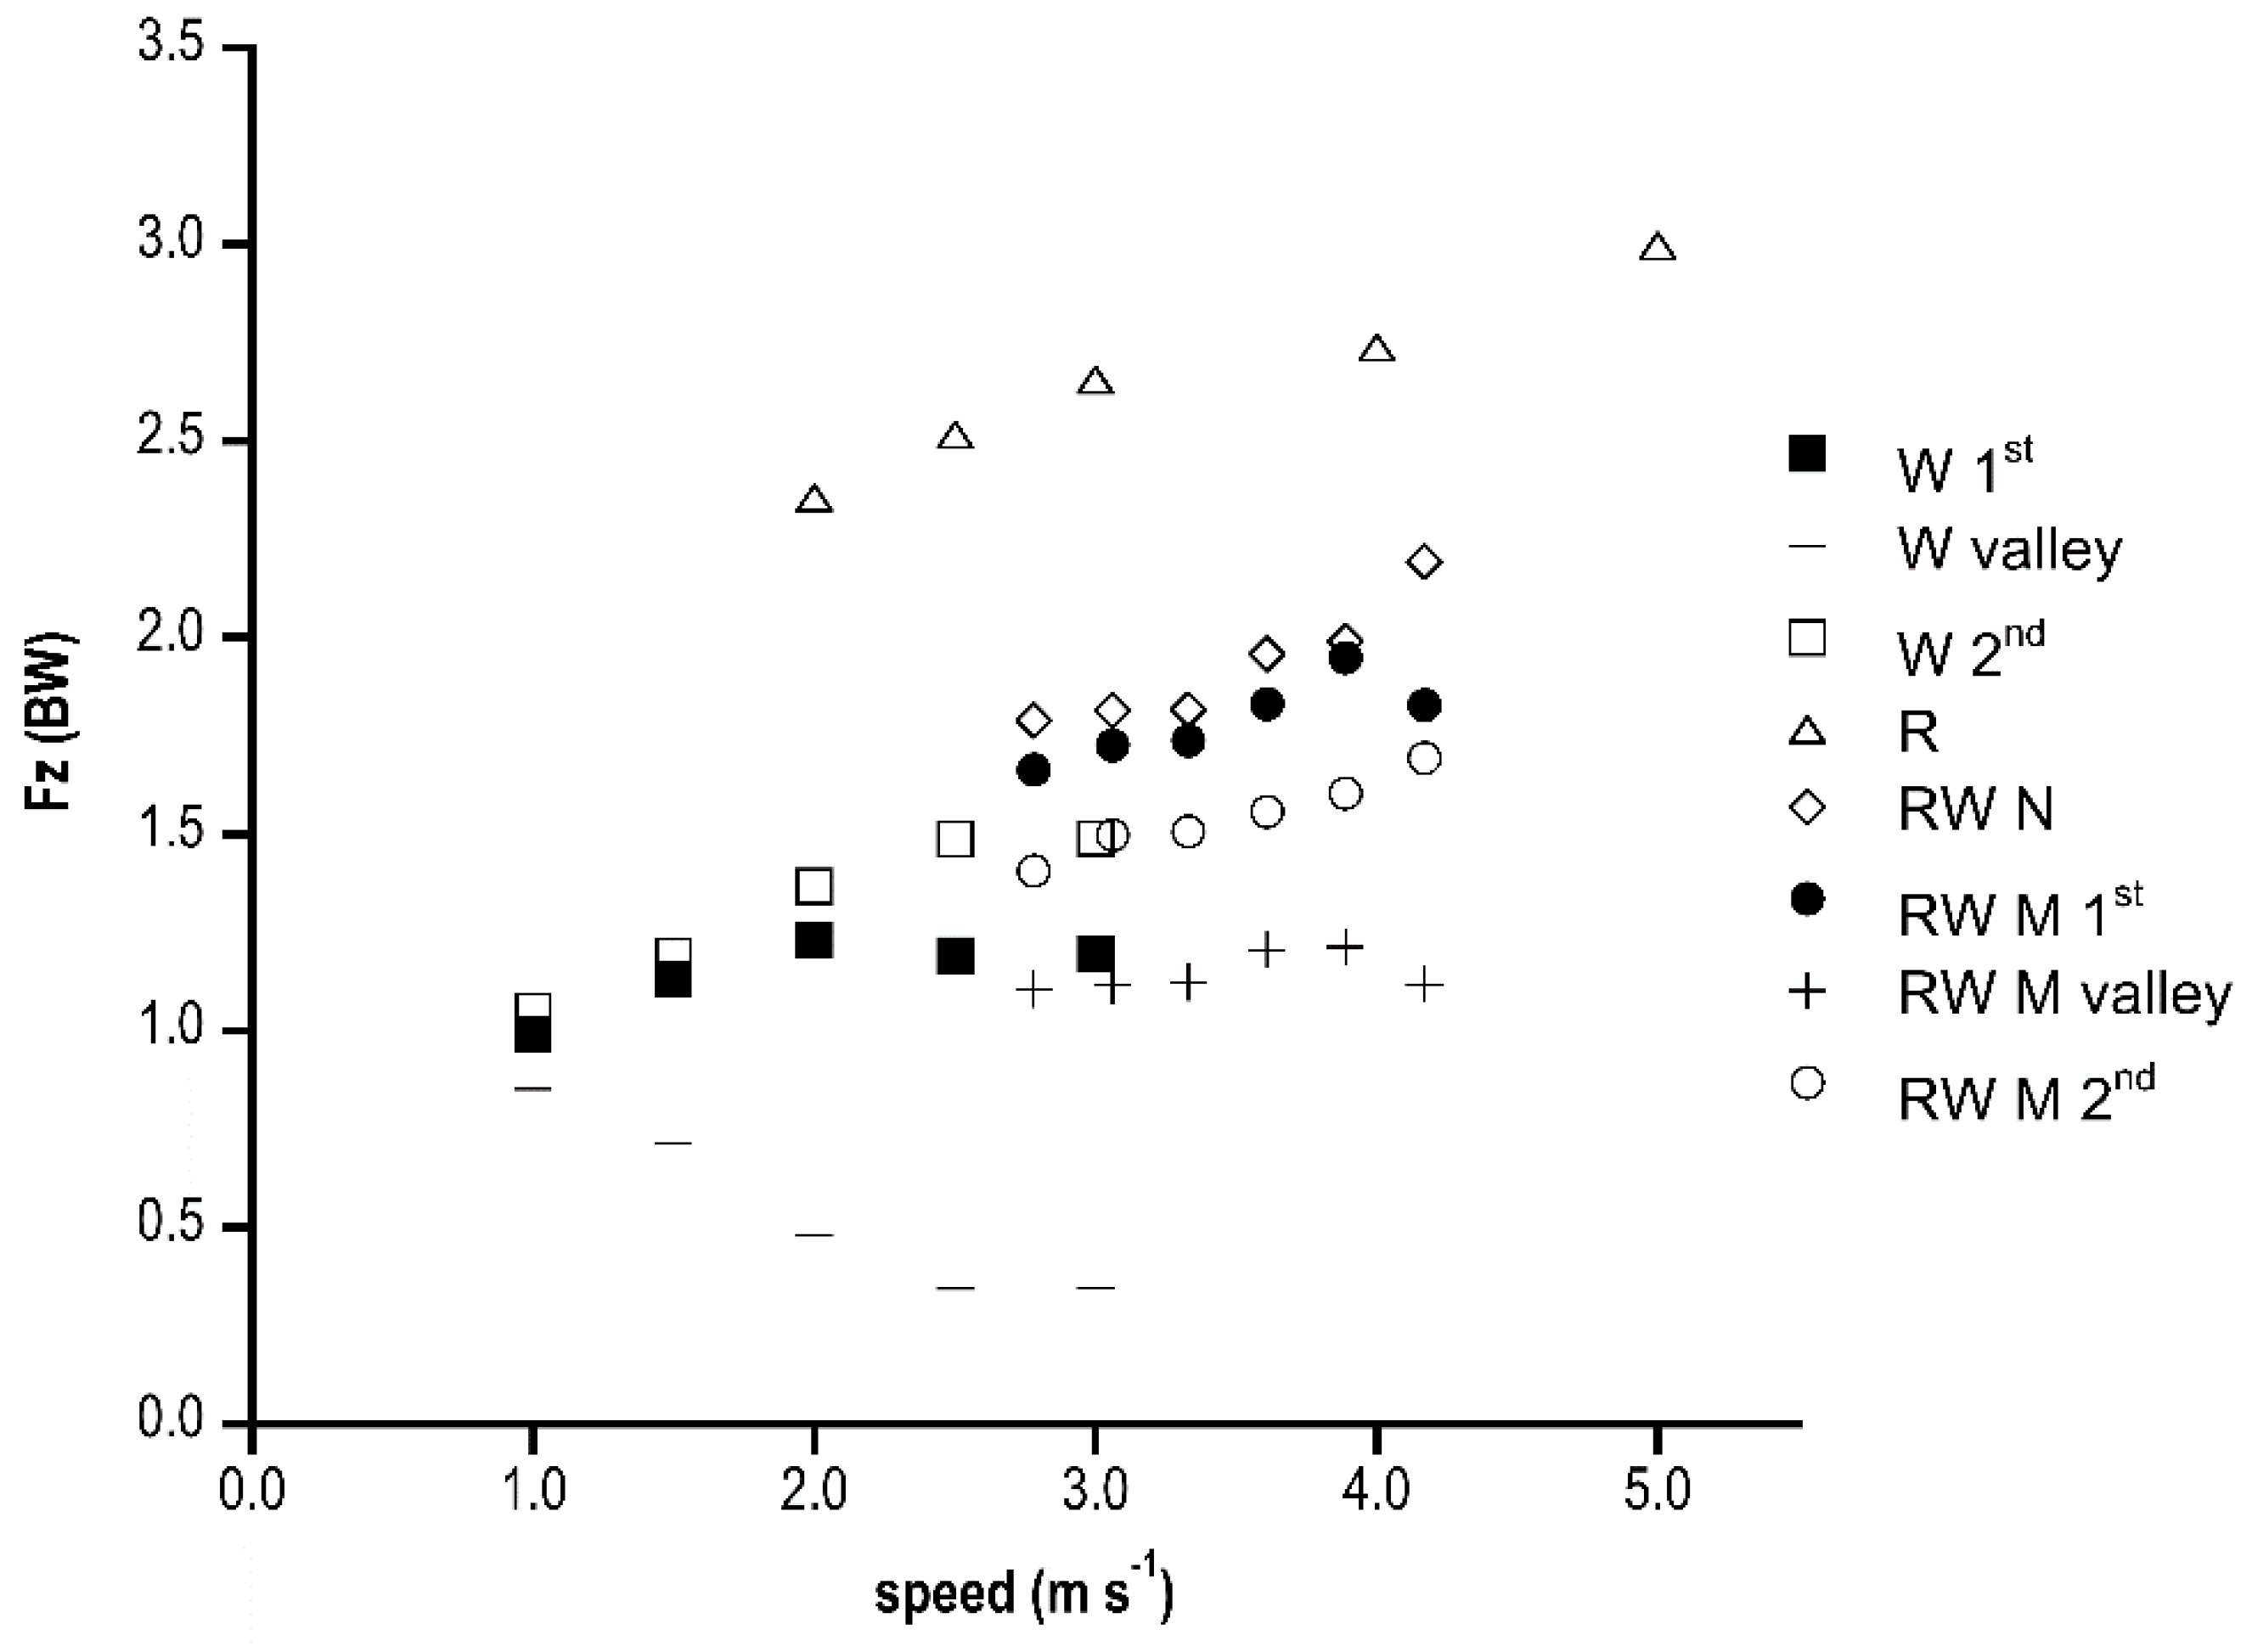
In Figure 2, vertical (Fz) peaks and valleys in race walking, walking and running [17] are presented. When analysing the M shape group, the first peak was higher than walking, whereas the second was comparable, and the valley instead was much higher in race walking than in walking without falling under the BW value. In the M shape group, the first Fz peak was always significantly higher (p < 0.001) than the second. The N shape Fz peak was slightly higher than the M shape, with significant difference only at 2.78 m s−1 (p < 0.01) and 3.61 m s−1 (p < 0.05). Running showed higher peaks than the other gaits. All peaks increased linearly with speed, with significant differences between 4.17 m s−1 and the other speeds in the N shape and the second M shape peak (p < 0.01). The first M peak increased with speed but with a less significant trend, whilst the valley was speed independent.
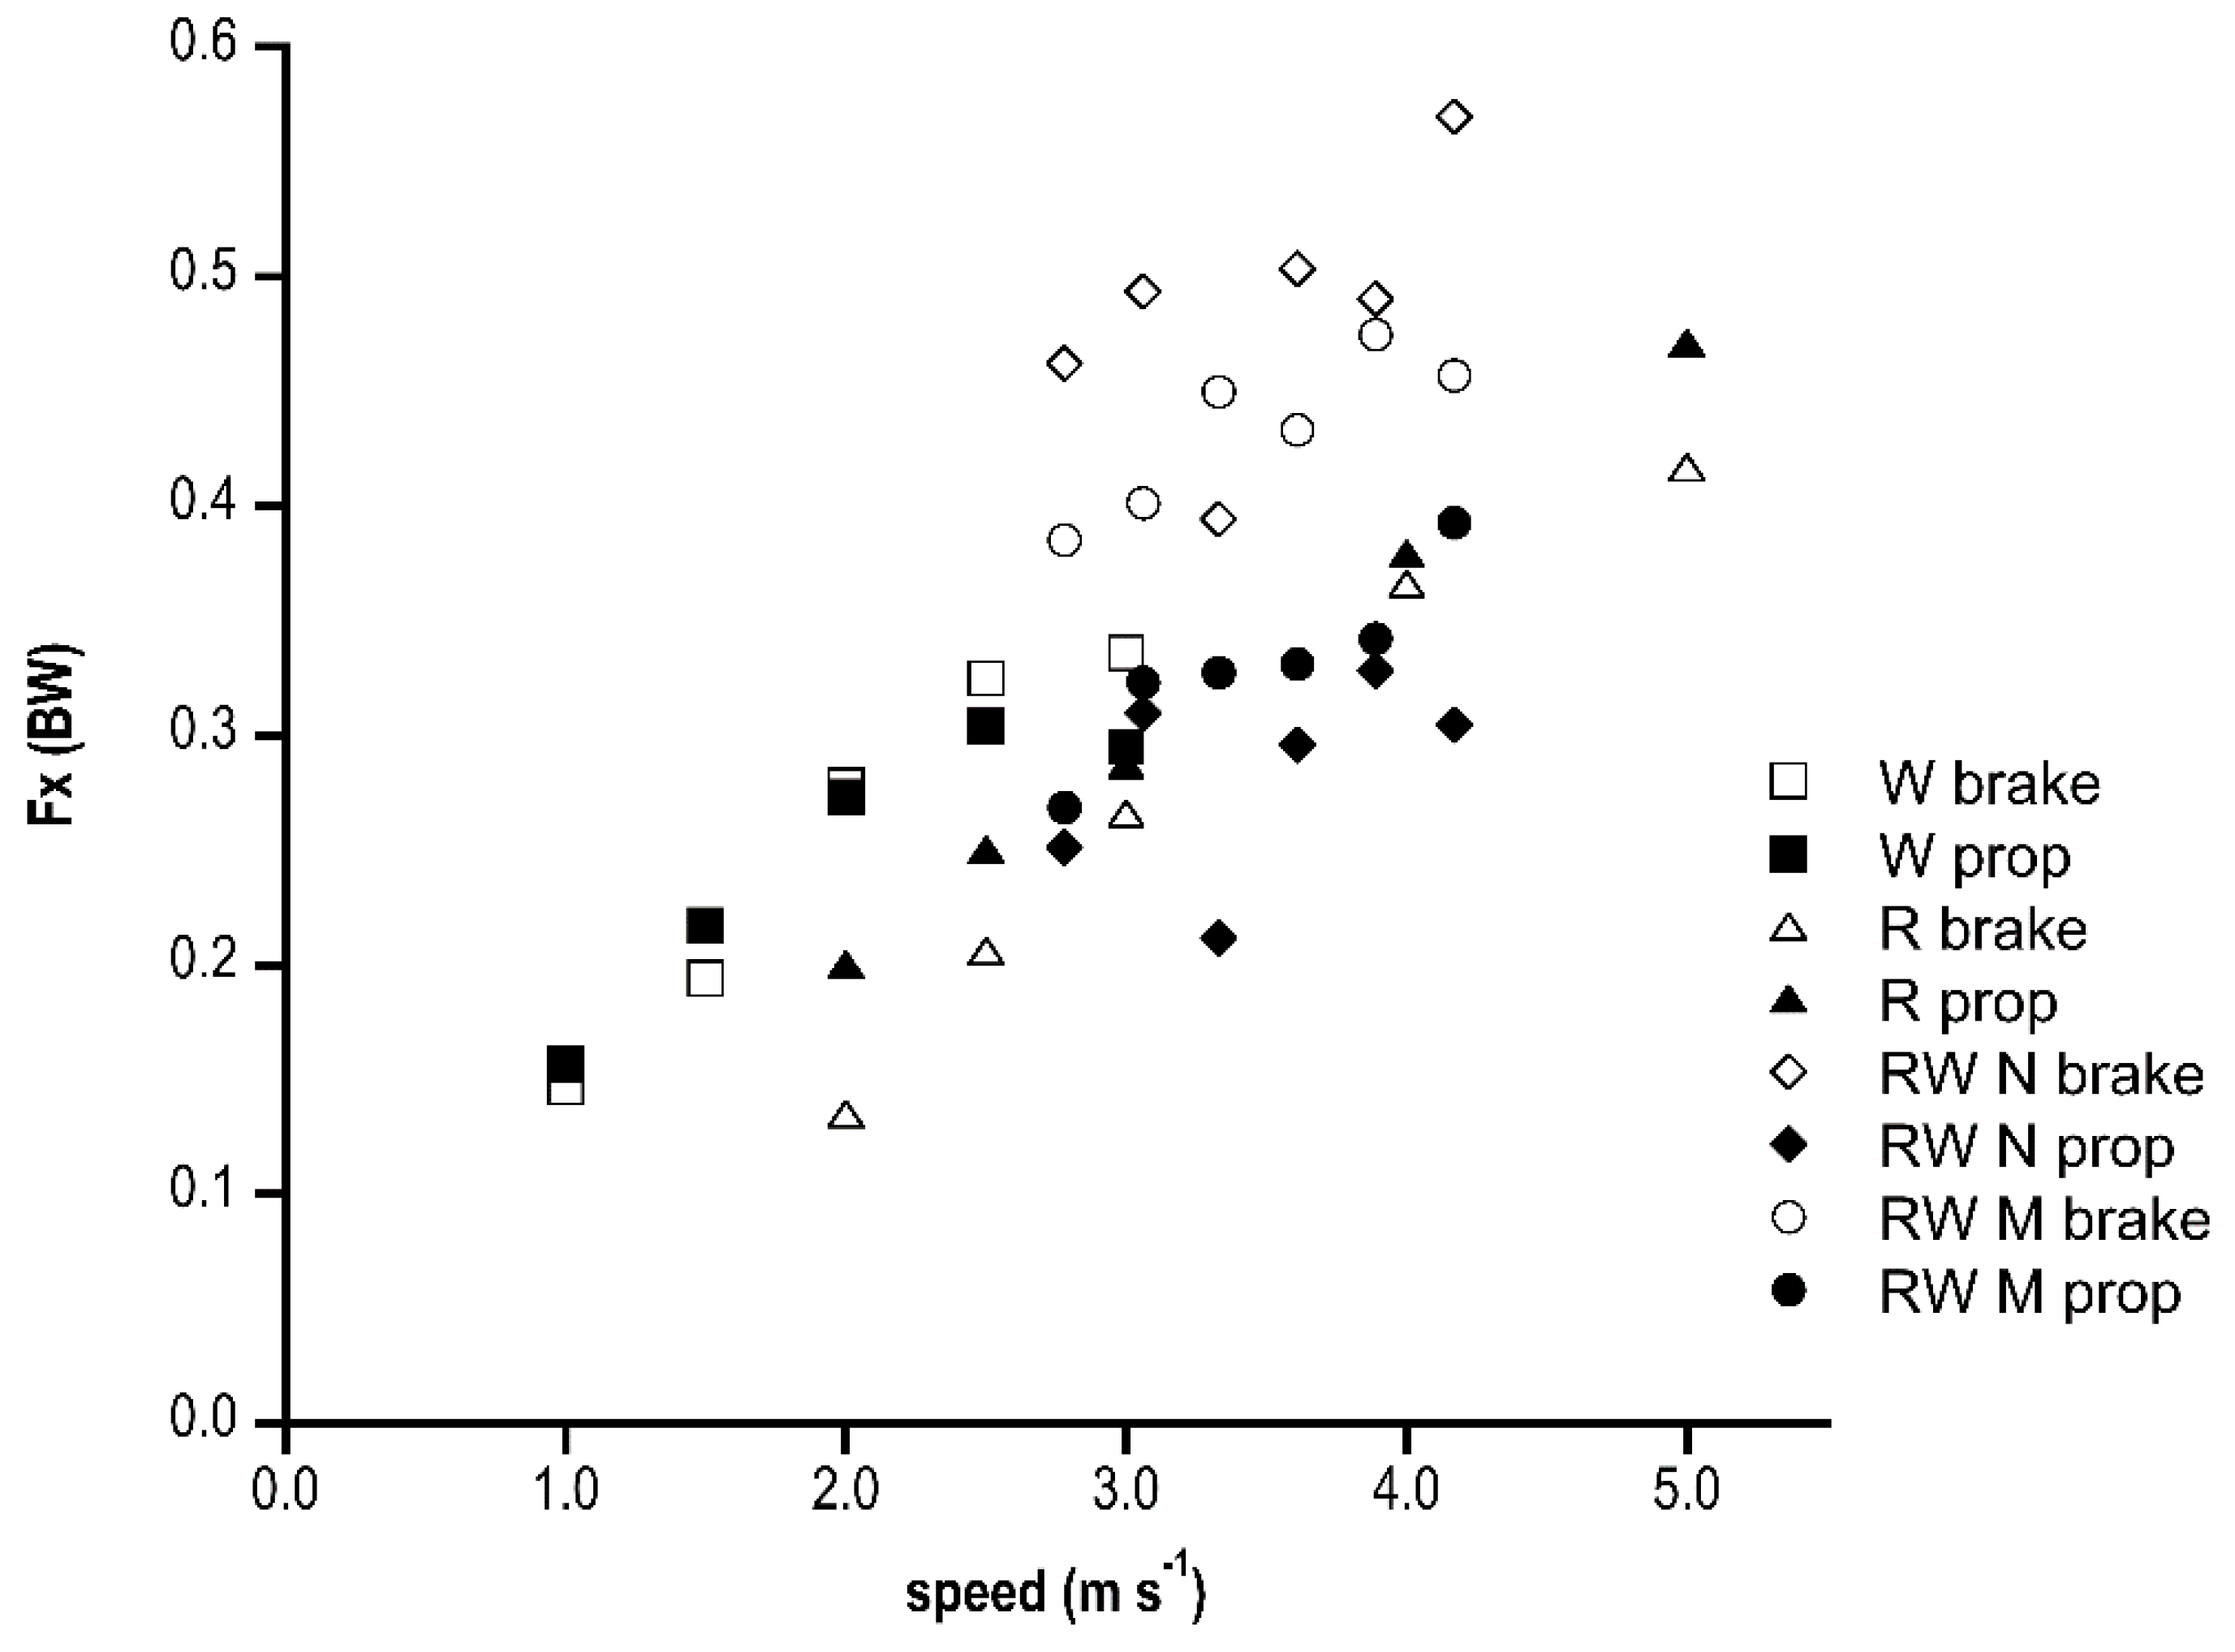
Figure 3 shows the antero-posterior (Fx) peaks in the three gaits. Braking and propulsive peaks increased linearly with speed and with the same values in walking and running, whereas race walking reported higher braking than propulsive peaks (p < 0.001) in both groups at each speed. The braking peak was significantly lower (p < 0.05) in the M shape than the N shape except for 3.33 m s−1 where the M shape peak was higher and at 3.89 m s−1 that was not different.
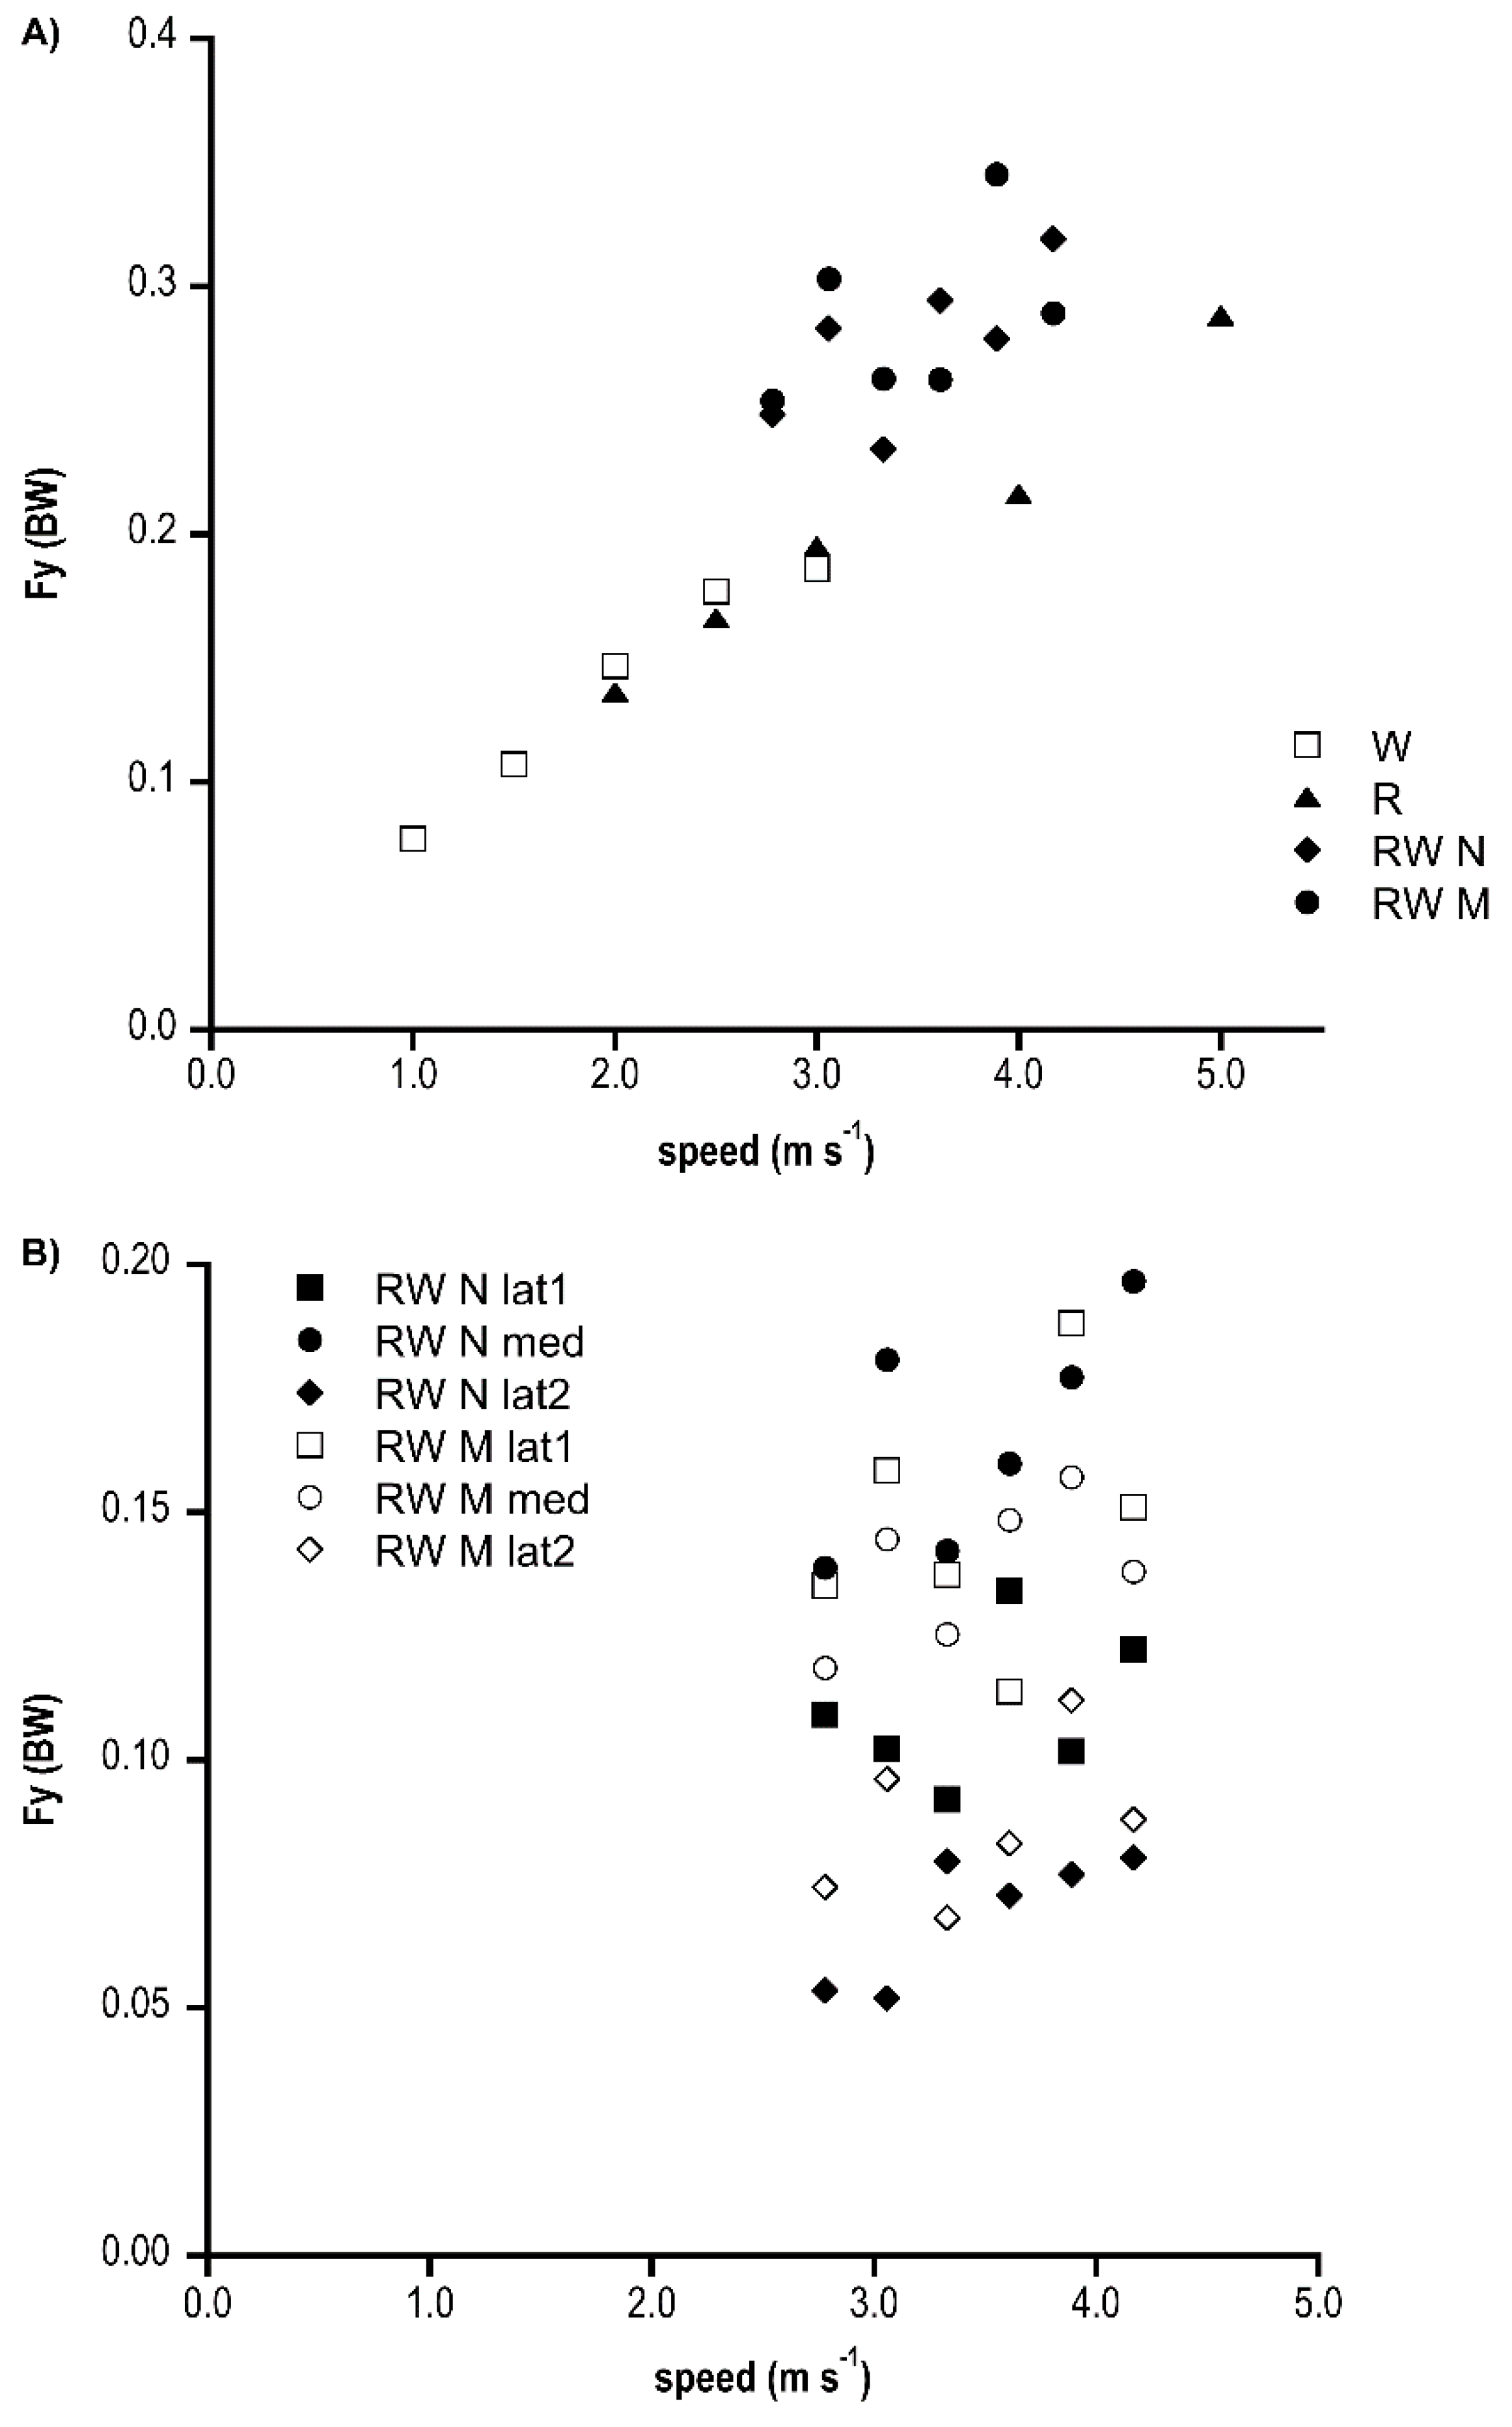
In Figure 4A, the difference between Fy medial and lateral peak are shown: walking and running Fy increased in a similar fashion linearly with speed, and race walking always showed higher values (significant differences among groups only at 3.89 m s−1 (p < 0.001)); in Figure 4B, the amplitude of medial and lateral peaks in race walking were almost speed independent. Also, across several speeds, the first lateral peak was significantly higher than the second one. In the N shape group, the medial peak was also greater than the lateral, whereas in the M shape group, the lateral and medial force peaks were comparable. The N shape group often showed significantly greater peak values than the M shape one.
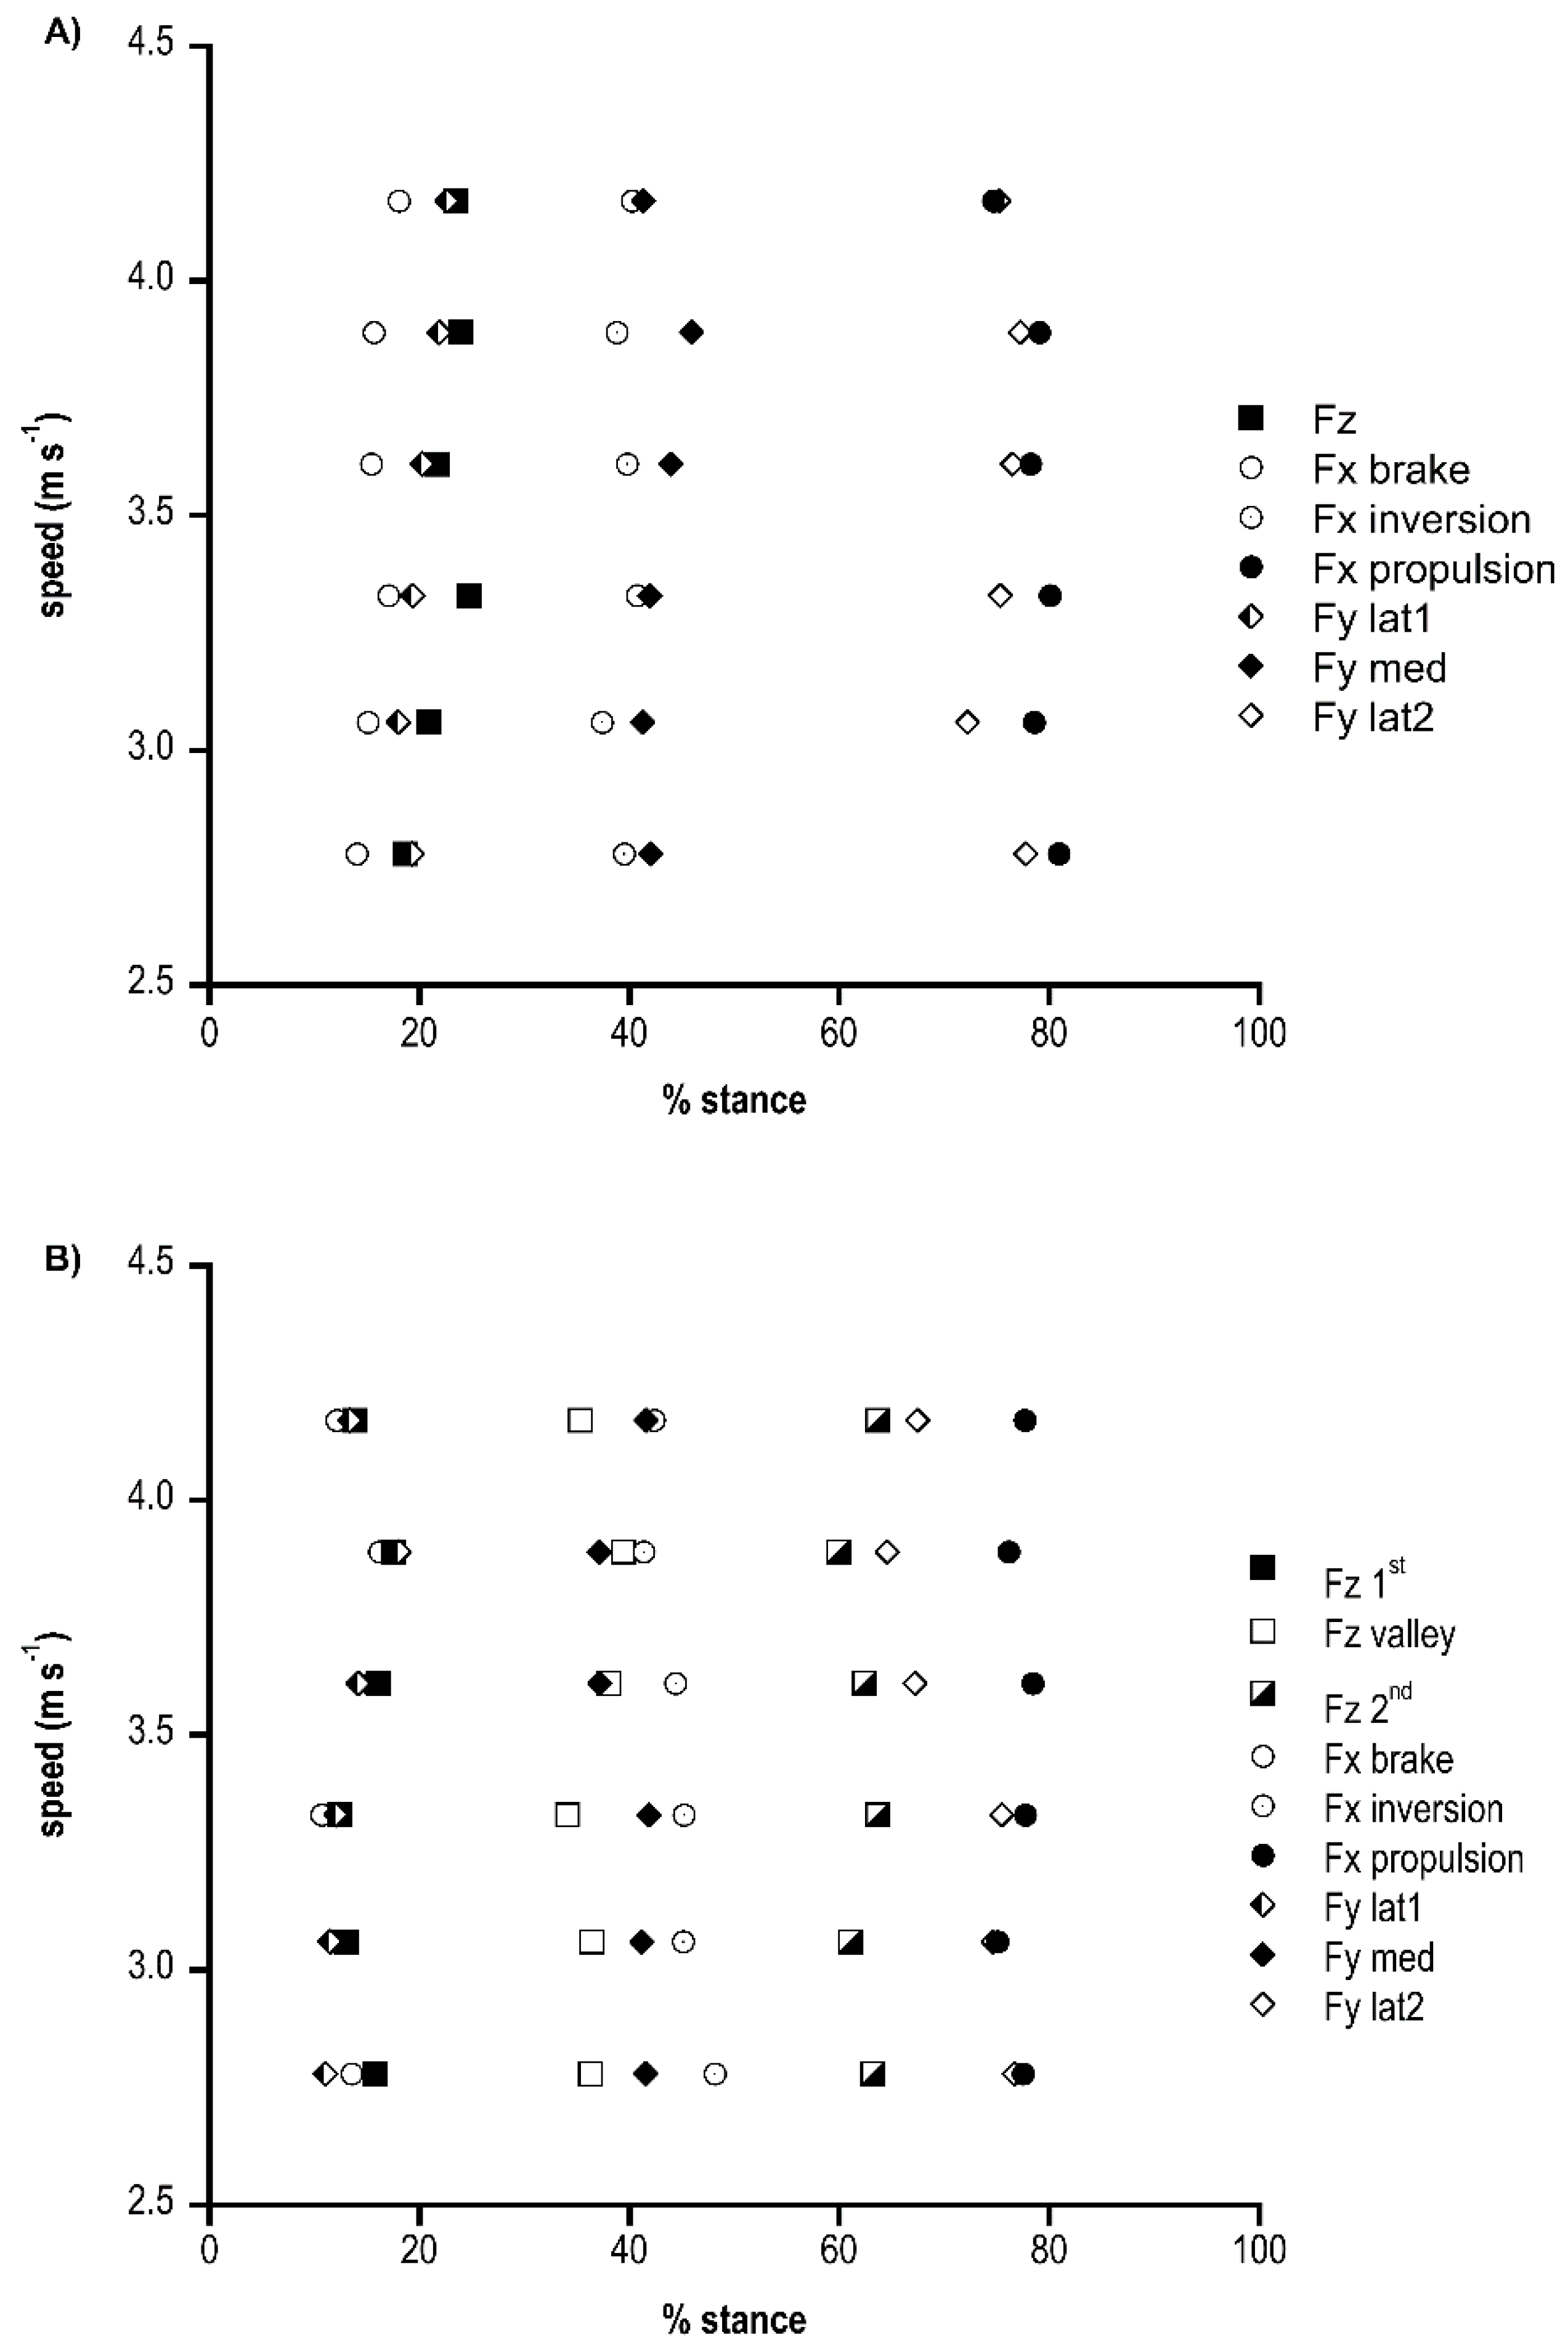
Figure 5A (M shape group) and b (N shape group) shows the timing of the peaks, valley and inversion of the vertical, antero-posterior and medio-lateral ground reaction forces in relation to the normalised stance phase for each speed tested. Most of the variables did not show speed dependency, since their relative timing across speeds did not change; however, in the N shape group, the propulsive peak at 4.17 m s−1 occurred significantly earlier (p < 0.05) than in other speeds. In the M shape group, the peak brake and peak lateral forces showed some timing variations, (p < 0.05). It was interesting to note that some peaks occurred together: Fx brake, Fy lateral and Fz; medial Fy and Fx inversion; and Fx propulsive and Fy lateral, without differences among groups. The M shape group showed a later inversion of antero-posterior force at speed < 3.89 m s−1 (p < 0.01), an earlier propulsive peak at some speeds (p < 0.01), an earlier lateral peak at speed < 3.61 m s−1 (p < 0.05) and an earlier medial peak at high speed (p < 0.05) than the N shape group.
By comparing race walking peaks’ timing with walking and running [17], braking and vertical peaks were anticipated in race walking, whereas propulsive peak timing was similar to walking and occurred later than running.
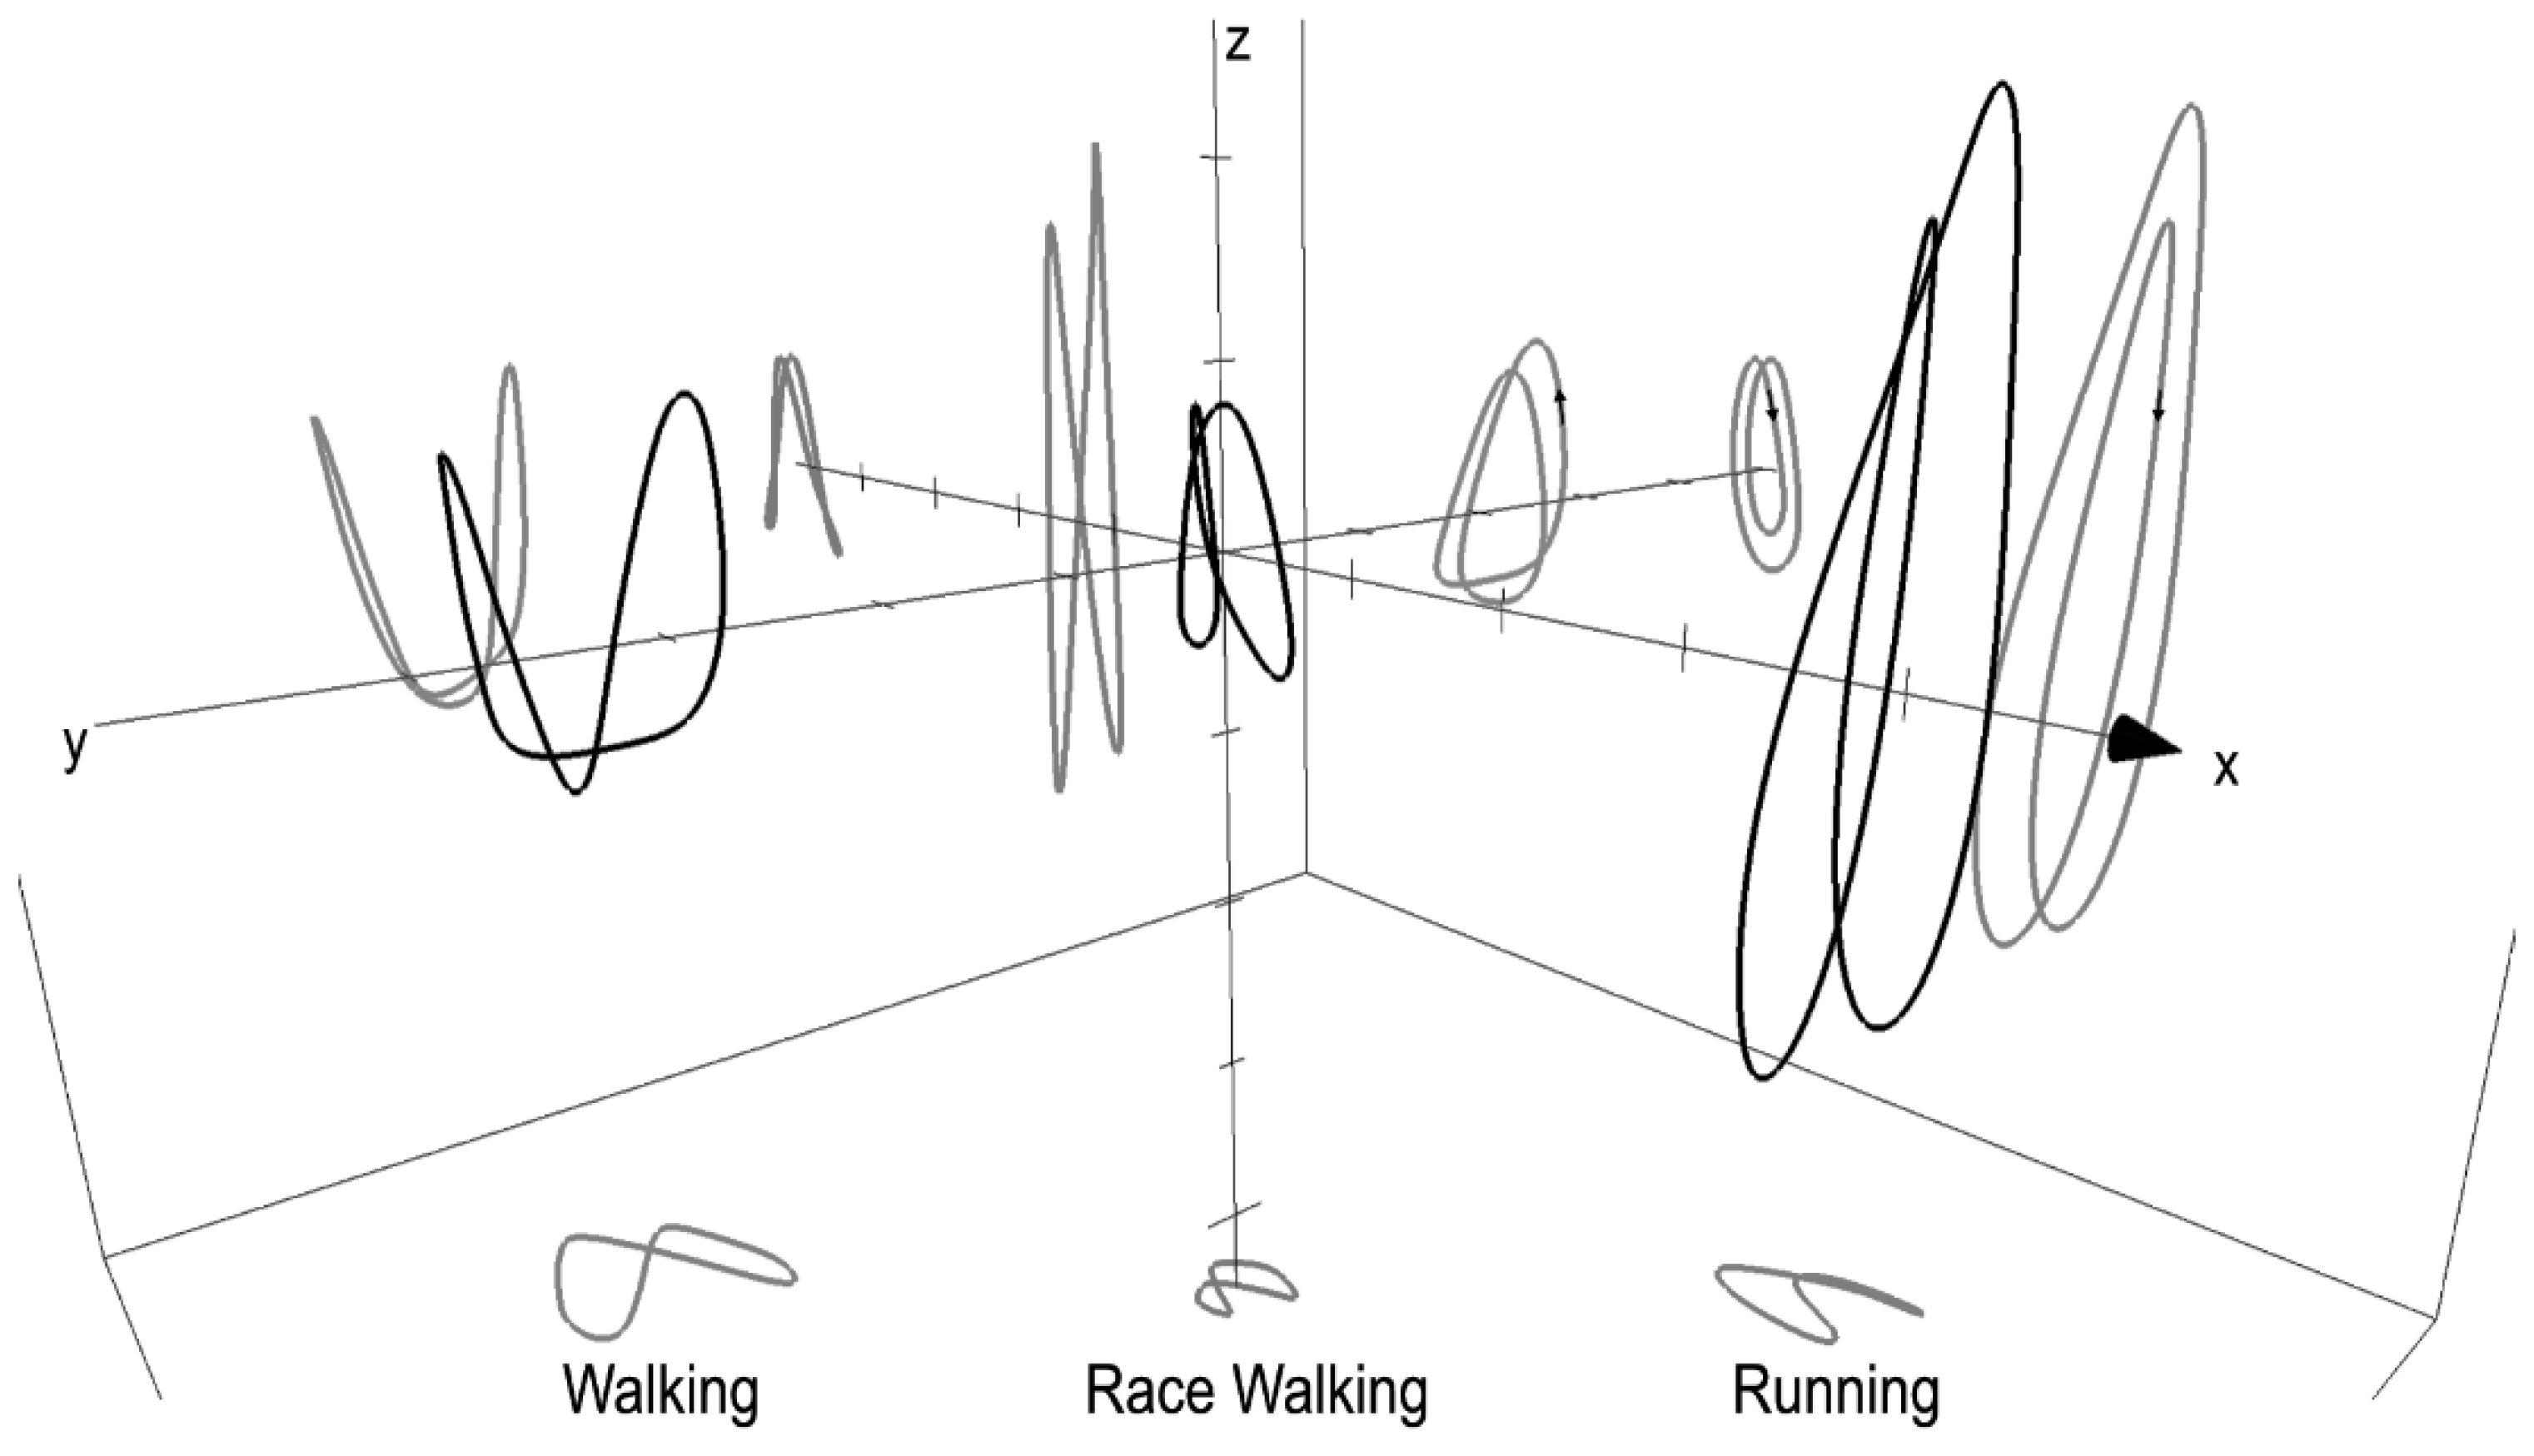
The 3D BCoM trajectory is presented in Figure 6 in comparison with running at the same speed and walking (1.94 m s−1). The race walking BCoM volume was smaller than in running and walking, with a narrower displacement in the medio-lateral direction and smaller vertical excursion. Walking and running showed a lower minimum of the BCoM vertical trajectory compared with race walking, whereas in the upper part, walking and race walking showed the same maximum, which was lower than in running. In race walking, BCoM was in the lowest part of the trajectory during stance, as in running, without showing the arc of circle characteristic of walking during the stance phase. The set of equations, based on the Fourier Series (truncated at the 6th harmonic), needed to describe the BCoM 3D trajectory of race walking (for example at 3.61 m s−1) is:
where x, y, and z are the antero-posterior, medio-lateral and vertical axis, respectively. This kind of equation was used to represent the walking, running and race walking BCoM trajectory in Figure 6.
4. Discussion
This paper described and analysed the race walking ground reaction forces patterns in the three planes of motion at increasing speeds. The GRF peak values were comparable with the paired speeds of previous studies in literature [13,14,15,19], with a few discrepancies which are discussed below.
4.1. Speed Adaptation
The speed increased vertical peaks almost linearly and the second peak in the M shape race walking group was more affected than the first one (Figure 2). On the contrary, the valley results were speed independent (Figure 2). The peak propulsive and braking forces also increased with speed and the braking peak was always greater than the propulsive peak, whereas the timing of the inversion was not affected by speed (Figure 3). The braking peak is expected to be passive in race walking as explained by the “locked-knee” rule, but since the braking and propulsive impulses were the same (as they should for the constant speed), such a peak force asymmetry seems to suggest a strategy to minimize peak muscle involvement in the propulsive phase. Medio-lateral forces, both in absolute terms or expressed as peaks difference, were similar at increasing speed (Figure 4), and this suggests that the leg and trunk muscles do not need to increase their activity when speed increases, as the body centre of mass trajectory was not further laterally deviated. Such speculation is supported from a gait optimisation perspective, as a lateral deviation with respect to the progression direction has been shown as an avoidable and functionally ineffective feature in all animal gaits (apart from penguins [20]). Timing of peaks, when expressed as stance percentage, was speed independent except for few variations (Figure 5). This is a typical gait stereotype, which could be beneficial from a motor learning perspective [21], since, in this way, athletes do not have to change their pattern to gain speed but only perform it faster. In fact, when increasing speed, the contact time is reduced [22], and the gait events are anticipated in absolute timing. Since the majority of the peaks increased with speed, as occurred in walking and running [17], comparison within the same gait or with other gaits should be performed only at matched speed.
4.2. Race Walking versus Walking and Running
When comparing GRFs across race walking, walking and running, some differences were found. Vertical forces were higher in running, whereas race walking peaks seemed to increase with speed following the same trend of walking values at higher speeds (Figure 2). However, while in walking, the valley values dropped under body weight and decreased with speed; in race walking, the valley values were slightly higher than body weight and speed independent (Figure 2). In walking, the trough drops under body weight due to the “centrifugal reaction force” caused by the arc of circumference quickly travelled by BCoM during the stance phase [23,24]. In race walking, the BCoM during stance does not move along a circle with leg length as radius [11], but lowers down as in running. This could explain why the trough in vertical force signal does not drop under body weight; however, this hypothesis does not explain why an M shape pattern is exhibited, as in walking, whilst the BCoM pathway is similar to running. Also, both vertical peaks occurred earlier than walking with a timing similar to running (for the first). When considering the vertical forces, running is the most stressful gait due to the highest peaks. Race walking propulsive peaks were comparable to running, differently, the braking peaks were higher than running (Figure 3). The inversion between braking and propulsive in race walking occurred earlier than in running, and a shorter braking time involves a higher peak. The propulsive peak timing occurred as in walking, but later than running (Figure 5). This could be advantageous to avoid rapid changes in force production but required a constant average activation.
The medio-lateral forces (expressed as delta peaks) in race walking showed the lowest values as in the other gaits, but they were higher than walking and running (Figure 4). This is probably due to the kinematics of the pelvis, which shows a medio-lateral excursion in order to accept the straight knee from heel strike to midstance [22,25,26]. The first lateral peak was simultaneous with the vertical peak, as occurred in walking and running, and the medial peak, which was the greatest, was in line with braking–propulsive inversion.
The BCoM trajectory shows some interesting features of race walking compared with walking and running. At first, the volume was smaller than the other two gaits with less excursion in the medio-lateral direction, which is not expected when considering the great excursion of the pelvis, typical of this gait [22]. However, the BCoM is the weighted mean of all the segments, and a single segment could bring a remarkable bias in the estimated BCoM trajectory [11]. The vertical displacement showed a higher minimum than both walking and running. This can be explained by the race walking rule that requires the knee to be straight during the stance phase. In this phase, BCoM lowers its trajectory as in running, without the knee flexion, race walking BCoM is mechanically forced to stay on a higher trajectory. In walking, when increasing speed, the minimum reaches smaller values. Walking and race walking, at slow speed (2.78 m s−1), show the same upper limit in BCoM trajectory. When speed is increased, flight time occurs also in race walking and the maximum is slightly higher, without approaching running values; whereas, the minimum is almost unchanged. The crossing point between the right and left part of the contour in race walking occurs in the upper part as in running, whereas in walking, it is located in the lower part. Also, the potential and kinetic mechanical energies are in phase as in running, whereas in walking, they are out of phase. The symmetry values on the three axes showed a behaviour similar to walking and running. However, a greater number of strides is necessary to give an appropriate description of the symmetry behaviour at increasing speed also in race walking. In conclusion, the BCoM contour of race walking resembles the running pattern, even when no flight time is present, with a smaller excursion.
4.3. Different Vertical GRF Groups
Besides the vertical peaks’ difference, the clustering of M and N shape athletes showed other small differences in anterior-posterior and medio-lateral forces in the first part of the stance phase, before the braking–propulsion inversion. The braking peak was higher in the N than in the M shape group and the lateral force pattern was less homogeneous with a delayed peak in the N shape group.
Fenton [14] suggested that the magnitude and timing of the vertical peak was an index of smoothness and “fluidity” of the stride. Moreover, the absence of a second vertical peak would direct the force more in the progression direction, on the contrary, a vertical force would cause a vertical displacement that could end in flight phase [14]. In our data, both groups (M and N shape) showed the same first vertical peak, therefore, they should have the same stride “fluidity”. As for the vertical displacement, the double integration of acceleration in both groups did not show any appreciable difference in the BCoM trajectory during stance and no difference in flight time.
The different vertical GRF patterns among athletes was already pointed out by Fenton [14], and it was also evident when comparing Fenton’s with Cairns and colleagues’ [13] data [13,16]. Fenton explained this difference with athletes’ performance level: M shape athletes were the least, whereas N shape were the most trained. Despite our relatively small sample size (larger than in the Fenton paper [14]), eight athletes showed an N shape pattern and seven showed an M shape pattern: within groups, the performance level was very different; however, between groups, the level was the same (PB 10,000 m min:s M shape: 44:39; N shape 44:18). This allowed us to conclude that performance level should not be the trigger for different patterns. As shown in Figure 1, the pattern was well characterised and different across the whole range of speeds and no athlete changed it by increasing speed. A further explanation could be related to the different athletes’ techniques learnt from different coaches. When analysing this aspect, the sample size decreases even more, with just a couple of athletes for each coach; however, we found that coach technique was not the determinant of the difference either.
5. Conclusions
The present comprehensive analysis of ground reaction forces shows that race walking is a gait that shares features with walking and running. Similarly, the increase in speed is achieved by increasing force peaks, which occur at the same relative instant of the stance phase, thus, a comparison among subjects or studies should be done only at the same speed. The peculiarity of race walking kinematics and dynamics features is remarkable, also in the ground reaction forces analysis, since, differently from walking and running, athletes showed two different vertical force patterns within the same gait. These different patterns do not change the 3D trajectory of the body centre of mass and related spatiotemporal parameters, and do not seem to be related to the athletes’ performance level. Further investigations are needed to understand which biomechanical factors cause these patterns. The BCoM trajectory obtained by ground reaction forces showed that race walking has the same pattern of running, even at slow speed where no flight time is present, within a smaller volume.
Author Contributions
Initial project discussion was conducted by all authors. Specific personal contributions were as follows: conceptualization, G.P.; methodology, G.P., D.C. and A.E.M.; software, G.P., D.C. and A.E.M.; formal analysis, G.P.; investigation, G.P., D.C. and A.L.T.; data curation, G.P.; writing—original draft preparation, G.P.; writing—review and editing, G.P., D.C., A.L.T. and A.E.M.
Funding
This research received no external funding.
Conflicts of Interest
The authors declare no conflict of interest.
References
- Elftman, H. The force exerted by the ground in walking. Arbeitphysiologie 1939, 10, 485–491. [Google Scholar] [CrossRef]
- Fenn, W.O. Work against gravity and work due to velocity changes in running. Am. J. Physiol. 1930, 93, 433–462. [Google Scholar] [CrossRef]
- Muniz, A.M.S.; Nadal, J. Application of principal component analysis in vertical ground reaction force to descriminate normal and abnormal gait. Gait Posture 2009, 29, 31–35. [Google Scholar] [CrossRef] [PubMed]
- White, R.; Agouris, I.; Selbie, R.D.; Kirkpatrick, M. The variability of force platform data in normal and cerebral palsy gait. Clin. Biomech. 1999, 14, 185–192. [Google Scholar] [CrossRef]
- Giakas, G.; Baltzopoulos, V. Time and frequency domain analysis of ground reaction forces during walking: An investigation of variability and symmetry. Gait Posture 1997, 5, 189–197. [Google Scholar] [CrossRef]
- McCrory, L.J.; White, S.C.; Lifeso, R.M. Vertical ground reaction forces: Objetive measures of gait following hip arthroplasty. Gait Posture 2001, 14, 104–109. [Google Scholar] [CrossRef]
- Gerlach, K.E.; White, S.C.; Burton, H.W.; Dorn, J.M.; Leddy, J.J.; Horvath, P.J. Kinetic changes with fatigue and relationship to injury in female runners. Med. Sci. Sports Exerc. 2005, 37, 657–663. [Google Scholar] [CrossRef]
- Anderson, F.C.; Pandy, M.G. Individual muscle contribution to support in normal walking. Gait Posture 2003, 17, 159–169. [Google Scholar] [CrossRef]
- Morin, J.B.; Edouard, P.; Samonzino, P. Technical Ability of Force Application as a Determinant Factor of Sprint Performance. Med. Sci. Sports Exerc. 2011, 43, 1680–1688. [Google Scholar] [CrossRef]
- Cavagna, G.A. Force platforms as ergometers. J. Appl. Physiol. 1975, 39, 174–179. [Google Scholar] [CrossRef]
- Pavei, G.; Seminati, E.; Cazzola, D.; Minetti, A.E. On the Estimation Accuracy of the 3D Body Center of Mass Trajectory during Human Locomotion: Inverse vs. Forward Dynamics. Front. Physiol. 2017, 8, 129. [Google Scholar] [CrossRef] [PubMed] [Green Version]
- Minetti, A.E.; Cisotti, C.; Mian, O.S. The mathematical description of the body centre of mass 3D path in human and animal locomotion. J. Biomech. 2011, 44, 1471–1477. [Google Scholar] [CrossRef] [PubMed]
- Cairns, M.A.; Burdett, R.G.; Pisciotta, J.C.; Simon, S.R. A biomechanical analysis of racewalking gait. Med. Sci. Sports Exerc. 1986, 18, 446–453. [Google Scholar] [CrossRef] [PubMed]
- Fenton, R.M. Race walking ground reaction forces. In Proceedings of the II International Symposium on Biomechanics in Sports; Terauds, J., Barthels, K., Krieghbaum, E., Mann, R., Crakes, J., Eds.; Academic: Del Mar, CA, USA, 1984; pp. 61–70. [Google Scholar]
- Hanley, B.; Bissas, A. Ground reaction forces of Olympic and World Championship race walkers. Eur. J. Sport Sci. 2016, 16, 50–56. [Google Scholar] [CrossRef] [PubMed]
- Pavei, G.; Cazzola, D.; La Torre, A.; Minetti, A.E. The biomechanics of race walking: Literature overview and new insights. Eur. J. Sport Sci. 2014, 14, 661–670. [Google Scholar] [CrossRef] [PubMed] [Green Version]
- Nilsson, J.; Thorstensson, A. Ground reaction forces at different speeds of human walking and running. Acta Physiol. Scand. 1989, 136, 217–227. [Google Scholar] [CrossRef] [PubMed]
- Saibene, F.; Minetti, A.E. Biomechanical and physiological aspects of legged locomotion in humans. Eur. J. Appl. Physiol. 2003, 88, 297–316. [Google Scholar] [CrossRef]
- Preatoni, E.; La Torre, A.; Rodano, R. A biomechanical comparison between racewalking and normal walking stance phase. In Proceedings of the XXIV International Symposium on Biomechanics in Sports; Schwameder, H., Strutzenberger, G., Fastenbauer, V., Lindinger, S., Müller, E., Eds.; Unversitary Press: Salzburg, Austria, 2006. [Google Scholar]
- Griffin, T.M.; Kram, R. Penguin waddling is not wasteful. Nature 2000, 408, 929. [Google Scholar] [CrossRef]
- Majed, L.; Heugas, A.-M.; Chamon, M.; Siegler, I.A. Learning an energy-demanding and biomechanically constrained motor skill, racewalking: Movement reorganization and contribution of metabolic efficiency and sensory information. Hum. Mov. Sci. 2012, 31, 1598–1614. [Google Scholar] [CrossRef] [Green Version]
- Pavei, G.; La Torre, A. The effects of speed and performance level on race walking kinematics. Sport Sci. Health 2016, 12, 35–47. [Google Scholar] [CrossRef]
- Alexander, R.M. Mechanics of Bipedal Locomotion. In Perspective in Experimental Biology 1; Spencer-Devies, P., Ed.; Pergamon Press: Oxford, UK, 1976; pp. 493–504. [Google Scholar]
- Usherwood, J.R.; Channon, A.J.; Myatt, J.P.; Rankin, J.W.; Hubel, T.Y. The human foot and heel-sole-toe walking strategy: A mechanism enabling an inverted pendular gait with low isometric force? J. R. Soc. Interface 2012, 9, 2396–2402. [Google Scholar] [CrossRef] [PubMed]
- Cazzola, D.; Pavei, G.; Preatoni, E. Can coordination variability identify performance factors and skill level in competitive sport? The case of race walking. J. Sport Health Sci. 2016, 5, 35–43. [Google Scholar] [CrossRef] [PubMed] [Green Version]
- Murray, M.P.; Guten, G.; Mollinger, L.; Gardner, G. Kinematic and electromyographic patterns of Olympic race walkers. Am. J. Sports Med. 1983, 11, 68–74. [Google Scholar] [CrossRef] [PubMed]
Figure 1.
Ground reaction force traces (as a fraction of body weight, BW) in the three axes (vertical, antero-posterior and medio-lateral axis from top to bottom) at increasing speed (m s−1) are shown. Right and left columns represent the M shape and N shape vertical force patterns, respectively.
Figure 1.
Ground reaction force traces (as a fraction of body weight, BW) in the three axes (vertical, antero-posterior and medio-lateral axis from top to bottom) at increasing speed (m s−1) are shown. Right and left columns represent the M shape and N shape vertical force patterns, respectively.

Figure 2.
Ground reaction force vertical peaks (as a fraction of BW) in the three gaits (W, walking; R, running; RW, race walking) at increasing speed (m s−1) are shown. M and N refer to race walking M shape and N shape groups, respectively.
Figure 2.
Ground reaction force vertical peaks (as a fraction of BW) in the three gaits (W, walking; R, running; RW, race walking) at increasing speed (m s−1) are shown. M and N refer to race walking M shape and N shape groups, respectively.

Figure 3.
Antero-posterior peaks (as a fraction of BW) of ground reaction force in the three gaits (W, walking; R, running; RW, race walking) at increasing speed (m s−1) are shown. “Brake” is braking peak; “prop” represents propulsive peak. M and N refer to race walking M shape and N shape groups, respectively.

Figure 4.
(A) Ground reaction medio-lateral “delta” force (as a fraction of BW), expressed as the peak-to-peak force difference, for the three gaits (W, walking; R, running; RW, race walking) at increasing speed (m s−1) are shown. (B) Peak medial (med) and lateral (lat) force (as a fraction of BW) during race walking at increasing speed (m s−1). M and N refer to race walking M shape and N shape groups, respectively.

Figure 5.
Timing of race walking force peaks (%stance) at the different speeds (m s−1). (A) N shape group. (B) M shape group.
Figure 5.
Timing of race walking force peaks (%stance) at the different speeds (m s−1). (A) N shape group. (B) M shape group.

Figure 6.
3D representation using the Fourier Series of the Body Center of Mass (BCoM) trajectory of walking (1.94 m s−1), race walking and running (2.78 m s−1). The mean contours (in black) have been shifted in the antero-posterior and medio-lateral axes (x and y, respectively) to better appreciate the 2D projection (in grey) on each plane. Black arrows on the contour projections in the XZ plane represent the BCoM dynamic movement along the trajectory, which is counter-clockwise for walking and clockwise for race walking and running. Progression direction is shown by the black arrows on the antero-posterior (x) axis, and the axes thickness is 0.02 m.

© 2019 by the authors. Licensee MDPI, Basel, Switzerland. This article is an open access article distributed under the terms and conditions of the Creative Commons Attribution (CC BY) license (http://creativecommons.org/licenses/by/4.0/).
Share and Cite
MDPI and ACS Style
Pavei, G.; Cazzola, D.; Torre, A.L.; Minetti, A.E. Race Walking Ground Reaction Forces at Increasing Speeds: A Comparison with Walking and Running. Symmetry 2019, 11, 873. https://0-doi-org.brum.beds.ac.uk/10.3390/sym11070873
AMA Style
Pavei G, Cazzola D, Torre AL, Minetti AE. Race Walking Ground Reaction Forces at Increasing Speeds: A Comparison with Walking and Running. Symmetry. 2019; 11(7):873. https://0-doi-org.brum.beds.ac.uk/10.3390/sym11070873
Chicago/Turabian StylePavei, Gaspare, Dario Cazzola, Antonio La Torre, and Alberto E. Minetti. 2019. "Race Walking Ground Reaction Forces at Increasing Speeds: A Comparison with Walking and Running" Symmetry 11, no. 7: 873. https://0-doi-org.brum.beds.ac.uk/10.3390/sym11070873
Note that from the first issue of 2016, this journal uses article numbers instead of page numbers. See further details here.