1. Introduction
Plant diseases have always been a significant concern in agriculture since they cause a reduction in crop quality and consequently, production. The effects of plant diseases range from minor symptoms to the serious damage of entire areas of planted crops, which causes major financial costs and impacts heavily on the agricultural economy [
1], especially in developing countries that depend on a single crop or a few crops.
In order to prevent major losses, various methods have been developed to diagnose disease. Methods established in molecular biology and immunology provide the precise identification of causal agents. However, these methods are unavailable for many farmers and require thorough domain knowledge or a great deal of money and resources to carry out. According to the Food and Agriculture Organization of the United Nations, the majority of the world’s farms are small and operated by families in developing countries. These families produce food for a significant part of the world’s population. Despite this, poverty and food insecurity are not uncommon and access to markets and services is limited [
2]. For the reasons given above, a lot of research has been carried out in an effort to come up with methods that will be accurate enough and accessible for the majority of farmers.
Precision agriculture uses the latest technology to optimize the decision-making process [
3]. Thanks to contemporary digital technologies, a great amount of data are being collected in real-time and various machine learning (ML) algorithms are used to provide optimal decisions, which has led to a minimization in costs. However, this area is still open for improvements, especially in the decision-support systems that help in turning massive amounts of data into useful recommendations.
It has been found that various algorithms and methods such as linear regression, logistic regression, random forest, clustering, Gaussian models, decision trees (DT), Naïve Bayes (NB), K-nearest neighbors (KNN), and support vector machines (SVM) among others, can be used for this purpose. A recent boom in deep learning (DL) methods have also expanded in the agriculture area. Progression in computer vision and artificial intelligence can lead to new solutions. These methods provide more accurate predictions than traditional methods, which enable better decision making. Owing to advances in hardware technology, DL methods are now used for solving complex problems in a reasonably short amount of time. The results of the research in this field are not trivial. DL is already a state-of-the-art technique for land cover classification tasks, and could also prove useful for many other tasks. Various types of deep neural networks (DNNs) have achieved remarkable results in hyperspectral analysis [
4]. Convolutional neural networks (CNNs) have performed well in crop classification tasks [
5], fruit counting, yield prediction [
6], disease detection [
7,
8,
9], and vision tasks in general [
9,
10]. AlexNet [
11] and GoogLeNet [
12] architectures have shown state-of-the-art performance in these experiments [
7,
8,
13,
14,
15]. Additionally, it has been shown that better results are acquired if networks are pre-trained [
13].
In order to obtain superior results in the detection of plant disease, DL methods require a greater amount of data. This is a drawback since currently available datasets are usually small and do not contain enough images, which is a necessity for high-quality decisions. A comprehensive dataset must contain images captured in different conditions, as much as possible. When there is a lack of examples in the training data, and traditional techniques do not improve the results significantly, generative adversarial networks (GANs) [
16] could be used for generating synthetic data. Currently, available solutions with DL methods for plant disease detection have somewhat been successful, however, there is still large room for improvement.
There are several current limitations in this research field. One of them is that currently available datasets do not contain images gathered and labeled from real-life situations. Therefore, training is conducted with images taken in a controlled environment. Another limitation is that currently, the proposed methods cannot detect multiple diseases in one image or cannot detect multiple occurrences of the same diseases in one image. In this paper, several different experiments were conducted in order to emphasize the current method’s limitations for practical usage and to try to overcome those issues by proposing novel strategies.
The main contribution of this paper is three-fold and embodies:
Using the new dataset, which contains a large number of labeled images of leaves captured in real surroundings;
A novel augmentation method based on GANs; and
A novel two-stage algorithm designed to improve plant disease detection in real environment images, which provides fast results, making it adequate for real-time application.
The rest of this paper is organized as follows:
Section 2 contains a brief review of the currently known traditional DL techniques for plant disease detection.
Section 3 contains a series of experiments that cover all of the current methods for plant disease detection while introducing new approaches that significantly improve the current state.
Section 4 represents the conclusions, followed by a list of the literature.
2. Related Work
The manual process of identifying plant diseases (visual inspection) is often time-consuming, labor-intensive, expensive, and subjective, which is one of the major reasons why researchers are exploring alternative methods. Various ML approaches have been proposed to tackle this problem with high accuracy, along with the reduction of costs and subjectivity.
Traditional machine learning algorithms have commonly been used to detect diseases, as shown in [
17,
18,
19,
20,
21]. The authors of [
17] proposed an approach where SVM classifiers were used to distinguish healthy and rice seedlings infected with the Bakanae disease. The authors concluded that the proposed approach was superior compared to conventional naked-eye examination since it was less subjective and less time-consuming. Another study was conducted to minimize the requirement of human intervention, where five types of soybean plant diseases and three types of classifiers were considered: SVM, KNN, and probabilistic neural network [
18]. The authors emphasized the importance of feature extraction and recognized the need for background subtraction and segmentation. The conclusion was the same in [
19]. The authors of [
20] engaged in the detection of aphids in wheat fields and their results showed that color, density, and location greatly affected the detection rate, and that the weather conditions under which the images were taken were also an important factor. KNN, NB, SVM, DT, and recurrent neural network were compared in [
21], and SVM was the best among the five classifiers that were tested. In [
22,
23,
24], the authors used advanced algorithms, which showed that neural networks could take the lead.
Classical ML models have something in common as they are only effective under specific setups [
25]. If there is variation in the conditions, the performance of these algorithms significantly decreases. Thereby, ML algorithms only provide a foundation for further research and a glance of the high potential of more advanced algorithms. Since DL has already demonstrated high possibilities and performance in various areas, these concepts tend to also provide prosperous solutions to agricultural problems [
26].
Ever since its great breakthrough, DL [
27] achieved has state-of-the-art performance, especially in the following domains: automatic game playing [
28], natural language processing [
29], autonomous vehicles [
30], and much more. Diversity of applications and the remarkable results of studies regarding DL have encouraged researchers to also apply it in the agricultural field. Thereafter, many papers on applying DL techniques for plant disease detection have been published, and some of these [
7,
8,
31,
32,
33,
34,
35,
36,
37,
38,
39,
40,
41,
42,
43] are presented below.
In [
31], banana images from a PlantVillage dataset [
44] were used to detect two common diseases. There was a total count of 3700 images, which were resized to 60 × 60 pixels, and the experiment was conducted on colored images as well as on grayscale. The model was based on LeNet architecture [
32] and after various trainings on different proportions of the train and test split, it achieved an accuracy of 92–99%. However, it was noticeable that the conversion to grayscale significantly diminished those results since diseases are often recognizable by color deviation. The authors recognized the need for taking images in real scene conditions and highlighted that disease localization was an important step in the process. Another study was conducted addressing the same issue [
8], though the experiment included testing five different CNN architectures: AlexNet, AlexNetOWTBn, GoogLeNet, OverFeat, and VGG, where the last one achieved the highest accuracy of 99.53% for 58 distinct classes. As opposed to the usual procedure, the authors avoided the segmentation on behalf of using CNN. However, an important fact is that the training and testing set was part of the same dataset, and if the sources were different, the results would not be as good.
A similar approach represented in [
7] was based on 1053 images of apple leaves, followed by generating 13,689 synthetic images by preprocessing. The experiment included testing SVM, a back propagation neural network (BP NN), and five CNN architectures like AlexNet, GoogLeNet, ResNet-20, and VGGNet-16. The modified AlexNet attained the best result of a 97.62% accuracy of detecting four common types of apple leaf diseases. The focus of this work was on preprocessing the images in a way that would simulate the real environment and develop an improved CNN with an efficient use of computational resources. As for future work, the authors suggested using faster region-based convolutional neural network (Faster R-CNN), the You Only Look Once object detection algorithm (YOLO), and single shot detector (SSD) algorithms for disease detection and pointed out the need for the expansion of the dataset.
The experiment described in [
33] aimed to overcome the known limitations of in-placing images with different illumination conditions, a complex background, and location of the disease, although a different approach was used on a different dataset. In order to create a detector for tomato diseases and pest recognition, the authors collected 5000 images of tomato leaves. Due to geometrical and intensity transformations of the images, the dataset was increased to have 43,398 examples. Three different algorithms were used in the experiment: Faster R-CNN, Region-based Fully Convolutional Network (R-FCN), and SSD. Each of them was combined with VGG net and ResNet deep feature extractors. As a result, the created system could recognize nine different types of diseases and pests with an average accuracy of 85.98%, even if the dataset contained challenging images with multiple diseases on the same leaf and different infection status. This model was constituted of R-FCN and ResNet-50. The authors also highlighted the impact of data augmentation on the final results and a shortcoming, the low number of diseases and crop species.
Exhaustive surveys have been conducted [
25,
33,
35] where the limitations of current methods for plant disease detection are summed up. Each of them listed the following challenges:
data scarcity
using images acquired in real conditions
more accurate classification of the disease
disease stage identification
The complex background is another issue that should be considered when creating the dataset. Authors of [
35] proposed segmentation as a first step in the process, and a solution to another problem: multiple disease infection on the same plant. Computational complexity and memory requirements also deserve special attention [
34].
The authors of [
25] split identified factors that impacted the results on the extrinsic and intrinsic. In addition to the above-mentioned, it was noted that in most experiments, the same datasets were used for training and testing, which lowered the confidence in the overall findings. Another problem was that the dataset often did not represent the symptom variety. Authors have also proposed solutions to some of these problems. Transfer learning and augmentation techniques can help in obtaining a dataset that is large and diverse enough. They state that it is still a challenging task to detect simultaneous disorders and to capture images in all of the possible conditions. However, they highlight that it is unrealistic to expect that an automatic disease recognition system can achieve perfect accuracy when used in field conditions.
If there is an insufficient amount of data, transfer learning may be useful [
13,
14,
15,
25,
36,
37,
38,
39,
45]. Authors of [
36] proved that this method could be useful by training a modified LeNet on the PlantVillage dataset and then on the dataset they collected. This paper aimed to build a system that would detect olive quick decline syndrome, which was done with an accuracy of 98.6 ± 1.47%. However, it should be taken into account that the experiment included clipping leaves and not images of olive leaves in real surroundings. One of the first papers that showed the applicability of DL on plant disease detection [
37] used a dataset that contained over 3000 images collected from Internet resources. Modified CaffeNet was pre-trained on an ImageNet dataset [
45] and used as a classifier with an overall accuracy of 96.3% in detecting 13 different types of diseases. It has been shown that augmentation and pre-training of the network are of great importance. The authors suggested that results could be improved by database enrichment. Transfer learning was part of the experiment described in [
38], where it was applied after preprocessing and augmentation of the images from the PlantVillage dataset. Here, six state-of-the-art architectures (AlexNet, DenseNet-169, Inception v3, ResNet-34, SqueezeNet-1.1, and VGG13) and three different training strategies were compared. All of the CNN architectures obtained an accuracy of over 99.2% when using a “deep” strategy. Using a saliency map as a visualization method had a great impact on verifying the learned features. The PlantVillage dataset was used in [
13], where it was shown (after experiments with a different setup) that pre-trained GoogLeNet achieved impressive results (99.35%). The authors emphasized the limitations of this approach: all images contained leaves facing up, on a homogeneous background, and the training and testing were done on the same dataset. A recent paper [
14] on plant disease identification showed that even if the dataset had a fairly low number of samples, if it is representative in qualitative terms, it could be used for the training of a deep neural network. In this experiment, the focus was on segmenting individual lesions and spots on 1567 captured images, 60% of which were captured under controlled conditions and 40% under real field conditions. This led to a total count of 46,409 images, which increased the diversity of the dataset and provided the possibility of identifying multiple diseases on the same leaf. After segmentation and blacking out of the background, transfer learning was applied to a pre-trained GoogLeNet CNN architecture. This model obtained accuracies that varied from 75 to 100%, depending on the crop species. Despite low accuracy for some classes, the authors emphasized that segmentation and background removal had a great impact on the results and should be incorporated into the model.
Multiple efforts have been made to overcome the problem of data scarcity. Researchers have implemented various methods to make more images based on the available dataset. The common way to do this is a transformation of the image. For example, the image can be rotated, cropped, scaled, gray-scaled, or mirrored [
7,
14,
33]. Still, these transformations may not contribute enough to the improvement of results. If commonly used procedures do not yield satisfactory results, creating artificial images can help. Some authors have proposed using different GAN models (Deep Convolutional GAN (DCGAN), cycle-consistent GAN, and conditional GAN) for image augmentation and overcoming the problem of a limited number of images in available datasets. In [
40] CNN was used for classification, deployed in a smartphone application. Inception V3 and MobileNet were tested and obtained an accuracy of 88.3% and 92%, respectively. Preprocessing was done in order to reduce the size of the dataset and eliminate noise (segmentation or cropping the image) and DCGAN was used for image augmentation to deal with the limited number of available images. Other papers [
41,
42,
43] have demonstrated the ability of GAN to generate realistic images of a given dataset.
Another approach used for plant disease detection is the use of genetic algorithms (GA) to automatically select the parameters of the SVM. Authors of the proposed GA-SVM method for plant leaf disease recognition achieved an accuracy of 98.14% [
46]. Plant disease detection using DL was based on different image features. Particle swarm optimization (PSO) can be used to extract these features. Revathi et. al. in their research used PSO to extract color feature variance, shape, and texture feature variance for the identification of cotton diseases [
47].
Table 1 contains a summary of different DL methods for plant disease classification, while
Table 2 contains the limitations of different DL methods for plant disease classification.
Although the authors surmounted the problems above-mentioned to some extent, there is still room for enhancement. Most of these studies have focused on improving the accuracy of classification. Even though the majority of models achieved extremely high accuracy, one must bear in mind that the percentage drastically falls when tested on a dataset that is not part of the same database. As is evident from the table, this is still one of the unresolved issues. Furthermore, there is a significant lack of examples in all of the experiments. Currently, the available datasets are not diverse enough, which may affect the quality of training the network and the ability to classify correctly. Additionally, some models were tested only on a single or little species. Moreover, only a minority of the experiments included images with complex backgrounds, and only some were able to detect multiple diseases in a single leaf.
Extensive research has shown no evidence of a paper where all of these issues were addressed. Based on our previous work [
37,
38] and motivated by the current limitations of the available plant disease detection models, a novel two-stage network algorithm is proposed, which combines advanced techniques in an effort to accurately identify plant diseases in complex backgrounds and in various conditions. In the following section, the dataset, model, and the experiments are explained in detail.
3. Methodology and Experiments
In order to address the present limitations and overcome the issues in current plant disease detection approaches, the entire process of the proposed approach is described in this section along with the series of experiments addressing current issues in plant disease detection tasks. The proposed method focuses on several important stages of developing a plant disease detection model including the introduction of a new dataset and augmentation methods, analyzing different classification and object detection algorithms, while proposing a novel approach for plant disease detection.
3.1. Datasets
One of the crucial drawbacks of the present study in the area of plant disease detection is a major drop in classification performance [
25,
34,
35] of the models on real images taken in fields compared to the images from a controlled environment. The reason for this is that there is a lack of large public datasets of plant diseases and most of the present achievements are based on the PlantVillage dataset [
44]. PlantVillage consists of 54,323 images divided into 38 classes of diseased and healthy plants based on 14 different crop species; it is available online from the crowd-sourced platform Kaggle [
48] (
Supplementary Materials). All images are taken as a single leaf on a solid background labeled only by a class name. Due to this, PlantVillage is used as a performance metric in many papers, which can be sometimes misleading when used in real on-field data, taking into account the purity of the dataset. The impact of the controlled environment is analyzed in more detail in
Section 3.3.
In this paper, object detection algorithms were explored in the plant disease detection task. Due to this, the PlantVillage dataset was additionally labeled generating metadata holding two types of bounding boxes, one marking the entire leaf and the second one marking only the infected areas. All additional labeling was performed and verified by agricultural experts.
In order to adapt the plant disease detection model for more practical usage, a new dataset was introduced, the PlantDisease dataset. This dataset is a continuation of the author’s previous work [
38]. New images of healthy and diseased leaves have been taken in fields under various weather conditions and at numerous angles during different daylight intensity. Alongside this, all images have an inconsistent background, meaning that sometimes a single leaf is in focus, and sometimes images hold many leaves of different crops whether they are healthy or infected with different diseases. This way, the dataset consists of images that mimic practical situations where the model could be potentially used. All images from the dataset were manually labeled and verified by agricultural experts.
Table 3 presents the image classes and the number of objects per class.
Based on the authors’ current knowledge, this is the largest labeled dataset of plants leaves with nearly eighty thousand images of 12 different species and 42 different classes (both healthy and diseased).
3.2. Augmentation
In order to overcome issues like overfitting, DL algorithms often rely on big datasets. This presents a general obstacle when training algorithms for wider practical usage. Gathering data can be a time-consuming process, which could also require having domain experts for the labeling tasks. In order to enlarge the existing datasets, augmentation techniques are a common approach.
In this paper, two augmentation strategies were used. The first included traditional augmentation methods widely applied in many plant disease detection studies [
7,
8,
13,
14,
33,
36]. Most of these methods include simple transformations such as rotations or pixel-wise changes like blurring or noising in order to introduce distortion to images. In this research, rotations by various angles, affine, and perspective transformations along with size preserving shearing, shifting, and mirroring were applied to the training dataset.
The second approach included training GANs [
16] responsible for generating syntactic data based on the existing dataset. A plain GAN architecture consisting of two neural networks was used as a participant of the competing game, where the discriminator tries to determine whether the data is real or fake, while the generator tries to create the data with all of the required features to trick the discriminator into thinking that the data are real. By applying this approach, a dedicated GAN could generate novel images that could be used in the training phase of a plant disease classifier.
This type of network has proven more successful on different benchmarks than the Variational Auto Encoders (VAEs), Restricted Boltzmann Machines, etc. Over the years, many new GAN architectures have been introduced. In this paper, several architectures were applied to explore the possibility of using syntactic data to train the plant disease classifier.
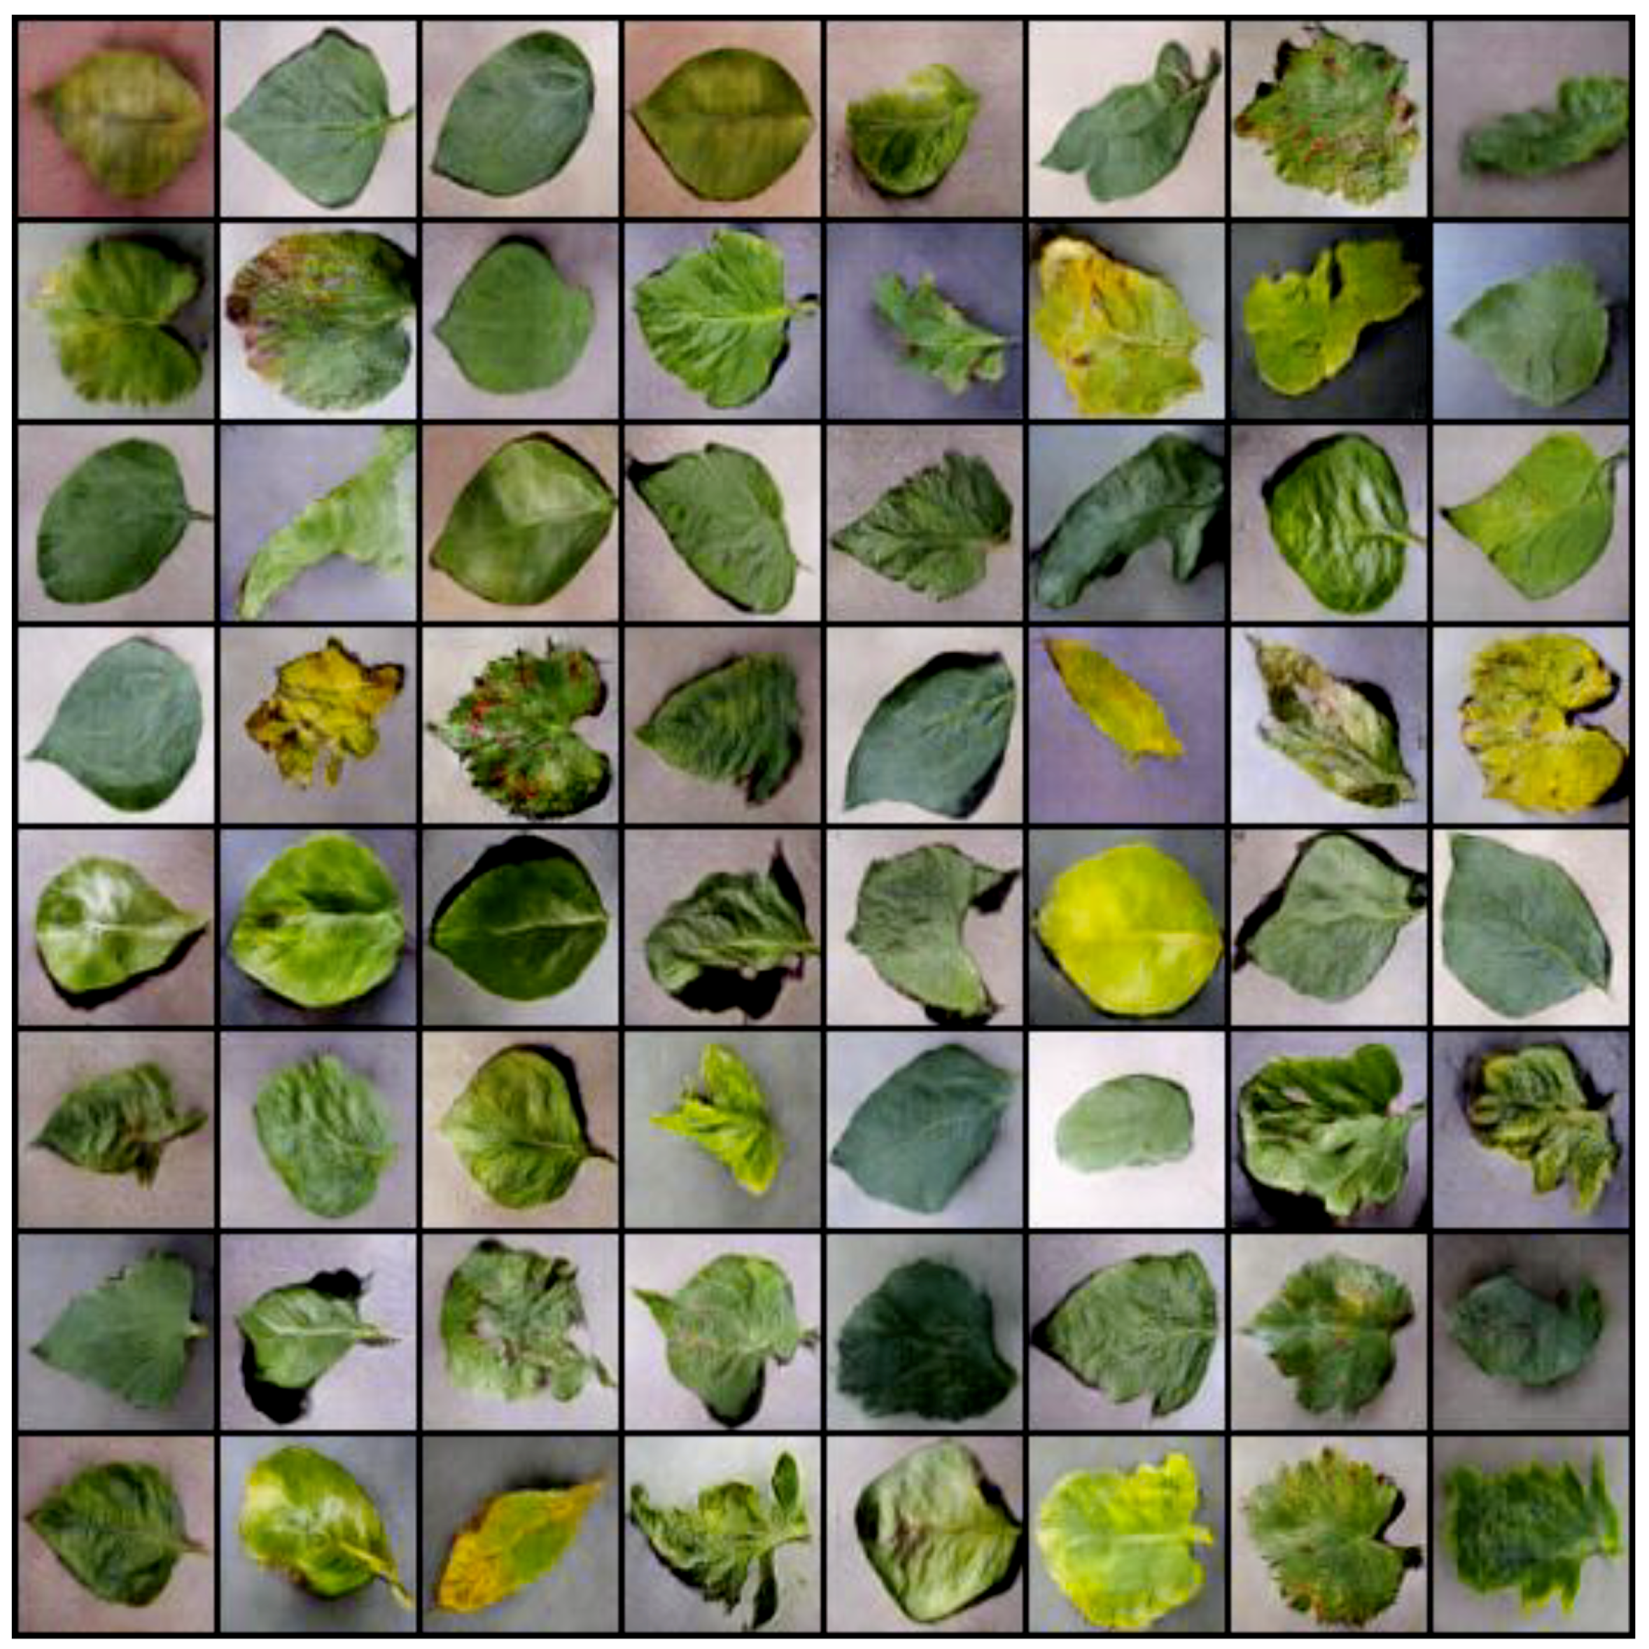
Due to its simplicity in design (5-layer discriminator/generator), DCGAN [
49] was used as a proof of concept whether the syntactic data could have features like color, shape, and texture like the real plant leaves. Based on
Figure 1, it can be observed that the syntactic data are displaying the desired features.
DCGAN architecture is designed for generating 64 × 64 images, while training for higher resolutions is highly unstable as one network becomes stronger than the other, which prevents the learning process.
In order to use this syntactic data in the training phase, higher resolution images must be generated as most of the state-of-the-art convolutional neural networks are designed for input image sizes around 256 × 256. For this reason, Progressively Growing GAN (ProGAN) [
50] was used to generate plant leaves at a 256 × 256 size. ProGAN starts by creating a tiny image of 4 × 4 or 8 × 8 pixels until the image is considered realistic by the discriminator. When the initial learning process is complete, ProGAN adds higher-resolution layers that are the next to be trained. This process continues until 1024 × 1024 pixels (or lower dimensions based on the number of layers) is trained. Although the network was stable during the training phase for the plant leaf images, it did not manage to generate images with a rich set of features that could represent the plant leaves well enough.
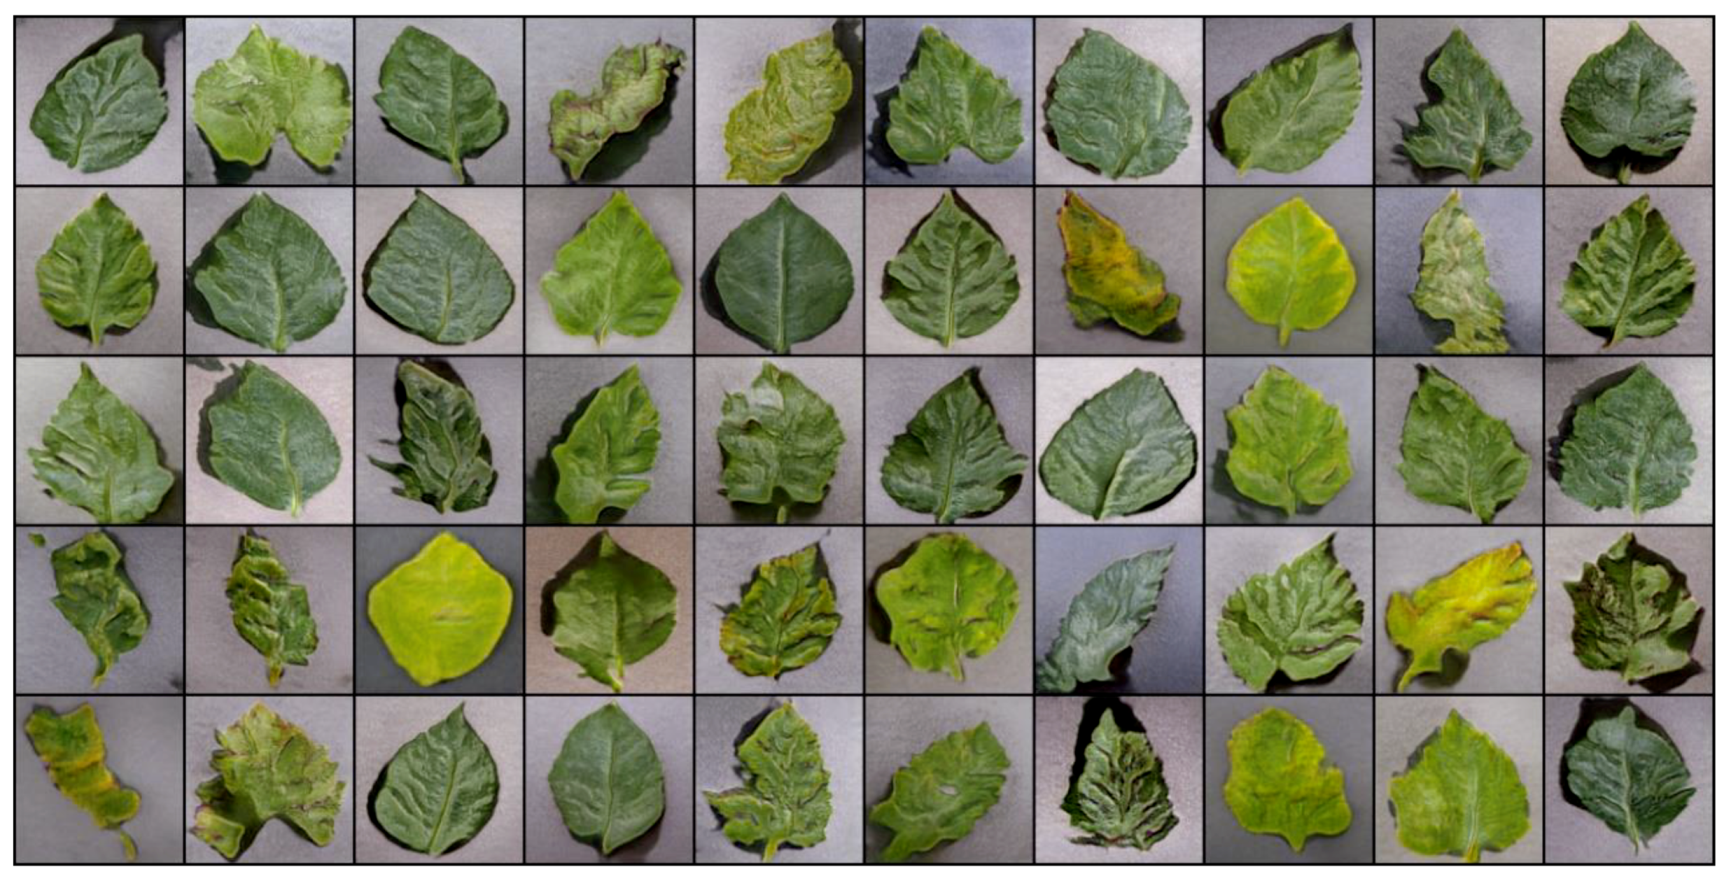
The architecture that most successfully generated plant leaf images in higher dimensions (256 × 256 used in the experiment) was Style GAN [
51], a new design that combines ProGAN and neural style transfer [
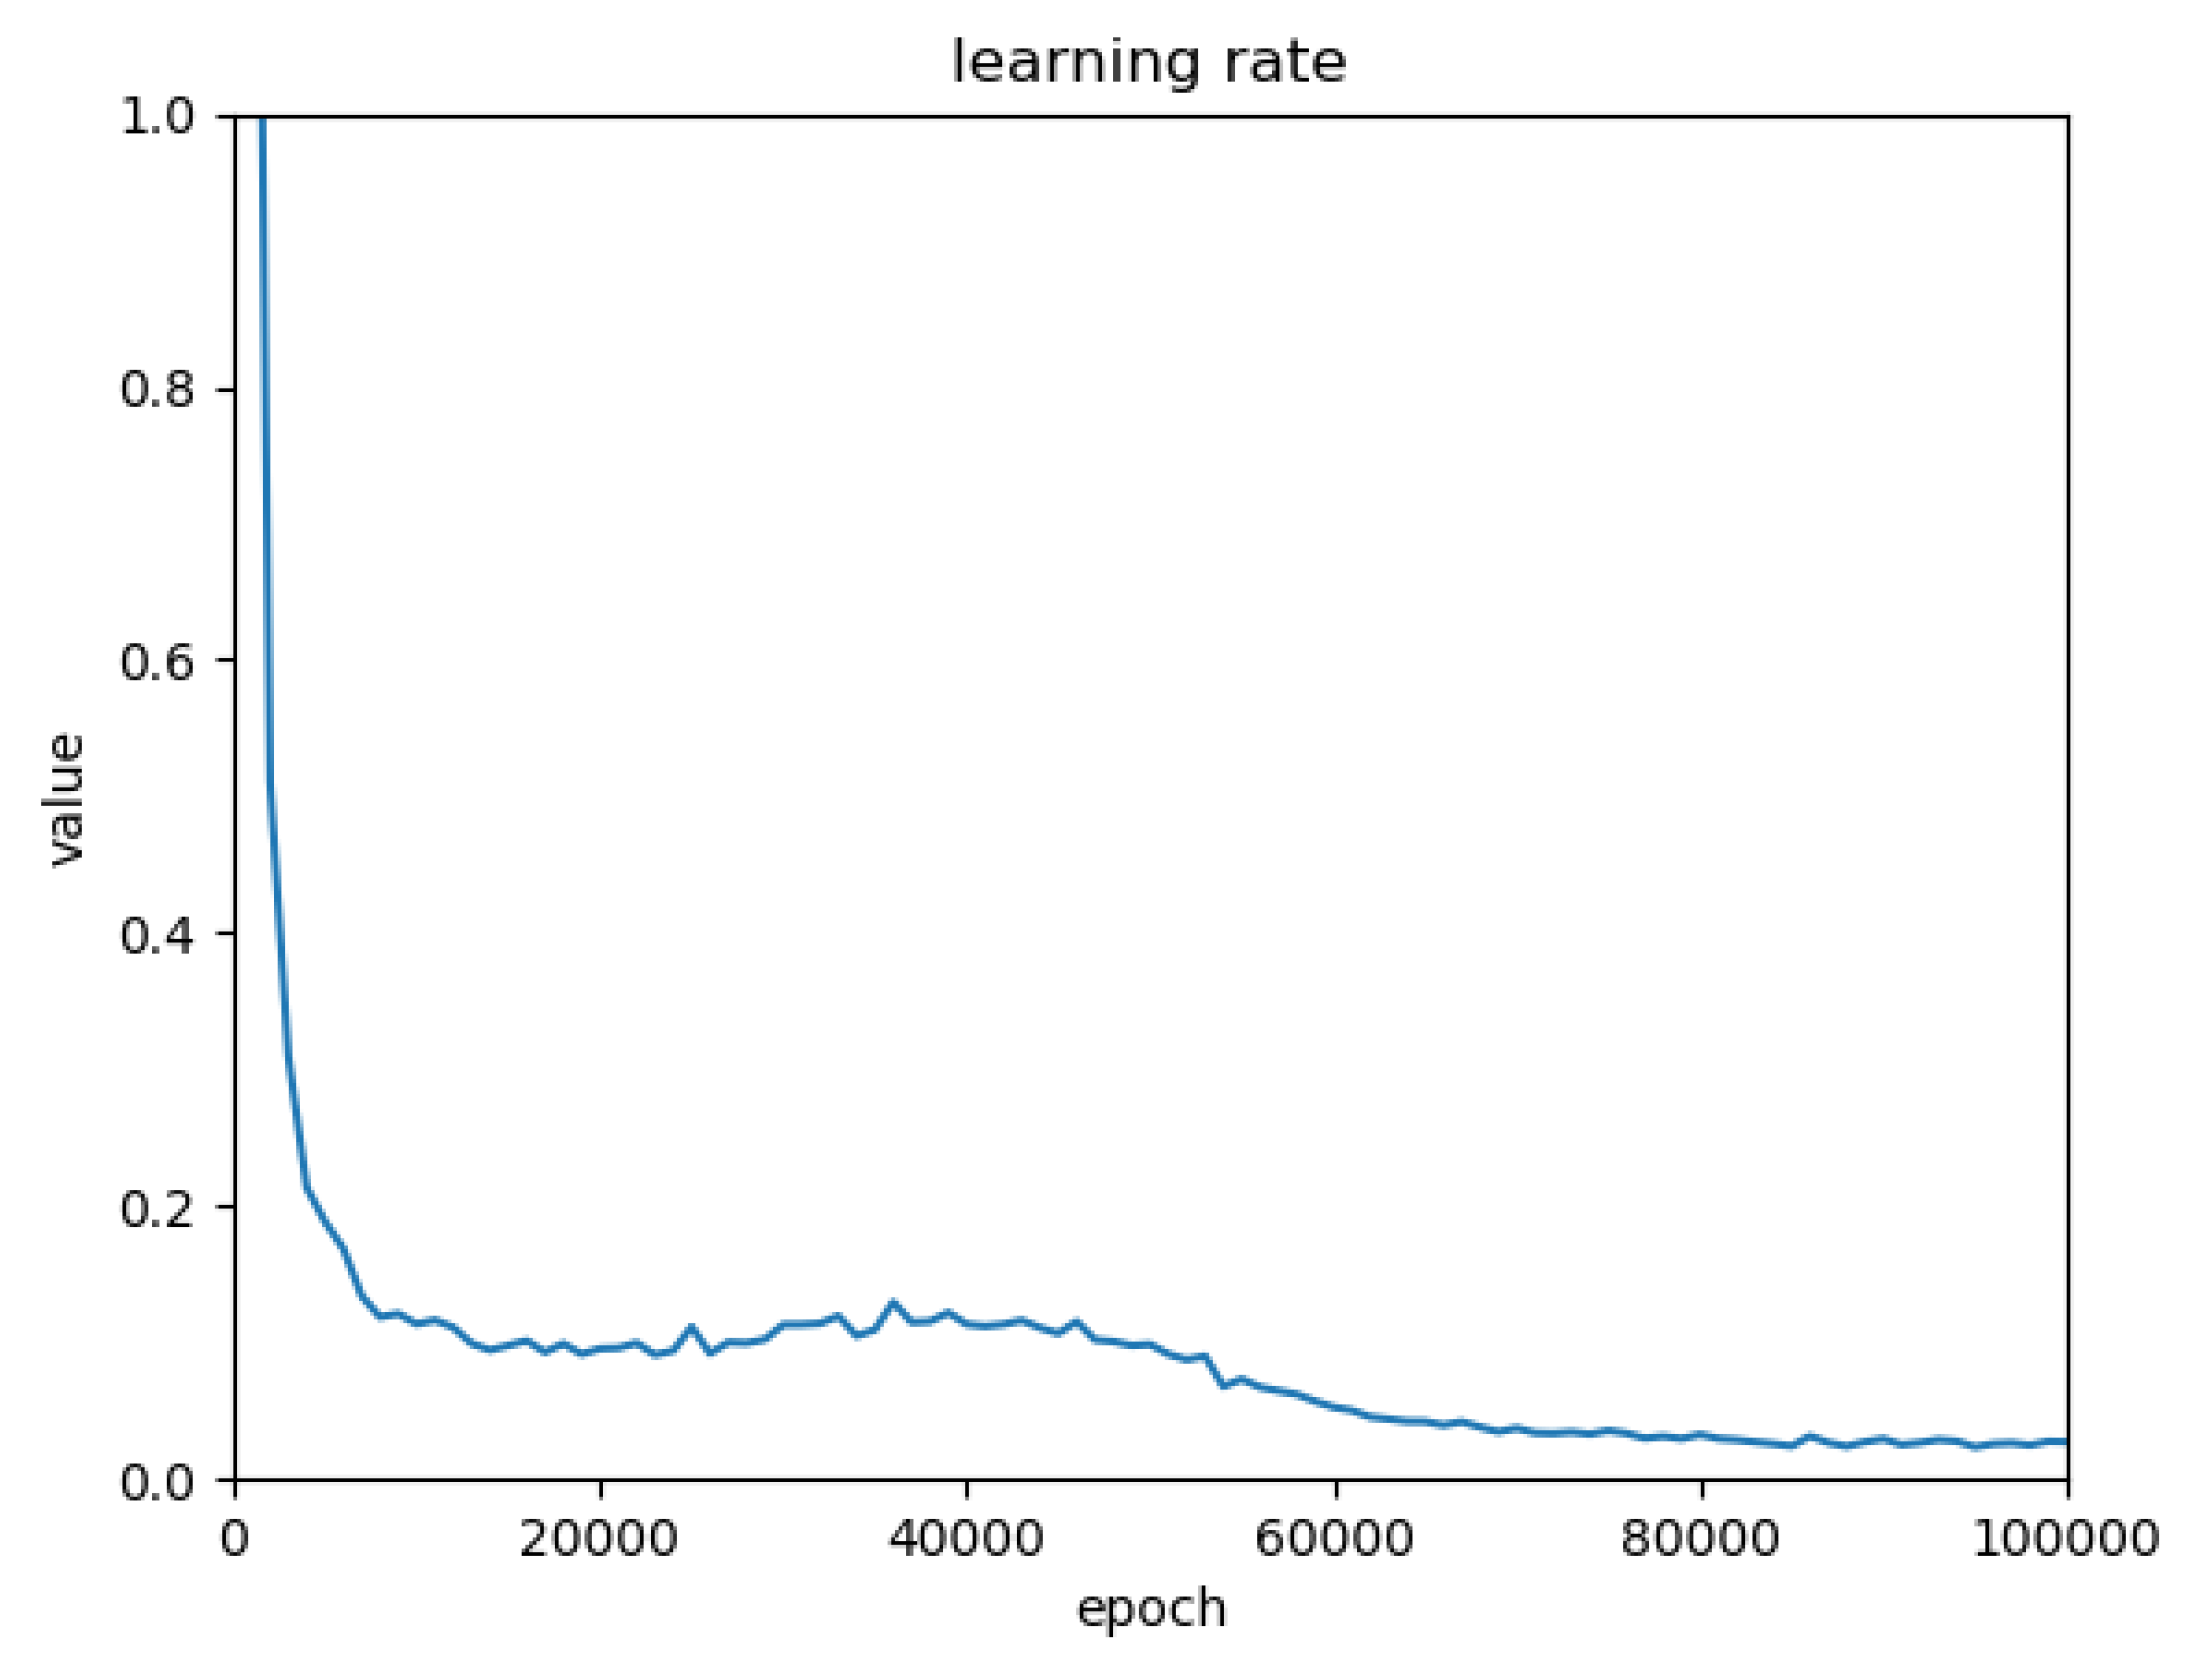
52]. The original architecture was adopted to generate the desired input dimension of 256 × 256. This was achieved by adding a styled convolutional block of 128 × 64 × 3, following a 64 × 3 convolutional block as the last layer to the generator network, and a 64 × 128 × 3 convolutional block following a 3 × 64 convolution as the first layer of the discriminator network. To train Style GAN on the entire PlantVillage dataset for generating novel plant leaves, the following parameters were used: a learning rate of 3 ×
, a minibatch size of 5, and an AMSGrad optimizer [
53]. The learning curve is displayed in
Figure 2.
Generated plant leaves images by Style GAN are displayed in
Figure 3.
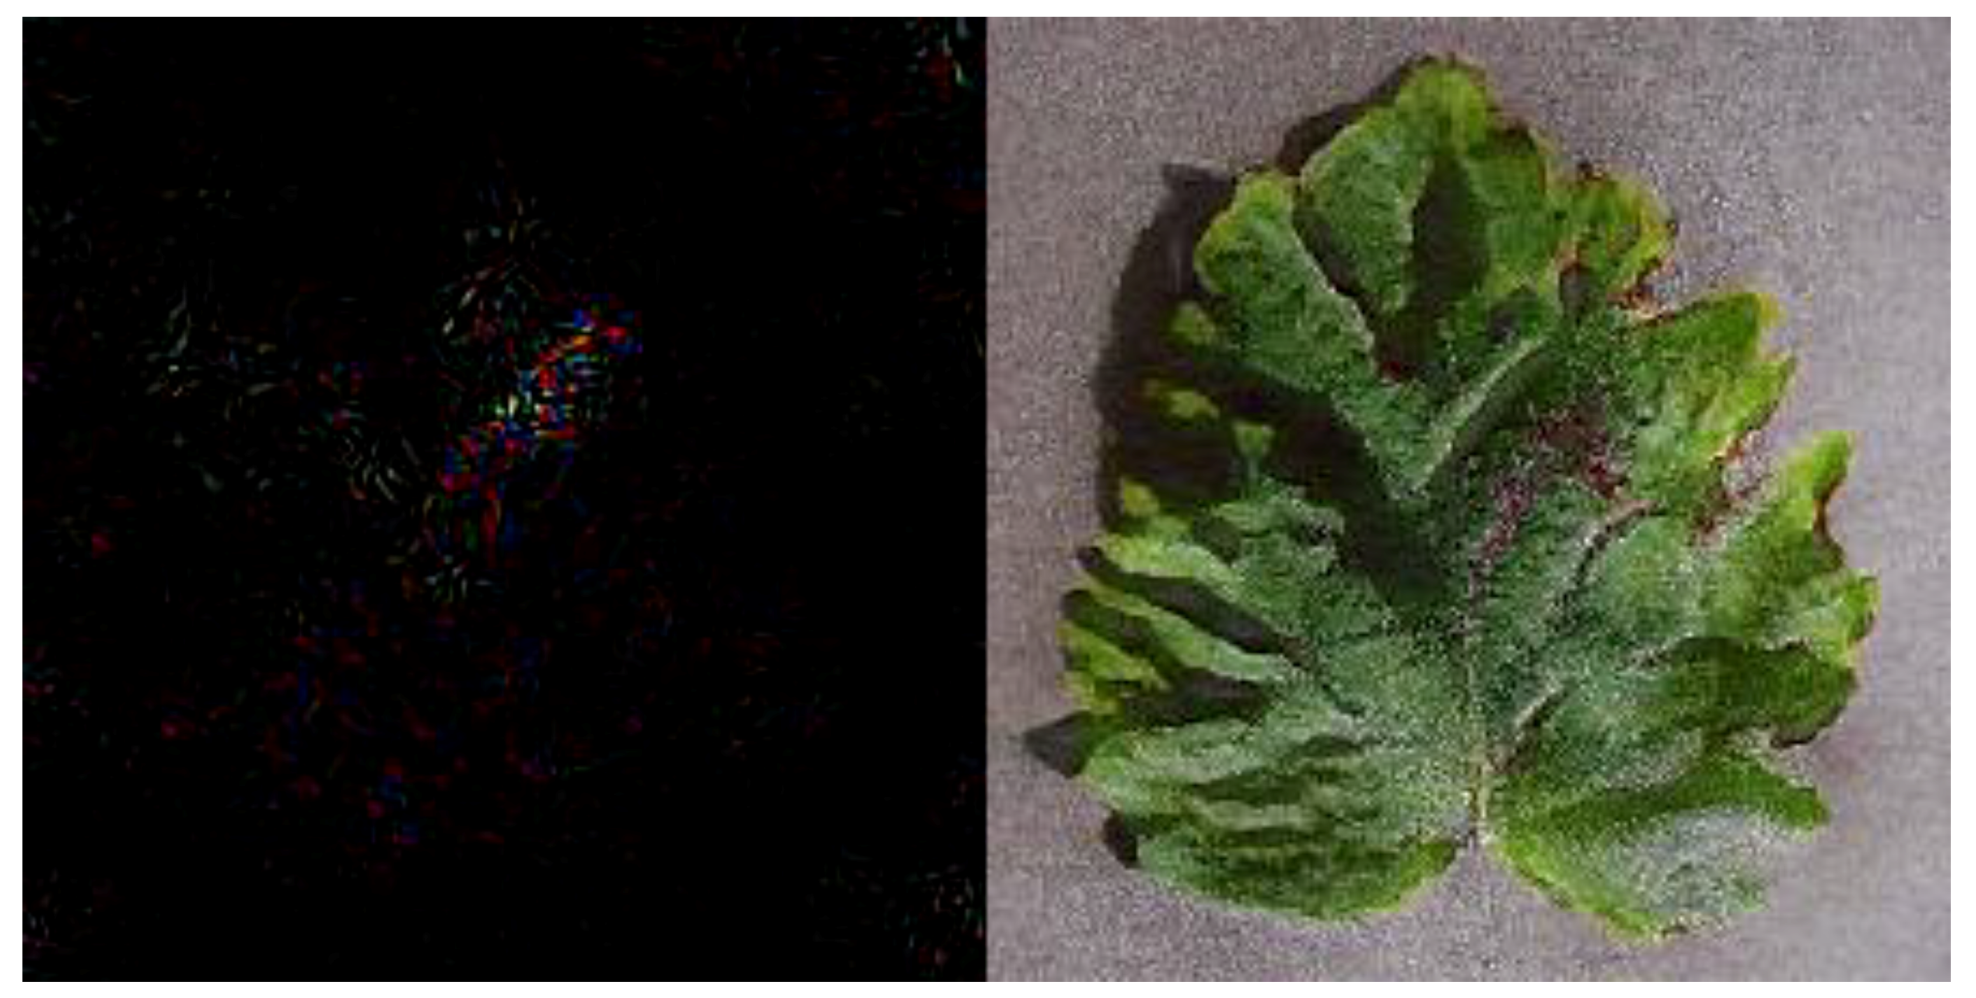
In order to explore the learned features of the trained Style GAN, the guided backpropagation technique, introduced in [
54] was used. This method uses a simple backward pass of the activation of a single neuron after a forward pass through the network to visualize the part of an image that mostly activates a certain neuron. Visualization of the generated image is displayed in
Figure 4.
Based on
Figure 4, it can be observed that Style GAN has learnt significant features representing the diseased areas.
Note that the same GAN architectures were applied to the PlantDisease dataset, but the trained models were highly affected via the background features and the generated images could not distinguish the leaves and their structure from the background. Developing such GAN-based models for generating plant leaves with complex backgrounds was out of the scope of this paper, but could be of great significance for further research.
3.3. Impact of the Controlled Environment
Plant disease detection models could have practical usage where they could be part of a decision support system applied on fields by experts or hobbyists. In order to do this, developed models should perform well on leaf images taken in various real-life conditions.
In this section, the effect of training data variance on the final classification model’s performance against the new set of data (collected in the field, under different conditions) is explored. Along with this, the impact of the proposed augmentation process with GAN syntactic data was also analyzed. For this purpose, several experiments were conducted.
The first experiment tested the model’s performance on images from real-life conditions, trained only on images taken in a controlled environment. For that purpose, several state-of-the-art CNN algorithms were trained on the PlantVillage dataset and tested on the PlantDisease dataset. In this experiment, only 18 classes from the PlantVillage dataset were used as those classes are also supported by the PlantDisease dataset (marked classes from
Table 3. The PlantVillage (18 classes, 18,334 images) dataset was split into a 80–20 training and validation ratio. The training was performed on original and augmented images using only the standard augmentation strategy, which is listed in
Section 3.2. In this way, the impact of the GAN augmentation strategy could be observed in later experiments.
A deep transfer learning strategy was used as a training method, as in the previous author’s work in [
38], it showed the best accuracy results on the PlantVillage dataset. Deep transfer learning included fine-tuning all the network layers while initiating backpropagation optimization from the pre-trained networks. The Adam optimizer was used with different learning rates (0.0008, 0.001, 0.002, and 0.003). The exponential decay rate for the first moment was 0.9 and was 0.999 for the second moment, while the epsilon parameter was fine-tuned with different values depending on the CNN algorithm (
,
, 0.1, 1).
Table 4 displays the top 1 accuracy results from the validation and test phase.
The second approach included the same CNN architecture and hyperparameter values, but images from the PlantDisease dataset were also put into the training, validation, and test set. In this way, the training and validation sets consisted of images from both datasets. As in the first experiment, only the standard augmentation process was applied.
Table 5 displays the top 1 results from the validation and test phase of the second experiment.
The third experiment included only a slight change in the training dataset by adding novel images generated by the Style GAN network as described in
Section 3.2. Nearly 5000 images were added to the training set (the number of images varied from 100 to 300 per class, while the dataset class balance was taken into consideration).
Table 6 displays the top 1 results with the GAN augmentation strategy included in the training phase.
Based on the results from
Table 3, a drastic drop in the model’s performance on the test images could be observed. The unavailability of models to overcome issues like backgrounds with multiple leaves and different surroundings, various angles, and lightnings, and not focus on a single leaf and other real-life conditions could come from the fact that the algorithms were trained on a small sub-set of the nonlinear space. Introducing these types of images taken in real-life conditions during the training phase of the models could potentially stimulate algorithms to learn features that were not exposed in images taken in the controlled environment.
Table 4 clearly displays the improvement in the model’s performance on test images when introducing more data than are usually seen in practice.
In addition, it can be observed from
Table 4 that the worst results were obtained when the model was trained on the PlantVillage dataset and tested on the PlantDisease dataset. This represents the current limitation in this research field; the images used for training were created in a controlled environment and when tested on images from real-life conditions, the results were poor. However, as can be observed from
Table 6, when the model was trained using both the PlantVillage and PlantDisease dataset containing images from the real-life conditions and images generated with GANs, the results were better, and this is the way that research should proceed further in this field.
Along with the standard augmentation methods widely used in many research papers, a novel augmentation approach was tested in the third experiment. Based on
Table 6, GAN’s synthetic data added in the training phase slightly improved the model’s accuracy (both on the validation and test sets). Taking into consideration that collecting data is time-consuming, along with the fact that in most cases deep classification models can suffer overfitting when having smaller datasets, GAN’s augmentation method could be used as a powerful tool in such situations.
Even when introducing a new collection of original data more suitable to real-life usage along with the application of several augmentation methods in such a way as to have images mimicking different conditions, but also having novel data generated with GANs, there are still huge limitations in using this classification method.
3.4. Object Detection
Deep neural network-based object detection algorithms were explored as a solution for successful plant disease detection methods in situations including multiple leaves on the image where they could be from different plant species along with different classes, whether they are diseased or healthy or dealing with images with complex backgrounds.
Two different types of algorithms were included in this experiment: one-stage and two-stage detectors. The main difference between these two strategies is that two-stage detectors primarily find candidates for object locations at the first stage by using various region proposal approaches which narrow down the final number of location candidates and then perform classification on each candidate object location.
Several state-of-the-art architectures for both types of object detection approaches (one-stage and two-stage) that showed the best results on the COCO dataset [
55] were used on the PlantDisease dataset, which was split to 70% for training, 20% for validation, and 10% for the test set. Faster R-CNNs were trained on batch sizes of 32, using stochastic gradient descent (SGD) with the momentum set at 0.9. The learning rate started at 0.001 and then decreased to 0.0001 after 35,000 iterations. YOLOv3 was trained with batch sizes of 64, with the momentum set to 0.9 and learning rate of 0.001 for the first 15,000 iterations and then set to 0.0001. SSD was trained on the batch sizes of 16 using the Adam optimizer with a learning rate of 0.004 for the first 10,000 iterations, which were decreased to 0.0004 after that. For the RetinaNet, batches of 32 were used, and trained with the weight decay of 0.0001 and momentum of 0.9. For the first 20,000 iterations, the learning rate was 0.02, which was set to 0.002 afterward.
Table 7 displays the results of the object detection models on the test set.
As a performance metric, mean average precision (mAP) was used as it was chosen by most of the research papers as a standard metric in object detection problems. The intersection over union (IoU) used on these experiments was 0.5. IoU is a common approach to determine whether the object proposal is right and takes the X as the set of proposed object pixels and Y as the set of the true object pixels:
where the average precision (AP) for class k is:
then mAP is calculated as:
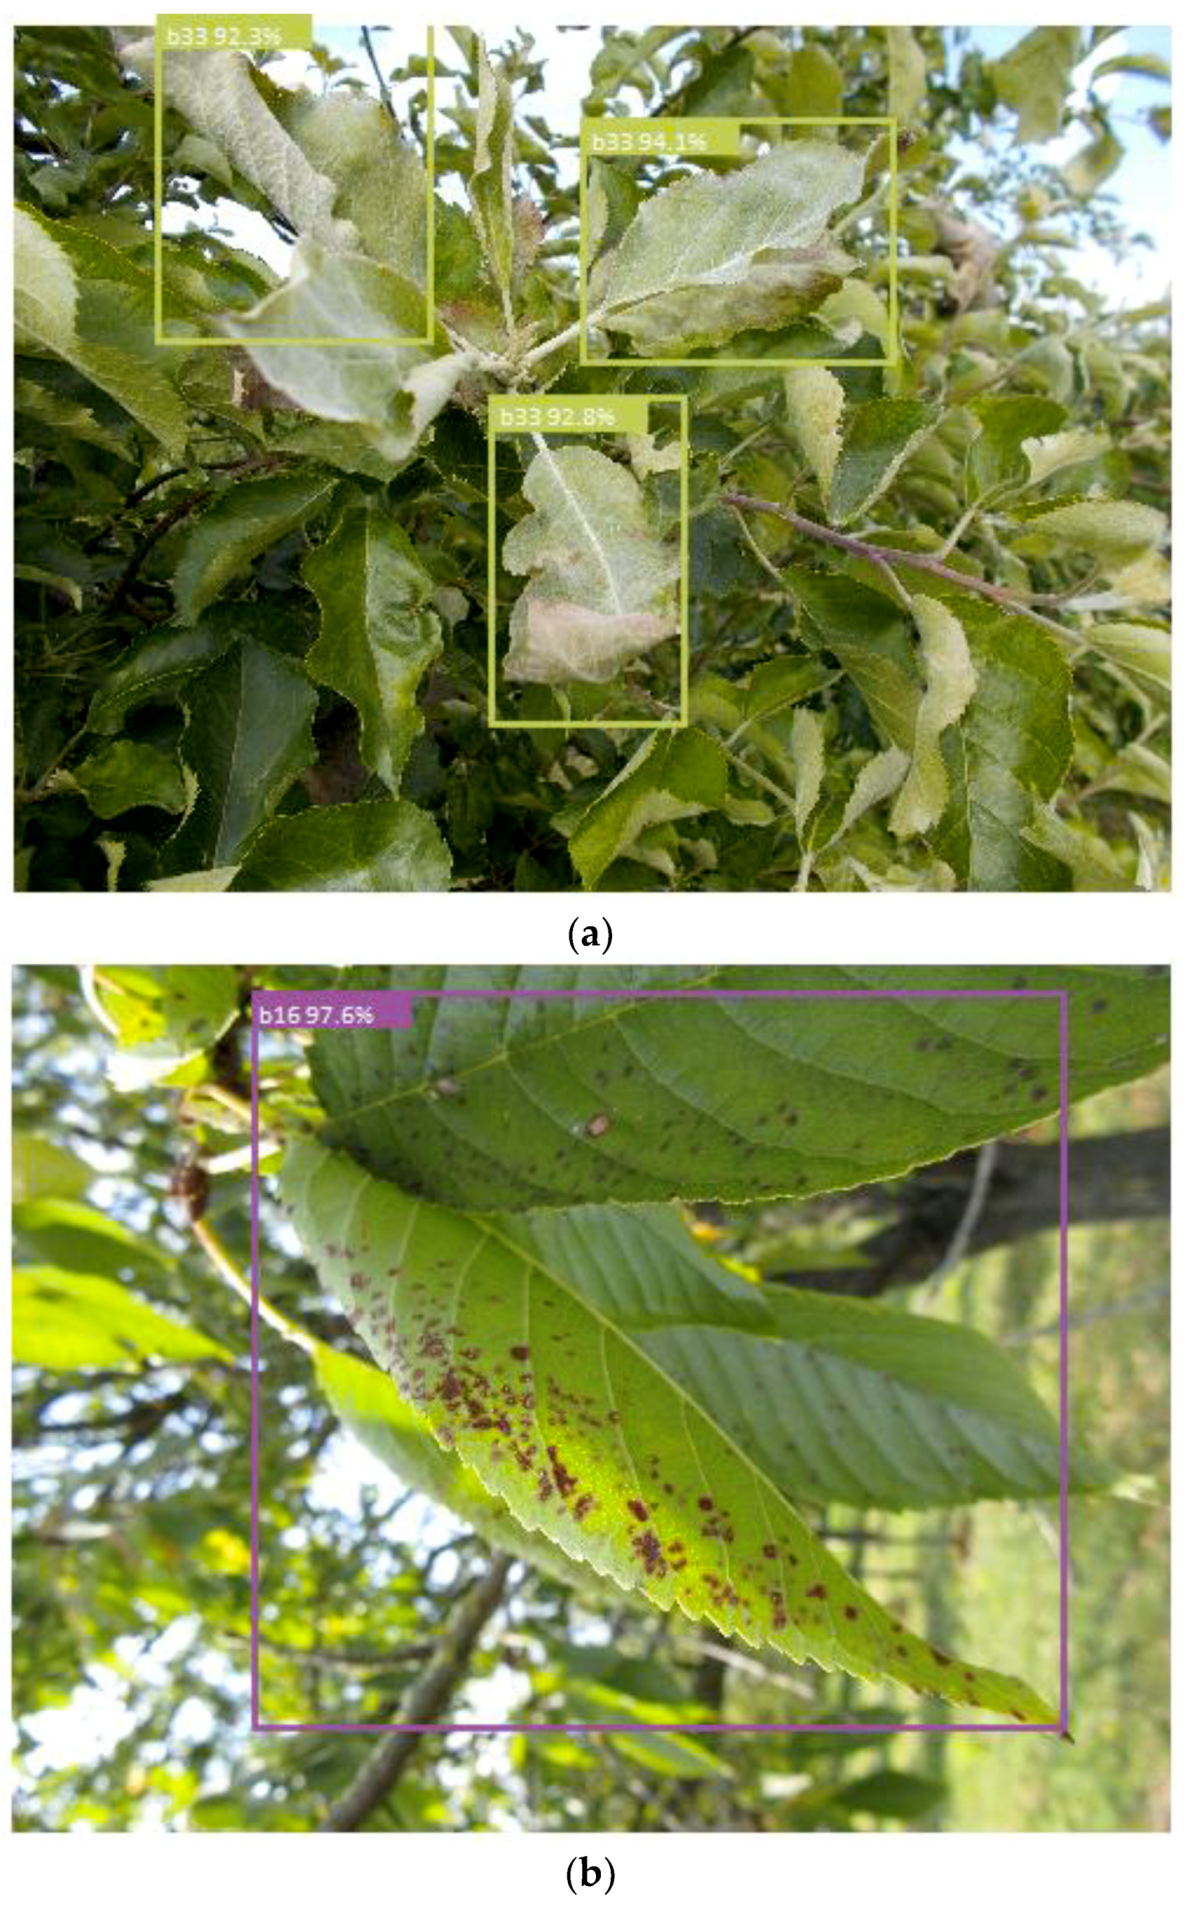
Based on the experimental results displayed in
Table 7, it can be observed that the two-stage methods showed better performance on the PlantDisease dataset. In general, two-stage methods reach higher accuracy rates than one-stage methods due to their design, but they are significantly slower [
62]. Faster R-CNN with top-down modulation out-performed other strategies on the PlantDisease dataset. Examples of detection are displayed in
Figure 5.
Observing the experimental test results, the detection strategies were better suited for complex backgrounds and were also able to detect the diseased regions with good precision.
3.5. PlantDiseaseNet Architecture
Based on the results and conclusions for the experiments discussed in previous sections, PlantDiseaseNet, a novel architecture focused on real environment plant disease classification, was proposed.
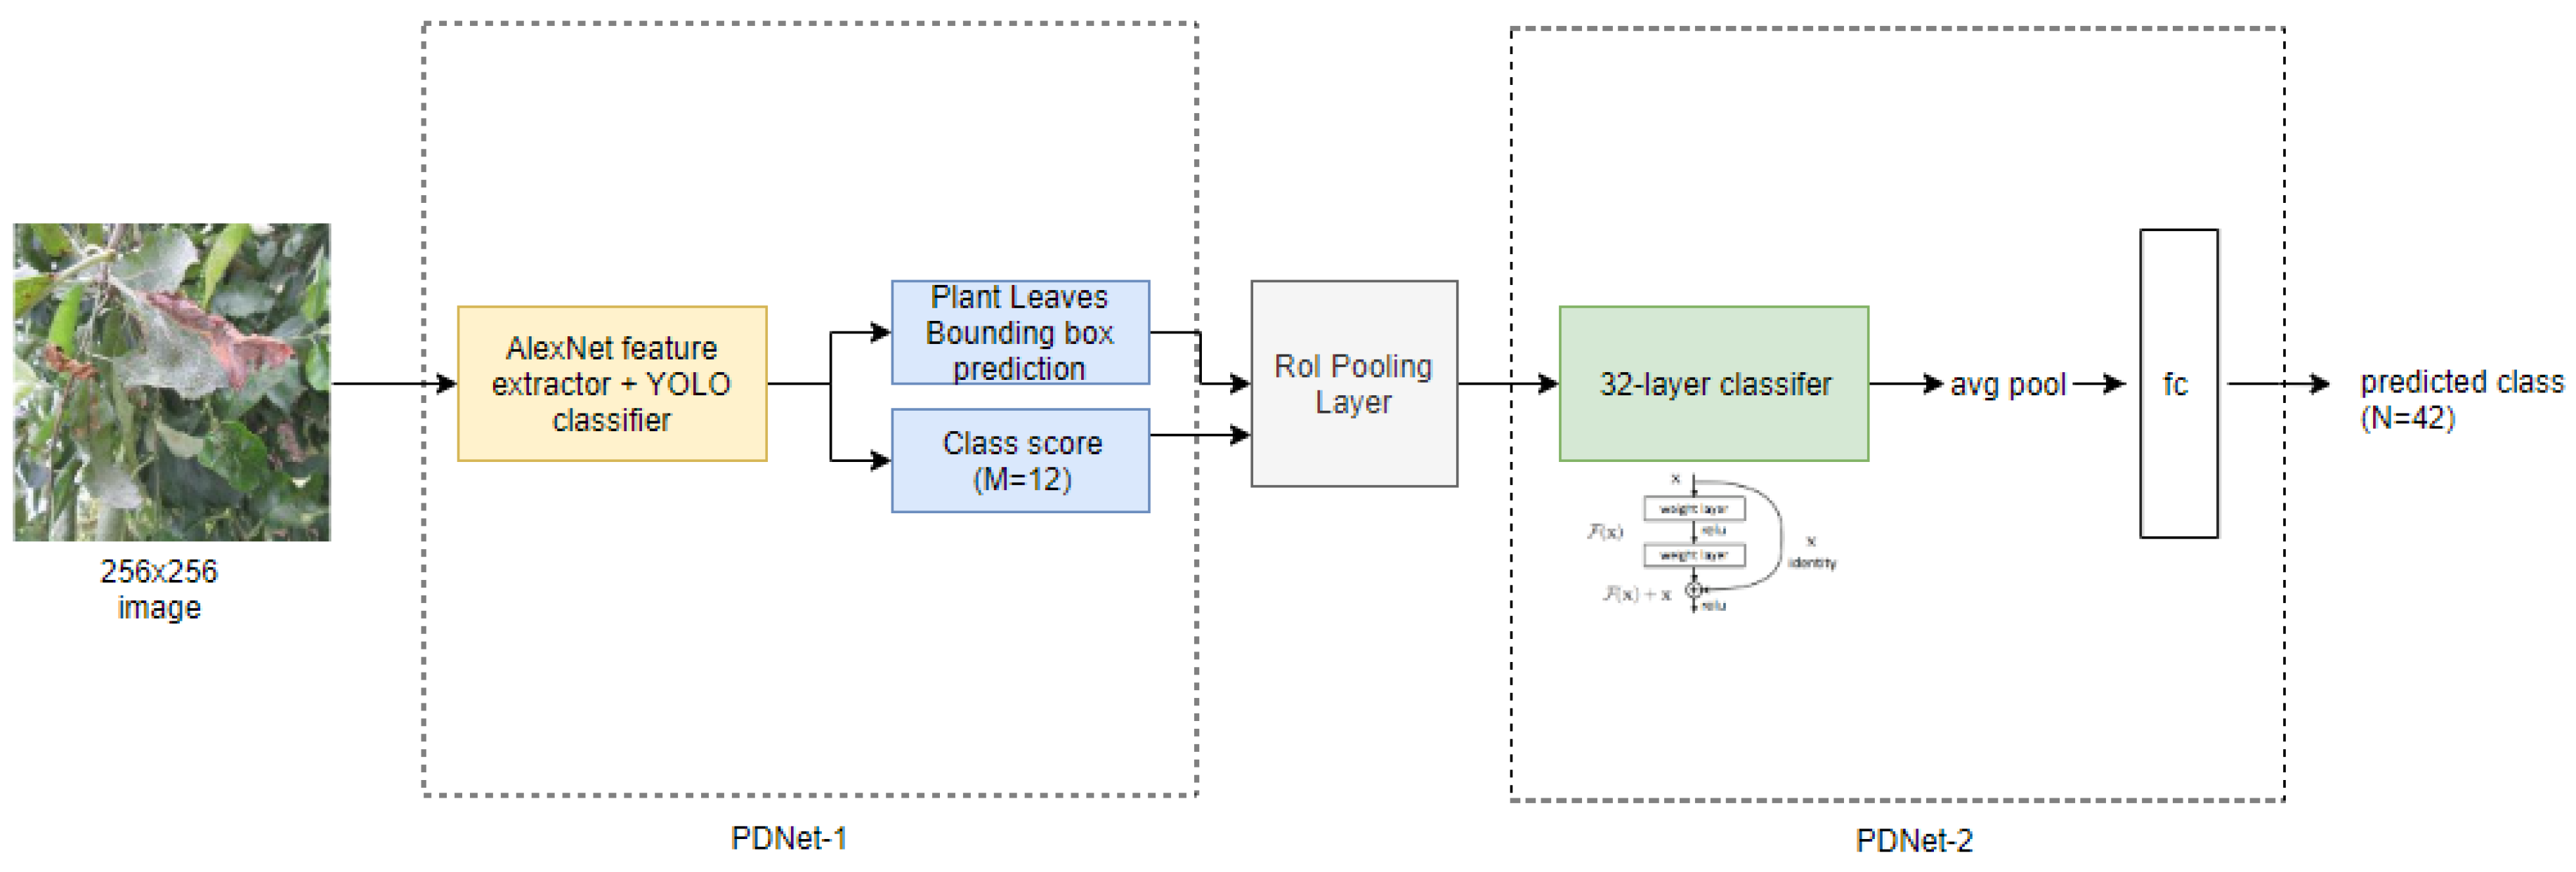
PlantDiseaseNet is a two-stage network that consists of PDNet-1 and PDNet-2 trained simultaneously (
Figure 6). PDNet-1 is responsible for plant leaf detection by species, while PDNet-2 is responsible for classifying those plant leaves.
As examined earlier, region proposal plays a significant role in plant detection tasks in real-environment situations and multi-species/classes on single images along with various backgrounds. Due to this, in the first step, PDNet-1 exploits the detection approach proposed in the YOLO algorithm [
63]. Pre-trained AlexNet was used as the backbone architecture of PDNet-1. AlexNet’s classifier layers were removed so it became a feature extractor, and then on top of it, the YOLO classifier layer (randomly initialized) was added. The object detection strategy in YOLO requires dividing the image into grid-cells where each grid cell is responsible for detecting and predicting the bounding boxes. In this experiment, an 8 × 8 grid was used over the images and two bounding box predictions per grid cell. In that way, a sufficient resolution was preserved along with having a smaller output prediction to train for.
In the second step, the rectangle box feature maps are unified in size by the region of interest (RoI) pooling layer (commonly used in Faster R-CNN algorithms), which are passed on to PDNet-2, the plant disease classification 34-layer network built of 3 × 3 residual block filters with a global average pooling layer on the top along with a 42-way fully-connected layer (42 classes supported by the PlantDisease dataset) with a Softmax layer at the end. The reason for using residual blocks as the learning layers of the PDNet-2 classifier is due to the already good performance of the ResNet architectures in plant disease classification tasks, as explored in
Section 3.3.
As in
Section 3.4, the PlantDisease dataset was split into a 70–20–10 ratio, training, validation, and test set, respectively. PlantDisesaseNet was trained on batch sizes of 32. The custom objective loss function proposed in [
63] was used for PDNet-1. The initial learning rate for PDNet-1 during the training was set at 0.01 and was decreased by one-tenth after every 10,000 iterations. PDNet-2 was trained using a fixed learning rate of 0.001 with a momentum of 0.9.
Table 8 displays the results on the test set.
During the architecture prototyping process, it was observed that the plant leaves detection task was rather more successful than the plant disease detection task, which was explored on the same state-of-the-art methods from
Section 3.4, using the same training hyperparameters (
Table 9). Thus, PDNet-1 was used as a plant leaves detector.
In addition, more complex CNN architectures were used as a backbone feature detector for PDNet-1, but overall, the mAP was not significantly improved by these changes. In the end, AlexNet was chosen due to its simplicity.
The proposed PlantDieseaseNet reached a higher top-1 accuracy on the test set than the trained state-of-the art classifiers, as PDNet-1 was only fed with the regions of interests provided by PDNet-2 with high precision, holding only focused single leaf features that overcame situations like complex backgrounds or multiple classes per image.
4. Conclusions
Plant diseases have been a significant concern in agriculture for years. Precision agriculture has enabled early disease detection and the minimization of losses through optimal decisions based on the results of DL methods. Recent advances in DL provide solutions with highly-accurate results, and available hardware enables fast processing. However, the decision-making process could be improved. Currently, the available models fail to attain high results when tested in real conditions. Motivated by this, and based on the authors’ previous work, a novel approach for plant disease detection was proposed in order to overcome the major limitations for practical usage.
In this paper, a new dataset was introduced, which contained images of leaves in real surroundings, at different angles, and in various weather conditions, labeled both for classification and detection tasks. This way, the dataset is more comprehensive, which improves the classification accuracy and practical applicability of the model.
An insufficient number of examples is a general obstacle since it leads to overfitting. In order to circumvent this issue, several augmentation techniques were used. Motivated by advances in GAN, this type of architecture was used (besides traditional techniques) to increase the size of the dataset and supplement it. Finally, a novel, two-stage architecture, the PlantDiseaseNet, was proposed for plant disease detection. The trained model achieved an accuracy of 93.67% on the PlantDisease dataset and due to its architectural design, it proved to be successful in situations with complex surroundings. Accuracy could potentially be enhanced by the exploitation of other information sources such as location, climate, and the age of the plant.
Future work should be focused on detecting diseases in various locations of the plant and different phases of the disease. The developed model could be part of a decision support system and as such provide suitable conditions for optimal decisions. It can also be integrated into a mobile application and provide an inexpensive solution for detecting plant diseases by only taking a photo of the plant leaf.


