Article

Comparison of Body Composition Monitor and InBody 720 Bioimpedance Devices for Body Composition Estimation in Hemodialysis Patients and Healthy Controls

1
Faculty of Sports, University of Ljubljana, 1000 Ljubljana, Slovenia
2
Essex Pathways Department, University of Essex, Colchester CO4 3SQ, UK
3
Faculty of Medicine, University of Ljubljana, 1000 Ljubljana, Slovenia
4
Dialysis Center Leonišče, University Medical Centre Ljubljana, 1000 Ljubljana, Slovenia
*
Author to whom correspondence should be addressed.
Submission received: 26 November 2020 / Revised: 12 January 2021 / Accepted: 14 January 2021 / Published: 18 January 2021
(This article belongs to the Special Issue Molecule Symmetry, Bioaerosol and Human Health)

Abstract

:
Bioelectric impedance devices have become a standard of care not only for peritoneal dialysis but also for hemodialysis patients. We compared the most important body composition variables (extracellular water, intracellular water, total body water and fat mass) measured with the multifrequency bioelectric impedance device InBody 720 (MF-BIA) and bioimpedance spectroscopy body composition monitor Fresenius (BIS BCM) in hemodialysis patients (n = 51, 175.1 + 7.8 cm, 82.2 + 15.2 kg) and healthy controls (n = 51, 175.1 + 7.6 cm, 82.3 + 15.3 kg). The MF-BIA InBody 720 device compared to the BIS BCM device showed significantly larger total body water and intracellular water estimates and significantly smaller extracellular water and body fat estimates in hemodialysis patients (p < 0.001). These differences (p < 0.001) were similar in the cohort of healthy controls; moreover, we observed high correlations in all variables between the hemodialysis patients and the healthy controls (0.80–0.95, p < 0.001). The mean relative differences in the order of 8% were lower for extracellular water and total body fat, but the limits of agreement were still wide enough to be clinically significant. We conclude that the results of the measurements with InBody 720 and BCM Fresenius cannot be used interchangeably. Physicians and nutritionists involved in the care of hemodialysis patients should be aware of this discrepancy between the two devices and should try to use the same device to track the body in their hemodialysis population in a longitudinal direction.

1. Introduction

The number of patients with chronic kidney disease (CKD), which affects approximately 150 million people worldwide each year, and the number of patients with end-stage CKD requiring dialysis, is growing rapidly [1]. The body composition of hemodialysis (HD) patients undergoes several changes as a result of multiple comorbid conditions, metabolic acidosis, chronic inflammation and the dialysis procedure itself [2,3]. These changes include loss of lean tissue mass [4], changes in body water content and changes in body fat mass [5]. There is an inverse relationship between body cell mass and overhydration in dialysis patients [6]. The amount of body water changes significantly before and during each hemodialysis session [5]. Fatty and lean tissue contents are strong and independent predictors of the outcome in dialysis patients and can influence the survival time [7,8,9]. Therefore, body composition measurement and surveillance, together with clinical parameters, should play an important role in the work-up of dialysis patients and determining their survival [4,7,10,11].
In today’s market, we find numerous methods for estimating body composition, including dual-energy X-ray absorptiometry, computed tomography, magnetic resonance imaging, underwater weighing and body impedance analysis [5]. Devices using the bioelectric impedance method (BIA) are constantly being expanded due to their portability, non-invasiveness and availability [12]. Currently, they are widely used for body composition assessment [13] and allow body composition to be measured without the help of a medical specialist [5]. In BIA, a low electric current is introduced into the body, with lean tissue with a high water content offering low resistance, while fatty tissue with a low water content offers high resistance [5]. The impedance is the frequency-dependent resistance of a conductor to the exchange of a current and is determined by resistance (R) and reactance (Xc) [5]. Despite the use of the same basic BIA method, analyzers can differ in the frequencies of the electric current and in the number of electrodes attached to the body. As well as this, the electric current can be passed through different parts of the body, and the procedure can be performed in the standing or supine position [13]. Multifrequency BIA (MF-BIA) measures from 3 to 8 frequencies between 1 and 1000 kHz and uses empirical linear regression models to evaluate fat-free mass (FFM), total body water (TBW), intracellular water (ICW) and extracellular water (ECW), which normally apply to healthy subjects, but according to previous research [1], these devices do not allow a precise distinction between ECW and ICW. Bioimpedance spectroscopy (BIS) uses a wide frequency band for physiological modeling in the range between 5 kHz and 1 MHz and mixing equations, such as the Cole–Cole plot and Hanai formula, to first determine the electrical resistance of ECW and ICW and then calculate the volumes of these respective compartments [12,14]. BIS has been validated in an HD population [15] and offers the possibility to assess body composition and hydration state [15,16,17]. These features of MF-BIA and BIS are key to determining the hydration status (HS) in CKD and HD.
The InBody 720 MF-BIA device (InBody, South Korea) [18,19,20,21,22,23] and the BIS body composition monitor BCM (FRESENIUS, Bad Homburg, Germany) are commonly used in CKD and HD research [24,25,26,27,28]. The main difference between them is the position of the subject during the measurement (InBody 720—upright, BCM—supine). The BCM device requires four disposable electrodes for each new measurement, which takes 5–10 min [29], while InBody 720 can be used at no additional cost and the scan usually takes less than 2 min. Both devices also differ slightly in data acquisition, signal processing, frequency spectra and the acquisition of body fluid status. The main difference between them is in the position of the subject during the measurement (InBody 720—upright, BCM—supine) as this directly affects the body hydration status measurements due to the effect of gravity, and because the water distribution in the supine position differs from the upright position in the edematous state [30]. In addition, the MF-BIA InBody 720 uses empirical linear regression models but includes impedances at multiple frequencies; however, BIS BCM uses mathematical modeling and mixture equations and then develops empirically derived prediction equations rather than going straight to mixture modeling [31]. As the MF-BIA InBodyInBody 720 device assumes that the patient is adequately hydrated, the BMC device is based on the model developed by Chamney et al. [32], which has allowed the assessment of hydration status with bioimpedance analysis independent of comparisons to controls and population-normalized body composition.
Nevertheless, we can find various research papers on HD that use both devices and equate the collected data for further analysis [33,34,35,36]. The ECW/TBW ratio for these two devices was compared in a peritoneal dialysis (PD) cohort to provide an inter-machine calibration, with BCM yielding statistically significant greater values; subsequently, the inter-machine calibration was performed using the 0.371 × BCM ECW/TBW + 0.216 equation for males and 0.296 × BCM ECW/TBW + 0.252 equation for females [36]. Additionally, MF-BIA and BIS were compared with dual-energy X-ray absorptiometry (DEXA) as a reference method for determining body composition: InBody 720 showed a high agreement and correlation with the DEXA method both in the PD and the renal disease free middle-aged cohort [21,37], but BCM’s predictive value for DEXA was found to be poor in renal transplant recipients [38].
Therefore, the question arises whether we can equate the results of the InBody 720 and the BIS BCM devices. BIA body composition measurement has become a standard of care not only for PD but also for HD patients. There is a lack of research on the comparability of the MF-BIA InBody 720 and BIS BCM devices in the HD population. Therefore, the aim of the present cross-sectional observational study was to investigate the agreement between InBody 720 and BCM body composition analyzers in HD patients and healthy controls.

2. Materials and Methods
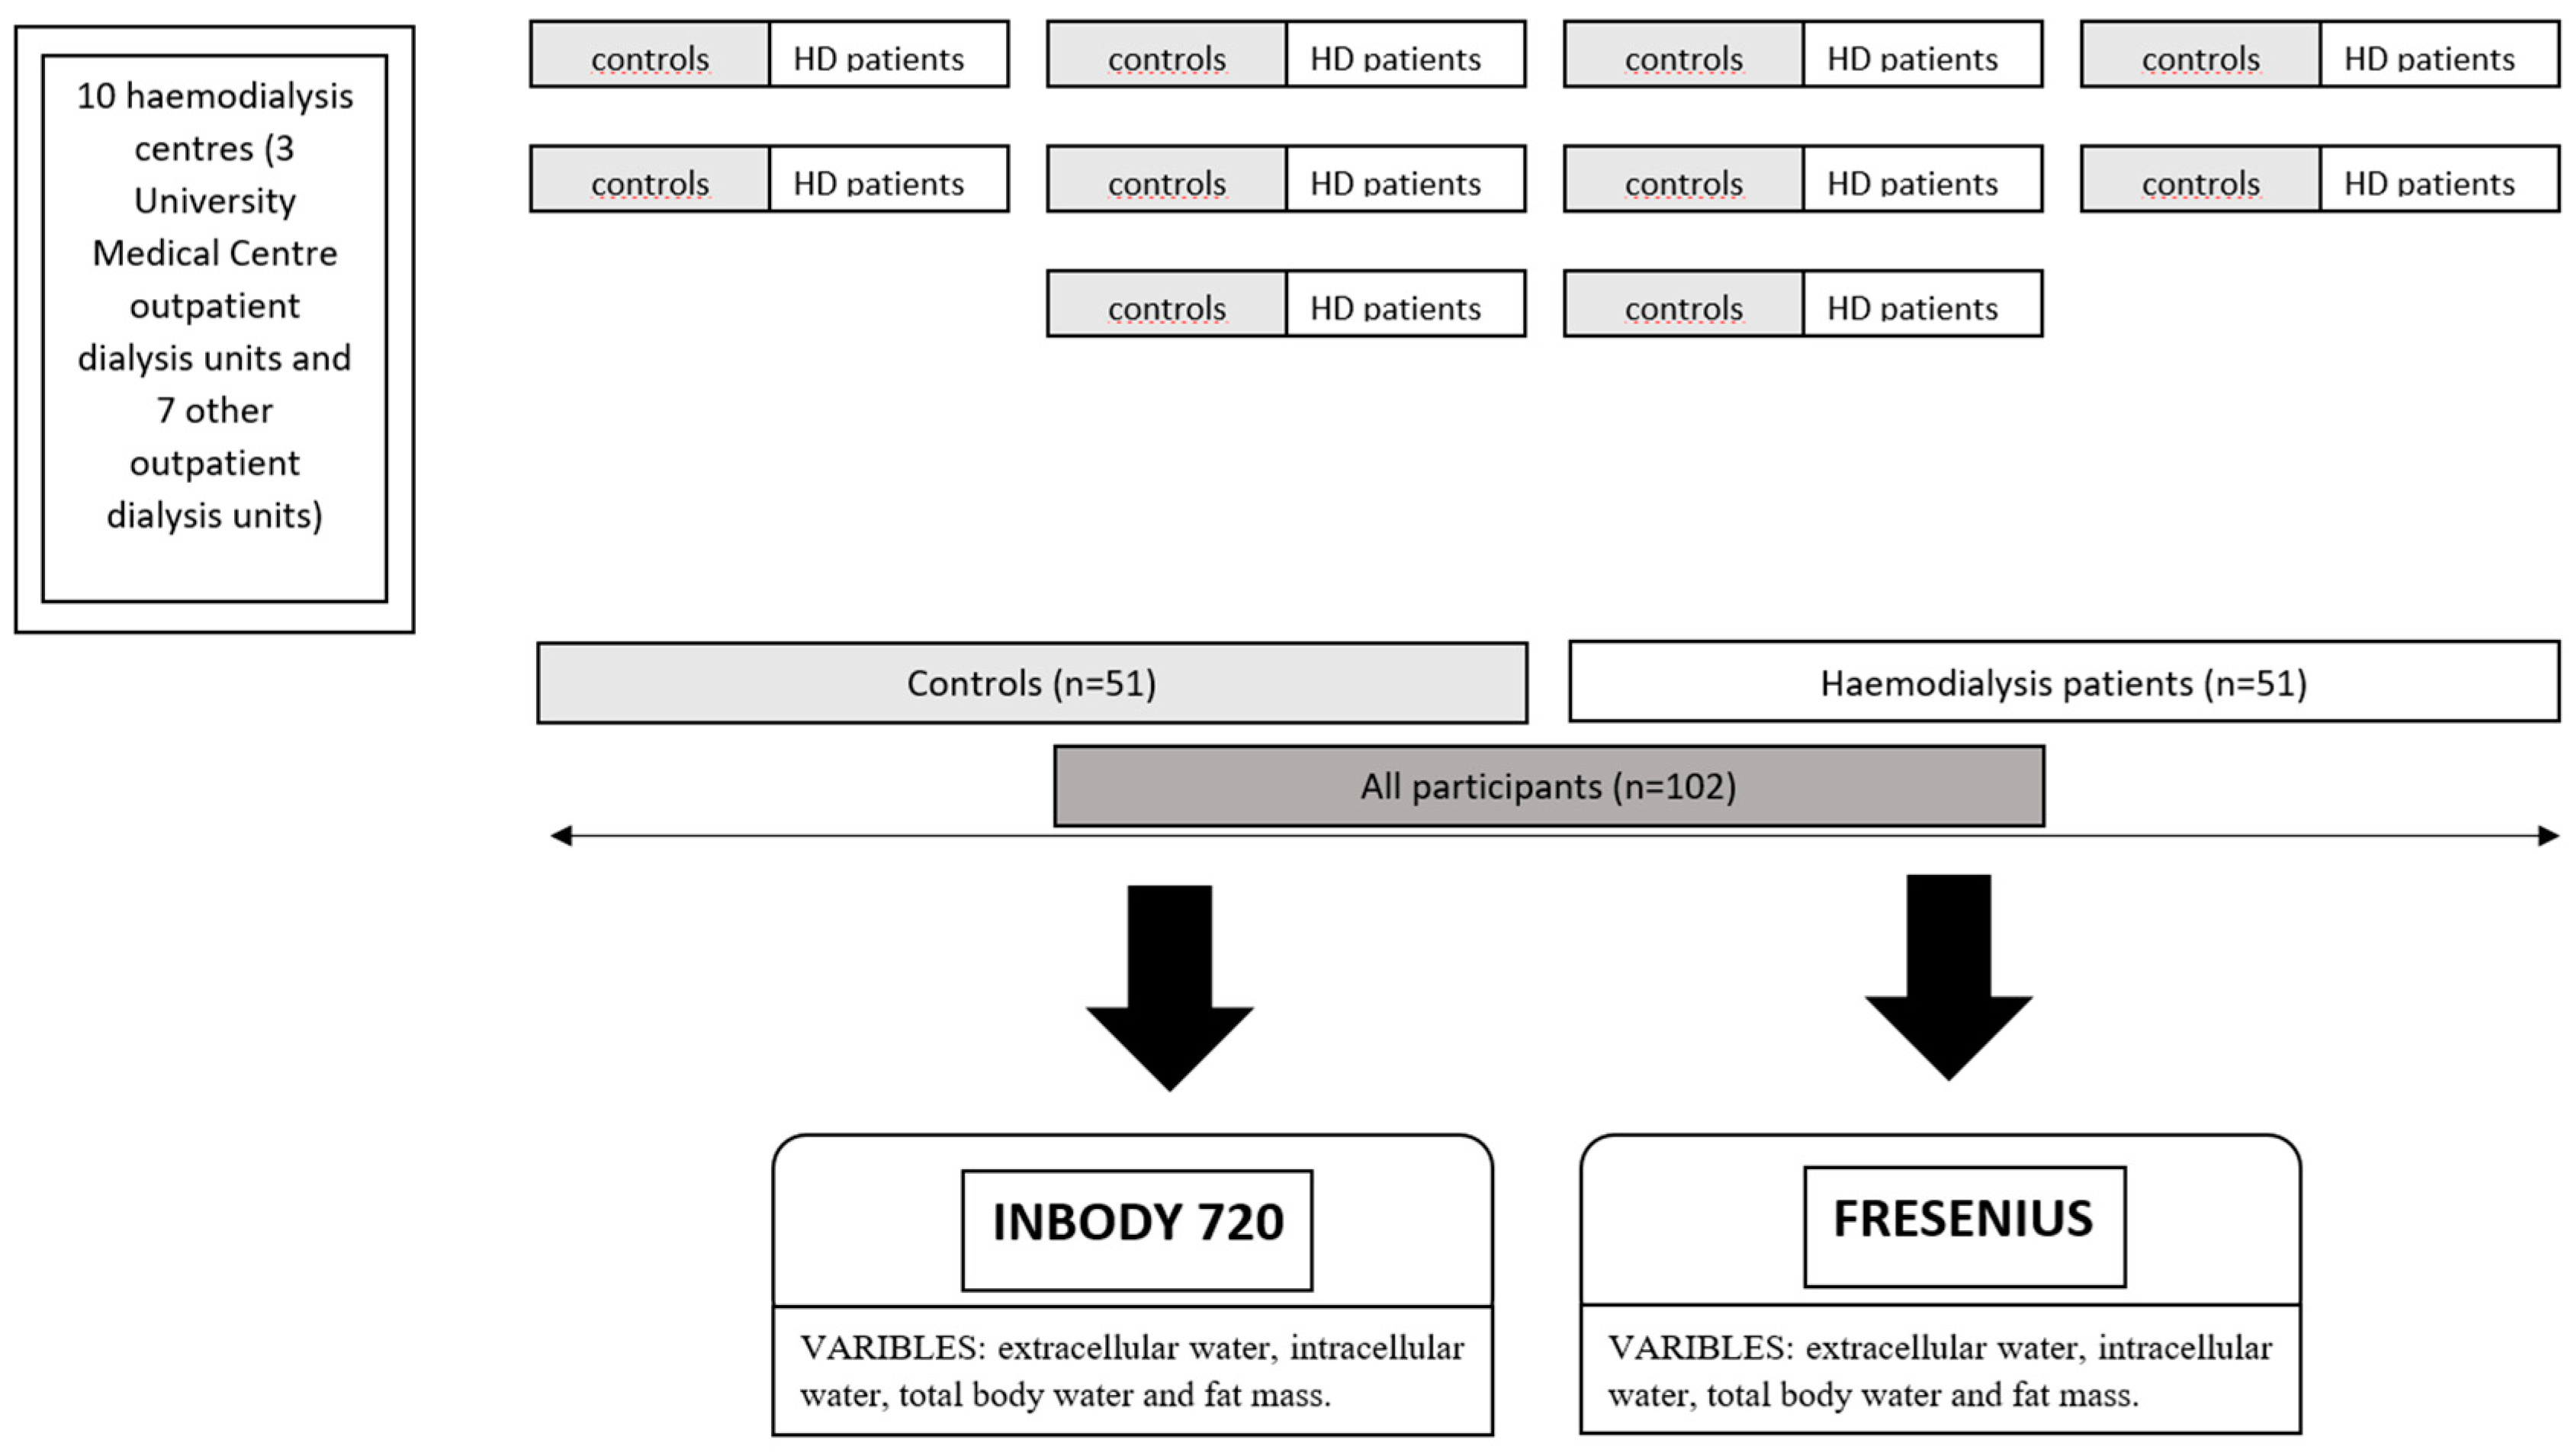
2.1. Participants

This study was performed on a cohort of a “DIAGIB” cross-sectional study examining the physical fitness of hemodialysis patients and healthy controls as previously reported [39]. The research protocol was reviewed and approved by the Slovenian National Medical Ethics Committee (ref. no. 125/05/14). Measurements were performed between July and December 2014 at the Faculty of Sports, University of Ljubljana. The measurements included a sample of maintenance hemodialysis patients from the three outpatients dialysis units of University Medical Centre Ljubljana and seven other outpatient Slovenian dialysis units. Patients and control subjects were eligible for inclusion in the study if they were at least 18 years old, could walk with or without additional support, and had voluntarily given informed consent to be included in the study. Patients or control subjects were not included if any of the following conditions were present: hospitalization or acute illness in the last weeks preceding the study measurements, active malignant disease or chronic infection (e.g., tuberculosis, osteomyelitis), consequences of cerebrovascular accident (such as paresis or paralysis), heart failure of NYHA stage 3 or 4 or symptomatic angina pectoris Canadian Cardiovascular Society stage 2, 3 or 4, chronic obstructive pulmonary disease stage 3 or 4, decompensated liver cirrhosis, symptomatic peripheral arterial obstructive disease, painful degenerative or inflammatory arthropathy with current use of anti-inflammatory or analgesic therapy or currently symptomatic psychiatric condition. Control subjects were required to have no history of kidney disease or a serum creatinine concetration below 133 μmol/L (1.5 mg/dL).
For the purposes of the present study, we included only males. The study sample consisted of 102 men (175.1 ± 7.7 cm, 82.2 ± 15.2 kg), 51 of them healthy men (175.1 ± 7.6 cm, 82.3 ± 15.3 kg) and 51 male HD patients (175.1 ± 7.8 cm, 82.2 ± 15.2 kg). The average age of all men was 52.1 ± 16.5 years (51.5 ± 16.2 years for healthy controls and 52.3 ± 16.4 years for HD patients). Participants’ selection is shown in Figure 1. We were able to reach 153 HD patients after preliminary screening and invite them to participate in the study. Of these, 35 refused participation, 1 died, 1 had undergone transplantation, 21 did not arrive at the scheduled date, 2 refused to start measurements and 3 were excluded after a detailed interview revealed the presence of exclusion criteria. Ninety patients of both genders remained in the sample, and of these, 51 male patients were included in the final analysis.
HD patients were treated with high-flux dialysis membranes in the hemodialysis or on-line hemodiafiltration modes as per the treating physician. The duration of the individual session was prescribed individually according to the need and tolerance for ultrafiltration and biochemical dialysis adequacy parameters in the range from 4 to 6 h per treatment 3 times a week. Epoetin, phosphate binder, active vitamin D, calcimimetic and other dialysis-related therapies were used to reach the satisfactory biochemical status of patients.

2.2. Procedures

All subjects were measured with the InBody 720 and the Fresenius BCM monitor in the same session. To compare both technologies, we used their main variables: extracellular water (ECW), intracellular water (ICW), total body water (TBW) and fat mass, which is called FTM in the Fresenius technology and BFM in the InBody 720.
All subjects were measured in the afternoon hours; dialysis patients were measured on non-dialysis days. The measurements were performed randomly, initially with InBody 720 or Fresenius BCM in the same room at intervals of a few minutes. The conditions during the measurement were stable in terms of air temperature (23 °C) and humidity (58%). All measurements were performed in accordance with the manufacturers’ user manuals.

2.3. Statistical Analyses
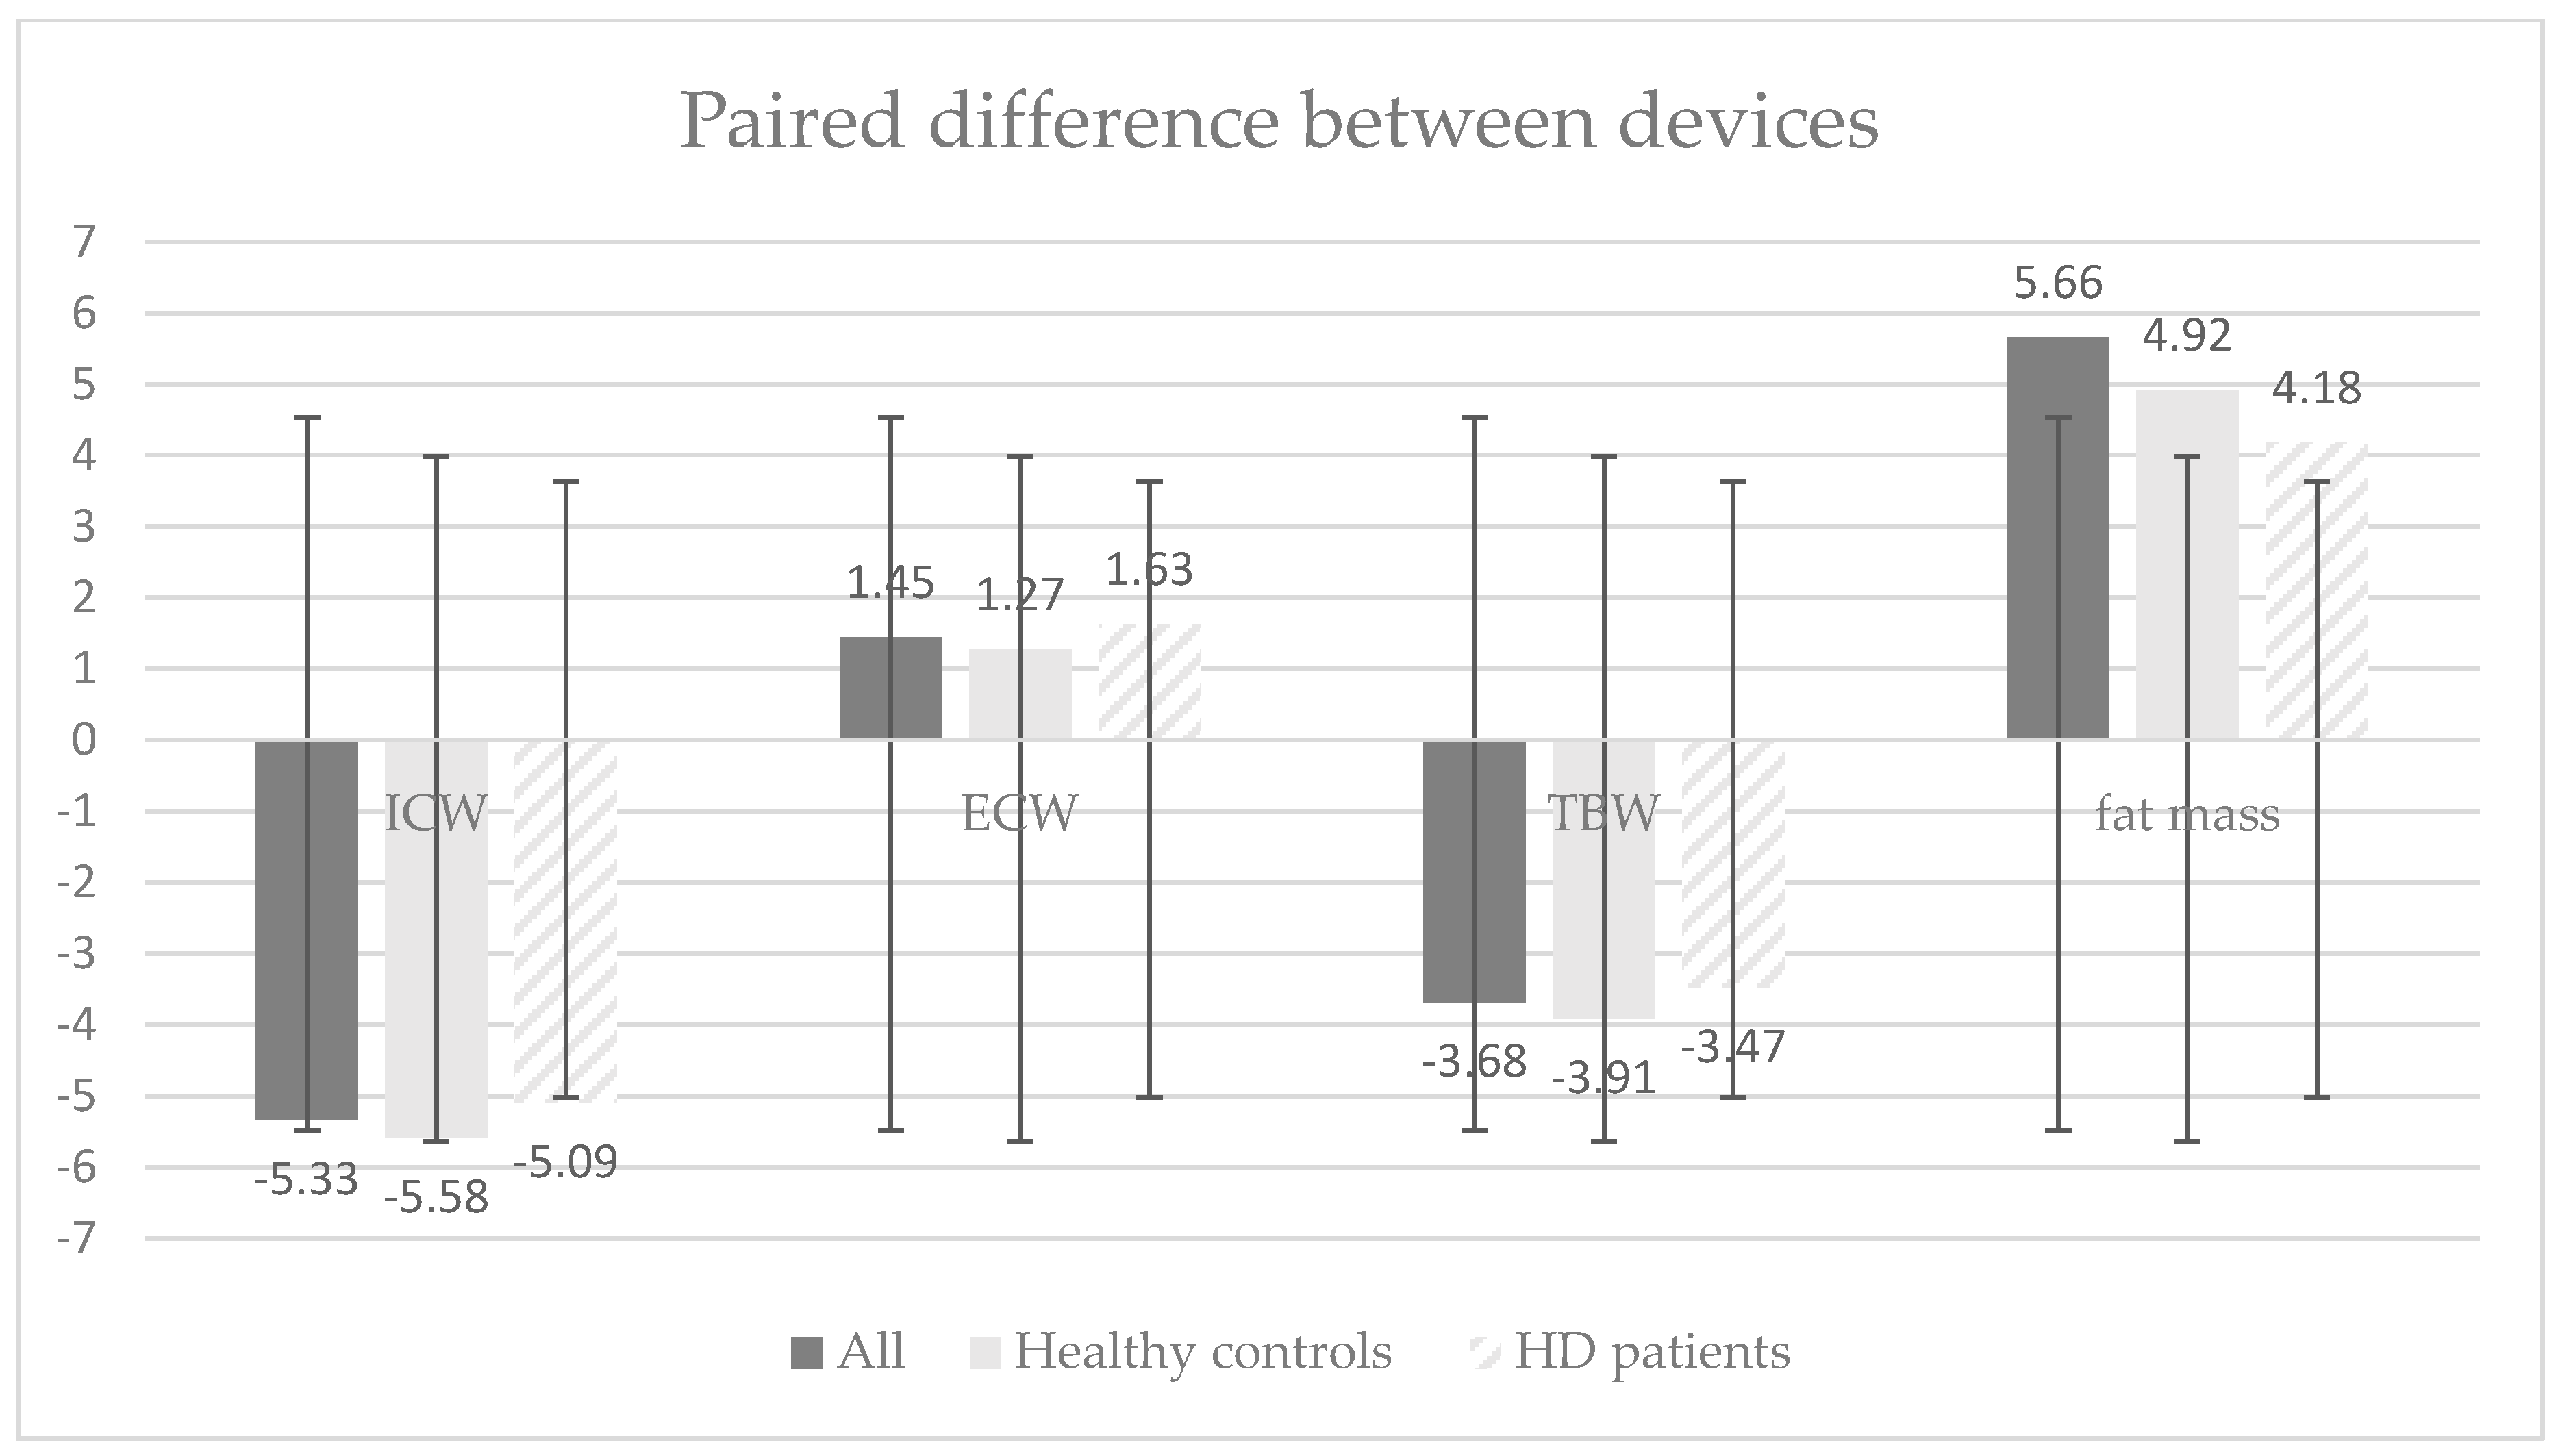
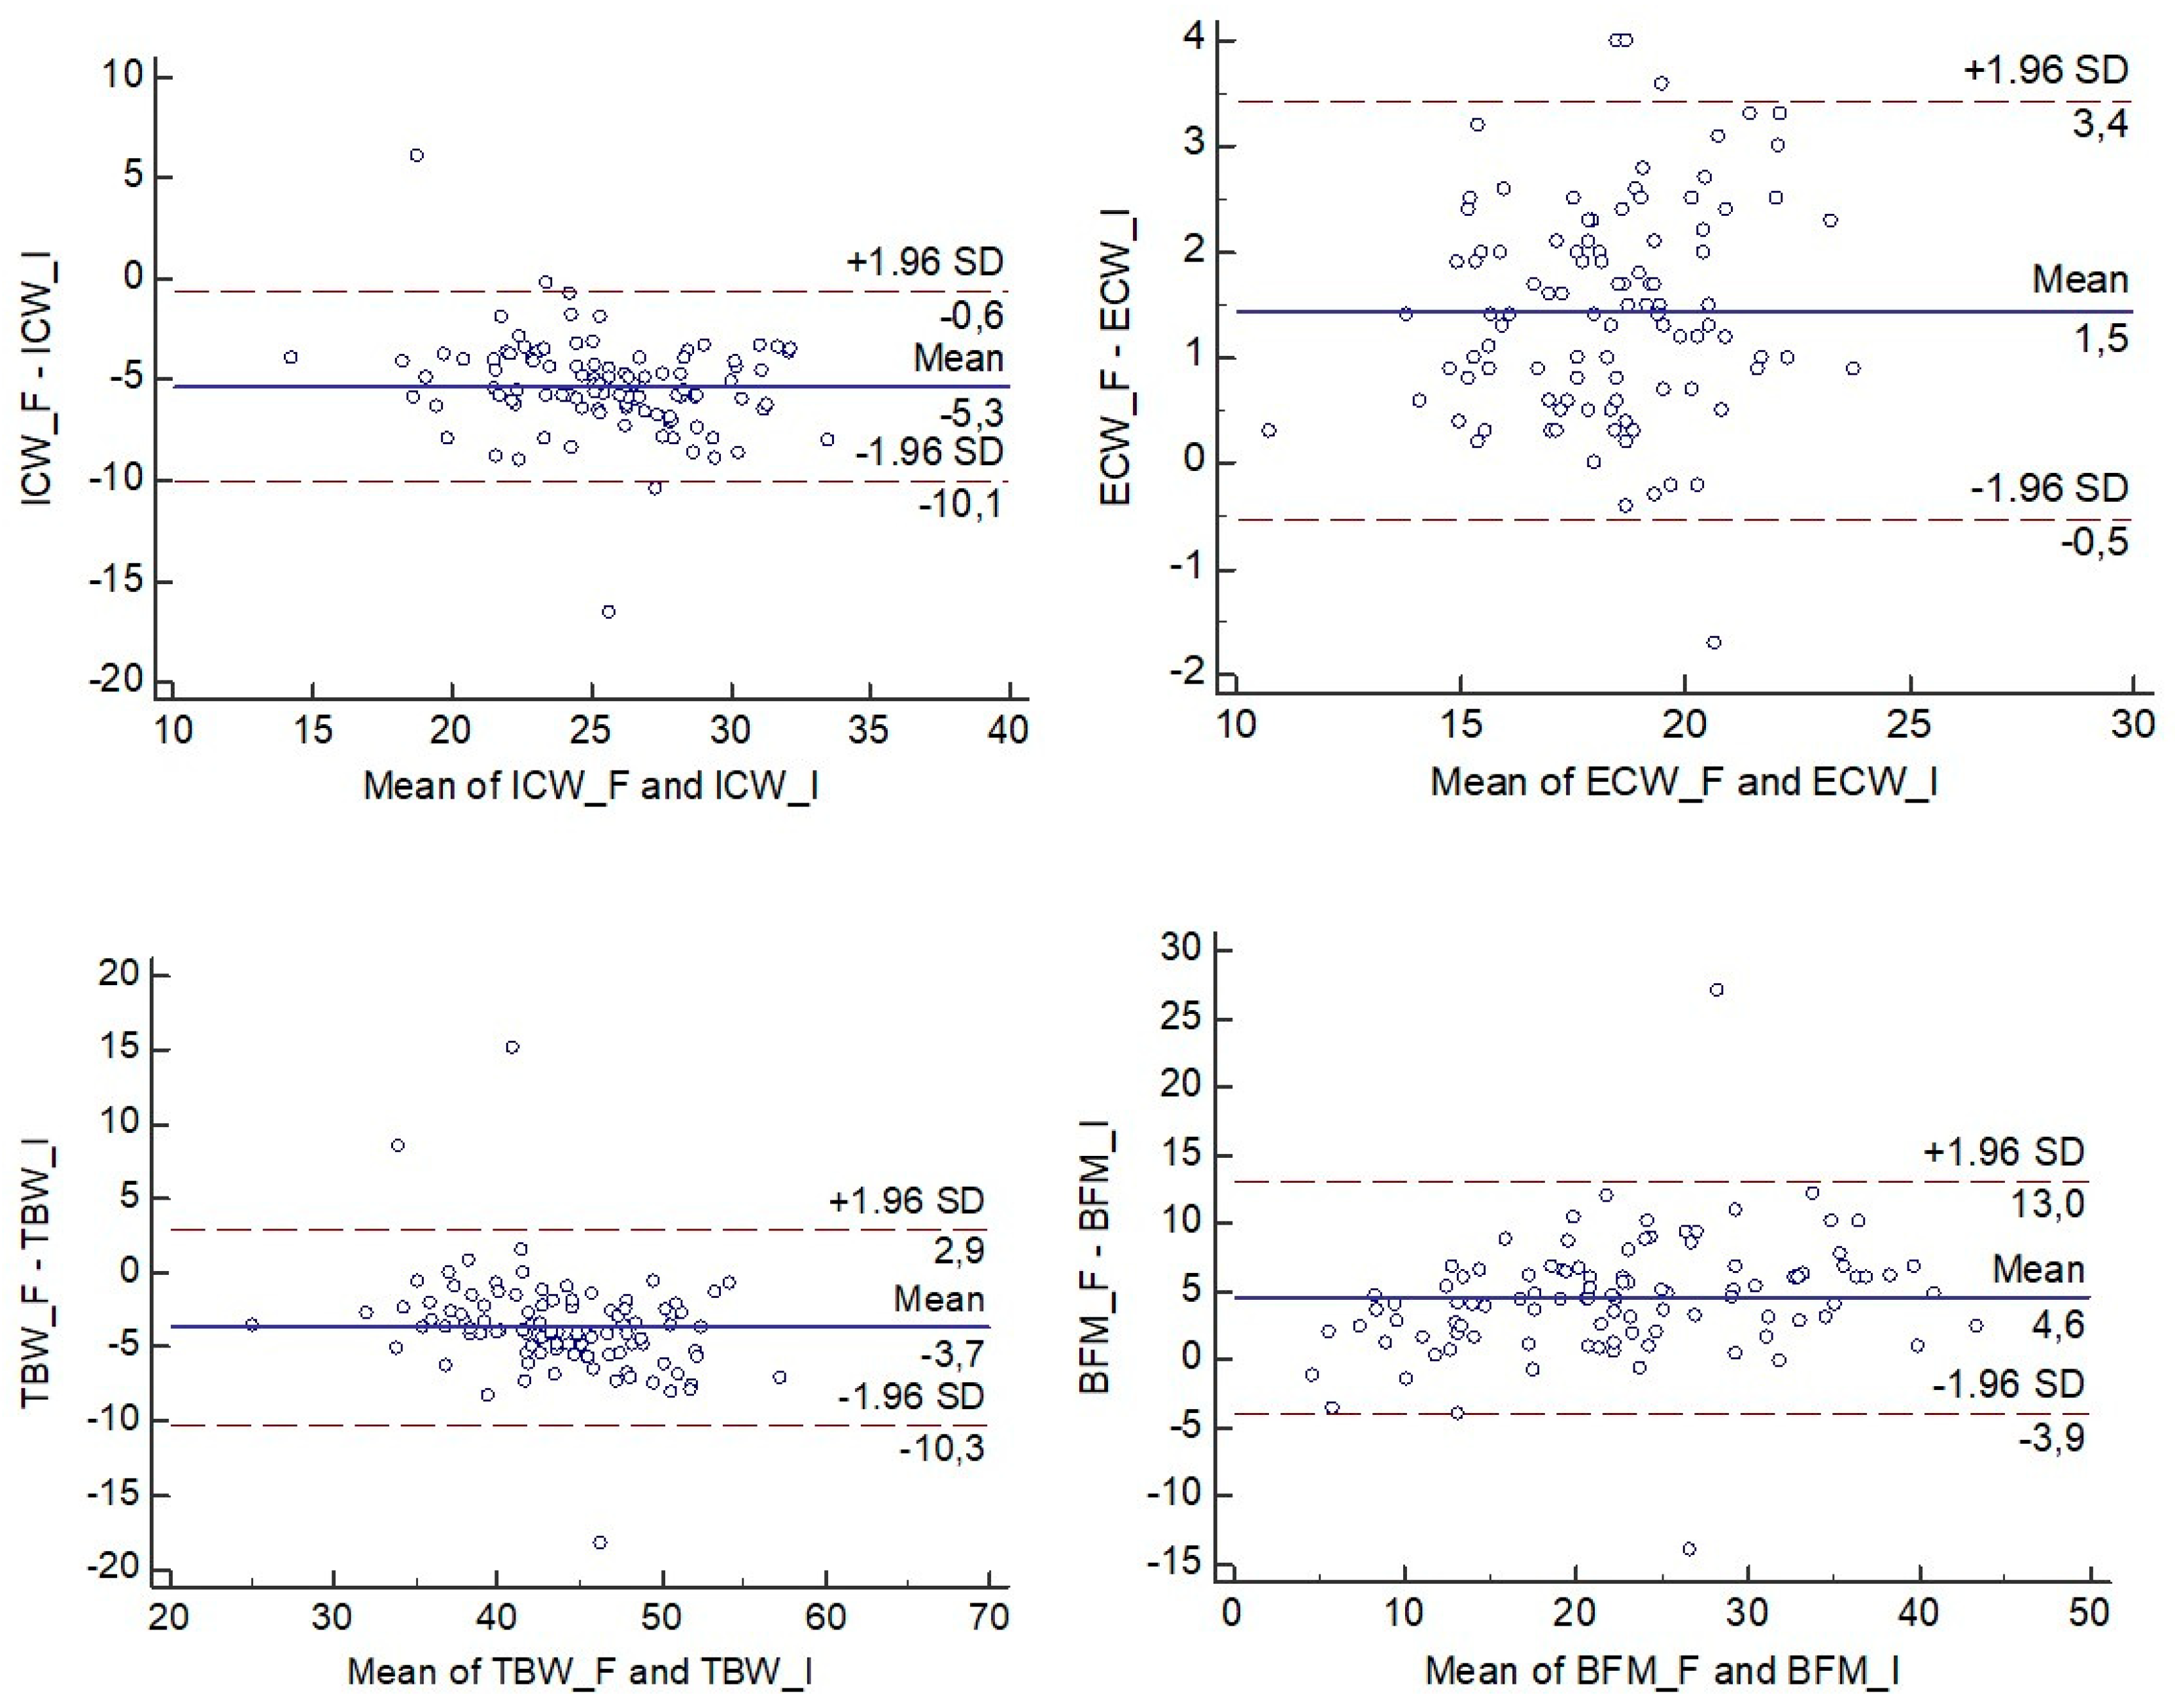
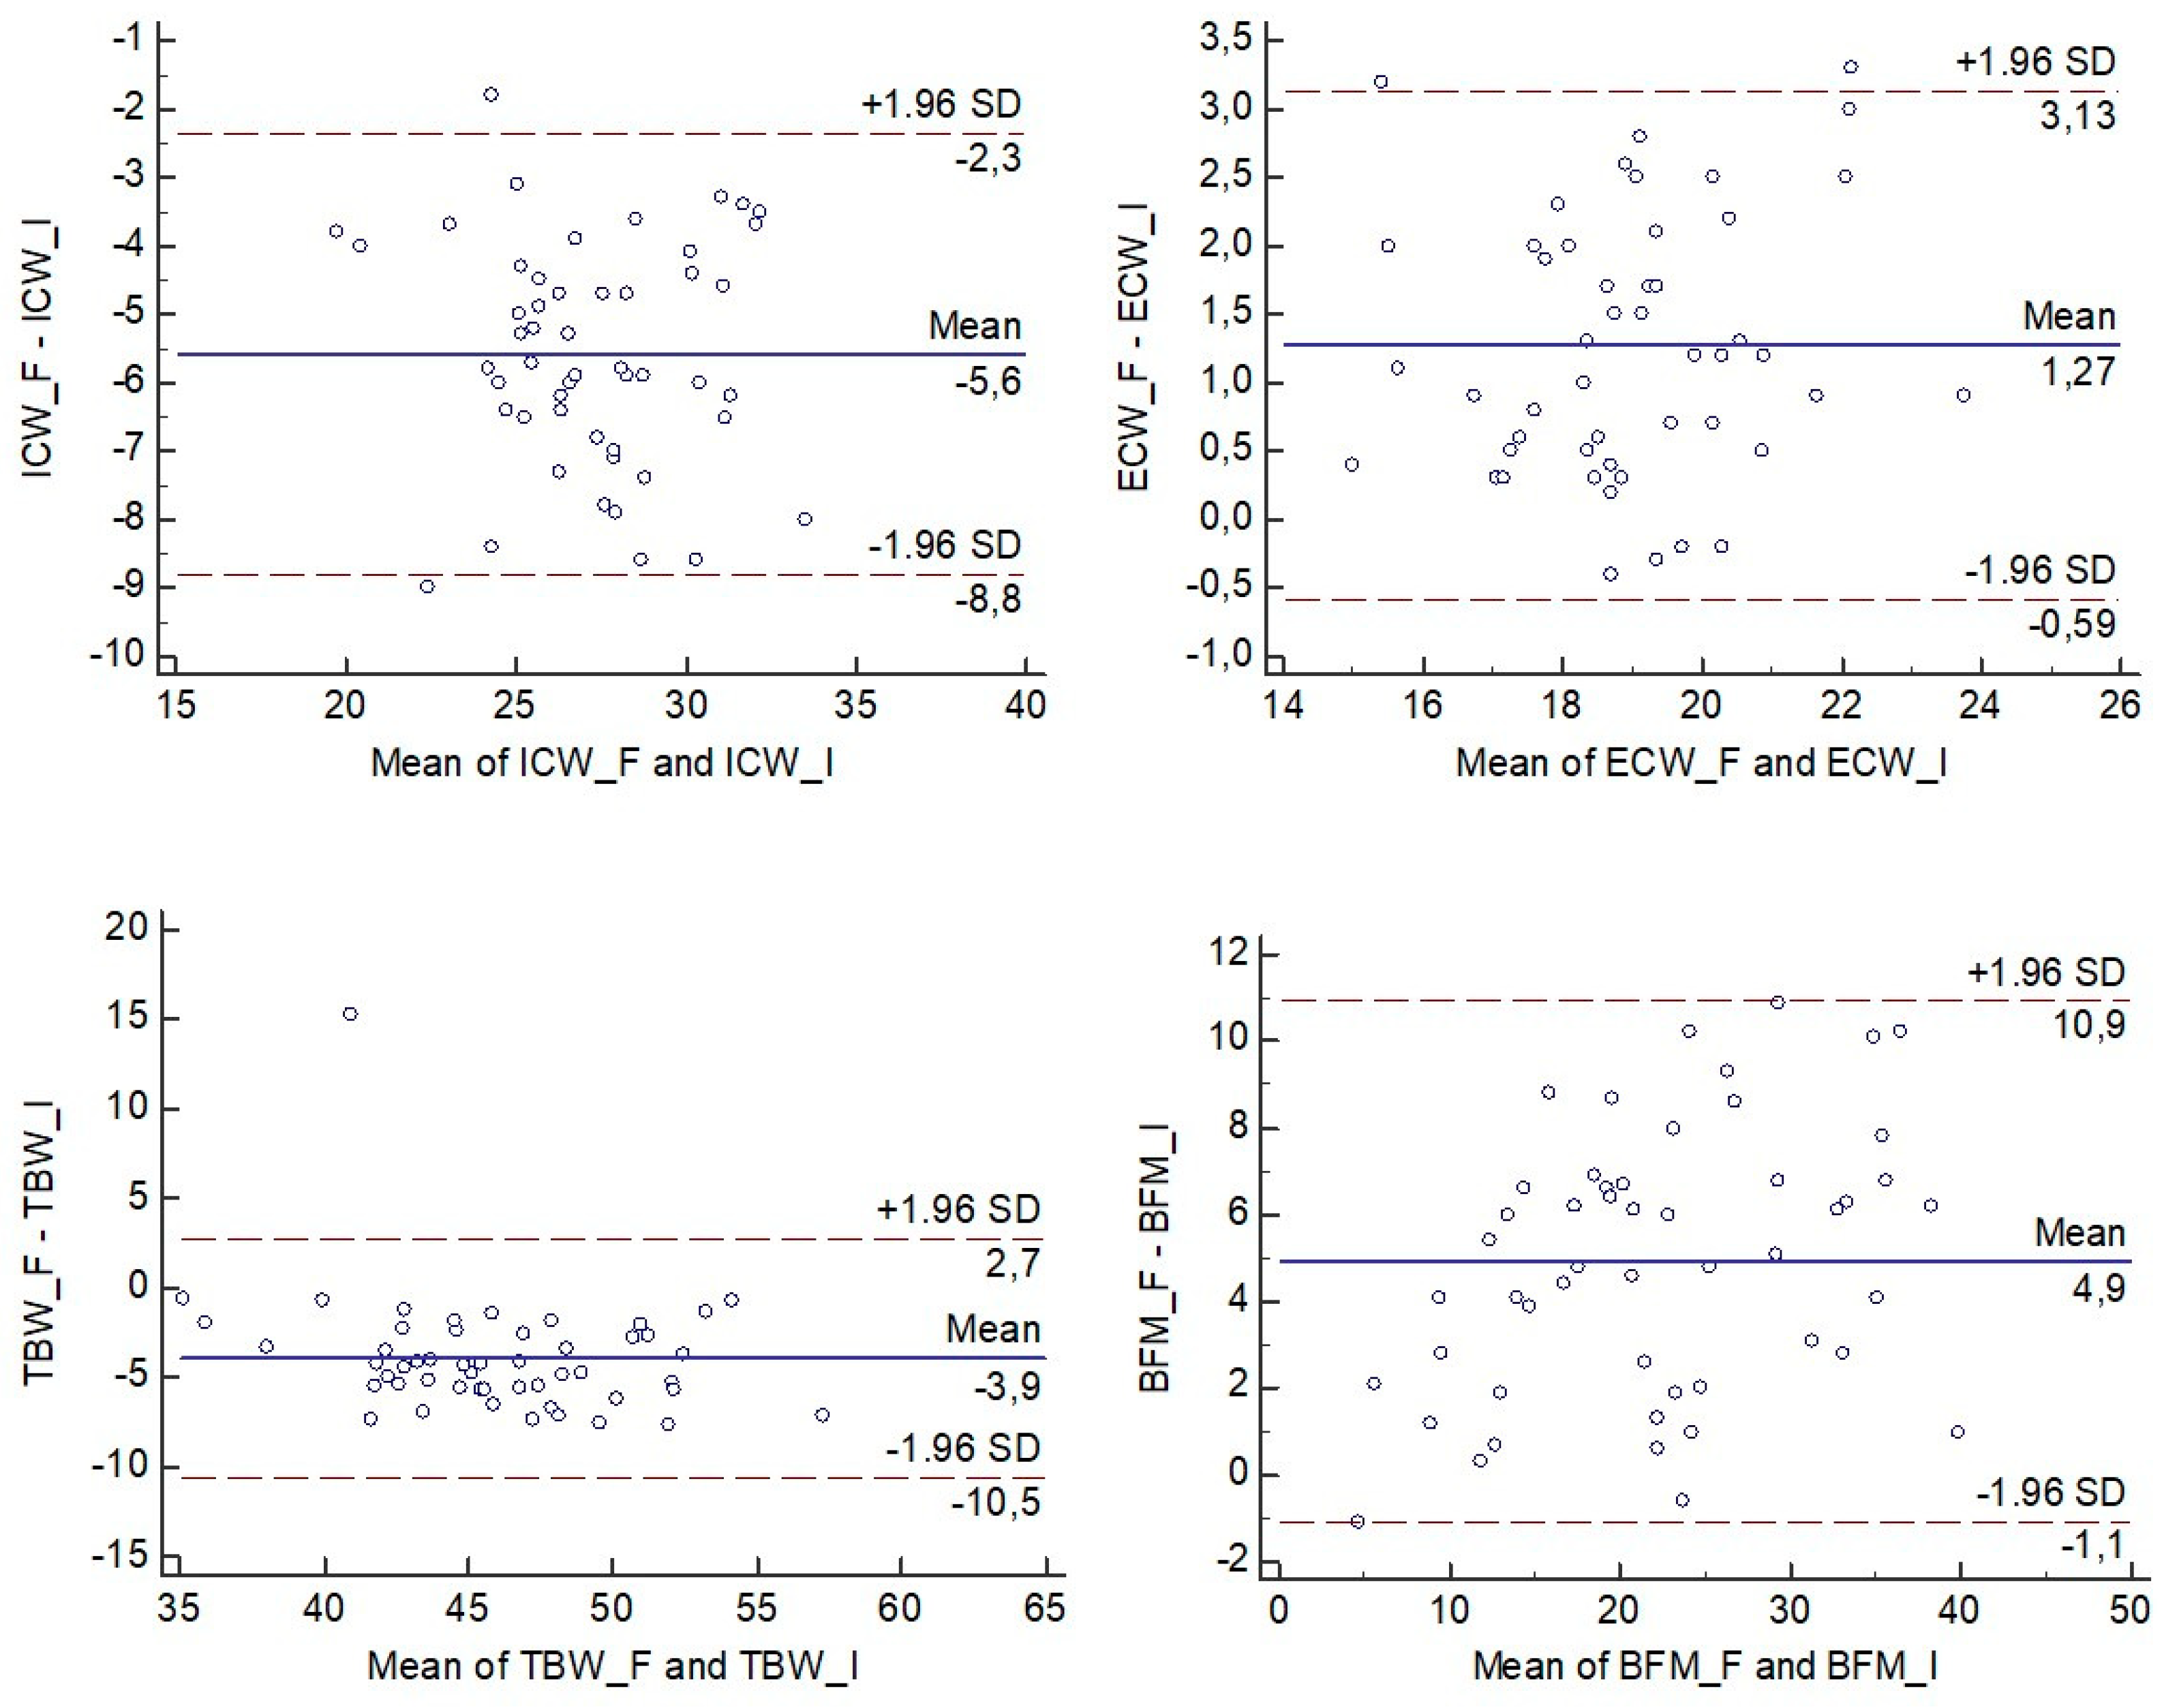
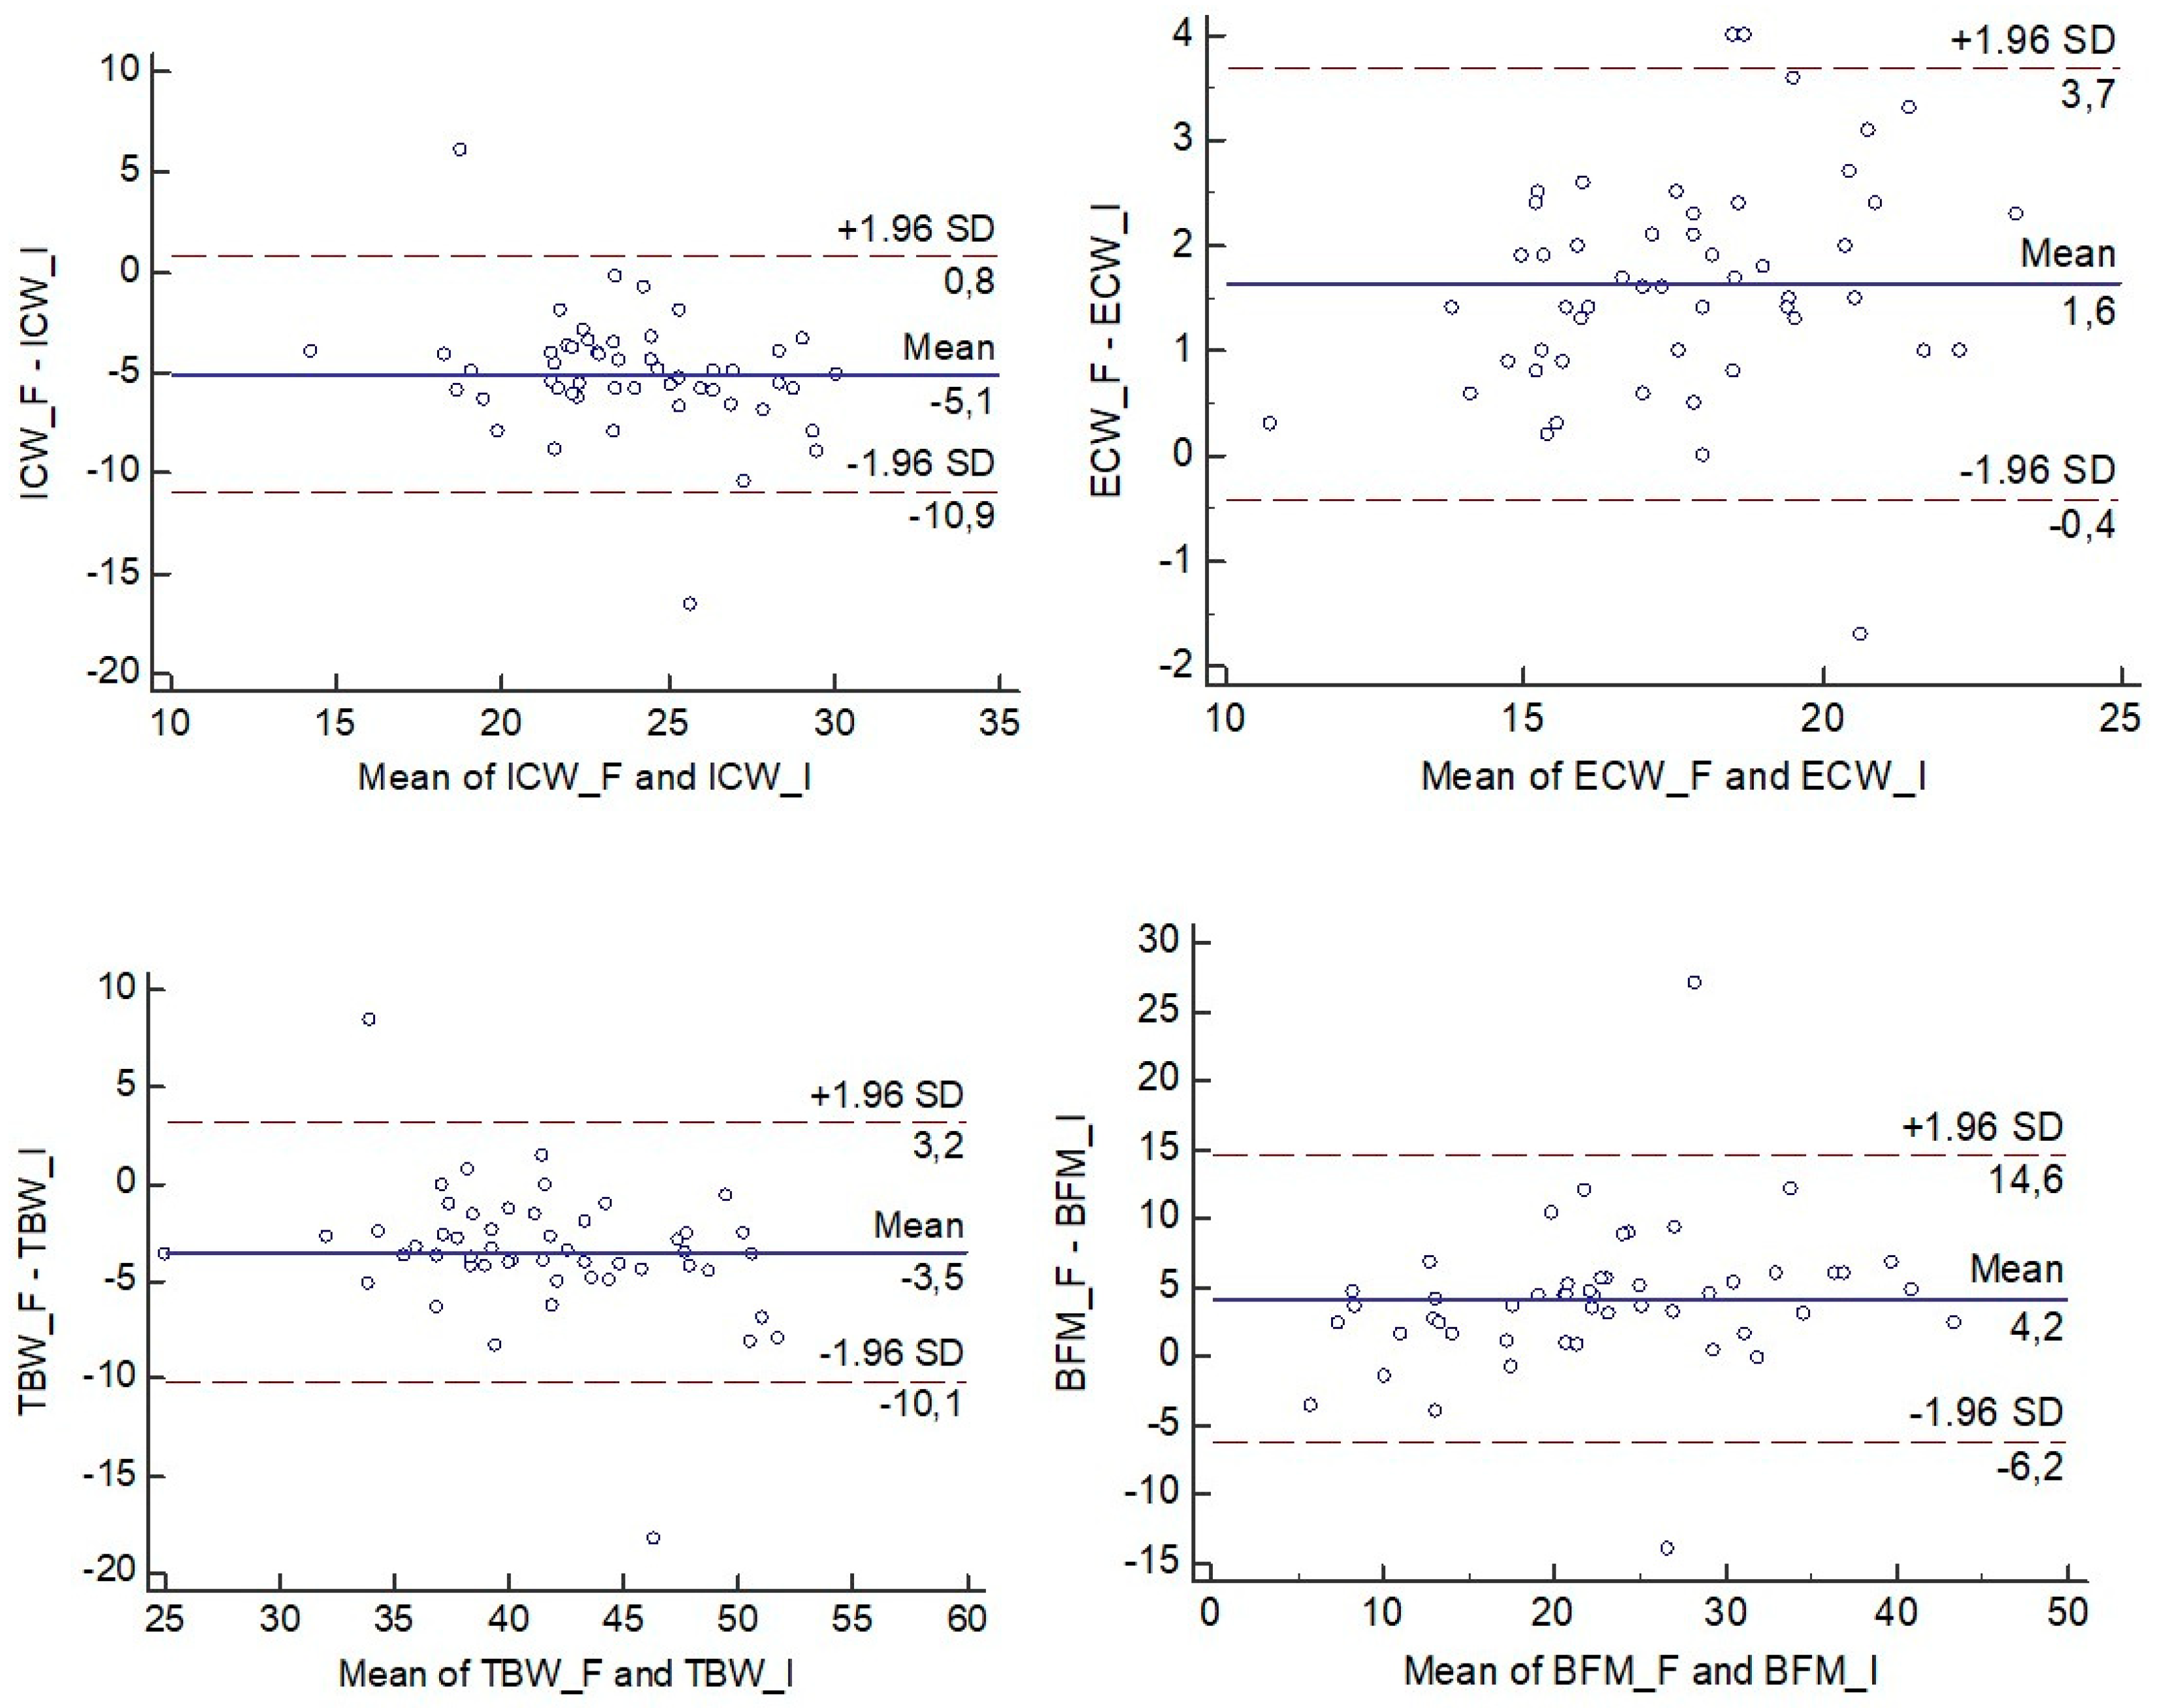
Statistical analyses were performed with SPSS for Windows (version 21.0; SPSS, Inc., Chicago, IL, USA). The data were presented according to descriptive statistics (mean values ± SD). In addition, the following tests were performed: the Kolmogorov–Smirnov test, coefficient of variation (CV), standard error of measurement (SEM), paired-sample t-test (Fresenius BCM—InBody720), Pearson correlation (r), coefficient of determination (R2), Cronbach’s alpha, Bland–Altman (Bland and Altman, 1986), average relative error and t-test between differences Fresenius BCM-InBody720 for healthy controls and HD patients. The relative error was calculated as the absolute difference between the InBody 720 results and Fresenius BCM and divided by the result of Fresenius BCM, and the average relative error was calculated. The Bland–Altman method for assessing agreement (Bland and Altman, 1986) was calculated with the MedCalc software (version 14.8.1; MedCalc®, Belgium). To calculate Bland–Altman figures, we subtracted the Fresenius BCM values from the values obtained with the InBody 720. All statistical significances for t-test, Pearson correlation and Cronbach’s alpha were set to p < 0.05.

3. Results

Analysis of the Kolmogorov–Smirnov test showed that all variables were normally distributed in the total sample and in the cohorts of healthy controls and HD patients. Descriptive statistics are presented in Table 1. We observed higher mean values in all three cohorts (all participants, healthy controls and HD patients) for ICW and TBW measured with MF-BIA and higher values for fat mass and ECW measured with BIS. There were high positive correlations in the sample of all participants between the parameters MF-BIA and BIS for ICW (r = 0.80, p < 0.01) and TBW (r = 0.84, p < 0.01) and a very high positive correlation for ECW (r = 0.91, p < 0.01) and fat mass (r = 0.90 p < 0.01). When comparing healthy controls and HD patients, we observed a higher correlation between both methods in healthy controls in ICW (r = 0.86 vs. r = 0.68, p < 0.01) and fat mass (r = 0.95 vs. r = 0.85, p < 0.01), while in HD patients, we found higher correlations between both methods in ECW (r = 0.92 vs. r = 0.87, p < 0.01). Paired differences between devices for all parameters of interest are presented in Figure 2.
The paired t-test showed significant differences in mean values (p < 0.0001) in all cohorts across all variables (ICW, ECW, TBW and fat mass). In the all participants sample, we found significant differences (p < 0.0001) in ICW, ECW, TBW and fat mass between measurements performed with MF-BIA and BIS. The largest relative difference (average relative error) was observed for ICW and fat mass, and the smallest relative differences were in ECW and TBW. Nevertheless, significant differences in the mean values between all variables, MF-BIA and BIS appeared to have good (0.8 ≥ α > 0.9) or excellent (0.9 ≥ α) internal consistency. The highest and excellent internal consistency was found in the fat mass variables (all participants α = 0.94, healthy controls α = 0.97 and HD patients α = 0.91) and the lowest but still good (all participants α = 0.89, HD patients α = 0.80) internal consistency was found in ICW.
The paired t-test did not reveal differences in between-method differences between healthy controls and HD patients. Results of paired t-tests are presented in Table 2.
Bland–Altman plots were created for each of the three cohorts (all participants, healthy controls, HD patients) compared with each variable by MF-BIA and BIS method. In this approach, the difference between the measurements (MF-BIA and BIS) is plotted against the average of the measurements (MF-BIA + BIS divided by 2) to investigate whether the residual or difference scores are biased by the magnitude of the variable (ICW, ECW, TBW of fat mass). Bland–Altman plots showed wide limits for all four variables in the all participants sample when comparing MF-BIA and BIS, with significant average biases of −5.3 (95% CI −10.1; −0.6) for ICW, 1.5 (95% CI: −0.5, 3.4) for ECW, −3.7 (95% CI: −10.3, 2.9) for TBW and 4.6 (95% CI: −3.9, 13.0) for fat mass (Figure 3).
Bland–Altman plots showed wide limits for all four variables in healthy controls when comparing MF-BIA and BIS, with significant average biases of −5.6 (95% CI −8.8 to −2.3) for ICW, 1.27 (95% CI −0.59 to 3.13) for ECW, −3.9 (95% CI −10.5 to 2.7) for TBW and 4.9 (95% CI −1.1 to 10.9) for fat mass (Figure 4).
Bland–Altman plots showed wide limits for all four variables in HD patients when comparing MF-BIA and BIS, with significant average biases of −5.1 (95% CI −10.9 to 0.8) for ICW, 1.6 (95% CI −0.4 to 3.7) for ECW, −3.5 (95% CI −10.1 to 3.2) for TBW and 4.2 (95% CI −6.2 to 14.6) for fat mass (Figure 5).

4. Discussion

Achieving the optimal management of fluid status is a key goal for dialysis patients [40]. MF-BIA and BIS equipment is increasingly being used in dialysis centers to assist in the determination of dry weight [15], as clinicians and patients have difficulty setting and maintaining target weights for optimal fluid status [40]. The present study, therefore, compared the results of BIA InBody 720 and the BIS BCM Fresenius machine and investigated the agreement and compatibility between body composition monitors in HD patients and healthy controls. According to the literature review, most studies assessing fluid status were conducted using the BIS [41] or MF-BIA methodology [20,42,43,44]. Only a few studies were conducted comparing two different methods of body composition assessment, mostly BIS with conventional [41] or dual-energy X-ray absorptiometry [45,46], and only two comparing BIS and BIA [47,48]. However, few studies were performed on patients, and only one study compared BIS and MF-BIA methods in HD patients [49], but with different monitors. To the best of our knowledge, this is the first study to compare ICW, ECW, TBW and fat mass measured with InBody 720 and Fresenius BCM in healthy and HD male patients. To the best of our knowledge, it includes one of the largest cohorts of healthy controls and HD patients using two different approaches to assess body composition and fluid status.
Among the most important results are the following: (i) MF-BIA and BIS devices provide us with significantly different results in measuring body composition parameters in healthy men and HD patients. In addition, the analysis of MF-BIA and BIS indicates a significant bias in body composition between the two methods; (ii) both methods show high or very high correlations between variables measured with one technique or the other; (iii) the results are similar in all three cohorts, and the Cronbach alpha values as a measure of internal consistency between the two technologies are high (all above 0.80 value); (iv) despite different methods, the factor analysis extracted two factors, the factor of water and the factor of body fat, in all three cohorts.
Our results show that MF-BIA provides statistically different results for ICW, ECW, TBW and fat mass measurements in healthy males and HD male patients, which is consistent with the results of Lee and colleagues (2019) [49]. On average, MF-BIA recorded up to 25% higher values for ICW, up to 10% higher values for TBW, up to 10% lower values for ECW and up to 20% lower for body fat. The reported differences are likely due to a different number of frequencies [49,50] or different equations and assumptions used [46]. In addition, MF-BIA has been shown to overestimate TBW in overweight and obese patients compared to other methods, and using MF-BIA to estimate fat mass was not the most reliable method [46]. However, both technologies show high correlations and reported more than 50% of the common variance for all body composition variables in all cohorts, except HD patients, where the common variance in ICW fell below 50%. In addition, the internal consistency between the two technologies appeared to be high (Cronbach alpha > 0.80), and the results were similar in all three cohorts.
The correlations between the variables within the Bland–Altman plots were all below 0.30, so we can conclude that the differences are random, as shown in Figure 2, Figure 3 and Figure 4. The figures also show random differences between the BIA and BIS technologies, which was also confirmed with non-significant results from the t-test. Generally, devices using different bioimpedance techniques are easy to use and inexpensive, but they are all based on estimates [51]. They use various equations and assumptions [52], and irregularity and disturbances of fluid flow can greatly affect the agreement of the results. HD patients present a wide spectrum of these abnormalities, whereby proper use of these techniques can be problematic.

Limitations

In light of current research, several considerations need to be made. Although both methods provided reasonable and similar estimates of ICW, ECW, TBW and body fat, these results should be reported with caution. The main limitation of the present article is the process of patient selection, as a nonrandomized selection of patients may introduce a large bias in the results. Nevertheless, in the present study, we included all available male patients from different hemodialysis centers in the country, which reduced the possibility of bias in the results. It is possible that the manufacturer of one or the other machine may make changes to the programmed equations in the future, thereby invalidating the results of the present study. Secondly, MF-BIA and BIS are based on an adult-specific reference population, which is a limitation since this machine was not tested on the same population as in the present study. Thirdly, these data should not be used for interpretation at the individual level, as there was a high degree of individual variability, as shown by the wide limits of agreement on the Bland–Altman plots. Finally, only males were included in the present study, so we cannot generalize the results to both genders.
In the context of body composition follow-up in HD population, a rather wide limit of agreement between both methods clearly suggests that a single chosen modality should be used to follow longitudinally individual patients. Since clinicians rely on extracellular water data (and the overhydration parameter in the case of BCM) daily to plan the ultrafiltration goals and the average relative error was smallest for this parameter, one could conditionally allow for usage of ECW data from both modalities in the same patients. However, a between-method correction in the order of 8% (with BCM value being larger) is suggested by our results.

5. Conclusions

In summary, the MF-BIA InBody 720 device compared to the BIS BCM device yielded significantly larger TBW and ICW estimates and significantly smaller ECW and body fat estimates in HD patients. These differences were similar in the cohort of healthy controls. The mean relative differences in the order of 8% were smallest for ECW and TBW, but the limits of agreement were still wide enough to be clinically significant. Therefore, the results of measurements with InBody 720 and BCM cannot be used interchangeably. Physicians and dietitians involved in the care of HD patients should be aware of this discrepancy between the two devices and try to use the same device to track body composition longitudinally in their HD population.

Author Contributions

Conceptualization, J.P. and M.P.; methodology, J.P.; software J.P.; formal analysis, J.P.; investigation, M.P., V.S., I.Č., J.Š. and J.P.; resources, J.P. and M.P.; data curation, M.P., V.S. and J.P.; writing—original draft preparation, J.P., J.Š., I.Č., V.S. and M.P.; writing—review and editing, J.P., I.Č., V.S., J.Š. and M.P.; visualization, V.S. and J.P.; supervision, J.P.; project administration, J.P.; funding acquisition, J.P. All authors have read and agreed to the published version of the manuscript.

Funding

This research was funded by Slovenian Research Agency within the Research project L3-1383 (J.P.), Bio-psycho-social context of kinesiology No P5-0142 (V.S.) and Kinesiology of monostructural, polystructural and conventional sports No P5-0147 (M.P. and I.Č.).

Institutional Review Board Statement

The study was conducted according to the guidelines of the Declaration of Helsinki, and approved by the Slovenian National Medical Ethics Committee (protocol code 125/05/14, 3.6.2014).

Informed Consent Statement

Informed consent was obtained from all subjects involved in the study.

Data Availability Statement

Data generated and analyzed during this study are included in this article. Additional data are available from the corresponding author on request.

Conflicts of Interest

The authors declare no conflict of interest.

References

  1. Dziubek, W.; Bulińska, K.; Kusztal, M.; Kowalska, J.; Rogowski, Ł.; Zembroń-Łacny, A.; Gołębiowski, T.; Ochmann, B.; Pawlaczyk, W.; Klinger, M.; et al. Evaluation of Exercise Tolerance in Dialysis Patients Performing Tai Chi Training: Preliminary Study. Evid. Based Complementary Altern. Med. 2016, 2016, 5672580. [Google Scholar] [CrossRef] [PubMed] [Green Version]
  2. Leavey, S.F.; McCullough, K.; Hecking, E.; Goodkin, D.; Port, F.K.; Young, E.W. Body mass index and mortality in ‘healthier’ as compared with ‘sicker’ haemodialysis patients: Results from the Dialysis Outcomes and Practice Patterns Study (DOPPS). Nephrol. Dial. Transpl. 2001, 16, 2386–2394. [Google Scholar] [CrossRef] [PubMed] [Green Version]
  3. Kalantar-Zadeh, K.; Abbott, K.C.; Salahudeen, A.K.; Kilpatrick, R.D.; Horwich, T.B. Survival advantages of obesity in dialysis patients. Am. J. Clin. Nutr. 2005, 81, 543–554. [Google Scholar] [CrossRef] [PubMed]
  4. Shinaberger, C.S.; Kilpatrick, R.D.; Regidor, D.L.; McAllister, C.J.; Greenland, S.; Kopple, J.D.; Kalantar-Zadeh, K. Longitudinal Associations Between Dietary Protein Intake and Survival in Hemodialysis Patients. Am. J. Kidney Dis. 2016, 48, 37–49. [Google Scholar] [CrossRef] [PubMed] [Green Version]
  5. Noguchi, M.; Yamaguchi, S.; Koshino, Y.; Kimura, A.; Miyagi, S. Validity of body impedance analysis for evaluating body composition in patients undergoing long-term hemodialysis. J. Phys. Ther. Sci. 2015, 27, 1649–1652. [Google Scholar] [CrossRef] [Green Version]
  6. Paudel, K.; Visser, A.; Burke, S.; Samad, N.; Fan, S.L. Can Bioimpedance Measurements of Lean and Fat Tissue Mass Replace Subjective Global Assessments in Peritoneal Dialysis Patients? J. Ren. Nutr. 2015, 25, 480–487. [Google Scholar] [CrossRef]
  7. Huang, C.X.; Tighiouart, H.; Beddhu, S.; Cheung, A.K.; Dwyer, J.T.; Eknoyan, G.; Beck, G.J.; Levey, A.S.; Sarnak, M.J. Both low muscle mass and low fat are associated with higher all-cause mortality in hemodialysis patients. Kidney Int. 2010, 77, 624–629. [Google Scholar] [CrossRef] [Green Version]
  8. Savalle, M.; Gillaizeau, F.; Maruani, G.; Puymirat, E.; Bellenfant, F.; Houillier, P.; Fagon, J.-Y.; Faisy, C. Assessment of body cell mass at bedside in critically ill patients. AJP Endocrinol. Metab. 2012, 303, E389–E396. [Google Scholar] [CrossRef]
  9. Talluri, A.; Liedtke, R.; Mohamed, E.I.; Maiolo, C.; Martinoli, R.; De Lorenzo, A. The application of body cell mass index for studying muscle mass changes in health and disease conditions. Acta Diabetol. 2003, 40, S286–S289. [Google Scholar] [CrossRef]
  10. Kakiya, R.; Shoji, T.; Tsujimoto, Y.; Tatsumi, N.; Hatsuda, S.; Shinohara, K.; Kimoto, E.; Tahara, H.; Koyama, H.; Emoto, M.; et al. Body fat mass and lean mass as predictors of survival in hemodialysis patients. Kidney Int. 2006, 70, 549–556. [Google Scholar] [CrossRef] [Green Version]
  11. Broers, N.J.H.; Usvyat, L.A.; Marcelli, D.; Bayh, I.; Scatizzi, L.; Canaud, B.; van der Sande, F.M.; Kotanko, P.; Moissl, U.; Kooman, J.P. Season affects body composition and estimation of fluid overload in haemodialysis patients: Variations in body composition; a survey from the European MONDO database. Nephrol. Dial. Transpl. 2014, 30, 678–681. [Google Scholar] [CrossRef] [PubMed] [Green Version]
  12. Khalil, S.F.; Mohktar, M.S.; Ibrahim, F. The theory and fundamentals of bioimpedance analysis in clinical status monitoring and diagnosis of diseases. Sensors 2014, 14, 10895–10928. [Google Scholar] [CrossRef] [PubMed]
  13. Kutáč, P.; Kopecký, M. Comparison of body fat using various bioelectrical impedance analyzers in university students. Acta Gymnica 2015, 45, 177–186. [Google Scholar] [CrossRef] [Green Version]
  14. Reddan, D.N.; Szczech, L.A.; Hasselblad, V.; Lowrie, E.G.; Lindsay, R.M.; Himmelfarb, J.; Owen, W.F. Intradialytic blood volume monitoring in ambulatory hemodialysis patients: A randomized trial. J. Am. Soc. Nephrol. 2005, 16, 2162–2169. [Google Scholar] [CrossRef] [Green Version]
  15. Chamney, P.W.; Kramer, M.; Rode, C.; Kleinekofort, W.; Wizemann, V. A new technique for establishing dry weight in hemodialysis patients via whole body bioimpedance. Kidney Int. 2002, 61, 2250–2258. [Google Scholar] [CrossRef] [Green Version]
  16. Kaysen, G.A.; Zhu, F.; Sarkar, S.; Heymsfield, S.B.; Wong, J.; Kaitwatcharachai, C.; Kuhlmann, M.K.; Levin, N.W. Estimation of total-body and limb muscle mass in hemodialysis patients by using multifrequency bioimpedance spectroscopy. Am. J. Clin. Nutr. 2005, 82, 988–995. [Google Scholar] [CrossRef] [Green Version]
  17. Devolder, I.; Verleysen, A.; Vijt, D.; Vanholder, R.; Van Biesen, W. Body composition, hydration, and related parameters in hemodialysis versus peritoneal dialysis patients. Perit. Dial. Int. 2010, 30, 208–214. [Google Scholar] [CrossRef] [Green Version]
  18. Davenport, A. Effect of Intra-abdominal Dialysate on Bioimpedance-Derived Fluid Volume Status and Body Composition Measurements in Peritoneal Dialysis Patients. Perit. Dial. Int. 2013, 33, 578–579. [Google Scholar] [CrossRef] [Green Version]
  19. Guo, Q.; Yi, C.; Li, J.; Wu, X.; Yang, X.; Yu, X. Prevalence and Risk Factors of Fluid Overload in Southern Chinese Continuous Ambulatory Peritoneal Dialysis Patients. PLoS ONE 2013, 8, 1–10. [Google Scholar] [CrossRef] [Green Version]
  20. Panorchan, K.; Nongnuch, A.; El-Kateb, S.; Goodlad, C.; Davenport, A. Changes in muscle and fat mass with haemodialysis detected by multi-frequency bioelectrical impedance analysis. Eur. J. Clin. Nutr. 2015, 69, 1109–1112. [Google Scholar] [CrossRef] [Green Version]
  21. Fürstenberg, A.; Davenport, A. Assessment of Body Composition in Peritoneal Dialysis Patients Using Bioelectrical Impedance and Dual-Energy X-Ray Absorptiometry. Am. J. Nephrol. 2011, 33, 150–156. [Google Scholar] [CrossRef] [PubMed]
  22. Kumar, S.; Khosravi, M.; Massart, A.; Potluri, M.; Davenport, A. Are serum to dialysate sodium gradient and segmental bioimpedance volumes associated with the fall in blood pressure with hemodialysis? Int. J. Artif. Organs 2014, 37, 21–28. [Google Scholar] [CrossRef] [PubMed]
  23. Kandouz, S.; Mohamed, A.S.; Zheng, Y.; Sandeman, S.; Davenport, A. Reduced protein bound uraemic toxins in vegetarian kidney failure patients treated by haemodiafiltration. Hemodial. Int. 2016, 20, 610–617. [Google Scholar] [CrossRef] [PubMed] [Green Version]
  24. Oei, E.; Paudel, K.; Visser, A.; Finney, H.; Fan, S.L. Is overhydration in peritoneal dialysis patients associated with cardiac mortality that might be reversible? World J. Nephrol. 2016, 5, 448–454. [Google Scholar] [CrossRef]
  25. Moissl, U.; Arias-Guillén, M.; Wabel, P.; Fontseré, N.; Carrera, M.; Campistol, J.M.; Maduell, F. Bioimpedance-Guided Fluid Management in Hemodialysis Patients. Clin. J. Am. Soc. Nephrol. 2013, 8, 1575–1582. [Google Scholar] [CrossRef] [Green Version]
  26. Wabel, P.; Chamney, P.; Moissl, U.; Jirka, T. Importance of whole-body bioimpedance spectroscopy for the management of fluid balance. Blood Purif. 2009, 27, 75–80. [Google Scholar] [CrossRef]
  27. Grangé, S.; Hanoy, M.; Le Roy, F.; Guerrot, D.; Godin, M. Monitoring of hemodialysis quality-of-care indicators: Why is it important? BMC Nephrol. 2013, 14, 109. [Google Scholar] [CrossRef] [Green Version]
  28. Passauer, J.; Petrov, H.; Schleser, A.; Leicht, J.; Pucalka, K. Evaluation of clinical dry weight assessment in haemodialysis patients using bioimpedance spectroscopy: A cross-sectional study. Nephrol. Dial. Transpl. 2010, 25, 545–551. [Google Scholar] [CrossRef] [Green Version]
  29. National Institute for Health and Care Excellence. The BCM—Body Composition Monitor for Managing Fluid in People Ha Having Ving Dialysis; National Institute for Health and Care Excellence: London, UK, 2015. [Google Scholar]
  30. Medrano, G.; Leonhardt, S.; Zhang, P. Modeling the Influence of Body Position in Bioimpedance Measurements. In Proceedings of the 2007 29th Annual International Conference of the IEEE Engineering in Medicine and Biology Society, Lyon, France, 22–26 August 2007; pp. 3934–3937. [Google Scholar]
  31. Kyle, U.G.; Bosaeus, I.; De Lorenzo, A.D.; Deurenberg, P.; Elia, M.; Gómez, J.M.; Heitmann, B.L.; Kent-Smith, L.; Melchior, J.-C.; Pirlich, M.; et al. Bioelectrical impedance analysis-part I: Review of principles and methods. Clin. Nutr. 2004, 23, 1226–1243. [Google Scholar] [CrossRef]
  32. Chamney, P.W.; Wabel, P.; Moissl, U.M.; Müller, M.J.; Bosy-Westphal, A.; Korth, O.; Fuller, N.J. A whole-body model to distinguish excess fluid from the hydration of major body tissues. Am. J. Clin. Nutr. 2007, 85, 80–89. [Google Scholar] [CrossRef] [Green Version]
  33. Davenport, A.; Hussain Sayed, R.; Fan, S. The effect of racial origin on total body water volume in peritoneal dialysis patients. Clin. J. Am. Soc. Nephrol. 2011, 6, 2492–2498. [Google Scholar] [CrossRef] [PubMed] [Green Version]
  34. Fan, S.; Davenport, A. Does Loss of Residual Renal Function Lead to Increased Volume Overload and Hypertension in Peritoneal Dialysis Patients? Perit. Dial. Int. 2015, 35, 753–755. [Google Scholar] [CrossRef] [PubMed] [Green Version]
  35. Fan, S.; Davenport, A. Does increased glucose exposure lead to increased body fat and reduced lean body mass in anuric peritoneal dialysis patients? Eur. J. Clin. Nutr. 2014, 68, 1253–1254. [Google Scholar] [CrossRef] [PubMed]
  36. McCafferty, K.; Fan, S.; Davenport, A. Extracellular volume expansion, measured by multifrequency bioimpedance, does not help preserve residual renal function in peritoneal dialysis patients. Kidney Int. 2014, 85, 151–157. [Google Scholar] [CrossRef] [PubMed] [Green Version]
  37. Ling, C.H.Y.; de Craen, A.J.M.; Slagboom, P.E.; Gunn, D.A.; Stokkel, M.P.M.; Westendorp, R.G.J.; Maier, A.B. Accuracy of direct segmental multi-frequency bioimpedance analysis in the assessment of total body and segmental body composition in middle-aged adult population. Clin. Nutr. 2011, 30, 610–615. [Google Scholar] [CrossRef] [Green Version]
  38. Pelle, G.; Branche, I.; Kossari, N.; Tricot, L.; Delahousse, M.; Dreyfus, J.-F. Is 3-compartment bioimpedance spectroscopy useful to assess body composition in renal transplant patients? J. Ren. Nutr. 2013, 23, 363–366. [Google Scholar] [CrossRef]
  39. Bučar Pajek, M.; Čuk, I.; Leskošek, B.; Mlinšek, G.; Buturović Ponikvar, J.; Pajek, J. Six-minute walk test in renal failure patients: Representative results, performance analysis and perceived dyspnea predictors. PLoS ONE 2016, 11, e0150414. [Google Scholar] [CrossRef] [Green Version]
  40. Tabinor, M.; Davies, S.J. The use of bioimpedance spectroscopy to guide fluid management in patients receiving dialysis. Curr. Opin. Nephrol. Hypertens. 2018, 27, 406–412. [Google Scholar] [CrossRef]
  41. Ponce, P.; Pham, J.; Gligoric-Fuerer, O.; Kreuzberg, U. Fluid management in haemodialysis: Conventional versus body composition monitoring (BCM) supported management of overhydrated patients. Port. J. Nephrol. Hypertens. 2014, 28, 239–248. [Google Scholar]
  42. Huan-Sheng, C.; Yeong-Chang, C.; Ming-Hsing, H.; Fan-Lieh, T.; Chu-Cheng, L.; Tsai-Kun, W.; Hung-Ping, C.; Sze-Hung, H.; Hsien-Chang, C.; Chia-Chen, L. Application of bioimpedance spectroscopy in Asian dialysis patients (ABISAD-III): A randomized controlled trial for clinical outcomes. Int. Urol. Nephrol. 2016, 48, 1897–1909. [Google Scholar] [CrossRef]
  43. Lara, D.M. Comparação da Pressão Arterial, Aferida por Mapa, Após Sessão de Hemodiálise, em Pacientes Submetidos à Avaliação Clínica ou Bioimpedância, Para Determinação de Peso Seco. Master’s Thesis, Universidade Federal do Rio Grande do Sul, Porto Alegre, Brazil, 2010. [Google Scholar]
  44. Onofriescu, M.; Hogas, S.; Voroneanu, L.; Apetrii, M.; Nistor, I.; Kanbay, M.; Covic, A.C. Bioimpedance-guided fluid management in maintenance hemodialysis: A pilot randomized controlled trial. Am. J. Kidney Dis. 2014, 64, 111–118. [Google Scholar] [CrossRef]
  45. Vermeiren, E.; Ysebaert, M.; Van Hoorenbeeck, K.; Bruyndonckx, L.; Van Dessel, K.; Van Helvoirt, M.; De Guchtenaere, A.; De Winter, B.; Verhulst, S.; Van Eyck, A. Comparison of bioimpedance spectroscopy and dual energy X-ray absorptiometry for assessing body composition changes in obese children during weight loss. Eur. J. Clin. Nutr. 2020, 1–12. [Google Scholar] [CrossRef]
  46. Rymarz, A.; Szamotulska, K.; Niemczyk, S. Comparison of skinfold thicknesses and bioimpedance spectroscopy to dual-energy x-ray absorptiometry for the body fat measurement in patients with chronic kidney disease. Nutr. Clin. Pract. 2017, 32, 533–538. [Google Scholar] [CrossRef] [PubMed]
  47. Jaffrin, M.Y.; Morel, H. Body fluid volumes measurements by impedance: A review of bioimpedance spectroscopy (BIS) and bioimpedance analysis (BIA) methods. Med. Eng. Phys. 2008, 30, 1257–1269. [Google Scholar] [CrossRef]
  48. Mager, J.R.; Sibley, S.D.; Beckman, T.R.; Kellogg, T.A.; Earthman, C.P. Multifrequency bioelectrical impedance analysis and bioimpedance spectroscopy for monitoring fluid and body cell mass changes after gastric bypass surgery. Clin. Nutr. 2008, 27, 832–841. [Google Scholar] [CrossRef] [PubMed] [Green Version]
  49. Lee, S.W.Y.; Ngoh, C.L.Y.; Chua, H.R.; Haroon, S.; Wong, W.K.; Lee, E.J.C.; Lau, T.W.L.; Sethi, S.; Teo, B.W. Evaluation of different bioimpedance methods for assessing body composition in Asian non-dialysis chronic kidney disease patients. Kidney Res. Clin. Pract. 2019, 38, 71. [Google Scholar] [CrossRef] [Green Version]
  50. Keane, D.F.; Baxter, P.; Lindley, E.; Moissl, U.; Pavitt, S.; Rhodes, L.; Wieskotten, S. The Body Composition Monitor: A flexible tool for routine fluid management across the haemodialysis population. Biomed. Phys. Eng. Express 2017, 3, 35017. [Google Scholar] [CrossRef] [PubMed] [Green Version]
  51. Mialich, M.S.; Sicchieri, J.M.F.; Junior, A.A.J. Analysis of body composition: A critical review of the use of bioelectrical impedance analysis. Int. J. Clin. Nutr. 2014, 2, 1–10. [Google Scholar]
  52. Mulasi, U.; Kuchnia, A.J.; Cole, A.J.; Earthman, C.P. Bioimpedance at the bedside: Current applications, limitations, and opportunities. Nutr. Clin. Pract. 2015, 30, 180–193. [Google Scholar] [CrossRef] [Green Version]
Figure 1. Sampling and measuring procedure flowchart.
Symmetry 13 00150 g001
Figure 2. Paired differences between both devices for ICW, ECW, TBW and fat mass.
Symmetry 13 00150 g002
Figure 3. Bland–Altman analysis comparing: ICW_F and ICW_I, ECW_F and ECW_I, TBW_F and TBW_I, and fat mass Fresenius and fat mass InBody 720 in all participants.
Symmetry 13 00150 g003
Figure 4. Bland–Altman analysis comparing: ICW_F and ICW_I, ECW_F and ECW_I, TBW_F and TBW_I, and fat mass Fresenius and fat mass InBody 720 in healthy controls.
Symmetry 13 00150 g004
Figure 5. Bland–Altman analysis comparing: ICW_F and ICW_I, ECW_F and ECW_I, TBW_F and TBW_I, and fat mass Fresenius and fat mass InBody 720 in HD patients.
Symmetry 13 00150 g005
Table 1. Descriptive statistics and statistical test results for all participants, healthy controls and HD patients.
SampleVariableMean ± SDSECVrMean. DiffCronbach
Alpha
Average
Rel. Error
AllICW_F22.87 ± 3.490.360.150.80−5.33 *0.890.24
ICW_I28.20 ± 4.010.400.14
ECW_F19.06 ± 2.380.240.120.911.45 *0.95−0.07
ECW_I17.60 ± 2.240.220.13
TBW_F41.92 ± 5.330.530.130.84−3.68 *0.910.08
TBW_I45.61 ± 6.250.620.14
FTM_F24.90 ± 9.820.970.390.904.55 *0.94−0.17
BFM_I20.35 ± 8.670.860.43
OH_F0.67 ± 1.210.081.80
Healthy controlsICW_F24.42 ± 3.030.420.100.86−5.58 *0.920.23
ICW_I30.00 ± 3.130.430.13
ECW_F19.62 ± 1.910.260.100.871.27 *0.93−0.06
ECW_I18.37 ± 1.790.250.10
TBW_F44.05 ± 4.440.620.100.77−3.91 *0.860.09
TBW_I47.97 ± 5.260.730.11
FTM_F24.70 ± 9.601.340.490.954.92 *0.97−0.19
BFM_I19.77 ± 8.501.190.34
OH_F0.63 ± 1.210.081.93
HD patientsICW_F21.30 ± 3.250.450.150.68−5.09 *0.800.24
ICW_I26.39 ± 4.010.560.15
ECW_F18.48 ± 2.650.370.140.921.63 *0.96−0.08
ECW_I16.85 ± 2.390.330.14
TBW_F39.79 ± 5.320.740.130.84−3.47 *0.910.08
TBW_I43.24 ± 6.310.880.15
FTM_F25.10 ± 10.141.410.400.854.18 *0.91−0.13
BFM_I20.91 ± 8.881.240.35
OH_F0.64 ± 1.220.081.89
Note: *—Sig. t-test < 0.001; SE—Standard error, CV—Coefficient of variation, r—Pearson correlation, R2—Coefficient of determination, HD patients—hemodialysis patients, ICW_F—intracellular water Fresenius, ICW_I—intracellular water InBody720, ECW_F—extracellular water Fresenius, ECW_I—extracellular water InBody720, TBW_F—total body water Fresenius, TBW_I—total body water InBody 720, FTM_F—fat mass Fresenius, BFM_I—fat mass InBody 720, OH_F—overhydration Fresenius.
Table 2. Comparison of between-method differences in healthy controls and HD patients.
Mean DifferenceSig.
Diff. ICW−0.490200.307
Diff. ECW−0.358820.072
Diff. TBW−0.454900.499
Diff. FM0.741180.389
Publisher’s Note: MDPI stays neutral with regard to jurisdictional claims in published maps and institutional affiliations.

