
Detection of Road Images Containing a Counterlight Using Multilevel Analysis

Department of Software Engineering, Sejong Cyber University, Seoul 05000, Korea
Symmetry 2021, 13(11), 2210; https://0-doi-org.brum.beds.ac.uk/10.3390/sym13112210
Submission received: 4 October 2021
/
Revised: 1 November 2021
/
Accepted: 6 November 2021
/
Published: 19 November 2021
Abstract
:In this paper, a method for detecting real-time images that include counterlight produced by the sun, is proposed. It involves applying a multistep analysis of the size, location, and distribution of bright areas in the image. In general, images containing counterlight have a symmetrically high brightness value at a specific location spread over an extremely large region. In addition, the distribution and change in brightness in that specific region have a symmetrically large difference compared with other regions. Through a multistep analysis of these symmetrical features, it is determined whether counterlight is included in the image. The proposed method presents a processing time of approximately 0.7 s and a detection accuracy of 88%, suggesting that the approach can be applied to a safe driving support system for autonomous vehicles.
1. Introduction
Improvements in vehicle infotainment and information technologies have led to the symmetrically increasing popularity of safe driving support systems. Technologies that support the safe driving of vehicles include lane departure guidance systems, traffic light recognition, and vehicle distance maintenance systems, which help vehicles drive more conveniently and safely [1,2,3,4]. Various sensors such as CCD, lidar, ultrasonic, infrared, and thermal imaging sensors are used in safe driving support systems [4,5,6]. Among these, CCD sensors are the most commonly used as they are inexpensive and can easily record roads in an image form. Most vehicle driving approaches depend on the driver’s perception of the driving conditions based on visual information [7,8]. Safe driving support through driving situation recognition based on the driver’s visual information is a symmetrical process. It is possible to prevent traffic accidents in advance by determining the driving situation quickly while driving. In order for the driver to quickly determine the driving situation, it is important to acquire visual information. CCD sensors are used to collect visual information, such as vehicle, lane, traffic light, and road sign recognition. Owing to the increase in computer processing performance and the symmetrically high performance of CCD sensors, both the object recognition performance and the image processing speed have improved. Thus, it is possible to recognize objects on the road such as vehicles and pedestrians in real-time, and the recognition results can be used to facilitate the driving operation of drivers or autonomous vehicles. Many vehicle black-box products, which are video recording devices, have been released and installed in vehicles to record road driving conditions in real time [9,10].
In South Korea, the law requires commercial taxis to be equipped with a black box to record both road images and the conditions inside the vehicle [9]. Other vehicles are also equipped with black boxes, which can be used for video analysis after an accident or for recording surrounding and indoor vehicle situations. However, various noises are included in the acquired image because the vehicle is driven in an outdoor road environment with different levels of brightness. In addition, it is difficult to recognize objects in images acquired by the black-box when there is counterlight caused by sunlight [11,12,13]. Counterlight in images that occurs when the sun is positioned in the driving direction of the vehicle makes object recognition through image processing particularly difficult. In a road image that includes a counterlight, the counterlight is significantly brighter than the surrounding brightness, and thus, the surrounding area of a vehicle, road lane, or traffic light is relatively dark. To effectively recognize the surrounding conditions of the road on behalf of the driver in an autonomous vehicle, information collection and an analysis of the outputs of various sensors are required. In particular, for safe driving, it is important to accurately and quickly recognize the road driving situations based on the driver’s visual information.
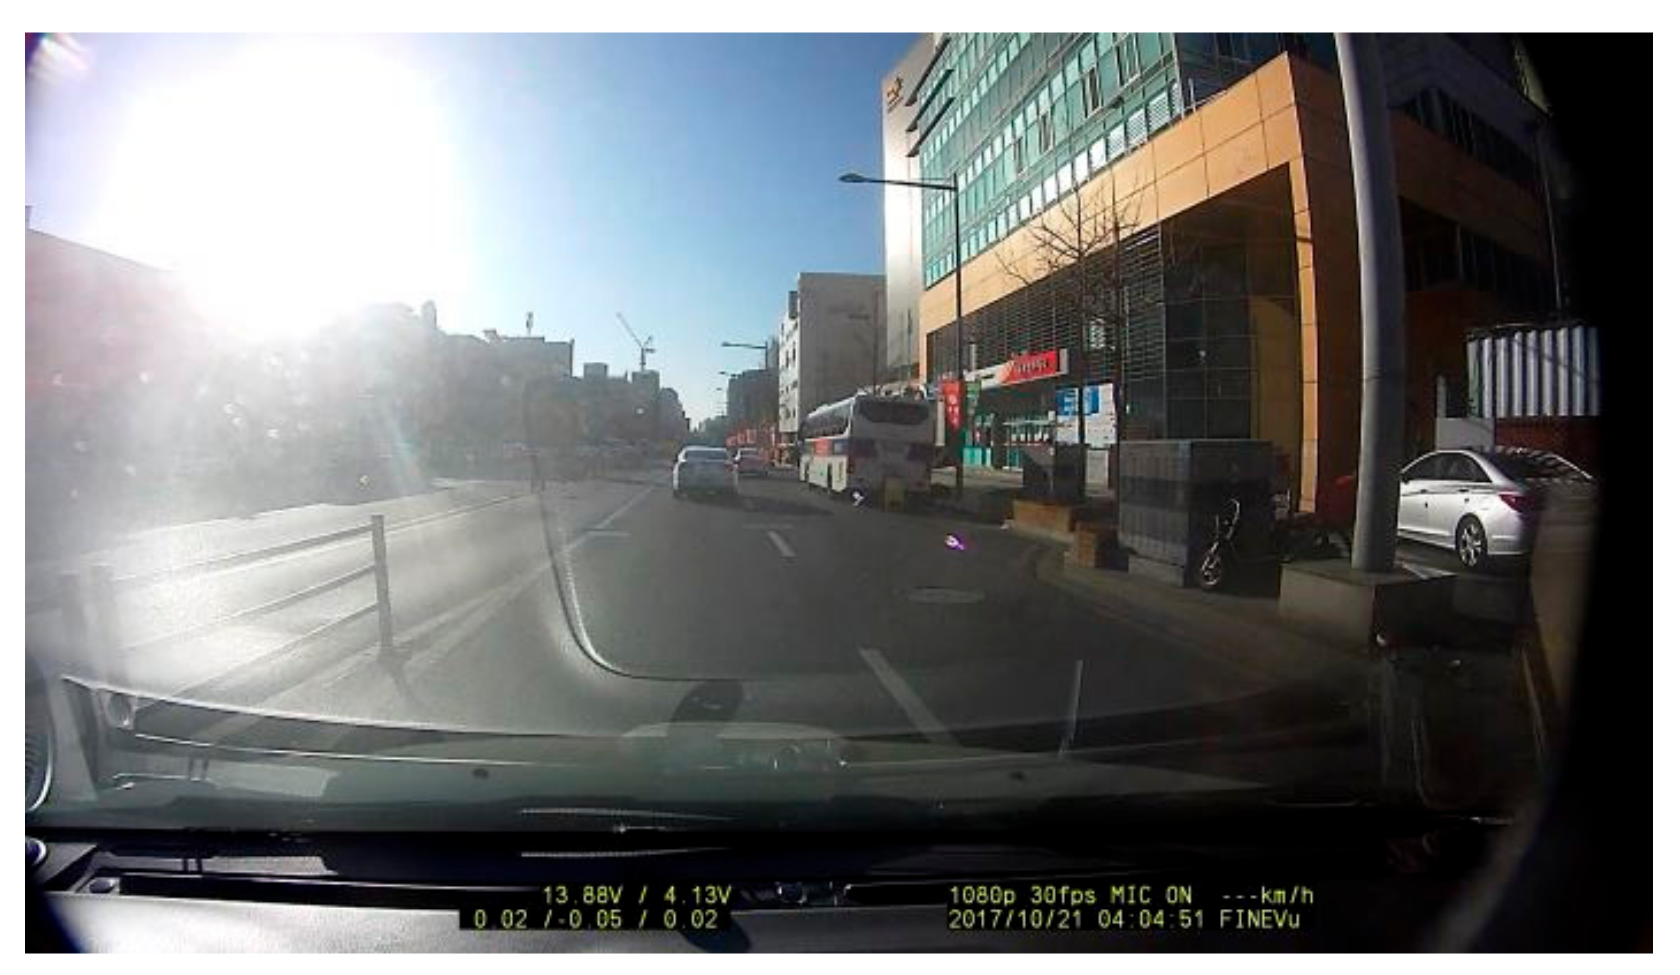
Digital video recording devices installed in vehicles have a pre-allocated amount of information that can be expressed per pixel, and thus large brightness values such as in a counterlight have an extremely large effect on the image. This creates a problem in that the dynamic range of the overall image brightness is limited. As shown in Figure 1, when a road image containing a bright counterlight is captured with a CCD sensor, the brightness value of the overall image is adjusted according to the bright area, and object areas with symmetrically lower brightness values are darkened. To minimize this limitation, it is necessary to apply an image quality enhancement [13,14] that emphasizes the brightness contrast of the objects in the image by enhancing the brightness values of other dark areas, excluding those areas that already have large brightness values.
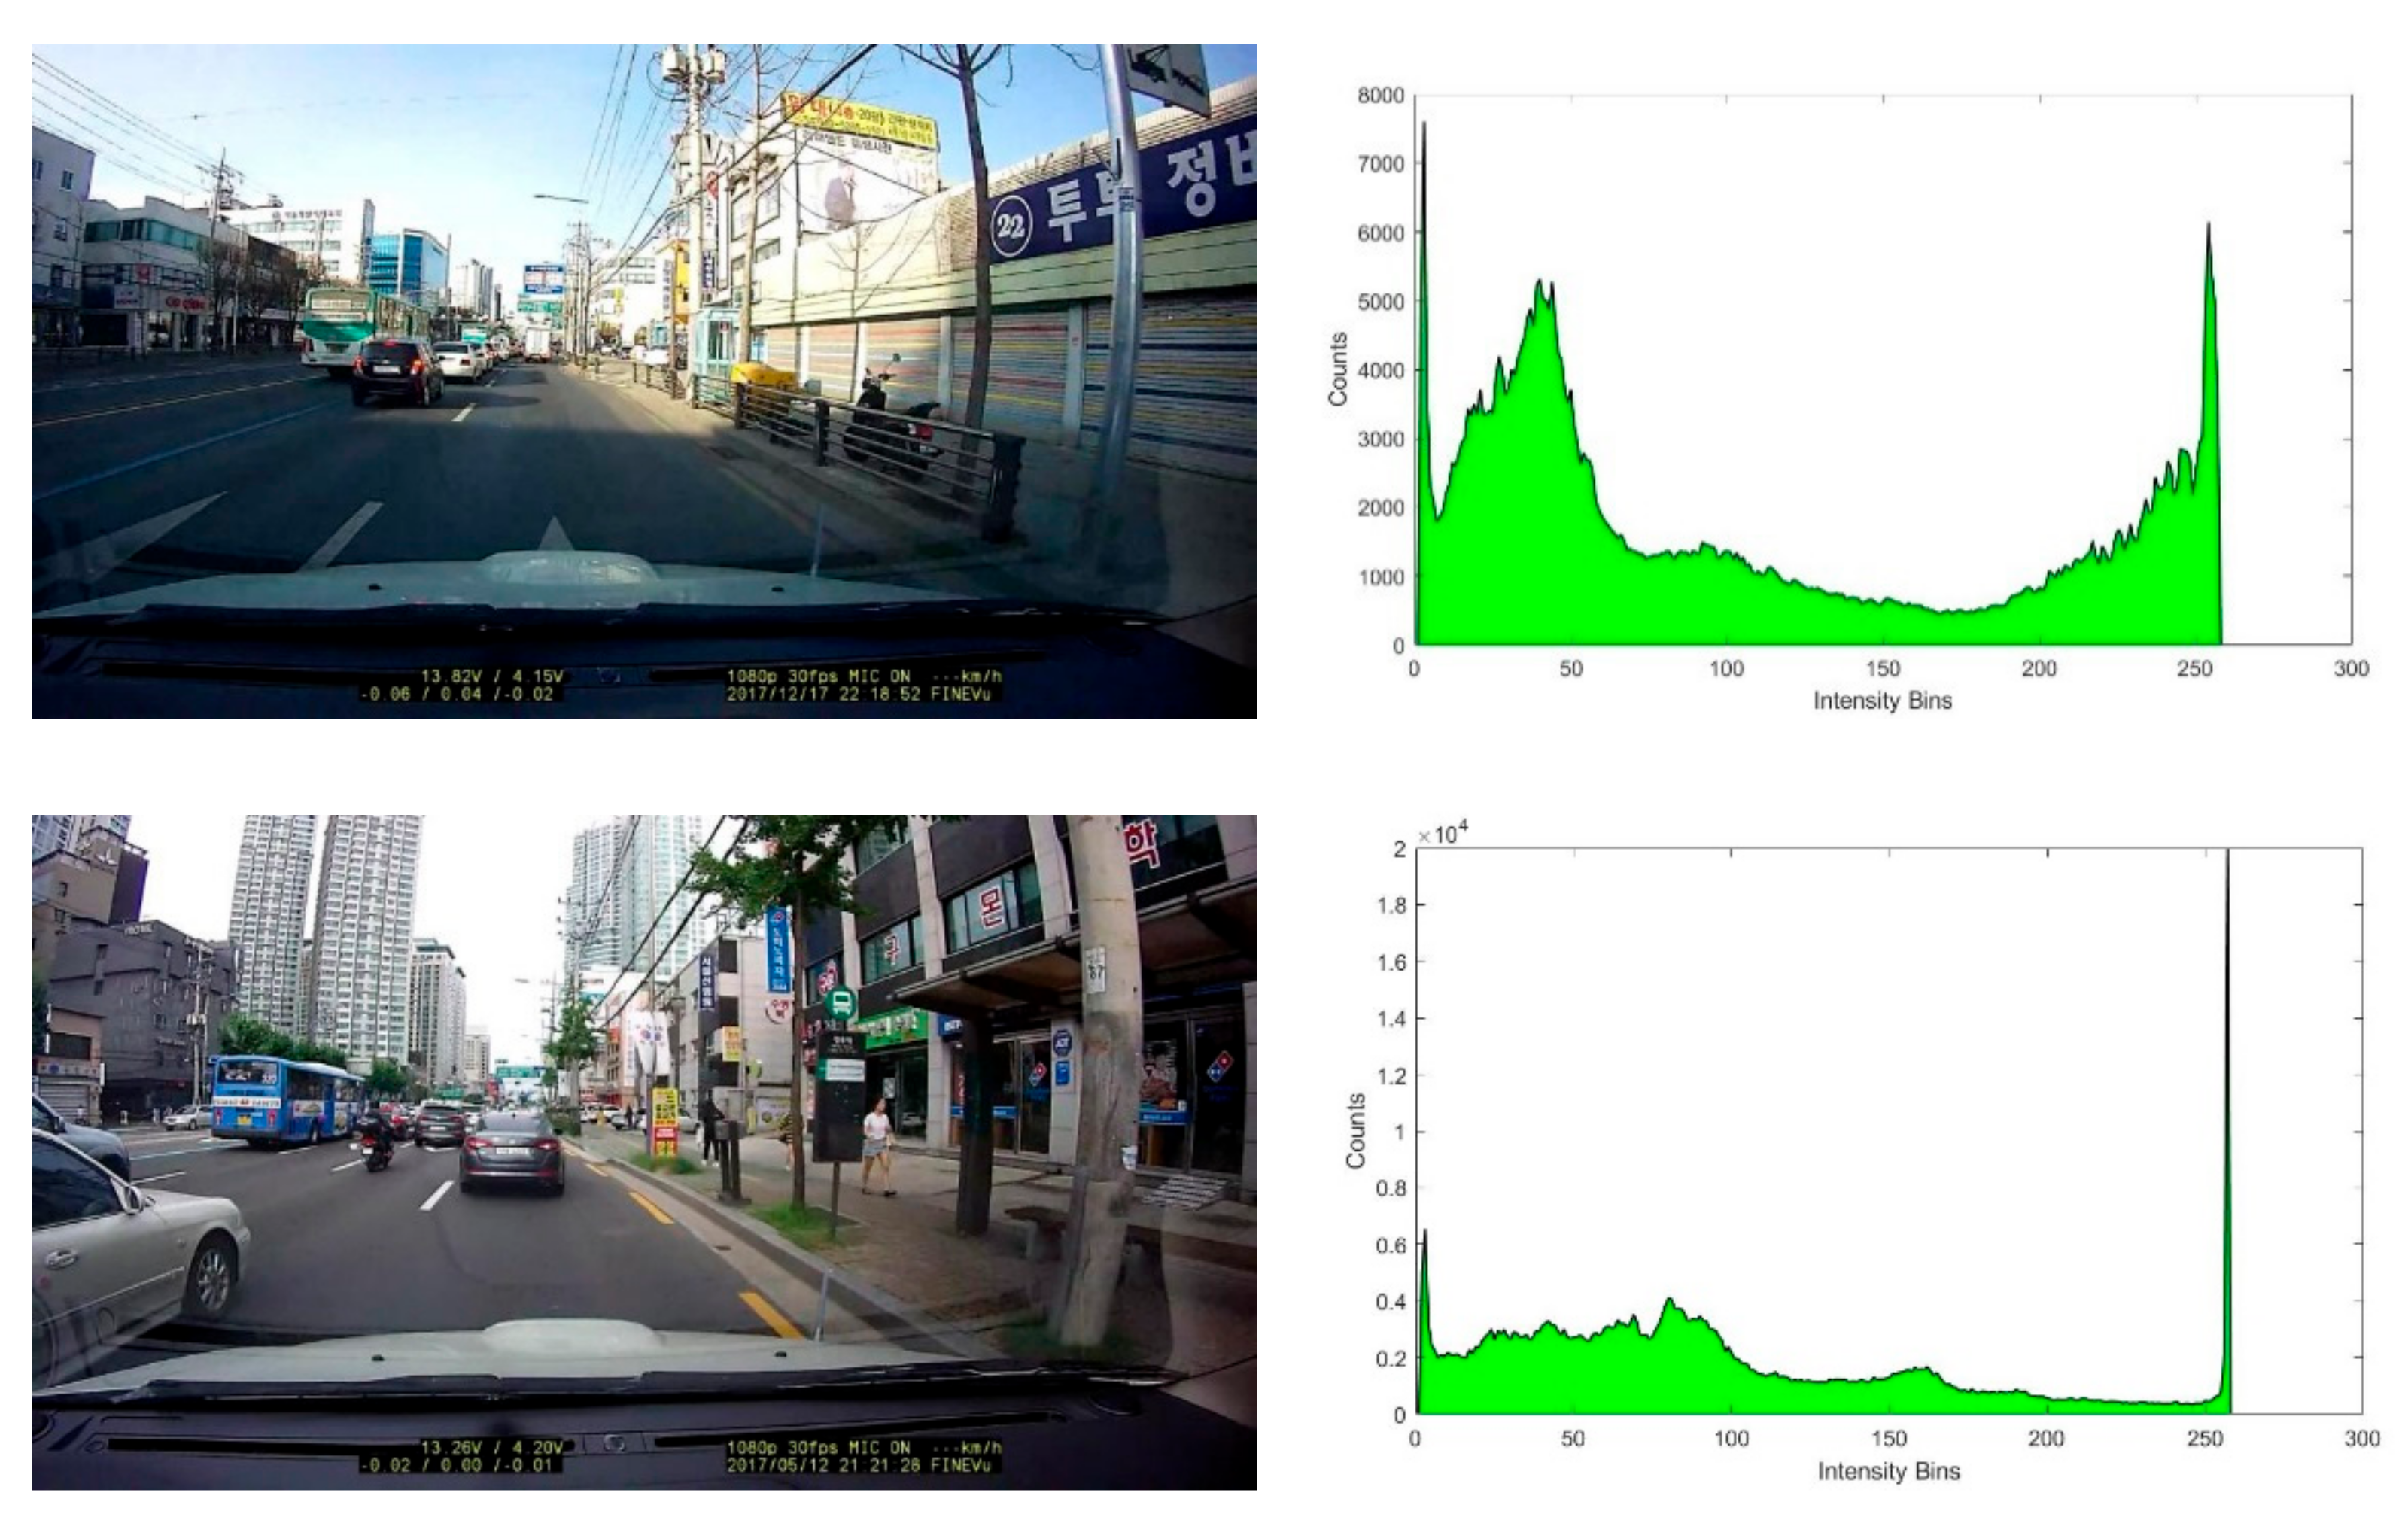
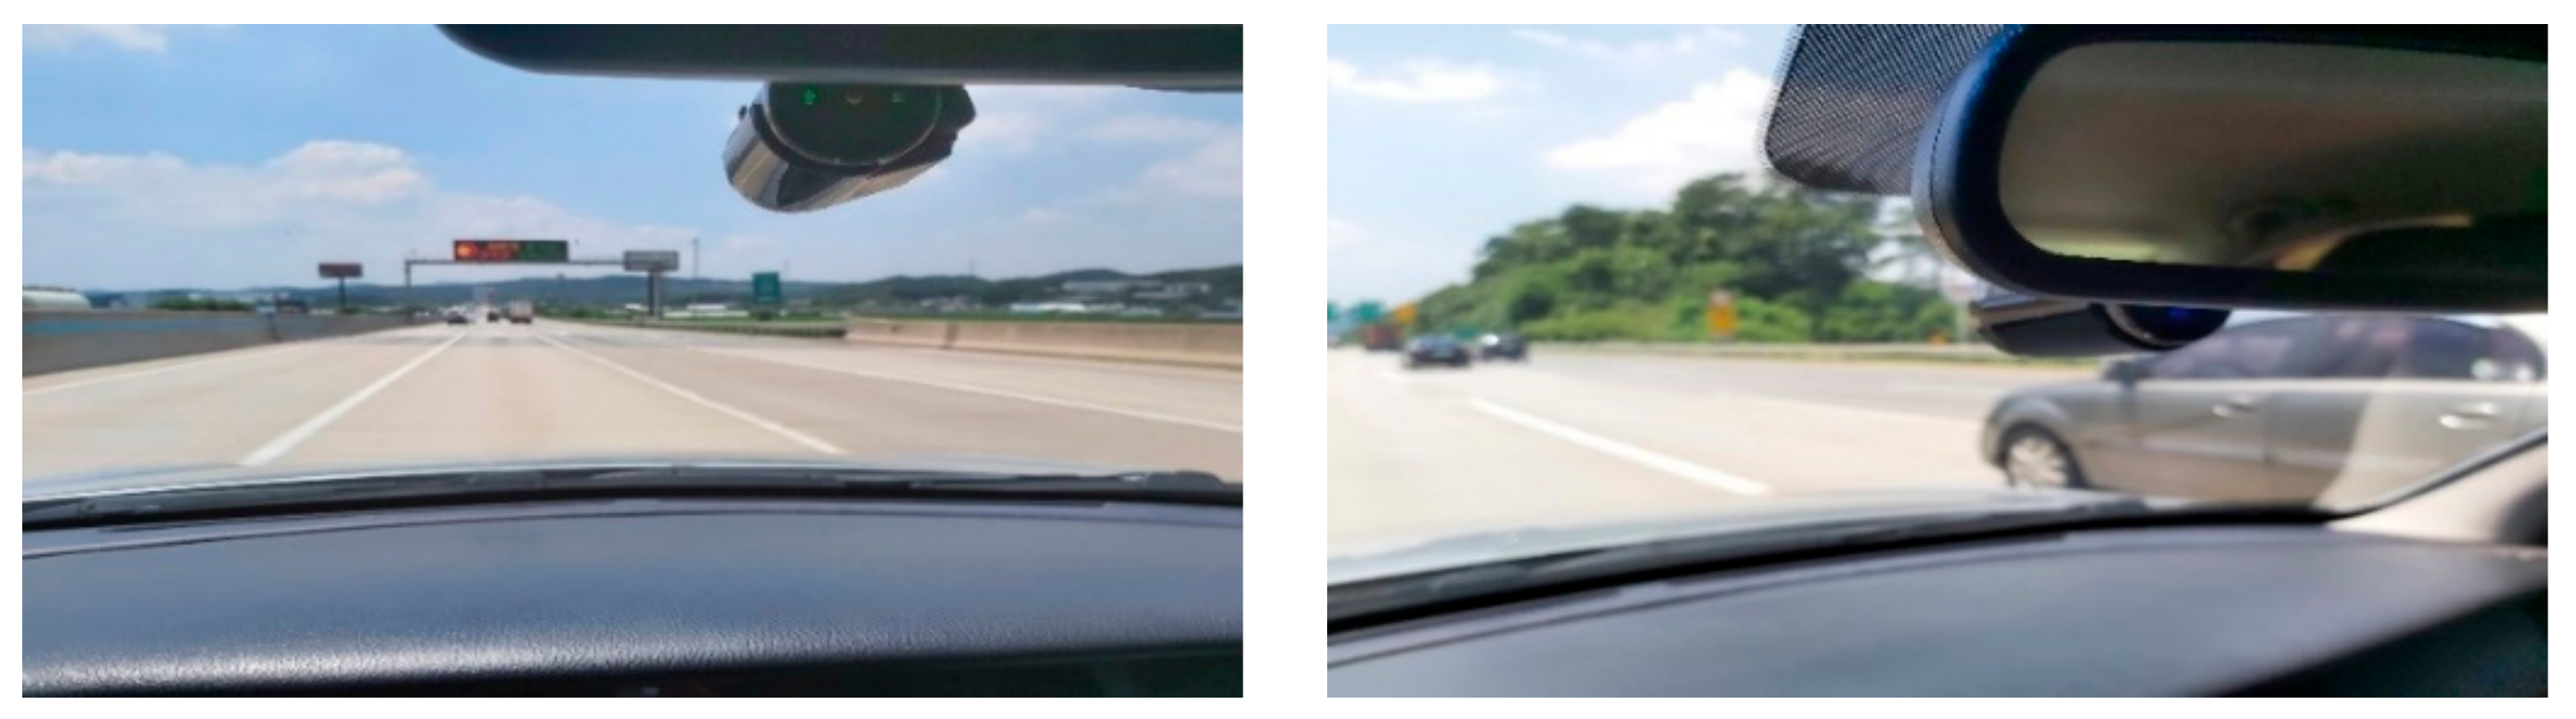
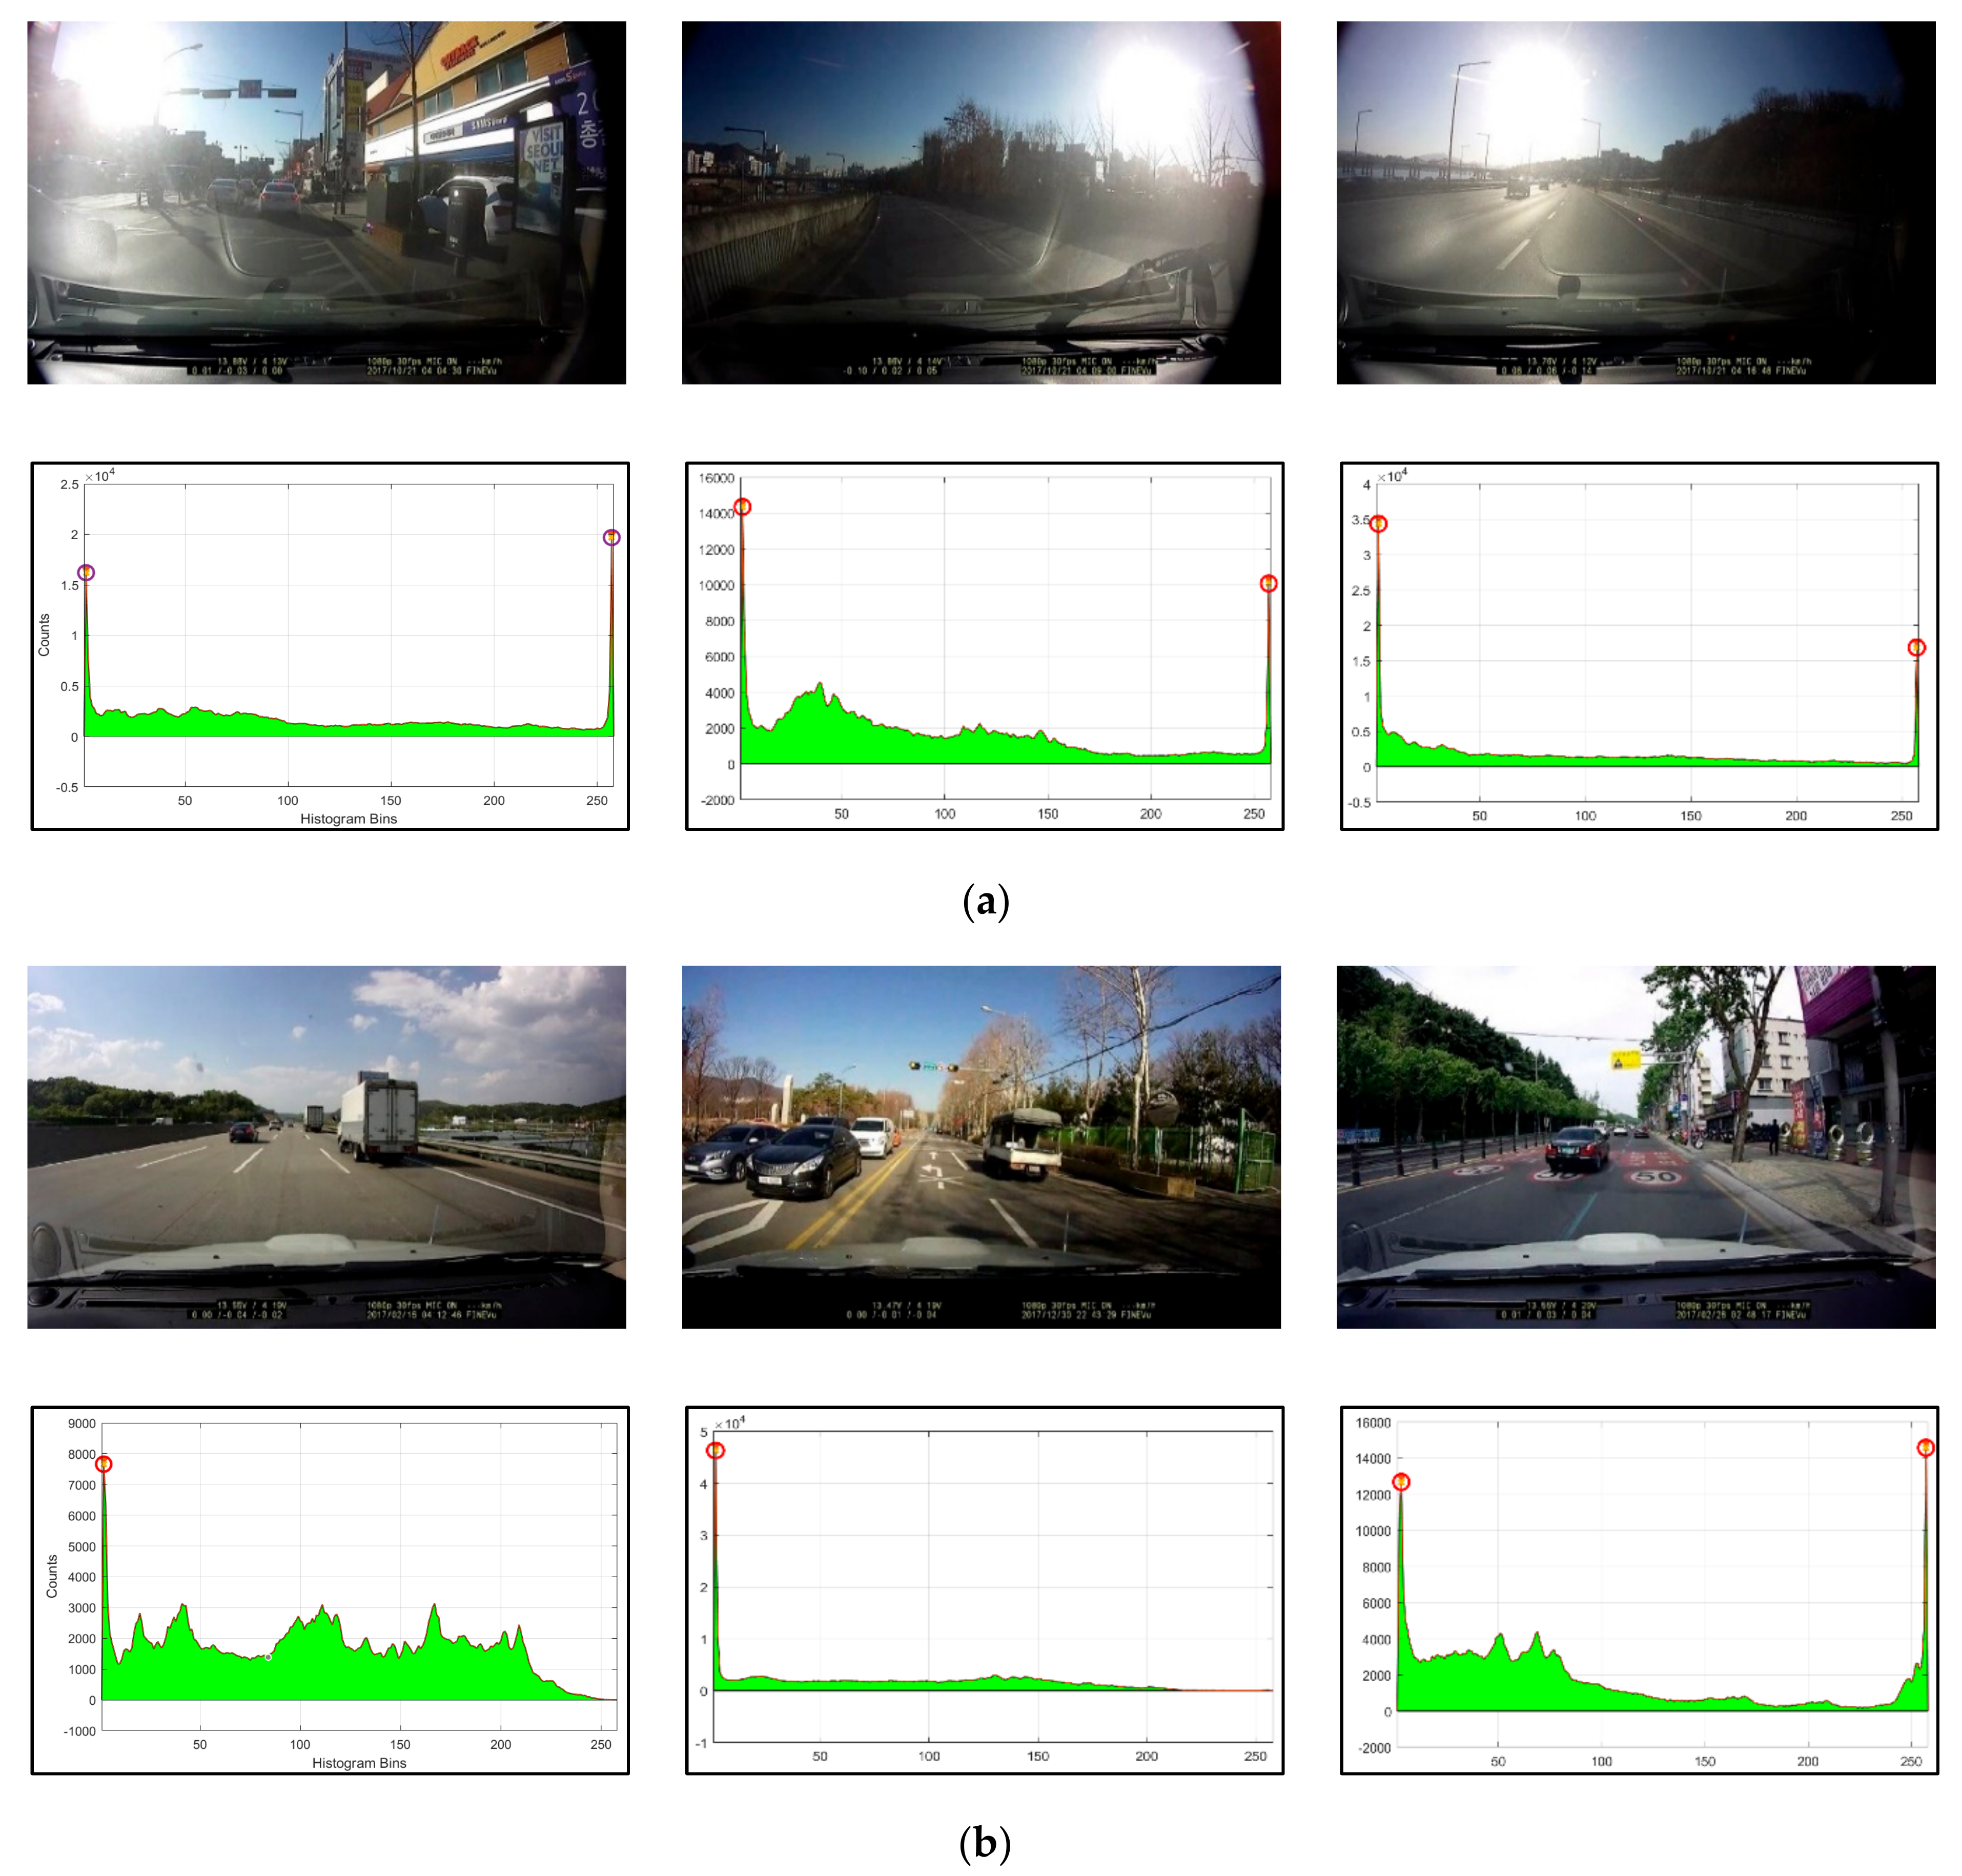
Various methods have been studied to overcome the limitations of lowlight areas caused by a counterlight [11,12,13,15,16,17]. One method proposed for brightening a low-illuminance area uniformly distributes the intensity values throughout the intensity histogram equalization of the image [18]. Research has also been conducted on improving the brightness value of low-light images by applying a retinex-based method [16,19]. To improve the brightness of the image, it is necessary to first determine whether the image contains a counterlight. The object detection or recognition rate can be improved by conducting an image improvement on every frame of the outdoor road driving image; however, real-time processing becomes symmetrically difficult when applying an image improvement on every frame. Real-time processing is essential for providing driver information related to safe driving under different road driving situations. Accordingly, it first needs to be determined whether the road image obtained includes a counterlight. In addition, because the image enhancement operation is performed only on an image including a detected counterlight, unnecessary image enhancement operations do not have to be applied to every frame. In previous studies, the presence or absence of a counterlight was detected based on a feature of the bimodal histogram distribution, in which the intensity histogram has two peaks near the values of 255 and 0 [11,12]. However, detecting images having a counterlight using only a dual-mode distribution of the histograms can result in a misdetection. In general, in an image that does not include a counterlight, the intensity histogram tends to be uniformly distributed. However, although the road images in Figure 2 do not include a counterlight, their intensity histograms have a bimodal distribution. Therefore, if the intensity histogram of a road image is considered to indicate that it contains a counterlight simply owing to its bimodal distribution, an increase in processing time may occur by unnecessarily applying a processing operation for image enhancement on such images.
Previous studies have applied intensity histogram equalization to increase the image intensity when it has been lowered by a counterlight. In general, the intensity histogram equalization method [20] assumes that the intensity value of the image except for the region including the counterlight has decreased because of the counterlight; uniformly applies the distribution of the intensity values. However, although the method is applied to improve the intensity values of pixels in a low-illuminance area, bright regions are excessively blurred because the pixel intensity values located in such regions also increase. To overcome this, an adaptive threshold-based intensity equalization method [21] was proposed; however, it results in a blurring of the image edge information. In other studies, it is assumed that the intensity value of the original image is generated through a combination of the reflected light of an object and the illuminance caused by sunlight [16,19]. The retinex method assumes that the color and brightness values of the original image are composed of defects in the reflected light of an object and the illuminance value of sunlight. Because an image acquired by a camera is contaminated by noise to obtain the original image from a contaminated image, the color and brightness values of the original image can be estimated by removing the illuminance caused by sunlight. However, there is a limit in real-time processing owing to the pixel unit calculation. In addition, there is a method in which a deep learning method is applied to improve the image intensity [22]. Previous research has focused on improving the intensity value of the images, including the counterlight caused by sunlight. However, applying the intensity enhancement process to all images has limitations in real-time processing. Therefore, a process for determining in real-time whether it is necessary to apply a method to improve the image intensity is required. One simple method is based on the distribution shape of the intensity histogram. However, general images may also have a distribution shape of the intensity histogram, similar to that of images including a counterlight. As a result, there is a need for a method to detect whether a counterlight from sunlight is included in the input image.
We propose a method to detect an image that includes a counterlight from road images acquired while the vehicle is being driven. Through the proposed method, image improvement can be implemented on only those frames that include a counterlight, enabling real-time processing and improving object recognition. To detect whether an image contains a counterlight caused by the sun, the proposed method applies a multistep analysis, such as determining the brightness value of the input image, the position of the counterlight region, and the distribution, size, and edge information. The following clues were used to detect images in which a counterlight was caused by sunlight. First, connected pixels with high intensity values are located in the upper part of the image. Second, the variation in the pixel intensity value in the region including the counterlight is relatively small compared to the other regions, and thus the number of edge pixels is small. Third, the distribution of the intensity histogram of the region including a counterlight is closer to 0 and 255 than that of the other regions. The proposed method for detecting whether the image includes a counterlight caused by sunlight uses information regarding the location of the high brightness region, the intensity histogram distribution, and the number of edge pixels. It is possible to determine quickly whether a counterlight is included in the input image in real-time through multistep analysis.
2. Previous Works
Wang et al. proposed a method for improving backlit images based on multiscale fusion [23]. A relatively dark region is improved by converting the input color image into the HSV space and conducting a multistep image decomposition process in the color space. Their method applies image enhancement based on the assumption that the input image is the image including a counterlight; thus, when the proposed method is applied to all frames, the computation time increases, rendering real-time application difficult. Therefore, their method does not detect in advance whether the input image includes a counterlight.
Buades et al. also proposed improving the difference between brightness and color contrast under different criteria for dark and bright regions in an input image containing a counterlight [24]. They proposed optionally applying an image enhancement method rather than a global image enhancement method, because enhancing the contrast intensity of dark areas results in a supersaturation of bright areas, whereas enhancing the contrast intensity of bright areas reduces the visibility of the dark areas. However, they did not present a detection process to verify whether a counterlight occurs in the input image when conducting the image enhancement process.
Park et al. proposed a method for determining the inclusion of a counterlight through a color analysis between frames [12]. They indicated that the distribution of the intensity histogram of the images can result in concentrations near the values of 0 and 255 even under ordinary illuminated light, and thus the intensity histogram distribution alone has limitations in determining images containing a counterlight. Therefore, to detect whether an image includes a counterlight, they compared the distribution range of the Cr and Cb colors of the image, including the counterlight, in the YCrCb color space. In general, although ordinary light sources have various color values, the color values of images containing a counterlight are limited to certain regions. They used this limit to determine whether the image contains a counterlight.
Song also proposed a method that utilizes image feature information to detect images that include a counterlight [11]. They proposed a method for detecting such an image according to the shape of the intensity histogram distribution of the image. The distribution of the intensity histogram of the image, including the counterlight, has a bimodal feature located around dark or bright intensity values. However, their proposed method also has a problem in that it is possible that an image with general illumination presents a bimodal histogram of the same type, and thus, there is a high possibility of a misdetection occurring in an image with a counterlight.
In addition, Li and Wu proposed a method for detecting an image with a counterlight using a Gaussian radial-based function kernel-based binary support vector machine (SVM) detector [25]. Their proposed method divides the input image into small regions and uses an SVM counterlight detector for each divided region. Their method detects regions where the counterlight occurs to improve the image quality. The image quality enhancement only applies to the detected regions. However, a learning process for images with counterlight must be applied in advance.
Chin and Lin proposed a method measuring the amount of counterlight for the detection of images containing such light [26]. They measured the degree of counterlight occurrence in an image using fuzzy logic along with the spatial characteristics of the image intensity values and the intensity histogram distribution characteristics as inputs. The image is divided into five regions, and the spatial characteristics of the regions including the counterlight are extracted from the divided regions. Histogram information uses the intensity histogram distribution. The authors used a feature in which the region where the counterlight occurred had relatively small changes in color and intensity compared to the regions where the color and intensity changes occurred. Their methods also have limitations in real-time processing owing to an increase in the number of computations per pixel.
Previous studies have focused on improving the color and intensity values of the image, and thus most proposed methods aim to restore the image including the counterlight to one close to the original version. However, applying image enhancement to all pixels may symmetrically increase the number of computations. To overcome this, a method for differentiating the counterlight region from other regions in the image including a counterlight, was applied. Most of the methods for classifying counterlight regions are based on the intensity histogram distribution. The intensity histogram expresses the global brightness distribution of the image, so when a bright-colored object or a dark-colored object is relatively large in the image, it can be mistaken for an image containing counterlight. Therefore, it is necessary to utilize various characteristic information such as edge distribution, region size and location, sunlight distribution, etc., in addition to the brightness distribution of the input image. In this paper, a multilevel analysis method is proposed that incorporates the position, size, and edge information of similar brightness regions as well as the brightness information of images to detect whether they contain a counterlight.
Definition of Clues for Detecting Images including Couinterlight
Images from a vehicle black box that records real driving situations typically include counterlight caused by sunlight at the top of the acquisition image. The upper part of the image including the counterlight is extremely bright, and the other regions are relatively dark owing to the difference in brightness contrast. Images containing sunlight have a high brightness value spread around the area containing the sunlight. In this case, the intensity value of the image is biased only toward the bright and dark areas. Thus, an image containing a counterlight has poor image quality owing to large contrast differences in the intensity values. In particular, CCD-based vehicle safety driving support systems will cause errors in recognizing traffic lights, lanes, and signs. Higher object recognition will be possible if only frames containing a counterlight can be detected in outdoor road images acquired from vehicles. Image recognition will also be improved by applying an image enhancement only to frames that contain a counterlight. Analyzing the images including a counterlight, the distribution of extremely high intensity values was concentrated only in a specific area in the image. In addition, the edge, color, and texture information of the high intensity region showed a significantly smaller change than that of the other regions. To detect an image containing a counterlight, it is necessary to apply a multistep analysis method with clues such as the size, ratio, position, shape, and distribution of brightness values of the connected pixels. As shown in Table 1, an image containing a counterlight is detected using clues that can be obtained from the input road image.
3. Proposed Method
This paper proposes a method for detecting images including a counterlight caused by sunlight in road images acquired from in-vehicle-installed video-recording devices. Counterlight areas caused by sunlight are typically characterized by a wide distribution of pixels with relatively high intensity values within the image. In addition, because the region including the counterlight in the image is composed of connected pixels with an extremely high intensity value, there is no difference in intensity value from the surrounding pixels, and thus edge pixels are not included. When these features are included in the input image, they are detected as an image that include a counterlight.
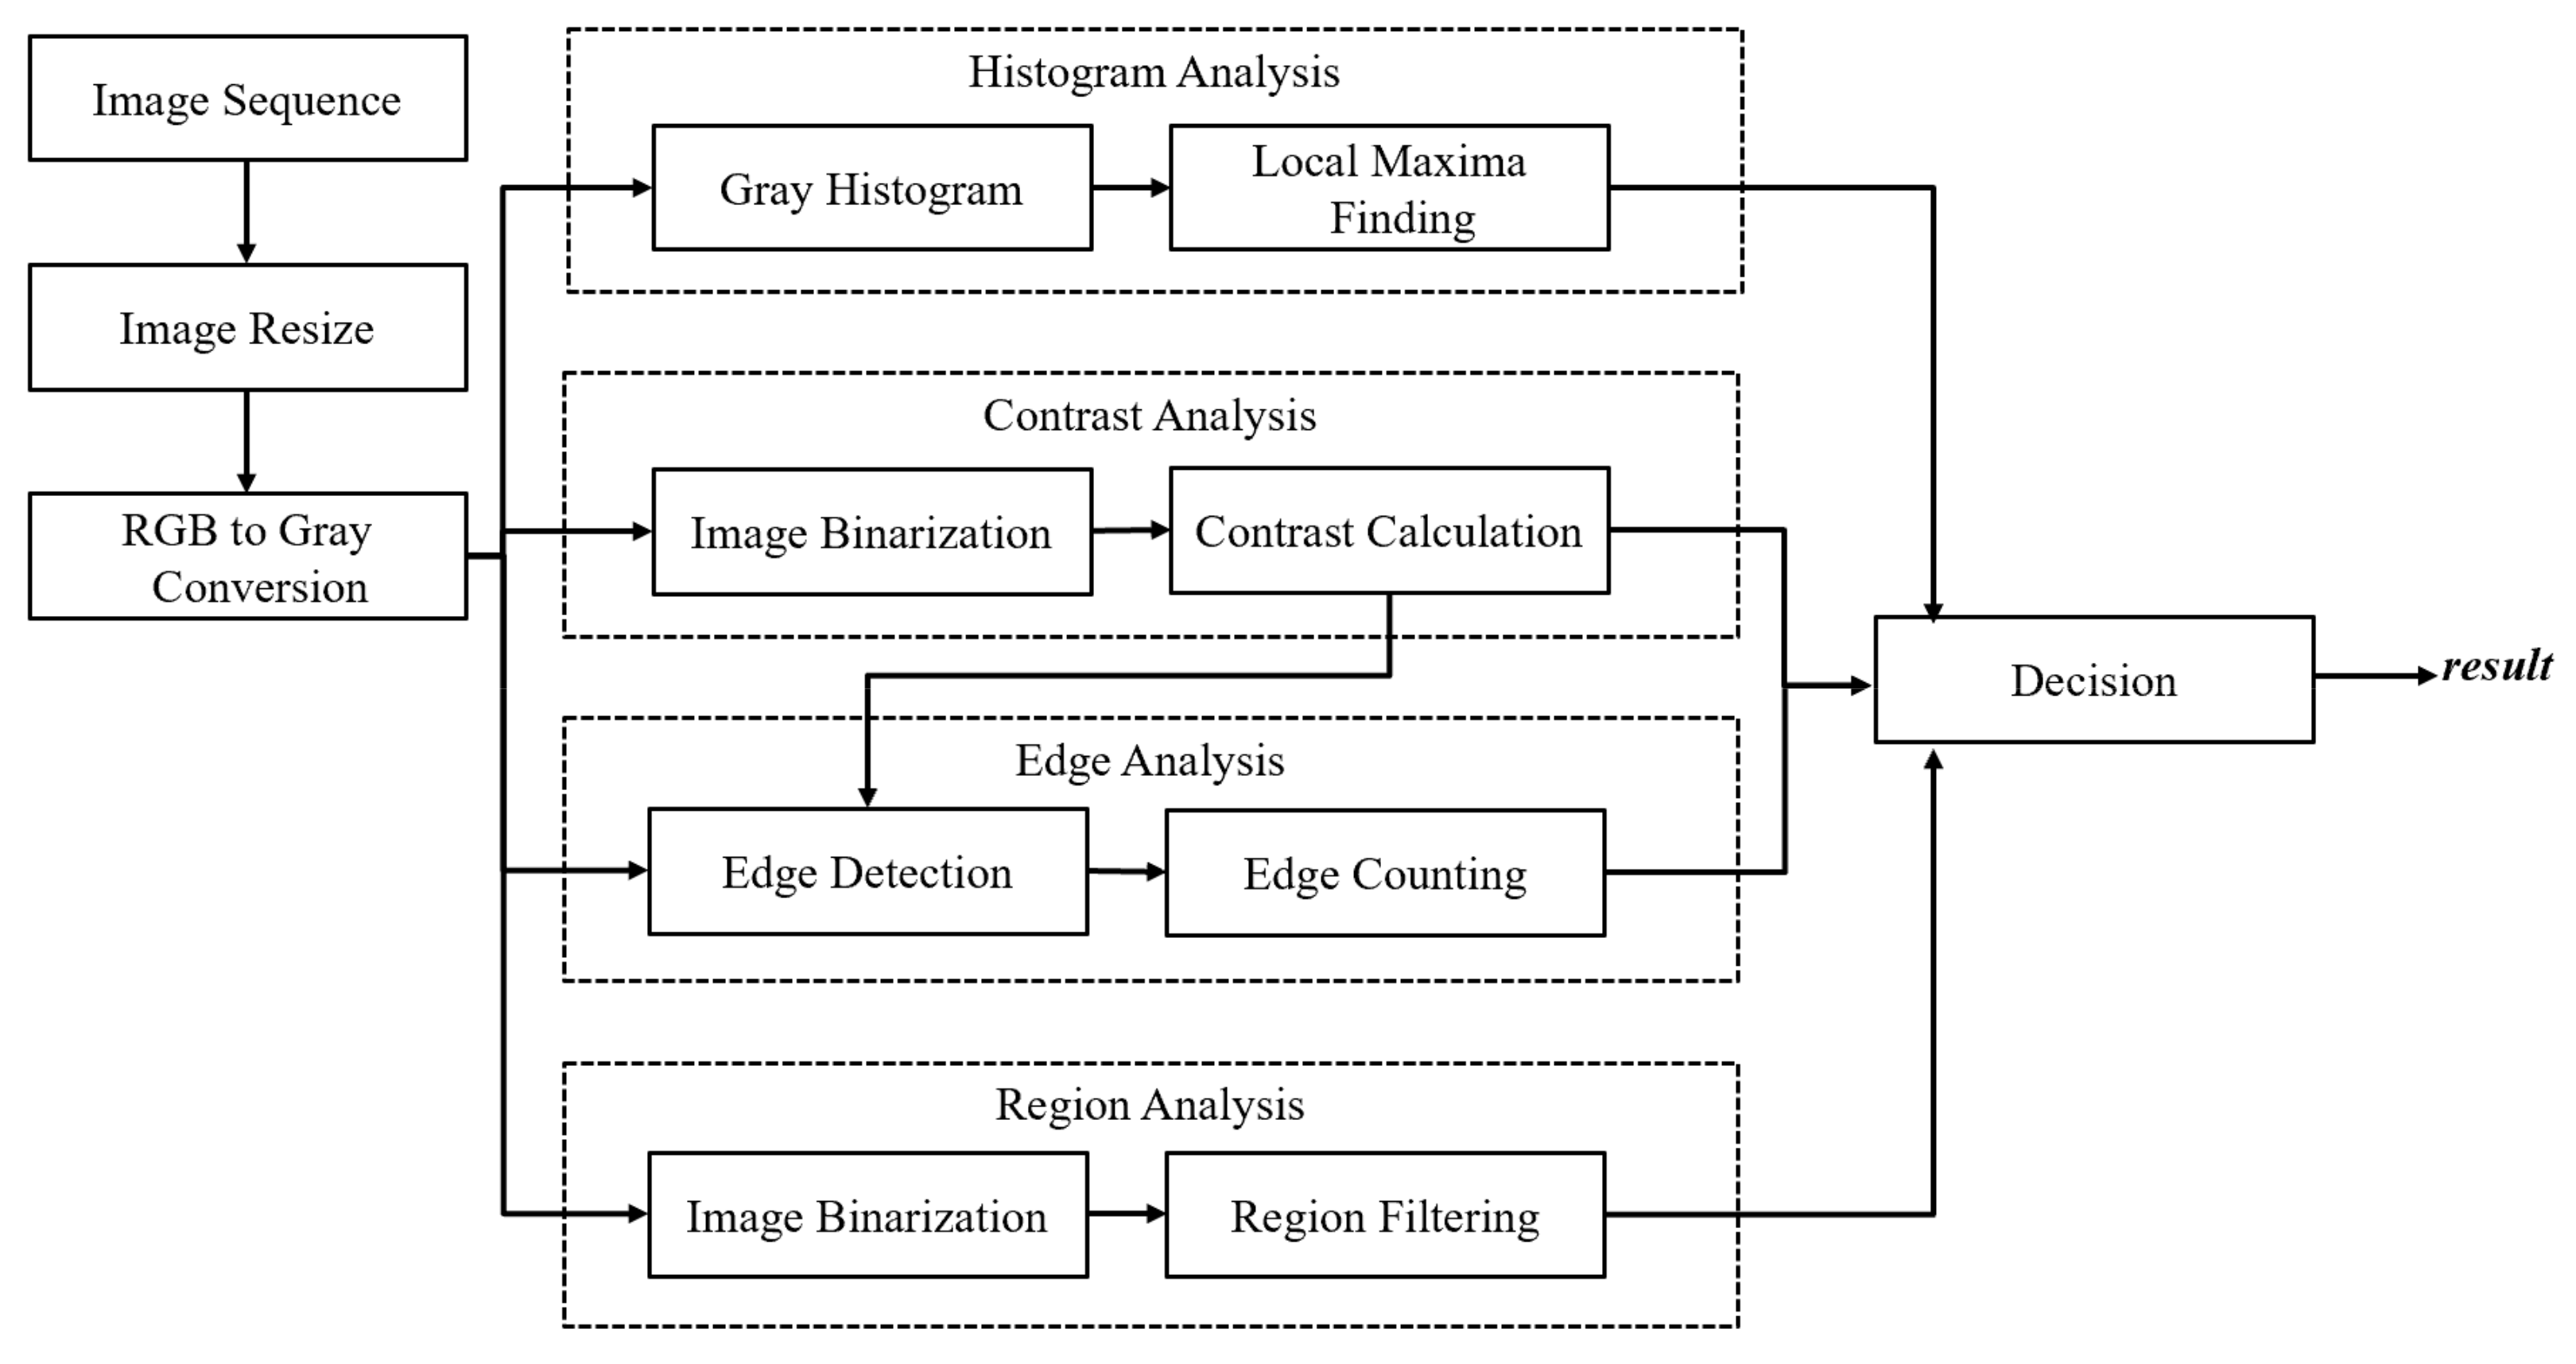
With the proposed method, an intensity histogram analysis, image binarization, and region analysis steps are applied to gray-scale images to reduce the processing time. Figure 3 shows the flow of the proposed method for detecting an image including a counterlight caused by sunlight.
3.1. Histogram Analysis
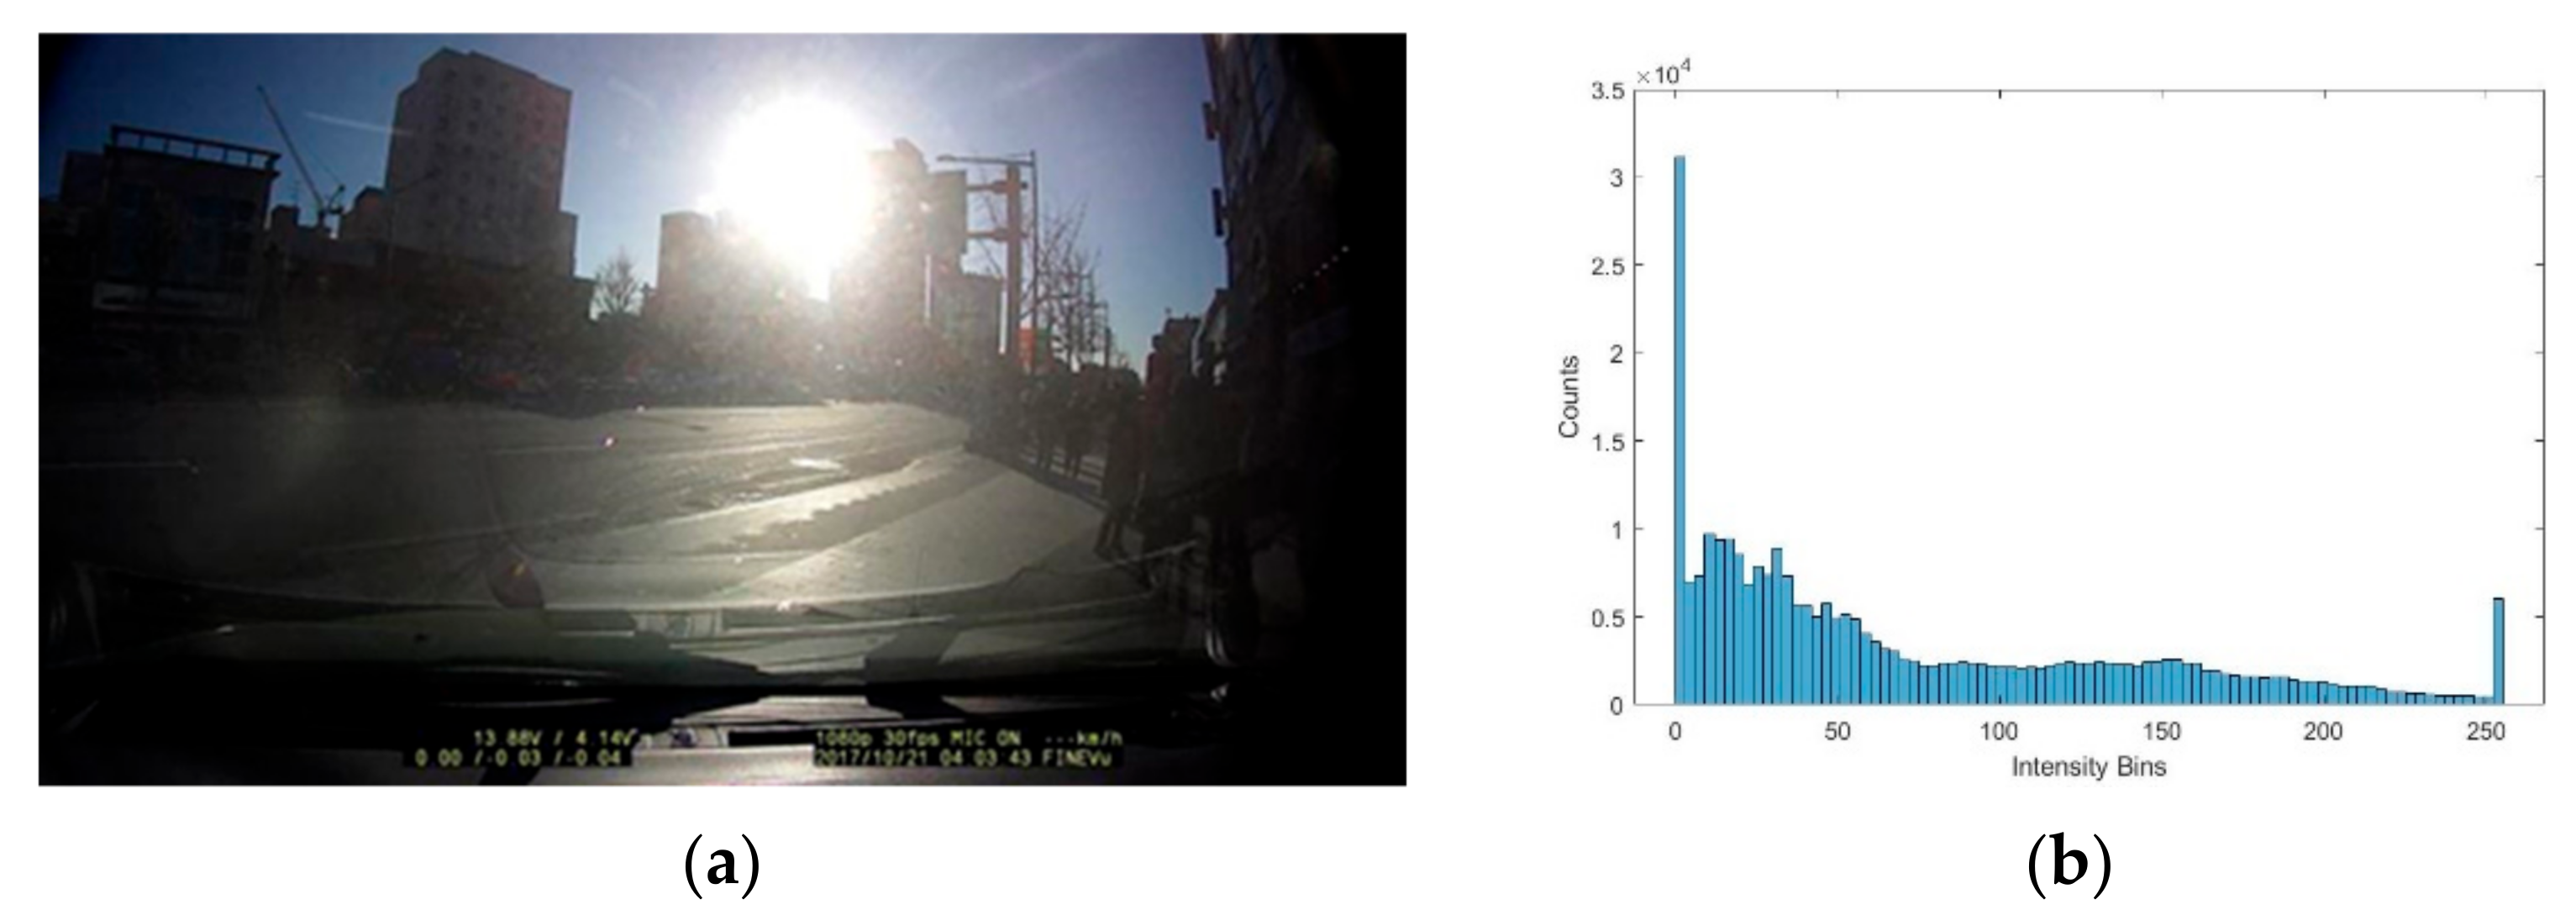
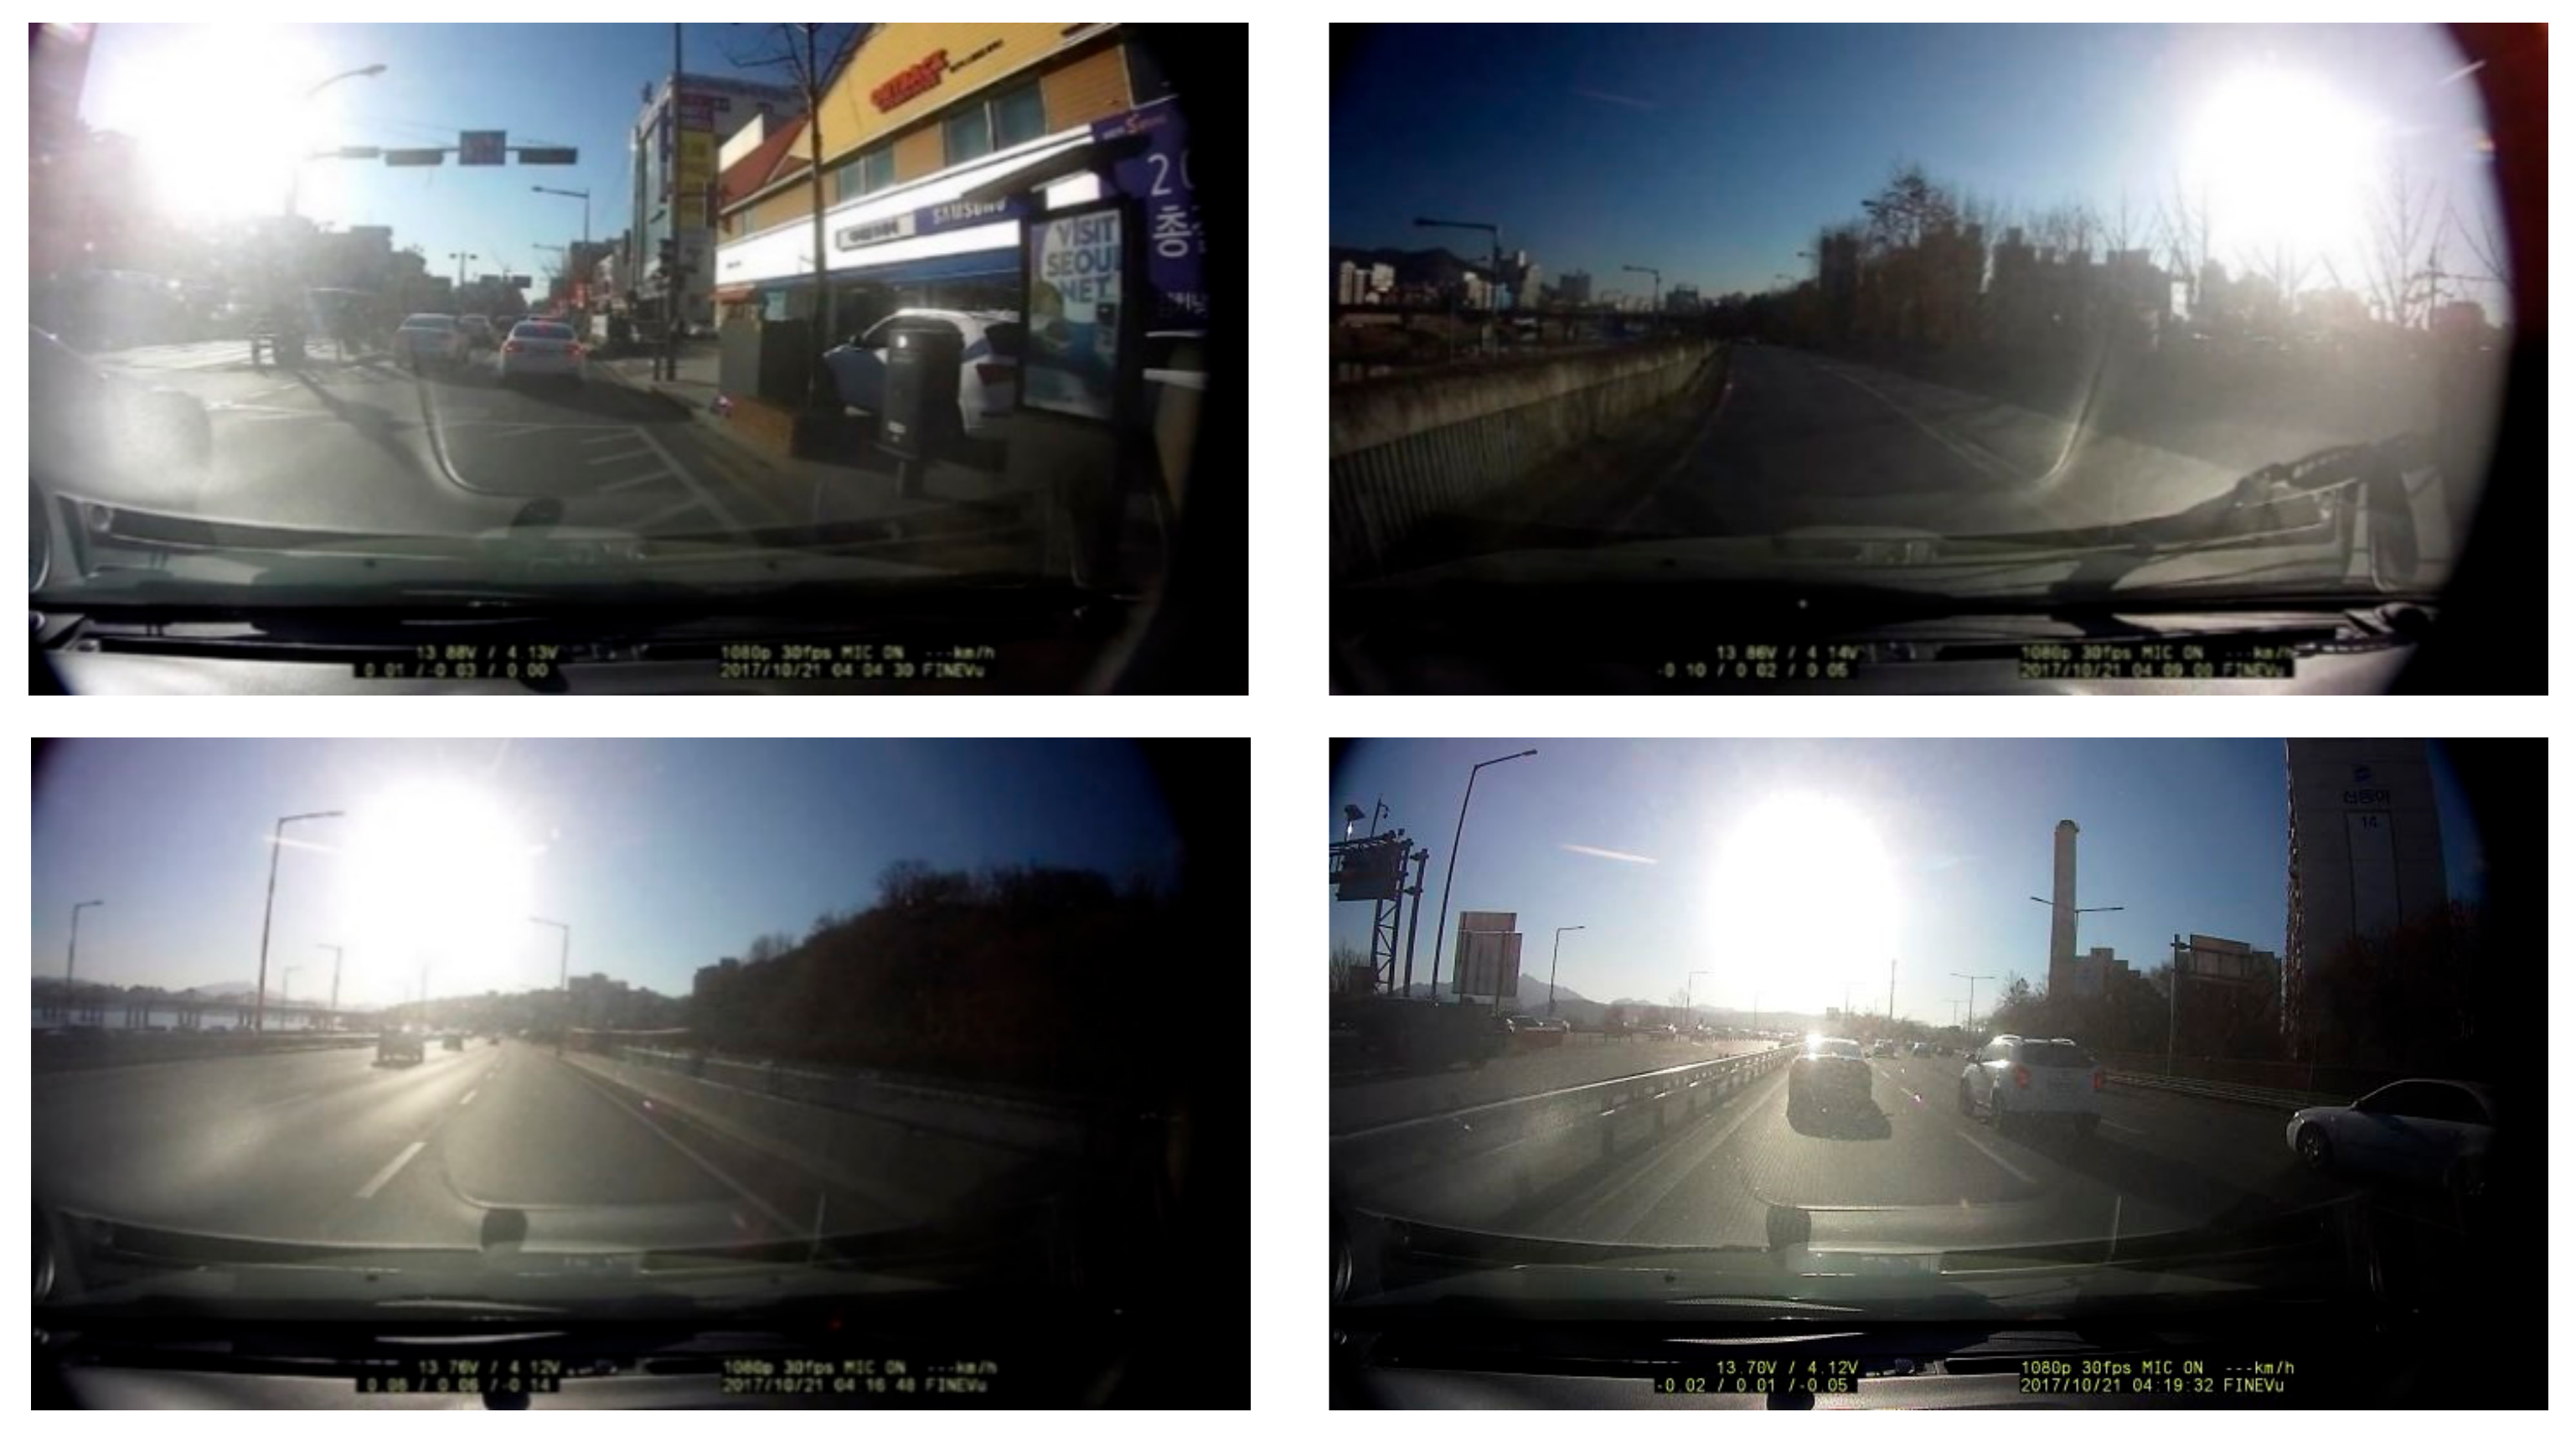
This step analyzes the intensity histogram from the gray image to determine whether it contains a counterlight. In general, the intensity histogram distribution of the image including a counterlight tends to be concentrated near the 0 and 255 values within the intensity value range of 0–255. If the input image contains a region with extremely high intensity values, the intensity values of other regions appear relatively dark because of the limitation of the color ranges expressed by the camera. By analyzing the distribution characteristics of the intensity histogram, it can be determined whether a counterlight is included in the image. Figure 4 shows the image containing a counterlight created by sunlight and its intensity histogram distribution.
As shown in Figure 4, the image containing a counterlight has extremely high intensity values, and thus the intensity values of pixels in the other regions are darkened. As shown in Figure 4b, the intensity histogram distribution has a significantly large number of pixels with intensity values in the ranges 0–10 and 245–255, and it can be seen that the histogram distribution peak is located in the corresponding intensity value range.
In this step, the locations of the first and second highest peaks of the intensity distribution and the number of histogram distributions can function as indicators for detecting whether an image includes counterlight. Therefore, the intensity histogram distribution was obtained from the input image, and the number and location of peaks in the histogram distribution were analyzed. For the proposed method, Equation (1) was used to detect the positions of the maximum peaks in the intensity histogram distribution. The proposed method detects positions where the minimum number of pixels is greater than α for the peaks of the intensity histogram distribution, and the difference in the number of pixels between adjacent peaks is at least β. The criteria for selecting the histogram peaks are shown in Equation (1).
3.2. Region Analysis
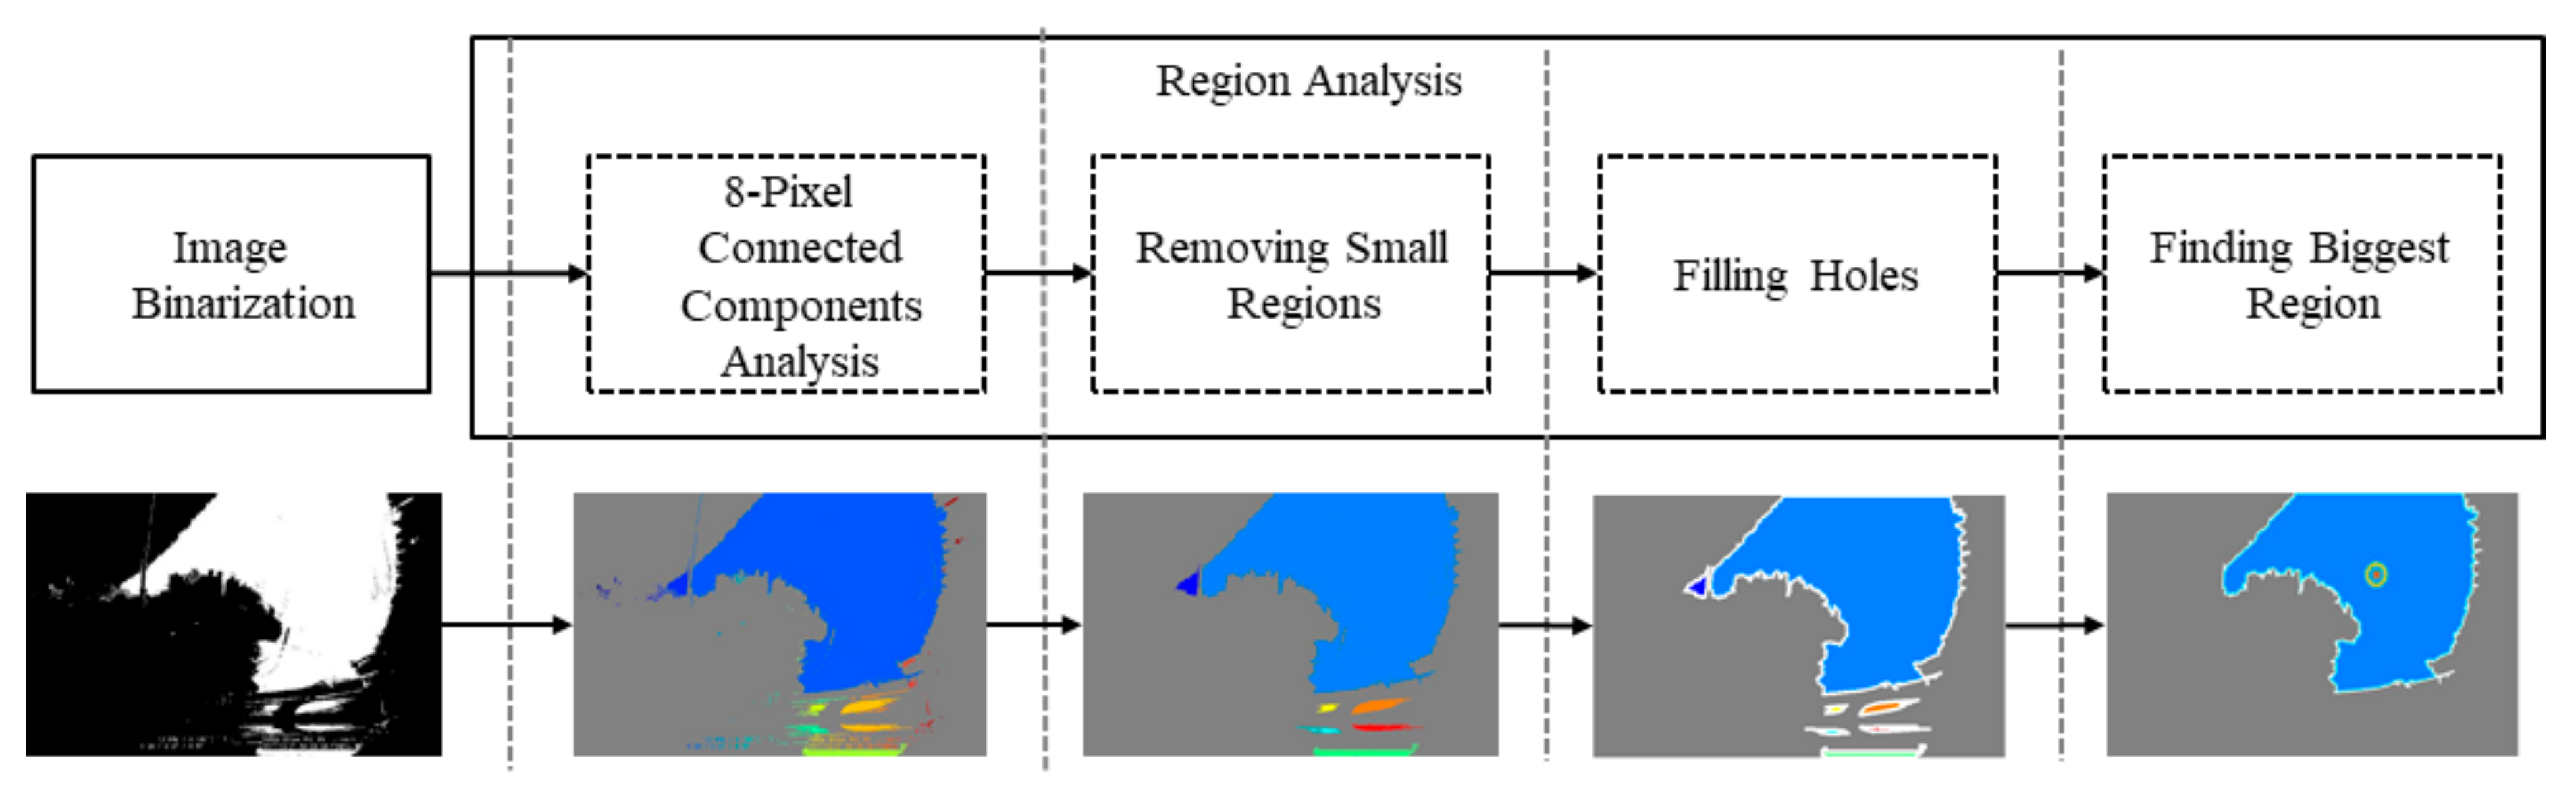
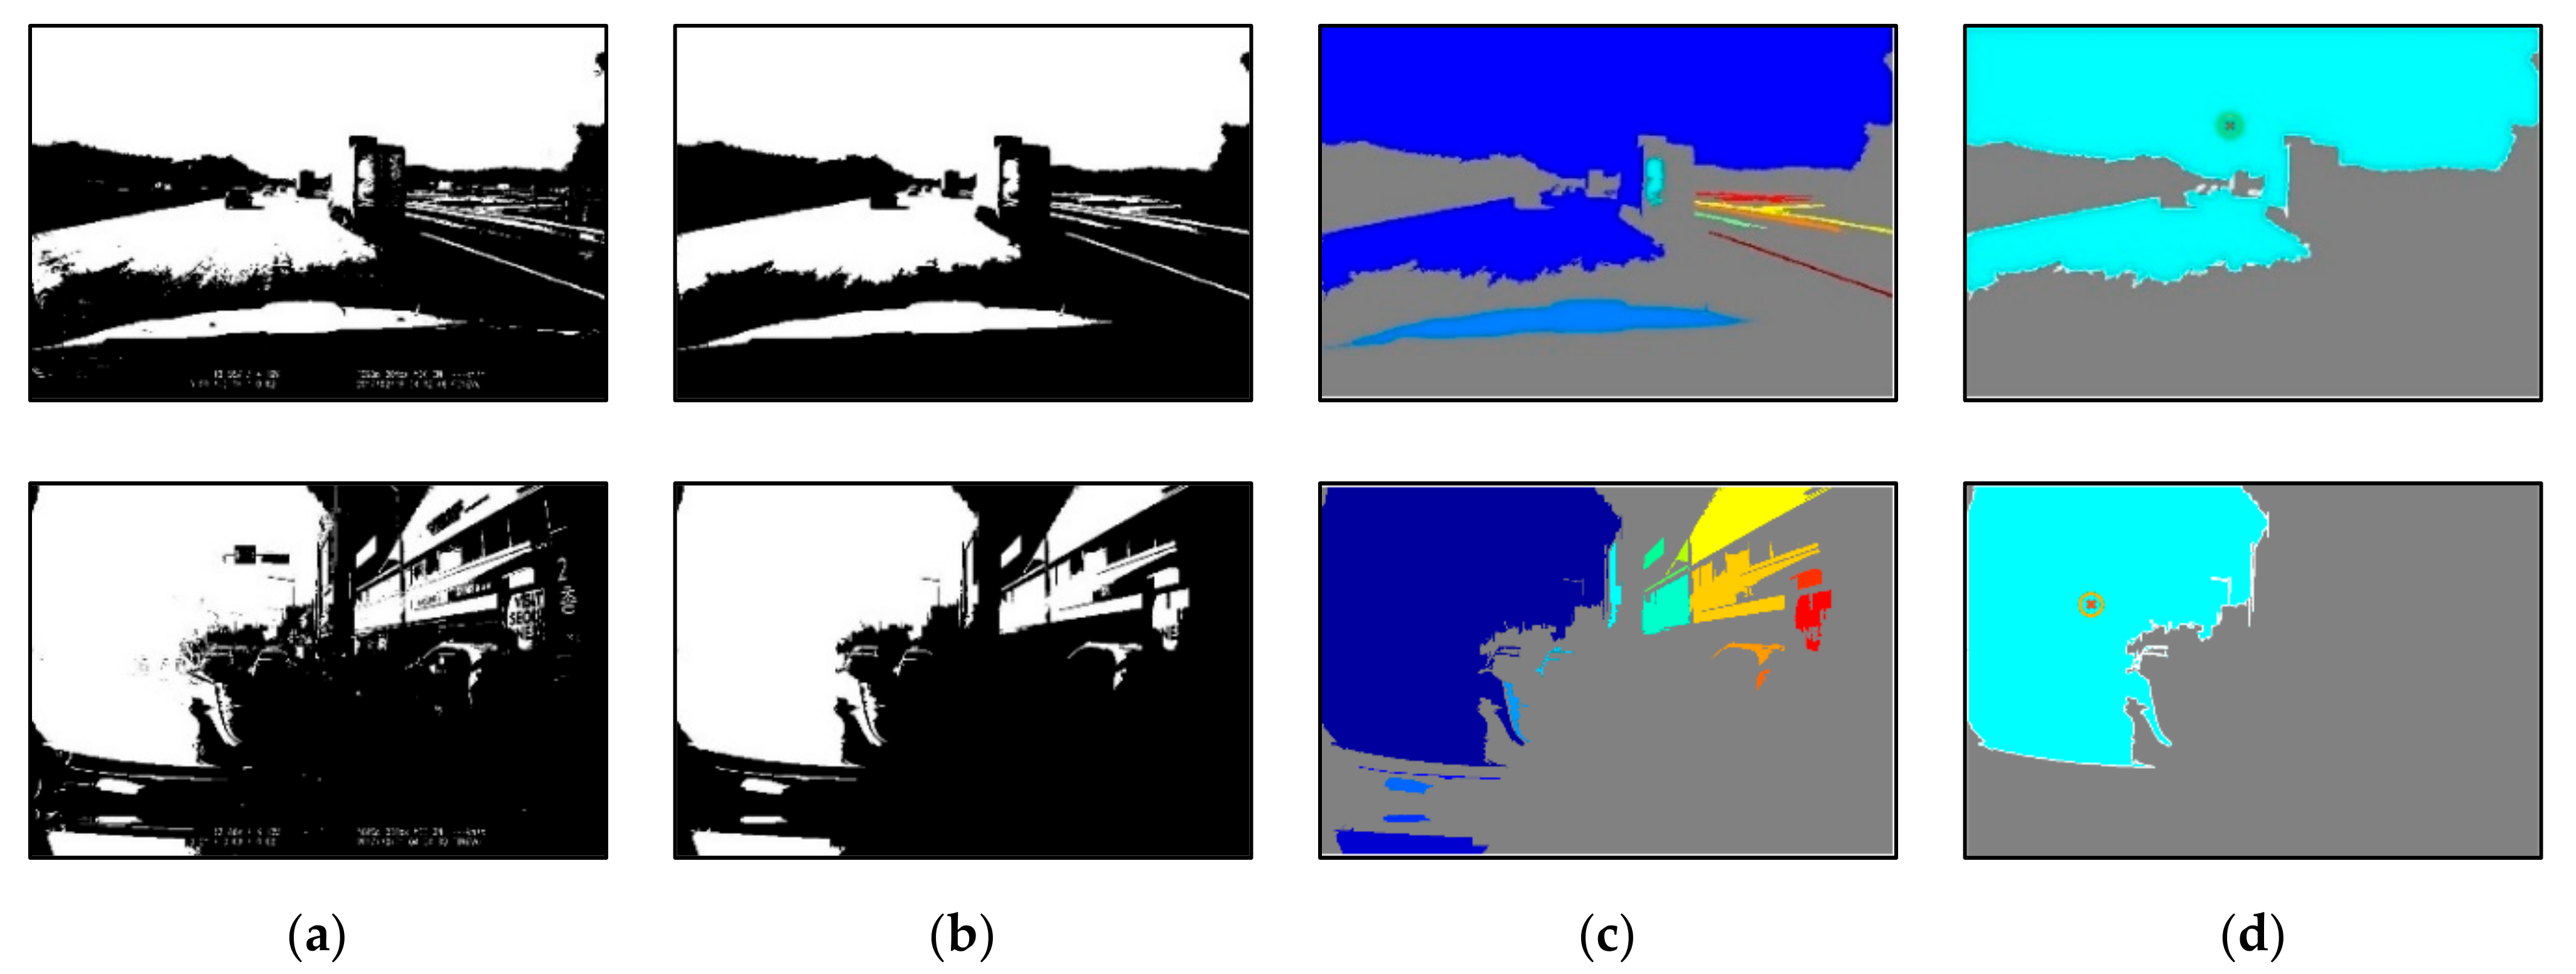
In this step, the gray image is converted into a binary image using the Otus global threshold method [26] and analyzed to determine whether the image contains counterlight based on the shape and location of the largest binary region. The binary image is generated by applying the threshold method to the gray image. Noise removal and empty hole-filling operations are conducted through a postprocessing technique. This step is applied as shown in Figure 5. The region analysis steps are conducted in the following order: a pixel-connected component analysis, small pixel region removal, region hole filling, and largest region extraction substeps.
The binarized image is generated by applying the global threshold method to the gray image, and the connected components of the pixels are analyzed in eight directions. Regions in which the area of connected pixels is smaller than t are removed from the binary image. The region hole in the binary regions is filled by applying morphology opening and closing operations [26]. Finally, the center locations of the binary region with the largest pixel connection component are extracted.
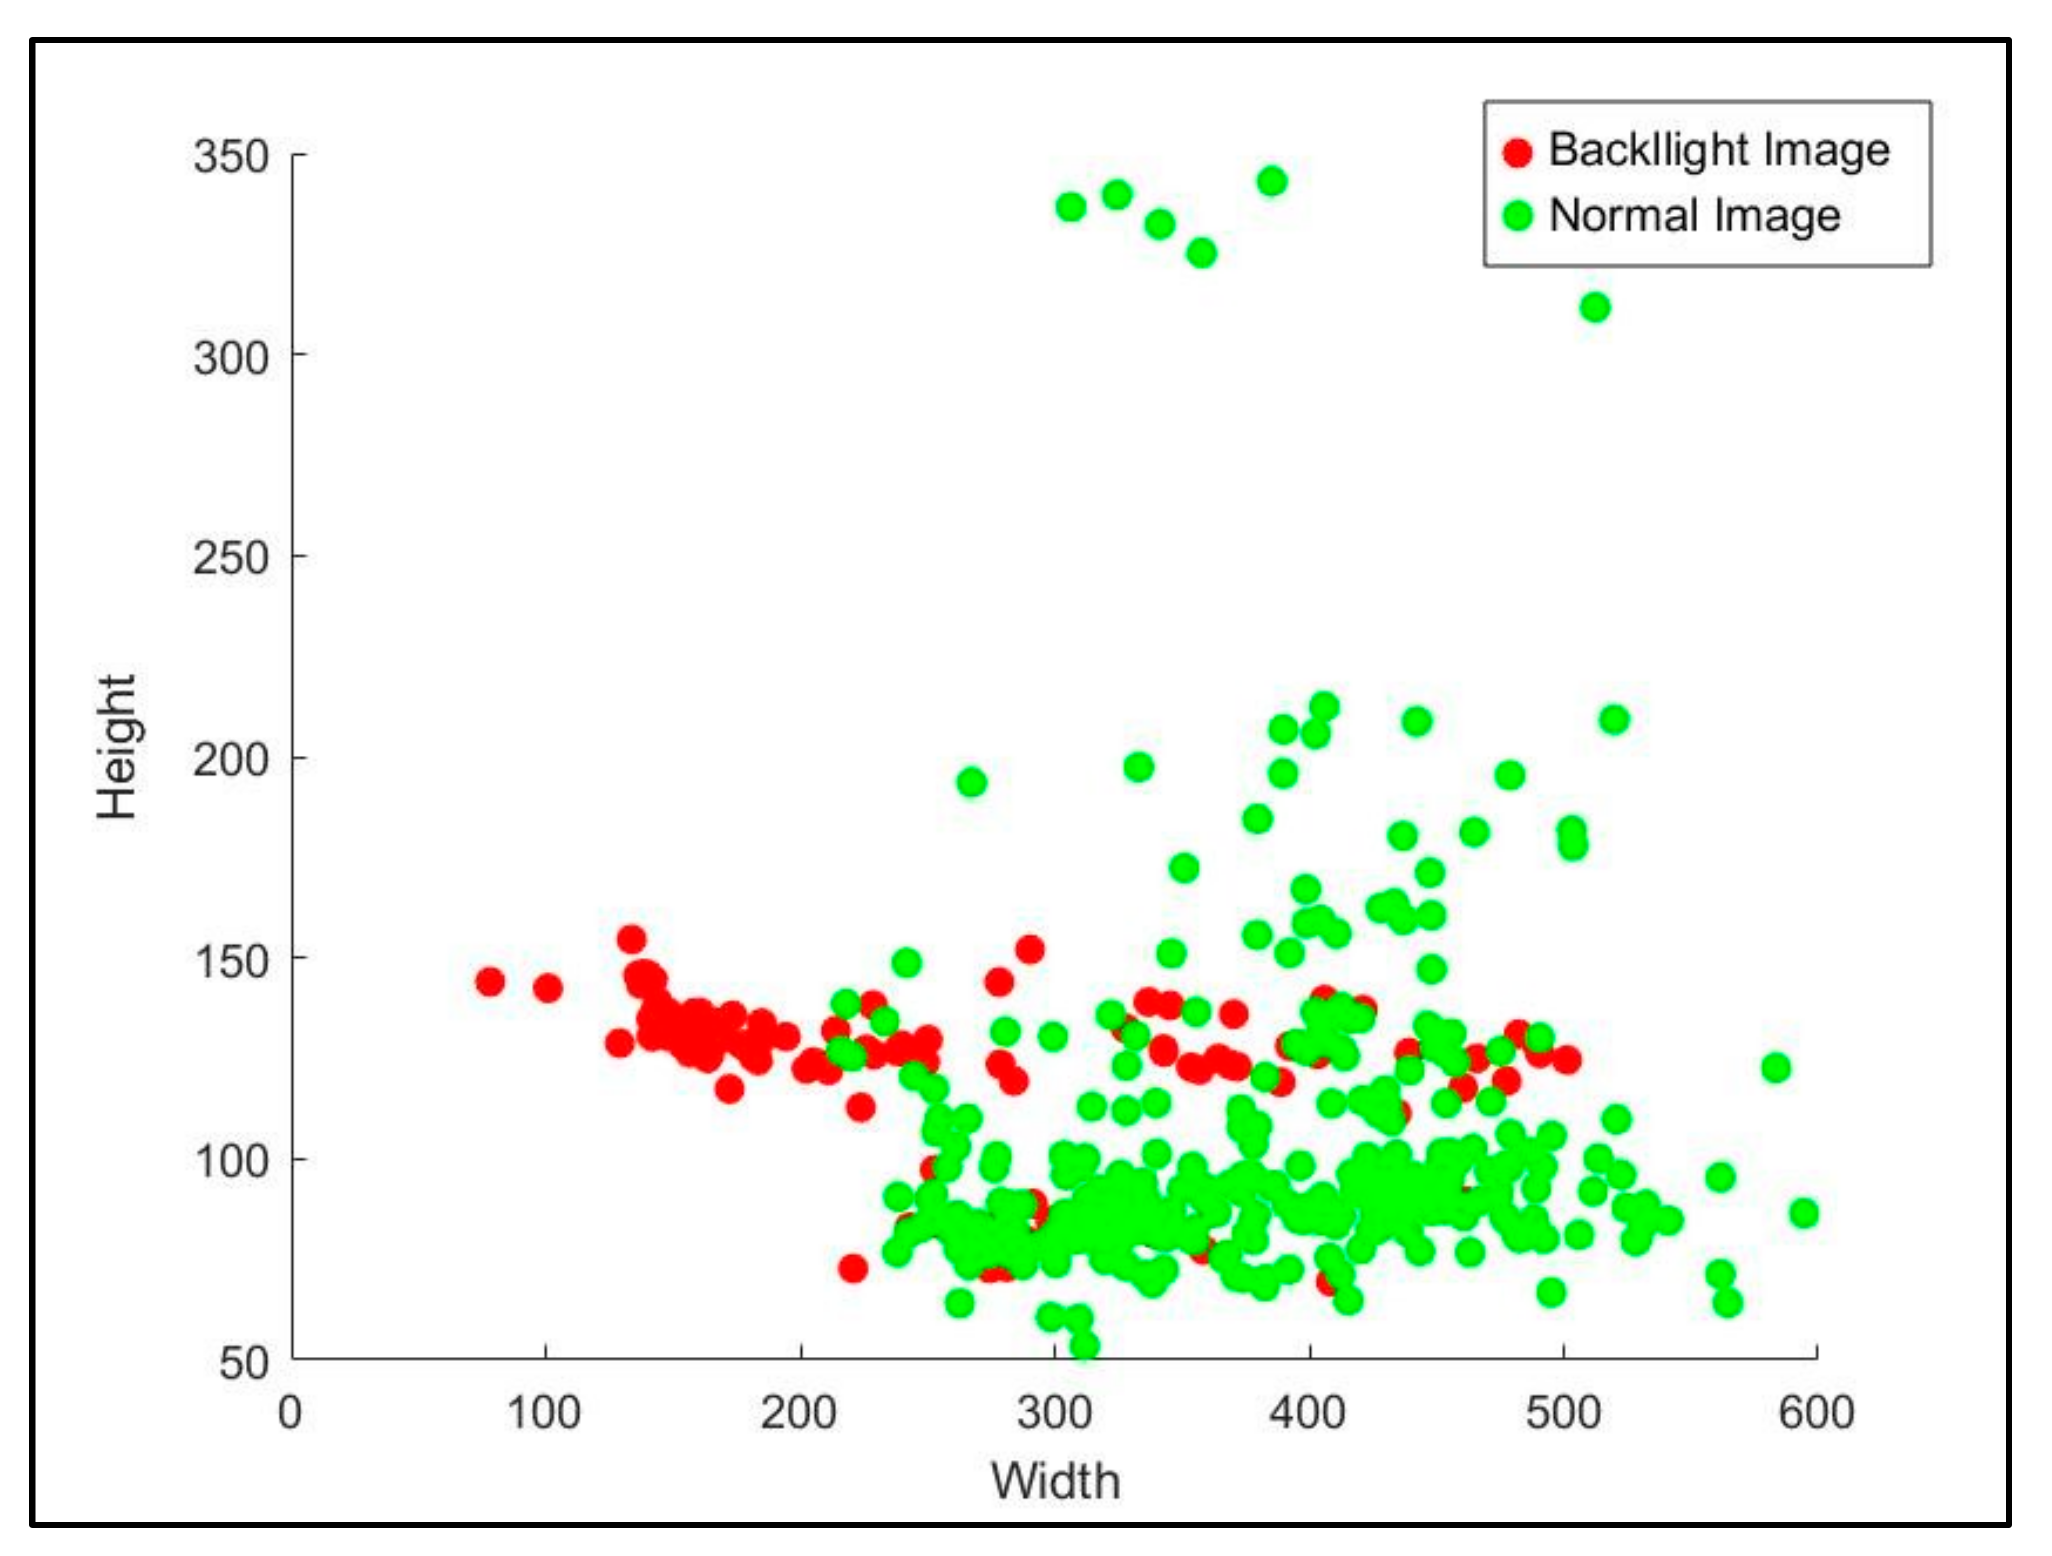
Although a counterlight may occur because of reflections from building windows or other vehicles, counterlight caused by sunlight is generally located in the upper part of driving road images obtained from vehicles. Based on these clues, to detect an image including a counterlight, the proposed method utilizes a feature in which areas of bright pixels are larger than t pixels and the position is at the top of the image. The analysis of the center locations of the large binary region having the brightest intensity values in an image including a counterlight, as indicated in Figure 6, shows that the brightest area is located at the top of the input image. In Figure 6, the coordinates of the center point of the binary region including the counterlight are constant along the vertical axis and change only along the horizontal axis.
In this step, the pixel size and center locations of the largest binary region are extracted. The regions in the road image consist of pixels that are significantly brighter than those in the other surrounding areas, located at the top of the road images, and have pixels of more than a certain size. The images are therefore classified as containing a counterlight. The procedure code for the detection process of an image including a counterlight, based on a region analysis, is shown in Table 2.
3.3. Edge Analysis
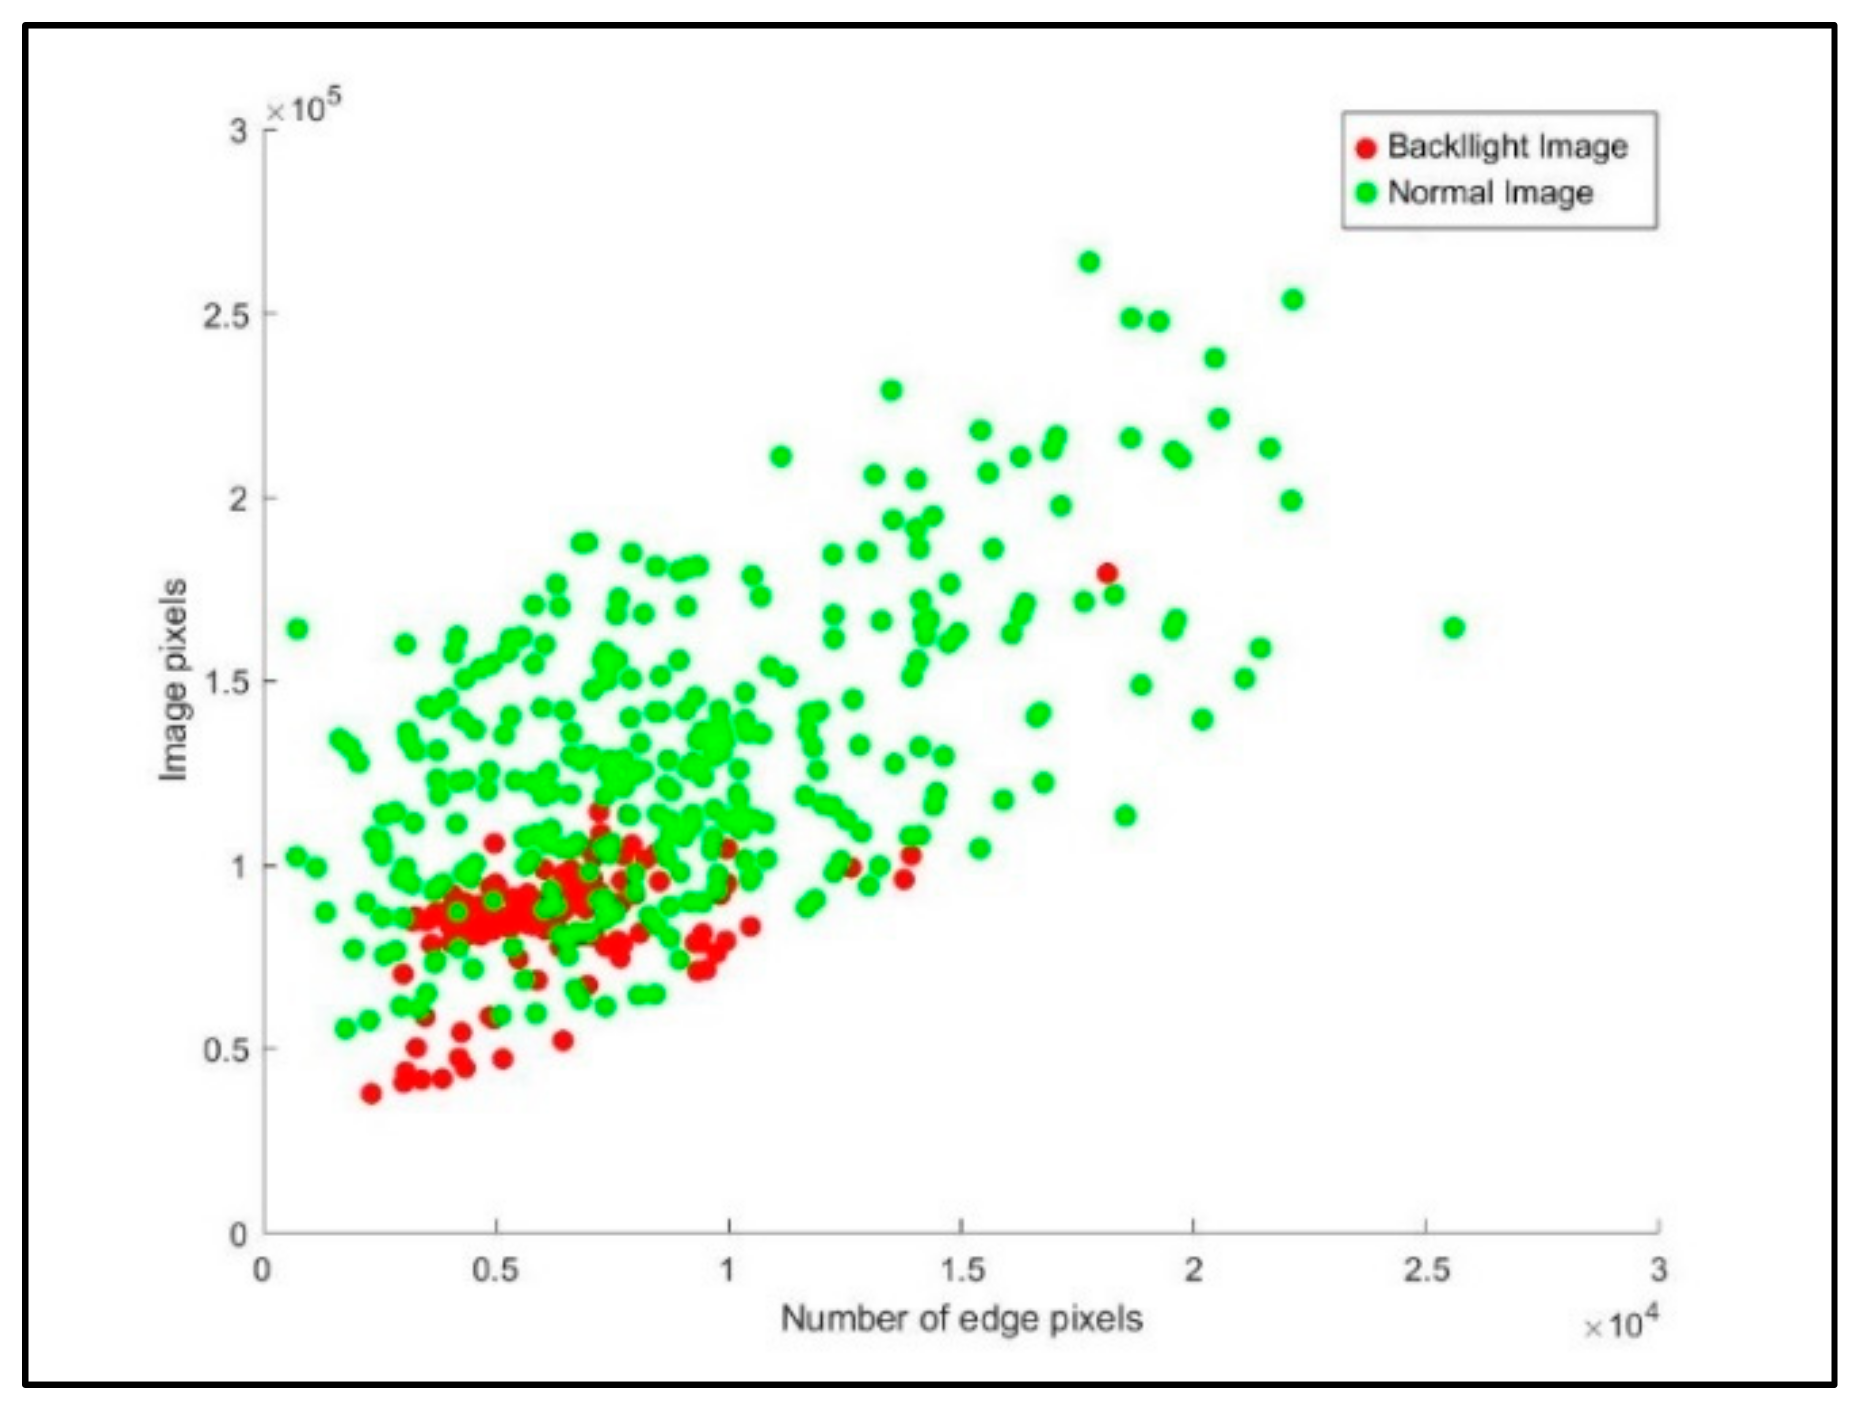
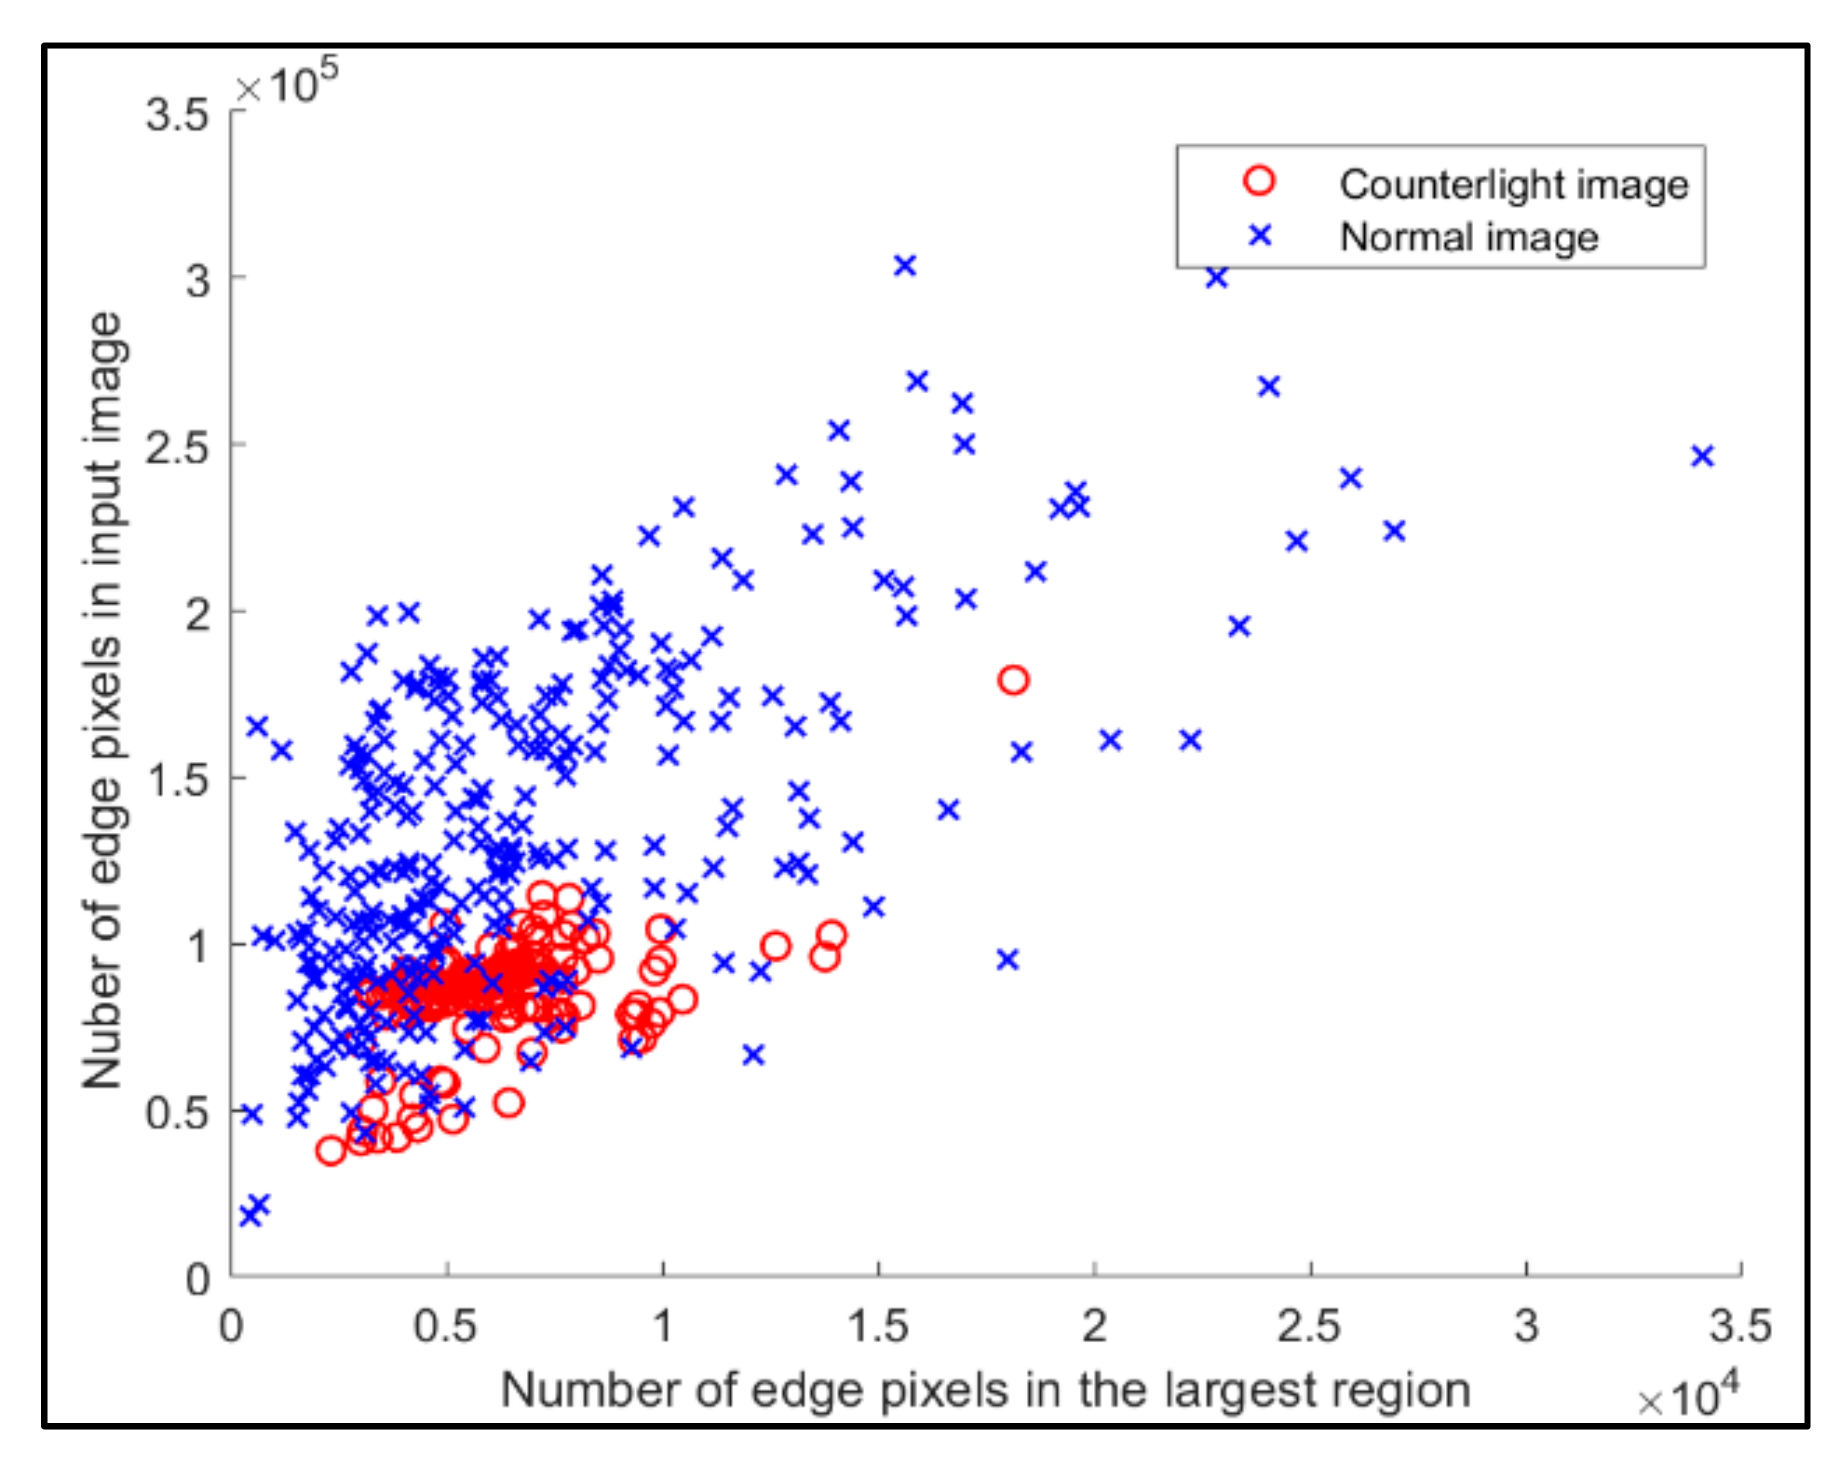
In this step, an image including a counterlight is detected by analyzing the edge information from the input gray images. A Canny edge detector is used for edge detection in the input gray image [26]. In general, images containing a counterlight have an extremely small number of edge pixels compared to other regions owing to the high brightness values. Figure 7 shows the number of pixels and the number of edges in the region with the largest brightness value in a road image that includes a counterlight and in general road images.
In Figure 7, the total number of pixels and the number of edge pixels are compared in the region extracted from the image including a counterlight and in the normal image. In the case of images that include a counterlight, edge pixels are concentrated at a specific ratio compared to the total number of pixels, and the number of edge pixels is smaller than that in the normal images. In the case of normal images, the ratio of edge pixels to the total number of pixels varies, and on average, the number of edge pixels is larger than in the image including a counterlight. As a result, the image including the counterlight has the effect of uniformly increasing the illuminance by sunlight. Because the change in brightness is small, the number of edge pixels is small, and the size of the region with an extremely high brightness is limited to a specific region. This clue is used as a measure to determine whether a counterlight is included in the road image obtained.
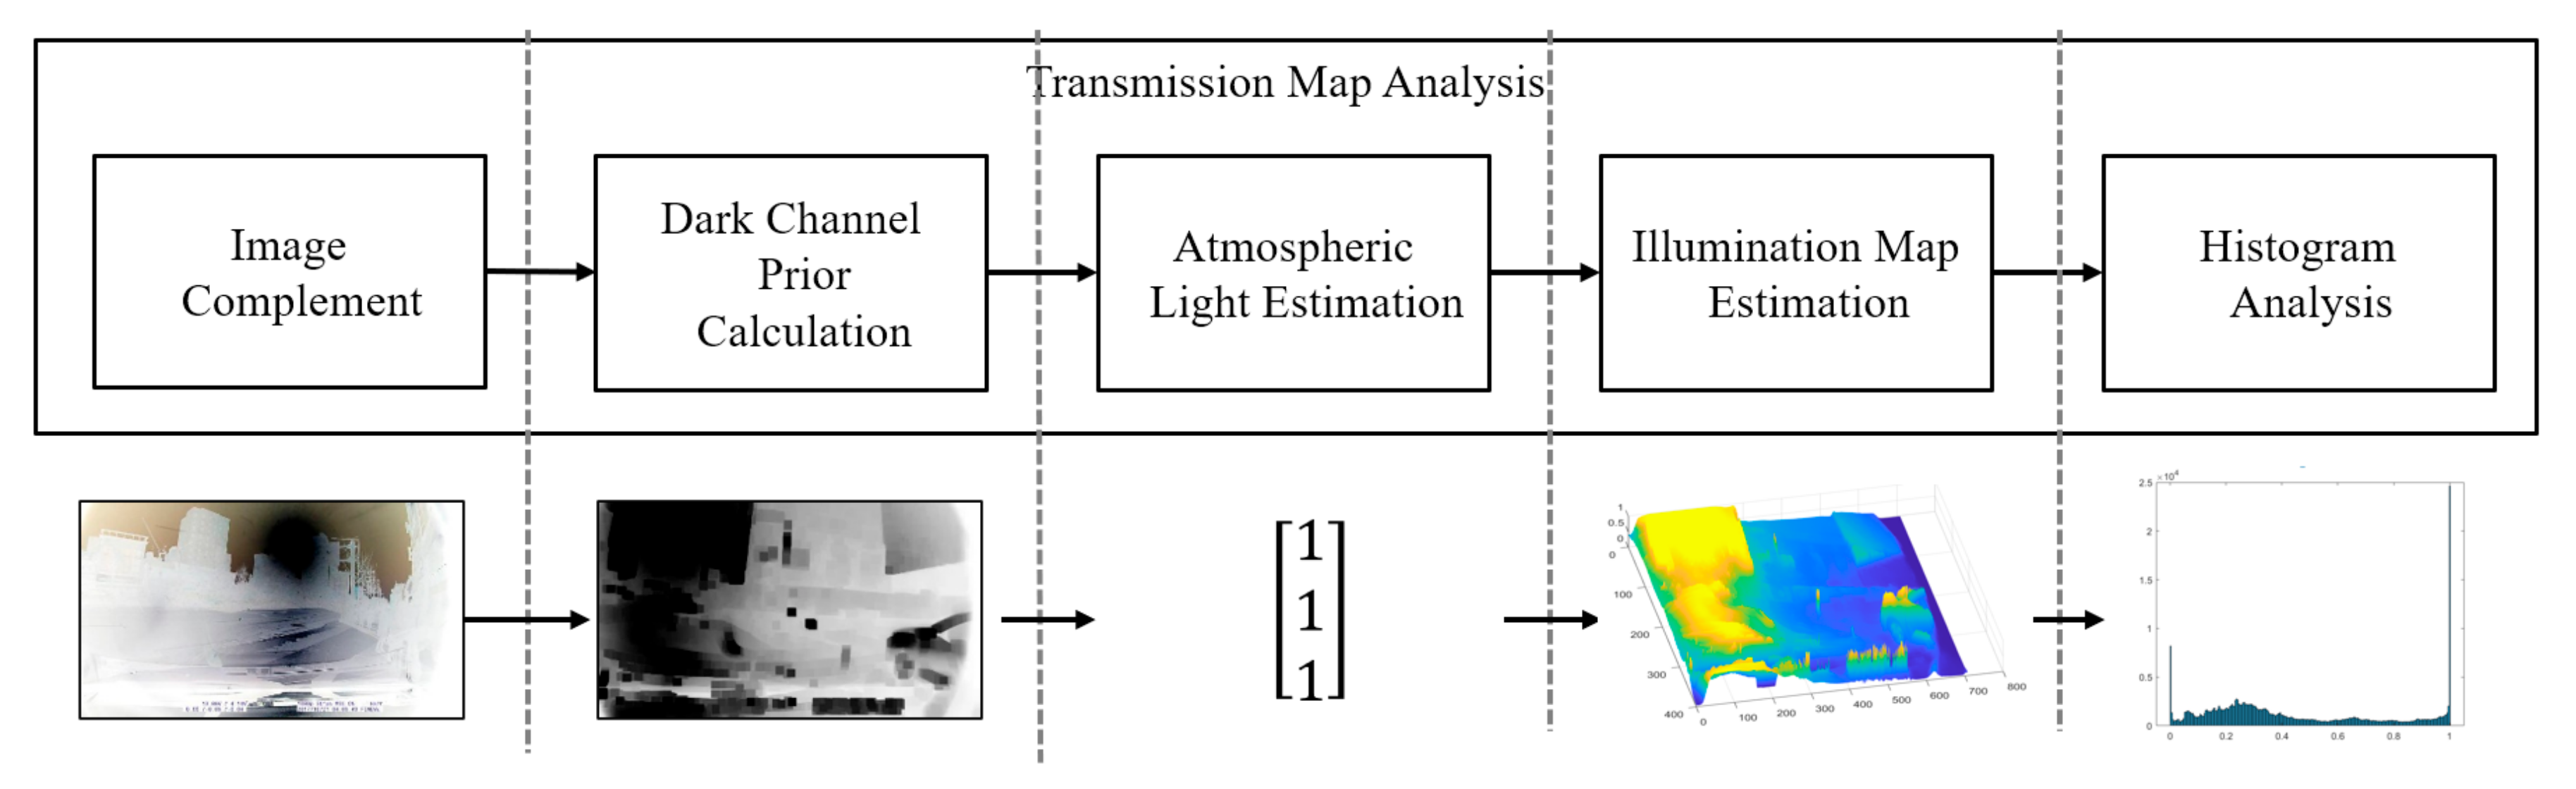
3.4. Illuminance Map Analysis
This step estimates the illumination map from the input image and analyzes the intensity histogram distribution from the estimated illumination map to determine whether the input image contains a counterlight. To analyze the illuminance map in the image, the intensity of the brightness of the image is measured, and it is determined whether the counterlight caused by sunlight is included. In general, when the counterlight is included in the image, the intensity of the brightness value of the illuminance map is relatively high. This step was applied as shown in Figure 8.
Image (I) obtained from the outdoor road environment is generated, as shown in Equation (2), by combining atmospheric light, which is input from sunlight reflected by the atmosphere, with illumination light partially lost by the atmosphere after being reflected from the surface of the object.
where x is a two-dimensional vector of pixels, I(x) is the observed RGB image acquired by the black box, J(x) is the scene radiance of RGB values before exposure to the atmospheric light and counterlight, t(x) is the illumination map, and A is the atmospheric light (airlight). The illumination map is a transmission map that describes the portion of light that reaches the camera, and takes a value between 0 and 1 as the ratio of light passing through the atmosphere and finally reaching the camera. Here, A assumes that all pixels have the same value. In Equation (2), the signal reflected from the object, J(x), is partially lost as it passes through the atmosphere, and only the signal of J(x)t(x) remains. The image I(x) obtained by reaching the camera includes airlight (A) formed by various surrounding light sources, including sunlight.
In this step, the illumination map, t(x), is obtained from the input image (I). From the illumination map, the intensity of illuminance by sunlight can be measured, and based on this, it can be determined whether the counterlight is included in the input image. Equation (3) shows the process used to obtain the illumination map.
However, Equation (3) assumes that A is a given value, and t(x) is unavailable because J(x) is unknown. Thus, Equation (3) can be calculated if J(x) can be found on a specific color channel. The information required to calculate Equation (3) is a dark channel prior [27]. The prior of the dark channel prior is used as prior knowledge, meaning that it is a prior knowledge obtained by human observation. He et al. [28] found that pixels without haze tend to have extremely low brightness values of at least one of the R, G, and B color channels. This channel was defined as a dark channel, which is referred to as the dark channel prior. Using the dark channel prior, the haze was removed from various outdoor images.
In the proposed method, pixels not affected by a counterlight exploit the tendency of at least one of the R, G, and B color channels to have a lower brightness value. The process of obtaining the t(x) illumination map using a dark channel prior and finally obtaining J(x) through this process is the haze removal process [28]. The dark channel value corresponding to a pixel x of the input image (I) becomes the smallest value among all RGB channel values of the pixels around the x pixel. The dark channel prior is then used to estimate the atmospheric light (A). Finally, t(x) is calculated using the estimated A. The procedural code for calculating t(x) is presented in Table 3.
To estimate the atmospheric light in the dark channel, pixels with a brightness value of 1% are searched for in the dark channel image. This means that the brightest pixel in the top 1% is searched because the method is performed on an image that is inverted from the input image. Atmospheric light was computed using the matrix [1 1 1].
In Equation (4), the atmospheric light is divided by the inversion image, and the smallest value is taken from the result. Then, using the morphology operation, an open operation using a 15 × 15 filter size is applied. The illuminance map is obtained after subtracting from 1. By applying a histogram analysis to the obtained illuminance map, if the range of the brightness value with a high weighted distribution among the illuminance map brightness values is between 0–5 and 250–255, it is determined that the input image contains a counterlight. A histogram analysis of the illumination map of an image with a counterlight is as shown in Equation (5).
4. Experiment Results
To experiment on the proposed method, we conducted an experiment with black-box images installed on vehicles acquired from various road environments. The black-box videos were of HD quality, with a pixel resolution of 1920 × 1080, a 24 bit RGB color channel, and a frame rate of 30 fps. To acquire the unique color and brightness of the outdoor environment, the image color and brightness correction function included in the black-box device were canceled, and an image shake correction function was activated to acquire the image. The experimental environment of the proposed method was achieved using the MATLAB program on a PC running Windows OS 10 with a 3.2 Ghz core CPU, 64 GB of memory, and a dual 3080 GPU(10 GB). Figure 9 shows the location where the vehicle black-box was installed.
As shown in Figure 10, in an image including a counterlight from sunlight acquired from the black-box, the illuminance increased in a specific area. When the counterlight was included in the acquired black-box image, the brightness of the regions not including sunlight was relatively low because of the limitation of the range of illuminance that could be expressed by the CCD sensor. Despite the rapid change in illuminance, human vision adaptively responds to recognize objects quickly, whereas the CCD sensor has limitations in expressing objects owing to the limited range of the illuminance expressed. When sunlight is included in the image, the illuminance value of the corresponding region is increased, whereas the illuminance of other regions is lowered, resulting in the image being darkened as a whole. Figure 10 shows images of sunlight acquired from the black-box.
The acquired image was a 24-bit HD quality RGB color image with a pixel resolution of 1920 × 1080. The proposed method reduced the throughput required for image processing by reducing the size of the image to determine in real time whether it contained a counterlight. Therefore, the black-box image input was reduced to 1/2 the pixel size using the bilinear interpolation method [26], and the analysis process was applied in the gray image instead of the RGB color channel. In order to evaluate the detection accuracy of the proposed method, the accuracy and precision were evaluated using images containing a counterlight and images determined to be normal in advance using a ground-truth method.
In Table 4 the step requiring the longest time consumption is the transmission map analysis step, which applies a pixel-wise inverse conversion process. Nevertheless, the proposed method took approximately 0.7 s on average to process one frame, enabling real-time processing. To test the proposed method, experiments were conducted on groups of images containing counterlight obtained from different locations, the average accuracy was found to be approximately 88%. By recognizing in advance whether a counterlight is included in the image acquired from the vehicle black-box, malfunctions owing to image recognition errors can be prevented in advance in the application of vision-based autonomous driving vehicles, and it will be possible to apply the method as a safe driving support system.
4.1. Evaluation of Histogram Analysis
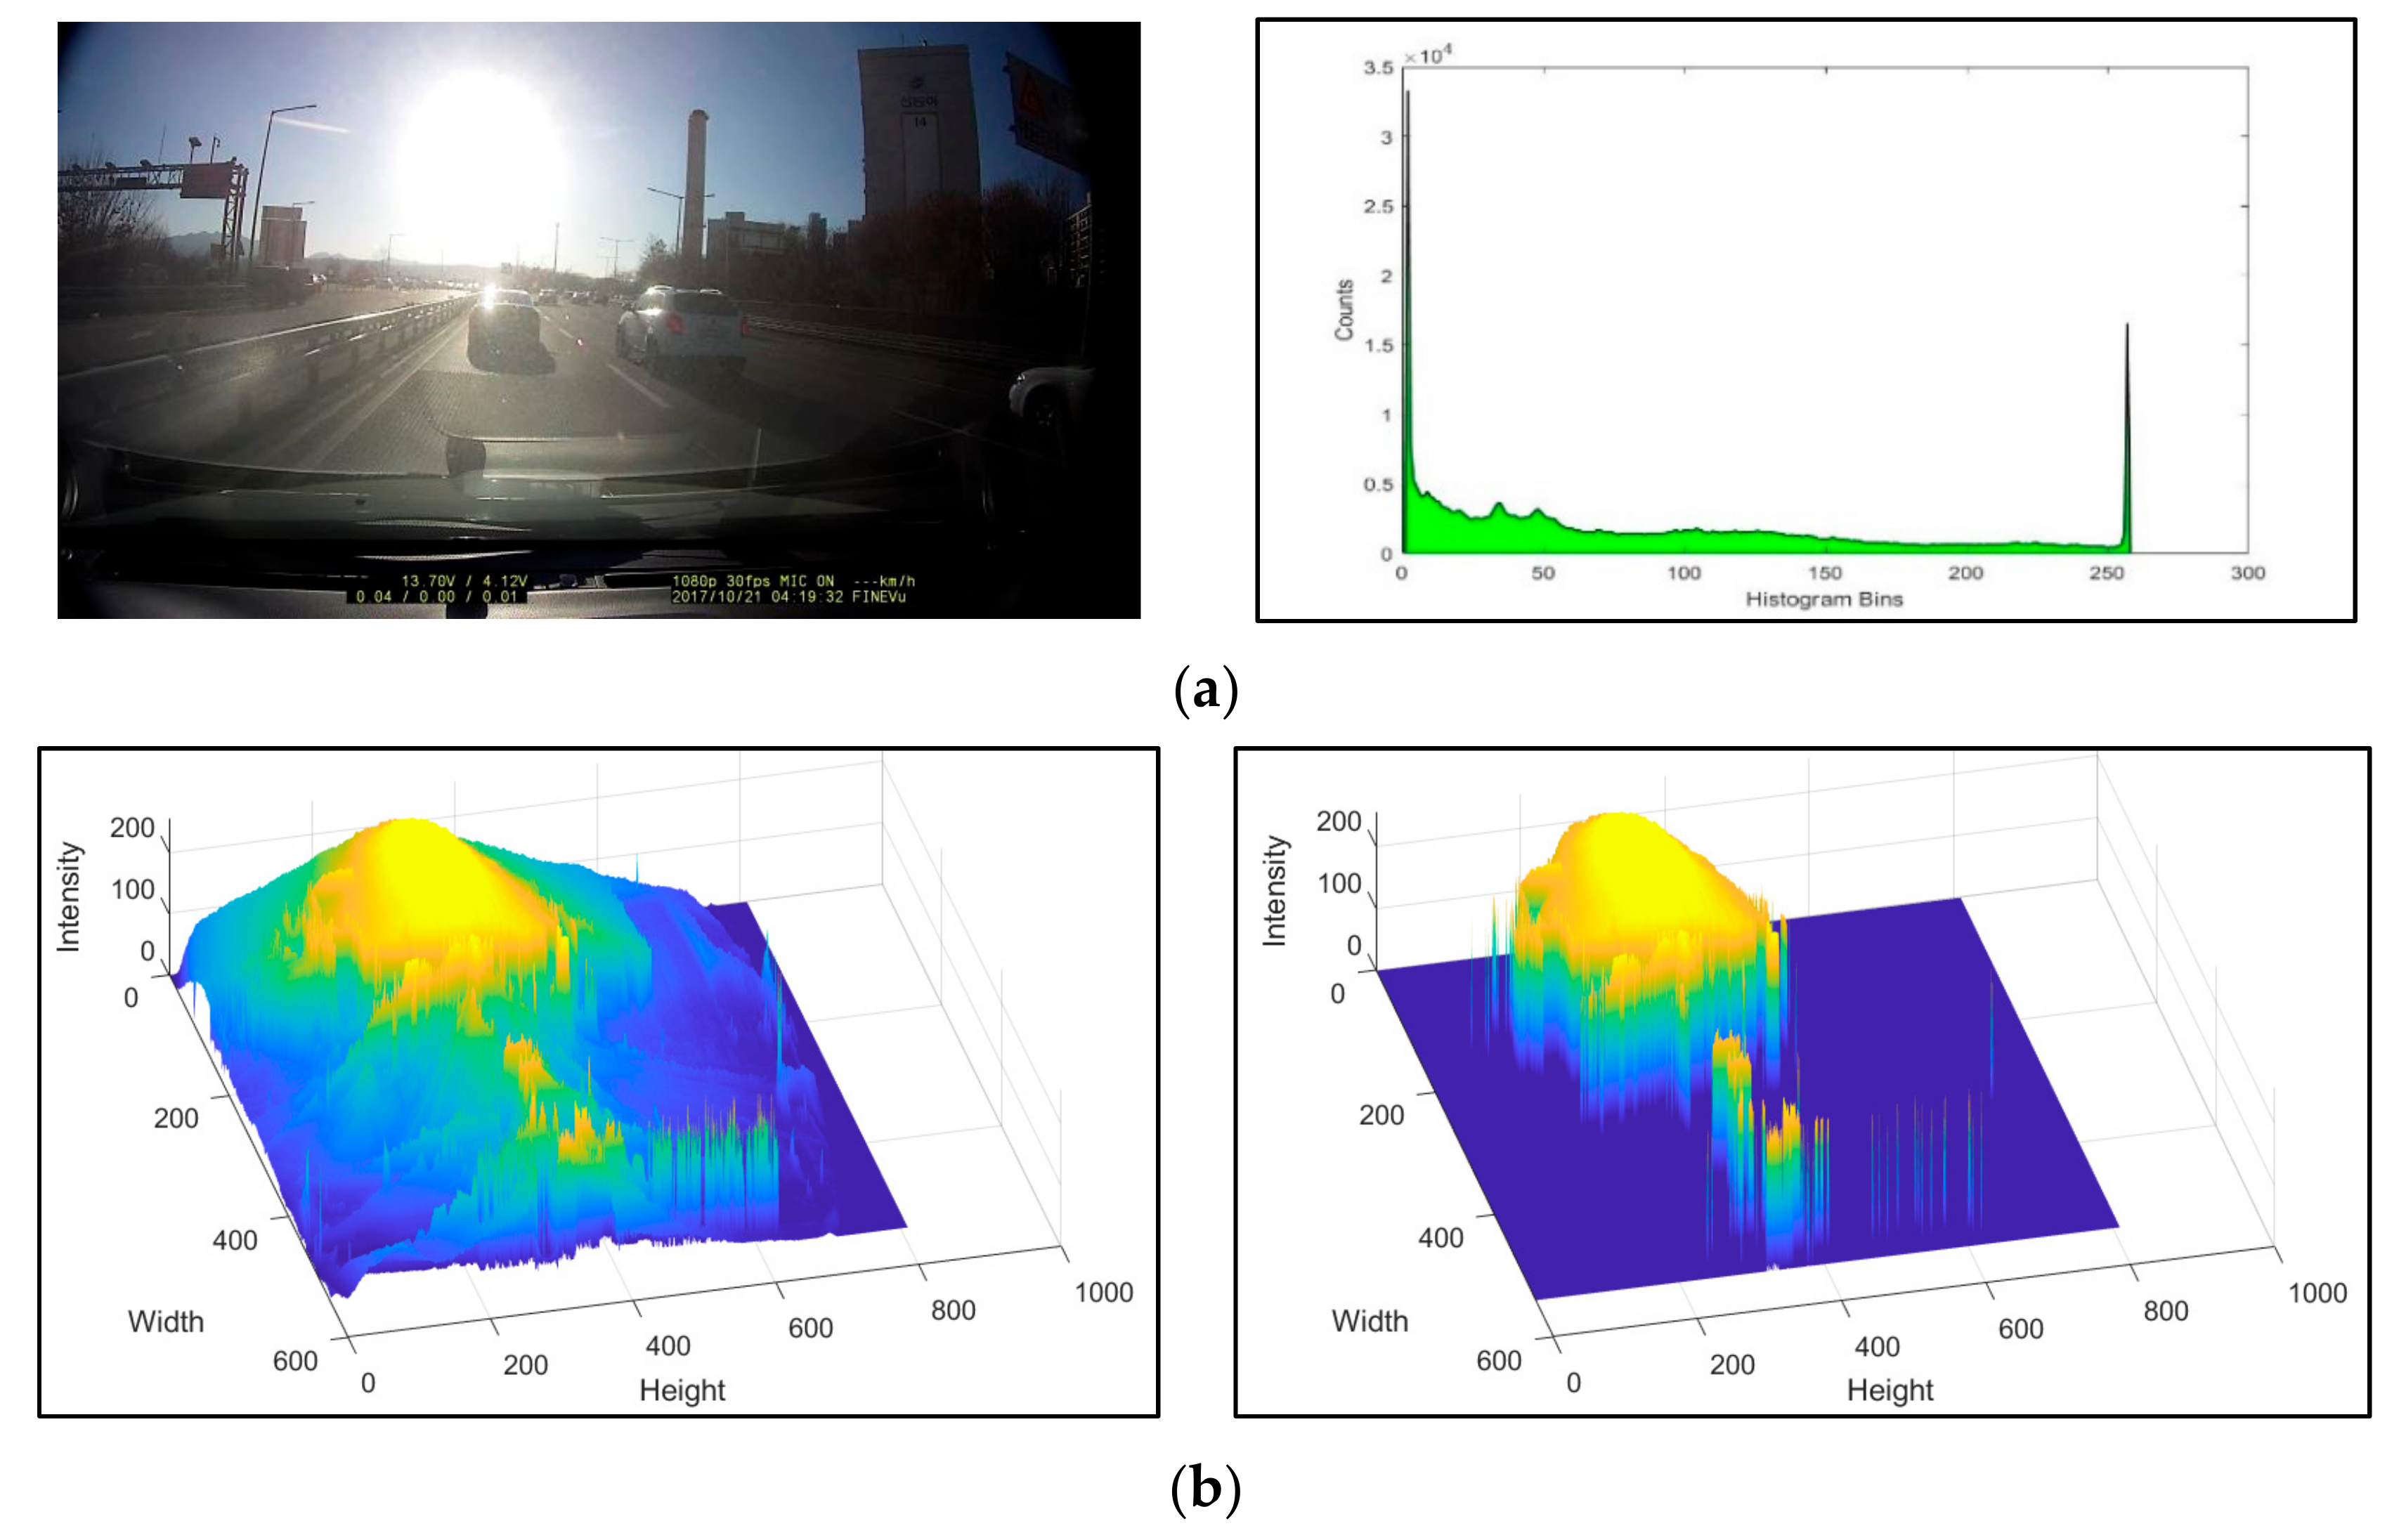
This step analyzes a histogram of the brightness values from the input gray image to determine whether it contains a counterlight. Figure 11 shows the output results of the histogram of an image with a counterlight. In the case of images with counterlight, the brightness value of a particular region was significantly higher, and the illumination value of the other pixels was lowered because of the expression limit of the CCD sensor. As shown in Figure 11, pixels with a brightness value of 200 or less accounted for more than 70% of the total image.
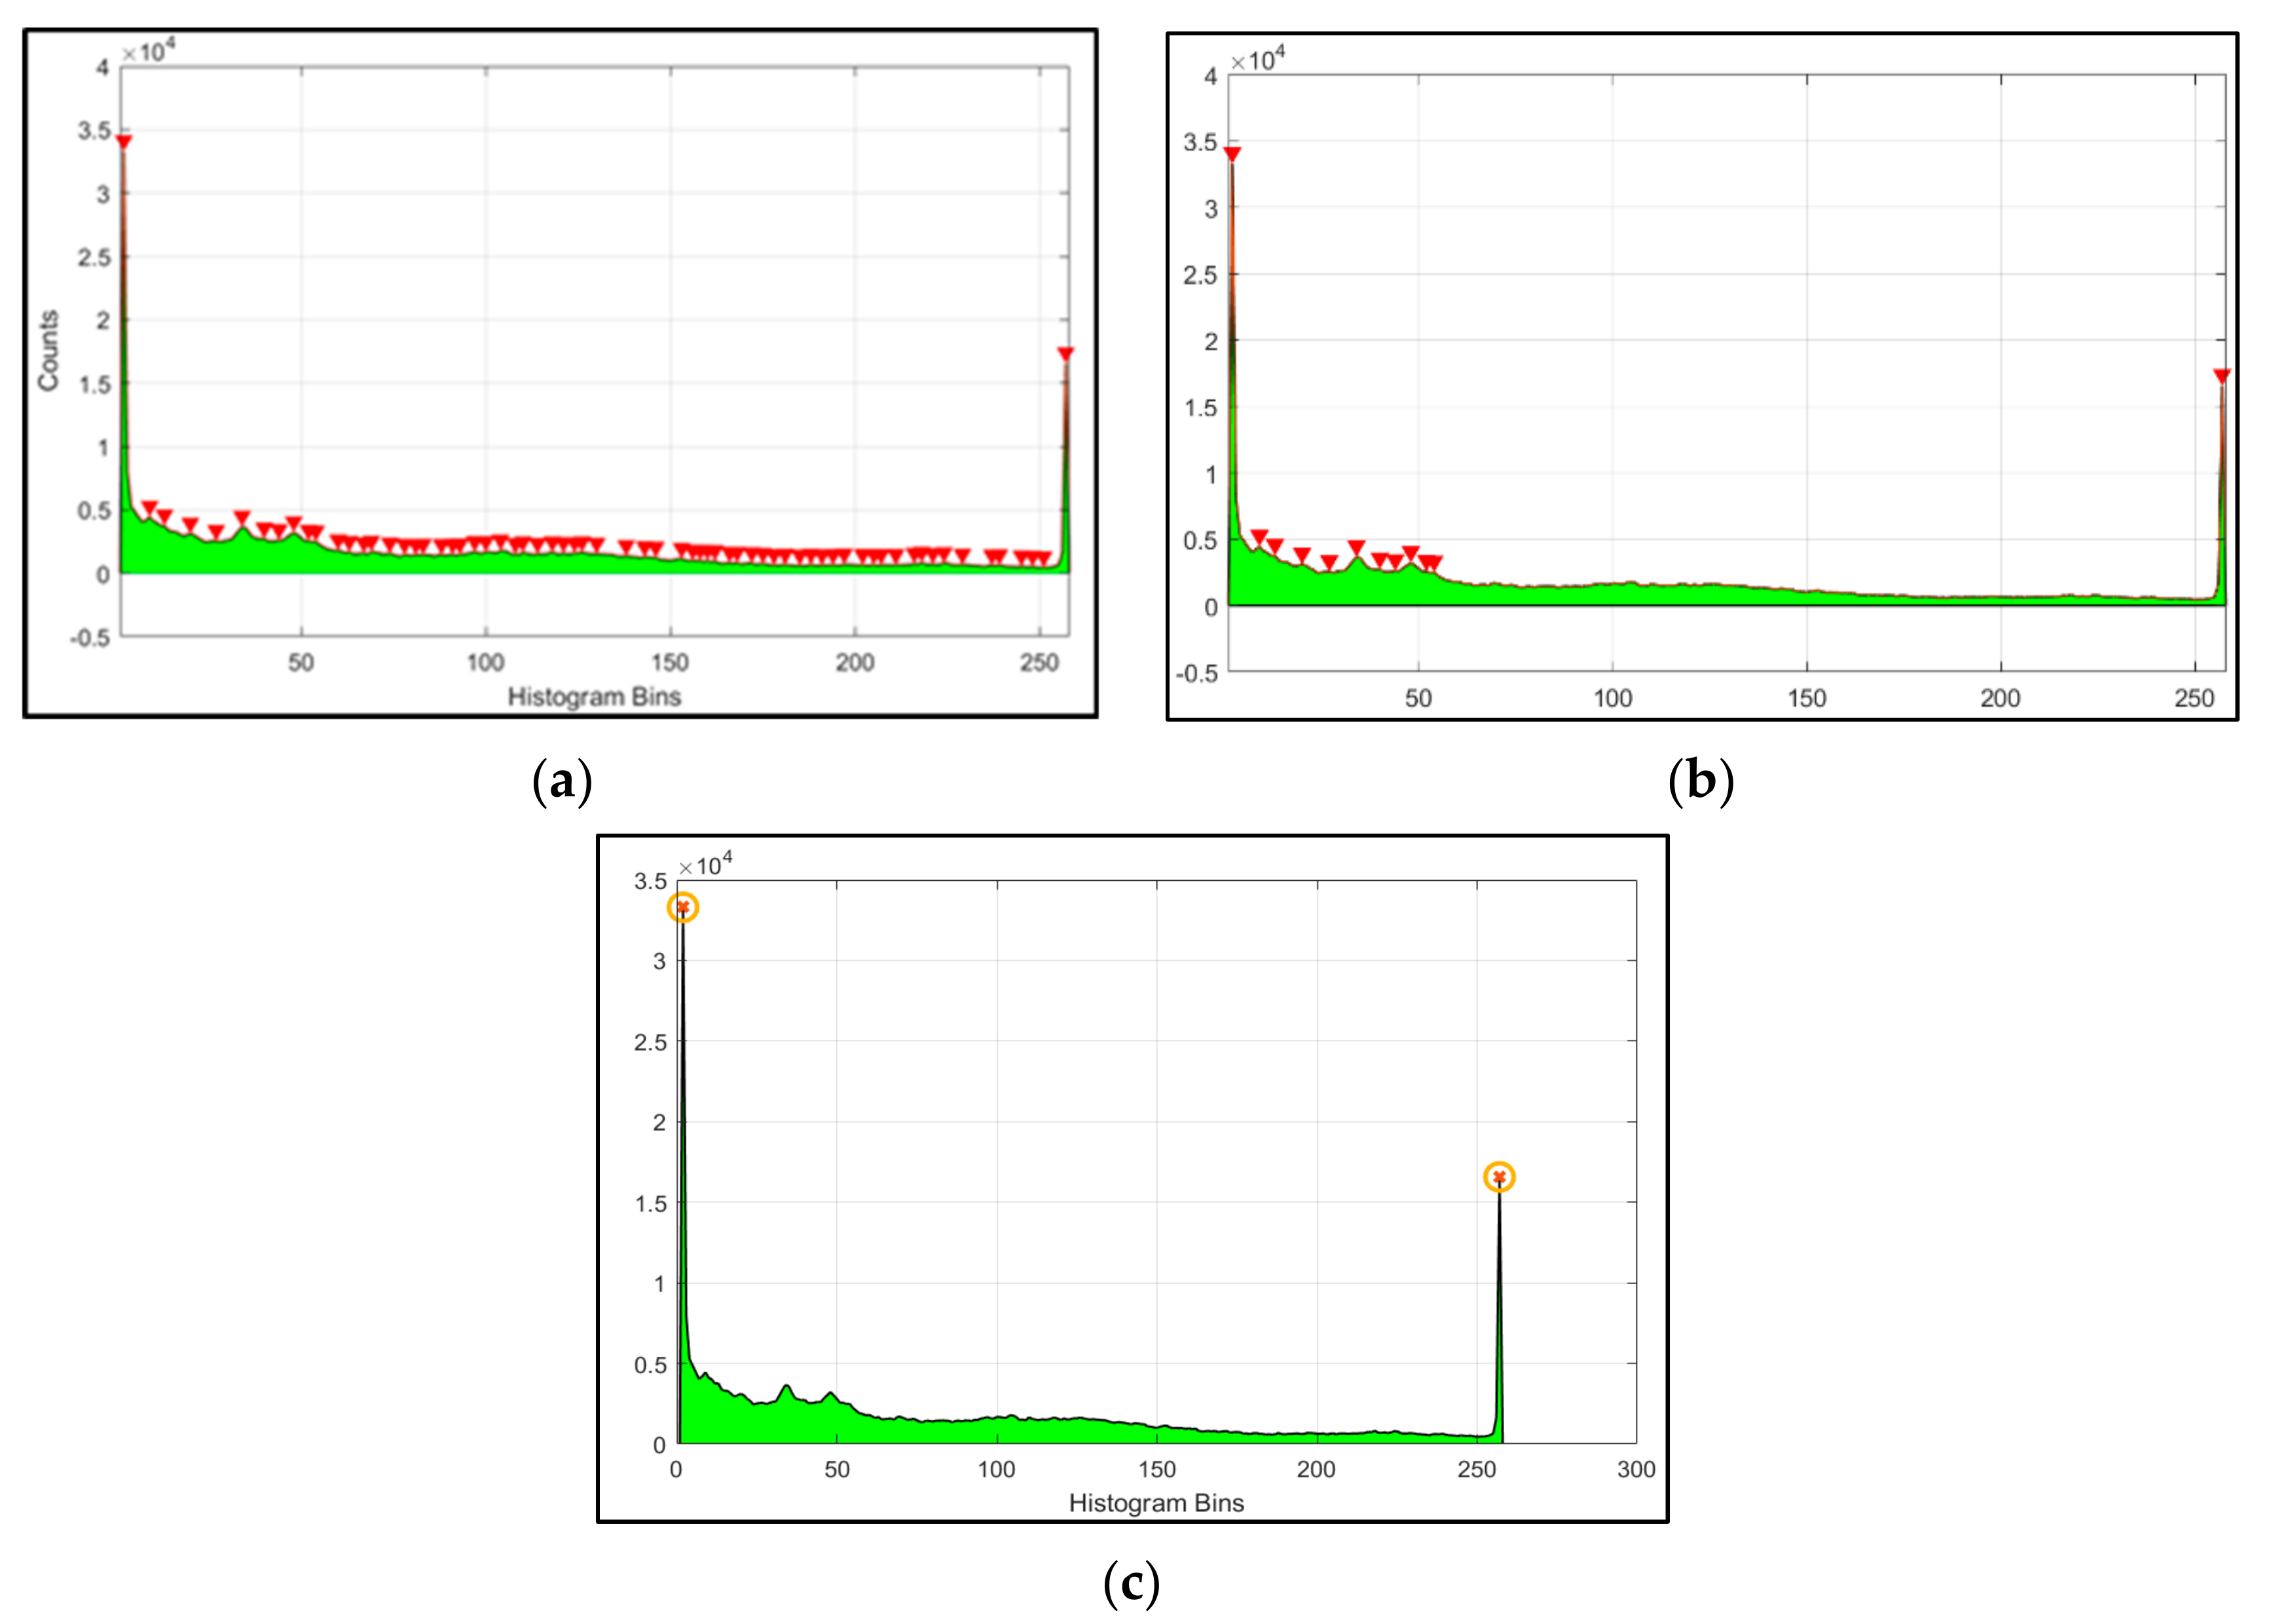
Figure 12 shows the positions of the peaks, which are the local maxima, from the histogram showing the number of pixels in the gray image. Figure 12a shows the selection of all peaks larger than the distribution of adjacent brightness values in the histogram of the brightness values. Figure 12b shows the selection of peaks with a difference in the distribution of adjacent brightness values greater than a certain size, and Figure 12c shows the results of selecting the histogram distribution peaks to which the proposed method is applied. Histogram peaks are measurements of the prominent peaks owing their unique heights and positions relative toother peaks. Thus, the histogram of the brightness values selects a relatively different portion of the adjacent brightness values as the peak. In the brightness value histogram, only peaks that are greater than or equal to α are selected as the minimum peak height. Only the peak exceeding the minimum height difference β between the peak and its neighboring peak is the output. α and β of Equation (1) were obtained from the experimental images through the ground-truth method. In Equation (1), α is 2000 and β is set to 1000.
Figure 13 shows the results of detecting road images containing counterlight using the proposed histogram analysis process. Figure 13a,b show the distribution of brightness histograms in the images including a counterlight and general road images. The experiments showed that peak brightness in the histogram was located at brightness values of 0–5 and 250–255 on road images containing a counterlight. However, the histogram distribution of a general road image had a peak similar to that of a road image having a counterlight. There is a limit to detecting images containing a counterlight when analyzing only the peak position of the histogram. Therefore, additional image analysis steps are required. In the histogram analysis step, if there are two or more histogram peaks and the position of the histogram peak is between the brightness values 0–5 and 250–255, the image is classified as an image that includes a counterlight.
4.2. Evaluation of Region Analysis
In general, a counterlight caused by sunlight is located at the top of the road image obtained from the black box of the vehicle. In the lower part of the road image, pixels with a low brightness value are located in the asphalt color of the road surface, and pixels with a relatively high brightness value are located in the upper part of images that includes a sky or lighting area. This step applies a binarization method to the input gray image and detects whether it contains a counterlight based on the size and center point position of the largest region with the same brightness value.
Figure 14 shows the results of detecting the largest area and center points with the same pixel brightness value through the region analysis step. Figure 14b shows the result of removing regions with less than 200 pixels from the binarized image in Figure 14a through a pixel connection component analysis. Then, a process of filling in the empty spaces in adjacent pixels in the four directions is conducted. Figure 14d shows the results of detecting the central point position of the largest region in images containing a counterlight and in normal road images.
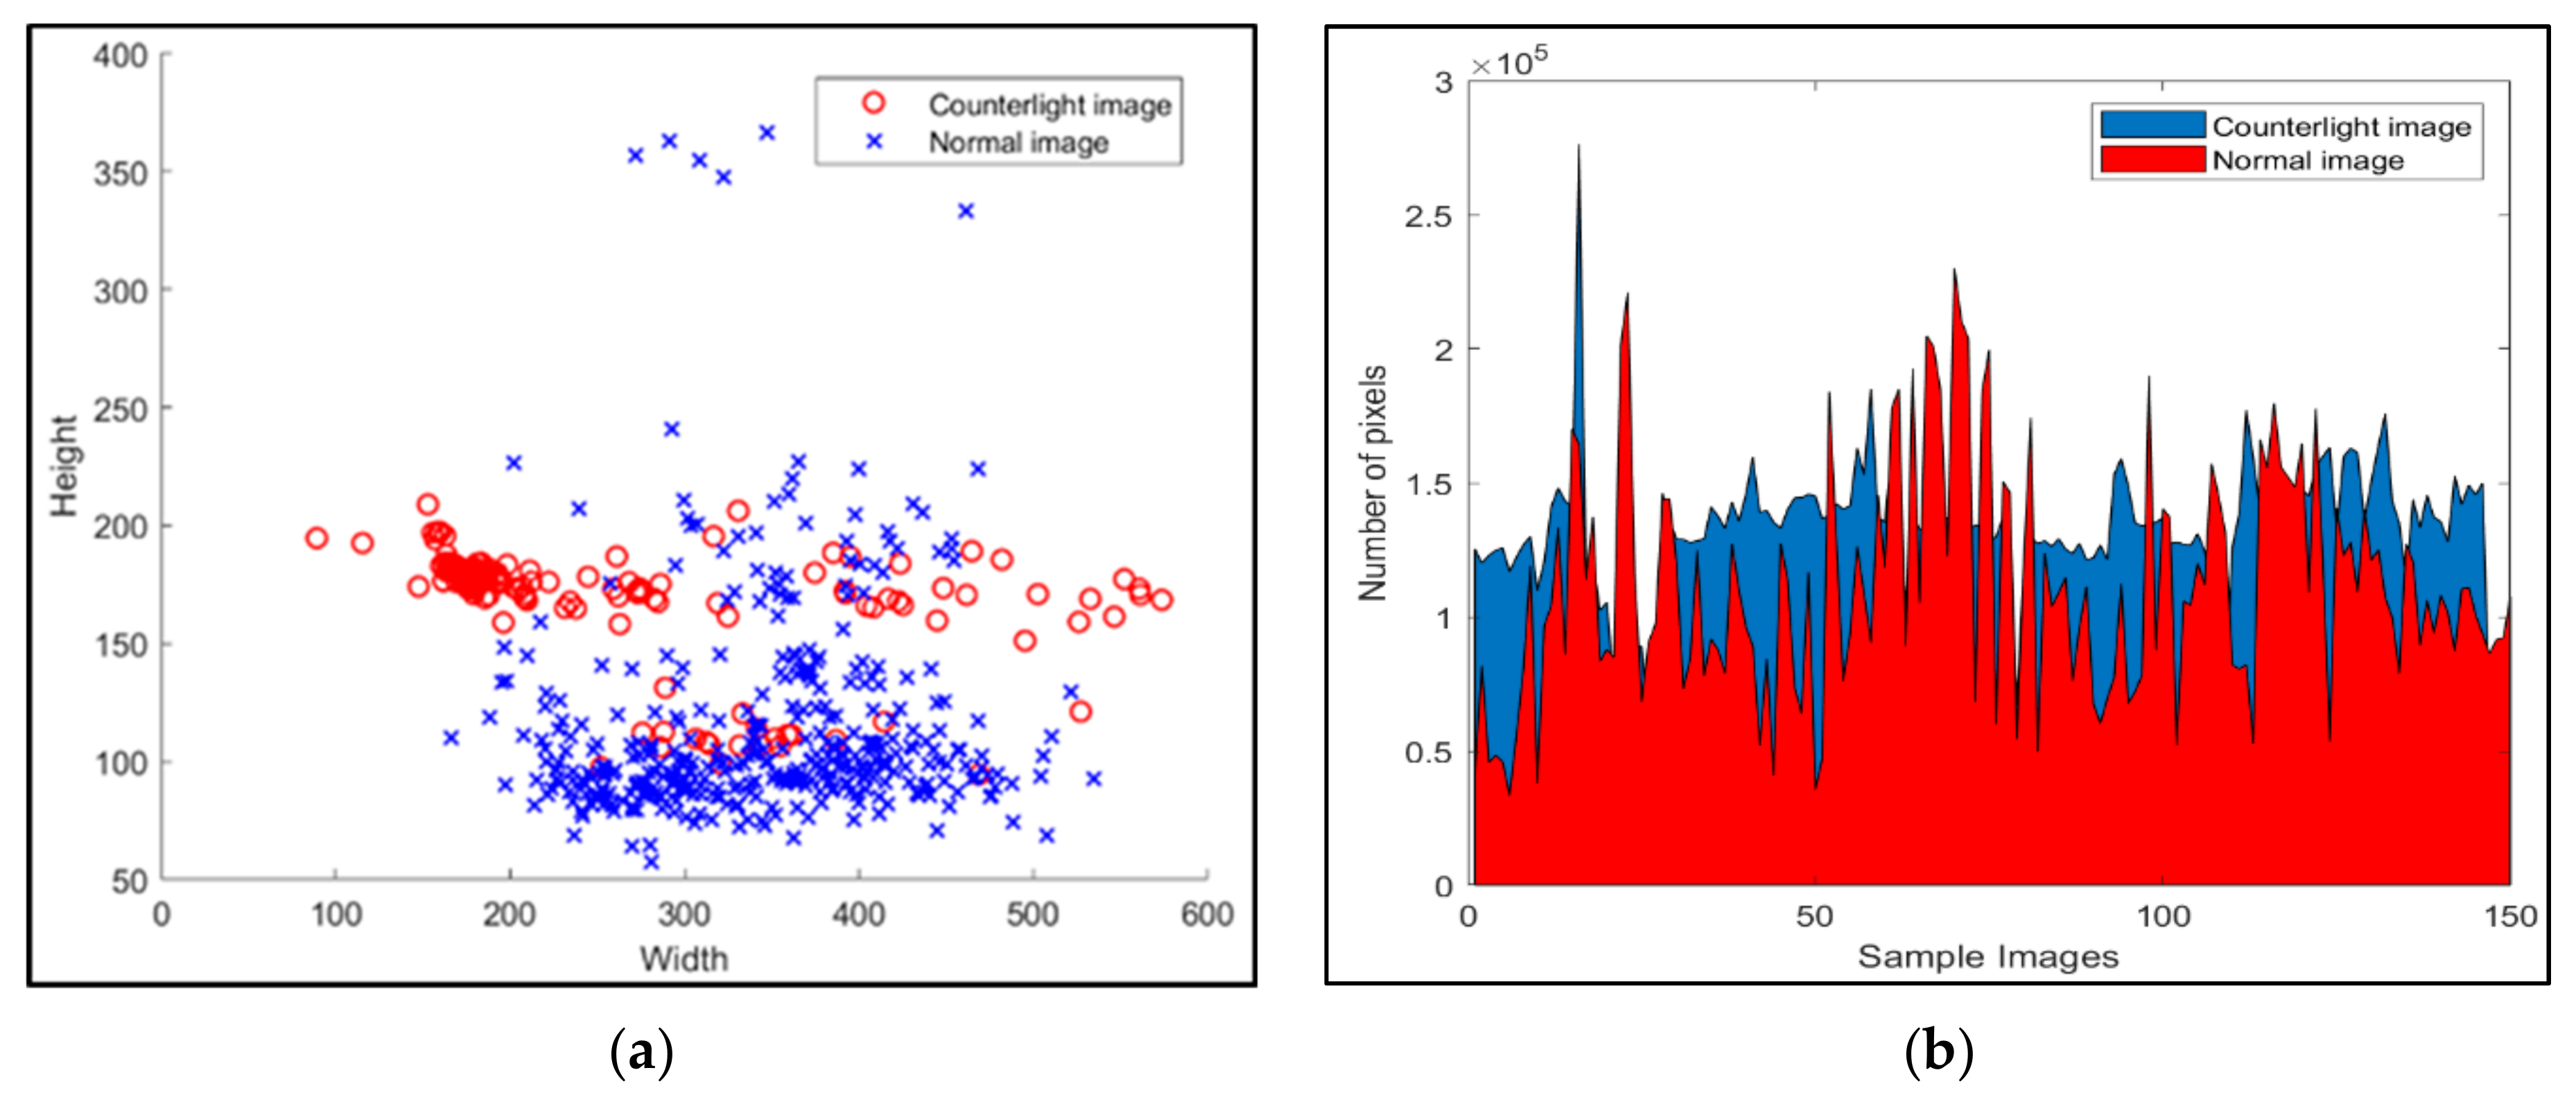
In Figure 15, the position and size of the region with the highest brightness value in an image including a counterlight and in a normal image were compared through a region analysis step. Figure 15a,b show the coordinates of the center point of the largest region with the same intensity value included in the experimental images and the total number of pixels. Figure 15a shows the coordinates of the upper left to 0, 0 based on the width and height of the input image. Experiment results showed that the center point coordinates of the largest region of a general road image and an image including a counterlight did not differ much in width, but that the height coordinates existed at a particular location. In addition, it can be seen through the experiment results that the number of pixels in the largest region was larger in the image including the counterlight compared to the normal road image. To detect an image that includes a counterlight, if the number of pixels in the largest region is 25% or more of the total image size and the position of the center points of the largest region is located in the upper half of the input image, the image is detected as having a counterlight.
4.3. Evaluation of Edge Analysis
Figure 16 shows the results of comparing the number of edge pixels included in the largest area in the binarized road image, including a counterlight and in the normal road image. Experiment results showed that the largest region of images containing a counterlight had similar brightness values, and thus, the number of edge pixels was smaller than that of normal road images. It can also be seen that the ratio of the number of edge pixels to the total number of pixels in the largest area in the road image including the counterlight was constant.
As the experiment results indicate, in the case of an image including a counterlight, the number of edge pixels is relatively small compared to a normal image owing to the effect of the bright illumination. The criteria of the proposed method used to classify whether an image includes a counterlight, for the number of edge pixels in the binary region (E) and the total number of pixels in the binary region (T), is as follows: when E/T > 0.1, the images are classified as including a counterlight.
4.4. Evaluation of Illuminance Map Analysis
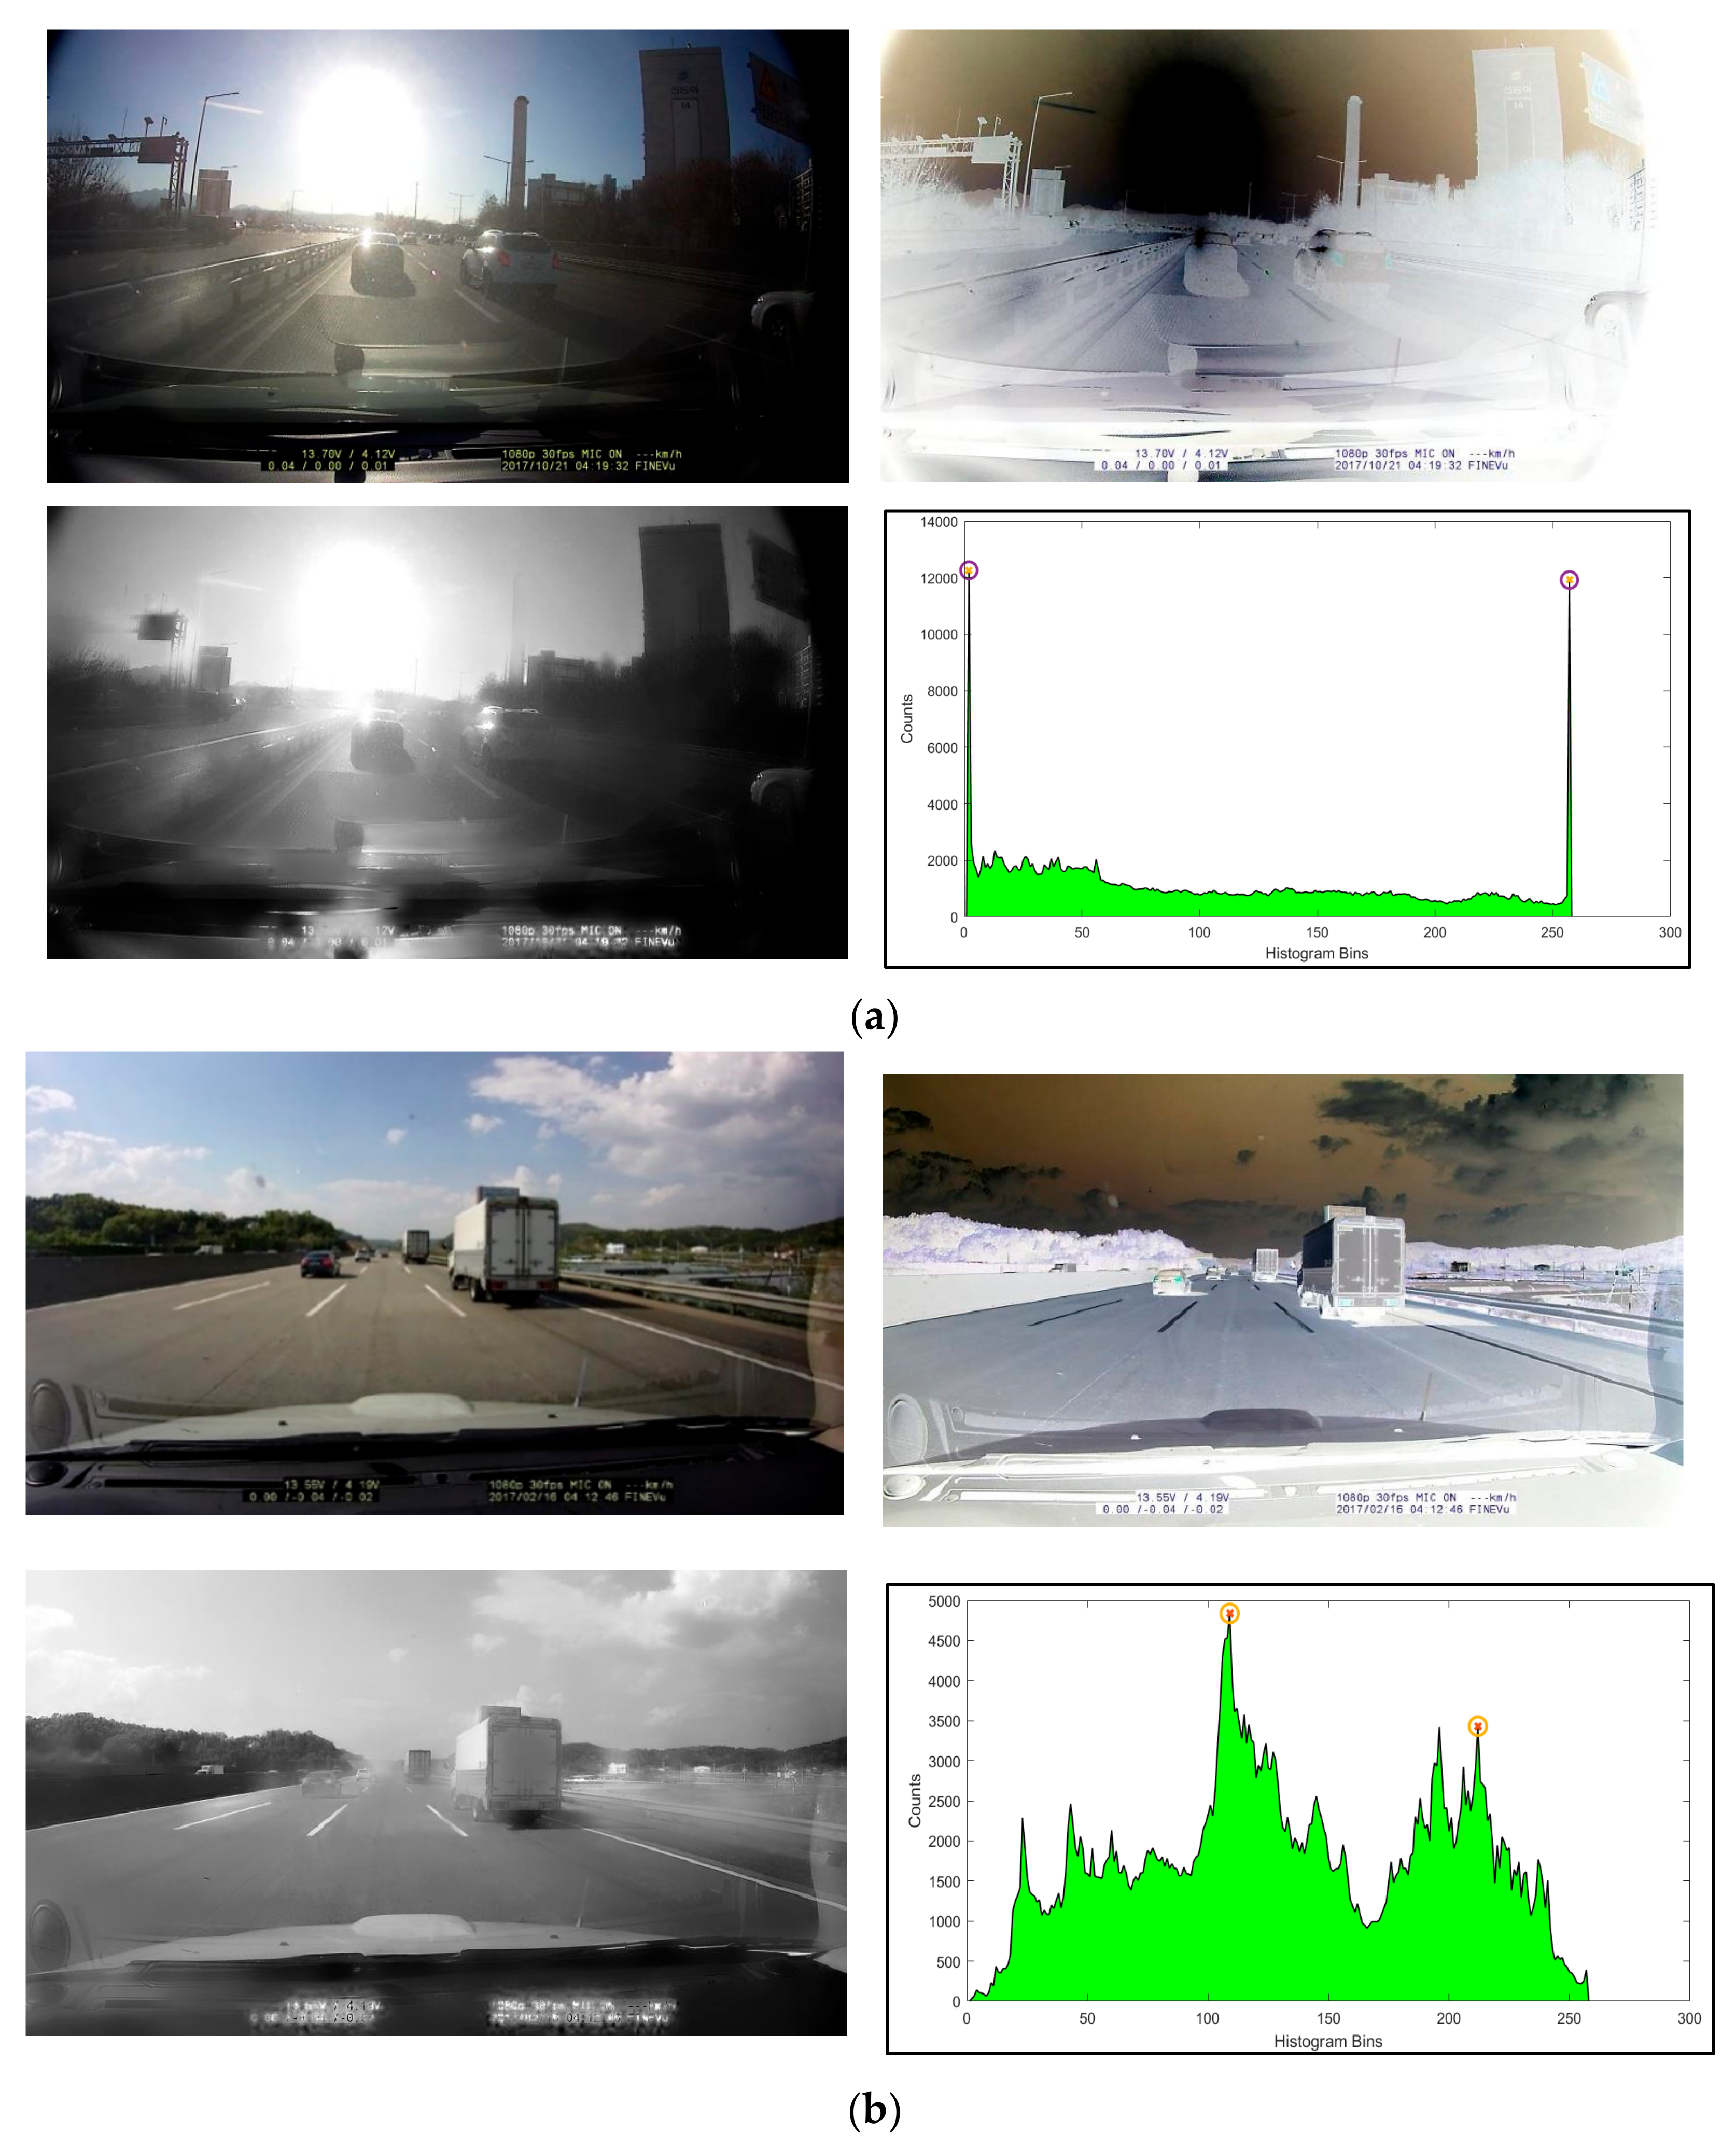
This step analyzes the histogram from the illumination map estimated in the input image to determine whether it contains a counterlight. In this step of the experiment, the proposed method was applied to estimate the illuminance map from the road image, including a counterlight, as well as to analyze the brightness histogram to determine whether the counterlight was included based on the location of the histogram peaks. To estimate the illuminance map from the input image, an inverted image was generated, as shown in Figure 17. The illuminance map was then estimated using the dark channel prior from atmospheric light. Figure 17 shows the results of expressing the estimated illuminance map, as well as a brightness histogram of the illuminance map of the road image with a counterlight and that of a normal road image. The histogram peaks of the estimated illumination map of road image including a counterlight were located near brightness values of 0, and 255.
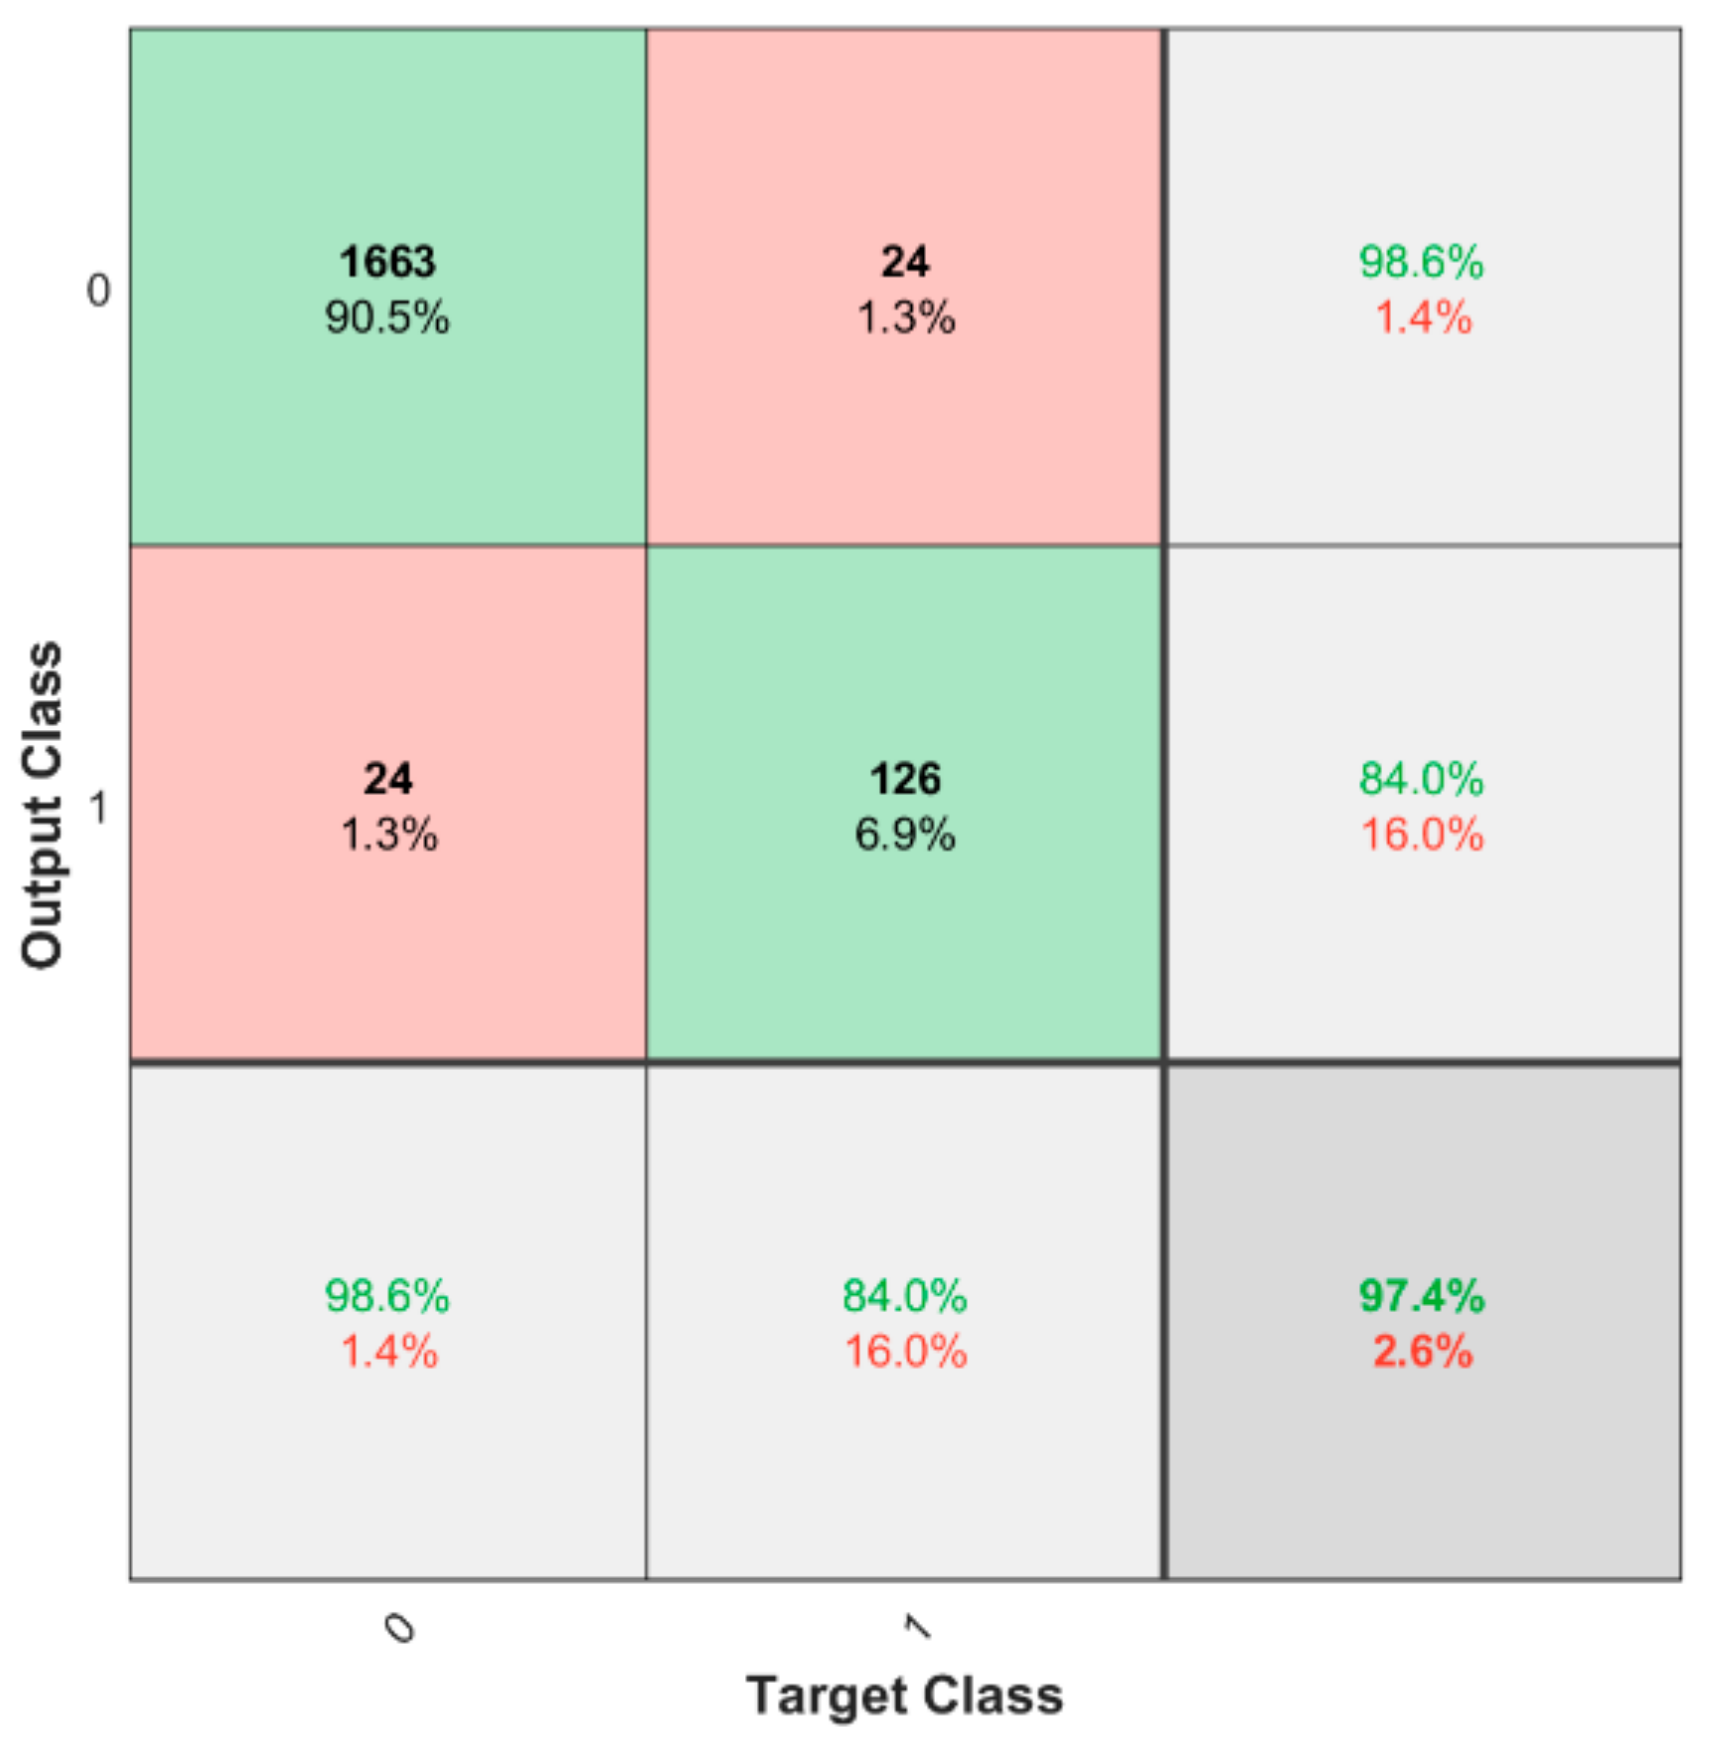
A total of 150 road images, including a counterlight acquired at different locations and 1687 normal road images, were used for the detection of counterlight including images through an illumination map analysis. Figure 18 shows the confusion matrix used to analyze the results of image detection including a counterlight based on an illumination map analysis. As a result of the experiment, the success rate in detecting images that include a counterlight, was 97.4%, with a misdetection rate of 2.6%. In particular, 84% of the road images containing a counterlight were correctly detected, and 16% were misdetected as normal road images. In addition, 98.6% of normal road images were correctly detected, and 1.4% of images containing a counterlight were erroneously detected.
4.5. Comparison of Detection Results of Images including a Counterlight
To evaluate the detection of images that include a counterlight when using the proposed method, the results were compared with methods described in [11,12]. Experiments were conducted on image sequences that included counterlights on different roads. With the proposed method [11], when the histogram distribution of the brightness values is located within the 0 and 255 regions in the gray image and the histogram distribution has a bimodal shape, the image is detected as one that includes a counterlight.
The method proposed in [12] calculates the histogram of each color channel in the YCrCb color space, and detects images that include a counterlight based on the distribution of the histograms in each Cr and Cb color space. Their method utilizes a feature in which Cr and Cb colors are narrowly distributed around 128 values within the 0–255 space for images that include a counterlight. For the method in [12], the image is classified as a low-illuminance image, and when the Cr and Cb values are above the threshold, it is classified as a backlight image. Here, the Cr and Cb color thresholds were set between 112 and 143. Table 5 shows the results of comparing the proposed method with other approaches. The experiment results show that the proposed method effectively detects images that include counterlights.
5. Conclusions
To support the safe driving of automobiles, it is necessary to effectively recognize road driving situations. Road driving situation recognition is possible by symmetrically collecting and analyzing visual information using a CCD sensor mounted on a vehicle. As a result, the image quality of the road image and the driving situation recognition rate are symmetrically related. In this paper, to provide safe driving support information for autonomous vehicles, a method for detecting whether a counterlight is included in the acquired black-box image is proposed. Most driving tasks depend on the visual information of the driver. In autonomous vehicles, it is necessary to use visual information to detect lanes, traffic lights, signs, obstacles, and other elements, and to provide information related to safe driving in real time. If the image acquired from a vehicle contains a counterlight caused by sunlight, image recognition becomes difficult. As a result, it is difficult to obtain driving safety information to support safe driving. Therefore, our method proposes a method of detecting whether a counterlight is included in a road image obtained from the vehicle’s black box in real time. With the proposed method, we detect whether a counterlight is included in the input image using the edge, area, and brightness distribution information in combination. Testing the proposed method on images obtained on an actual road, a level of satisfaction of approximately 88%, or more, was presented. The proposed method also enables the application of safe autonomous vehicles. In future studies, we will attempt to improve the image quality of road images that include a counterlight.
Funding
This work was supported by the National Research Foundation of Korea (NRF) grant funded by the Korea government (MSIT) (NRF-2020R1F1A106890011) and Technology Innovation Program (20016800) funded by the Ministry of Trade, Industry & Energy (MOTIE, Korea).
Institutional Review Board Statement
Not applicable.
Informed Consent Statement
Not applicable.
Data Availability Statement
Not applicable.
Conflicts of Interest
The author declares no conflict of interest.
References
- Guo, C.; Meguro, J.; Kojima, Y.; Naito, T. A Multimodal ADAS System for Unmarked Urban Scenarios Based on Road Context Understanding. IEEE Trans. ITS 2015, 16, 1690–1704. [Google Scholar] [CrossRef]
- Hua, J.; Shi, Y.; Xie, C.; Zhang, H.; Zhang, J. Pedestrian and Vehicle-Detection Algorithm Based on Improved Aggregated Channel Features. IEEE Access 2021, 9, 25885–25897. [Google Scholar] [CrossRef]
- Gerónimo, D.; López, A.M.; Sappa, A.D.; Graf, T. Survey of Pedestrian Detection for Advanced Driver Assistance Systems. IEEE Trans. PAMI 2010, 32, 1239–1258. [Google Scholar] [CrossRef] [Green Version]
- Ledezma, A.; Zamora, V.; Sipele, Ó.; Sesmero, M.P.; Sanchis, A. Implementing a Gaze Tracking Algorithm for Improving Advanced Driver Assistance Systems. Electronics 2021, 10, 1480. [Google Scholar] [CrossRef]
- Bengler, K.; Dietmayer, K.; Farber, B.; Maurer, M.; Stiller, C.; Winner, H. Three Decades of Driver Assistance Systems: Review and Future Perspectives. IEEE Trans. ITS Mag 2014, 6, 6–22. [Google Scholar] [CrossRef]
- Li, Y.; Qiao, Y.; Ruichek, Y. Multiframe-Based High Dynamic Range Monocular Vision System for Advanced Driver Assistance Systems. IEEE Sens. J. 2015, 15, 5433–5441. [Google Scholar] [CrossRef]
- Marti, E.; Miguel, M.A.; Garcia, F.; Perez, J. A Review of Sensor Technologies for Perception in Automated Driving. IEEE ITS Mag. 2019, 11, 94–108. [Google Scholar] [CrossRef] [Green Version]
- Kang, B.; Lee, Y. A Driver’s Visual Attention Prediction Using Optical Flow. Sensors 2021, 21, 3722. [Google Scholar] [CrossRef]
- Kim, J.B. Efficient Vanishing Point Detection for Driving Assistance Based on Visual Saliency Map and Image Segmentation from a Vehicle Black-Box Camera. Symmetry 2019, 11, 1492. [Google Scholar] [CrossRef] [Green Version]
- Lee, W.; Kang, M.H.; Song, J.; Hwang, K. The Design of Preventive Automated Driving Systems Based on Convolutional Neural Network. Electronics 2021, 10, 1737. [Google Scholar] [CrossRef]
- Song, C.W.; Jeong, W.J.; Moon, Y.S. The Counterlight Image Classification Based on Properties of Counterlight Image. Proc. IEEK 2015, 474–476. [Google Scholar]
- Park, H.J.; Han, S.W. Detection of backlight images using chrominance. Proc. SPIE 2012, 8292, 121–127. [Google Scholar]
- Chin, C.L.; Lin, C.T. Detection and compensation algorithm for backlight images with fuzzy logic and adaptive compensation curve. Int. J. Pattern Recognit. Artif. Intell. 2005, 19, 1041–1057. [Google Scholar] [CrossRef]
- Aldibaja, M.; Suganuma, N.; Yoneda, K. Robust Intensity-Based Localization Method for Autonomous Driving on Snow–Wet Road Surface. IEEE Trans. Ind. Inform. 2017, 13, 2369–2378. [Google Scholar] [CrossRef] [Green Version]
- Lee, C.; Chen, L.; Wang, W. Image contrast enhancement using classified virtual exposure image fusion. IEEE Trans. Consum. Electron. 2012, 58, 1253–1261. [Google Scholar] [CrossRef]
- Dharejo, F.A.; Zhou, Y.; Deeba, F.; Du, Y. A Color Enhancement Scene Estimation Approach for Single Image Haze Removal. IEEE Geosci. Remote Sens. Lett. 2020, 17, 1613–1617. [Google Scholar] [CrossRef]
- Wang, Y.F.; Liu, H.M.; Fu, Z.W. Low-Light Image Enhancement via the Absorption Light Scattering Model. IEEE Trans. Image Process. 2019, 28, 5679–5690. [Google Scholar] [CrossRef]
- Kim, K.; Park, S.; Yu, S.; Paik, J. Bright region preserving back-light image enhancement using clipped histogram equalization. In Proceedings of the 2018 International Conference on Electronics, Information, and Communication (ICEIC), Honolulu, HI, USA, 24–27 January 2018; pp. 1–3. [Google Scholar]
- Wen, H.; Dai, F.; Wang, D. A Survey of Image Dehazing Algorithm Based on Retinex Theory. In Proceedings of the 2020 5th International Conference on Intelligent Informatics and Biomedical Sciences (ICIIBMS), Okinawa, Japan, 18–20 November 2020; pp. 38–41. [Google Scholar]
- Li, C.; Tang, S.; Yan, J.; Zhou, T. Low-Light Image Enhancement Based on Quasi-Symmetric Correction Functions by Fusion. Symmetry 2020, 12, 1561. [Google Scholar] [CrossRef]
- Kandhway, P.; Bhandari, A.K. An optimal adaptive thresholding based sub-histogram equalization for brightness preserving image contrast enhancement. Multidim Syst. Sign Process. 2019, 30, 1859–1894. [Google Scholar] [CrossRef]
- Liang, H.; Yu, A.; Shao, M.; Tian, Y. Multi-Feature Guided Low-Light Image Enhancement. Appl. Sci. 2021, 11, 5055. [Google Scholar] [CrossRef]
- Wang, Q.; Fu, X.; Zhang, X.; Ding, X. A fusion-based method for single backlit image enhancement. In Proceedings of the IEEE International Conference on Image Processing, Phoenix, AZ, USA, 25–28 September 2016; pp. 4077–4081. [Google Scholar]
- Buades, A.; Lisani, J.L.; Petro, A.B.; Sbert, C. Backlit images enhancement using global tone mappings and image fusion. IET Image Process. 2020, 14, 211–219. [Google Scholar] [CrossRef]
- Li, Z.; Wu, X. Learning-Based Restoration of Backlit Images. IEEE Trans. Image Process. 2018, 27, 976–986. [Google Scholar] [CrossRef]
- Gonzalez, R.; Woods, R. Digital Image Processing, 4th ed.; Pearson Education: Essex, UK, 2017. [Google Scholar]
- He, K.; Sun, J.; Tang, X. Single Image Haze Removal Using Dark Channel Prior. IEEE Trans. Pattern Anal. Mach. Intell. 2011, 33, 2341–2353. [Google Scholar]
- Lee, S.; Yun, S.; Nam, J.H. A review on dark channel prior based image dehazing algorithms. EURASIP J. Image Video Process. 2016, 4, 1–23. [Google Scholar] [CrossRef] [Green Version]
Figure 1.
Example of a vehicle black-box image including counterlight caused by sunlight.

Figure 2.
Example of road images and intensity histograms.

Figure 3.
Processing flow of the proposed method.

Figure 4.
(a) Road image including a counterlight caused by sunlight and (b) its intensity histogram distribution.
Figure 4.
(a) Road image including a counterlight caused by sunlight and (b) its intensity histogram distribution.

Figure 5.
Processing flow of region analysis step.

Figure 6.
Coordinates of the center point of the binary region with the largest brightness values in images including a counterlight and in normal images.
Figure 6.
Coordinates of the center point of the binary region with the largest brightness values in images including a counterlight and in normal images.

Figure 7.
Total image pixels and the number of edge pixels in the region with the largest brightness value in images that include a counterlight and in normal images.
Figure 7.
Total image pixels and the number of edge pixels in the region with the largest brightness value in images that include a counterlight and in normal images.

Figure 8.
Processing flow of the illumination map analysis step.

Figure 9.
Vehicle black-box installation environment.

Figure 10.
Road images inducing a counterlight obtained from a black-box.

Figure 11.
(a) Road image including a counterlight and (b) histogram distribution and three-dimensional distribution of brightness values.
Figure 11.
(a) Road image including a counterlight and (b) histogram distribution and three-dimensional distribution of brightness values.

Figure 12.
Peak detection results for histogram of brightness values. (a) Results of all peak selections, (b) results of selection of peaks above a certain size, and (c) results of peak selection of the proposed method.
Figure 12.
Peak detection results for histogram of brightness values. (a) Results of all peak selections, (b) results of selection of peaks above a certain size, and (c) results of peak selection of the proposed method.

Figure 13.
Results of histogram analysis of (a) road images including a counterlight and (b) normal road images.
Figure 13.
Results of histogram analysis of (a) road images including a counterlight and (b) normal road images.

Figure 14.
Processing results of region analysis step. (a) Image binarization, (b) small region removal and hole filling, (c) region labeling, and (d) largest region with a centroid.
Figure 14.
Processing results of region analysis step. (a) Image binarization, (b) small region removal and hole filling, (c) region labeling, and (d) largest region with a centroid.

Figure 15.
Results of comparing the center point locations of regions with the largest brightness values in the image. (a) Center point locations of the largest regions, and (b) number of pixels in the largest regions.
Figure 15.
Results of comparing the center point locations of regions with the largest brightness values in the image. (a) Center point locations of the largest regions, and (b) number of pixels in the largest regions.

Figure 16.
Ratio of the number of edge pixels to the number of pixels in the largest region of a normal road image and a road image including a counterlight.
Figure 16.
Ratio of the number of edge pixels to the number of pixels in the largest region of a normal road image and a road image including a counterlight.

Figure 17.
Results of estimated illumination maps and histogram plots from road image. (a) Road image including a counterlight, (b) normal road image (clockwise: original image, inverted image, histogram, estimated illumination maps).
Figure 17.
Results of estimated illumination maps and histogram plots from road image. (a) Road image including a counterlight, (b) normal road image (clockwise: original image, inverted image, histogram, estimated illumination maps).

Figure 18.
Confusion matrix of image detection including a counterlight based on illuminance map analysis.
Figure 18.
Confusion matrix of image detection including a counterlight based on illuminance map analysis.


Table 1.
Definition of clues for detecting images including a counterlight.
| 1. Ratio of the size of the region with an intensity value above a certain threshold in the input image; 2. Center position of the largest region in the input image with an intensity value above a certain threshold; 3. Appearance of the largest area in the input image with an intensity value above a certain threshold; 4. Ratio of edge pixels contained inside a region with intensity values above a certain threshold in the input image; 5. Ratio of the concentration of a specific intensity value in the intensity histogram of the input image; 6. Position of the peak value in the distribution of the intensity histogram of the input image; 7. Difference between the maximum and minimum intensities of the input image; |
Table 2.
Procedure code for region analysis step for detecting images including a counterlight.
| Create the binary image B of gray image G. CNTS is the number of regions in binary image B. NEWCNTS is the number of regions in the small regions removed from binary image B. Procedure region(B) { for R = 1 to CNTS { if size region(R) < t then region(R) = 0; else fill image holes from region(R); } for N = 1 to NEWCNTS { find biggest area and location from region(N); } } |
Table 3.
Procedure code for calculating illumination map t(x).
| I(x) = J(x)t(x) + A(1 − t(x)), Obtain the observed image. min(I(x) = min(J(x)t(x)) + A(1 − t(x)), Apply minimum operation to calculate the dark channel prior. min = mint(x) + (1 − t(x)). = t(x) + (1 − t(x)), means one of r, g, b channel of pixel x. is a set of pixels within a certain range centered on x (set of surrounding pixels (local patch)). Dark channel priority . Therefore, = (1 − t(x)). t(x) = 1 − . Therefore, it is necessary to estimate the atmospheric light(A) to obtain t(x). (x,y) is the RGB image, c ∈ {r,g,b} CNT is the pixel size of (x,y) procedure (x,y) { (x,y) = (x,y)’, Create the inverse image of the obtained image. for i = 1 to CNT { (x,y) = min(min((x,y)), Calculate dark channel image prior D(x,y) from C(x,y) at each color channel. Erodes the D(x,y) with 15 15 matrix of the structuring element. } Estimate the atmospheric light in D(x,y) Estimate the transmission t(x,y) } |
Table 4.
Procedure code for calculating illumination map t(x).
| Steps | Histogram Analysis | Region Analysis | Edge Analysis | Transmission Map Analysis |
|---|---|---|---|---|
| Processing Time (sec.) | 0.11 | 0.23 | 0.08 | 0.29 |
Table 5.
Results comparing the detection performance for images that include a counterlight (%).
| Method | Intensity Histogram Analysis | Chrominance Analysis | Proposed Method | |
|---|---|---|---|---|
| Test No. (Number of Test Images) | ||||
| #1 (60) | 81.7 | 88.3 | 91.6 | |
| #2 (50) | 82 | 86 | 90 | |
| #3 (40) | 72.5 | 80 | 82.5 | |
Publisher’s Note: MDPI stays neutral with regard to jurisdictional claims in published maps and institutional affiliations. |
© 2021 by the author. Licensee MDPI, Basel, Switzerland. This article is an open access article distributed under the terms and conditions of the Creative Commons Attribution (CC BY) license (https://creativecommons.org/licenses/by/4.0/).
Share and Cite
MDPI and ACS Style
Kim, J. Detection of Road Images Containing a Counterlight Using Multilevel Analysis. Symmetry 2021, 13, 2210. https://0-doi-org.brum.beds.ac.uk/10.3390/sym13112210
AMA Style
Kim J. Detection of Road Images Containing a Counterlight Using Multilevel Analysis. Symmetry. 2021; 13(11):2210. https://0-doi-org.brum.beds.ac.uk/10.3390/sym13112210
Chicago/Turabian StyleKim, JongBae. 2021. "Detection of Road Images Containing a Counterlight Using Multilevel Analysis" Symmetry 13, no. 11: 2210. https://0-doi-org.brum.beds.ac.uk/10.3390/sym13112210
Note that from the first issue of 2016, this journal uses article numbers instead of page numbers. See further details here.