
The North–South Asymmetry of Sunspot Relative Numbers Based on Complex Network Technique

1
School of Statistics and Mathematics, Yunnan University of Finance and Economics, Kunming 650221, China
2
Department of Statistics, BNU-HKBU United International College, 2000 Jintong Road, TangJiaWan, Zhuhai 519087, China
3
School of Artificial Intelligence, Chongqing University of Arts and Sciences, Chongqing 402160, China
*
Author to whom correspondence should be addressed.
Symmetry 2021, 13(11), 2228; https://0-doi-org.brum.beds.ac.uk/10.3390/sym13112228
Submission received: 8 October 2021
/
Revised: 12 November 2021
/
Accepted: 17 November 2021
/
Published: 22 November 2021
Abstract
:Solar magnetic activity exhibits a complex nonlinear behavior, but its dynamic process has not been fully understood. As the complex network technique can better capture the dynamics of nonlinear system, the visibility graphs (VG), the horizontal visibility graphs (HVG), and the limited penetrable visibility graphs (LPVG) are applied to implement the mapping of sunspot relative numbers in the northern and southern hemispheres. The results show that these three methods can capture important information of nonlinear dynamics existing in the long-term hemispheric sunspot activity. In the presentation of the results, the network degree sequence of the HVG method changes preferentially to the original data series as well as the VG and the LPVG, while both the VG and the LPVG slightly lag behind the original time series, which provides some new ideas for the nonlinear dynamics of the hemispheric asymmetry in the two hemispheres. Meanwhile, the use of statistical feature-skewness values and complex network visibility graphs can yield some complementary information for mutual verification.
1. Introduction
The complexity of solar magnetic activity and its long-term variability have been studied for a long time, and it was known as early as the last century that solar activity is characterized by the hemispheric asymmetry [1,2]. By studying the spatial distribution of the number or area of sunspots, the hemispheric asymmetry of solar magnetic activity was confirmed by Newton and Milsom [3]. The longest record of solar activity variability is the number of sunspots, and the study of hemispheric asymmetry in the two hemispheres has gradually moved from sunspots to almost all solar activity phenomena, such as coronal mass ejections [4], flare activity [5,6,7], differential rotation [8,9], polar faculae [10,11], and so on.
It is interesting to note that the influence of solar activity on the Earth’s climate was found to be significant a long time ago. For example, Herschel [12] speculated that solar variability would cause changes in the Earth’s climate, and concluded that rainfall was less when there were fewer sunspots. Eddy [13] found that the Maunder Minimum (1645–1715), an anomalous decrease in sunspot numbers, corresponded in time to the trough of the Little Ice Age in Western Europe. Currie [14] found that many elements of climate (e.g., temperature, rainfall, sea level) exhibit cyclical variations similar to solar magnetic activity. Friis-Christensen et al. [15] also found a high correlation between northern hemisphere land surface temperature and the length of the solar activity cycle.
Haigh [16] and Svensmark [17] have pointed out that solar activity is an important factor driving the Earth’s climate change. Therefore, it is still of great importance to examine the influence of solar activity on the Earth’s climate on longer time scales. Furthermore, the asymmetry of solar activity can be introduced the cycle pattern of solar activity [18], which improves the human understanding of solar activity and the prediction accuracy of space climate, and plays a driving force for the research of a series of solar physics fields. For instance, by studying the full disk images at 30.4, 19.5, and 28.4 nm wavelengths during solar cycle 24, Sharma et al. [8] presented evidence of a very strong and statistically significant relationship between solar activity and hemispheric asymmetry in solar coronal rotation rate. They found that the phase of sunspot numbers lags behind the hemispheric asymmetry index by 1.56 years. Deng et al. [19] studied the mid-term periodicities of polar faculae in the northern and southern hemispheres for a time interval from 1951 August to 1998 December, and found that the periodicities on both hemispheres are not identical.
Traditional methods usually consider the amplitude [3] and phase difference [20] to study the north–south asymmetry of solar activity and predict the solar activity cycle by the empirical data analysis-driven approach. In recent years, solar activity asymmetry has been studied using the latitudinal and longitudinal distributions, showing that the north–south asymmetry largely depends on the asynchronous development of activity in the two hemispheres [21]. By using the cross-correlation analysis, the cross wavelet transform, and the cross-recurrence plot methods, the temporal evolution of group sunspot numbers is found to be different between the two hemispheres, providing a lot of reference value for studying sunspot activity [22]. Although these methods have advantages, considering the nonlinear dynamics of solar activity [23], the traditional linear methods have some limitations in predicting the solar cycle, which are not sufficient to fully capture the nonlinear dynamics of solar activity.
The complex network-based visibility graph is a technique for studying nonlinear systems. It is able to capture information that cannot be extracted by traditional linear methods. As a powerful tool for studying nonlinear dynamics [24], it is widely used to explore complicated data in many scientific fields. Complex network-based visibility methods, including the visibility graphs (VG; [25]), the horizontal visibility graphs (HVG; [26]), and the limited penetrable visibility graphs (LPVG; [27]), have been applied with better feedback on processing nonlinear time series. These methods showed that the improved visibility-based techniques have obtained better results in the solar physics field [28,29], which are more able to extract amplitude differences and phase differences of nonlinear systems. Notably, in the study of Zou et al. [30], the visibility graph methods applied on a single time series of solar activity indicator is extended to a double sequence of solar activities (i.e., separately for the northern and southern hemispheres), which provides us a new perspective to understand the hemispheric asymmetry of solar activity.
In this work, complex network techniques are applied to investigate the long-term hemispheric asymmetry of sunspot relative numbers obtained from the National Astronomical Observatory of Japan (NAOJ). The framework of this work is organized as follows. In Section 2, the data used and its methods are described in detail. Section 3 presents a comparative analysis of the obtained results. Finally, the conclusions and discussions of the current work are shown in Section 4.
2. Data and Methods
2.1. Sunspot Data
The sunspot relative numbers are the most commonly used parameter to describe solar activity. The sunspot time series used in this work are derived from the Mitaka observatory of NAOJ which was formerly the Tokyo Astronomical Observatory (before 1989), University of Tokyo [31]. The Mitaka Observatory recorded daily sunspot relative numbers over the whole solar disk since 1928, while the daily sunspot relative numbers of the northern and southern hemispheres were recorded separately since March 1939 [32].
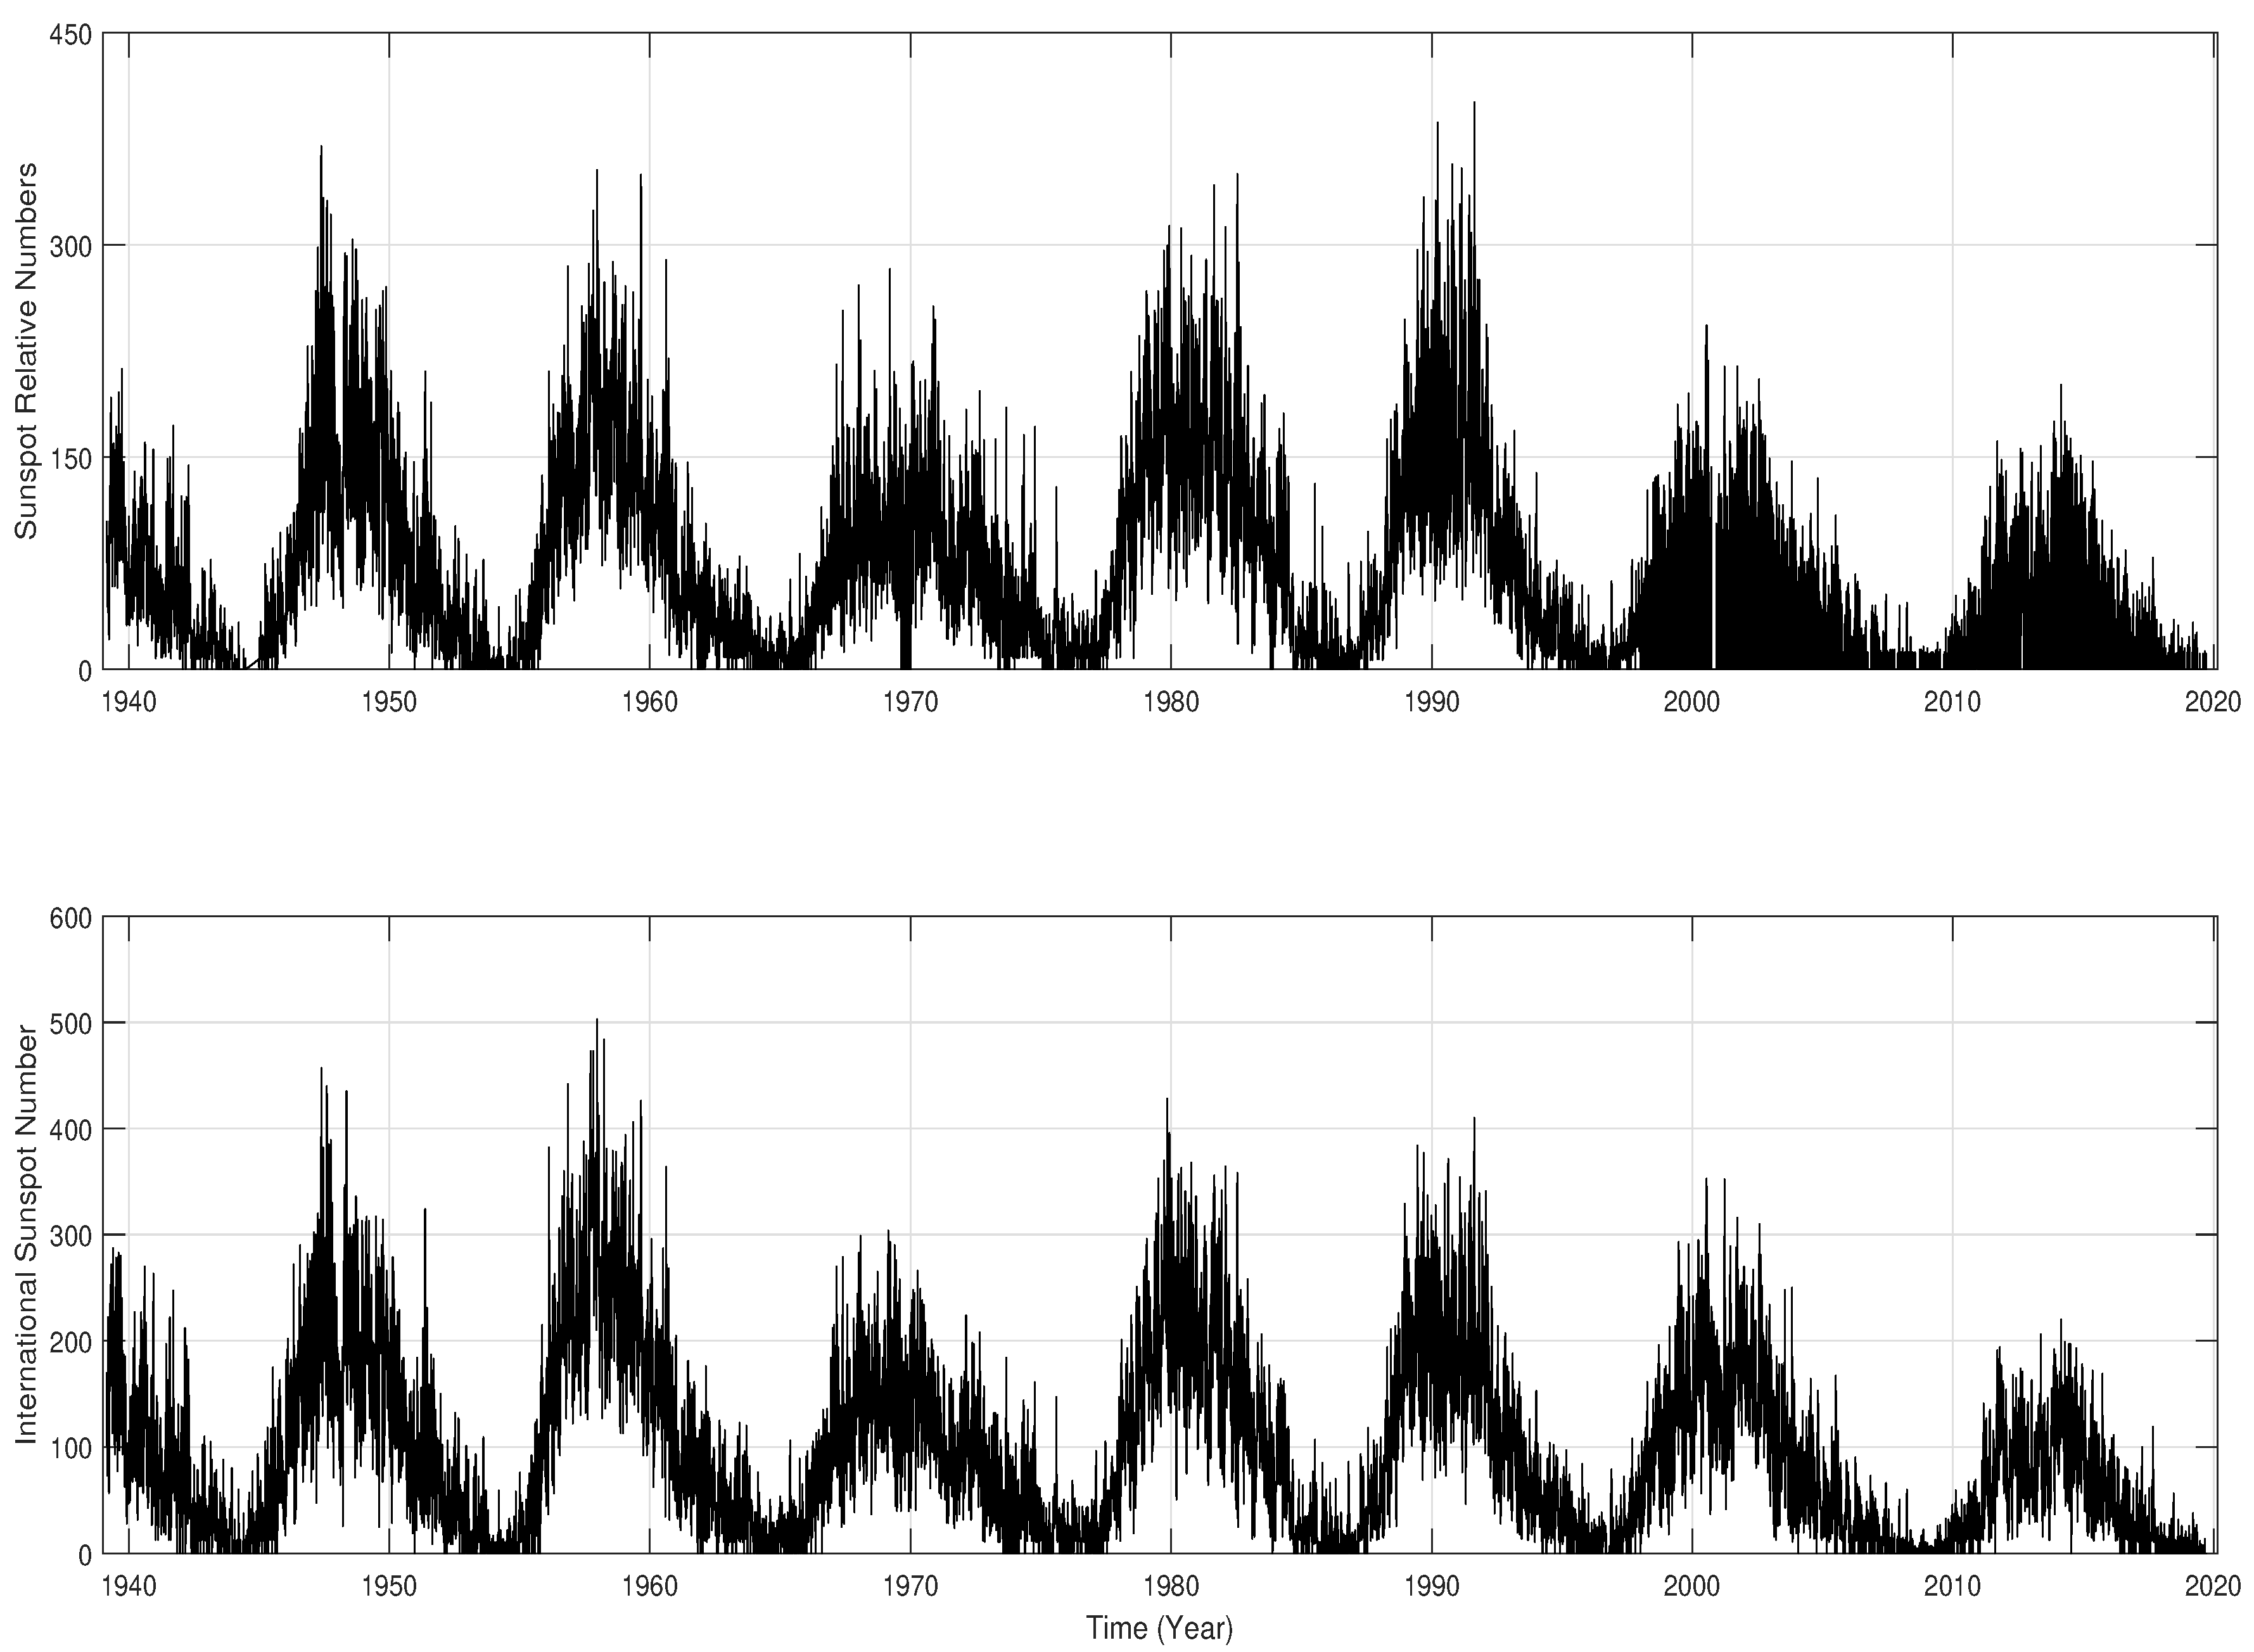
Figure 1 shows the daily time series of sunspot relative numbers from the NAOJ/ Mitaka observatory (upper panel) along with the International Sunspot Number (ISSN; lower panel) from 1 March 1939 to 30 September 2019. The daily time series of ISSN version 2.0 [33] come from the World Data Center-Sunspot Index and Long-term Solar Observations (WDC-SILSO). To check for the relatedness of different origins for the daily sunspot numbers, we performed a correlation analysis [34] between them for the same time interval. A correlation coefficient of 0.8862 (99.9% confidence) is obtained, which justifies the use of sunspot relative numbers obtained from the NAOJ/Mitaka observatory for our analysis.
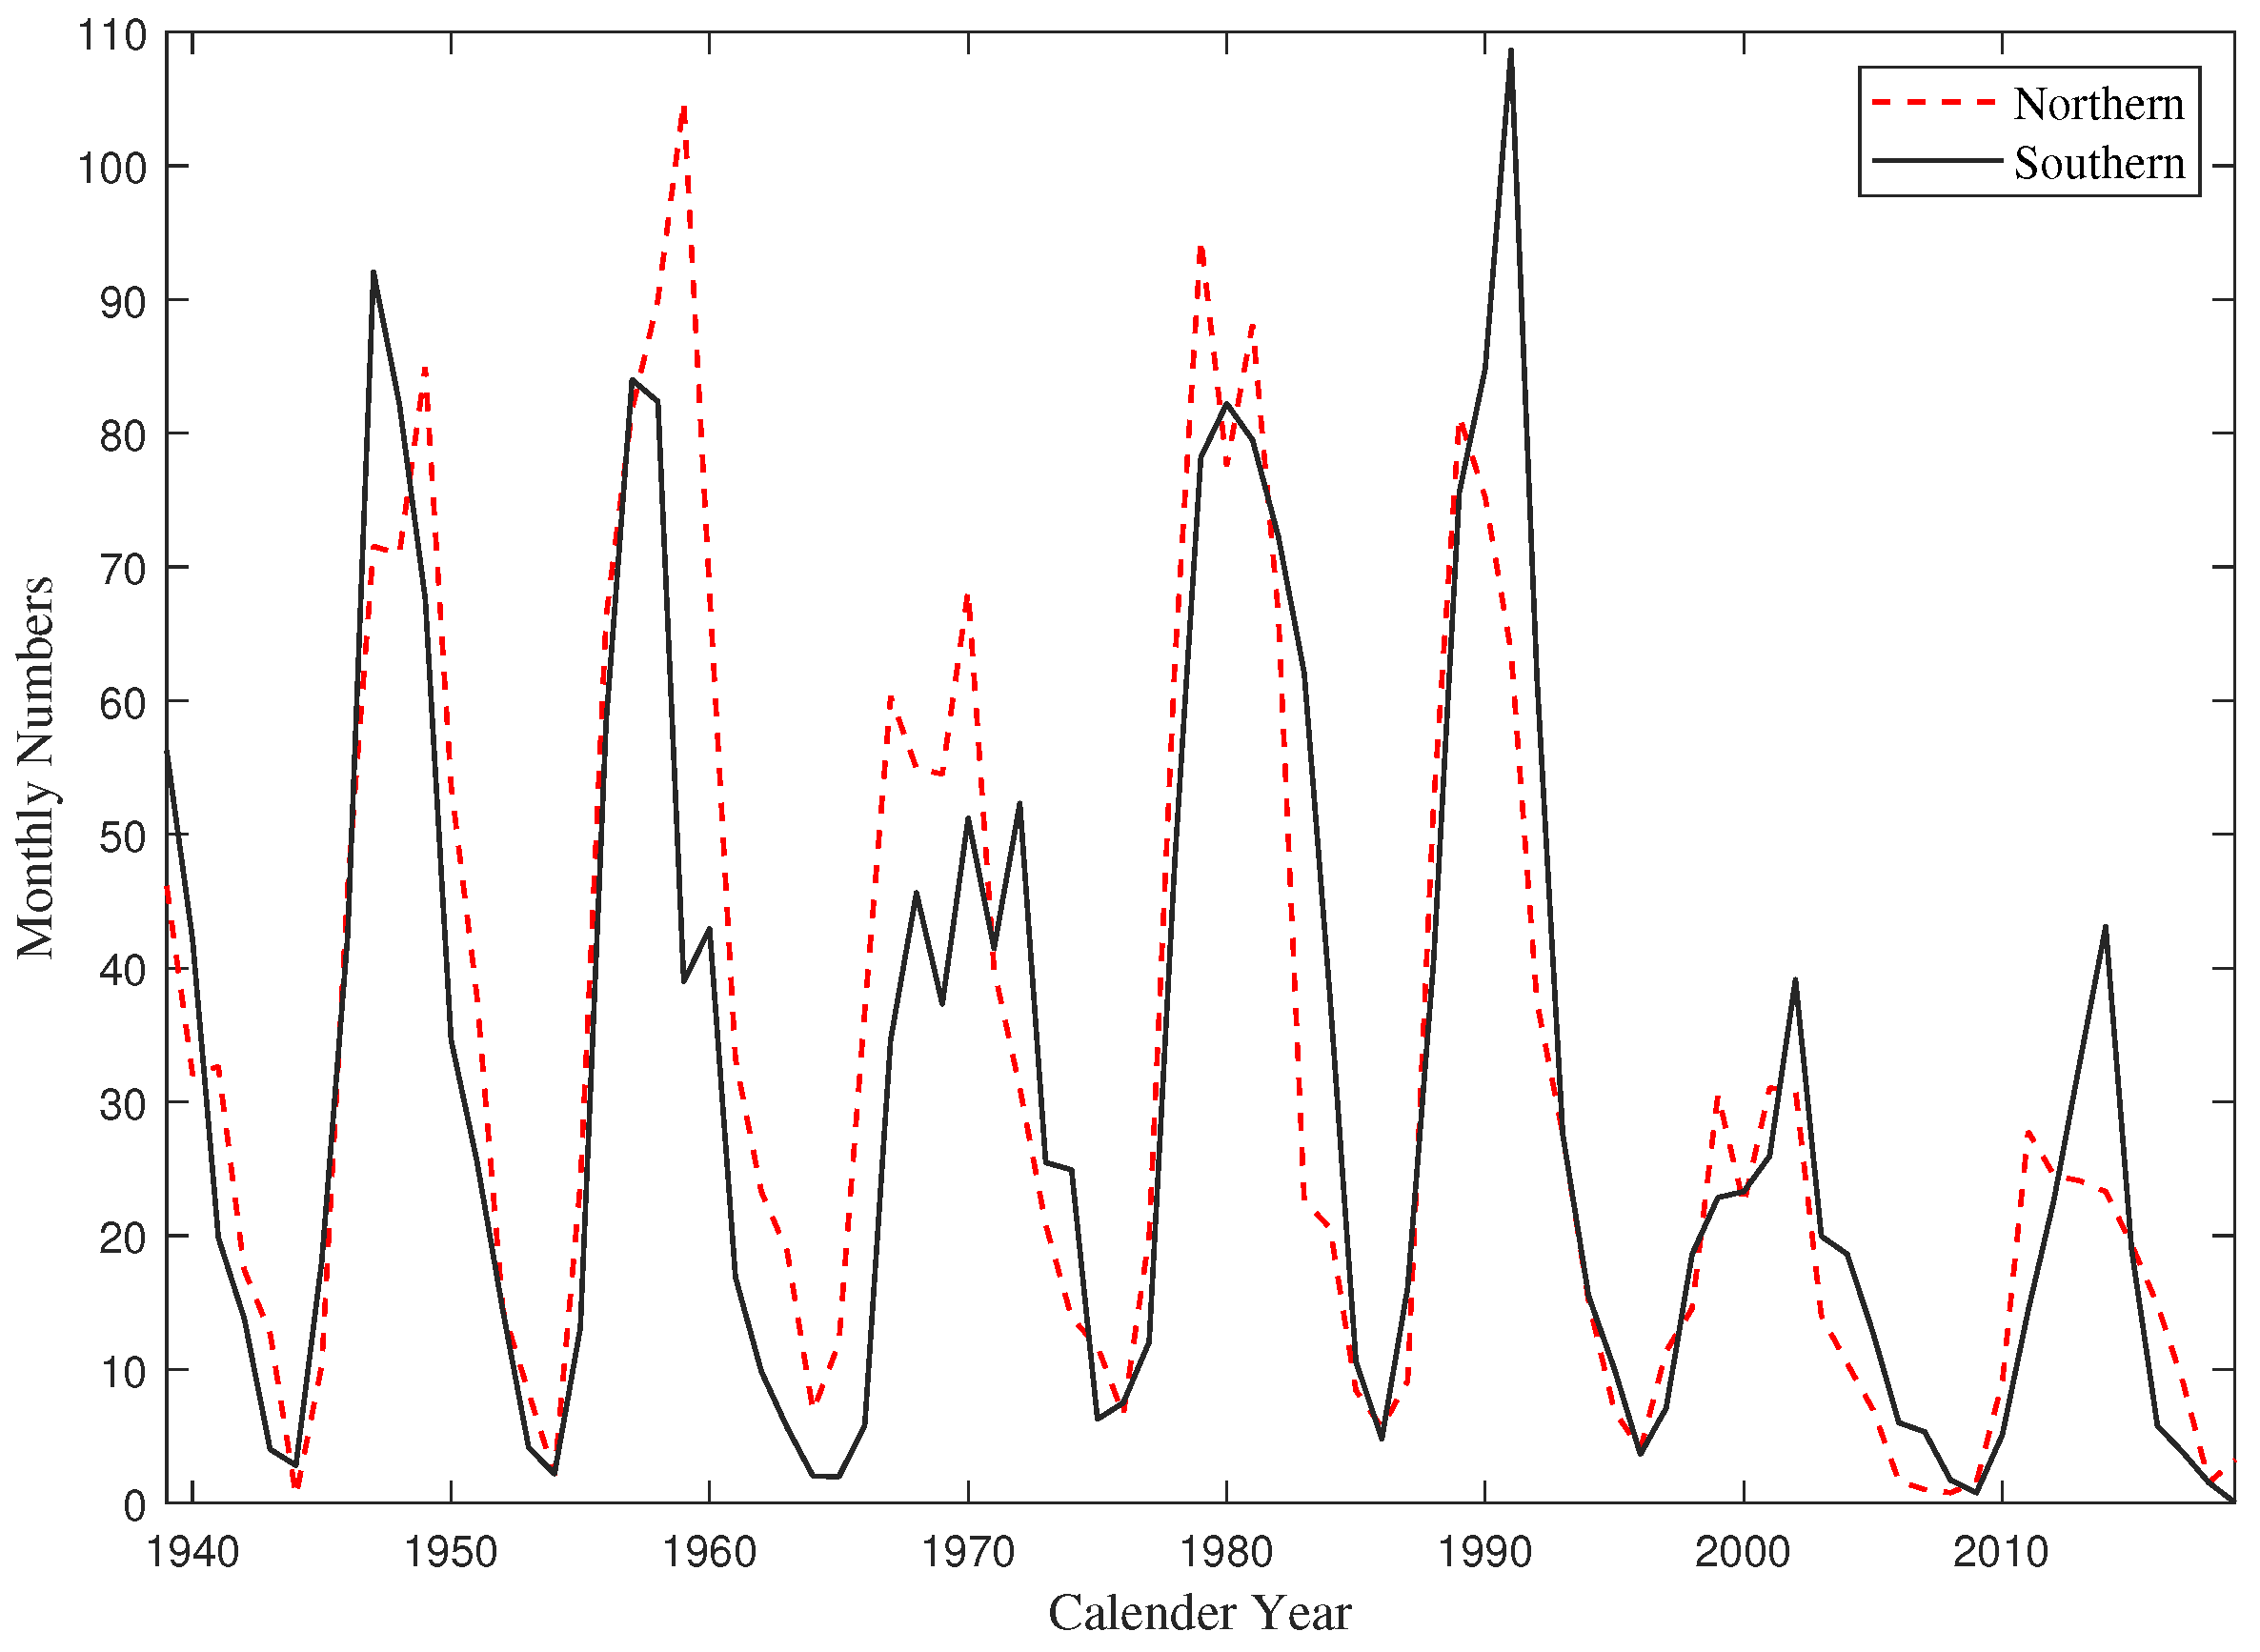
In our work, we choose the monthly sunspot relative numbers (averaged daily numbers in each month) in the northern and southern hemispheres to analyze the north–south asymmetry of sunspot activity. Figure 2 shows the time series of monthly sunspot relative numbers on both hemispheres. There are 967 natural months from 1939 March to 2019 September, covering solar cycles 17 to 24.
The traditional method for measuring the north–south asymmetry of sunspot activity is to calculate the absolute or normalized difference between the two hemispheres. The absolute difference of sunspot relative numbers can be described as:
and the normalized difference of sunspot relative numbers is [3,35]:
where are the sunspot relative numbers in the northern and southern hemispheres, respectively.
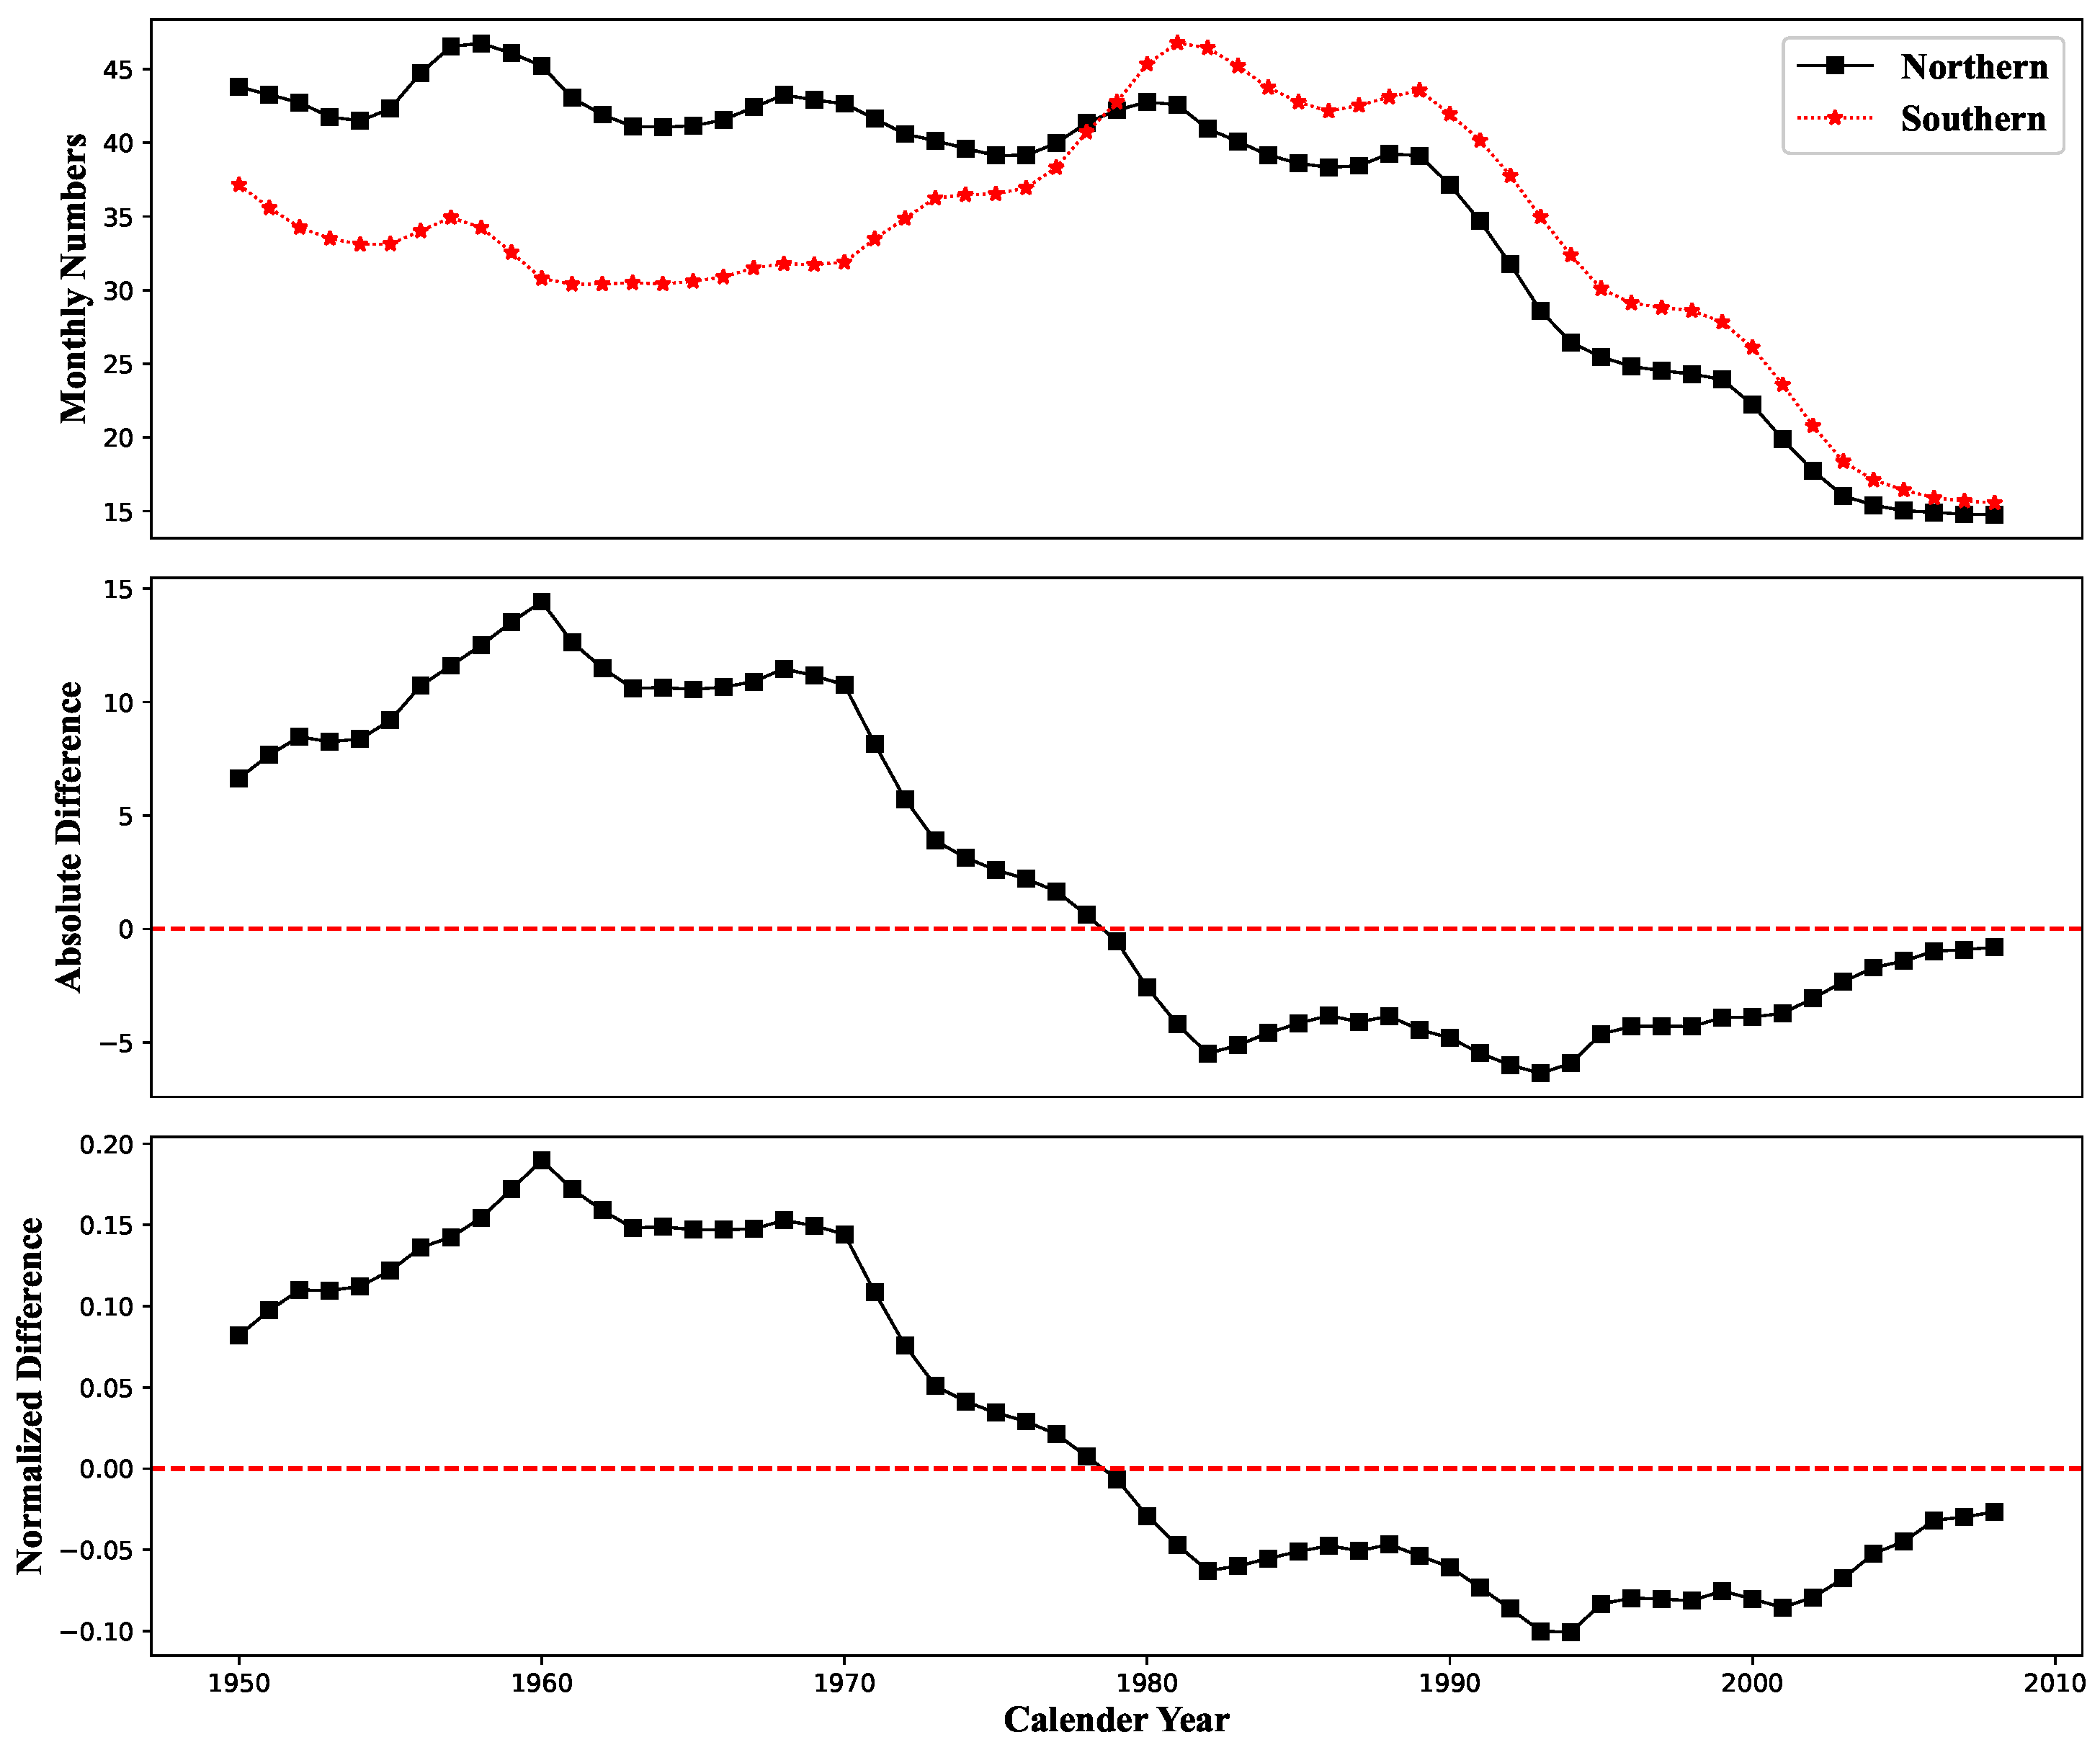
The long-term variations of sunspot relative numbers in the two hemispheres are shown in the top panel of Figure 3. Here, the width of the running window is months. The absolute and normalized differences of hemispheric sunspot activity are shown in the middle and bottom panels of Figure 3, respectively. In Section 3.2, we will explain why the running window is chosen as 270 months.
2.2. Visibility Graphs
The idea of the VG is that in the network, each node of the complex network corresponds to each observation in the time series. If the visibility criterion of the VG is satisfied, then two nodes have edges connected to each other. This is the edge of the network, and the visibility criterion can be described below.
Consider a time variable of length T, each time node corresponds to a time series observation, and if any two data points and in the time series are visible to each other, they correspond to any point , with , satisfying the following equation.
The VG algorithm has been applied in several fields and achieved good results, which proves that the VG can be used as an alternative framework to study the statistical characteristics of sunspot time series.
2.3. Horizontal Visibility Graphs
With the deepening of time series visualization research, Luque et al. [26] proposed a new simpler and more calculation-efficient algorithm, i.e., the HVG. It is based on the following principle: the same two data points and in a time variable of length T are visible for any , if they satisfy the following equation:
For all with .
The HVG criterion is more restrictive than the VG, so the degree of nodes inside its network is generally smaller than that of the VG, but it provides a simpler algorithm and a faster process implementation than the VG.
2.4. Limited Penetrable Visibility Graphs
In the framework of the idea of visibility graph network building, Ning-De et al. [27] proposed the LPVG, which is an innovative method is reducing noise interference in the time-series data. The nodes that should be connected in the network nodes are isolated by noise interference, which has an impact on visibility graph network building. Moreover, the dynamics features are masked by the noise. i.e., following the rules of the visibility graph algorithm on the improvement. Let the limited penetrable sight distance be N, when the connection of any two points is cut by an intermediate node with a return of . These two points satisfy the visibility criterion, and any two data points and of the time series variable of the same length T that are l apart are visible to each other, then there exist p data points between these two data points, where the following equation is satisfied.
The rest of the data points , , satisfy:
It is shown that the LPVG has a larger average degree value and not only retains the original visibility principle but also improves it and has an advantage over the VG and the HVG in terms of noise immunity and visibility.
3. Results
3.1. Statistical Characteristics of the Data
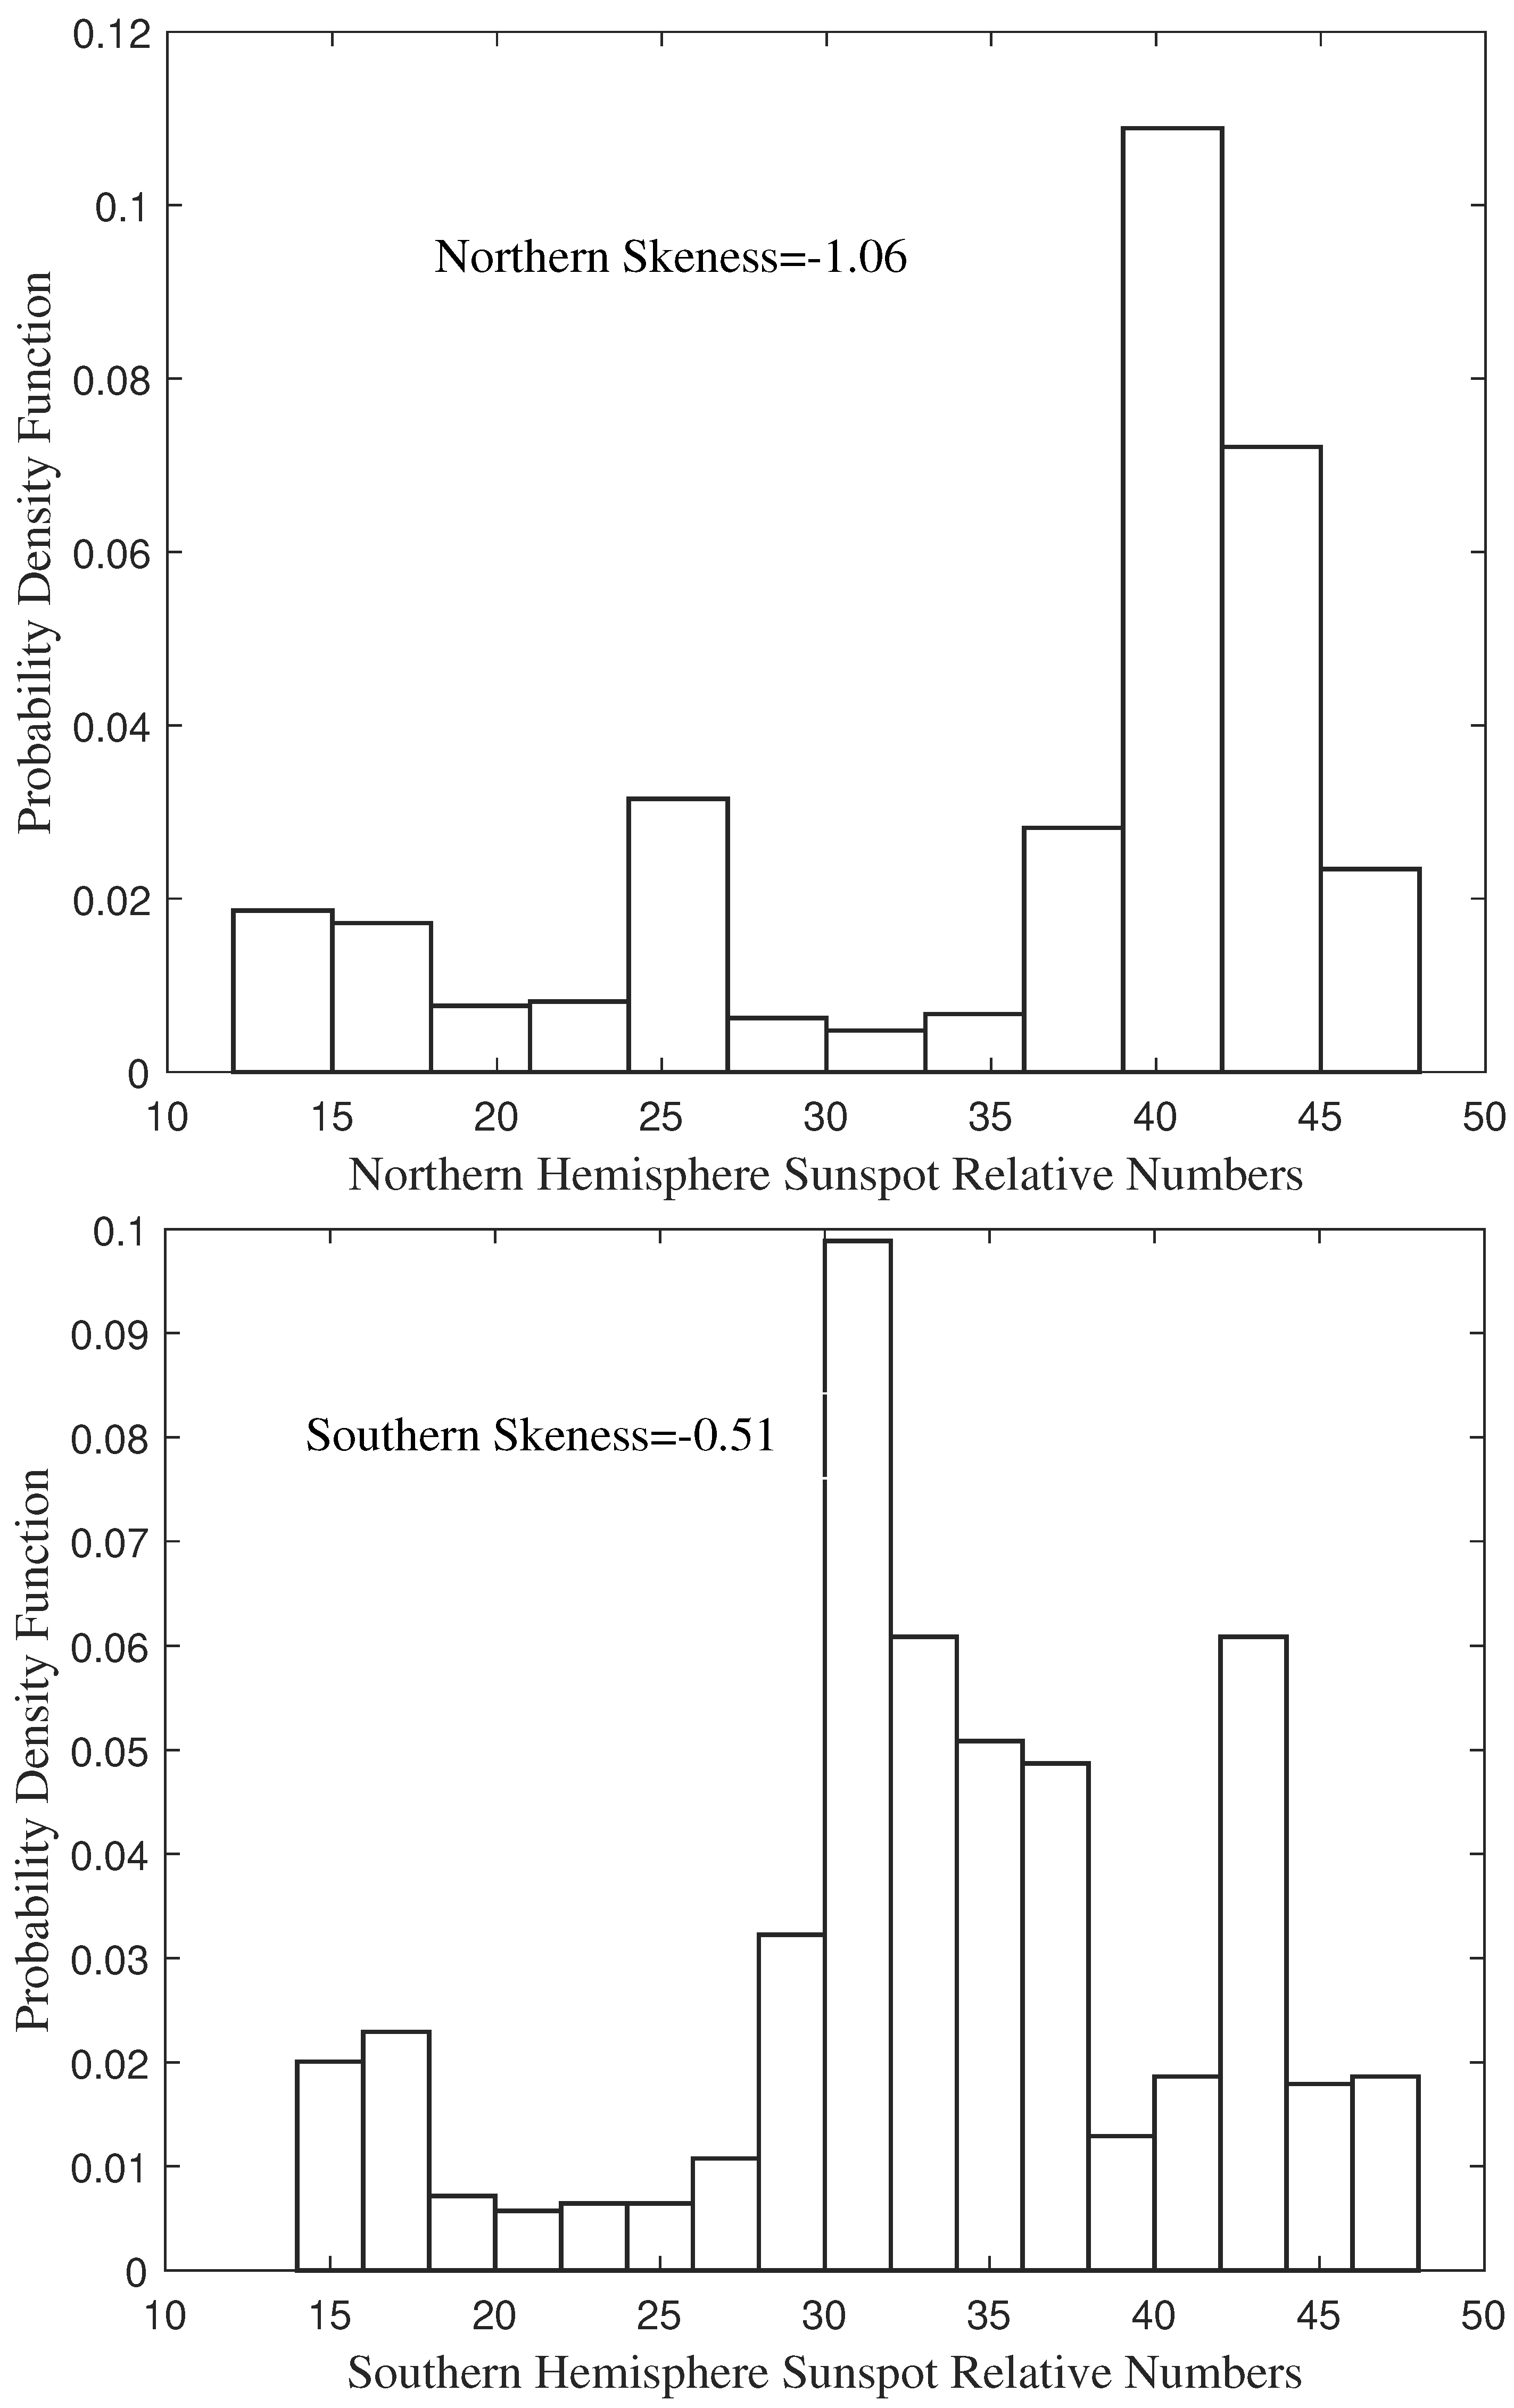
Considering the complexity of the solar magnetic activity, the probability distribution functions (PDFs) of the hemispheric sunspot relative numbers are first discussed. The results are shown in Figure 4 and Figure 5. It is easily found that sunspot data can be characterized by a non-normal distribution with a significant left-skewed (negative-skewed feature). The skewness values are calculated to be and for the northern and southern hemispheres, respectively.
With the above basic characteristics of sunspot data, the following work sets the stage to seek whether some commonalities can be obtained between the statistical features and the conclusions obtained from the complex network-based visibility graphs approach.
3.2. VG Analysis of North–South Asymmetry
Evidence has been studied that hemispheric asymmetries in rotation profiles appear to have temporal variation within small scales [9]. In order to better investigate the long-term variation of the north–south asymmetry of solar magnetic activity, we do not focus overly on the solar activity information of small timescales in this work. To eliminate the short-term timescale effect of the solar data, we first perform a smoothing window (the width is 270 months).
Small smooth windows do not identify the shifts in the hemispheric behavior of the two hemispheres well. Conversely, high-frequency variations of the Sun as well as low-frequency variations are both smoothed for a much larger smoothing window [30] on the sunspot time series. Then, we use the VG method to implement a mapping of the data from time-series data to a complex network, converting it into a degree series, where the degree of a node in the network is defined as the number of edges connected to this node, the degree refers to the complexity of the local solar magnetic activity of the original series, i.e., the intensity of the fluctuations, rather than the strength of solar activity.
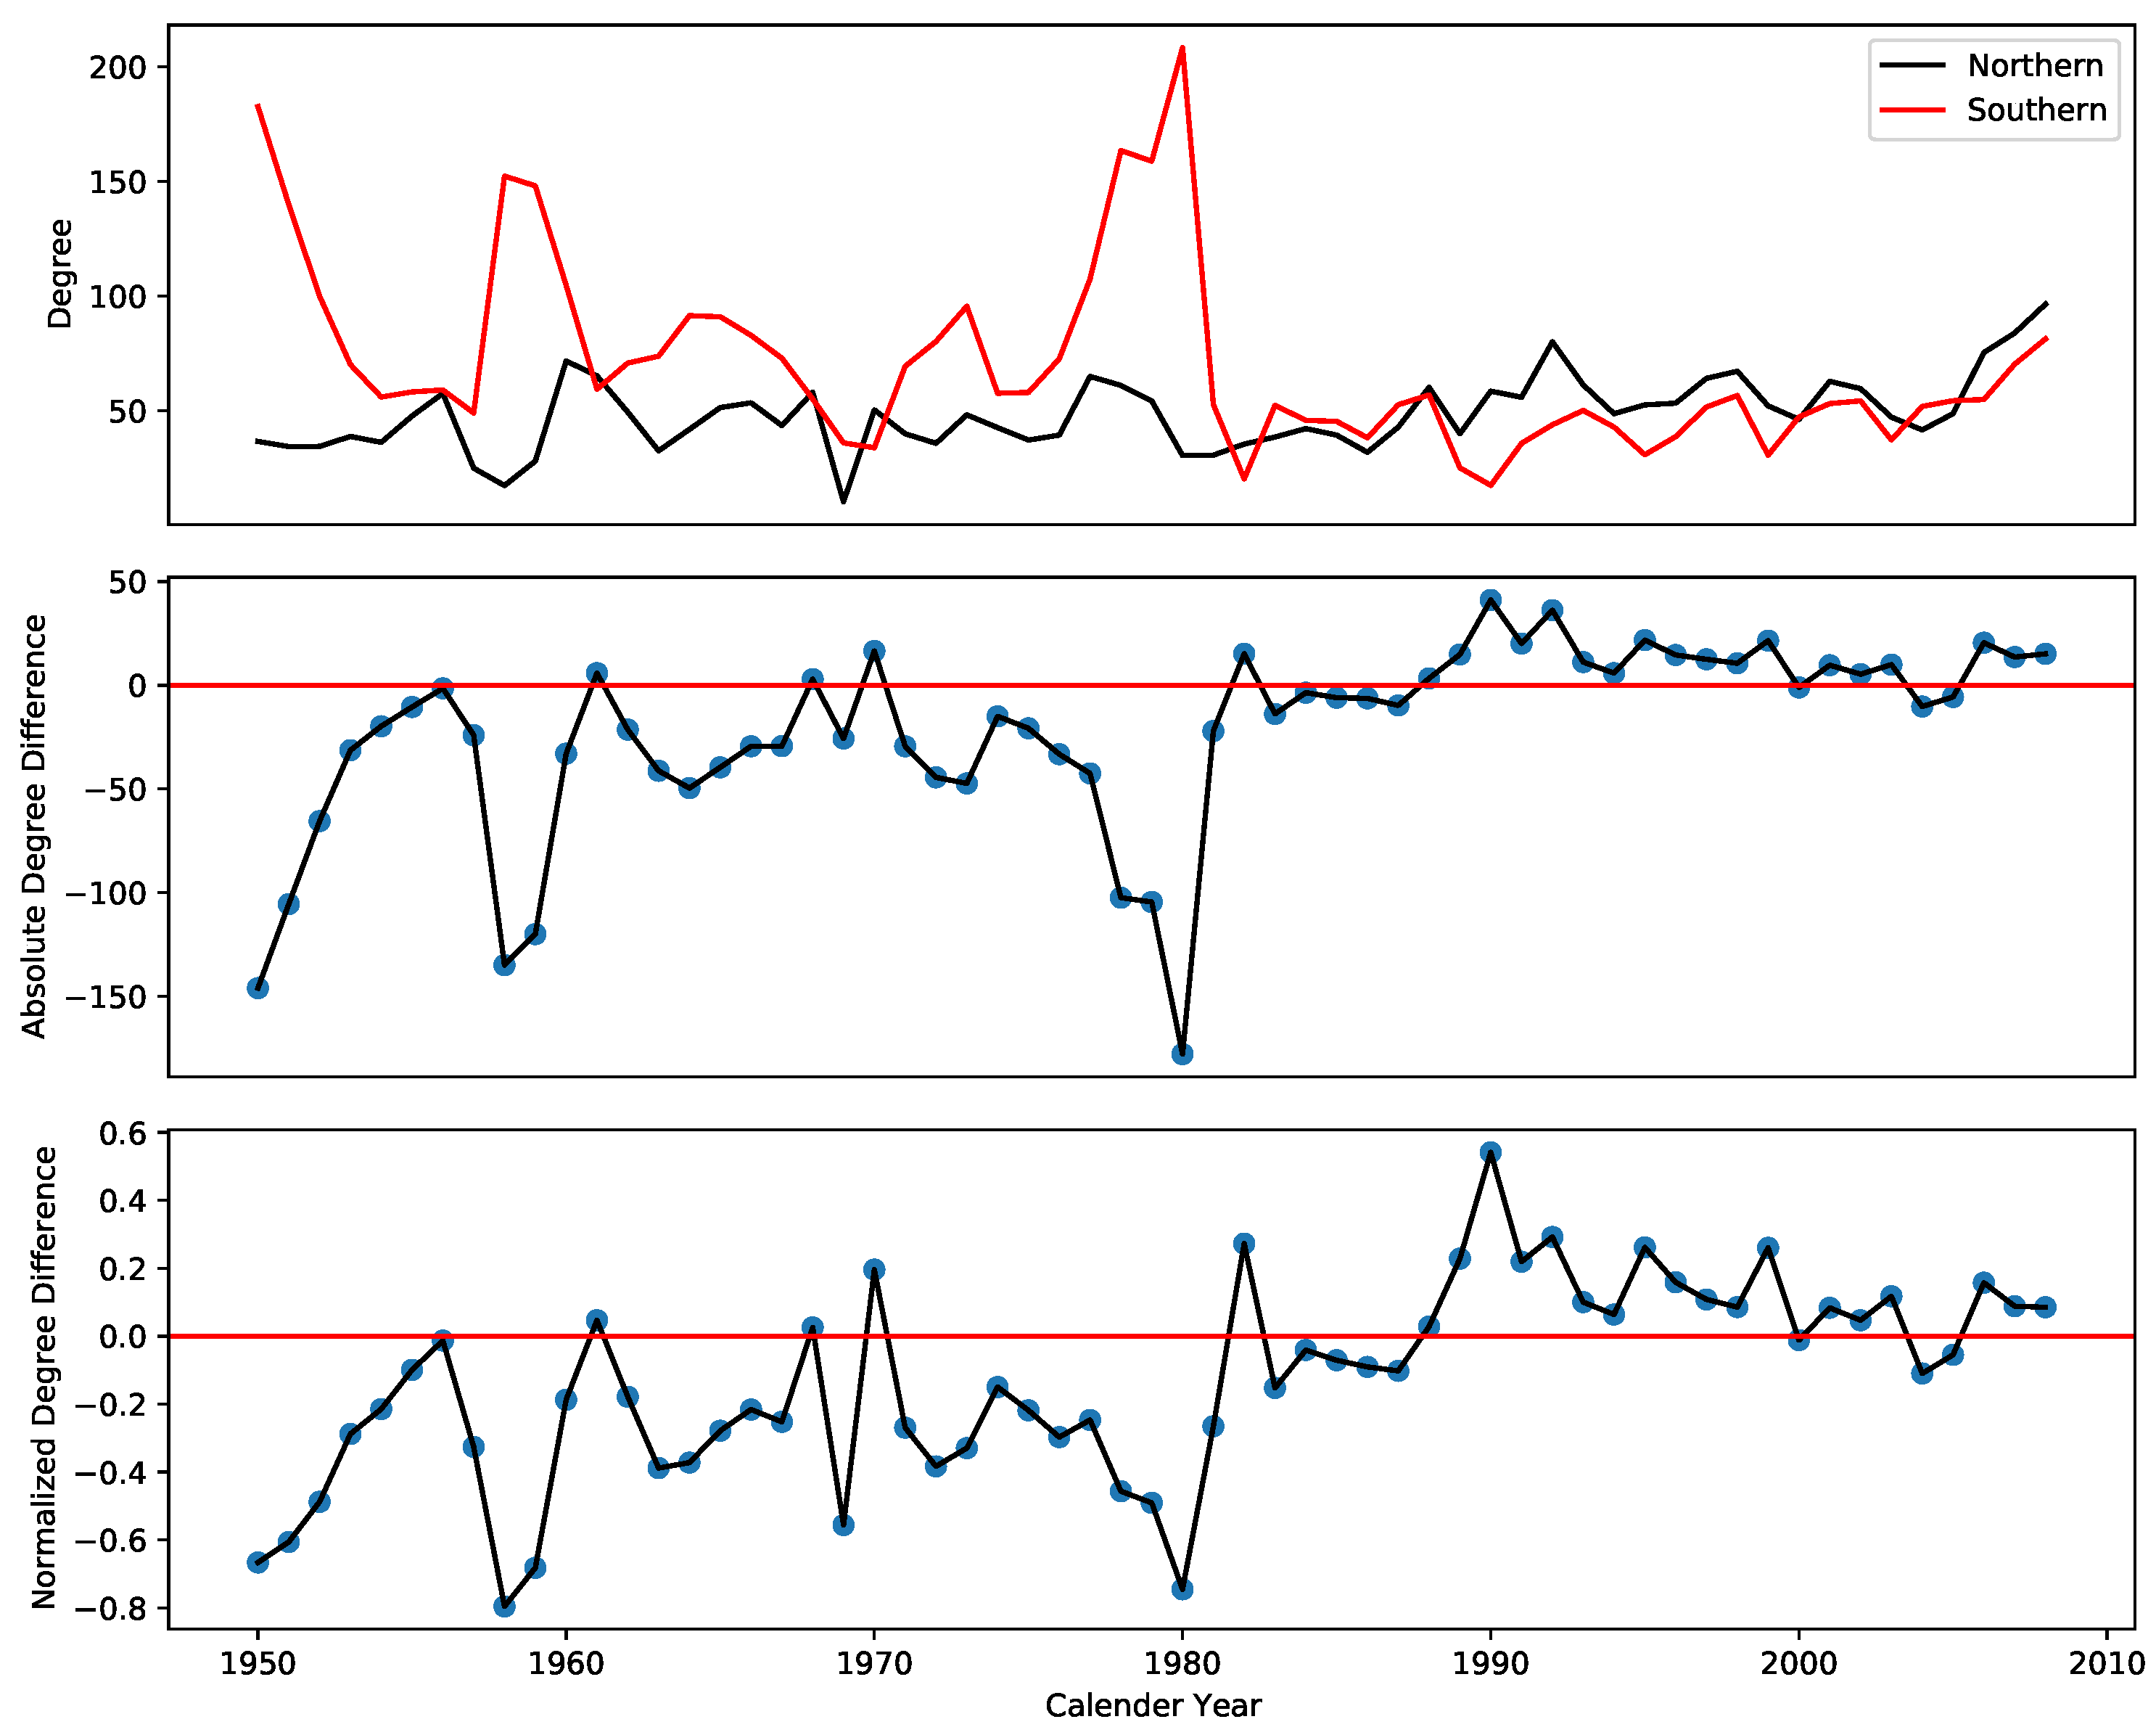
The results of the VG analysis are shown in Figure 6. From this figure, we can find that a phase transition occurred between the northern and southern hemispheres, and this time period was concentrated between 1980 and 1990. From 1970 to 1980, the transition from a higher degree in the southern hemisphere to a higher degree in the northern hemisphere. It shows the opposite trend with the time series diagram presented in Figure 2. Before 1980, the relative sunspot number in the northern hemisphere was higher than that in the southern hemisphere most of the time, which probably means that the northern hemisphere is more active than the southern hemisphere. From the VG results, the complexity of sunspot activity in the southern hemisphere is higher than that in the northern hemisphere, and it can also be simply observed from the time series diagram that the number of sequence fluctuations in the southern hemisphere before 1980 is more than that in the northern hemisphere, which corroborates with our results.
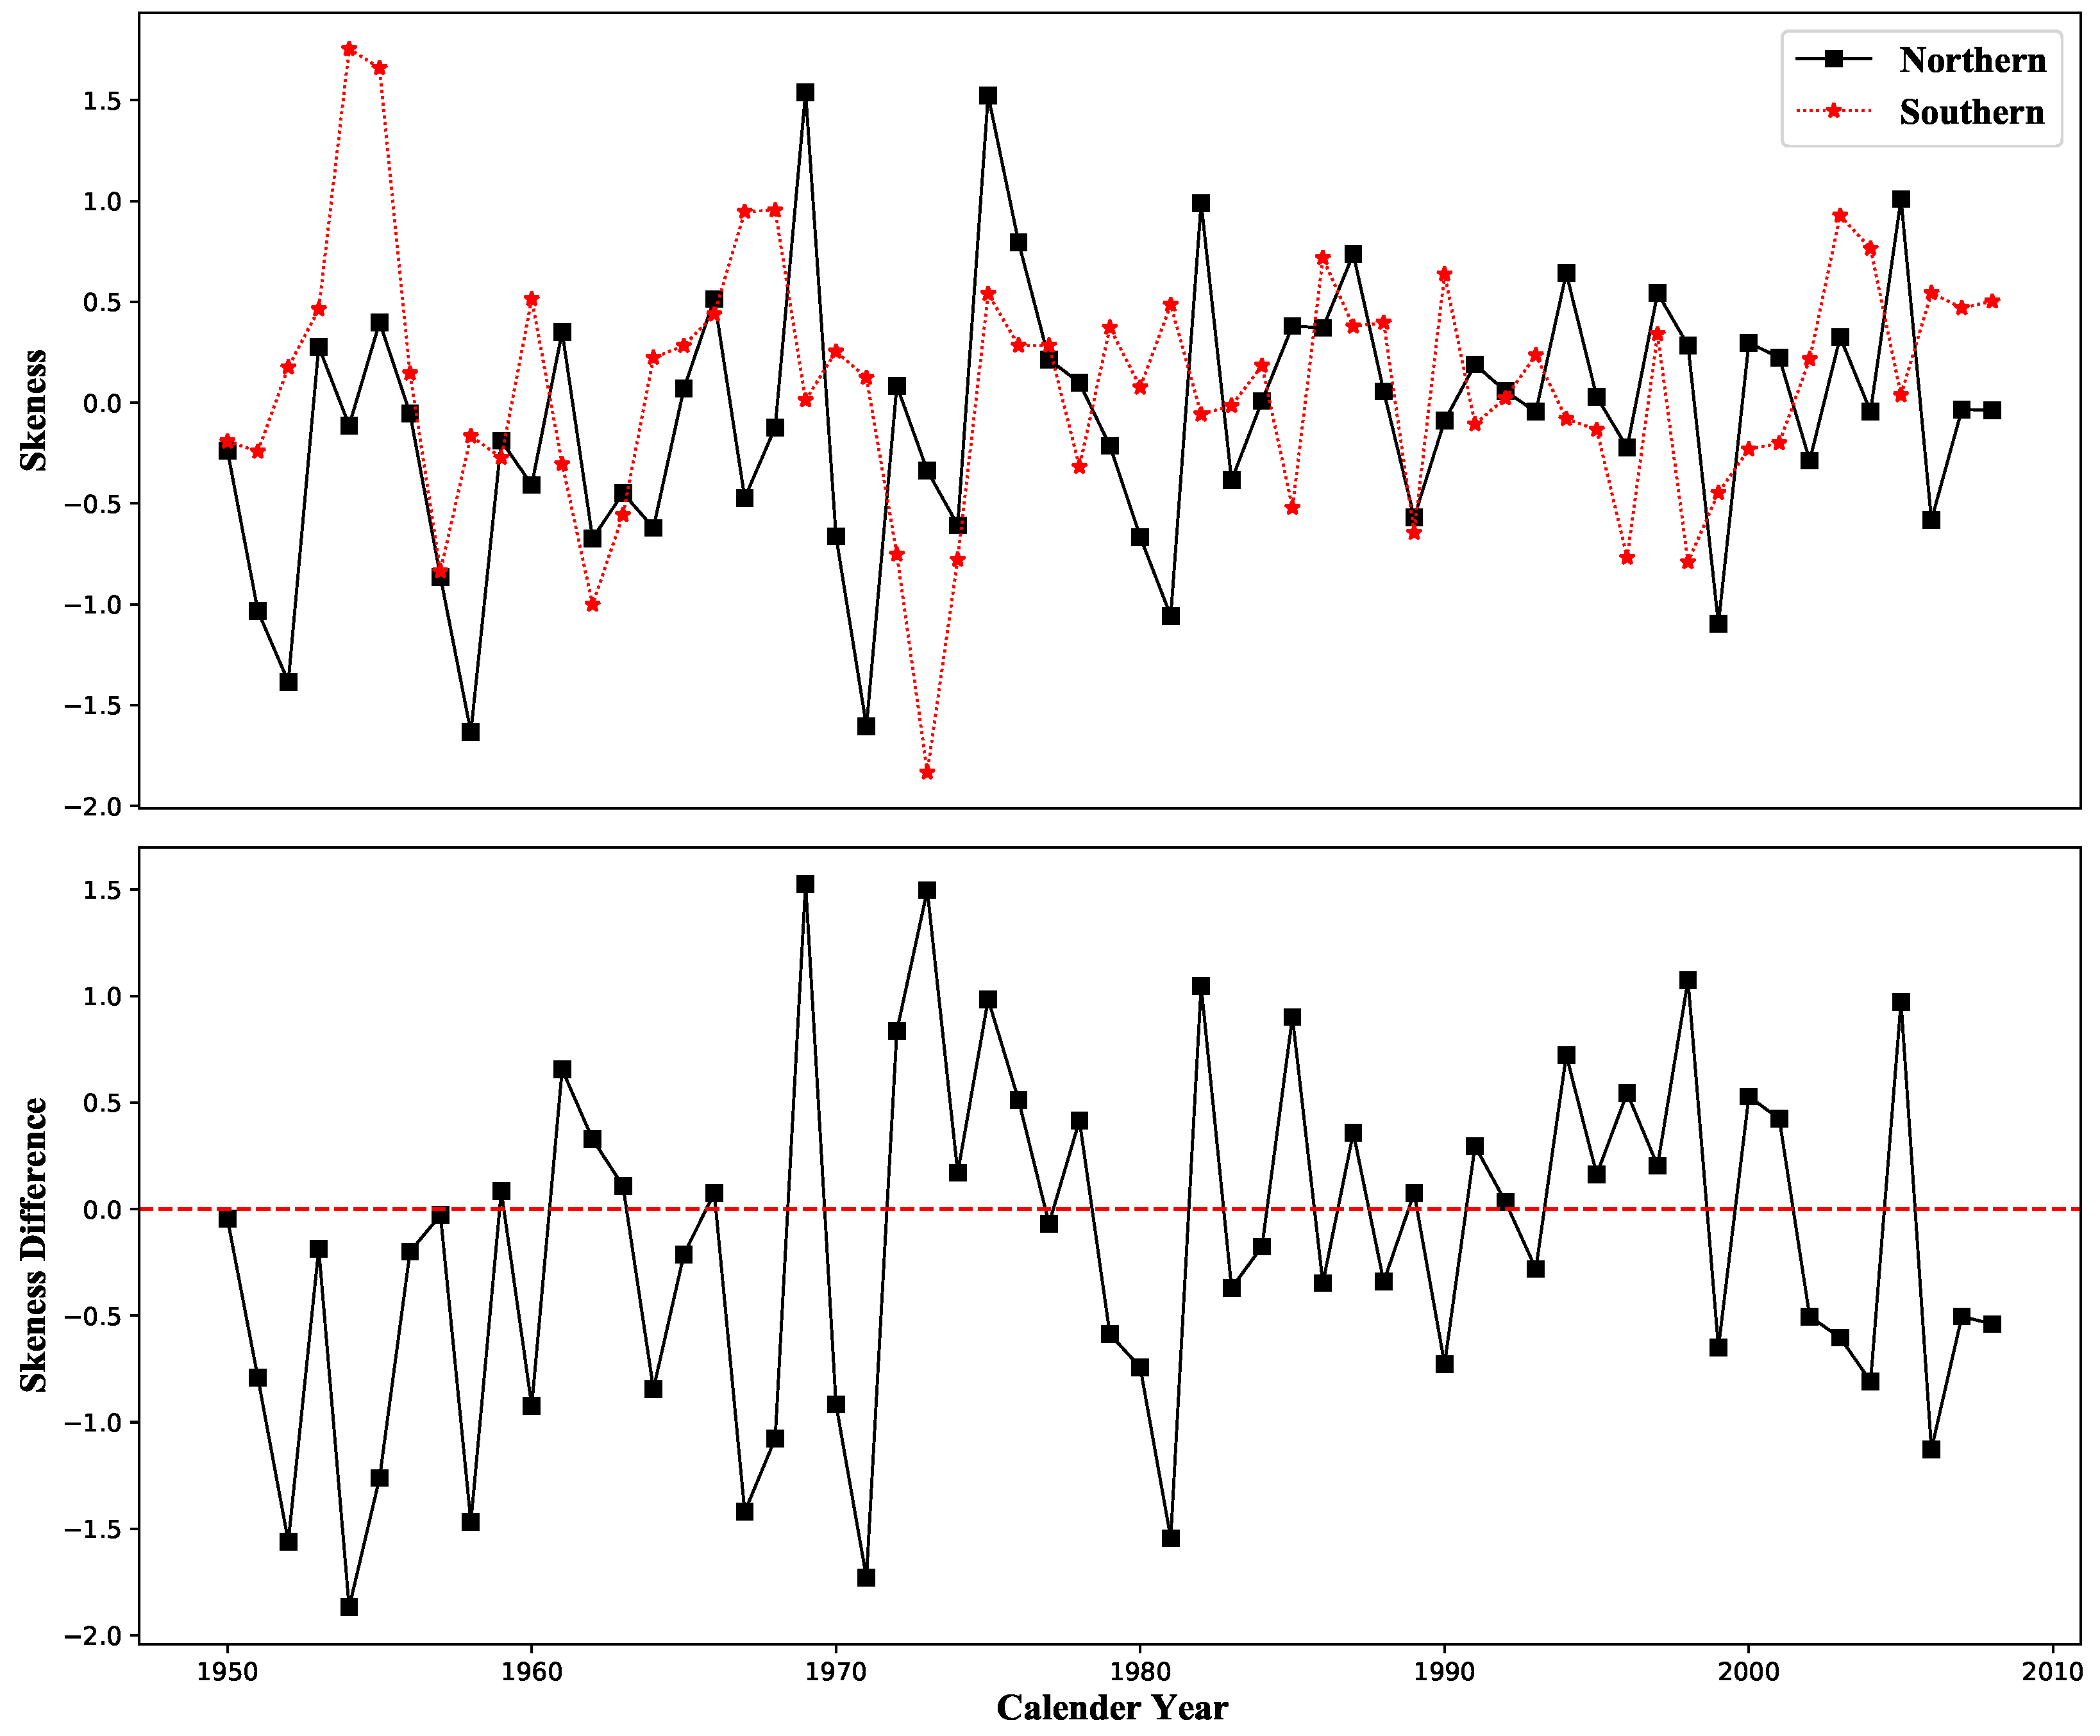
Looking at the statistical characteristics obtained from Section 3.1, we find that the skewness values fluctuate relatively smoothly until 1970, with a large fluctuation between 1970 and 1980, and then remain in a relatively smooth state, suggesting that the fluctuation of the skewness values in the similar interval between 1970 and 1980 also indicates the active transition between the northern and southern hemispheres.
3.3. HVG Analysis of North–South Asymmetry
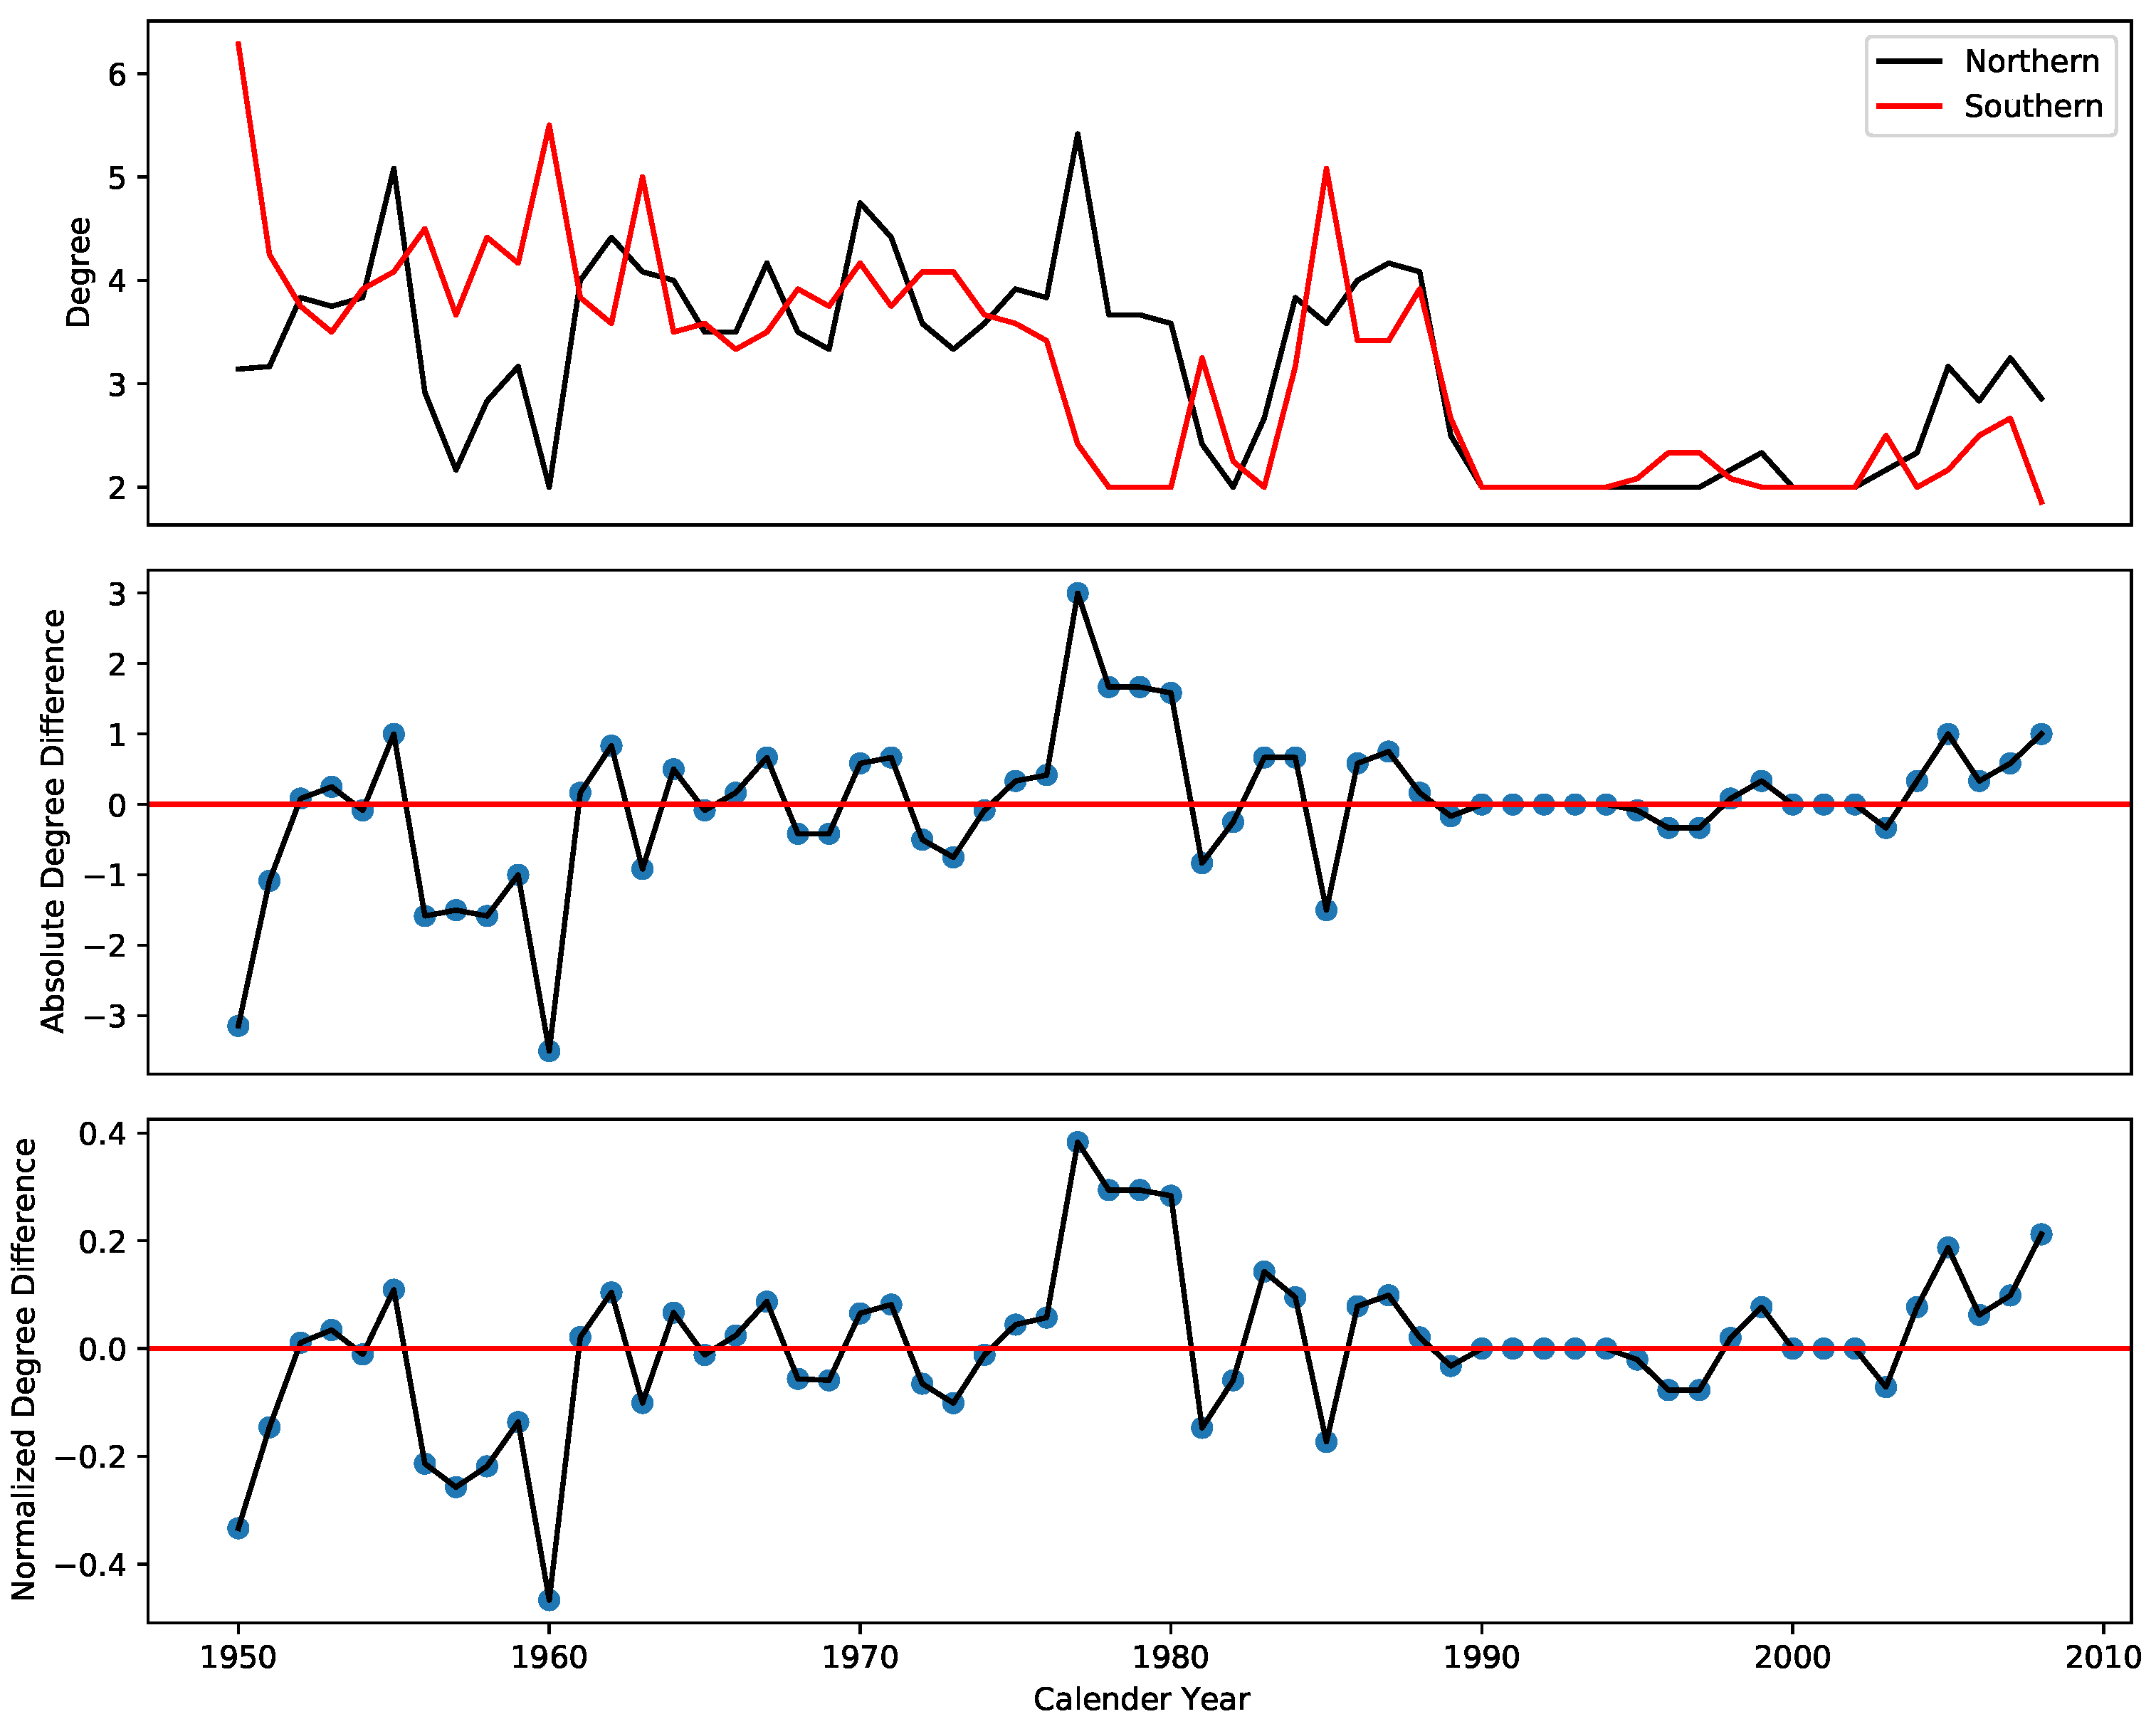
To further obtain more information, we construct the complex networks using the HVG, and the results are shown in Figure 7. Compared with the VG, the results obtained by the HVG are much more interesting. Firstly, the values of the degree sequences constructed by the HVG are much lower than those constructed by the VG, which is consistent with the expected results. Secondly, it is worth noting that the hemispheric transition of the results obtained by the HVG is earlier than the VG. The possible reason is that the HVG provides limited information about the studied sunspot data. The solar activity has complex variations, but the HVG can grasp the overall changes with minimum information.
3.4. LPVG Analysis of North–South Asymmetry
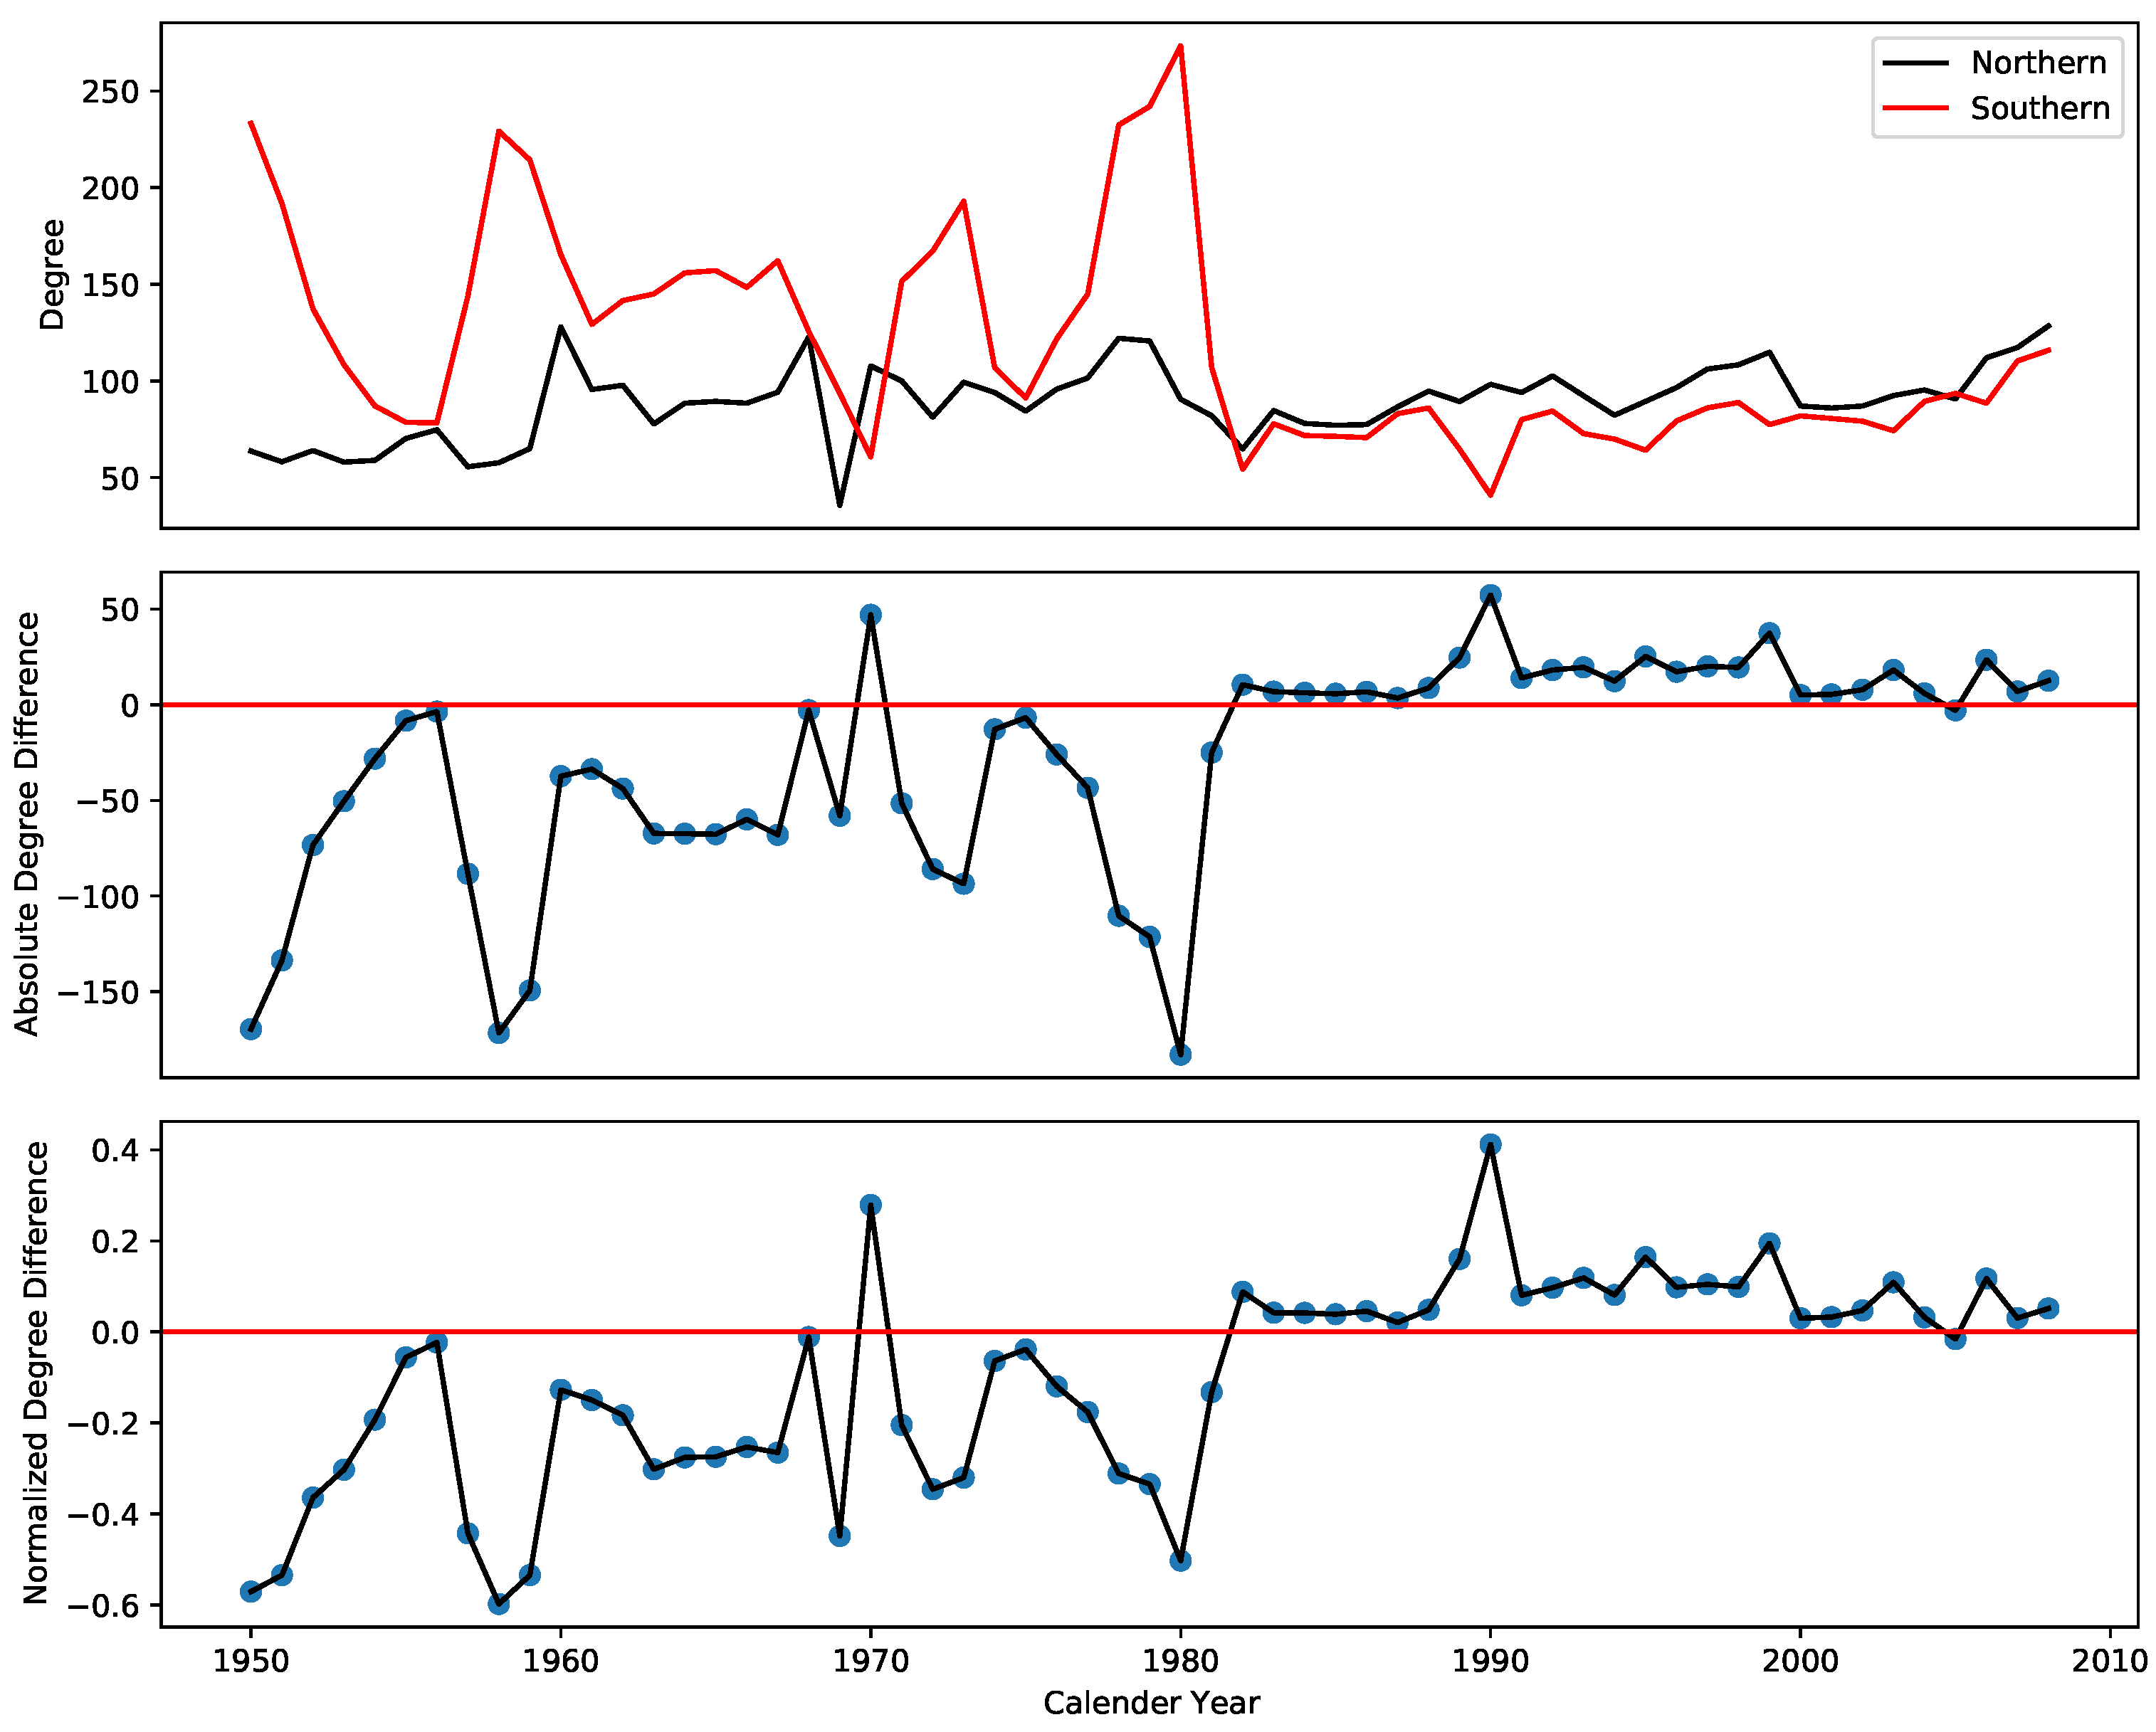
The LPVG has a better anti-noise effect compared with the above two algorithms, and can provide more complete information about the inherited series. The analysis results are shown in Figure 8.
Compared with the results of the VG, the average value of the degree sequence obtained by the LPVG is higher, but the trend remains roughly the same. The transition period is consistent with the VG algorithm, and it is worth noting that the LPVG plays a certain effect of homogenizing the fluctuations of the transition period between the northern and southern hemispheres.
4. Discussion and Conclusions
In the present work, three nonlinear analysis methods, i.e., the VG, the HVG, and the LPVG, are used to investigate the north–south asymmetry of sunspot relative numbers. Compared with the original time series studied in this work, the network structure constructed by the nonlinear techniques provides some additional information.
In the original time series plot (the top panel of Figure 3), during the period from 1950 to 1980, the activity in the southern hemisphere is much weaker than in the northern hemisphere. For the absolute and normalized differences, the values in this time interval are all positive (the middle and bottom panels of Figure 3). Based on the VG algorithm, the hemispheric sunspot numbers show a shift from a southward dominant (from 1950 to 1980) to a northward dominant pattern (about 1980 onwards). The direct results of the original time series are likely to be based on classical information of north–south asymmetry such as the amplitude, while the properties of the VG algorithm reflect the underlying nonlinear dynamics of solar time series, characterized by the complexity of nonlinear behaviors. That is to say, the analysis results show that a shift in the solar hemisphere (i.e., a shift in the magnitude of hemispheric activity) occurred during the time period around 1980 (Figure 6, Figure 7 and Figure 8), in the opposite direction to the shift in the original time series shown in Figure 3. It is interesting to note that, by studying the Greenwich sunspot area data, Zolotova et al. [36] concluded that the phase difference between the northern and southern hemispheres is anti-correlated with the latitude of the magnetic equator, a result somewhat similar to that of our present work. Maybe there is some degree of association between the degree sequence of the complex network and the magnetic equator. Further work is needed to explore their relationship in the future.
Three nonlinear methods are also used to compare the transition period, i.e., the transition between the northern and southern hemispheres. The results obtained by the VG and the LPVG are similar, and only have a smoothing difference in fluctuations. However, the HVG, due to its limited information of the extracted degrees, shows an earlier transition compared to the VG and the LPVG. At the same time, there are large fluctuations in the skewness values in the two hemispheres during this period. Here, the skewness values represent the statistical characteristics that can be used to analyze the temporal changes of sunspot relative numbers in the two hemispheres.
The complex network methods also have some limitations. For instance, the noise effects may cause disconnection of nodes that should be connected in the VG and the HVG, and connect nodes that should not be connected in the LPVG. Therefore, it is still a big challenge to find a visibility method that minimizes the noise, and there is still much work to be done to provide more information on the dynamics of solar activity asymmetry for both hemispheric time series data and to explore sunspot data in more detail from statistical aspects.
Author Contributions
Conceptualization: Y.F.; Data curation: H.X. and J.L.; Formal analysis: Y.F. and C.L.; Funding acquisition: Y.F.; Methodology: Y.F.; Software: H.X., Z.W. and X.T.; Writing—original draft: H.X.; Writing—review and editing: H.X. and Y.F. All authors have read and agreed to the published version of the manuscript.
Funding
This research was funded by Yu Fei’s research is supported by the National Natural Science Foundation of China (NSFC) grant (No.11971421) and Yunling Scholar Research Fund of Yunnan Province (YNWR-YLXZ-2018-020), Jiajuan Liang’s research is partially supported by UIC Start-up Research Fund R72021106.
Institutional Review Board Statement
Not applicable.
Informed Consent Statement
Not applicable.
Data Availability Statement
The data of sunspot relative numbers are based on sunspot sketches obtained at Tokyo Astronomical Observatory (University of Tokyo) and National Astronomical Observatory by using a Zeiss 20 cm refractor. The international sunspot numbers are from the WDC-SILSO, Royal Observatory of Belgium, Brussels.
Acknowledgments
We would like to thank two anonymous referees for valuable comments and suggestions that helped to improve this manuscript significantly. The first two authors contributed equally to the paper.
Conflicts of Interest
The authors declare no conflict of interest.
References
- Spoerer, F.W.G.; Maunder, E.W. Prof. Spoerer’s researches on Sun-spots. Mon. Not. R. Astron. Soc. 1890, 50, 251. [Google Scholar]
- Maunder, E.W. Note on the distribution of sun-spots in heliographic latitude, 1874–1902. Mon. Not. R. Astron. Soc. 1904, 64, 747–761. [Google Scholar] [CrossRef]
- Newton, H.W.; Milsom, A.S. Note on the observed differences in spottedness of the Sun’s northern and southern hemispheres. Mon. Not. R. Astron. Soc. 1955, 398–404. [Google Scholar] [CrossRef] [Green Version]
- Harrison, R.A. Solar coronal mass ejections and flares. Astron. Astrophys. 1986, 162, 283–291. [Google Scholar]
- Ataç, T.; Özgüç, A. North-south asymmetry in the solar flare index. Sol. Phys. 1996, 166, 201–208. [Google Scholar] [CrossRef]
- Deng, L.; Zhang, X.; An, J.; Cai, Y. Statistical properties of solar Hα flare activity. J. Space Weather Space Clim. 2017, 7, A34. [Google Scholar] [CrossRef]
- Deng, L.H.; Zhang, X.J.; Li, G.Y.; Deng, H.; Wang, F. Phase and amplitude asymmetry in the quasi-biennial oscillation of solar Hα flare activity. Mon. Not. R. Astron. Soc. 2019, 488, 111–119. [Google Scholar] [CrossRef] [Green Version]
- Sharma, J.; Malik, A.K.; Kumar, B.; Vats, H.O. Evidence of a strong relationship between hemispheric asymmetry in solar coronal rotation and solar activity during solar cycle 24. Mon. Not. R. Astron. Soc. 2020, 499, 5442–5446. [Google Scholar] [CrossRef]
- Sharma, J.; Kumar, B.; Malik, A.K.; Vats, H.O. Differential rotation of the solar transition region from STEREO/EUVI 30.4-nm images. Mon. Not. R. Astron. Soc. 2021, 506, 4952–4959. [Google Scholar] [CrossRef]
- Deng, L.H.; Qu, Z.Q.; Yan, X.L.; Liu, T.; Wang, K.R. The hemispheric asymmetry of polar faculae. J. Astrophys. Astron. 2012, 33, 221–226. [Google Scholar] [CrossRef]
- Deng, L.H.; Qu, Z.Q.; Liu, T.; Huang, W.J. The hemispheric asynchrony of polar faculae during solar cycles 19–22. Adv. Space Res. 2013, 51, 87–95. [Google Scholar] [CrossRef]
- Herschel, W., XIII. Observations tending to investigate the nature of the sun, in order to find the causes or symptoms of its variable emission of light and heat; with remarks on the use that may possibly be drawn from solar observations. Philos. Trans. R. Soc. Lond. 1801, 91, 265–318. [Google Scholar]
- Eddy, J.A. The maunder minimum. Science 1976, 1189–1202. [Google Scholar] [CrossRef] [PubMed] [Green Version]
- Currie, R.G. Distribution of solar cycle signal in surface air temperature over North America. J. Geophys. Res. 1979, 84, 753–761. [Google Scholar] [CrossRef]
- Friis-Christensen, E.; Lassen, K. Length of the solar cycle: An indicator of solar activity closely associated with climate. Science 1991, 254, 698–700. [Google Scholar] [CrossRef] [Green Version]
- Haigh, J.D. The impact of solar variability on climate. Science 1996, 272, 981–984. [Google Scholar] [CrossRef]
- Svensmark, H. Cosmoclimatology: A new theory emerges. Astron. Geophys. 2007, 48, 1.18–1.24. [Google Scholar] [CrossRef] [Green Version]
- Heras, A.M.; Sanahuja, B.; Shea, M.A.; Smart, D.F. Some comments on the east-west solar flare distribution during the 1976–1985 period. Sol. Phys. 1990, 126, 371–383. [Google Scholar] [CrossRef]
- Deng, L.H.; Li, B.; Xiang, Y.Y.; Dun, G.T. On mid-term periodicities of high-latitude solar activity. Adv. Space Res. 2014, 54, 125–131. [Google Scholar] [CrossRef]
- Deng, L.H.; Xiang, Y.Y.; Qu, Z.N.; An, J.M. Systematic regularity of hemispheric sunspot areas over the past 140 years. Astron. J. 2016, 151, 70. [Google Scholar] [CrossRef]
- Kramynin, A.P.; Mikhalina, F.A. Latitude-longitude characteristics of the north-south asymmetry of solar activity. Geomagn. Aeron. 2018, 58, 937–941. [Google Scholar] [CrossRef]
- Deng, L.-H.; Qu, Z.-Q.; Yan, X.-L.; Wang, K.-R. Phase analysis of sunspot group numbers on both solar hemispheres. Res. Astron. Astrophys. 2013, 13, 104–114. [Google Scholar] [CrossRef]
- Sello, S. Solar cycle forecasting: A nonlinear dynamics approach. Astron. Astrophys. 2001, 377, 312–320. [Google Scholar] [CrossRef] [Green Version]
- Gao, Z.K.; Cai, Q.; Yang, Y.X.; Dang, W.D.; Zhang, S.S. Multiscale limited penetrable horizontal visibility graph for analyzing nonlinear time series. Sci. Rep. 2016, 6, 35622. [Google Scholar] [CrossRef] [PubMed] [Green Version]
- Lucas, L.; Luque, B.; Ballesteros, F.; Luque, J.; Nuño, J.C. From time series to complex networks: The visibility graph. Proc. Natl. Acad. Sci. USA 2008, 105, 4972–4975. [Google Scholar] [CrossRef] [Green Version]
- Luque, B.; Lacasa, L.; Ballesteros, F.; Luque, J. Horizontal visibility graphs: Exact results for random time series. Phys. Rev. 2009, 80, 046103. [Google Scholar] [CrossRef] [Green Version]
- Zhou, T.-T.; Jin, N.-D.; Gao, Z.-K.; Luo, Y.-B. Limited penetrable visibility graph for establishing complex network from time series. Acta Phys. Sin. 2012, 61, 3. [Google Scholar]
- Yu, Z.G.; Anh, V.; Eastes, R.; Wang, D.-L. Multifractal analysis of solar flare indices and their horizontal visibility graphs. Nonlinear Process. Geophys. 2012, 19, 657–665. [Google Scholar] [CrossRef] [Green Version]
- Suyal, V.; Prasad, A.; Singh, H.P. Visibility-graph analysis of the solar wind velocity. Sol. Phys. 2014, 289, 379–389. [Google Scholar] [CrossRef] [Green Version]
- Zou, Y.; Donner, R.V.; Marwan, N.; Small, M.; Kurths, J. Long-term changes in the north-south asymmetry of solar activity: A nonlinear dynamics characterization using visibility graphs. Nonlinear Process. Geophys. 2014, 21, 1113–1126. [Google Scholar] [CrossRef] [Green Version]
- Sakurai, T. Long-term monitoring studies of the Sun at the National Astronomical Observatory of Japan. ASP Conf. Ser. 1998, 140, 483–495. [Google Scholar]
- Natori, T. Sunspot relative numbers observed before 1948 at the Tokyo Astronomical Observatory. Rep. Natl. Astron. Obs. Jpn. 1991, 1, 71–99. [Google Scholar]
- Clette, F.; Svalgaard, L.; Vaquero, J.M.; Cliver, E.W. Revisiting the Sunspot Number. A 400-Year Perspective on the Solar Cycle. Space Sci. Rev. 2014, 186, 35–103. [Google Scholar] [CrossRef] [Green Version]
- Deng, L.H.; Zhang, X.J.; Deng, H.; Mei, Y.; Wang, F. Systematic regularity of solar coronal rotation during the time interval 1939–2019. Mon. Not. R. Astron. Soc. 2020, 491, 848–857. [Google Scholar] [CrossRef]
- Carbonell, M.; Oliver, R.; Ballester, J.L. On the asymmetry of solar activity. Astron. Astrophys. 1993, 274, 497. [Google Scholar]
- Zolotova, N.V.; Ponyavin, D.I.; Arlt, R.; Tuominen, I. Secular variation of hemispheric phase differences in the solar cycle. Astron. Nachrichten. 2010, 331, 765. [Google Scholar] [CrossRef] [Green Version]
Figure 1.
The daily time series of sunspot relative numbers from the NAOJ/Mitaka observatory (upper panel) along with the International Sunspot Number (ISSN; lower panel) from 1 March 1939 to 30 September 2019.
Figure 1.
The daily time series of sunspot relative numbers from the NAOJ/Mitaka observatory (upper panel) along with the International Sunspot Number (ISSN; lower panel) from 1 March 1939 to 30 September 2019.

Figure 2.
Monthly distribution of sunspot relative numbers in the northern and southern hemispheres during the time interval from March 1939 to September 2019.
Figure 2.
Monthly distribution of sunspot relative numbers in the northern and southern hemispheres during the time interval from March 1939 to September 2019.

Figure 3.
Monthly hemispheric sunspot relative numbers (top panel), the absolute difference (middle panel), and the normalized difference (bottom panel) with a running width of months.
Figure 3.
Monthly hemispheric sunspot relative numbers (top panel), the absolute difference (middle panel), and the normalized difference (bottom panel) with a running width of months.

Figure 4.
Probability distribution functions of sunspot relative numbers in the northern (upper panel) and southern (lower panel) hemispheres, respectively.
Figure 4.
Probability distribution functions of sunspot relative numbers in the northern (upper panel) and southern (lower panel) hemispheres, respectively.

Figure 5.
Upper panel: the yearly skewness values of hemispheric sunspot relative numbers. Lower panel: the difference of the yearly skewness of hemispheric sunspot relative numbers.
Figure 5.
Upper panel: the yearly skewness values of hemispheric sunspot relative numbers. Lower panel: the difference of the yearly skewness of hemispheric sunspot relative numbers.

Figure 6.
The degree sequences of the sunspot relative numbers for the northern and southern hemispheres (top panel), and the absolute (middle panel) and normalized (bottom panel) hemispheric differences of the degree sequences.
Figure 6.
The degree sequences of the sunspot relative numbers for the northern and southern hemispheres (top panel), and the absolute (middle panel) and normalized (bottom panel) hemispheric differences of the degree sequences.

Figure 7.
Similar to Figure 6, but for the HVG.
Figure 7.
Similar to Figure 6, but for the HVG.

Figure 8.
Similar to Figure 6, but for the LPVG.
Figure 8.
Similar to Figure 6, but for the LPVG.

Publisher’s Note: MDPI stays neutral with regard to jurisdictional claims in published maps and institutional affiliations. |
© 2021 by the authors. Licensee MDPI, Basel, Switzerland. This article is an open access article distributed under the terms and conditions of the Creative Commons Attribution (CC BY) license (https://creativecommons.org/licenses/by/4.0/).
Share and Cite
MDPI and ACS Style
Xu, H.; Fei, Y.; Li, C.; Liang, J.; Tian, X.; Wan, Z. The North–South Asymmetry of Sunspot Relative Numbers Based on Complex Network Technique. Symmetry 2021, 13, 2228. https://0-doi-org.brum.beds.ac.uk/10.3390/sym13112228
AMA Style
Xu H, Fei Y, Li C, Liang J, Tian X, Wan Z. The North–South Asymmetry of Sunspot Relative Numbers Based on Complex Network Technique. Symmetry. 2021; 13(11):2228. https://0-doi-org.brum.beds.ac.uk/10.3390/sym13112228
Chicago/Turabian StyleXu, Hengyu, Yu Fei, Chun Li, Jiajuan Liang, Xinan Tian, and Zhongjie Wan. 2021. "The North–South Asymmetry of Sunspot Relative Numbers Based on Complex Network Technique" Symmetry 13, no. 11: 2228. https://0-doi-org.brum.beds.ac.uk/10.3390/sym13112228
Note that from the first issue of 2016, this journal uses article numbers instead of page numbers. See further details here.