
Analysis and Prediction for Confirmed COVID-19 Cases in Czech Republic with Uncertain Logistic Growth Model


School of Mathematical Sciences, Liaocheng University, Liaocheng 252059, China
*
Author to whom correspondence should be addressed.
†
These authors contributed equally to this work.
Symmetry 2021, 13(12), 2264; https://0-doi-org.brum.beds.ac.uk/10.3390/sym13122264
Submission received: 31 October 2021
/
Revised: 19 November 2021
/
Accepted: 24 November 2021
/
Published: 28 November 2021
(This article belongs to the Special Issue Uncertainty Theory: Symmetry and Applications)
Abstract
:This paper presents an uncertain logistic growth model to analyse and predict the evolution of the cumulative number of COVID-19 infection in Czech Republic. Some fundamental knowledge about the uncertain regression analysis are reviewed firstly. Stochastic regression analysis is invalid to model cumulative number of confirmed COVID-19 cases in Czech Republic, by considering the disturbance term as random variables, because that the normality test and the identical distribution test of residuals are not passed, and the residual plot does not look like a null plot in the sense of probability theory. In this case, the uncertain logistic growth model is applied by characterizing the disturbance term as uncertain variables. Then parameter estimation, residual analysis, the forecast value and confidence interval are studied. Additionally, the uncertain hypothesis test is proposed to evaluate the appropriateness of the fitted logistic growth model and estimated disturbance term. The analysis and prediction for the cumulative number of COVID-19 infection in Czech Republic can propose theoretical support for the disease control and prevention. Due to the symmetry and similarity of epidemic transmission, other regions of COVID-19 infections, or other diseases can be disposed in a similar theory and method.
1. Introduction
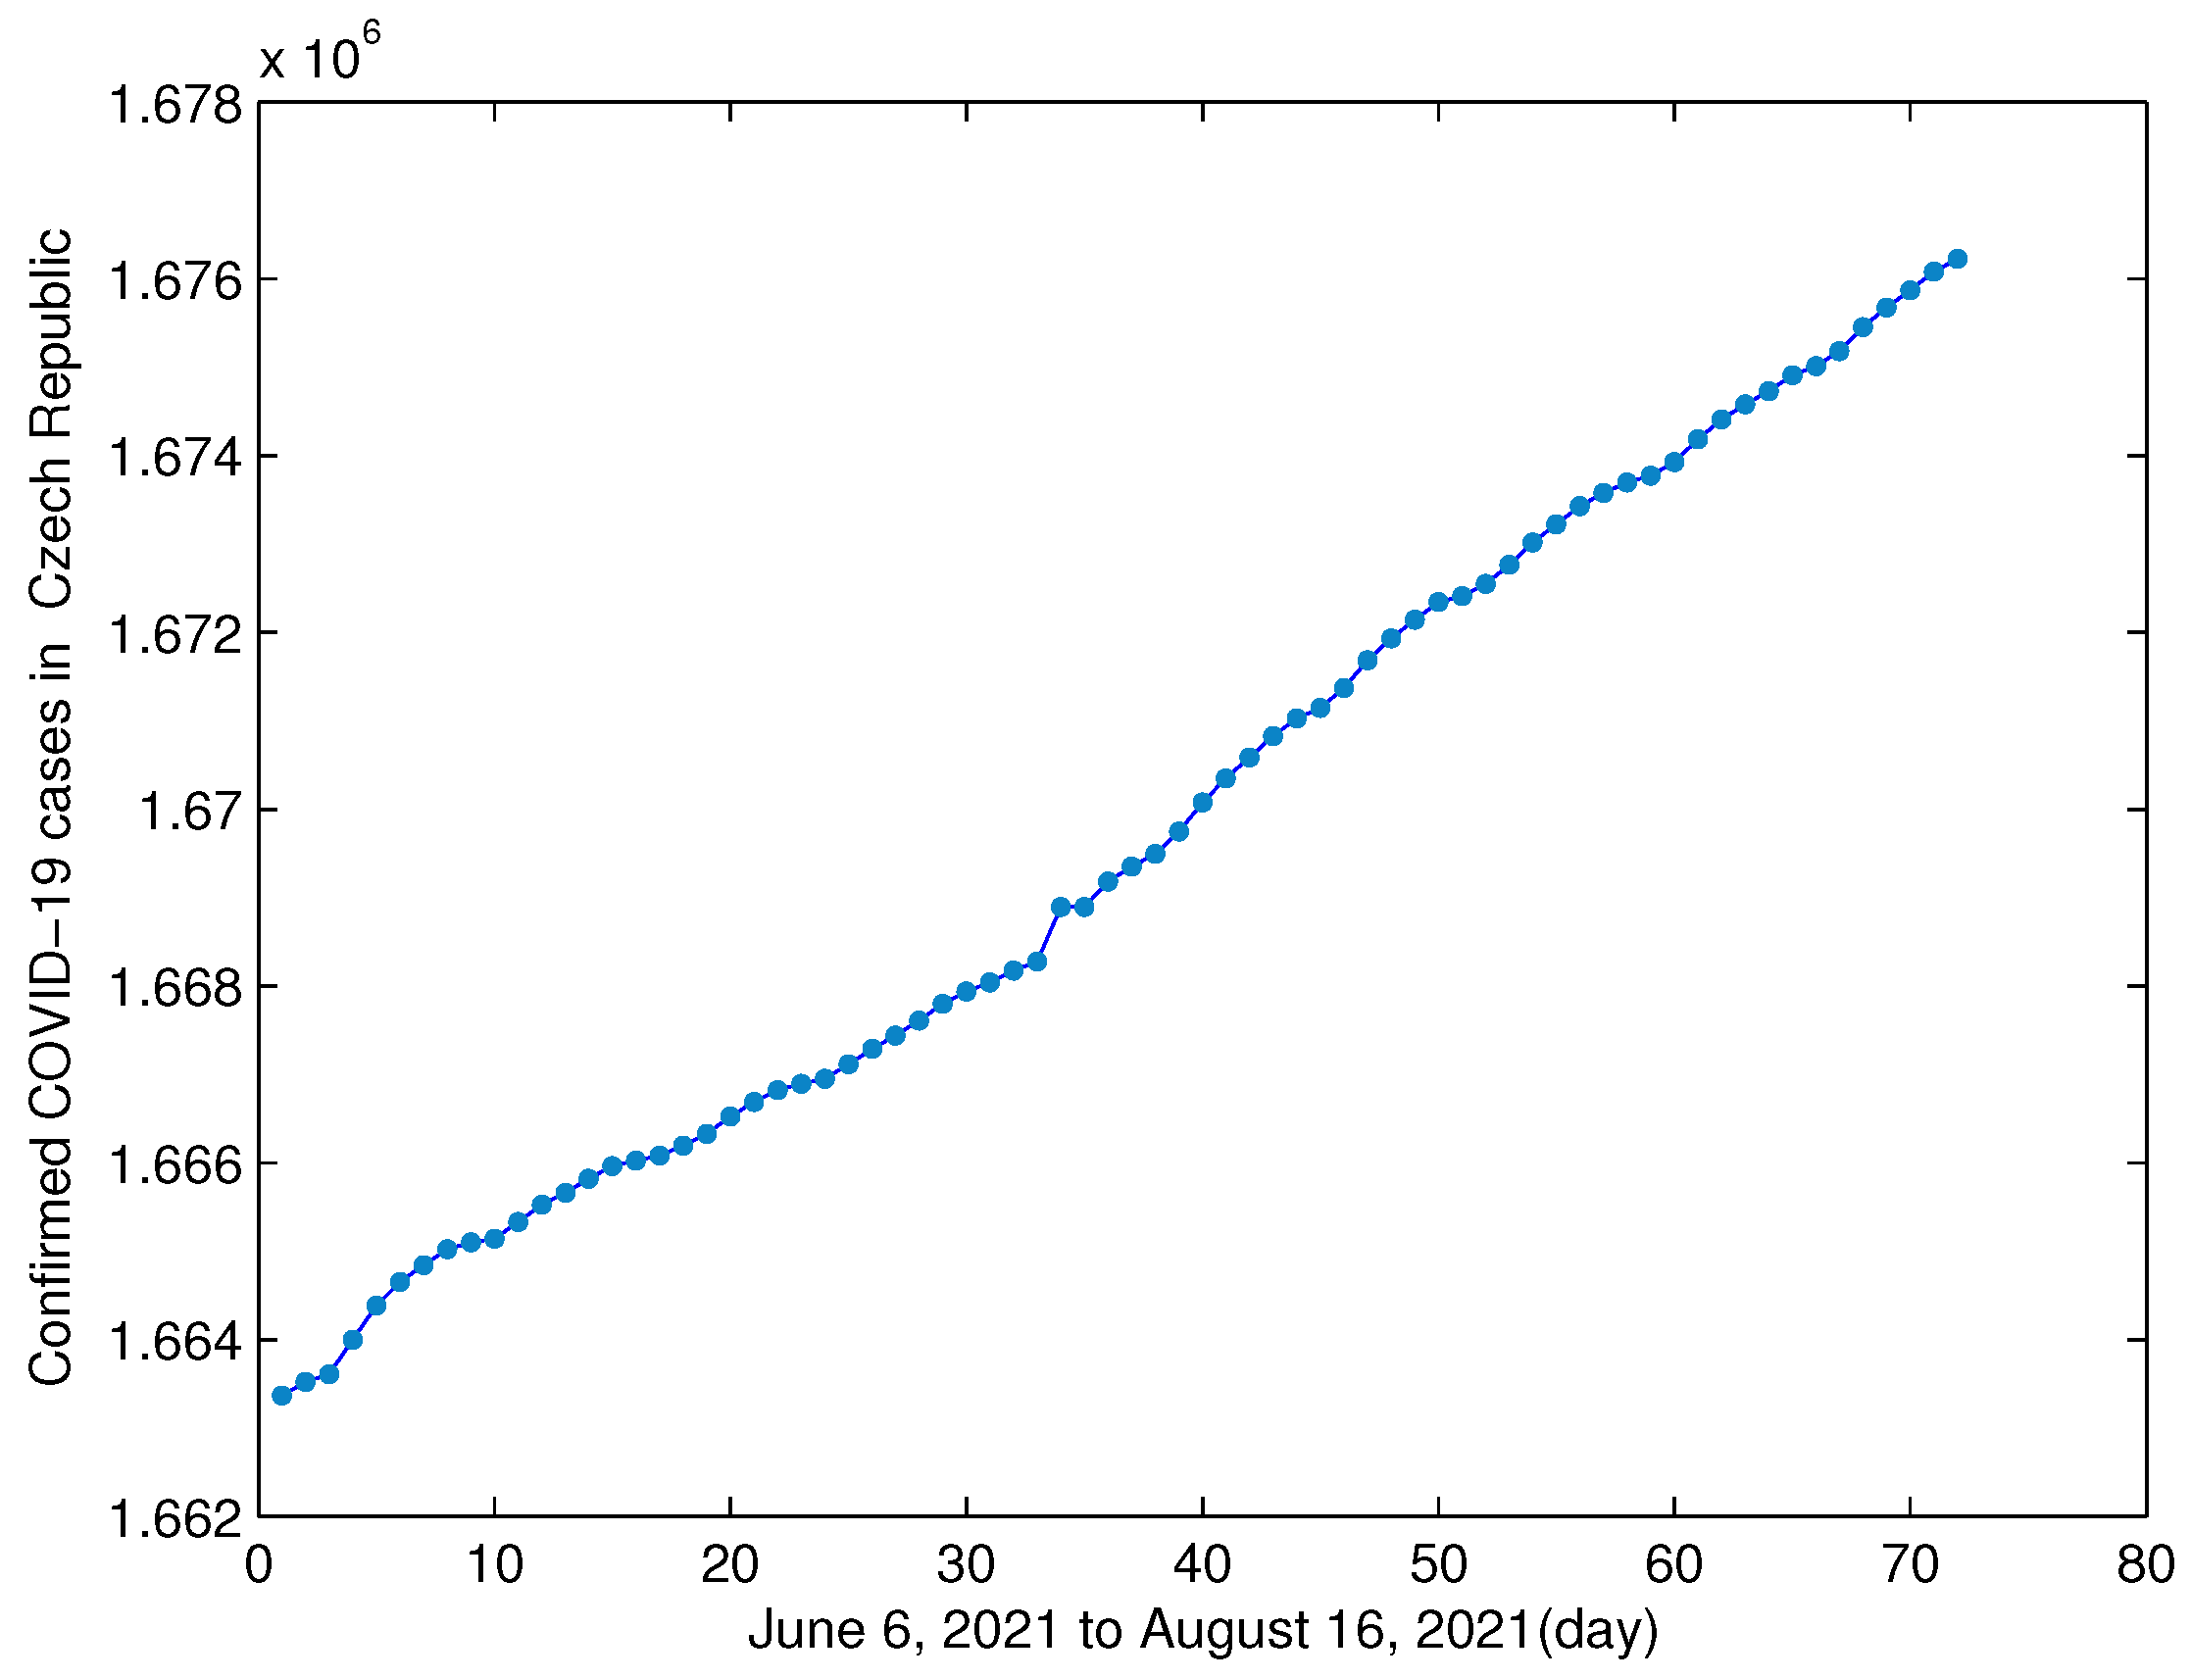
The pandemic COVID-19 remains a challenge globally, which gives rise to seriously threatens of human health, economic losses and social panic in different degree. As of 16 August 2021, a total of 1,676,222 confirmed cases and 30,737 death has been reported in Czech Republic. In addition, the confirmed case is the individual whose blood sample is confirmed to be positive and has the ability to transmit the virus, and the death case means the individual who infects the COVID-19 and dies from the virus. How do we model its evolution based on the cumulative confirmed cases from 6 June 2021 to 16 August 2021 in Czech Republic?
Regression analysis is a set of statistical techniques exploring the relationship between explanatory variables and response variables. Although stochastic regression analysis, under the framework of probability theory, has got lots of attention and researches. However, it can only be applied to the case that the estimated distribution being close enough to the true frequency, which can not be satisfied in many cases. Motivated by this, the uncertain regression analysis was firstly proposed in 2018 by Yao-Liu [1] based on the knowledge framework of uncertainty theory [2].
In this paper, we will adopt the uncertain regression analysis to interpret and analyse the cumulative confirmed of COVID-19 cases in Czech Republic. As an important branch of uncertain statistics, uncertain regression analysis [1] is a set of statistical techniques that use uncertainty theory to explore the relationship between explanatory variables and response variables.
After the least squares estimation was proposed to estimate the unknown parameters in uncertain regression models [1], some other estimation methods were presented, such as the absolute deviations estimation [3], Tukey’s biweight estimations [4], the maximum likelihood estimation [5], and so on. In order to make interval estimation for predicting the response variables, Lio-Liu [6] suggested a method to determine the expected value and variance of uncertain disturbance term. The uncertain hypothesis test was initialized by Ye-Liu [7] as a statistical tool that uses uncertainty theory to judge whether some hypotheses are correct or not based on observed data. Then the uncertain significance test [8] was introduced. Uncertain regression analysis has also been successfully extended in many directions, including uncertain multivariable regression model [9], multivariate regression analysis [10,11], nonparametric regression analysis [12], and so on. In addition, some other uncertain regression models were analysed, such as the uncertain Chapman-Richards growth model [13], the uncertain Verhulst-Pearl model [14], the uncertain Gompertz regression model [15], the uncertain revised regression model [16], and so on.
It is worth mentioning that the uncertainty theory has been successfully applied to the cumulative number of COVID-19 infections in China, for instance, uncertain SIR model [17], uncertain SEIAR model [18], uncertain logistic growth model [19], initial value estimation [20], uncertain time series [21], and so on. All above researches have studied and analysed the cumulative number of COVID-19 infections in China by using the uncertainty theory, from the angle of uncertain differential equation, uncertain regression analysis and uncertain time series analysis. In this manuscript, the cumulative number of COVID-19 infections in Czech Republic is dealt with initially by using an uncertain logistic growth model. The upper limit number of infection, and an accurate expected forecast value are obtained.
The rest frame is organized as follows. In next section, some fundamental knowledge about the uncertain regression analysis are introduced. Uncertain logistic growth model is given for COVID-19 cases in Czech Republic in Section 3 by characterizing the disturbance term as an uncertain variable. The data for the cumulative number of COVID-19 infection in Czech Republic is given firstly. Then parameter estimation, the forecast value, confidence interval, and the uncertain hypothesis test are used to analyse and predict the evolution of the cumulative number of confirmed COVID-19 infections in Czech Republic. In addition, stochastic regression analysis is invalid to model cumulative number of confirmed COVID-19 cases in Czech Republic, because that the normality test (Lilliefors test) and the identical distribution test (Kolmogorov–Smirnov test) of residuals are not passed, and the residual plot does not look like a null plot in the sense of probability theory. A brief summary and discussion are given in the last. So other regions of COVID-19 infections, or other diseases can be analysed and forecasted by using the uncertain logistic growth model due to the symmetry and similarity.
2. Uncertain Regression Analysis
In this section, we introduce some fundamental knowledge about the uncertain regression analysis, including parameter estimation, residual analysis, forecast value and confidence interval, and hypothesis test for the uncertain logistic growth model.
2.1. Uncertain Logistic Growth Model
The uncertain logistic growth model, as an uncertain regression model, was proposed in order to explore the functional relationship between t and
where is a vector of parameters, and is an uncertain disturbance term (uncertain variable).
2.2. Parameter Estimation and Residual Analysis
When are observed, Yao and Liu [1] defined the uncertain least squares estimations of in the uncertain logistic growth model (1) is the solution of the minimization problem:
which is a traditional minimization problem, solved by the least square method (lsqnonlin in Matlab). Thus, the fitted logistic growth model is:
Then for each index the t-th residual is:
which will be regarded as the samples of the uncertain disturbance term in the uncertain logistic growth model. Therefore, the expected value of the uncertain disturbance term can be estimated as the average of residuals, i.e.,
and the variance of the disturbance term can be estimated as:
2.3. Forecast
As the hypothesis, the disturbance term is a normal uncertain variable with expected value and variance Thus, the forecast uncertain variable of response variable y with respect to a new explanatory variable t is:
in which are the expected value and variance of the disturbance term shown in (5) and (6), respectively.
The forecast value is defined as the expected value of the forecast uncertain variable y
According to the operational law for calculating the inverse uncertainty distributions [2], has a normal uncertainty distribution i.e.,
and the inverse uncertainty distribution of is equivalent to:
where is the inverse uncertainty distribution,
Taking as a confidence level (e.g., ), Lio-Liu [5] suggested the confidence interval of response variable y is:
where
is the minimum b such that:
2.4. Uncertain Hypothesis Test
Uncertain hypothesis test was initialized by Ye-Liu [7] as a statistical tool that uses uncertainty theory to judge whether some hypotheses are correct or not. Let be an uncertain variable with a normal uncertainty distribution where e and are unknown parameters. Then the hypotheses are:
The statement is called a null hypothesis, and is called an alternative hypothesis. Given a significance level the hypotheses are
with is the inverse uncertainty distribution of i.e.,
If the vector of observed data belongs to the rejection region i.e.,
then we reject Otherwise, we accept
3. Uncertain Logistic Growth Model for COVID-19 Cases in Czech Republic
In this section, we use the uncertain regression analysis to modeling the cumulative data of confirmed COVID-19 infections in Czech Republic from 6 June 2021 to 16 August 2021 (see Table 1).
3.1. Data and Model
Table 1 shows the cumulative numbers of COVID-19 infections in Czech Republic from 6 June 2021 to 16 August 2021, via the website of the (MedSci https://www.medsci.cn/ (accessed on 16 August 2021)). Let , 72 denotes the data from 6 June 2021 to 16 August 2021. For instance, and 72 represent 6 June 2021 and 16 August 2021, respectively. In order to find the functional relationship between t (the date) and y (the cumulative number of COVID-19 infections in Czech Republic ), we may use the observed data:
in which are the cumulative numbers shown in Table 1 on days , 72, respectively. For example,
which is shown in Figure 1.
We use the uncertain logistic growth model to invest the relationship between the time t and the cumulative number of confirmed COVID-19 cases in Czech Republic The uncertain logistic growth model is shown in (1),
where is a vector of parameters, and is an uncertain disturbance term (uncertain variable).
3.2. Parameter Estimation and Residual Analysis
With the observed data of confirmed COVID-19 cases in Czech Republic from 6 June 2021 to 16 August 2021, , 72, solving the following minimization problem:
we can obtain the parameter values for
Thus, the fitted logistic growth model is:
which matching the data excellently.
Then, for each index , 72), the t-th residual is:
which can be regarded as the samples of the uncertain disturbance term (shown in Figure 2) in the uncertain regression model
Then, the average of the expected values of residuals is obtained, i.e.,
and the variance is:
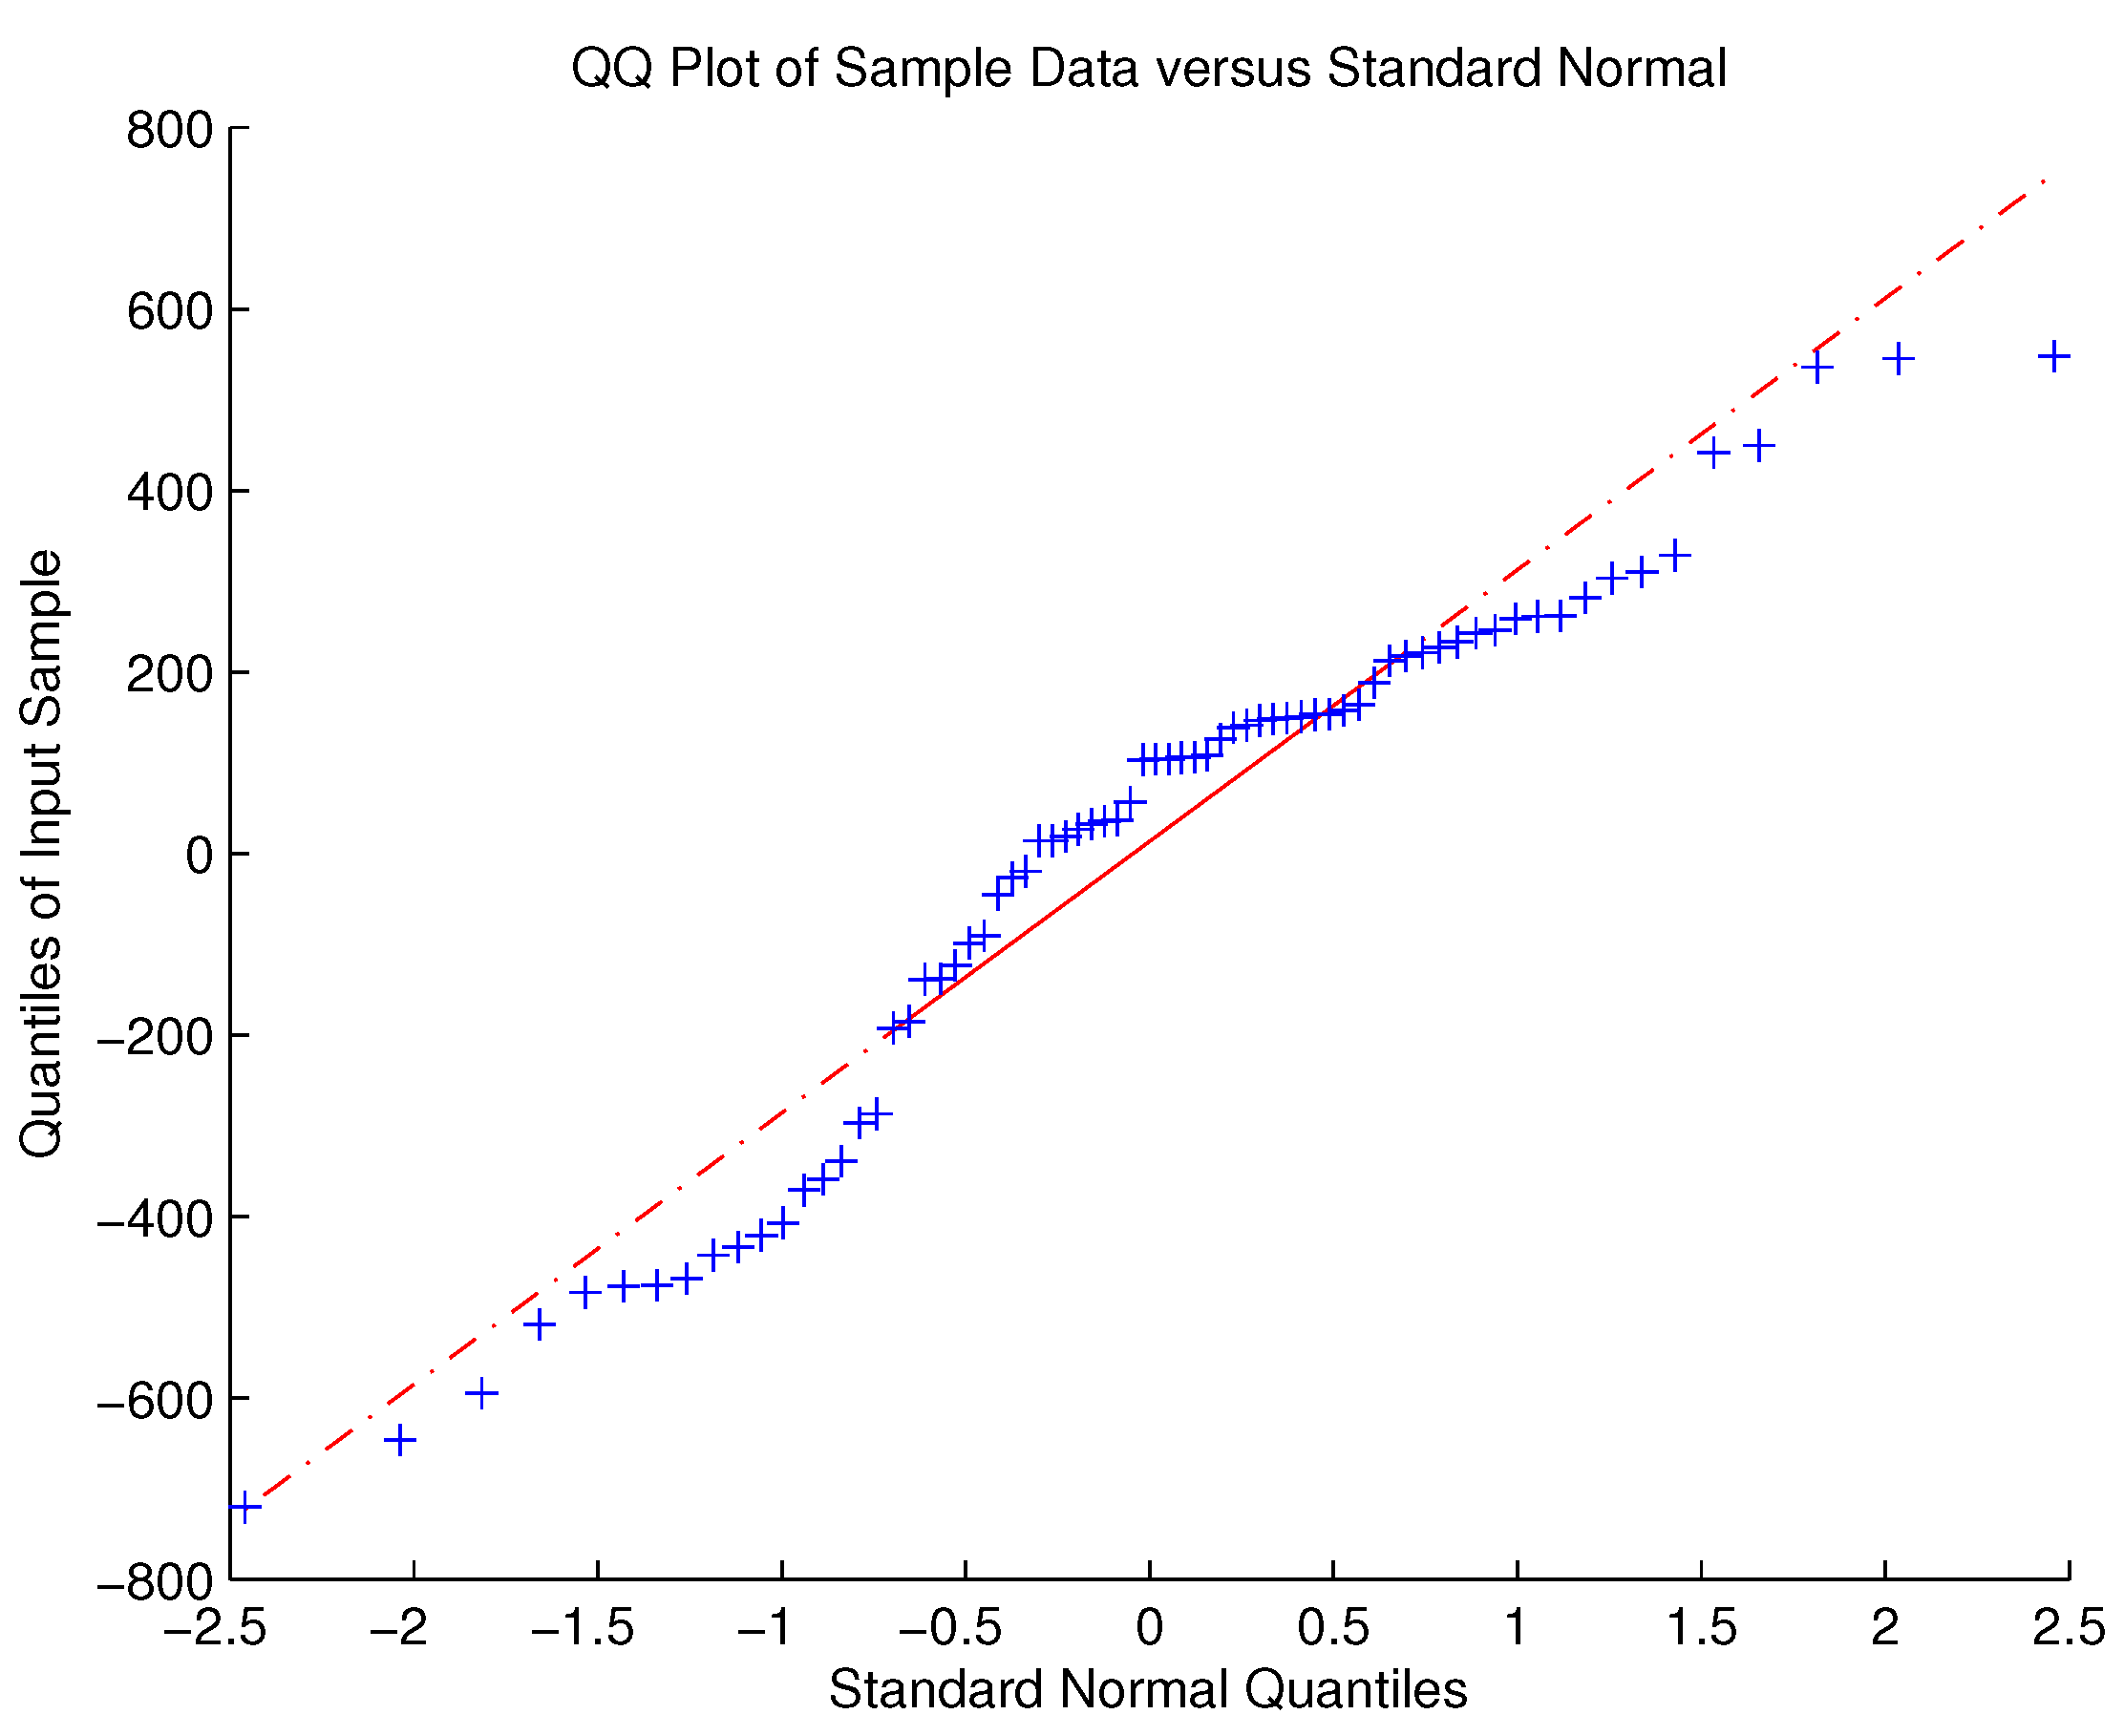
Stochastic regression analysis is invalid to model cumulative number of confirmed COVID-19 cases in Czech Republic. Firstly, based on the Lilliefors test for the normality of residuals in Figure 2, we have the p-values is less than which suggests that the normality of residuals has been disproved by the test. The QQplot shown in Figure 3 can also support this point. Then, by using the Kolmogorov–Smirnov test, the residuals in Figure 2 are not from the same population in the sense of probability theory. For example, by using the test to check whether the first 10 residuals and the rest residuals in Figure 2 are identically distributed in the sense of probability theory, we have that the p-value is which means it does not pass the identical distribution test. Finally, stochastic regression analysis requires that a residual plot should look like a null plot which has constant mean, constant variance, and no separated points. It seems that the residual plot shown in Figure 2 is not a null plot in the sense of probability theory. Under these situations, the distribution function we obtained is not close enough to the real frequency for the disturbance term. Therefore, the disturbance term can not be characterized as a random variable, that is to see, stochastic regression analysis is invalid in this case.Consequently, the disturbance term can be characterized as an uncertain variable, and we use the uncertain regression analysis and uncertain hypothesis to exam the observed data in Table 1.
3.3. Forecast
The forecast uncertain variable of cumulative number of confirmed COVID-19 infections in Czech Republic on day t is:
For instance, the forecast uncertain variable of cumulative number of confirmed COVID-19 infections in Czech Republic on day 73 ( 17 August 2021) follows the normal uncertainty distribution:
We can see that due to Thus, the excepted forecast value of cumulative number of confirmed COVID-19 infections in Czech Republic on 17 August 2021 is 1,676,256. Furthermore, the confidence interval is:
i.e., [1,675,650.30, 1,676,861.13].
3.4. Uncertain Hypothesis Test
As assumption, is a normal uncertain variable with unknown expected value e and unknown variance obtained in Equation (16) are 72 observed data of the uncertain variable For a certain significance level we obtain:
where is the inverse uncertainty distribution of , i.e.,
It follows from and uncertain hypothesis test that the test for the hypotheses:
is
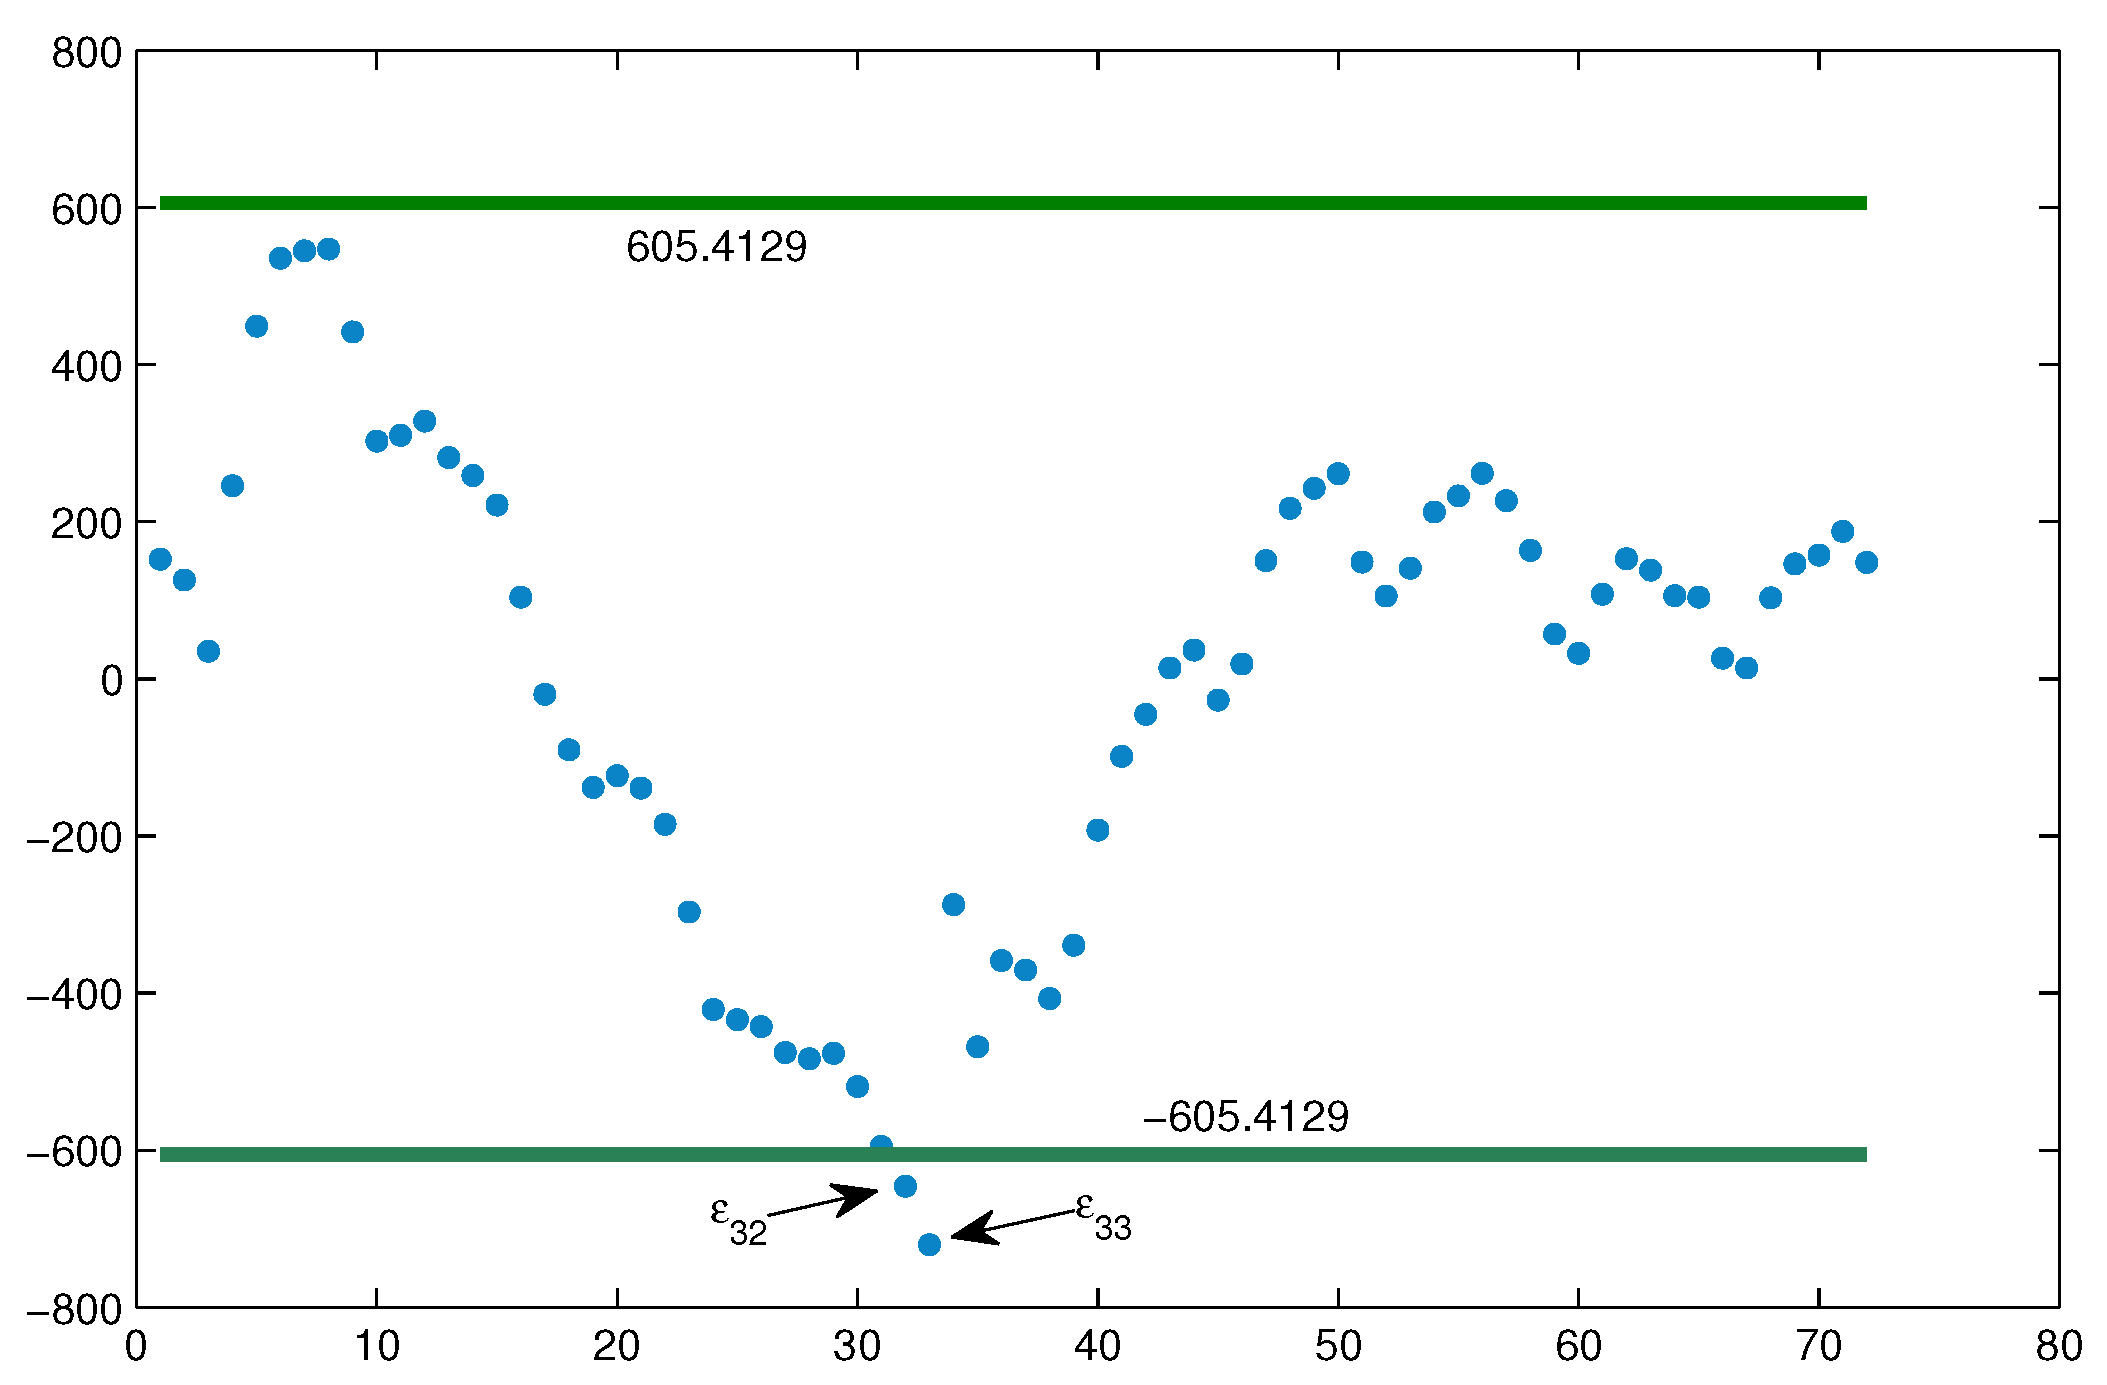
with is the inverse uncertainty distribution of Since there only exist 2 outliers ∉ and ∉ (shown in Figure 4), we have Thus, we accept In other words, the uncertain regression model (20) is appropriate for fitting the the cumulative number of confirmed COVID-19 data in Czech Republic. As the forecast of uncertain logistic growth model, the total number of confirmed COVID-19 infections in Czech Republic continues to increase, but does not exceed as expected.
4. Discussion
In this manuscript, an uncertain logistic growth model was applied to formulated the cumulative number of COVID-19 data in Czech Republic. Stochastic regression analysis is invalid to model cumulative number of confirmed COVID-19 cases in Czech Republic, by considering the disturbance term as random variables, because that the normality test and the identical distribution test of residuals are not passed, and the residual plot does not look like a null plot in the sense of probability theory. In this case, the uncertain logistic growth model was employed by considering the perturbation as an uncertain distribution term. Then parameter estimation, residual analysis, forecast value, and confidence interval were proposed, also the cumulative number of confirmed COVID-19 on August 17, 2021 in Czech Republic was predicted. Moreover the uncertain hypothesis test was employed to illustrate the uncertain logistic growth model is a good fit to the observed data. In the future, uncertain logistic growth model can also be applied to modeling the prediction and precaution for other epidemics due to the symmetry and similarity of disease. If there is a very little data reported or the limitations of data time period choosing, the prediction will be not as accurate as expected.
Author Contributions
Validation, writing, C.D.; review and editing, W.L.; visualization, C.D.; supervision, W.L. All authors have read and agreed to the published version of the manuscript.
Funding
This research was funded by the National Natural Science Foundation of China (No.12026226), the Natural Science Foundation of Shandong Province of China (ZR2021MA089), the Natural Science Foundation of Jiangsu Province of China (BK20190723) and the Foundation of Liaocheng University (318051712).
Institutional Review Board Statement
Not applicable.
Informed Consent Statement
Not applicable.
Data Availability Statement
The data supporting the results reported in the paper can be accessed from the corresponding authors.
Conflicts of Interest
The authors declare no conflict of interest.
References
- Yao, K.; Liu, B. Uncertain regression analysis: An approach for imprecise observations. Soft Comput. 2018, 22, 5579–5582. [Google Scholar] [CrossRef]
- Liu, B. (Ed.) Uncertain Statistics. In Uncertainty Theory, 2nd ed.; Springer: Berlin/Heidelberg, Germany, 2007; pp. 122–149. [Google Scholar]
- Liu, Z.; Yang, Y. Least absolute deviations estimation for uncertain regression with imprecise observations. Fuzzy Optim. Decis. Mak. 2020, 19, 33–52. [Google Scholar] [CrossRef]
- Chen, D. Tukeys biweight estimation for uncertain regression model with imprecise observations. Soft Comput. 2020, 24, 16803–16809. [Google Scholar] [CrossRef]
- Lio, W.; Liu, B. Uncertain maximum likelihood estimation with application to uncertain regression analysis. Soft Comput. 2020, 24, 9351–9360. [Google Scholar] [CrossRef]
- Lio, W.; Liu, B. Residual and confidence interval for uncertain regression model with imprecise observations. J. Intell. Fuzzy Syst. 2018, 35, 2573–2583. [Google Scholar] [CrossRef]
- Ye, T.; Liu, B. Uncertain hypothesis test with application to uncertain regression analysis. Fuzzy Optim. Decis. Mak. 2021. [Google Scholar] [CrossRef]
- Ye, T.; Liu, B. Uncertain significance test for regression coefficients with application to regional economic analysis. Tech. Rep. 2021. under review. [Google Scholar]
- Song, Y.; Fu, Z. Uncertain multivariable regression model. Soft Comput. 2018, 22, 5861–5866. [Google Scholar] [CrossRef]
- Ye, T.; Liu, Y. Multivariate uncertain regression model with imprecise observations. J. Ambient. Intell. Humaniz. Comput. 2020, 11, 4941–4950. [Google Scholar] [CrossRef]
- Zhang, C.; Liu, Z.; Liu, J. Least absolute deviations for uncertain multivariate regression model. Int. J. Gen. Syst. 2020, 49, 449–465. [Google Scholar] [CrossRef]
- Ding, J.; Zhang, Z. Statistical inference on uncertain nonparametric regression model. Fuzzy Optim. Decis. Mak. 2021. [Google Scholar] [CrossRef]
- Liu, Z.; Jia, L. Cross-validation for the uncertain Chapman-Richards growth model with imprecise observations. Int. J. Uncertain. Fuzziness Knowl. Based Syst. 2020, 28, 769–783. [Google Scholar] [CrossRef]
- Liu, S. Leave-p-Out Cross-Validation Test for Uncertain Verhulst-Pearl Model With Imprecise Observations. IEEE Access 2019, 7, 131705–131709. [Google Scholar] [CrossRef]
- Hu, Z.; Gao, J. Uncertain Gompertz regression model with imprecise observations. Soft Comput. 2020, 24, 2543–2549. [Google Scholar] [CrossRef]
- Fang, L.; Hong, Y. Uncertain revised regression analysis with responses of logarithmic, square root and reciprocal transformations. Soft Comput. 2020, 24, 2655–2670. [Google Scholar] [CrossRef]
- Chen, X.; Li, J.; Xiao, C.; Yang, P. Numerical solution and parameter estimation for uncertain SIR model with application to COVID-19. Fuzzy Optim. Decis. Mak. 2021, 20, 189–208. [Google Scholar] [CrossRef]
- Jia, L.; Chen, W. Uncertain SEIAR model for COVID-19 cases in China. Fuzzy Optim. Decis. Mak. 2021, 20, 243–259. [Google Scholar] [CrossRef]
- Liu, Z. Uncertain growth model for the cumulative number of COVID-19 infections in China. Fuzzy Optim. Decis. Mak. 2021, 20, 229–242. [Google Scholar] [CrossRef]
- Lio, W.; Liu, B. Initial value estimation of uncertain differential equations and zero-day of COVID-19 spread in China. Fuzzy Optim. Decis. Mak. 2021, 20, 177–188. [Google Scholar] [CrossRef]
- Ye, T.; Yang, X. Analysis and prediction of confirmed COVID-19 cases in China with uncertain time series. Fuzzy Optim. Decis. Mak. 2021, 20, 209–228. [Google Scholar] [CrossRef]
Figure 1.
Cumulative numbers of confirmed COVID-19 infections in Czech Republic from 6 June 2021 to 16 August 2021.
Figure 1.
Cumulative numbers of confirmed COVID-19 infections in Czech Republic from 6 June 2021 to 16 August 2021.

Figure 2.
Residual plots for the uncertain logistic growth model.

Figure 3.
QQplot for the residuals.

Figure 4.
Uncertain hypothesis test: two outliers ( and ).


Table 1.
Cumulative numbers of confirmed COVID-19 infections in Czech Republic from 6 June 2021 to 16 August 2021.
Table 1.
Cumulative numbers of confirmed COVID-19 infections in Czech Republic from 6 June 2021 to 16 August 2021.
| 1,663,363 | 1,663,517 | 1,663,607 | 1,663,998 | 1,664,382 | 1,664,649 | 1,664,839 | 1,665,022 |
| 1,665,097 | 1,665,139 | 1,665,327 | 1,665,526 | 1,665,660 | 1,665,818 | 1,665,961 | 1,666,025 |
| 1,666,082 | 1,666,192 | 1,666,325 | 1,666,521 | 1,666,686 | 1,666,821 | 1,666,890 | 1,666,947 |
| 1,667,115 | 1,667,287 | 1,667,435 | 1,667,608 | 1,667,796 | 1,667,935 | 1,668,040 | 1,668,170 |
| 1,668,277 | 1,668,891 | 1,668,891 | 1,669,182 | 1,669,351 | 1,669,496 | 1,669,745 | 1,670,073 |
| 1,670,348 | 1,670,583 | 1,670,823 | 1,671,027 | 1,671,145 | 1,671,372 | 1,671,685 | 1,671,933 |
| 1,672,140 | 1,672,340 | 1,672,409 | 1,672,547 | 1,672,764 | 1,673,017 | 1,673,219 | 1,673,429 |
| 1,673,576 | 1,673,694 | 1,673,769 | 1,673,926 | 1,674,183 | 1,674,410 | 1,674,577 | 1,674,726 |
| 1,674,906 | 1,675,010 | 1,675,179 | 1,675,450 | 1,675,675 | 1,675,868 | 1,676,080 | 1,676,222 |
Publisher’s Note: MDPI stays neutral with regard to jurisdictional claims in published maps and institutional affiliations. |
© 2021 by the authors. Licensee MDPI, Basel, Switzerland. This article is an open access article distributed under the terms and conditions of the Creative Commons Attribution (CC BY) license (https://creativecommons.org/licenses/by/4.0/).
Share and Cite
MDPI and ACS Style
Ding, C.; Liu, W. Analysis and Prediction for Confirmed COVID-19 Cases in Czech Republic with Uncertain Logistic Growth Model. Symmetry 2021, 13, 2264. https://0-doi-org.brum.beds.ac.uk/10.3390/sym13122264
AMA Style
Ding C, Liu W. Analysis and Prediction for Confirmed COVID-19 Cases in Czech Republic with Uncertain Logistic Growth Model. Symmetry. 2021; 13(12):2264. https://0-doi-org.brum.beds.ac.uk/10.3390/sym13122264
Chicago/Turabian StyleDing, Chunxiao, and Wenjian Liu. 2021. "Analysis and Prediction for Confirmed COVID-19 Cases in Czech Republic with Uncertain Logistic Growth Model" Symmetry 13, no. 12: 2264. https://0-doi-org.brum.beds.ac.uk/10.3390/sym13122264
Note that from the first issue of 2016, this journal uses article numbers instead of page numbers. See further details here.