
Assessing Renewable Energy Production Capabilities Using DEA Window and Fuzzy TOPSIS Model


1
Department of Industrial Engineering and Management, National Kaohsiung University of Science and Technology, Kaohsiung 80778, Taiwan
2
Department of Logistics and Supply Chain Management, Hong Bang International University, Ho Chi Minh 723000, Vietnam
3
Department of Electrical Engineering, Technological University of the Philippines Taguig, Taguig 1630, Philippines
4
Department of Mechanical Engineering, National Kaohsiung University of Science and Technology, Kaohsiung 80778, Taiwan
*
Authors to whom correspondence should be addressed.
Symmetry 2021, 13(2), 334; https://0-doi-org.brum.beds.ac.uk/10.3390/sym13020334
Submission received: 2 February 2021
/
Revised: 11 February 2021
/
Accepted: 15 February 2021
/
Published: 18 February 2021
(This article belongs to the Section Computer)
Abstract
:Climate change and air pollution are among the key drivers of energy transition worldwide. The adoption of renewable resources can act as a peacemaker and give stability regarding the damaging effects of fossil fuels challenging public health as well as the tension made between countries in global prices of oil and gas. Understanding the potential and capabilities to produce renewable energy resources is a crucial pre-requisite for countries to utilize them and to scale up clean and stable sources of electricity generation. This paper presents a hybrid methodology that combines the data envelopment analysis (DEA) Window model, and fuzzy technique for order of preference by similarity to ideal solution (FTOPSIS) in order to evaluate the capabilities of 42 countries in terms of renewable energy production potential. Based on three inputs (population, total energy consumption, and total renewable energy capacity) and two outputs (gross domestic product and total energy production), DEA window analysis chose the list of potential countries, including Norway, United Kingdom, Kuwait, Australia, Netherlands, United Arab Emirates, United States, Japan, Colombia, and Italy. Following that, the FTOPSIS model pointed out the top three countries (United States, Japan, and Australia) that have the greatest capabilities in producing renewable energies based on five main criteria, which are available resources, energy security, technological infrastructure, economic stability, and social acceptance. This paper aims to offer an evaluation method for countries to understand their potential of renewable energy production in designing stimulus packages for a cleaner energy future, thereby accelerating sustainable development.
Keywords:
renewable energy; capability; DEA; window model; triangular fuzzy number; TOPSIS; decision making1. Introduction
The burning of fossil fuels, such as coal and oil, which accounts for two-thirds of all greenhouse gases [1], has dramatically increased the carbon dioxide content of the earth’s atmosphere over the last century. As a result, the earth’s surface temperature has risen by 1.14 degrees Celsius since records began in the late 19th century [2]. The effects on the environment, such as more intense heat waves, rising sea levels, and changes in plants and animals, are already being noticeable today. The intergovernmental panel on climate change (IPCC) assumes that climate change will cause considerable economic damage, which could become even worse in the future [3]. The energy sector alone, from generation to consumption, contributes a lot to the exhaustion of greenhouse gases in the air. The electricity demand has grown tremendously, which became the driving force for developed countries to enhance their energy production using any means.
Renewable energies play an important role in mitigating the negative consequences of climate change. For example, analyses by the international renewable energy agency (IRENA) show that 90% of the carbon dioxide reductions are needed to meet nationally agreed climate targets can be achieved through safe, reliable, and affordable strategies using renewable energy and energy efficiency [4]. In doing so, many countries and global organizations have made significant strides towards achieving more sustainable alternatives for energy generation using renewable methods. The development of solar and wind energies has received considerable attention, as their sources are almost inexhaustible and easy to acquire anywhere. Other countries have obtained benefits from having abundant sources of geothermal energy. Some are also exploiting their tidal or wave to generate electricity, yet not many countries can have enough wave power. Aside from these already available sources of renewable energy, other countries are also investigating producing hydrogen fuel as another source of energy, since this can be another cheaper way of energy generation, meanwhile reducing the emission of greenhouse gases [5].
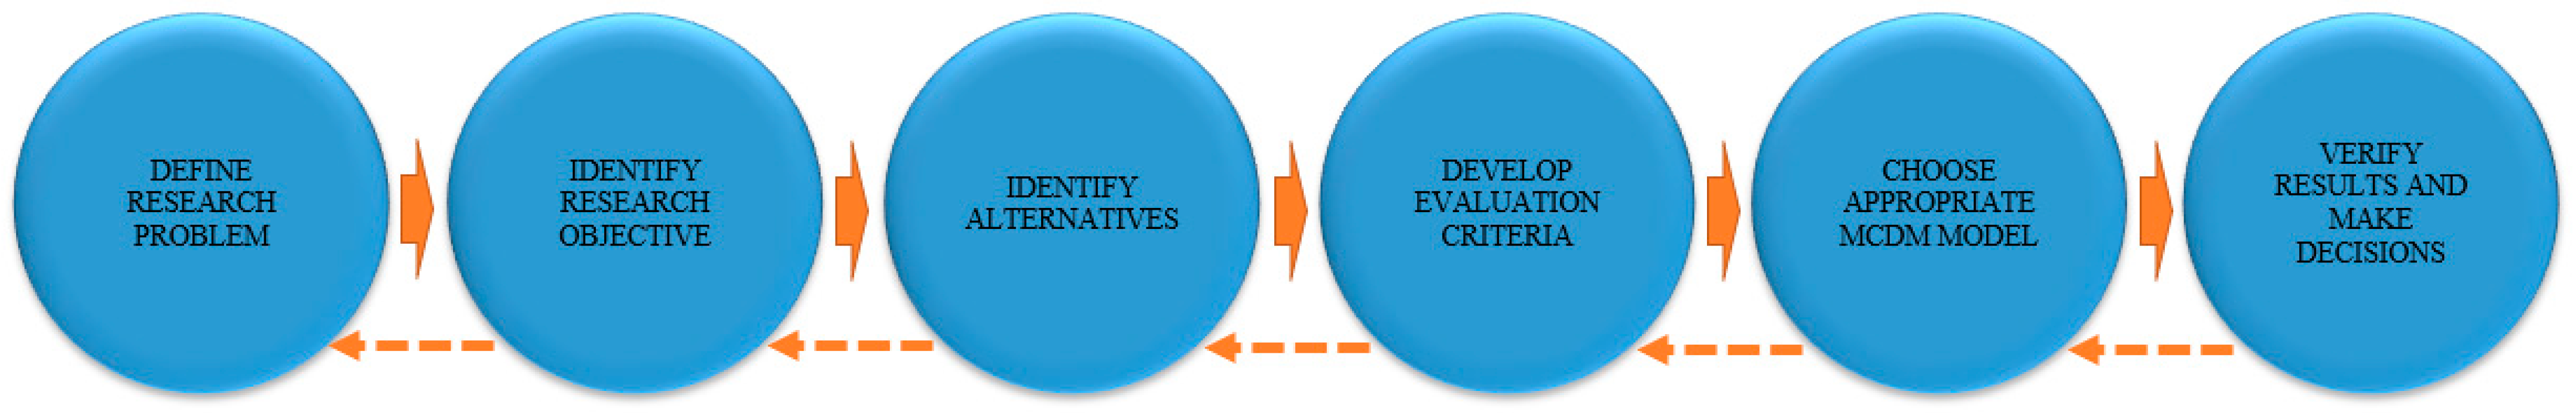
However, it has raised questions regarding how a country can exploit the potential or even determine its capacities in renewable energy production. Many countries are now producing energy using renewable sources, but not everyone is capable of adopting this new trend in energy generation. Thus, for each nation, the evaluation of its potential in producing renewable energies is the pre-requisite step in the ambition of developing renewable energy systems. Simply stated, this assessment process can be regarded as a multiple criteria decision-making (MCDM) problem that requires various inputs and criteria. A general MCDM process model is shown in Figure 1 [6,7]. MCDM methods are often the first choice of researchers to construct evaluation frames in different industries. For renewable energy sector, MCDM techniques are commonly used to evaluate sources, efficiency, technologies, alternatives, projects, and policies, to name a few. For example, Ertay et al. [8] evaluate the renewable energy alternatives for a case study in Turkey, proposing MACBETH and AHP-based multicriteria methods under fuzziness. Considering the selection of suitable renewable energy policy as a significant issue, Mousavi et al. [9] solved two real case studies in developing countries on renewable energy policy selection problem. In this study, ELECTRE was presented under a hesitant fuzzy environment for solving the multi-attribute group decision-making (MAGDM) problems in energy sector. In order to determine the most suitable low-emission energy technologies development in Poland, Ligus and Peternek [10] introduced a hybrid MCDM model based on FAHP and FTOPSIS, considering a number of criteria that are defined from the viewpoint of accomplishment of sustainable development policy goals. In a typical problem of site selection for installing renewable energy plants, Nazari et al. [11] considered four different locations as the primary options for utility scale PV plants installation and the best choice is selected based on a MADM method, TOPSIS. Wang et al. [12] applied the SWOT analysis and fuzzy AHP method to assess the renewable resources of Pakistan.
This study will focus on determining which countries have the most capabilities in producing renewable energy by combining quantitative and qualitative methods of analysis. The quantitative step involves the use of Pearson’s correlation and the Window model of data envelopment analysis (DEA), while the qualitative one will use analysis with the fuzzy technique for order of preference by similarity to ideal solution (FTOPSIS). In detail, the DEA Window model is used for selecting the candidate countries for the period 2010–2019 based on input factors, which are population, total energy consumption, and total renewable energy capacity, while gross domestic product and total energy production are considered to be output factors. Afterward, FTOPSIS is used for ranking all potential countries based on five main criteria, which are available resources, energy security, technological infrastructure, economic stability, and social acceptance. In the FTOPSIS model, the rating of each alternative and the weight of each criterion are identified by linguistic value using triangular fuzzy numbers. The managerial implications of this study enable countries to understand and expedite their potential in renewable energy production at the center of recovery efforts to secure a structural downward trend in carbon emissions and achieve more resilient and sustainable development.
The study focuses on two outlooks, first is the use of this combined MCDM model as an alternative to other methods that are used in the assessment of renewable energy capabilities. These methods have better advantages when compared to others and they will be discussed in the succeeding sections. In this paper, the problem of renewable energy production capability is solved using triangular fuzzy set theory, which is effective in handling qualitative data and uncertainty of experts’ judgment. Thus, it leads to more robust and sustainable results when considering fuzzy conditions than deterministic ones. The second outlook is to provide the countries under studied the analysis on how they perform in terms of renewable energy utilization and through the presence of criteria used, they can assess which aspects they do best and need to be improved.
The second section provides details regarding how previous studies describe the methods and they were used in several applications. The third section describes the materials and methods that will be used. The fourth section will provide data collection, and the results analysis on the output data and determine which of the countries are the most suitable to invest in renewable power generation. Finally, the last section will discuss concluding remarks.
2. Literature Review
Several studies have been conducted in order to evaluate the renewable energy sector while using different methods under various scopes. An example of these studies is from Lee and Zhong [13], in which they are able to construct a composite index that will evaluate the 50 countries’ concerns in investment through measurement of their social, environmental, government, and economic situation, in terms of renewable energy production. With the use of historical data from the year 2004 to 2013, they were able to devise an investment tool that some investors can use for decision making to guide them with their investment opportunities. Another study from Iddrisu and Bhattacharyya [14] focused on the creation of a sustainability index in which this aspect is a common lack to some energy indicators. Capturing the sustainability aspect will improve the measurement tools in evaluating the energy efficiency of many countries; this study finds that the index has a positive correlation to the existing energy development and human development indices. The measurement indices for the evaluation of energy sustainability have been a common interest for some research studies, including one from Cirstea et al. [15], in which they were also able to develop what they called the renewable energy sustainability index. The method was applied to 15 countries in Europe in assessing their weaknesses and strengths in terms of renewable energy production. This index enables policymakers to devise strategic solutions in improving their country’s positive indicators and reduce the effects of the negative factors.
In spite of several measurement indices that are designed to evaluate any energy systems, this may not be sufficient, as this only covers quantitative factors and it may be improved by integrating other methods, such as DEA and TOPSIS. Some other studies were also conducted using some models of DEA, such as the one from Wang et al. [16] in which three DEA models were used (CCR, BCC, and SBM) to evaluate the total factor efficiency of 46 potential solar power plant locations in Vietnam. After which the TOPSIS method was applied for the ranking of the best locations. The combination of these methods made up the multicriteria decision making (MCDM) technique that is commonly used for many types of industries. Another study was also conducted in Turkey by Şengül et al. [17], wherein the authors fuzzified the TOPSIS analysis to rank the best energy supply in the country. The study finds out that the best energy source is hydropower, followed by geothermal, regulator, and wind power. Kaya and Kahraman [18] used the same method and integrated the fuzzy analytical hierarchy process (AHP) in order to provide a quantitative and qualitative evaluation of the different energy systems and removes the uncertainties in the data set. Factors, such as technical, economic, environmental, and social aspects, were highly considered by the experts to provide more comprehensive assessments of several energy supplies such as biomass, hydro, wind, solar, and nuclear.
Based on a generalized framework for multi-criteria method selection, Table 1 summarizes the literature of the proposed methods concerning global renewable energy assessment. Most previous studies have applied DEA and DEA-based modeling approaches, for example, CCR (Charnes–Cooper–Rhodes) [19,20,21,22], Undesirable Output [23,24,25,26,27,28], Malmquist [24,29,30,31], and Window [27]. To define and obtain weights for criteria and sub-criteria in multi-criteria evaluation of renewable energy alternatives, the most commonly used weighting MCDM methods are analytical hierarchy process (AHP)/Fuzzy AHP [19,21,32,33,34] and the technique for order of preference by similarity to ideal solution (TOPSIS)/Fuzzy TOPSIS [20,35,36,37,38]. Some frequently applied methods are bootstrap [22,28,31], stochastic frontier analysis (SFA) [26,39], ordinary least square (OLS) [40,41], regression model [41,42,43], and hybrid approaches [19,20,21,22,24,26,27,28,31,41]. Other recently used multi-criteria decision making (MCDM) methods are visekriterijumska optimizacija i kompromisno resenje (VIKOR) and preference ranking organization method for enrichment of evaluations (PROMETHEE II) [33,44,45,46,47,48,49], and other MCDM approaches [20,21,33,50,51].
In this study, the authors considered the DEA Window analysis and FTOPSIS method based on their advantages and purposes. The DEA Window is capable of measuring the relative technical efficiency of DMUs from one period to another while taking their efficiency performance into consideration. While FTOPSIS can provide a ranking of alternatives based on qualitative criteria. Unlike the ordinary TOPSIS, FTOPSIS operates in the presence of an uncertain environment, which makes the results more robust and specific. The combination of these two methods is suitable for this paper. These methods will be discussed more in the fourth section of this study (i.e., theoretical framework). It is important to note that the objective of the paper is to propose a combined model of DEA Window and Fuzzy TOPSIS in order to come up with reliable efficiency and ranking results. To the best of our knowledge, our paper is the first study to propose an integrated model that combines the Window model of data envelopment analysis (DEA), and fuzzy technique for order of preference by similarity to ideal solution (FTOPSIS), for the evaluation of renewable energy production capabilities of 42 potential countries.
3. Research Process
This paper proposes a hybrid DEA window model and FTOPSIS approach for measuring the capabilities of renewable energy production. Figure 2, depicted the research flow chart, describes how this study will be conducted. The process starts by identifying the goals and objectives while selecting the proper decision-making units (DMUs). This paper considers 42 countries, as DMUs, spreading from America, Europe, Asia, to Africa, which can be highly established and effective in utilizing their renewable energy.
In the first stage, the DEA window model is used to choose lists of candidate potential countries. The input and output factors must be well distinguished, as these factors also have a great influence on the DEA method. Based on the objective of the paper and the list of common input and output factors for renewable energy potential assessments in previous studies (Table 2). This paper considers three inputs (population, total energy consumption, and total renewable energy capacity) and two outputs (gross domestic product, total energy production). A Pearson correlation analysis will be applied to the data to ensure that the values in the input and output factors are consistent with the stochastic requirement of DEA. Additionally, once all of the values are correlated with one another, DEA will proceed. The Window DEA model was chosen to provide the technical efficiency of the DMUs in a certain period. This will enable the author to see whether the DMUs have been efficient or not from one year to another. As to the DEA Window results, the 42 countries will be downlisted to 10 countries. The chosen 10 countries are those that have achieved the highest efficiency scores among the others.
In the second stage, FTOPSIS is used to rank all of the potential countries, which is from DEA Window model. Table 3 lists down the different criteria used by several studies. These criteria are also considered for use in this paper, including the availability of resources, energy security, technological infrastructure, economic stability, and social acceptance. Within the context of energy capability assessments, availability of resources, energy security, and technological infrastructure are traditional key system measurements. Additionally, the focus on sustainable development has increased, so economic stability and social acceptance are quintessential factors in long-term profitability and resilience. The final optimal ranking is suggested according to the shortest geometric distance from the fuzzy positive ideal solution (NPIS) and the longest geometric distance from the fuzzy negative ideal solution (FNIS) values. This method will be able to determine the top three countries that have the greatest capabilities in producing renewable energies.
4. Theoretical Framework
4.1. DEA Window Model
The Pearson is generally used in previous studies, which describes the linear relationship of two factors, where +1 presents a total positive linear, 0 presents no linear, and −1 presents a total negative linear. Isotropic is an essential DEA data assumption. The relationship between the inputs and outputs will be verified before using the DEA model, which means that it should be in a total positive linear relationship. The Pearson correlation index is one of the best statistical tests for estimating the correlation between two factors. The correlation coefficient formula of Pearson’s of two factors a and b is calculated, as seen in Equation (1) [73,74].
where is the sample size; denote the individual sample points that are related to .
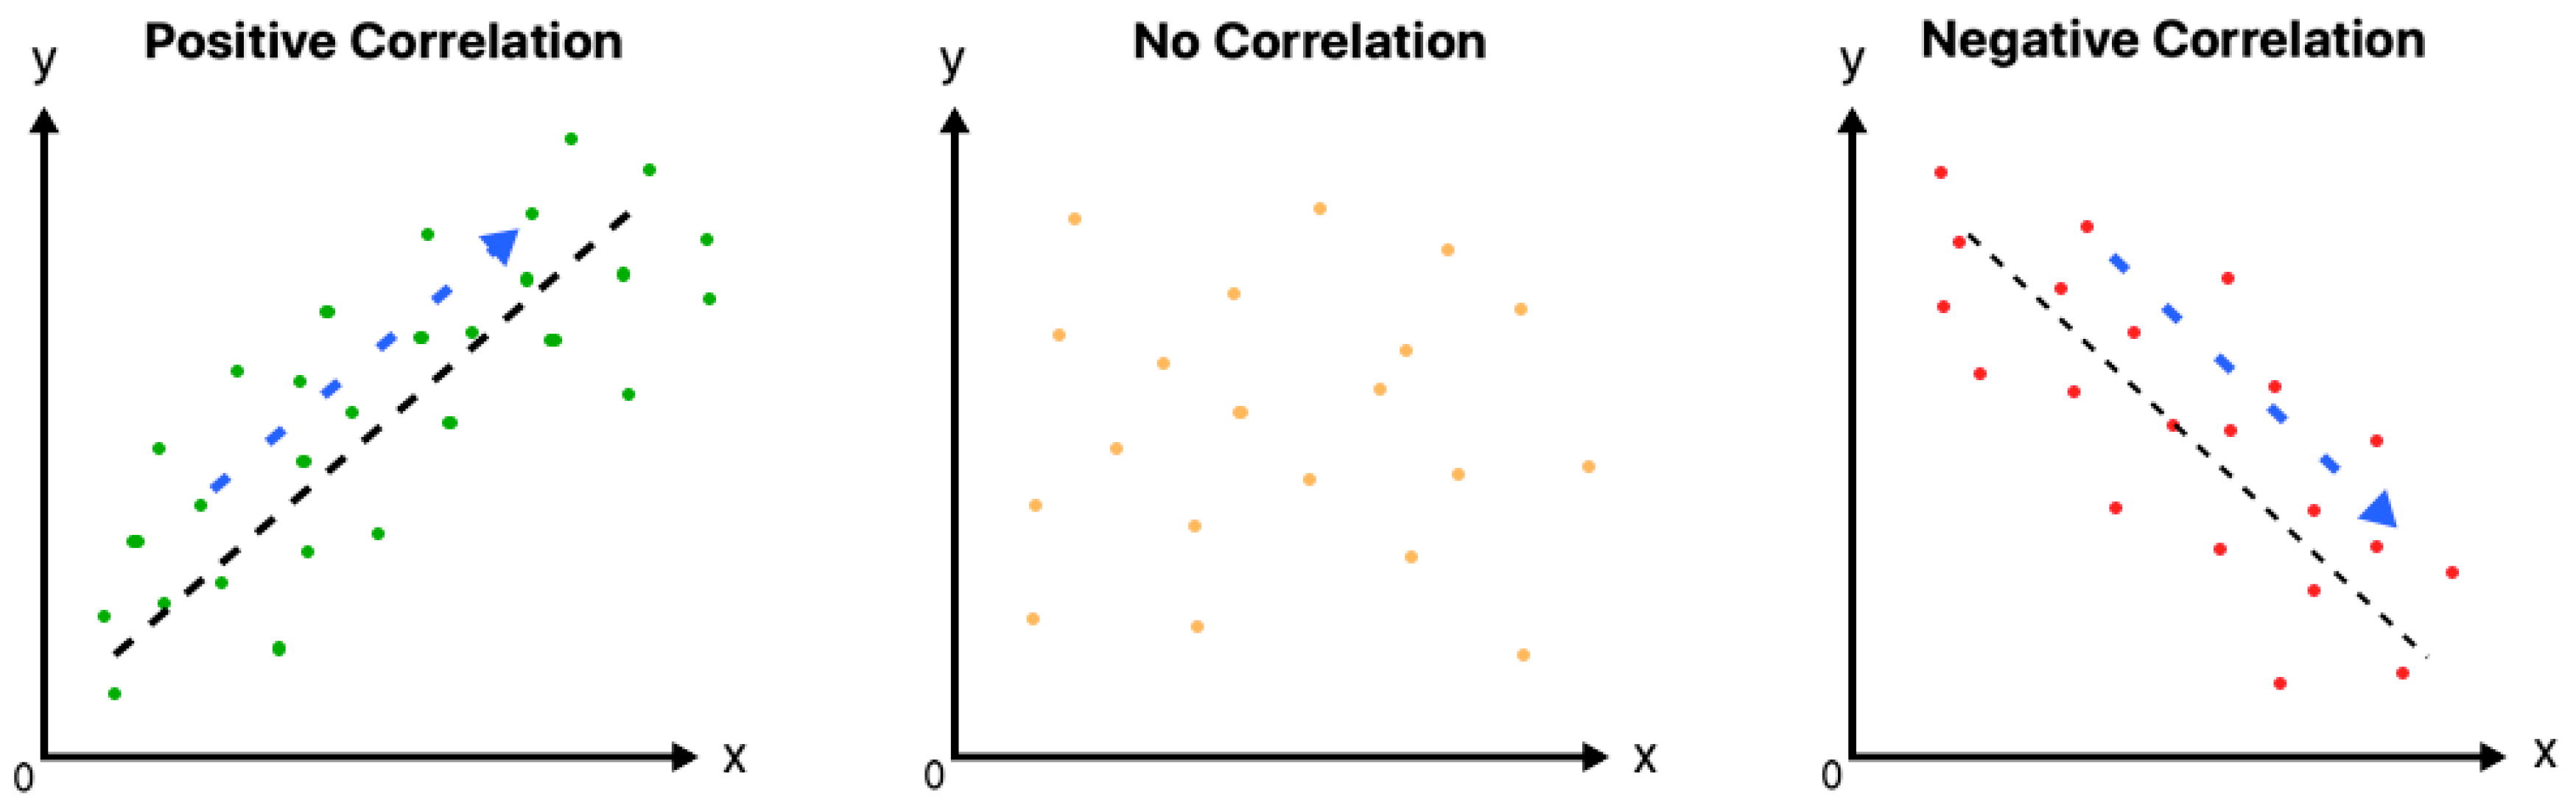
Because the homogeneity and isotonicity are two critical DEA data assumptions, these use the correlation test as an imperative step before using DEA. It is certain that there is an isotonic condition between input and output factors. The input and output data must have a positive correlation (i.e., the closer the value to +1, the better positive linear correlation), as can be seen in Figure 3.
The DEA Window model is nonparametric in the DEA method. It is a useful model to detect the tendency of DMUs over multiple periods with respect to multiple inputs and outputs [75]. The procedures of DEA window mode are presented, as follows.
Assume that the DEA window model has inputs to produce outputs. Let represent the nth DMU with which are observed in period with . Thus, the sample has observations and an observation in period . Subsequently, the input and output vectors of are shown as follows [76].
Equation (2) presents the r-dimensional input vector of .
Equation (3) presents the s-dimensional output vector of .
The window starting at the time and with the width , is denoted by and has observations. Consequently, the matrix of inputs and the outputs of each window are presented, as follows.
The matrix of inputs is presented in Equation (4).
The matrix of outputs is presented in Equation (5).
The input-oriented DEA window model for is solved using a form of linear programming, as can be seen in the mathematical model (6), below.
4.2. Fuzzy TOPSIS Model
Triangular fuzzy number is the basic concept of fuzzy theory to deal with uncertainty environment problems [77]. The fuzzy technique for order preference by similarity to ideal solution (FTOPSIS) was extended from the TOPSIS method for group decision-making under fuzzy environment [78]. Based on the concept of TOPSIS, the optimal result of FTOPSIS is defined by calculating the distance between the fuzzy positive ideal solution (FPIS) and the fuzzy negative ideal solution (FNIS). The procedures of FTOPSIS are presented, as follows.
Step 1: identifying the criteria that significantly affect renewable energy production by a summary of previous literature. Subsequently, decision-makers assess the importance of the criteria using the linguistic weighting value in Table 4.
Step 2: evaluating the ratings of all alternatives (i.e., by decision-makers) with respect to criteria using the linguistic rating value in Table 5.
Step 3: converting the linguistic values into triangular fuzzy numbers in order to obtain the fuzzy weight of criteria by decision-makers and fuzzy rating of alternative with respect to criteria by decision-makers. Subsequently, the fuzzy decision matrix and fuzzy weight are built, as can be seen in Equations (7)–(10).
where , are the linguistic values by using triangular fuzzy number, ; , denote the performance rating and the important weight of decision-makers, respectively, , ; , .
Step 4: building fuzzy normalized decision matrix, as shown in Equations (11)–(15).
where B, C are set of benefit and cost criteria, respectively.
Step 5: building fuzzy weighted normalized decision matrix, Equations (16)–(17).
Step 6: calculating FPIS (the most level) and FNIS (the worst level).
where , , .
Step 7: calculating the distance ( and of each alternative, i.e., distance measurement between two fuzzy numbers.
Step 8: calculating the closeness coefficient of each alternative, as in Equation (20).
Step 9: determining the ranking order of all alternatives. The optimal solution is closer to the FPIS (the most level) and farther from the FNIS (the worst level) as approaches to 1.
5. Results Analysis
5.1. Data Collection
Table 6 shows a list of countries used in the paper. There are 42 countries, including 14 countries in the European Union, four countries in the commonwealth of independent states (CIS), two countries in North America, five countries in Latin America, seven countries in Asia, two countries in the Pacific, four countries in Africa, and four countries in the Middle East. Because of unavailable data, this paper is limited to the number of countries. Hence, there are 42 countries with renewable energy where the related data are collected for the period 2010–2019, from Enerdata [79], IRENA [80], and Worldbank [81]. Table 7 shows descriptive statistics of inputs and outputs. Note that population (PO, unit: million), total energy consumption (TEC, unit: Mtoe), total renewable energy capacity (TREC, unit: MW), gross domestic product (GDP, unit: billion), and total energy production (TEP, unit: Mtoe).
It is very important to check that all of the inputs and outputs must have a positive correlation before applying the DEA model. The Pearson correlation test is applied to check data assumptions (i.e., homogeneity and isotonicity condition). The values of coefficient correlation are always between −1 and +1. Table 8 shows the Pearson correlation index of inputs and outputs. The results indicate that the correlation among these factors is in a positive relationship and significant at the 0.01 level. Hence, the collected data can be used for the DEA window model.
5.2. Results of DEA Window Model
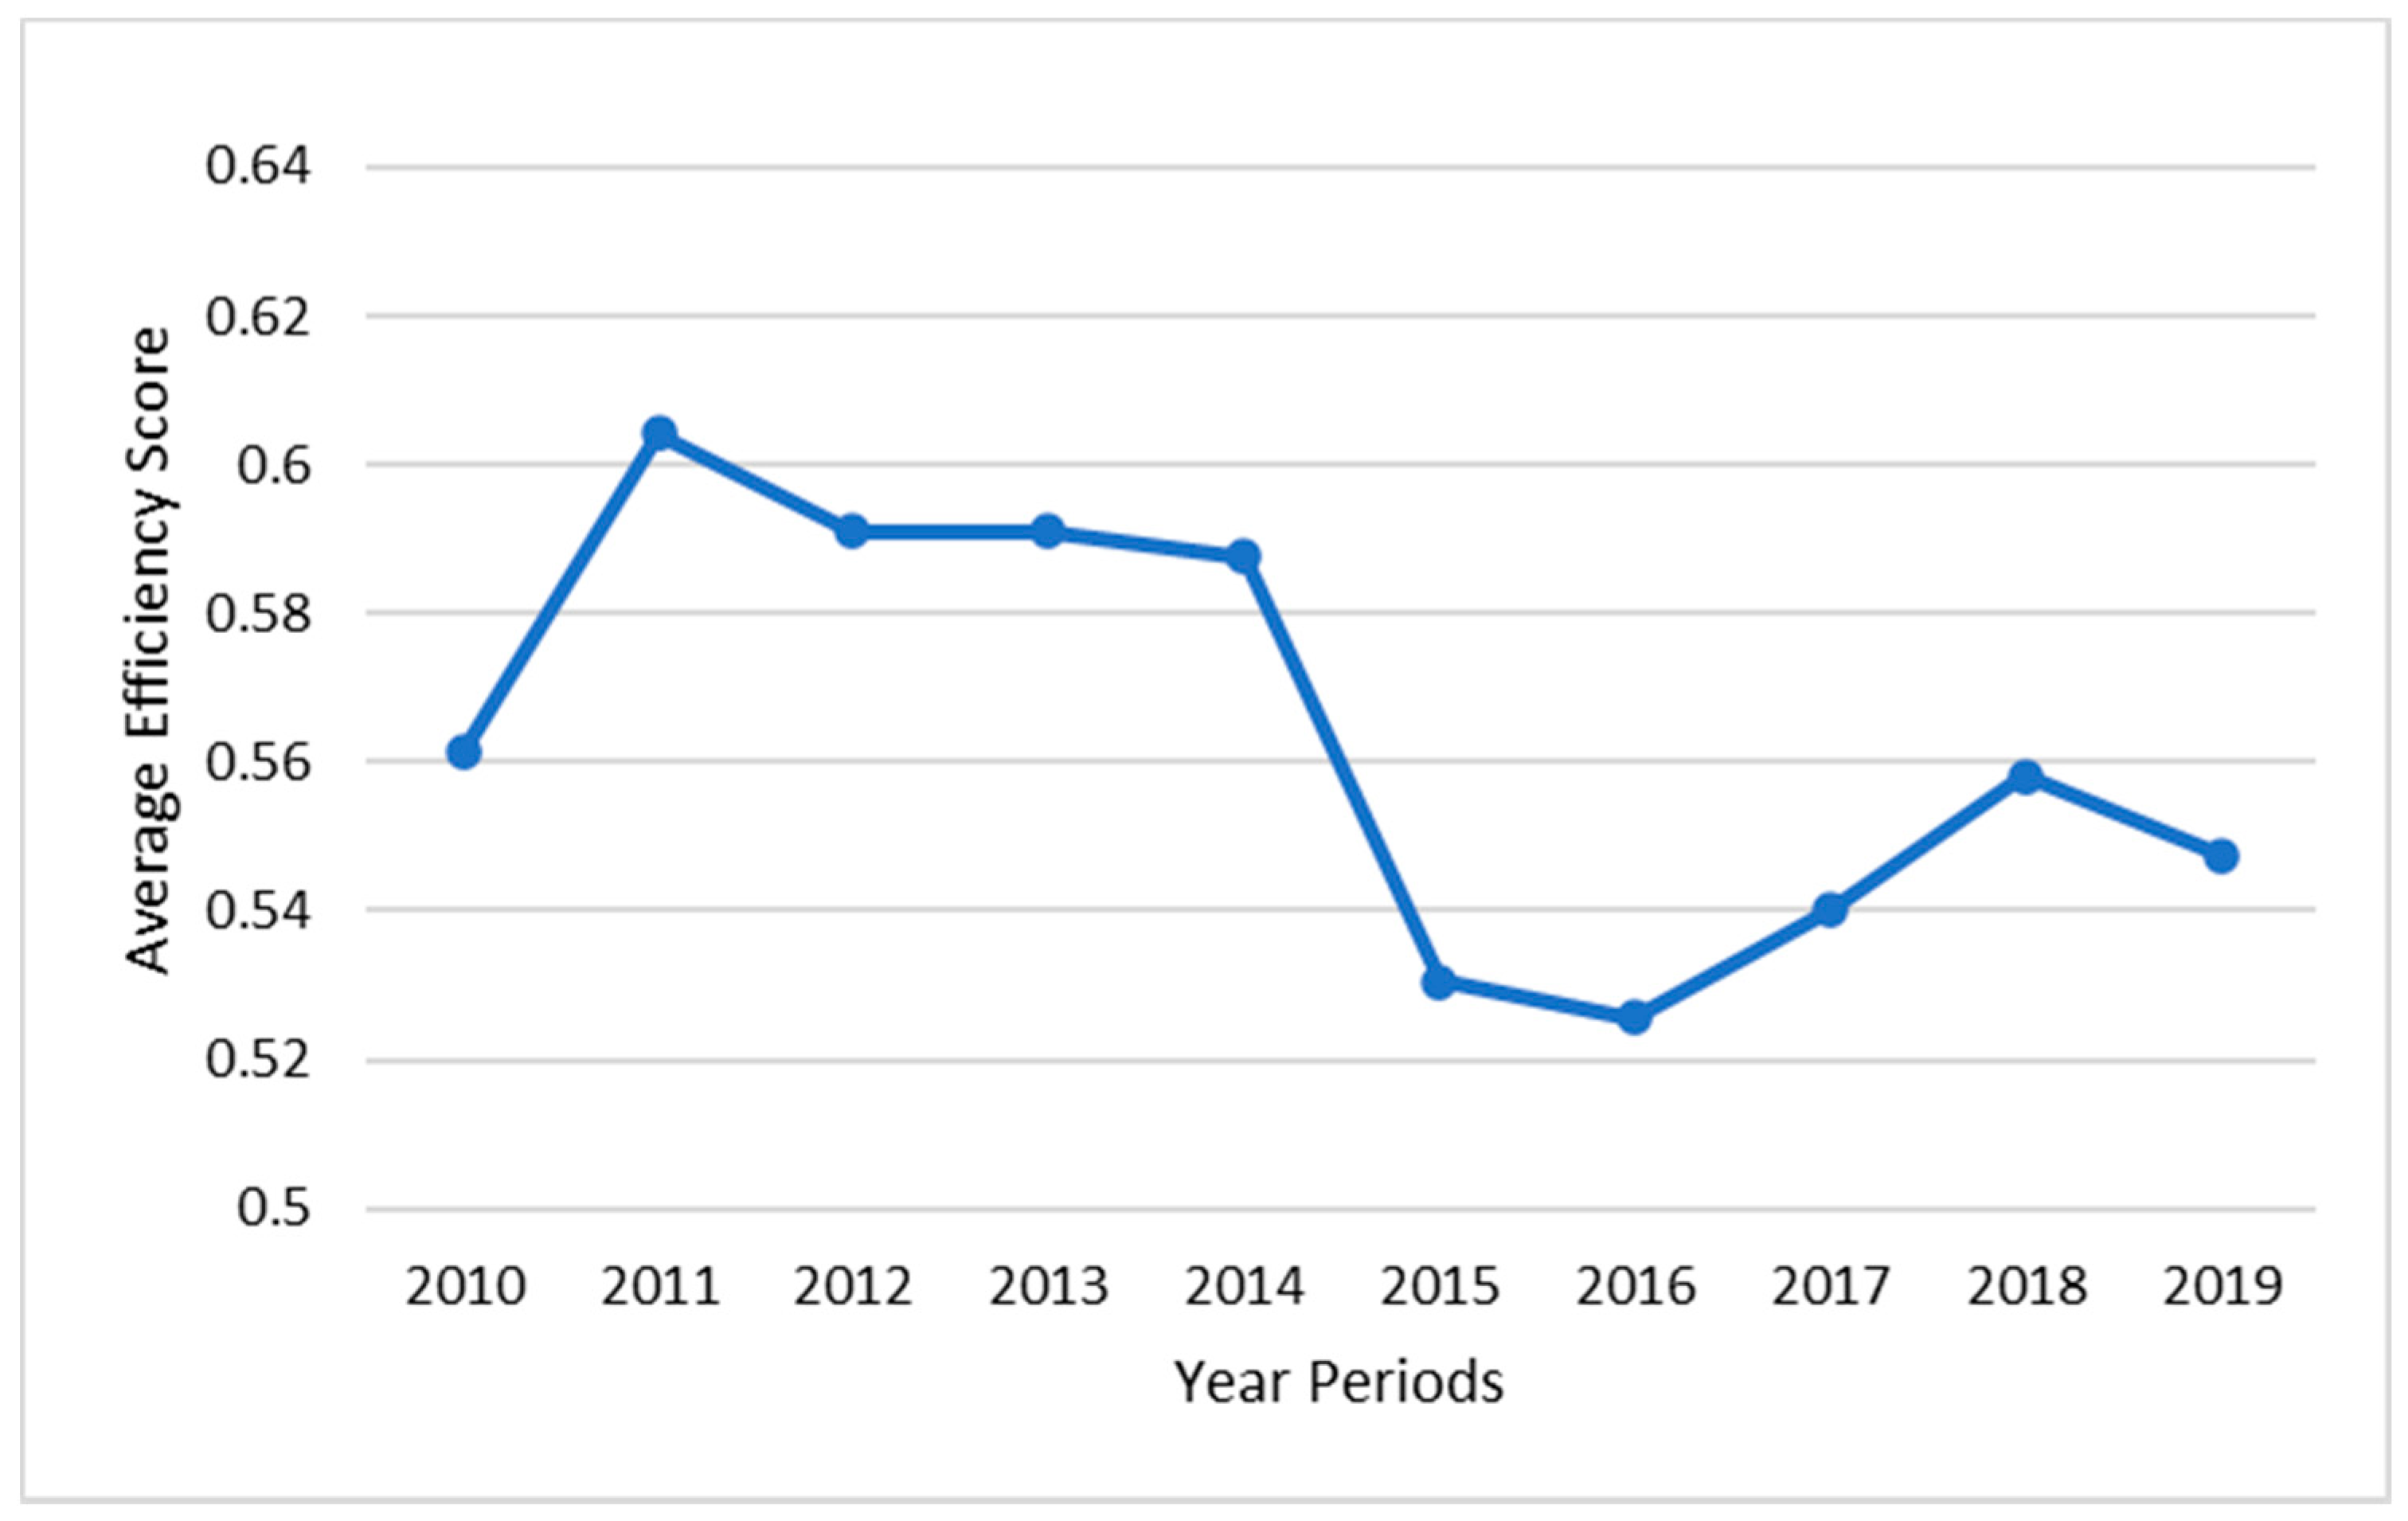
Figure 4 shows the average efficiency score of the whole countries, which significantly fluctuated for the period 2010–2019. From 2010–2011, the average score increased from 0.56 to 0.6 (i.e., the peak value for the whole period). From 2011–2016, the average score continuously decreased. In particular, the average score steadily decreased to 0.59 in 2014, and then dramatically dropped to 0.53 in 2016 (i.e., the bottom value for the whole period). From 2016–2018, the average score began to recover, increased to 0.56 in 2018, and then suddenly dropped to 0.55 in 2019 due to the impact of the Covid-19 crisis on renewable energy systems around the world [82].
In this stage, DEA window model, i.e., a useful model of DEA to detect the tendency of DMUs over multiple periods with respect to multiple inputs and outputs, is used to choose lists of candidate potential countries based on input factors, which are population, total energy consumption, total renewable energy capacity, and output factors, which are gross domestic product and total energy production. Table 9 shows the average efficiency ranking of 42 countries for the whole period 2010–2019. From the results, the top 10 potential countries with high average efficiency score in 2010–2019 are Norway, United Kingdom, Kuwait, Australia, Netherlands, United Arab Emirates, United States, Japan, Colombia, and Italy. These candidate countries are used for ranking in the next stage using FTOPSIS model.
5.3. Results of Fuzzy TOPSIS Model
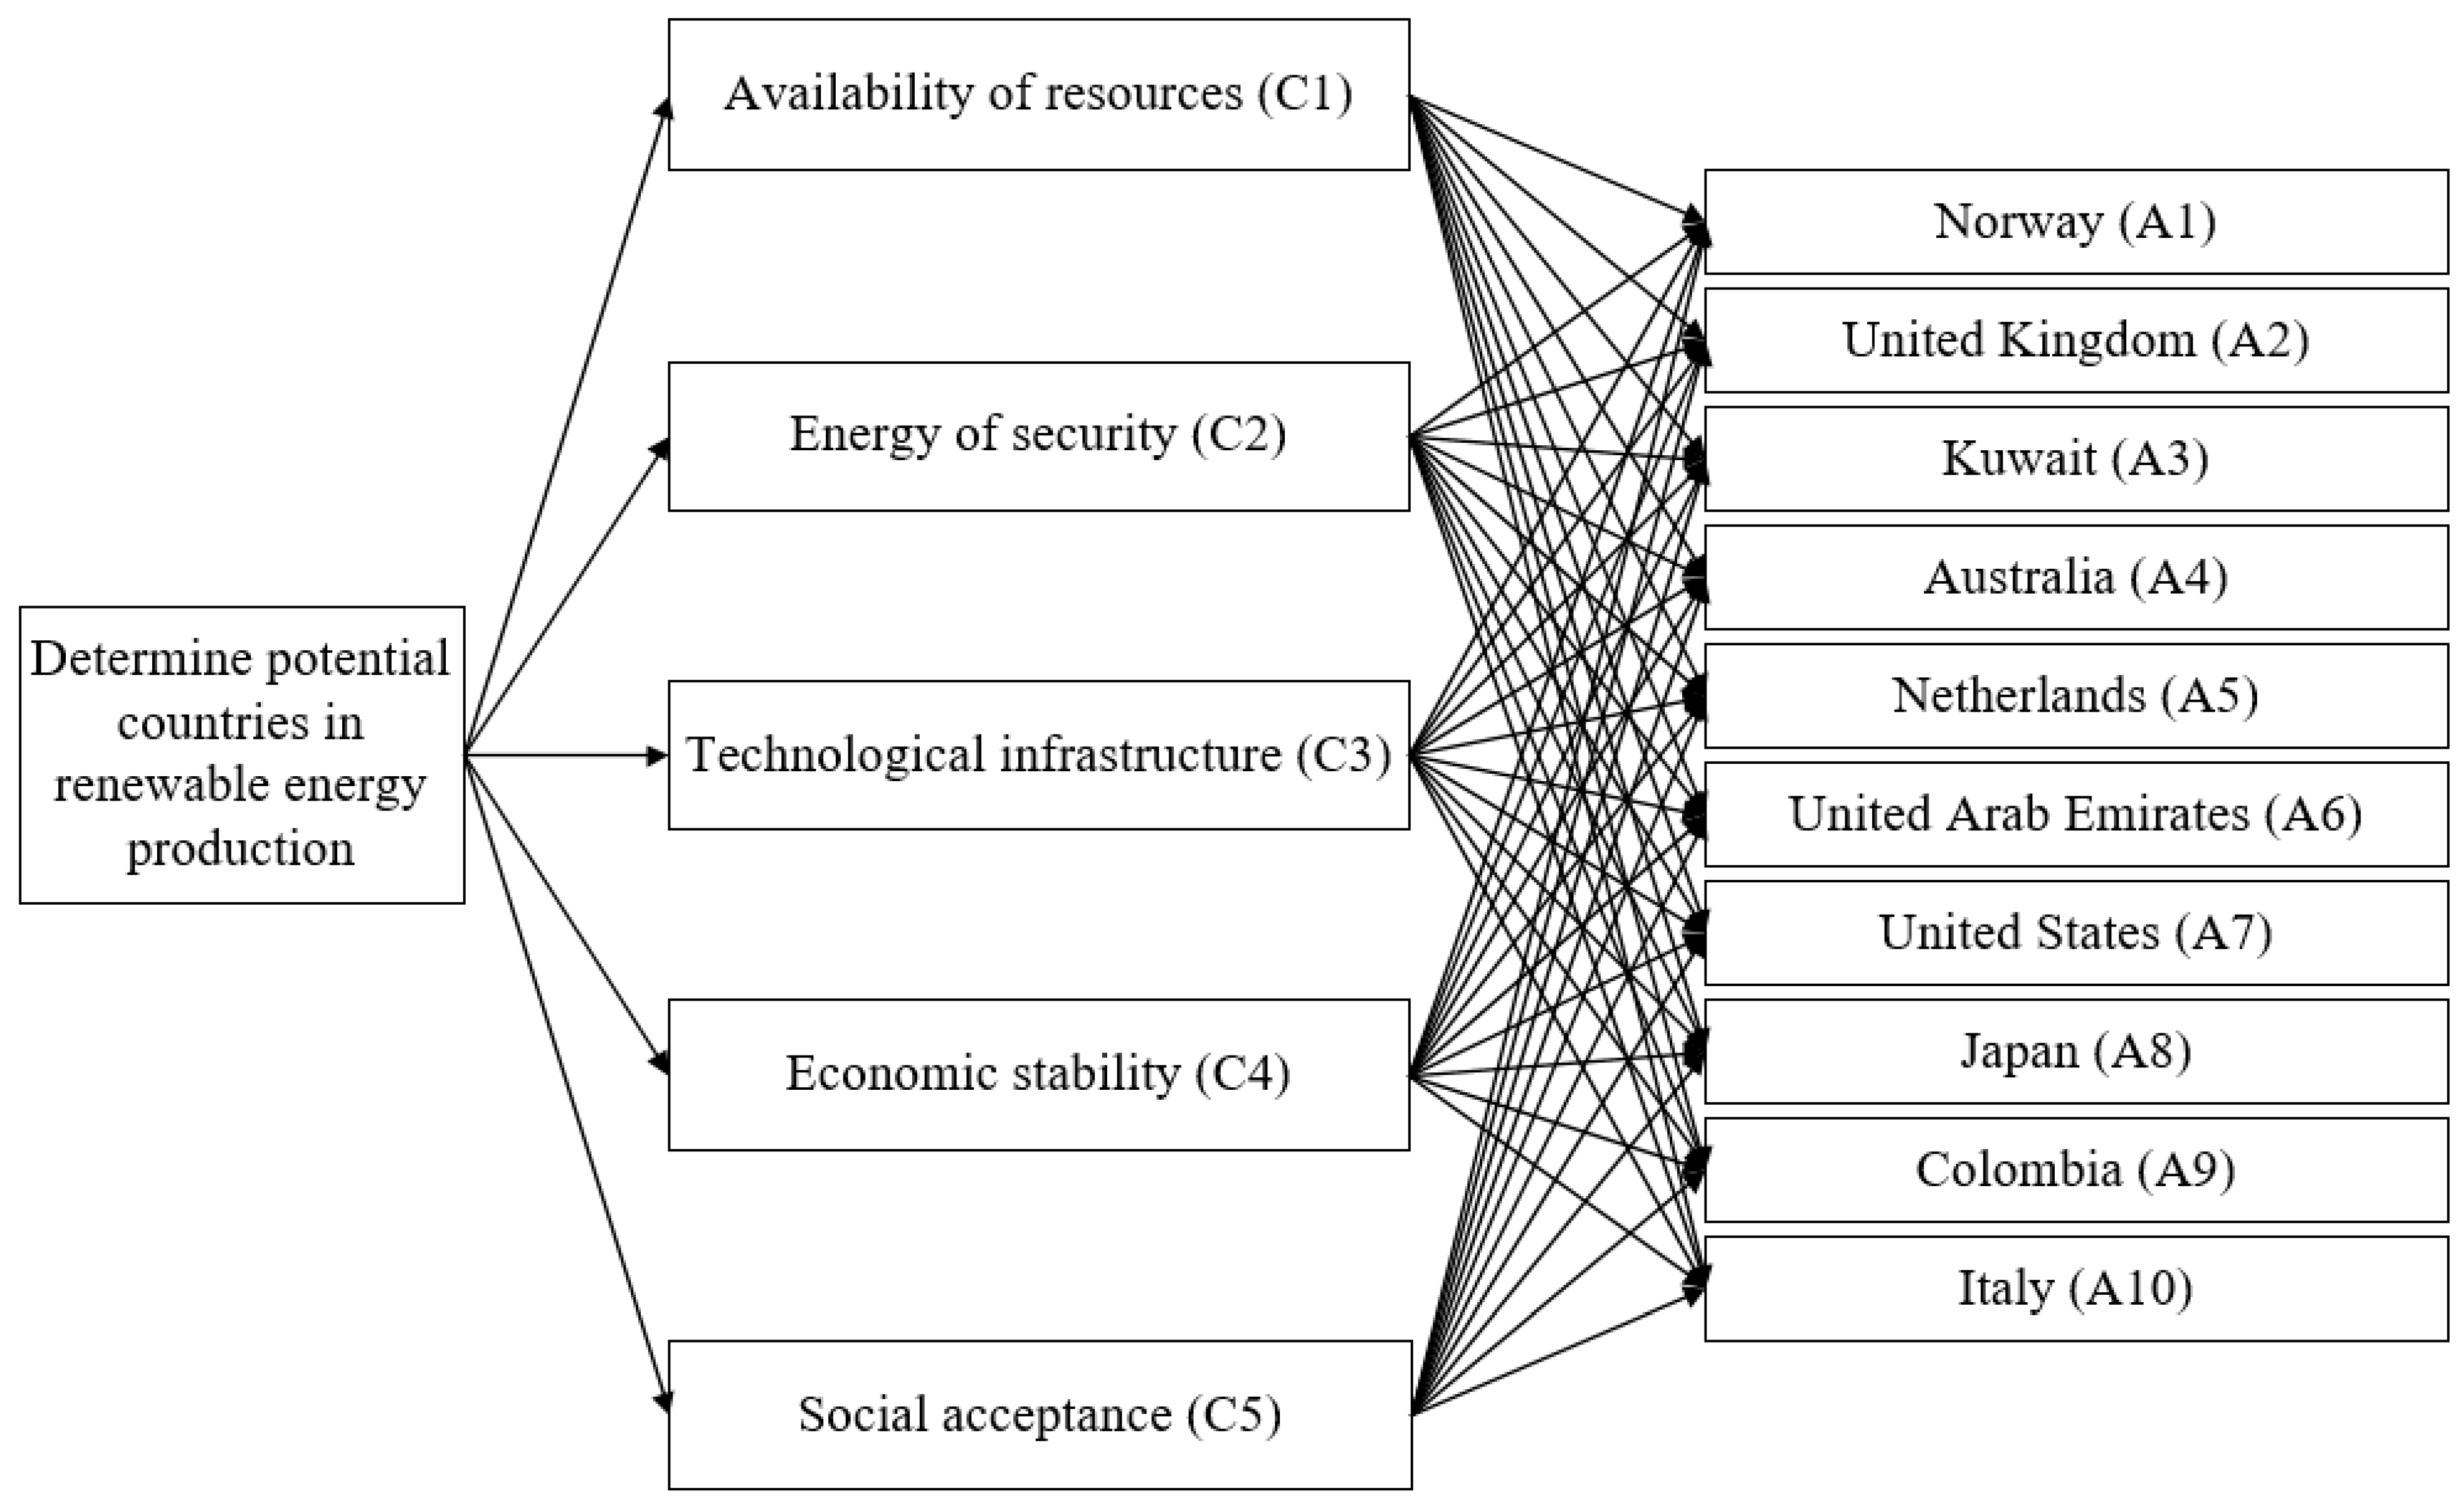
The top 10 potential countries with a higher average technical efficiency in renewable energy production, which were selected from the results of DEA window model, are used for ranking using the FTOPSIS model. In the FTOPSIS model, the final optimal ranking is suggested based on five main criteria, which are available of resources, energy security, technological infrastructure, economic stability, and social acceptance, as can be seen in Figure 5. These five main criteria that significantly affect renewable energy production are selected according to the decision-makers’ experience and relevant studies in the past few decades.
According to the procedures of FTOPSIS, fuzzy decision matrix and fuzzy weights of all alternatives, fuzzy normalized decision matrix, and fuzzy weighted normalized decision matrix are presented in Table 10, Table 11 and Table 12, respectively.
As the final ranking from FTOPSIS model, Table 13 and Figure 6 indicate the top three countries that have the most capabilities in renewable energy production, in which the United States, Japan, and Australia ranked the first, second, and third, with scores of 0.5774, 0.5767, and 0.5714, respectively.
6. Discussions and Conclusions
For an evaluation of renewable energy production potential of 42 countries spreading from America, Europe, Asia, to Africa, this study proposed a hybrid methodology that combines the data envelopment analysis (DEA) Window model, and fuzzy technique for order of preference by similarity to ideal solution (FTOPSIS). In the first stage, the DEA Window model was applied to choose the potential DMUs (countries) for the period 2010–2019 based on input factors, which are population, total energy consumption, and total renewable energy capacity, while gross domestic product and total energy production are considered to be the output factors. Thus, 10 potential countries, including Norway, United Kingdom, Kuwait, Australia, Netherlands, United Arab Emirates, United States, Japan, Colombia, and Italy, were selected. In the next stage, FTOPSIS was used for ranking all potential countries based on five main criteria, which are available resources, energy security, technological infrastructure, economic stability, and social acceptance. In the FTOPSIS model, the rating of each alternative and the weight of each criterion are identified by linguistic value using triangular fuzzy numbers. By doing that, the FTOPSIS model pointed out the top three countries (United States, Japan, and Australia) that have the most capabilities in producing renewable energies.
The generation of renewable energy in the United States reached an all-time high in 2019 of 11.6 billion British thermal units [83]. In another context, Australia continues to lead the world in deploying renewable energy according to a new analysis from The Australian National University (ANU), namely, the per capita roll-out of solar and wind-generated energy contributes to lower greenhouse gas emissions and declining electricity prices [84]. For Japan, the country is known as one of the world’s biggest energy consumers and energy importers, dependent on imports from other countries for almost 96% of its primary energy production. The government recognized the energy supply sensitivity and decided to restructure the diversification of the energy mix, renewable energies, enhancement of energy performance, and reduction of carbon emissions. Different renewable energy technologies are also now being taken into account as substitute sources of energy and promising ways of supplying domestic energy, as well as crucial factors to enhance the reliability of the energy supply [85].
The contributions of the paper are three-fold. (1) This study is the first to propose a hybrid MCDM model that combines the data envelopment analysis (DEA) Window model, and fuzzy technique for order of preference by similarity to ideal solution (FTOPSIS) for the evaluation of renewable energy production potential. (2) The results of this paper provide comprehensive and practical insights for 42 countries around the world to review and investigate their renewable energy potential. Besides mitigating climate change and accelerating sustainable development, renewable energy is also key in the responses to unprecedented crises, such as the Covid-19 pandemic crisis [86]. (3) The authors expect that this study can be used as a useful guideline for countries to evaluate their potential not only in renewable energy, but also in any industries’ development.
For future studies involving quantitative and qualitative approaches, the authors suggest investigating new assessment factors that can impact the production capacities of renewable energy in order to enhance the resolution of the empirical results. The procedure and methods that were introduced by the paper can also be considered to explore the capabilities of many countries in other aspects of energy, such as the use of hydrogen fuel. Implementing these methods will only require tailor fitting the criteria to see whether some countries are in a state of low or high readiness in utilizing earth-friendly and low-cost energy production and consumption. The authors hope that future research regarding renewable energies can be helpful for many countries’ governments and policymakers to assess their current performance in terms of their use of their renewable resources. This paper is also evidence that combining MCDM methods can be a more effective evaluation model. Their results can be compared together to obtain highly accurate results.
Author Contributions
Conceptualization, C.-N.W., T.-T.D. and H.T.; Data curation, T.-T.D. and D.-H.D.; Formal analysis, T.-T.D., H.T. and D.-H.D.; Funding acquisition, C.-N.W.; Investigation, H.T. and D.-H.D.; Methodology, C.-N.W., T.-T.D. and H.T.; Project administration, C.-N.W.; Software, T.-T.D. and D.-H.D.; Validation, C.-N.W. and H.T.; Writing-original draft, T.-T.D. and H.T.; Writing-review and editing, C.-N.W., T.-T.D. and H.T. All authors have read and agreed to the published version of the manuscript.
Funding
This research was partly supported by the National Kaohsiung University of Science and Technology, and MOST 109-2622-E-992-026 from the Ministry of Sciences and Technology in Taiwan.
Institutional Review Board Statement
Not applicable.
Informed Consent Statement
Not applicable.
Data Availability Statement
Not applicable.
Acknowledgments
The authors appreciate the support from the National Kaohsiung University of Science and Technology, Ministry of Sciences and Technology in Taiwan.
Conflicts of Interest
The authors declare no conflict of interest.
References
- IPCC. Climate Change 2014: Synthesis Report. Contribution of Working Groups I, II and III to the Fifth Assessment Report of the Intergovernmental Panel on Climate Change. 2014. Available online: https://www.ipcc.ch/site/assets/uploads/2018/05/SYR_AR5_FINAL_full_wcover.pdf (accessed on 30 January 2021).
- Global Climate Change Indicators. Available online: https://www.ncdc.noaa.gov/monitoring-references/faq/indicators.php (accessed on 30 January 2021).
- IPCC. Climate Change 2013: The Physical Science Basis. Contribution of Working Group I to the Fifth Assessment Report of the Intergovernmental Panel on Climate Change; Stocker, T.F., Qin, D., Plattner, G.-K., Tignor, M., Allen, S.K., Boschung, J., Nauels, A., Xia, Y., Bex, V., Midgley, P.M., Eds.; Cambridge University Press: Cambridge, UK; New York, NY, USA, 2013; p. 1535. [Google Scholar]
- IRENA. Climate Change and Renewable Energy. 2019. Available online: https://www.irena.org/-/media/Files/IRENA/Agency/Publication/2019/Jun/IRENA_G20_climate_sustainability_2019.pdf (accessed on 30 January 2021).
- Amponsah, N.Y.; Troldborg, M.; Kington, B.; Aalders, I.; Hough, R.L. Greenhouse gas emissions from renewable energy sources: A review of lifecycle considerations. Renew. Sustain. Energy Rev. 2014, 39, 461–475. [Google Scholar] [CrossRef]
- Wątróbski, J.; Jankowski, J.; Ziemba, P.; Karczmarczyk, A.; Zioło, M. Generalised framework for multi-criteria method selection. Omega 2019, 86, 107–124. [Google Scholar] [CrossRef]
- MCDA Method Selection Tools. Available online: http://mcda.it/ (accessed on 11 February 2021).
- Ertay, T.; Kahraman, C.; Kaya, İ. Evaluation of renewable energy alternatives using MACBETH and fuzzy AHP multicriteria methods: The case of Turkey. Technol. Econ. Dev. Econ. 2013, 19, 38–62. [Google Scholar] [CrossRef] [Green Version]
- Mousavi, M.; Gitinavard, H.; Mousavi, S.M. A soft computing based-modified ELECTRE model for renewable energy policy selection with unknown information. Renew. Sustain. Energy Rev. 2017, 68, 774–787. [Google Scholar] [CrossRef]
- Ligus, M.; Peternek, P. Determination of most suitable low-emission energy technologies development in Poland using integrated fuzzy AHP-TOPSIS method. Energy Procedia 2018, 153, 101–106. [Google Scholar] [CrossRef]
- Nazari, M.A.; Aslani, A.; Ghasempour, R. Analysis of solar farm site selection based on TOPSIS approach. Int. J. Soc. Ecol. Sustain. Dev. 2018, 9, 12–25. [Google Scholar] [CrossRef]
- Wang, Y.; Xu, L.; Solangi, Y.A. Strategic renewable energy resources selection for Pakistan: Based on SWOT-Fuzzy AHP approach. Sustain. Cities Soc. 2020, 52, 101861. [Google Scholar] [CrossRef]
- Lee, C.W.; Zhong, J. Construction of a responsible investment composite index for renewable energy industry. Renew. Sustain. Energy Rev. 2015, 51, 288–303. [Google Scholar] [CrossRef]
- Iddrisu, I.; Bhattacharyya, S.C. Sustainable energy development index: A multi-dimensional indicator for measuring sustainable energy development. Renew. Sustain. Energy Rev. 2015, 50, 513–530. [Google Scholar] [CrossRef] [Green Version]
- Cîrstea, S.D.; Moldovan-Teselios, C.; Cîrstea, A.; Turcu, A.C.; Darab, C.P. Evaluating renewable energy sustainability by composite index. Sustainability 2018, 10, 811. [Google Scholar] [CrossRef] [Green Version]
- Wang, C.-N.; Nguyen, V.T.; Thai, H.T.N.; Duong, D.H. Multi-criteria decision making (MCDM) Approaches for solar power plant location selection in Vietnam. Energies 2018, 11, 1504. [Google Scholar] [CrossRef] [Green Version]
- Şengül, Ü.; Eren, M.; Shiraz, S.E.; Gezder, V.; Şengül, A.B. Fuzzy TOPSIS method for ranking renewable energy supply systems in Turkey. Renew. Energy 2015, 75, 617–625. [Google Scholar] [CrossRef]
- Kaya, T.; Kahraman, C. Multicriteria decision making in energy planning using a modified fuzzy TOPSIS methodology. Expert Syst. Appl. 2011, 38, 6577–6585. [Google Scholar] [CrossRef]
- Gan, L.; Xu, D.; Hu, L.; Wang, L. Economic feasibility analysis for renewable energy project using an integrated tfn–ahp–DEA approach on the basis of consumer utility. Energies 2017, 10, 2089. [Google Scholar] [CrossRef] [Green Version]
- Li, Y.; Shao, S.; Zhang, F. An analysis of the multi-criteria decision-making problem for distributed energy systems. Energies 2018, 11, 2453. [Google Scholar] [CrossRef] [Green Version]
- Shah, S.A.A. Feasibility study of renewable energy sources for developing the hydrogen economy in Pakistan. Int. J. Hydrog. Energy 2020, 45, 15841–15854. [Google Scholar] [CrossRef]
- Jebali, E.; Essid, H.; Khraief, N. The analysis of energy efficiency of the Mediterranean countries: A two-stage double bootstrap DEA approach. Energy 2017, 134, 991–1000. [Google Scholar] [CrossRef]
- Zofío, J.L.; Prieto, A.M. Environmental efficiency and regulatory standards: The case of CO2 emissions from OECD industries. Resour. Energy Econ. 2001, 23, 63–83. [Google Scholar] [CrossRef]
- Xie, B.-C.; Shang, L.-F.; Yang, S.-B.; Yi, B.-W. Dynamic environmental efficiency evaluation of electric power industries: Evidence from OECD (Organization for Economic Cooperation and Development) and BRIC (Brazil, Russia, India and China) countries. Energy 2014, 74, 147–157. [Google Scholar] [CrossRef]
- Lee, T.; Yeo, G.T.; Thai, V.V. Environmental efficiency analysis of port cities: Slacks-based measure data envelopment analysis ap-proach. Transp. Policy 2014, 33, 82–88. [Google Scholar] [CrossRef]
- Robaina-Alves, M.; Moutinho, V.; Macedo, P. A new frontier approach to model the eco-efficiency in European countries. J. Clean. Prod. 2015, 103, 562–573. [Google Scholar] [CrossRef] [Green Version]
- Moutinho, V.; Fuinhas, J.A.; Marques, A.C.; Santiago, R. Assessing eco-efficiency through the DEA analysis and decoupling index in the Latin America countries. J. Clean. Prod. 2018, 205, 512–524. [Google Scholar] [CrossRef]
- Halkos, G.; Petrou, K.N. Assessing 28 EU member states’ environmental efficiency in national waste generation with DEA. J. Clean. Prod. 2019, 208, 509–521. [Google Scholar] [CrossRef]
- Mavi, N.K.; Mavi, R.K. Energy and environmental efficiency of OECD countries in the context of the circular economy: Common weight analysis for malmquist productivity index. J. Environ. Manag. 2019, 247, 651–661. [Google Scholar] [CrossRef]
- Woo, C.; Chung, Y.; Chun, D.; Seo, H.; Hong, S. The static and dynamic environmental efficiency of renewable energy: A Malmquist index analysis of OECD countries. Renew. Sustain. Energy Rev. 2015, 47, 367–376. [Google Scholar] [CrossRef]
- Zhang, N.; Zhou, P.; Kung, C.-C. Total-factor carbon emission performance of the Chinese transportation industry: A bootstrapped non-radial Malmquist index analysis. Renew. Sustain. Energy Rev. 2015, 41, 584–593. [Google Scholar] [CrossRef]
- Mirjat, N.H.; Uqaili, M.A.; Harijan, K.; Mustafa, M.W.; Rahman, M.; Khan, M.W.A. Multi-criteria analysis of electricity generation scenarios for sustainable energy planning in Pakistan. Energies 2018, 11, 757. [Google Scholar] [CrossRef] [Green Version]
- Seddiki, M.; Bennadji, A. Multi-criteria evaluation of renewable energy alternatives for electricity generation in a residential building. Renew. Sustain. Energy Rev. 2019, 110, 101–117. [Google Scholar] [CrossRef]
- Mastrocinque, E.; Ramírez, F.J.; Honrubia-Escribano, A.; Pham, D.T. An AHP-based multi-criteria model for sustainable supply chain development in the renewable energy sector. Expert Syst. Appl. 2020, 150, 113321. [Google Scholar] [CrossRef]
- Siksnelyte, I.; Zavadskas, E.K. Achievements of the European Union countries in seeking a sustainable electricity sector. Energies 2019, 12, 2254. [Google Scholar] [CrossRef] [Green Version]
- Serrano-Gomez, L.; Munoz-Hernandez, J.I. Monte Carlo approach to fuzzy AHP risk analysis in renewable energy construction projects. PLoS ONE 2019, 14, e0215943. [Google Scholar] [CrossRef] [Green Version]
- Babatunde, O.M.; Munda, J.L.; Hamam, Y. Selection of a hybrid renewable energy systems for a low-income household. Sustainability 2019, 11, 4282. [Google Scholar] [CrossRef] [Green Version]
- Rani, P.; Mishra, A.R.; Mardani, A.; Cavallaro, F.; Alrasheedi, M.; AlRashidi, A. A novel approach to extended fuzzy TOPSIS based on new divergence measures for renewable energy sources selection. J. Clean. Prod. 2020, 257, 120352. [Google Scholar] [CrossRef]
- Wang, D.; Wan, K.; Yang, J. Measurement and evolution of eco-efficiency of coal industry ecosystem in China. J. Clean. Prod. 2019, 209, 803–818. [Google Scholar] [CrossRef]
- Cicea, C.; Marinescu, C.; Popa, I.; Dobrin, C. Environmental efficiency of investments in renewable energy: Comparative analysis at macroeconomic level. Renew. Sustain. Energy Rev. 2014, 30, 555–564. [Google Scholar] [CrossRef]
- Moutinho, V.; Madaleno, M.; Robaina, M. The economic and environmental efficiency assessment in EU cross-country: Evidence from DEA and quantile regression approach. Ecol. Indic. 2017, 78, 85–97. [Google Scholar] [CrossRef]
- Chien, T.; Hu, J.-L. Renewable energy and macroeconomic efficiency of OECD and non-OECD economies. Energy Policy 2007, 35, 3606–3615. [Google Scholar] [CrossRef]
- Anwar, A.; Siddique, M.; Dogan, E.; Sharif, A. The moderating role of renewable and non-renewable energy in environment-income nexus for ASEAN countries: Evidence from Method of Moments Quantile Regression. Renew. Energy 2021, 164, 956–967. [Google Scholar] [CrossRef]
- Kaya, T.; Kahraman, C. Multicriteria renewable energy planning using an integrated fuzzy VIKOR & AHP methodology: The case of Istanbul. Energy 2010, 35, 2517–2527. [Google Scholar] [CrossRef]
- Debbarma, B.; Chakraborti, P.; Bose, P.K.; Deb, M.; Banerjee, R. Exploration of PROMETHEE II and VIKOR methodology in a MCDM approach for ascertaining the optimal performance-emission trade-off vantage in a hydrogen-biohol dual fuel endeavour. Fuel 2017, 210, 922–935. [Google Scholar] [CrossRef]
- Andreopoulou, Z.; Koliouska, C.; Galariotis, E.; Zopounidis, C. Renewable energy sources: Using PROMETHEE II for ranking websites to support market opportunities. Technol. Forecast. Soc. Chang. 2018, 131, 31–37. [Google Scholar] [CrossRef]
- Wu, Y.; Zhang, T.; Yi, L. An internal type-2 trapezoidal fuzzy sets-Promethee-II based investment decision framework of compressed air energy storage project in china under the perspective of different investors. J. Energy Storage 2020, 30, 101548. [Google Scholar] [CrossRef]
- Zheng, G.; Wang, X. The comprehensive evaluation of renewable energy system schemes in tourist resorts based on VIKOR method. Energy 2020, 193, 116676. [Google Scholar] [CrossRef]
- Guleria, A.; Bajaj, R.K. A robust decision making approach for hydrogen power plant site selection utilizing (R, S)-Norm Pythagorean Fuzzy information measures based on VIKOR and TOPSIS method. Int. J. Hydrog. Energy 2020, 45, 18802–18816. [Google Scholar] [CrossRef]
- Alkan, Ö.; Albayrak, Ö.K. Ranking of renewable energy sources for regions in Turkey by fuzzy entropy based fuzzy COPRAS and fuzzy MULTIMOORA. Renew. Energy 2020, 162, 712–726. [Google Scholar] [CrossRef]
- Yücenur, G.N.; Çaylak, Ş.; Gönül, G.; Postalcıoğlu, M. An integrated solution with SWARA&COPRAS methods in renewable energy production: City selection for biogas facility. Renew. Energy 2020, 145, 2587–2597. [Google Scholar]
- Zhou, P.; Ang, B.; Poh, K. Slacks-based efficiency measures for modeling environmental performance. Ecol. Econ. 2006, 60, 111–118. [Google Scholar] [CrossRef]
- Choi, Y.; Zhang, N.; Zhou, P. Efficiency and abatement costs of energy-related CO2 emissions in China: A slacks-based efficiency measure. Appl. Energy 2012, 98, 198–208. [Google Scholar] [CrossRef]
- Uyan, M. GIS-based solar farms site selection using analytic hierarchy process (AHP) in Karapinar region, Konya/Turkey. Renew. Sustain. Energy Rev. 2013, 28, 11–17. [Google Scholar] [CrossRef]
- Carrión, J.A.; Estrella, A.E.; Dols, F.A.; Ridao, A.R. The electricity production capacity of photovoltaic power plants and the selection of solar energy sites in Andalusia (Spain). Renew. Energy 2008, 33, 545–552. [Google Scholar] [CrossRef]
- Sabo, M.L.; Mariun, N.; Hizam, H.; Radzi, M.A.M.; Zakaria, A. Spatial matching of large-scale grid-connected photovoltaic power generation with utility demand in Peninsular Malaysia. Appl. Energy 2017, 191, 663–688. [Google Scholar] [CrossRef]
- Idris, R.; Latif, Z.A. GIS multi-criteria for power plant site selection. In Proceedings of the 2012 IEEE Control and System Graduate Research Colloquium, Shah Alam, Malaysia, 16–17 July 2012; pp. 203–206. [Google Scholar]
- Massimo, A.; Dell’Isola, M.; Frattolillo, A.; Ficco, G. Development of a geographical information system (GIS) For the integration of solar energy in the energy planning of a wide area. Sustainability 2014, 6, 5730–5744. [Google Scholar] [CrossRef] [Green Version]
- Chamanehpour, E.; Akbarpour, A. Site selection of wind power plant using multi-criteria decision-making methods in GIS: A case study. Comput. Ecol. Softw. 2017, 7, 49–64. [Google Scholar]
- Augutis, J.; Martisauskas, L.; Krikštolaitis, R.; Augutienė, E. Impact of the renewable energy sources on the energy security. Energy Procedia 2014, 61, 945–948. [Google Scholar] [CrossRef] [Green Version]
- Bekhrad, K.; Aslani, A.; Mazzuca-Sobczuk, T. Energy security in Andalusia: The role of renewable energy sources. Case Stud. Chem. Environ. Eng. 2020, 1, 100001. [Google Scholar] [CrossRef]
- Wang, B.; Wang, Q.; Wei, Y.-M.; Li, Z.-P. Role of renewable energy in China’s energy security and climate change mitigation: An index decomposition analysis. Renew. Sustain. Energy Rev. 2018, 90, 187–194. [Google Scholar] [CrossRef]
- Hamed, T.A.; Bressler, L. Energy security in Israel and Jordan: The role of renewable energy sources. Renew. Energy 2019, 135, 378–389. [Google Scholar] [CrossRef]
- Lucas, J.N.V.; Francés, G.E.; González, E.S.M. Energy security and renewable energy deployment in the EU: Liaisons dangereuses or virtuous circle? Renew. Sustain. Energy Rev. 2016, 62, 1032–1046. [Google Scholar] [CrossRef]
- Ozdemir, S.; Sahin, G. Multi-criteria decision-making in the location selection for a solar PV power plant using AHP. Measurement 2018, 129, 218–226. [Google Scholar] [CrossRef]
- Demirel, T.; Yalcinn, U. Multi-criteria wind power plant location selection using fuzzy AHP. In Proceedings of the 8th International FLINS Conference, Madrid, Spain, 21–24 September 2008. [Google Scholar]
- Toklu, M.G.; Uygun, Ö. Location selection for wind plant using AHP and axiomatic design in fuzzy environment. Period. Eng. Nat. Sci. 2018, 6, 120–128. [Google Scholar]
- Kengpol, A.; Rontlaong, P.; Tuominen, M. Design of a decision support system for site selection using fuzzy AHP: A case study of solar power plant in north eastern parts of Thailand. In Proceedings of the PICMET12: Technology Management for Emerging Technologies, Vancouver, BC, Canada, 29 July–2 August 2012. [Google Scholar]
- Wang, C.-N.; Hsueh, M.-H.; Lin, D.-F. Hydrogen power plant site selection under fuzzy multicriteria decision-making (FMCDM) environment conditions. Symmetry 2019, 11, 596. [Google Scholar] [CrossRef] [Green Version]
- Talinli, I.; Topuz, E.; Aydin, E.; Kabakcı, S.B. A Holistic Approach for Wind Farm Site Selection by FAHP. IntechOpen. Available online: https://www.researchgate.net/publication/221912736_A_Holistic_Approach_for_Wind_Farm_Site_Selection_by_Using_FAHP (accessed on 30 January 2021).
- Wüstenhagen, R.; Wolsink, M.; Bürer, M.J. Social acceptance of renewable energy innovation: An introduction to the concept. Energy Policy 2007, 35, 2683–2691. [Google Scholar] [CrossRef] [Green Version]
- Paletto, A.; Bernardi, S.; Pieratti, E.; Teston, F.; Romagnoli, M. Assessment of environmental impact of biomass power plants to increase the social acceptance of renewable energy technologies. Heliyon 2019, 5, e02070. [Google Scholar] [CrossRef] [Green Version]
- Wang, C.-N.; Dang, T.-T.; Nguyen, N.-A.-T.; Le, T.-T.-H. Supporting better decision-making: A combined grey model and data envelopment analysis for efficiency evaluation in e-commerce marketplaces. Sustainability 2020, 12, 10385. [Google Scholar] [CrossRef]
- Wang, C.-N.; Nguyen, T.-L.; Dang, T.-T. Analyzing operational efficiency in real estate companies: An application of GM (1,1) And DEA malmquist model. Mathematics 2021, 9, 202. [Google Scholar] [CrossRef]
- Chung, S.-H.; Lee, A.H.-I.; Kang, H.-Y.; Lai, C.-W. A DEA window analysis on the product family mix selection for a semiconductor fabricator. Expert Syst. Appl. 2008, 35, 379–388. [Google Scholar] [CrossRef]
- Yue, P. Data envelopment analysis and commercial bank performance: A primer with applications to Missouri banks. Review 1992, 74. [Google Scholar] [CrossRef] [Green Version]
- Wang, C.-N.; Viet, V.T.H.; Ho, T.P.; Nguyen, V.T.; Nguyen, V.T. Multi-criteria decision model for the selection of suppliers in the textile industry. Symmetry 2020, 12, 979. [Google Scholar] [CrossRef]
- Chen, C.-T. Extensions of the TOPSIS for group decision-making under fuzzy environment. Fuzzy Sets Syst. 2000, 114, 1–9. [Google Scholar] [CrossRef]
- Global Energy Statistical Yearbook 2020. Available online: https://yearbook.enerdata.net/ (accessed on 12 January 2021).
- IRENA-International Renewable Energy Agency. 2020. Available online: https://www.irena.org/ (accessed on 12 January 2021).
- The Workbank Database. Available online: https://databank.worldbank.org/home.aspx (accessed on 12 January 2021).
- Covid-19: The Impact on Renewable Energy. Available online: https://energyeconomicgrowth.org/blog/covid-19-impact-renewable-energy (accessed on 30 January 2021).
- Renewable Energy Production and Consumption in the United States from 1975 to 2020. Available online: https://0-www-statista-com.brum.beds.ac.uk/statistics/224747/renewable-energy-production-and-consumption-in-the-us (accessed on 30 January 2021).
- Australia Leading the World in Deploying Renewable Energy. Available online: https://www.anu.edu.au/news/all-news/australia-leading-the-world-in-deploying-renewable-energy (accessed on 30 January 2021).
- Zhu, D.; Mortazavi, S.M.; Maleki, A.; Aslani, A.; Yousefi, H. Analysis of the robustness of energy supply in Japan: Role of renewable energy. Energy Rep. 2020, 6, 378–391. [Google Scholar] [CrossRef]
- Covid-19 Crisis Reinforces the Importance of the Sustainable Energy Transition. Available online: https://www.unescap.org/blog/covid-19-crisis-reinforces-importance-sustainable-energy-transition (accessed on 30 January 2021).

Figure 2.
Research process.

Figure 3.
Linear correlation diagrams.

Figure 4.
The average efficiency score for the period 2010–2019.

Figure 5.
The hierarchical tree of FTOPSIS model.

Figure 6.
Final ranking order of FTOPSIS model.


Table 1.
Summary of application studies in renewable energy evaluation.
| Authors [Citation] | Year | CCR | Undesirable Output | Malmquist | Window | Bootstrap | SFA | OLS | Regression Model | (Fuzzy) AHP | (Fuzzy) TOPSIS | (Fuzzy) VIKOR | (Fuzzy) PROMETHEE II | Other (fuzzy) MCDM |
|---|---|---|---|---|---|---|---|---|---|---|---|---|---|---|
| Zofío and Prieto [23] | 2001 | x | ||||||||||||
| Chien and Hu [42] | 2007 | x | ||||||||||||
| Kaya and Kahraman [44] | 2010 | x | x | |||||||||||
| Xie et al. [24] | 2014 | x | x | |||||||||||
| Cicea et al. [40] | 2014 | x | ||||||||||||
| Lee et al. [25] | 2014 | x | ||||||||||||
| Robaina-Alves et al. [26] | 2015 | x | x | |||||||||||
| Woo et al. [30] | 2015 | x | ||||||||||||
| Zhang et al. [31] | 2015 | x | x | |||||||||||
| Moutinho et al. [41] | 2017 | x | x | |||||||||||
| Gan et al. [19] | 2017 | x | x | |||||||||||
| Jebali et al. [22] | 2017 | x | x | |||||||||||
| Debbarma et al. [45] | 2017 | x | x | x | ||||||||||
| Moutinho et al. [27] | 2018 | x | x | |||||||||||
| Li et al. [20] | 2018 | x | x | x | ||||||||||
| Hussain Mirjat et al. [32] | 2018 | x | ||||||||||||
| Andreopoulou et al. [46] | 2018 | x | ||||||||||||
| Halkos and Petrou [28] | 2019 | x | x | |||||||||||
| Wang et al. [39] | 2019 | x | ||||||||||||
| Siksnelyte and Zavadskas [35] | 2019 | x | ||||||||||||
| Gomez and Hernandez [36] | 2019 | x | ||||||||||||
| Babatunde et al. [37] | 2019 | x | ||||||||||||
| Seddiki and Bennadji [33] | 2019 | x | x | x | ||||||||||
| Mavi and Mavi [29] | 2019 | x | ||||||||||||
| Rani et al. [38] | 2020 | x | ||||||||||||
| Shah [21] | 2020 | x | x | x | ||||||||||
| Mastrocinque et al. [34] | 2020 | x | ||||||||||||
| Wu et al. [47] | 2020 | x | ||||||||||||
| Alkan et al. [50] | 2020 | x | ||||||||||||
| Yücenur et al. [51] | 2020 | x | ||||||||||||
| Zheng and Wang [48] | 2020 | x | ||||||||||||
| Guleria and Bajaj [49] | 2020 | x | x | |||||||||||
| Anwar et al. [43] | 2021 | x | ||||||||||||
| This paper | 2021 | x | x |
Table 2.
List of common input and output factors for renewable energy potential assessments used in data envelopment analysis (DEA) Window model.
Table 2.
List of common input and output factors for renewable energy potential assessments used in data envelopment analysis (DEA) Window model.
| No. | Authors | Year | Input Factors | Output Factors | Application Areas |
|---|---|---|---|---|---|
| 1 | Zhou et al. [52] | 2006 | Population Total energy supply | GDP CO2 emissions | 30 OECD countries |
| 2 | Choi et al. [53] | 2012 | Capital Labor force Total energy consumption | GDP CO2 emissions | 30 Chinese cities |
| 3 | Xie et al. [24] | 2014 | Fuel and nuclear Labor force Installed capacity | Power generation CO2 emissions | 26 OECD countries |
| 4 | Cicea et al. [40] | 2014 | GDP per capita Renewable energy investment Energy intensity | CO2 intensity | 22 European countries |
| 5 | Robaina-Alves et al. [26] | 2015 | Labor productivity Capital investment Renewable energy consumption | GDP Greenhouse gases | 26 European countries |
| 6 | Moutinho et al. [41] | 2017 | Labor Capital Weight of fossil energy Share of renewable energy in GDP | GDP Greenhouse gases | 26 European countries |
| 7 | Moutinho et al. [27] | 2018 | Share of renewable energy consumption Energy usage Population density Labor productivity | GDP CO2 emissions | 16 Latin America countries |
| 8 | This paper | 2021 | Population Total energy consumption Total renewable energy capacity | GDP Total energy production | 42 potential countries in renewable energy |
Note: gross domestic product (GDP), organization for economic cooperation and development (OECD).
Table 3.
All criteria used in fuzzy technique for order of preference by similarity to ideal solution (FTOPSIS) model.
Table 3.
All criteria used in fuzzy technique for order of preference by similarity to ideal solution (FTOPSIS) model.
| Main Criteria | Description | Literature Review |
|---|---|---|
| Availability of resource | The nature and structure of locations, i.e., ecology, geology, land use | Uyan [54], Carrión et al. [55], Sabo et al. [56], Idris et al. [57], Massimo et al. [58], Chamanehpour and Akbarpour [59] |
| Energy security | Description of environmental effects, which is paramount to human security | Augutis et al. [60], Bekhrad et al. [61], Wang et al. [62], Hamed and Bressler [63], Lucas et al. [64] |
| Technological infrastructure | The technology investment, the distance from power network, power generators, transportation infrastructure | Ozdemir and Sahin [65], Demirel and Yalcinn [66], Uyan [54], Carrión et al. [55], Sabo et al. [56], Toklu and Uygun [67] |
| Economic stability | The demand for electricity consumption, fixed and variable cost, i.e., construction cost, operation and management cost | Ozdemir and Sahin [65], Demirel and Yalcinn [66], Uyan [54], Kengpol et al. [68], Wang et al. [69] |
| Social acceptance | Influence of protection law, public acceptance, legal and regulation compliance | Talinli et al. [70], Wüstenhagen et al. [71], Wang et al. [16], Paletto et al. [72], Wang et al. [69] |
Table 4.
Linguistic value for the important weight of each criteria.
| Symbol | Definition | Scale of Triangular Fuzzy Number |
|---|---|---|
| VL | Very low | (0, 0, 0.1) |
| L | Low | (0, 0.1, 0.3) |
| ML | Medium low | (0.1, 0.3, 0.5) |
| M | Medium | (0.3, 0.5, 0.7) |
| MH | Medium high | (0.5, 0.7, 0.9) |
| H | High | (0.7, 0.9, 1) |
| VH | Very high | (0.9, 1, 1) |
Table 5.
Linguistics value for the rating of all alternatives.
| Symbol | Definition | Scale of Triangular Fuzzy Number |
|---|---|---|
| VP | Very poor | (0, 0, 1) |
| P | Poor | (0, 1, 3) |
| MP | Medium poor | (1, 3, 5) |
| F | Fair | (3, 5, 7) |
| MG | Medium good | (5, 7, 9) |
| G | Good | (7, 9, 10) |
| VG | Very good | (9, 10, 10) |
Table 6.
List of countries used in the paper.
| DMUs | Country | Region | DMUs | Country | Region |
|---|---|---|---|---|---|
| 1 | Belgium | European Union | 21 | Argentina | Latin America |
| 2 | Czech Republic | European Union | 22 | Brazil | Latin America |
| 3 | France | European Union | 23 | Chile | Latin America |
| 4 | Germany | European Union | 24 | Colombia | Latin America |
| 5 | Italy | European Union | 25 | Mexico | Latin America |
| 6 | Netherlands | European Union | 26 | China | Asia |
| 7 | Poland | European Union | 27 | India | Asia |
| 8 | Portugal | European Union | 28 | Indonesia | Asia |
| 9 | Romania | European Union | 29 | Japan | Asia |
| 10 | Spain | European Union | 30 | Malaysia | Asia |
| 11 | Sweden | European Union | 31 | South Korea | Asia |
| 12 | United Kingdom | European Union | 32 | Thailand | Asia |
| 13 | Norway | European Union | 33 | Australia | Pacific |
| 14 | Turkey | European Union | 34 | New Zealand | Pacific |
| 15 | Kazakhstan | CIS | 35 | Algeria | Africa |
| 16 | Russia | CIS | 36 | Egypt | Africa |
| 17 | Ukraine | CIS | 37 | Nigeria | Africa |
| 18 | Uzbekistan | CIS | 38 | South Africa | Africa |
| 19 | Canada | North America | 39 | Iran | Middle East |
| 20 | United States | North America | 40 | Kuwait | Middle East |
| 41 | Saudi Arabia | Middle East | |||
| 42 | United Arab Emirates | Middle East |
Note: CIS denotes commonwealth of independent states.
Table 7.
Descriptive statistics of input and output factors.
| Minimum | Maximum | Mean | Std. Deviation | |
|---|---|---|---|---|
| Population | 2.99 | 1397.72 | 125.31 | 279.36 |
| Total energy consumption | 18 | 3284 | 277.89 | 547.07 |
| Total renewable energy capacity | 0 | 758,626 | 37,848.41 | 82,491.48 |
| Gross domestic product | 46.68 | 21,433.23 | 1636.98 | 3165 |
| Total energy production | 5 | 2684 | 280.38 | 497.12 |
Source: calculated by authors.
Table 8.
Pearson correlation index of input and output factors.
| PO | TEC | TREC | GDP | TEP | ||
|---|---|---|---|---|---|---|
| Population (PO) | Pearson index | 1 | 0.758 ** | 0.711 ** | 0.474 ** | 0.657 ** |
| p-value | 0.000 | 0.000 | 0.000 | 0.000 | ||
| Sample size | 420 | 420 | 420 | 420 | 420 | |
| Total energy consumption (TEC) | Pearson index | 0.758 ** | 1 | 0.884 ** | 0.870 ** | 0.936 ** |
| p-value | 0.000 | 0.000 | 0.000 | 0.000 | ||
| Sample size | 420 | 420 | 420 | 420 | 420 | |
| Total renewable energy capacity (TREC) | Pearson index | 0.711 ** | 0.884 ** | 1 | 0.747 ** | 0.788 ** |
| p-value | 0.000 | 0.000 | 0.000 | 0.000 | ||
| Sample size | 420 | 420 | 420 | 420 | 420 | |
| Gross domestic product (GDP) | Pearson index | 0.474 ** | 0.870 ** | 0.747 ** | 1 | 0.780 ** |
| p-value | 0.000 | 0.000 | 0.000 | 0.000 | ||
| Sample size | 420 | 420 | 420 | 420 | 420 | |
| Total energy production (TEP) | Pearson index | 0.657 ** | 0.936 ** | 0.788 ** | 0.780 ** | 1 |
| p-value | 0.000 | 0.000 | 0.000 | 0.000 | ||
| Sample size | 420 | 420 | 420 | 420 | 420 | |
Note: ** denotes correlation is significant at the 0.01 level (2-tailed).
Table 9.
The average efficiency ranking of 42 countries (2010–2019).
| 2010 | 2011 | 2012 | 2013 | 2014 | 2015 | 2016 | 2017 | 2018 | 2019 | Avg | Rank | |
|---|---|---|---|---|---|---|---|---|---|---|---|---|
| Belgium | 0.78 | 0.79 | 0.74 | 0.74 | 0.77 | 0.66 | 0.65 | 0.69 | 0.76 | 0.72 | 0.73 | 12 |
| Czech Republic | 0.38 | 0.42 | 0.38 | 0.37 | 0.37 | 0.34 | 0.35 | 0.38 | 0.43 | 0.43 | 0.38 | 31 |
| France | 0.71 | 0.78 | 0.73 | 0.76 | 0.78 | 0.66 | 0.67 | 0.70 | 0.75 | 0.73 | 0.73 | 13 |
| Germany | 0.72 | 0.81 | 0.75 | 0.78 | 0.81 | 0.69 | 0.71 | 0.74 | 0.80 | 0.78 | 0.76 | 11 |
| Italy | 0.73 | 0.79 | 0.75 | 0.79 | 0.85 | 0.69 | 0.71 | 0.74 | 0.78 | 0.77 | 0.76 | 10 |
| Netherlands | 0.94 | 1.00 | 0.92 | 0.95 | 0.98 | 0.82 | 0.81 | 0.84 | 0.90 | 0.89 | 0.90 | 5 |
| Poland | 0.55 | 0.53 | 0.46 | 0.44 | 0.46 | 0.39 | 0.37 | 0.38 | 0.40 | 0.41 | 0.44 | 25 |
| Portugal | 0.58 | 0.61 | 0.57 | 0.60 | 0.61 | 0.51 | 0.52 | 0.54 | 0.61 | 0.61 | 0.58 | 21 |
| Romania | 0.33 | 0.35 | 0.33 | 0.36 | 0.37 | 0.34 | 0.35 | 0.38 | 0.43 | 0.43 | 0.37 | 33 |
| Spain | 0.64 | 0.68 | 0.61 | 0.66 | 0.68 | 0.57 | 0.59 | 0.61 | 0.66 | 0.64 | 0.63 | 16 |
| Sweden | 0.67 | 0.78 | 0.74 | 0.79 | 0.78 | 0.69 | 0.67 | 0.70 | 0.71 | 0.68 | 0.72 | 14 |
| United Kingdom | 1.00 | 1.00 | 0.96 | 0.94 | 1.00 | 0.94 | 0.88 | 0.88 | 0.95 | 0.96 | 0.95 | 2 |
| Norway | 1.00 | 1.00 | 1.00 | 1.00 | 0.95 | 0.97 | 1.00 | 1.00 | 0.97 | 0.97 | 0.99 | 1 |
| Turkey | 0.43 | 0.43 | 0.44 | 0.48 | 0.45 | 0.39 | 0.37 | 0.34 | 0.31 | 0.30 | 0.39 | 30 |
| Kazakhstan | 0.43 | 0.41 | 0.45 | 0.44 | 0.45 | 0.41 | 0.38 | 0.41 | 0.42 | 0.40 | 0.42 | 28 |
| Russia | 0.36 | 0.39 | 0.39 | 0.41 | 0.39 | 0.35 | 0.35 | 0.35 | 0.35 | 0.37 | 0.37 | 32 |
| Ukraine | 0.14 | 0.16 | 0.17 | 0.19 | 0.16 | 0.14 | 0.14 | 0.15 | 0.16 | 0.17 | 0.16 | 42 |
| Uzbekistan | 0.24 | 0.23 | 0.23 | 0.26 | 0.27 | 0.31 | 0.30 | 0.26 | 0.26 | 0.27 | 0.26 | 40 |
| Canada | 0.60 | 0.66 | 0.67 | 0.66 | 0.64 | 0.54 | 0.53 | 0.56 | 0.58 | 0.58 | 0.60 | 19 |
| United States | 0.76 | 0.78 | 0.79 | 0.80 | 0.82 | 0.84 | 0.85 | 0.88 | 0.91 | 0.94 | 0.84 | 7 |
| Argentina | 0.41 | 0.47 | 0.48 | 0.47 | 0.45 | 0.49 | 0.46 | 0.51 | 0.44 | 0.40 | 0.46 | 24 |
| Brazil | 0.48 | 0.56 | 0.51 | 0.49 | 0.47 | 0.36 | 0.37 | 0.41 | 0.37 | 0.36 | 0.44 | 26 |
| Chile | 0.41 | 0.44 | 0.42 | 0.42 | 0.44 | 0.40 | 0.39 | 0.42 | 0.43 | 0.42 | 0.42 | 29 |
| Colombia | 0.77 | 0.89 | 0.95 | 0.83 | 0.81 | 0.70 | 0.65 | 0.70 | 0.71 | 0.68 | 0.77 | 9 |
| Mexico | 0.50 | 0.53 | 0.51 | 0.53 | 0.54 | 0.48 | 0.44 | 0.45 | 0.47 | 0.48 | 0.49 | 22 |
| China | 0.24 | 0.26 | 0.27 | 0.28 | 0.29 | 0.29 | 0.28 | 0.29 | 0.31 | 0.31 | 0.28 | 38 |
| India | 0.23 | 0.23 | 0.22 | 0.22 | 0.22 | 0.22 | 0.22 | 0.24 | 0.23 | 0.24 | 0.23 | 41 |
| Indonesia | 0.45 | 0.54 | 0.53 | 0.52 | 0.49 | 0.47 | 0.48 | 0.49 | 0.48 | 0.49 | 0.49 | 23 |
| Japan | 0.87 | 0.97 | 0.98 | 0.79 | 0.73 | 0.65 | 0.73 | 0.72 | 0.73 | 0.75 | 0.79 | 8 |
| Malaysia | 0.37 | 0.38 | 0.38 | 0.34 | 0.35 | 0.33 | 0.32 | 0.33 | 0.35 | 0.34 | 0.35 | 34 |
| South Korea | 0.61 | 0.63 | 0.62 | 0.64 | 0.64 | 0.58 | 0.56 | 0.58 | 0.60 | 0.55 | 0.60 | 20 |
| Thailand | 0.28 | 0.30 | 0.29 | 0.28 | 0.27 | 0.26 | 0.25 | 0.26 | 0.28 | 0.29 | 0.28 | 39 |
| Australia | 0.82 | 0.94 | 1.00 | 1.00 | 0.97 | 0.93 | 0.85 | 0.90 | 0.92 | 0.86 | 0.92 | 4 |
| New Zealand | 0.52 | 0.60 | 0.61 | 0.65 | 0.66 | 0.58 | 0.61 | 0.65 | 0.66 | 0.66 | 0.62 | 18 |
| Algeria | 0.74 | 0.79 | 0.75 | 0.72 | 0.68 | 0.54 | 0.56 | 0.55 | 0.53 | 0.47 | 0.63 | 17 |
| Egypt | 0.32 | 0.33 | 0.36 | 0.36 | 0.36 | 0.38 | 0.35 | 0.27 | 0.28 | 0.31 | 0.33 | 36 |
| Nigeria | 0.43 | 0.43 | 0.46 | 0.48 | 0.50 | 0.46 | 0.38 | 0.37 | 0.38 | 0.39 | 0.43 | 27 |
| South Africa | 0.40 | 0.44 | 0.43 | 0.38 | 0.32 | 0.30 | 0.27 | 0.30 | 0.31 | 0.30 | 0.35 | 35 |
| Iran | 0.35 | 0.37 | 0.34 | 0.29 | 0.28 | 0.27 | 0.30 | 0.31 | 0.30 | 0.27 | 0.31 | 37 |
| Kuwait | 0.87 | 0.98 | 1.00 | 0.99 | 1.00 | 0.93 | 0.94 | 0.92 | 0.93 | 0.87 | 0.94 | 3 |
| Saudi Arabia | 0.66 | 0.73 | 0.69 | 0.73 | 0.66 | 0.57 | 0.62 | 0.63 | 0.71 | 0.69 | 0.67 | 15 |
| United Arab Emirates | 0.83 | 1.00 | 1.00 | 0.98 | 0.95 | 0.82 | 0.84 | 0.87 | 0.90 | 0.82 | 0.90 | 6 |
Source: calculated by authors.
Table 10.
Fuzzy decision matrix and fuzzy weights of all alternatives.
| C1 | C2 | C3 | C4 | C5 | |
|---|---|---|---|---|---|
| A1 | (1, 3, 5) | (7.667, 9.333, 10) | (7.667, 9, 9.667) | (6.333, 7.667, 8.333) | (7.667, 9.333, 10) |
| A2 | (5.667, 7.667, 9.333) | (6.333, 8, 9.333) | (7.667, 9, 9.667) | (5.667, 7.667, 9) | (6.333, 8, 9.333) |
| A3 | (7, 9, 10) | (6.333, 8.333, 9.667) | (5.667, 7.333, 8.333) | (5.667, 7.667, 9) | (5.667, 7.667, 9.333) |
| A4 | (5, 7, 9) | (7.667, 9.333, 10) | (6.333, 8.333, 9.667) | (8.333, 9.667, 10) | (7, 8.667, 9.667) |
| A5 | (5, 7, 8.667) | (5, 6.667, 8) | (6.333, 8, 9) | (7.667, 9, 9.667) | (7.667, 9.333, 10) |
| A6 | (5, 7, 8.667) | (2.333, 3.333, 4.667) | (2.667, 4.333, 6.333) | (3.333, 4.333, 5.333) | (1.333, 3, 5) |
| A7 | (7.667, 9.333, 10) | (7, 8.667, 9.667) | (7.667, 9.333, 10) | (6.333, 8.333, 9.667) | (6.333, 8.333, 9.667) |
| A8 | (5, 7, 8.667) | (7.667, 9.333, 10) | (7.667, 9.333, 10) | (7, 9, 10) | (7.667, 9, 9.667) |
| A9 | (4.333, 6.333, 8) | (6.333, 8, 9) | (3, 5, 7) | (6.333, 8.333, 9.667) | (5.667, 7.667, 9) |
| A10 | (5.667, 7.333, 8.667) | (7, 9, 10) | (6.333, 8, 9) | (4.333, 6.333, 8.333) | (4.333, 6.333, 8) |
| Weight | (0.367, 0.567, 0.767) | (0.833, 0.967, 1) | (0.567, 0.767, 0.9) | (0.433, 0.633, 0.8) | (0.3, 0.5, 0.667) |
Source: calculated by authors.
Table 11.
Fuzzy normalized decision matrix.
| C1 | C2 | C3 | C4 | C5 | |
|---|---|---|---|---|---|
| A1 | (0.1, 0.3, 0.5) | (0.767, 0.933, 1) | (0.767, 0.9, 0.967) | (0.633, 0.767, 0.833) | (0.767, 0.933, 1) |
| A2 | (0.567, 0.767, 0.933) | (0.633, 0.8, 0.933) | (0.767, 0.9, 0.967) | (0.567, 0.767, 0.9) | (0.633, 0.8, 0.933) |
| A3 | (0.7, 0.9, 1) | (0.633, 0.833, 0.967) | (0.567, 0.733, 0.833) | (0.567, 0.767, 0.9) | (0.567, 0.767, 0.933) |
| A4 | (0.5, 0.7, 0.9) | (0.767, 0.933, 1) | (0.633, 0.833, 0.967) | (0.833, 0.967, 1) | (0.7, 0.867, 0.967) |
| A5 | (0.5, 0.7, 0.867) | (0.5, 0.667, 0.8) | (0.633, 0.8, 0.9) | (0.767, 0.9, 0.967) | (0.767, 0.933, 1) |
| A6 | (0.5, 0.7, 0.867) | (0.233, 0.333, 0.467) | (0.267, 0.433, 0.633) | (0.333, 0.433, 0.533) | (0.133, 0.3, 0.5) |
| A7 | (0.767, 0.933, 1) | (0.7, 0.867, 0.967) | (0.767, 0.933, 1) | (0.633, 0.833, 0.967) | (0.633, 0.833, 0.967) |
| A8 | (0.5, 0.7, 0.867) | (0.767, 0.933, 1) | (0.767, 0.933, 1) | (0.7, 0.9, 1) | (0.767, 0.9, 0.967) |
| A9 | (0.433, 0.633, 0.8) | (0.633, 0.8, 0.9) | (0.3, 0.5, 0.7) | (0.633, 0.833, 0.967) | (0.567, 0.767, 0.9) |
| A10 | (0.567, 0.733, 0.867) | (0.7, 0.9, 1) | (0.633, 0.8, 0.9) | (0.433, 0.633, 0.833) | (0.433, 0.633, 0.8) |
Source: calculated by authors.
Table 12.
Fuzzy weighted normalized decision matrix.
| C1 | C2 | C3 | C4 | C5 | |
|---|---|---|---|---|---|
| A1 | (0.037, 0.17, 0.384) | (0.639, 0.902, 1) | (0.435, 0.69, 0.87) | (0.274, 0.486, 0.666) | (0.23, 0.466, 0.667) |
| A2 | (0.208, 0.435, 0.716) | (0.527, 0.774, 0.933) | (0.435, 0.69, 0.87) | (0.246, 0.486, 0.72) | (0.19, 0.4, 0.622) |
| A3 | (0.257, 0.51, 0.767) | (0.527, 0.806, 0.967) | (0.321, 0.562, 0.75) | (0.246, 0.486, 0.72) | (0.17, 0.384, 0.622) |
| A4 | (0.184, 0.397, 0.69) | (0.639, 0.902, 1) | (0.359, 0.639, 0.87) | (0.361, 0.612, 0.8) | (0.21, 0.434, 0.645) |
| A5 | (0.184, 0.397, 0.665) | (0.416, 0.645, 0.8) | (0.359, 0.614, 0.81) | (0.332, 0.57, 0.774) | (0.23, 0.466, 0.667) |
| A6 | (0.184, 0.397, 0.665) | (0.194, 0.322, 0.467) | (0.151, 0.332, 0.57) | (0.144, 0.274, 0.426) | (0.04, 0.15, 0.334) |
| A7 | (0.281, 0.529, 0.767) | (0.583, 0.838, 0.967) | (0.435, 0.716, 0.9) | (0.274, 0.527, 0.774) | (0.19, 0.416, 0.645) |
| A8 | (0.184, 0.397, 0.665) | (0.639, 0.902, 1) | (0.435, 0.716, 0.9) | (0.303, 0.57, 0.8) | (0.23, 0.45, 0.645) |
| A9 | (0.159, 0.359, 0.614) | (0.527, 0.774, 0.9) | (0.17, 0.384, 0.63) | (0.274, 0.527, 0.774) | (0.17, 0.384, 0.6) |
| A10 | (0.208, 0.416, 0.665) | (0.583, 0.87, 1) | (0.359, 0.614, 0.81) | (0.187, 0.401, 0.666) | (0.13, 0.316, 0.534) |
Source: calculated by authors.
Table 13.
Distance measurement and closeness coefficient of each alternative.
| Alternative | Countries | Rank | |||
|---|---|---|---|---|---|
| A1 | Norway | 2.53389 | 2.78231 | 0.52336 | 7 |
| A2 | United Kingdom | 2.44247 | 2.91216 | 0.54386 | 4 |
| A3 | Kuwait | 2.50178 | 2.86652 | 0.53397 | 5 |
| A4 | Australia | 2.30395 | 3.07180 | 0.57142 | 3 |
| A5 | Netherlands | 2.52475 | 2.79734 | 0.52561 | 6 |
| A6 | United Arab Emirates | 3.53176 | 1.71309 | 0.32662 | 10 |
| A7 | United States | 2.27166 | 3.10339 | 0.5774 | 1 |
| A8 | Japan | 2.27273 | 3.09668 | 0.57673 | 2 |
| A9 | Colombia | 2.74876 | 2.59387 | 0.48551 | 9 |
| A10 | Italy | 2.60542 | 2.75456 | 0.51391 | 8 |
Source: calculated by authors.
Publisher’s Note: MDPI stays neutral with regard to jurisdictional claims in published maps and institutional affiliations. |
© 2021 by the authors. Licensee MDPI, Basel, Switzerland. This article is an open access article distributed under the terms and conditions of the Creative Commons Attribution (CC BY) license (http://creativecommons.org/licenses/by/4.0/).
Share and Cite
MDPI and ACS Style
Wang, C.-N.; Dang, T.-T.; Tibo, H.; Duong, D.-H. Assessing Renewable Energy Production Capabilities Using DEA Window and Fuzzy TOPSIS Model. Symmetry 2021, 13, 334. https://0-doi-org.brum.beds.ac.uk/10.3390/sym13020334
AMA Style
Wang C-N, Dang T-T, Tibo H, Duong D-H. Assessing Renewable Energy Production Capabilities Using DEA Window and Fuzzy TOPSIS Model. Symmetry. 2021; 13(2):334. https://0-doi-org.brum.beds.ac.uk/10.3390/sym13020334
Chicago/Turabian StyleWang, Chia-Nan, Thanh-Tuan Dang, Hector Tibo, and Duy-Hung Duong. 2021. "Assessing Renewable Energy Production Capabilities Using DEA Window and Fuzzy TOPSIS Model" Symmetry 13, no. 2: 334. https://0-doi-org.brum.beds.ac.uk/10.3390/sym13020334
Note that from the first issue of 2016, this journal uses article numbers instead of page numbers. See further details here.