Article

Determination of Objective Weights Using a New Method Based on the Removal Effects of Criteria (MEREC)

by
Mehdi Keshavarz-Ghorabaee
1,
Maghsoud Amiri
2,
Edmundas Kazimieras Zavadskas
3,*,
Zenonas Turskis
3 and
Jurgita Antucheviciene
4
1
Department of Management, Faculty of Humanities (Azadshahr Branch), Gonbad Kavous University, Gonbad Kavous 49717-99151, Iran
2
Department of Industrial Management, Faculty of Management and Accounting, Allameh Tabataba’i University, Tehran 14348-63111, Iran
3
Institute of Sustainable Construction, Civil Engineering Faculty, Vilnius Gediminas Technical University, Sauletekio al. 11, LT-10223 Vilnius, Lithuania
4
Department of Construction Management and Real Estate, Vilnius Gediminas Technical University, Sauletekio al. 11, LT-10223 Vilnius, Lithuania
*
Author to whom correspondence should be addressed.
Submission received: 2 March 2021 / Revised: 19 March 2021 / Accepted: 22 March 2021 / Published: 24 March 2021
(This article belongs to the Special Issue Symmetric and Asymmetric Data in Solution Models, Part II)

Abstract

:
The weights of criteria in multi-criteria decision-making (MCDM) problems are essential elements that can significantly affect the results. Accordingly, researchers developed and presented several methods to determine criteria weights. Weighting methods could be objective, subjective, and integrated. This study introduces a new method, called MEREC (MEthod based on the Removal Effects of Criteria), to determine criteria’ objective weights. This method uses a novel idea for weighting criteria. After systematically introducing the method, we present some computational analyses to confirm the efficiency of the MEREC. Firstly, an illustrative example demonstrates the procedure of the MEREC for calculation of the weights of criteria. Secondly, a comparative analysis is presented through an example for validation of the introduced method’s results. Additionally, we perform a simulation-based analysis to verify the reliability of MEREC and the stability of its results. The data of the MCDM problems generated for making this analysis follow a prevalent symmetric distribution (normal distribution). We compare the results of the MEREC with some other objective weighting methods in this analysis, and the analysis of means (ANOM) for variances shows the stability of its results. The conducted analyses demonstrate that the MEREC is efficient to determine objective weights of criteria.

1. Introduction

Multi-criteria decision-making (MCDM) is an essential and interdisciplinary field in operations research that has been taken into consideration in the past years. This field can be categorized into two different branches: multi-objective decision-making (MODM) and multi-attribute decision-making (MADM) [1]. In MODM, we usually address the problems of determining an optimal or near-optimal solution in a feasible solution space based on multiple objectives and several variables, parameters, and constraints. Solving linear and ono-linear programming models is a common way to deal with MODM problems. On the other hand, MADM is a branch of MCDM that deals with issues defined by discrete decision variables, a limited number of alternatives and attributes [2,3,4,5]. The focus of this study is on this branch of MCDM. Many researchers have usually used the two terms: MADM and MCDM. We also use the term MCDM to refer to the current research problems.
In practical situations, we can be confronted with some problems in which a finite set of alternatives need to be evaluated in terms of multiple criteria [6,7,8,9]. MCDM methods provide us with a process that results in rational, explainable, and justifiable decisions. Several MCDM methods and techniques have been proposed in the literature. WSM (Weighted Sum Model), WASPAS (Weighted Aggregated Sum Product ASsessment), TOPSIS (Technique for Order of Preference by Similarity to Ideal Solution), VIKOR (Vise Kriterijumska Optimizacija I Kompromisno Resenje), PROMETHEE (Preference Ranking Organization METHod for Enrichment of Evaluations), ELECTRE (ELimination Et Choix Traduisant la REalité), COPRAS (COmplex PRoportional ASsessment), EDAS (Evaluation based on Distance from Average Solution), AHP (Analytic Hierarchy Process), and BWM (Best-Worst Method) are some of the popular MCDM methods which have been utilized by many researchers in different fields of study [10,11,12,13,14,15]. Generally, there are four steps in the evaluation process using MCDM approaches: (i) defining the alternatives and criteria related to the problem, (ii) determining weights of each measure, (iii) assigning individual performance to each option on each measure, and (iv) evaluate the alternatives based on the aggregate performance of them on all criteria [16,17]. The second step is the focus of this study. We can say that determination of criteria weights is one of the most critical and complicated processes in dealing with MCDM problems.
The weights of criteria show the importance of them. The easiest way, which has been utilized in many studies, is to assign equal weights to the criteria [18]. However, the final evaluation results are highly dependent on the weights of criteria, which is not appropriate [19]. Several methods have been introduced to obtain criteria weights. These methods fall into three categories—subjective weighting methods, objective weighting methods, and hybrid weighting methods. In subjective methods, the determination of criteria weights is dependent on the preferences of decision-makers. Direct ranking, point allocation, pairwise comparisons, and SMART (Simple Multi-attribute Ranking Technique) are examples of subjective methods [20]. The main disadvantage of these methods is that they are not efficient enough when the number of criteria increases. In other words, expressing preferences is a mental task for decision-makers, and the accuracy of their preferences decreases by increasing the number of criteria [17]. In objective weighting methods, the preferences of decision-makers have no role in determining criteria weights [20]. The objective weighting methods yield criteria weights using a specific computational process based on the initial data or decision-matrix (each alternative’s performance on each criterion).
In these methods, we do not use direct data on the significance of criteria expressed by decision-makers [21]. Entropy method, Standard Deviation method, CRITIC (CRiteria Importance Through Inter-criteria Correlation) and SECA (Simultaneous Evaluation of Criteria and Alternatives) are in the category of objective weighting methods [9,20,22]. Hybrid methods use a combination of different subjective and objective weighting methods. These methods have no distinctive characteristics, and they borrow the features of other methods. Since the hybrid methods can utilize the decision-makers’ preferences and the data of decision-matrix, they could give more realistic weights [23,24,25,26,27,28]. Each of these methods has its advantages and disadvantages and can be efficient in different situations. Here, we do not aim to study these advantages and disadvantages.
This study proposes a new objective weighting method, called MEREC (MEthod based on the Removal Effects of Criteria), for determining criteria weights. As mentioned previously, the objective weighting methods use the initial data or the decision-matrix to determine criteria weights. These methods usually exploit the variations in different alternatives’ performances concerning each criterion to determine the weights. The criteria with more variations have greater weights [20]. Unlike the other methods, the proposed method uses removal effects of each criterion on the aggregate performance of alternatives for calculating criteria weights. In the proposed method, a criterion has a greater weight when its removal leads to more effects on alternatives’ aggregate performances. Besides weighting each criterion, this perspective may help decision-makers to exclude some criteria from the decision-making process. Considering the variations, the performance of an alternative based on removing criteria is a new perspective on determining the weights of criteria. In other words, the concept of causality is the basis of the proposed method. A logarithmic function is used in this study to measure the aggregate performance of alternatives; however, as the main advantage of the proposed method, it is flexible so that decision-makers can use different functions to calculate the performances. Introducing new MCDM methods based on novel perspectives could help experts and decision-makers increase the robustness of results based on integration and combination of approaches.
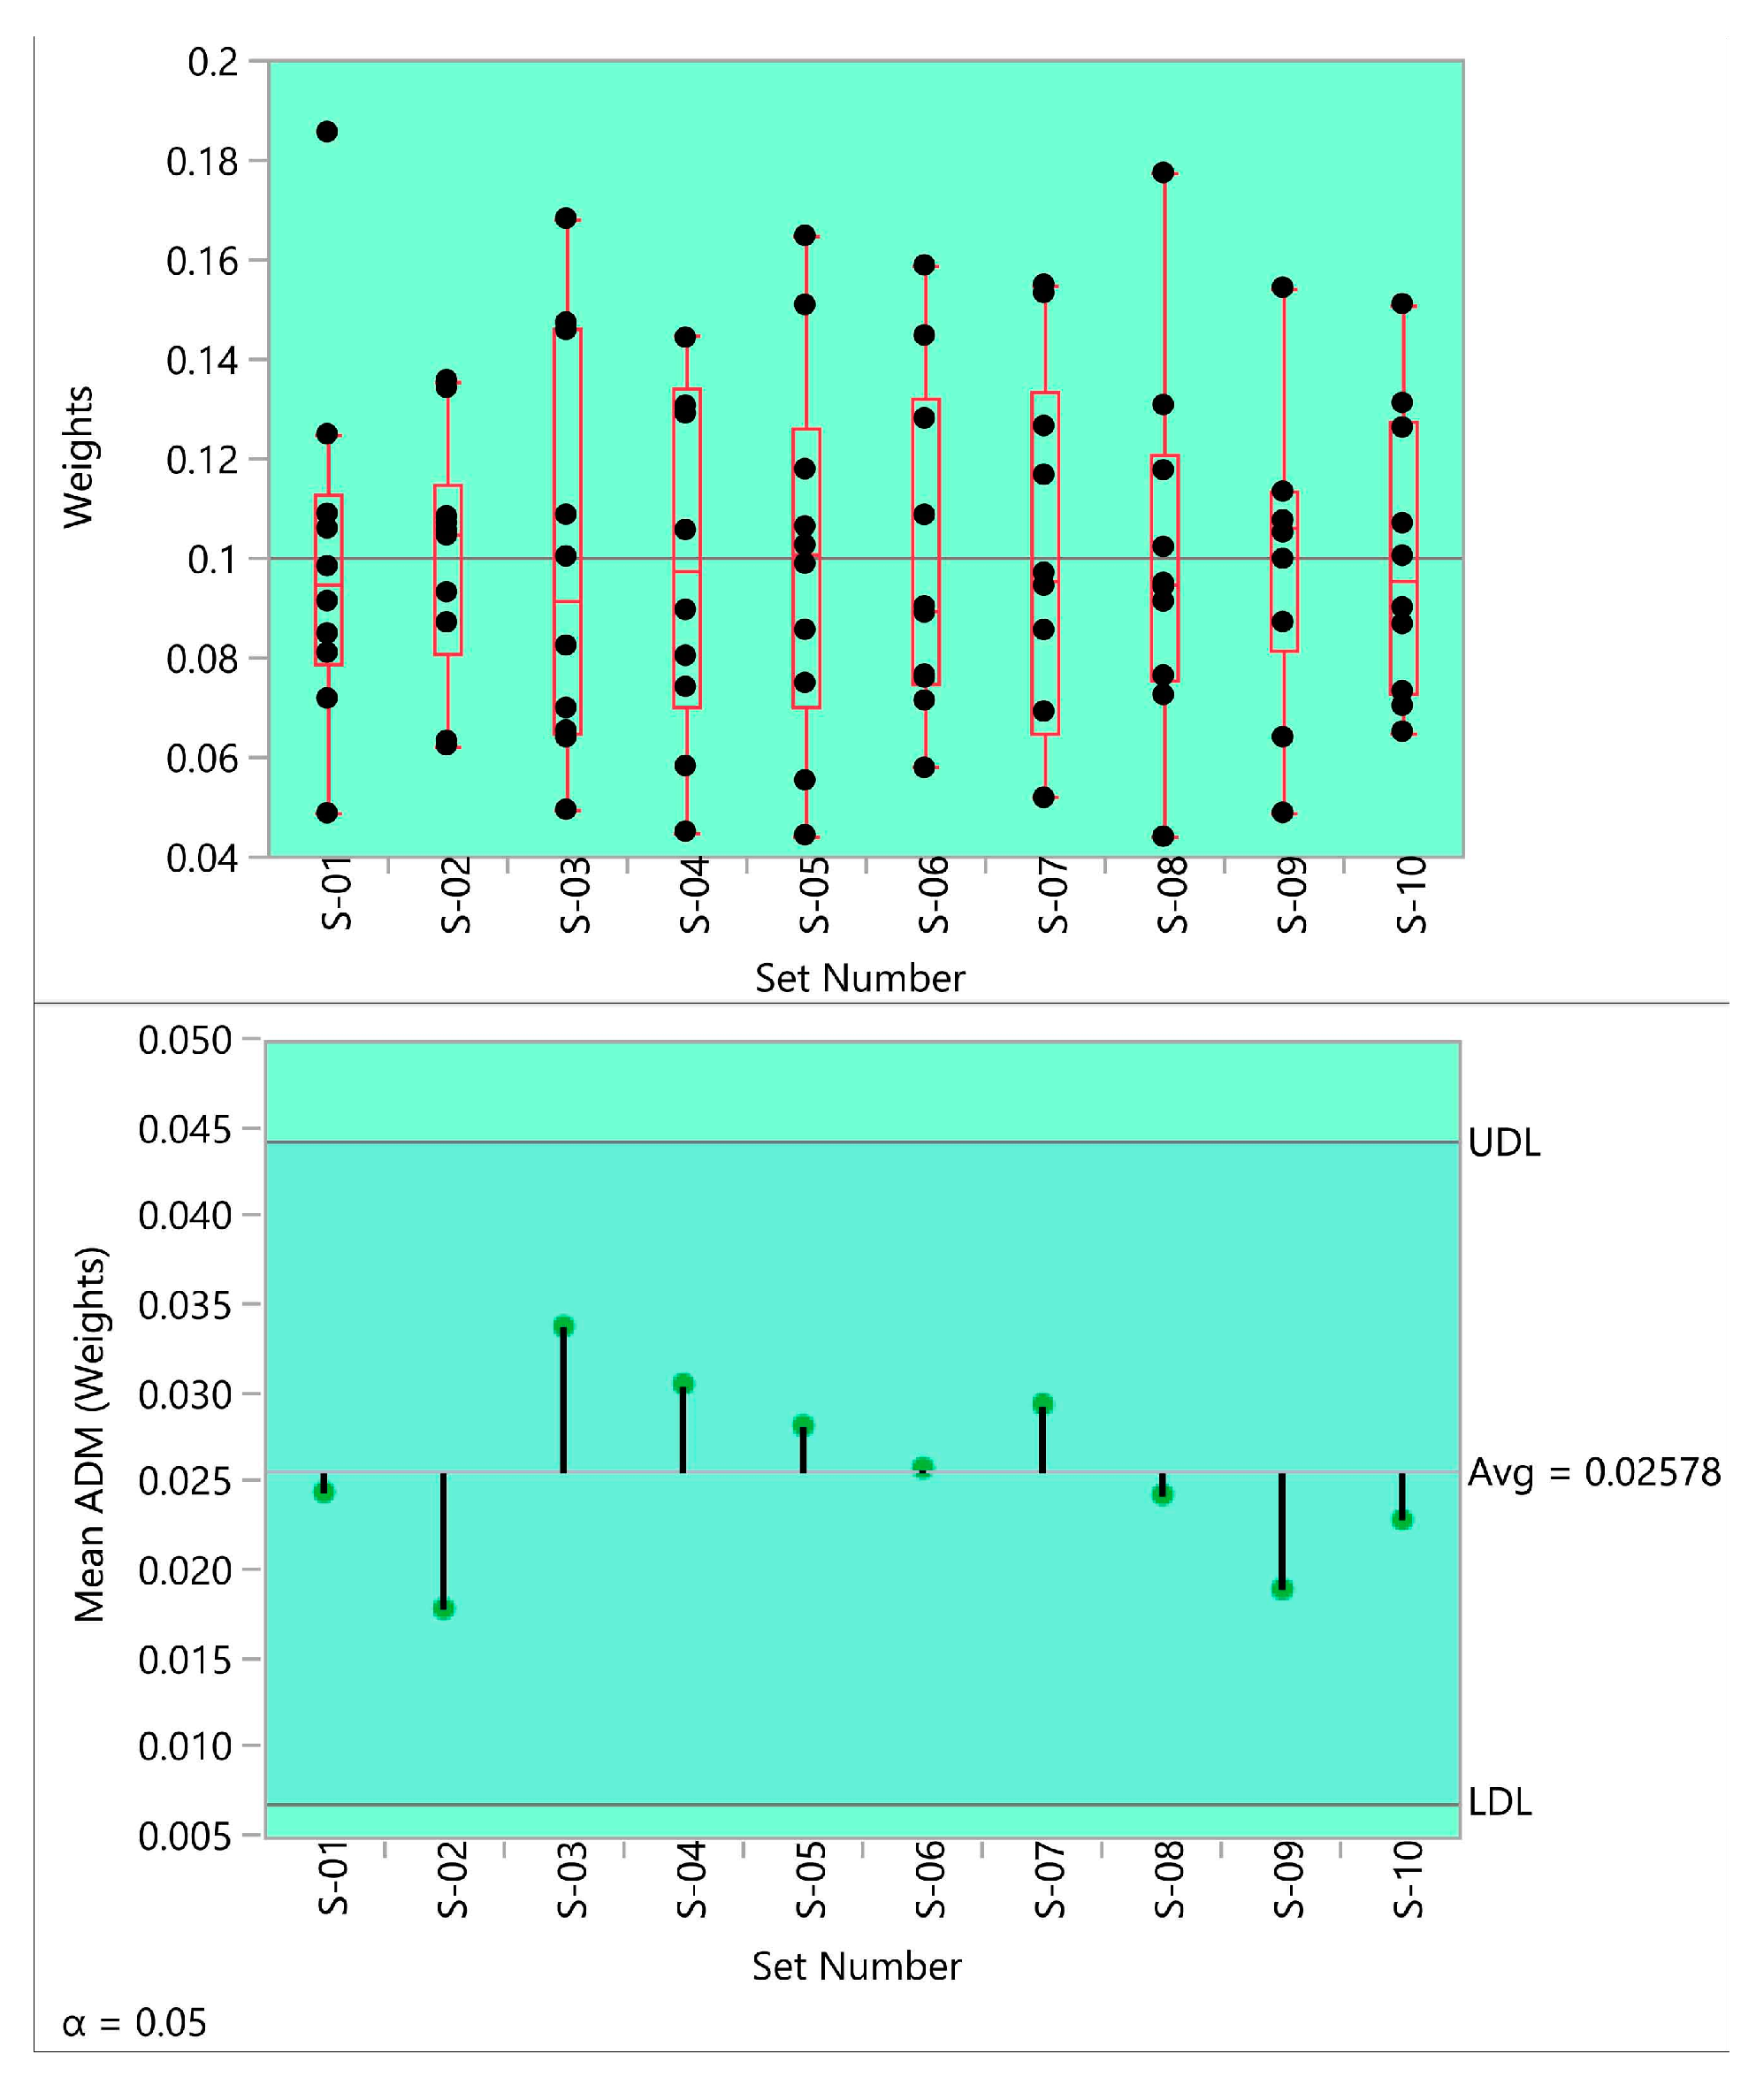
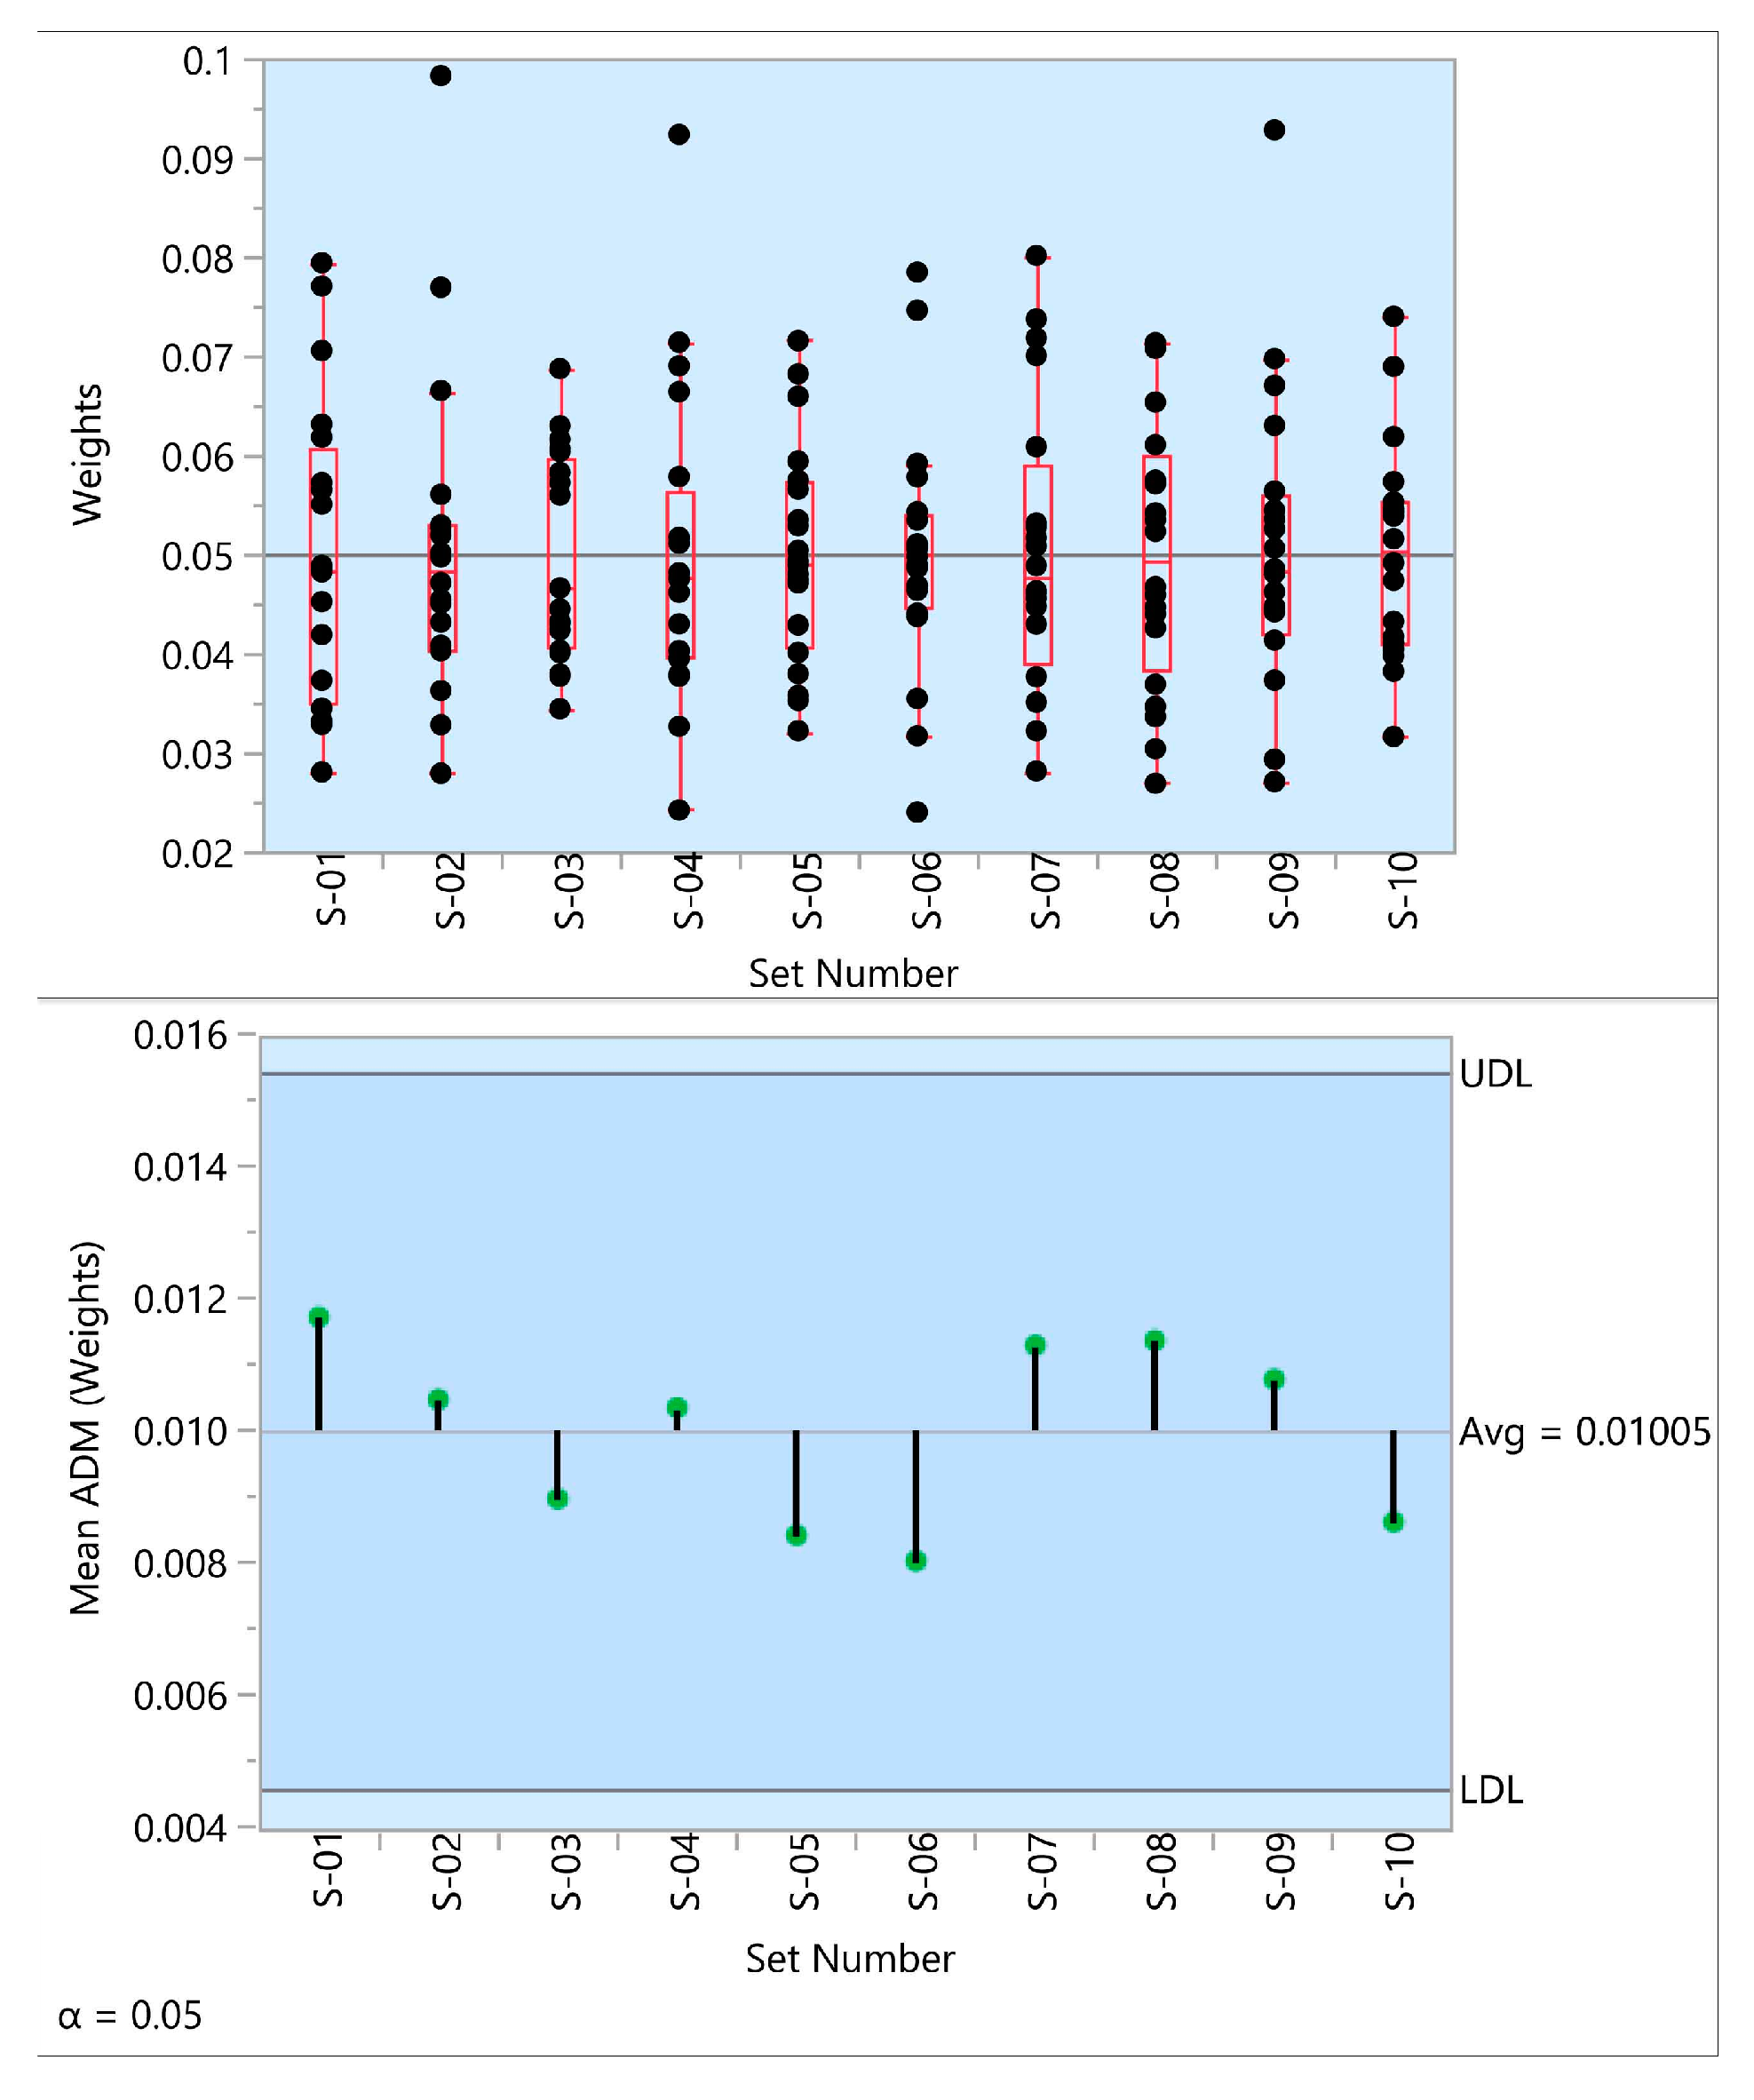
In this paper, after presenting the proposed method, it is illustrated through a simple MCDM example. Another numerical example is used to make a computational study on the method and compare it with some other objective weighting methods. Besides, a simulation-based analysis is conducted to make a more comprehensive comparison and verify the stability of the results of MEREC by testing the homogeneity of variances of the criteria weights. Symmetrical data are generated for the simulation-based analysis using the normal distribution. The analysis of means (ANOM) for variances is applied to show the homogeneity of variances in the simulation results. The comparative study results show that the weights obtained by MEREC are consistent with those of other objective weighting methods. Moreover, the simulation-based analysis demonstrates that MEREC yields homogeneous variances and can give stable criteria weights.
The remainder of this paper is organized as follows. Section 2 reviews some recent studies on the objective weighting methods and their applications. Section 3 systematically presents MEREC. Section 4 examines the introduced method based on computational analyses. This section includes three sub-sections. The first sub-section illustrates the procedure of using MEREC for the determination of criteria weights. The second sub-section uses an MCDM problem to present the results of a comparison between MEREC and three objective weighting methods (CRITIC, Entropy, and Standard Deviation). The third sub-section provides simulation-based analysis results to verify the credibility, reliability and stability of the results determined using MEREC. Finally, Section 5 discusses conclusions.

2. Recent Studies on Objective Weighting Methods

In this section, some of the most recent studies on the applications and developments of objective weighting methods are briefly surveyed. We focus on the three common methods (Entropy, Standard Deviation, and CRITIC) because they are used in this study’s computational analysis.
In a recent study, Nguyen et al. [29] studied the financial performance of retailer companies traded in the Vietnam Stock Exchange Market. They examined the financial performance concerning several ratios, including valuation, profitability, growth rate, liquidity, efficiency, and leverage. Twelve companies were considered in different quarters of 2019 and 2020. They used the Standard Deviation method to compute the weights of eighteen financial ratios. Then, the Grey relational analysis was applied to rank each company in each quarter (time). Their study showed that the leverage ratio could highly impact the retailer companies’ financial performance and long-term investment planning.
Sałabun et al. [30] addressed the problem of choosing appropriate methods for MCDM problems. Their study focused on benchmarking some of the prevalent methods in this field based on a simulation-based analysis. TOPSIS, VIKOR, COPRAS, and PROMETHEE II were selected to perform the analysis. Besides, they used different normalization techniques and different weighting methods, including the Equal Weights, Entropy, and Standard Deviation methods. It was concluded that the Equal Weights method was not the right choice for weighting criteria compared with the Entropy and Standard Deviation methods. Moreover, they found that using the Entropy weighting method led to smaller changes in the correlation between rankings.
Another study was performed on the dimensions of cultural environment and development. To evaluate the Czech theatres’ economy, Vavrek and Bečica [31] selected 11 criteria related to financial and technical efficiency. Three objective weighting methods, including Coefficient of Variation, Standard Deviation, and Mean Weight (Equal Weights) methods, were applied to determine the selected criteria’ importance and the variation coefficient indicated that financial criteria are more significant than technical criteria, but standard deviation gave importance to technical criteria. The TOPSIS method is then utilized to make the overall evaluation concerning these two categories of criteria.
Narayanamoorthy et al. [32] used the standard deviation as an objective weighting method and hesitant fuzzy sets to develop three multi-criteria decision-making approaches: hesitant fuzzy standard deviation with multi-objective optimization method by ratio analysis (HFSDV-MOORA), hesitant fuzzy standard deviation with VIKOR (HFSDV-VIKOR), and hesitant fuzzy standard deviation with TOPSIS (HFSDV-TOPSIS). They applied the proposed approaches to evaluate water distribution systems and improve water resources. Their problem consisted of four alternatives and five criteria. To validate the results of the proposed approaches, they made a comparative analysis based on the studies of Liao and Xu [33], Xu and Zhang [34], and Li [35].
In a recent research, Anitha and Das [36] tackled a problem to optimize electro-discharge machines’ process parameters. They considered four input parameters of the problem, including pulse-on time, current, voltage, and duty cycle and their effects on surface roughness (Ra), and material removal rate (MRR). The Standard Deviation method was utilized to obtain the criteria weights (MRR and Ra). Based on experimental results, they applied the full multiplicative form of MOORA (MULTIMOORA) and multi-objective optimization based on simple-ratio analysis (MOOSRA) to determine the best scenario of parameters in the considered process. In this field, Anitha and Das [37] also made a similar study and utilized the MOOSRA and Standard Deviation methods.
Maheshwari et al. [38] performed a study on design parameters of the solid ventilated brake disc. They defined seven criteria, including inboard plate thickness, outboard plate thickness, vane height, effective offset, central radius, fatigue life, and axial deflection. The authors constructed several scenarios through a full factorial design (design of experiments), and used the Standard Deviation method for weighting the criteria. They applied the EDAS, COPRAS, TOPSIS, and ARAS (Additive Ratio ASsessment) methods to evaluate the designed scenarios. The authors also compared results of the considered MCDM methods to verify the optimum design parameters.
Ramasamy et al. [39] applied the TOPSIS method in research for choosing the optimized set of experimental conditions to synthesize Bismuth Iron Tri Oxide (BiFeO3–BFO) nano-powder using the sol-gel route based on changing time duration and slotted calcination temperature. Their study’s main goal was to identify the optimum time duration and slotted calcination temperature required to get single-phase powders with minimum strain and crystallite size. The input weights of TOPSIS were assigned based on two approaches: Equal Weights and Standard Deviation methods. Due to the low number of criteria, there was not much difference in the results of these two approaches.
Şahin [40] addressed the material selection problem in the process of designing a product. The Standard Deviation and CRITIC methods were used to determine the criteria’ importance, and the GRA (Grey Relational Analysis), TOPSIS, and ORESTE (Organization, Rangement Et Synthese De Donnes Relationnelles) methods were applied to evaluate the alternatives. Six approaches were proposed based on these methods: Standard Deviation-GRA, Standard Deviation-TOPSIS, Standard Deviation-ORESTE, CRITIC-GRA, CRITIC-TOPSIS, and CRITIC-ORESTE. The author analyzed and compared the proposed approaches and used the Copeland method to aggregate the results.
Yazdani et al. [41] made a study on the evaluation of renewable energy resources. They developed a multi-criteria decision-making approach to handle this evaluation process with conflicting objectives. Five renewable resources, including solar thermal, solar photovoltaic, wind power, biomass, and geothermal, were chosen for evaluation. The set of evaluation criteria consisted of economic, social, environmental and technical dimensions. Their developed methodology was based on the EDAS and Entropy methods. A case-based analysis (a case in Saudi Arabia) was performed to show the developed methodology’s application, and wind power was selected as the most suitable alternative. They also made a sensitivity analysis to verify the stability of the results.
In another study, Afshar et al. [42] tackled the subcontractor evaluation problem. They used type-2 fuzzy sets to deal with the uncertainty of information in the qualification assessment of subcontractors. Their study’s methodology was based on the TOPSIS method, and they utilized the Entropy method to determine criteria weights. More than ten criteria and their corresponding sub-criteria were defined for the evaluation process. They used the centroid of the interval type-2 fuzzy values in the decision matrix for determining criteria weights by Entropy. To validate their methodology, they compared it with an approach based on type-1 fuzzy sets.
Arya and Kumar [43] designed a methodology using the picture fuzzy set theory. They study a new picture fuzzy entropy approach based on the probability theory to determine criteria weights. The standard Entropy method is the basis of their proposed picture fuzzy Entropy approach. They utilized the VIKOR and TODIM (a Portuguese acronym for Interactive Multi-Criteria Decision Making) to evaluate alternatives in MCDM problems. Mathematical properties of the proposed Entropy were investigated. Besides, they carried out computational and comparative analyses to confirm the validity and stability of the results.
Li et al. [44] addressed the machine tool selection problem in the manufacturing industry. They employed an integrated approach based on the fuzzy DEMATEL (DEcision MAking Trial and Evaluation Laboratory) and Entropy methods to calculate the criteria weights. Then a methodology based on the VIKOR method was applied to select an appropriate machining tool. A case-based analysis and a sensitivity analysis were performed to assess the efficiency of the proposed approach. The analyses showed that their method is efficient, and the results are valid.
A study carried out by Görçün [45] on the problem of selecting an appropriate container seaport in the Black Sea region. The study presented two hybrid multi-criteria decision-making approaches. The first approach used the Entropy and OCRA (Operational Competitiveness RAting) methods, and the second was based on the Entropy and EATWIOS (Efficiency Analysis Technique WIth Output Satisfying). The Borda method was also used to merge the results of the approaches. Although the proposed approaches were applied to a significant problem, there were not enough analyses to verify and compare the results.
Zha et al. [46] developed a hybrid multi-criteria decision-making approach. The problem of facility layout evaluation was addressed in their study. An integration of Delphi, fuzzy ANP (Analytic Network Process), and Entropy were employed to obtain the criteria weights. Then a fuzzy extension of PROMETHEE was applied to evaluate facility layout alternatives. They compared the results of their proposed approach with several MCDM approaches in different levels of uncertainty. The comparative analysis showed that the approach could efficiently deal with this type of problem.
Alao et al. [47] presented a study on evaluating technologies used in the waste-to-energy process. They defined this problem as a multi-criteria decision-making problem. The Entropy method was applied to compute the weights of criteria. Electricity generation potential, technology maturity, investment cost, cost of energy, operation and maintenance cost, and carbon dioxide emission were the criteria for the evaluation. Moreover, the TOPSIS method was applied to make the evaluation. They used a case in Lagos, Nigeria, to show the applicability of their methodology.
A study in the field of crisis management was also used as an objective weighting method. Salehi et al. [48] chose five petrochemical plants and evaluated their crisis management systems in three criteria: technical, human, and organizational. They calculated the weights of these criteria using the Entropy method. According to their results, the human factor was the most critical criterion in their study. Then, the TOPSIS method and the obtained weights were utilized to evaluate the petrochemical plants. A shortcoming of their study was the lack of comparative analysis and sensitivity analyses to verify and validate the results.
In a study of groundwater vulnerability assessment, Torkashvand et al. [49] used the Entropy, SWARA (Stepwise Weight Assessment Ratio Analysis), and GA (Genetic Algorithm) methods to improve the DRASTIC (Depth to the water table, net Recharge, Aquifer media, Soil media, Topography, Impact of the vadose zone, and hydraulic Conductivity) framework. They used the data of nitrate concentration gathered from 50 wells in the study region. Their study shows the importance of using objective and subjective weighting methods in dealing with vital environmental problems and improving the decisions related to human lives.
Wang et al. [50] focused on a particular supplier selection problem. They studied battery-swapping stations as essential infrastructures in promoting electric vehicles (EVs) and their inevitable concerns about selecting appropriate battery suppliers. An MCDM framework was proposed in their article to evaluate the suppliers under uncertainty. The uncertainty of data was defined using triangular fuzzy numbers. The problem of their study consisted of four suppliers and fifteen criteria. They utilized the Entropy method to determine the weights of criteria. Then, the MULTIMOORA method was employed in evaluating the suppliers.
In addition to the Entropy and Standard Deviation methods, the CRITIC method is an efficient objective weighting method that incorporates the standard deviation of data related to each criterion and the correlation between the criteria. Like the Standard Deviation and Entropy methods, this method has also been developed in many research types and applied to different MCDM problems. Shipboard crane selection [51], healthcare management evaluation [52], configuration optimization in energy systems [53], supply chain risk management [54], financial risk evaluation [52], quality assessment of wireless networks [55], urban transportation [56], location planning [57], third-party logistics providers [58], air quality assessment [59], waste disposal [60], and outsourcing evaluation [61] are some of the recent and essential real-life problems in which the CRITIC method has been applied.
Table 1 presents a summary of the above-mentioned studies.
The basis of the objective weighting methods used in the MCDM field is commonly the input or the decision matrix. Unlike the former methods, this study aims to introduce a novel objective weighting method, called MEREC, based on the relation between input or decision-matrix and its effect on the output or the performance of alternatives. In other words, we can say that causality is the foundation of MEREC.

3. Proposed Method

In this section, a new method based on the removal effects of criteria (MEREC) is proposed to determine the criteria’ weights in a multi-criteria decision-making problem. This method is in the category of objective weighting methods for obtaining criteria weights. As previously mentioned, the MEREC uses each criterion’s removal effect on the performance of alternatives to determine criteria weights. Greater weights are assigned to the criteria that have higher effects on the performances. In this method, we should define a measure for the performances of alternatives first. In this study, a simple logarithmic measure is used with equal weights to calculate alternatives’ performances. To identify the effects of removing each criterion, we use the absolute deviation measure. This measure reflects the difference between the overall alternative’s performance and its performance in removing a criterion. The following steps are used to calculate objective weights by MEREC.
Step 1: Construct the decision matrix. A decision matrix is constructed in this step, which shows each alternative’s ratings or values concerning each criterion. The elements of this matrix are denoted by x i j , and these elements should be greater than zero ( x i j > 0 ). If we have negative values in the decision matrix, they should be transformed into positive values using an appropriate technique. Suppose that there are n alternatives and m criteria, and the form of the decision-matrix is as follows:
X = [ x 11 x 12 x 1 j x 1 m x 21 x 22 x 2 j x 2 m x i 1 x i 2 x i j x i m x n 1 x n 2 x n j x n m ]
Step 2: Normalize the decision matrix ( N ). In this step, a simple linear normalization is used to scale the elements of the decision-matrix. The elements of the normalized matrix are denoted by n i j x . If B shows the set of beneficial criteria, and H represents the set of non-beneficial criteria, we can utilize the following equation for normalization:
n i j x = { min k x k j x i j           i f           j B x i j max k x k j           i f           j H
  • It should be noted that the normalization process is similar but different from the process used in methods like WASPAS. The difference is in switching between the formulas of beneficial and non-beneficial criteria. Unlike many other studies, we transform all the criteria into the minimization type criteria.
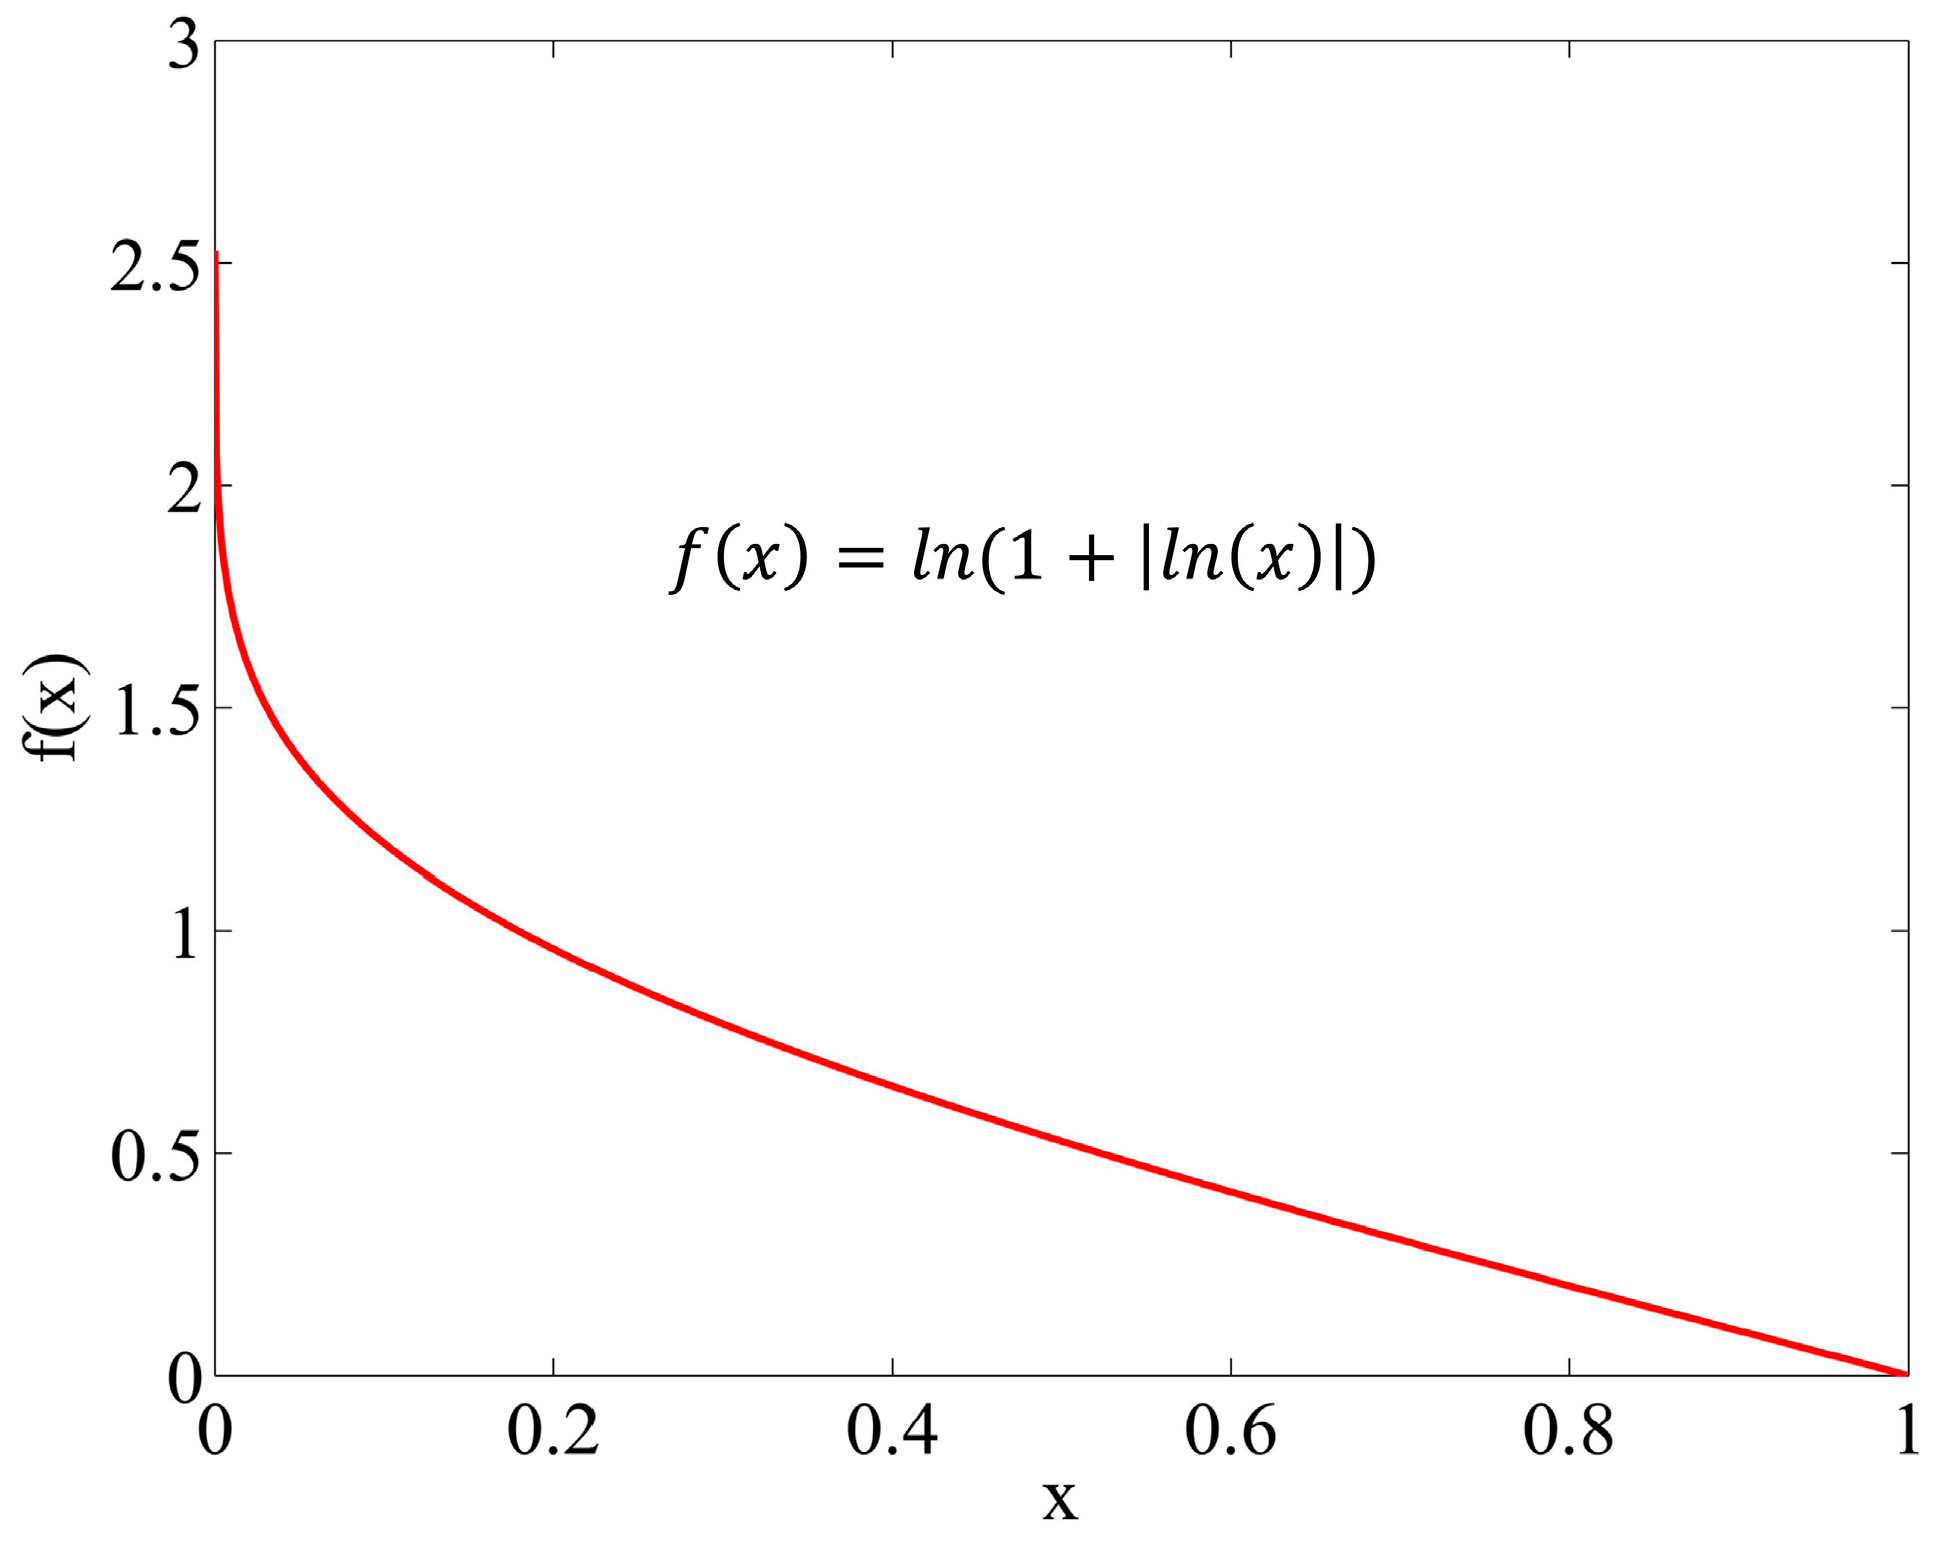
Step 3: Calculate the overall performance of the alternatives ( S i ). A logarithmic measure with equal criteria weights is applied to obtain alternatives’ overall performances in this step. This measure is based on a non-linear function depicted in Figure 1. According to the normalized values obtained from the previous step, we can ensure that smaller values of n i j x yield greater values of performances ( S i ). The following equation is used for this calculation:
S i = l n ( 1 + ( 1 m j | l n ( n i j x ) | ) )
Step 4: Calculate the performance of the alternatives by removing each criterion. In this step, we use the logarithmic measure in a similar way to the previous step. The difference between this step and Step 3 is that the alternatives’ performances are calculated based on removing each criterion separately. Therefore, we have m sets of performances associated with m criteria. Let us denote by S i j the overall performance of i th alternative concerning the removal of j th criterion. The following equation is used for the calculations of this step:
S i j = l n ( 1 + ( 1 m k , k j | l n ( n i k x ) | ) )
Step 5: Compute the summation of absolute deviations. In this step, we calculate the removal effect of the j th criterion based on the values obtained from Step 3 and Step 4. Let E j denote the effect of removing j th criterion. We can calculate the values of E j using the following formula:
E j = i | S i j S i |
Step 6: Determine the final weights of the criteria. In this step, each criterion’s objective weight is calculated using the removal effects ( E j ) of Step 5. In what follows, w j stands for the weight of the j th criterion. The following equation is used for the calculation of w j :
w j = E j k E k

4. Computational Analyses

In this section, we present three sub-sections. The first sub-section using a simple example systematically illustrates the way of using the MEREC. The second sub-section performs a comparative analysis to show that the results of MEREC are valid and congruent with those of existing objective criteria weight determination methods. The third subsection presents a simulation-based analysis to test the variability of the results obtained by MEREC.

4.1. Illustrative Example

To illustrate the procedure of utilizing MEREC for criteria weights determination, we use a simple decision matrix in this sub-section.
Step 1: Table 2 shows the elements of this decision matrix. As shown in Table 2, we have five alternatives, two beneficial criteria, and two non-beneficial criteria.
Step 2: Decision-makers use Equation (2) and obtain the normalized decision matrix. Table 3 represents this matrix.
Step 3: In this step, decision-makers should obtain the overall performances of the alternatives. They calculate these values based on Equation (3):
S 1 = l n ( 1 + ( 1 4 ( | l n ( 0.011 ) | + | l n ( 1 ) | + | l n ( 1 ) | + | l n ( 0.895 ) | ) ) ) = 0.77
S 2 = l n ( 1 + ( 1 4 ( | l n ( 0.5 ) | + | l n ( 0.879 ) | + | l n ( 0.037 ) | + | l n ( 0.988 ) | ) ) ) = 0.71
S 3 = l n ( 1 + ( 1 4 ( | l n ( 0.05 ) | + | l n ( 0.976 ) | + | l n ( 0.574 ) | + | l n ( 0.944 ) | ) ) ) = 0.65
S 4 = l n ( 1 + ( 1 4 ( | l n ( 0.023 ) | + | l n ( 0.86 ) | + | l n ( 0.019 ) | + | l n ( 1 ) | ) ) ) = 1.09
S 5 = l n ( 1 + ( 1 4 ( | l n ( 1 ) | + | l n ( 0.952 ) | + | l n ( 0.426 ) | + | l n ( 0.975 ) | ) ) ) = 0.21
Step 4: Based on Equation (4), decision-makers calculate the alternatives’ overall performances by removing each criterion ( S i j ) in this step. Table 4 shows these values. To clarify the process of calculation, in the following, we present two examples. S 11 is the overall performance of A 1 related to the removal of C 1 , and S 34 is the overall performance of A 3 connected with the removal of C 4 .
S 11 = l n ( 1 + ( 1 4 ( | l n ( 1 ) | + | l n ( 1 ) | + | l n ( 0.895 ) | ) ) ) = 0.03
S 34 = l n ( 1 + ( 1 4 ( | l n ( 0.05 ) | + | l n ( 0.976 ) | + | l n ( 0.574 ) | ) ) ) = 0.64
Step 5: Decision-makers calculate the removal effect of each criterion on the overall performance of the alternatives based on the deviation-based formula of Equation (5), the results of Step 3, and the values of Table 4. These values are determined as follows:
E 1 = | 0.03 0.77 | + | 0.62 0.71 | + | 0.15 0.65 | + | 0.71 1.09 | + | 0.21 0.21 | = 1.71
E 2 = | 0.77 0.77 | + | 0.69 0.71 | + | 0.64 0.65 | + | 1.08 1.09 | + | 0.20 0.21 | = 0.04
E 3 = | 0.77 0.77 | + | 0.19 0.71 | + | 0.57 0.65 | + | 0.68 1.09 | + | 0.02 0.21 | = 1.19
E 4 = | 0.75 0.77 | + | 0.71 0.71 | + | 0.64 0.65 | + | 1.09 1.09 | + | 0.20 0.21 | = 0.03
Step 6: Calculation of each criterion’s weight is performed based on the effect of their removal on the performance of the alternatives. Using Equation (6) and the values computed in the previous section, we calculate the weights as follows:
k E k = 1.71 + 0.04 + 1.19 + 0.03 = 2.97
w 1 = 1.71 2.97 = 0.5752
w 2 = 0.04 2.97 = 0.0141
w 3 = 1.19 2.97 = 0.4016
w 4 = 0.03 2.97 = 0.0091

4.2. Comparative Example

The authors borrowed an MCDM example from [62] and used it for comparative analysis. Table 5 represents the data of this example, including ten alternatives and seven criteria. The authors chose three objective weighting methods to determine the criteria weights and to perform the analysis. The research compares criteria weights determined using CRITIC, Entropy, and Standard Deviation with the weights resulted from the proposed method in this sub-section.
Table 6 shows the criteria weights determined by each method and the related Pearson correlation coefficients ( r ). Figure 2 also represents these weights. The values of r in the last row of Table 6 reflect the relationship between the results of MEREC and those of the other considered methods in a significance level of α = 0.05 (confidence level of 95%). The authors used a normalized decision matrix based on the linear normalization used in WASPAS [63] to calculate the criteria weights by CRITIC, Entropy, and Standard Deviation, and the CRITIC method skipped the normalization step.
Suppose the value of the correlation coefficient between two variables is more significant than 0.4. In that case, we can say that there is a moderate relationship between them, and if the value is more significant than 0.6, the relationship is substantial [64]. According to the values of r shown in Table 6, we can see that the criteria weights determined using MEREC have a strong relationship with weights from CRITIC, Entropy, and Standard Deviation. Figure 2 shows that the trend in varying criteria weights in MEREC is similar to the other methods considered in the comparative analysis. Therefore, the MEREC yields results that can be considered credible and reliable weights for the criteria in MCDM problems.

4.3. Simulation-Based Analysis

This sub-section examines the stability of the proposed method using a simulation-based study. The authors generated several decision matrices for this purpose and compared the results of the MEREC with those of the CRITIC, Entropy, and Standard Deviation methods. Besides, the authors examined the homogeneity of criteria weights variances determined by MEREC. Generated decision matrices fall into three categories: (i) 5 alternatives and 5 criteria, (ii) 10 alternatives and 10 criteria, and (iii) 20 alternatives and 20 criteria. The authors generated a decision matrix for each category ten times (ten sets in each category) for simulation, and the values of the matrices follow the symmetric distribution. The authors used the normal distribution with a mean of 10 and a standard deviation of 1. The authors used these generated decision matrices to obtain criteria weights using the MEREC, and they can be found (in a format compatible with MATLAB) in Ref. [65]. ANOM for variances is an efficient test to examine the homogeneity of variances in the obtained results [66]. ANOM for variances with Levene provides us with a test for comparing the group means of the absolute deviations from the median (ADM) to the overall mean ADM [67]. The authors used the JMP-SAS software to perform all the statistical tests. Table 7, Table 8 and Table 9, show the criteria weights determined by MEREC in each set of the generated decision matrices of category (i), category (ii), and category (iii), respectively.
Like in the previous sub-section, to compare the results of MEREC in the different categories of simulation with other methods, we use correlation coefficients in a significance level of α = 0.05 (confidence level of 95%). Table 10 presents these values in the sets of each category of simulation, and all the p-values are smaller than the significance level. Besides, Figure 3 graphically depicts these values. In this figure, the degrees of relationship are illustrated using different background colors in different classes defined by Walters [64], i.e., red for r < 0.2 or very weak relationship, orange for 0.2 r < 0.4 or weak relationship, yellow for 0.4 r < 0.6 or moderate relationship, blue for 0.6 r < 0.8 or strong relationship, and green for 0.8 r or very strong relationship. Based on Table 10 and Figure 3, we can see that all the average correlation coefficient values in all categories are more significant than 0.4, so the moderate relationship between the results can be concluded. However, the correlation values decrease when the size of the problem increases. Therefore, we cannot say that MEREC behaves like the other methods in all circumstances.
In the case of the large-size problems, to understand the behavior of MEREC in comparison to the other methods considered in this study, we can calculate the variance (or standard deviation) of the weights in each set of category (iii). Table 11 shows the results. Greater values of the variance show that the method can distinguish different criteria weights in a more efficient way. According to Table 11, the values of variance for Entropy and MEREC are more than those of CRITIC and Standard Deviation. It shows that MEREC is relatively efficient in differentiating between the weights of criteria.
As previously mentioned, to examine the stability of the results of MEREC, we use ANOM for variances with Levene (ADM). This analysis helps us to have a graphical representation for verifying the homogeneity of variances. The graphical representation has three variables: the overall mean ADM is the centerline, upper decision limits (UDL) and lower decision limits (LDL). If a group (set) standard deviation falls outside of the decision limits, then that standard deviation is significantly different from the overall mean ADM, and we have heterogeneity in variances. In other words, if the standard deviations of all sets are between LDL and UDL, homogeneity of variances is confirmed. Table 7, Table 8 and Table 9 show the criteria weights for this analysis.
Figure 4, Figure 5 and Figure 6 demonstrate the results of the analysis for category (i), category (ii), and category (iii).
The interpretation of Figure 4, Figure 5 and Figure 6 (ANOM techniques) is like interpreting control charts used in SPC (Statistical Process Control).
As shown in these figures, all the mean ADM values in different simulation categories are between decision limits (LDL and UDL). Accordingly, the simulation-based analysis shows the homogeneity of variances. This analysis also demonstrates the stability of the results determined by MEREC.

5. Conclusions

Determination of criteria weights is a vital function in a multi-criteria decision-making process. Researchers usually divide weighting methods into subjective and objective methods. Direct judgements and opinions of decision-makers are the basis for determining the subjective weights of criteria. Meanwhile, the initial data defined in the MCDM problem-solving matrices support objective criteria weights. In this study, we focused on objective weighting methods. A new objective weighting method, called MEREC, has been introduced in this research. The idea of the proposed method is different from the other objective weighting methods. Most of the methods for determining objective weights use variations in criteria to calculate the weights. However, in the method introduced, the removal effects of criteria on alternatives’ performances are considered a measure for weighting. It is a novel perspective on the determination of objective criteria weights. MCDM methods may yield different results for individual problems. However, their various perspectives in defining problems and providing solutions can help researchers and practitioners justify their application. While a method could be efficient for solving a problem, it may be less efficient or inefficient for dealing with another. For example, the SAW and TOPSIS methods use completely different decision-making ideas, and decision-makers can use them depending on different circumstances and problems’ characteristics.
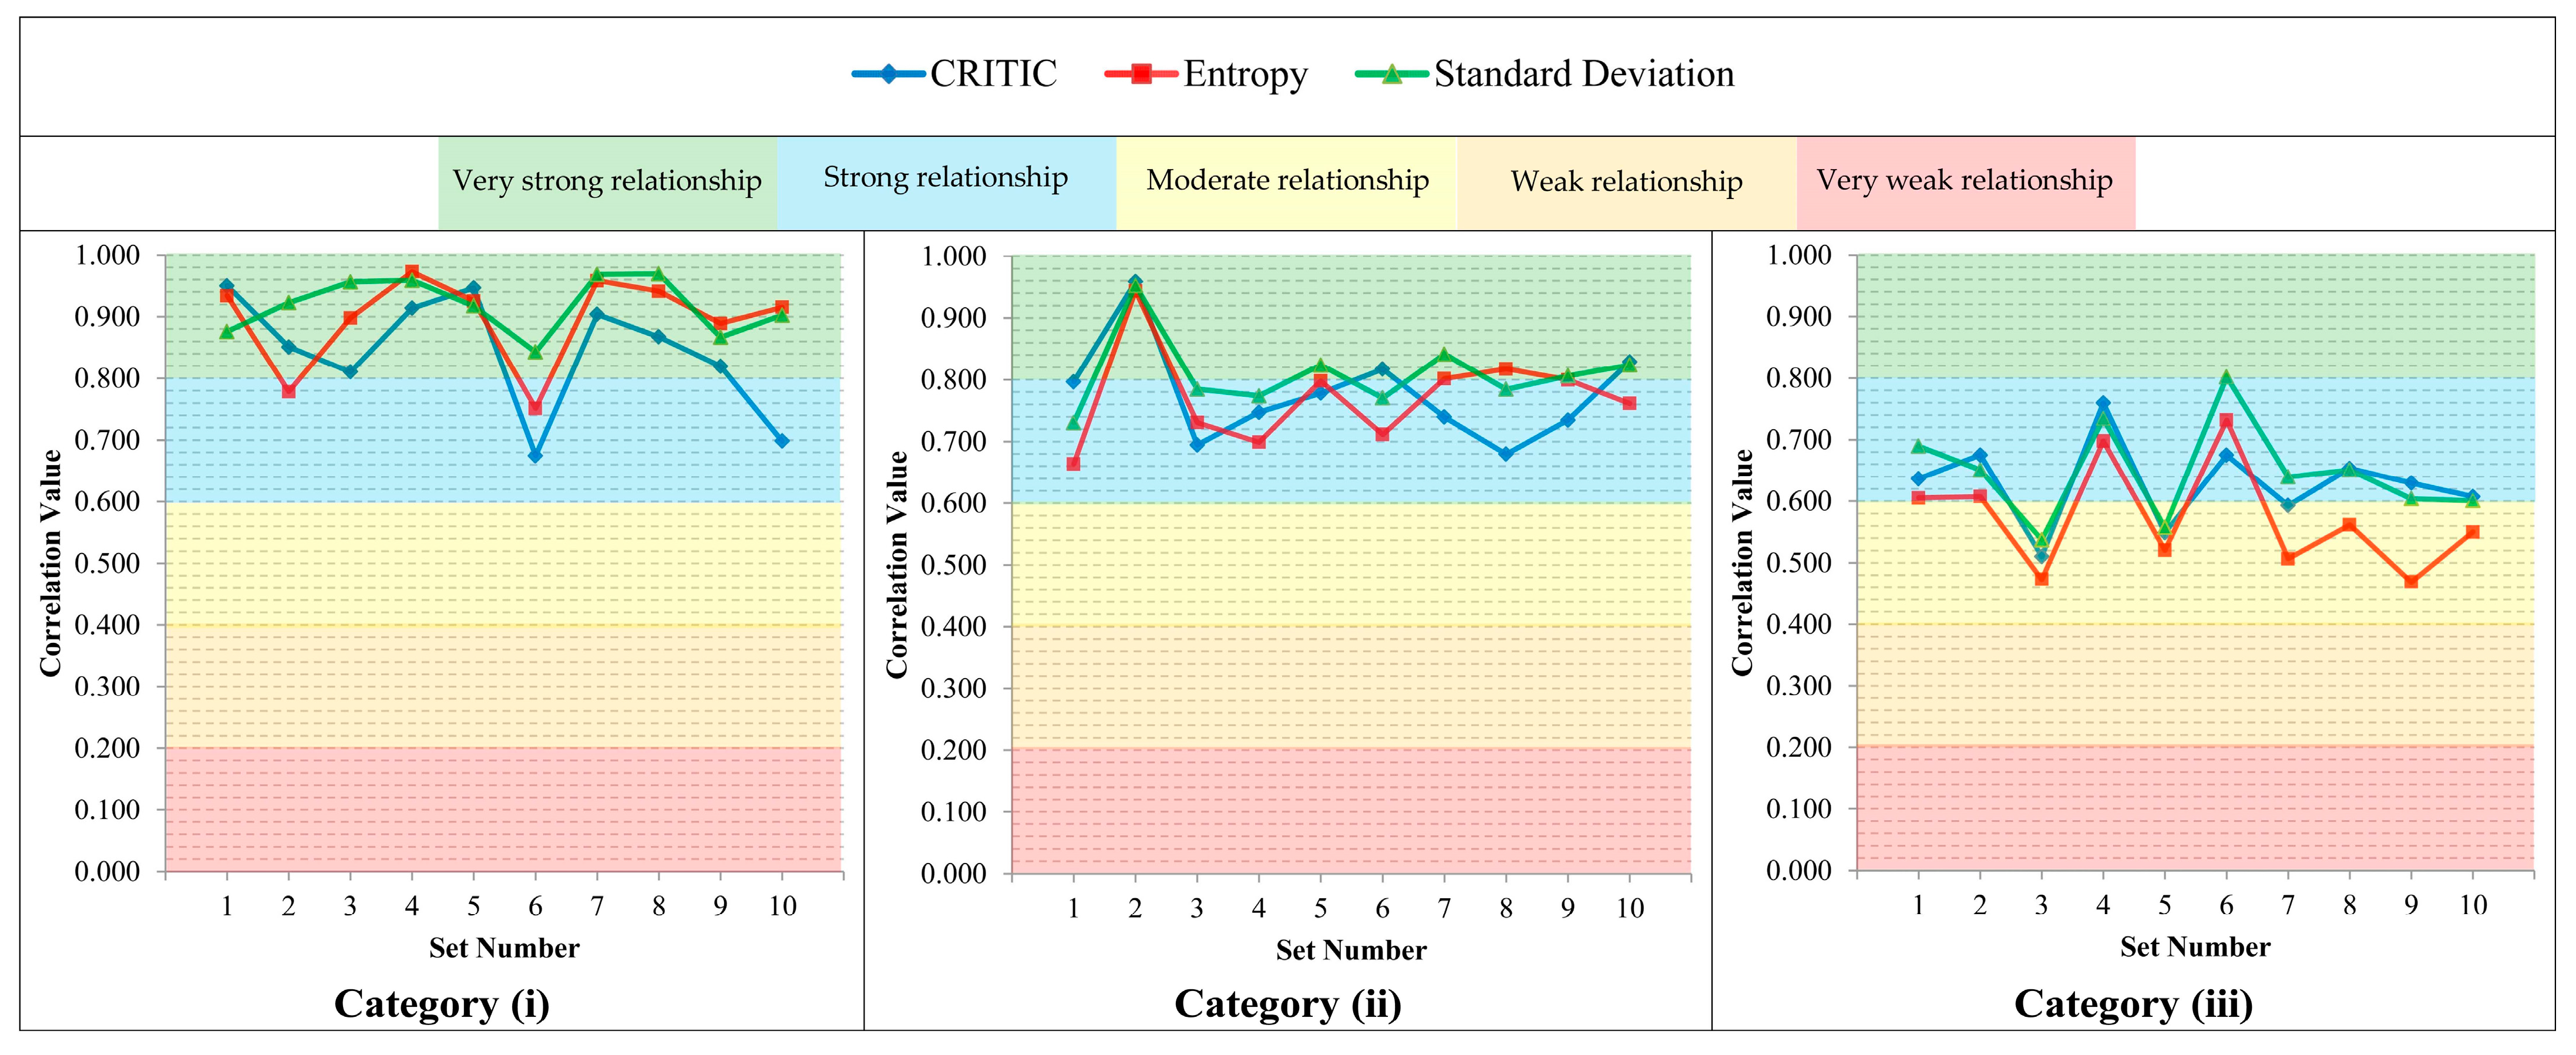
Although we defined the process of weighting criteria based on a new perspective in the proposed method, the results were consistent with the other objective weighting methods. The simulation-based analysis shows that the correlation between the MEREC and the results of other methods decreases with increasing problem size. Therefore, we cannot say that the MEREC behaves like the other methods in all circumstances. However, the way we used for validation (i.e., comparative and simulation-based analyses) is the most prevalent literature approach. It may be considered an essential limitation of this study and many other studies addressing MCDM problems. We can claim that introducing new MCDM methods based on novel perspectives could ensure the robustness of results. Specifically, by integrating weighting methods, decision-makers can obtain weights that are more reliable.
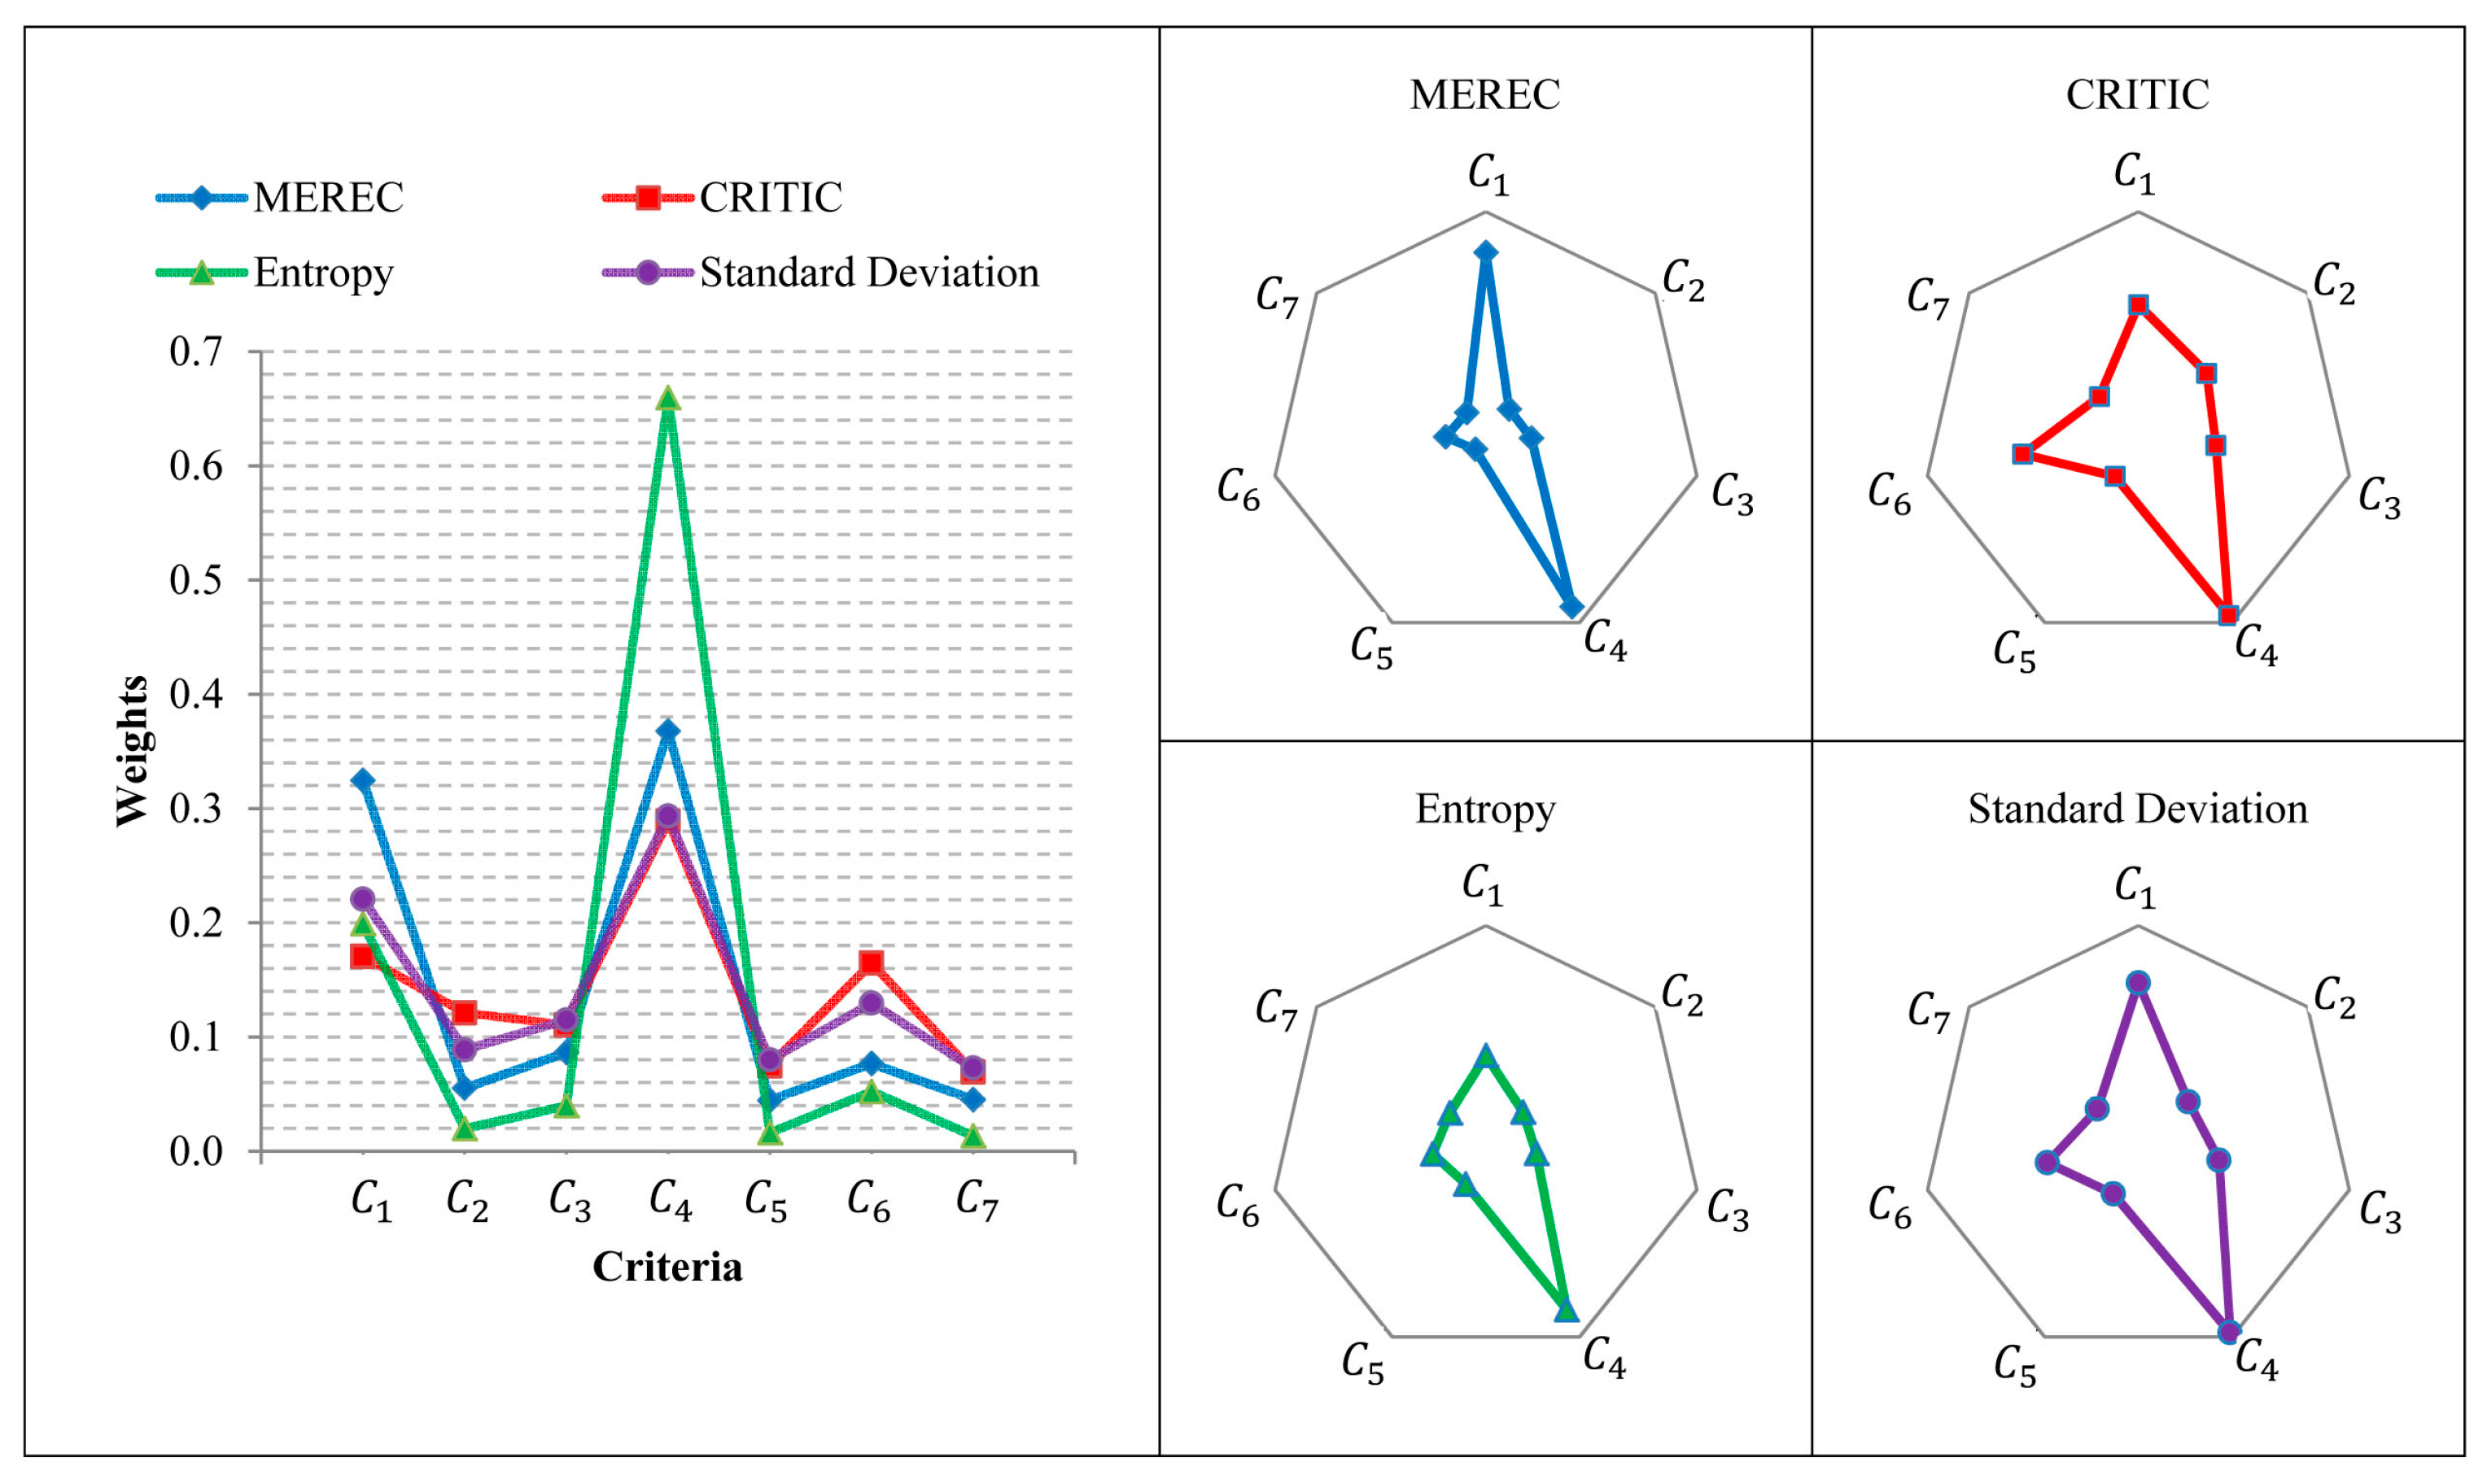
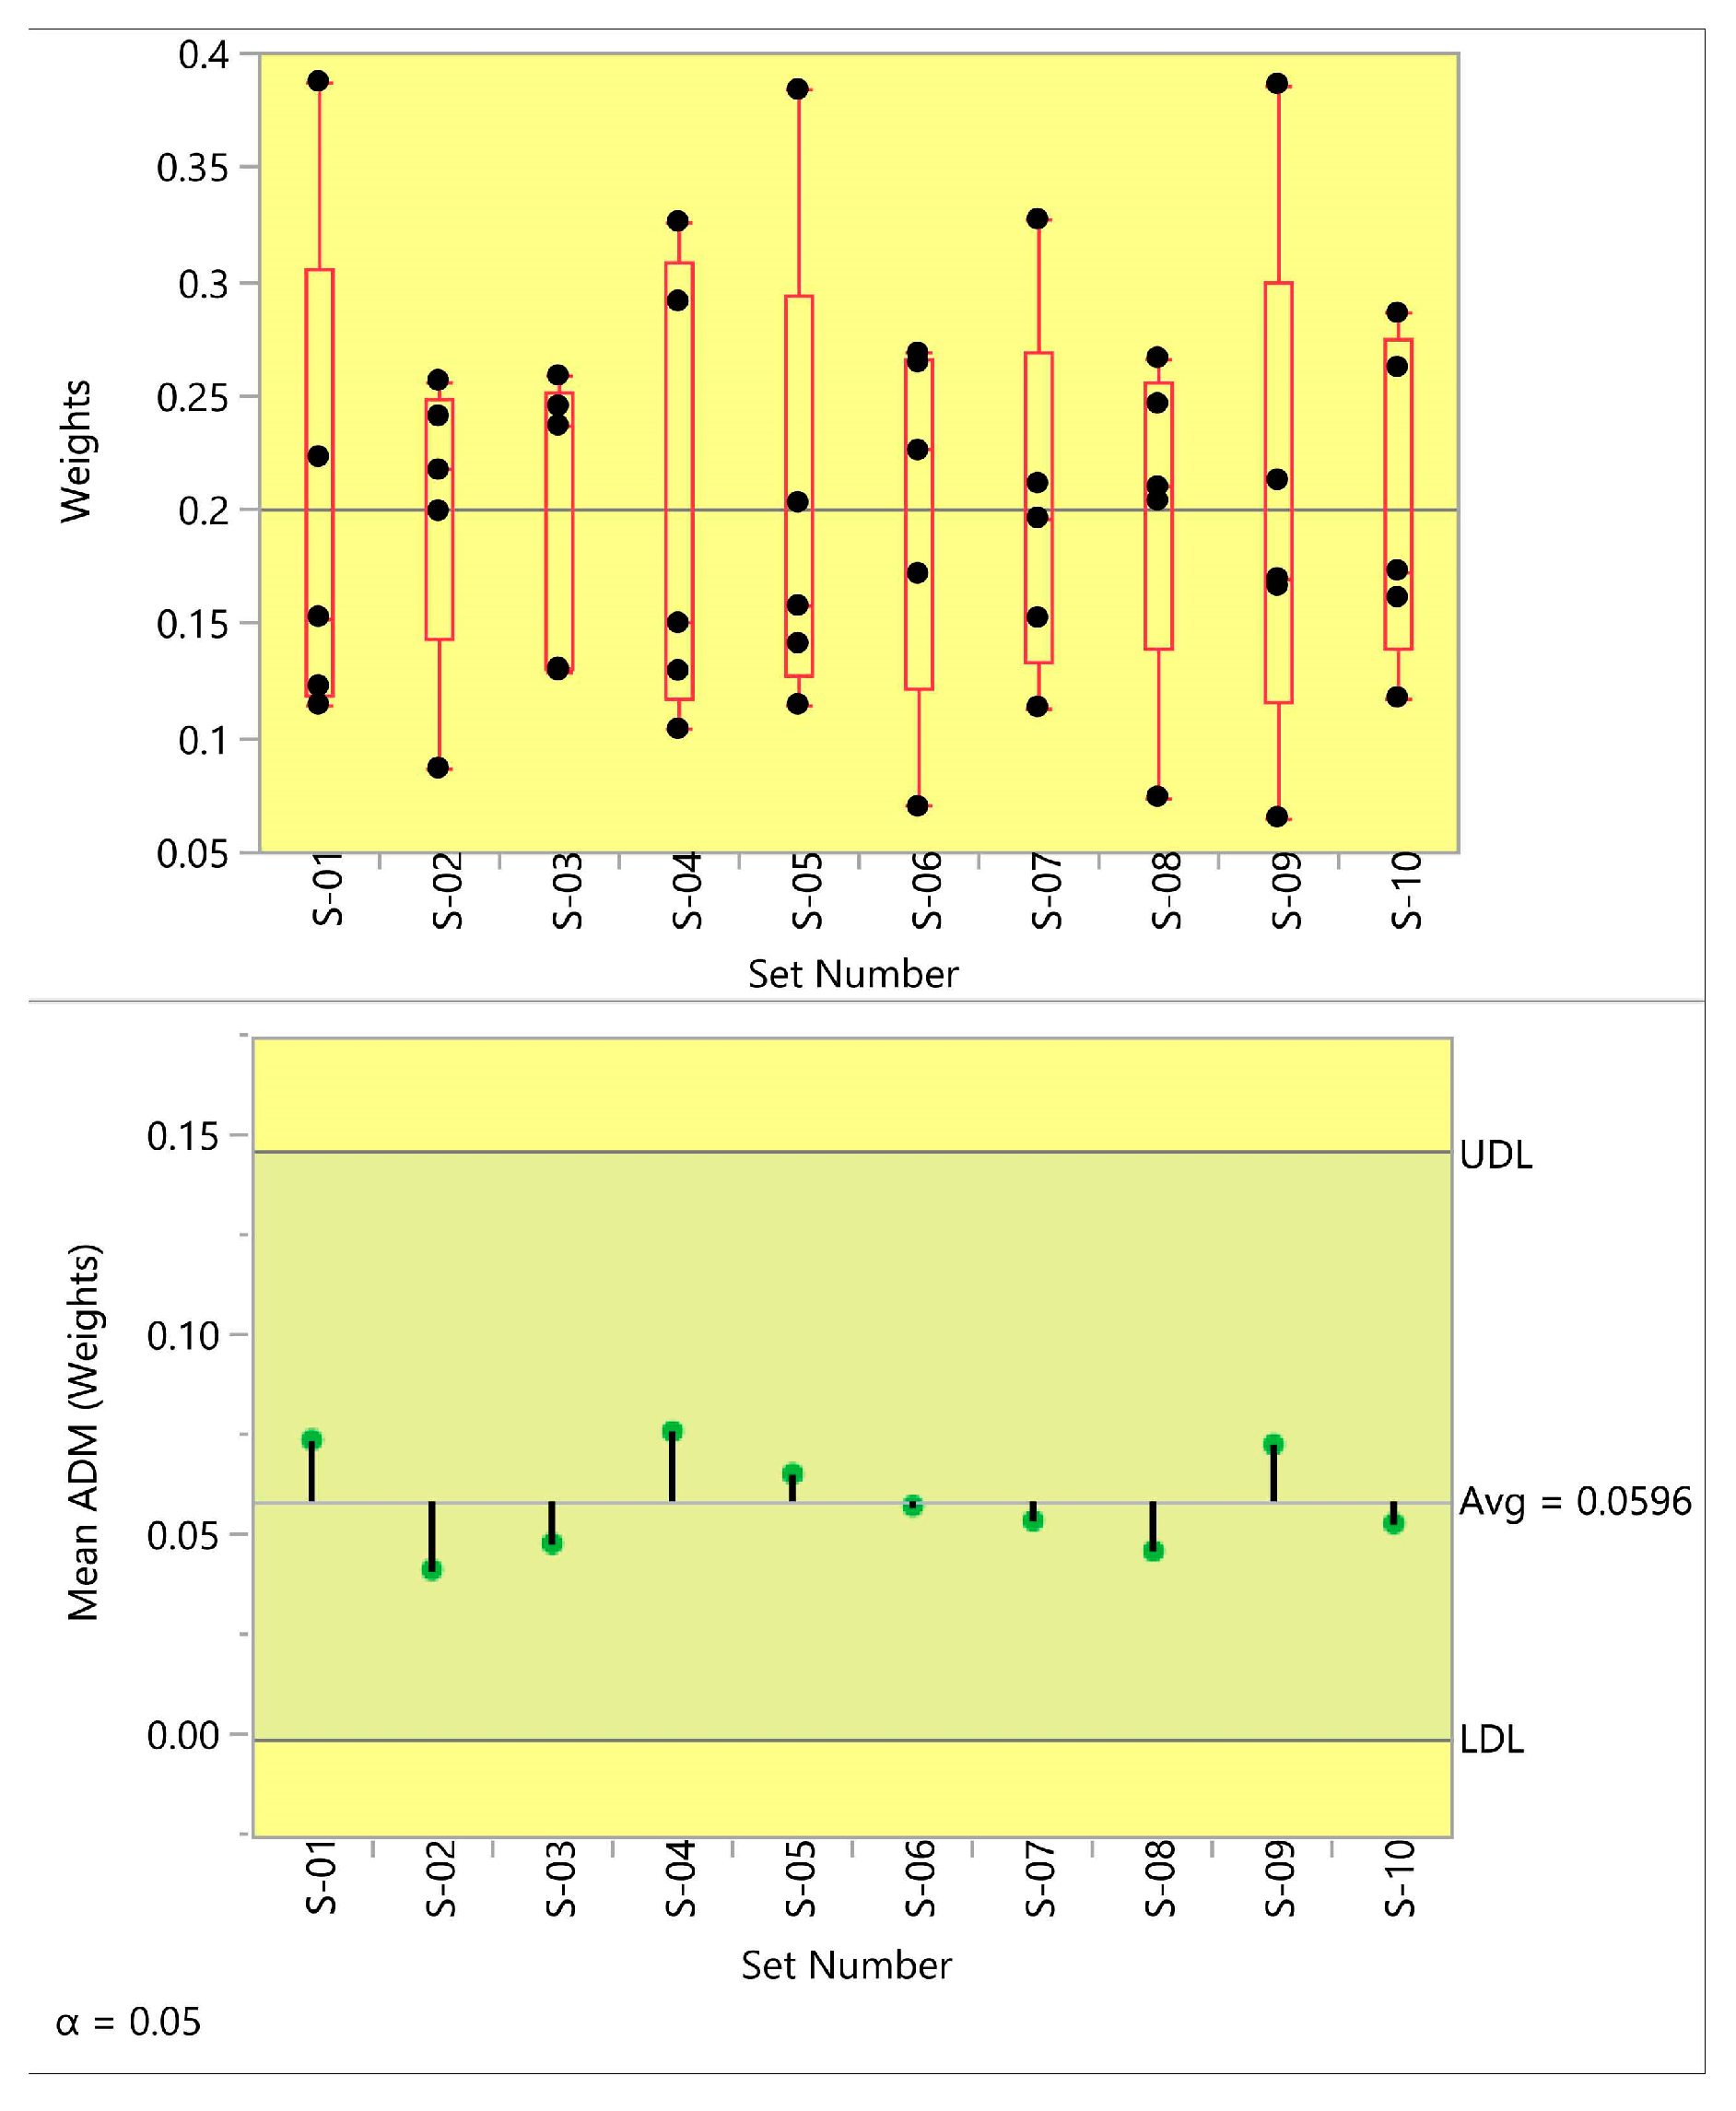
We have used a simple example to illustrate the steps of using the MEREC. The authors used another numerical example to compare the results of the MEREC with the results of the CRITIC, Entropy, and Standard Deviation methods. The values of the correlation coefficients between the results have shown that MEREC yields credible weights for the criteria. Finally, the authors performed a simulation-based analysis, generating MCDM problems whose data follow a prevalent symmetric distribution (normal distribution). The authors carried out two types of analyses based on the generated data. First, a comparison verifies the reliability of the results of MEREC. Then, the use of the ANOM for variances checked the stability of the results. The simulation-based analysis shows that the weights resulted from the MEREC are relatively reliable and stable weights. Thus, the method introduced is efficient and suitable to determine objective criteria weights. The performance measure function plays an essential role in the determination of the weight by MEREC. We used a logarithmic function to measure alternatives performances. Future research can investigate using other functions like multiplicative functions, distance-based functions, i.e., functions used in WASPAS, TOPSIS, and VIKOR.
Moreover, integrating MEREC with the other objective and subjective weighting methods like Entropy, IDOCRIW (Integrated Determination of Objective CRIteria Weights), WEBIRA (Weight Balancing Indicator Ranks Accordance), ACW (Adaptive Criteria Weights), SWARA and considering other methods of expert evaluation can be the focus in future research [68,69,70,71,72]. Another area for future research could be to apply the proposed method to real-world problems, such as designing geographic information systems, economic indicators assessment, evaluations in tourism management, and pollution management [2,73,74,75]. Future research can be enriched by the proposed method in a vaguely determined environment, e.g., fuzzy and neutrosophic environments [3,76,77].

Author Contributions

Conceptualization, M.K.-G., E.K.Z., and Z.T.; methodology, M.K.-G., M.A., E.K.Z.; validation, M.K.-G. and J.A.; formal analysis, M.K.-G. and J.A.; investigation, M.K.-G., M.A., and Z.T.; writing—original draft preparation, M.K.-G. and M.A.; writing—review and editing, E.K.Z., J.A., and Z.T. All authors have read and agreed to the published version of the manuscript.

Funding

This research received no external funding.

Conflicts of Interest

The authors declare no conflict of interest.

References

  1. Abdulgader, F.S.; Eid, R.; Daneshvar Rouyendegh, B. Development of Decision Support Model for Selecting a Maintenance Plan Using a Fuzzy MCDM Approach: A Theoretical Framework. Appl. Comput. Intell. Soft Comput. 2018, 2018, 9346945. [Google Scholar] [CrossRef]
  2. Samanlioglu, F.; Burnaz, A.N.; Diş, B.; Tabaş, M.D.; Adıgüzel, M. An Integrated Fuzzy Best-Worst-TOPSIS Method for Evaluation of Hotel Website and Digital Solutions Provider Firms. Adv. Fuzzy Syst. 2020, 2020, 8852223. [Google Scholar] [CrossRef]
  3. Irvanizam, I.; Usman, T.; Iqbal, M.; Iskandar, T.; Marzuki, M. An Extended Fuzzy TODIM Approach for Multiple-Attribute Decision-Making with Dual-Connection Numbers. Adv. Fuzzy Syst. 2020, 2020, 6190149. [Google Scholar] [CrossRef]
  4. Muangman, J.; Krootsong, K.; Polrong, P.; Yukunthorn, W.; Udomsap, W. Fuzzy Multicriteria Decision-Making for Ranking Intercrop in Rubber Plantations under Social, Economic, and Environmental Criteria. Adv. Fuzzy Syst. 2020, 2020, 6508590. [Google Scholar] [CrossRef]
  5. Zapolskytė, S.; Burinskienė, M.; Trepanier, M. Evaluation criteria of smart city mobility system using MCDM method. Balt. J. Road Bridge Eng. 2020, 15, 196–224. [Google Scholar] [CrossRef]
  6. Ueasin, N. Decision-making on Public Transportation Services Based on the Socio-economic, Psychological, and Environmental Concern Factors. Open Transp. J. 2020, 14. [Google Scholar] [CrossRef]
  7. Zagorskas, J.; Turskis, Z. Location preferences of new pedestrian bridges based on multi-criteria decision-making and GIS-based estimation. Balt. J. Road Bridge Eng. 2020, 15, 158–181. [Google Scholar] [CrossRef]
  8. Alakaş, H.M.; Gür, Ş.; Özcan, E.; Eren, T. Ranking of sustainability criteria for industrial symbiosis applications based on ANP. J. Environ. Eng. Landsc. Manag. 2020, 28, 192–201. [Google Scholar] [CrossRef]
  9. Keshavarz-Ghorabaee, M.; Govindan, K.; Amiri, M.; Zavadskas, E.K.; Antuchevičienė, J. An integrated type-2 fuzzy decision model based on WASPAS and SECA for evaluation of sustainable manufacturing strategies. J. Environ. Eng. Landsc. Manag. 2019, 27, 187–200. [Google Scholar] [CrossRef]
  10. He, T.; Wei, G.; Lu, J.; Wu, J.; Wei, C.; Guo, Y. A novel EDAS based method for multiple attribute group decision making with Pythagorean 2-tuple linguistic information. Technol. Econ. Dev. Econ. 2020, 26, 1125–1138. [Google Scholar] [CrossRef]
  11. Lin, P.-P.; Li, D.-F.; Jiang, B.-Q.; Yu, G.-F.; Wei, A.-P. Evaluating the comprehensive impacts of tourism in Hainan by intergrating input-output model with MCDM methods. Technol. Econ. Dev. Econ. 2020, 26, 989–1029. [Google Scholar] [CrossRef]
  12. Ban, A.I.; Ban, O.I.; Bogdan, V.; Popa, D.C.S.; Tuse, D. Performance evaluation model of Romanian manufacturing listed companies by fuzzy AHP and TOPSIS. Technol. Econ. Dev. Econ. 2020, 1–29. [Google Scholar] [CrossRef]
  13. Mi, X.; Liao, H.; Liao, Y.; Lin, Q.; Lev, B.; Al-Barakati, A. Green suppler selection by an integrated method with stochastic acceptability analysis and MULTIMOORA. Technol. Econ. Dev. Econ. 2020, 26, 549–572. [Google Scholar] [CrossRef]
  14. Tian, C.; Peng, J.; Zhang, W.; Zhang, S.; Wang, J. Tourism environmental impact assessment based on improved AHP and picture fuzzy PROMETHEE II methods. Technol. Econ. Dev. Econ. 2020, 26, 355–378. [Google Scholar] [CrossRef]
  15. Tabatabaei, M.H.; Amiri, M.; Ghahremanloo, M.; Keshavarz-Ghorabaee, M.; Zavadskas, E.K.; Antucheviciene, J. Hierarchical decision-making using a new mathematical model based on the Best-Worst Method. Int. J. Comput. Commun. Control 2020, 14, 710–725. [Google Scholar] [CrossRef] [Green Version]
  16. Roszkowska, E. Rank Ordering criteria weighting methods–a comparative overview. Optim. Studia Ekon. 2013, 5, 14–33. [Google Scholar] [CrossRef]
  17. Alfares, H.K.; Duffuaa, S.O. Simulation-based evaluation of criteria rank-weighting methods in multi-criteria decision-making. Int. J. Inf. Technol. Decis. Mak. 2016, 15, 43–61. [Google Scholar] [CrossRef] [Green Version]
  18. Wang, J.-J.; Jing, Y.-Y.; Zhang, C.-F.; Zhao, J.-H. Review on multi-criteria decision analysis aid in sustainable energy decision-making. Renew. Sustain. Energy Rev. 2009, 13, 2263–2278. [Google Scholar] [CrossRef]
  19. Ginevičius, R. A new determining method for the criteria weights in multicriteria evaluation. Int. J. Inf. Technol. Decis. Mak. 2011, 10, 1067–1095. [Google Scholar] [CrossRef]
  20. Zardari, N.H.; Ahmed, K.; Shirazi, S.M.; Yusop, Z.B. Weighting Methods and their Effects on Multi-Criteria Decision Making Model Outcomes in Water Resources Management; Springer: New York, NY, USA, 2014. [Google Scholar]
  21. Kao, C. Weight determination for consistently ranking alternatives in multiple criteria decision analysis. Appl. Math. Model. 2010, 34, 1779–1787. [Google Scholar] [CrossRef]
  22. Wu, H.-W.; Zhen, J.; Zhang, J. Urban rail transit operation safety evaluation based on an improved CRITIC method and cloud model. J. Rail Transp. Plan. Manag. 2020, 16, 100206. [Google Scholar] [CrossRef]
  23. Delice, E.K.; Can, G.F. A new approach for ergonomic risk assessment integrating KEMIRA, Best–Worst and MCDM methods. Soft Comput. 2020, 24, 15093–15110. [Google Scholar] [CrossRef]
  24. Freeman, J.; Chen, T. Green supplier selection using an AHP-Entropy-TOPSIS framework. Supply Chain Manag. Int. J. 2015. [Google Scholar] [CrossRef] [Green Version]
  25. Du, Y.-W.; Gao, K. Ecological security evaluation of marine ranching with AHP-entropy-based TOPSIS: A case study of Yantai, China. Mar. Policy 2020, 122, 104223. [Google Scholar] [CrossRef]
  26. Du, Y.; Zheng, Y.; Wu, G.; Tang, Y. Decision-making method of heavy-duty machine tool remanufacturing based on AHP-entropy weight and extension theory. J. Clean. Prod. 2020, 252, 119607. [Google Scholar] [CrossRef]
  27. Chen, C.-H. A novel multi-criteria decision-making model for building material supplier selection based on Entropy-AHP weighted TOPSIS. Entropy 2020, 22, 259. [Google Scholar] [CrossRef] [Green Version]
  28. Liu, S.; Hu, Y.; Zhang, X.; Li, Y.; Liu, L. Blockchain service provider selection based on an integrated BWM-Entropy-TOPSIS method under an intuitionistic fuzzy environment. IEEE Access 2020, 8, 104148–104164. [Google Scholar] [CrossRef]
  29. Nguyen, P.-H.; Tsai, J.-F.; Nguyen, V.-T.; Vu, D.-D.; Dao, T.-K. A Decision Support Model for Financial Performance Evaluation of Listed Companies in The Vietnamese Retailing Industry. J. Asian Financ. Econ. Bus. 2020, 7, 1005–1015. [Google Scholar] [CrossRef]
  30. Sałabun, W.; Wątróbski, J.; Shekhovtsov, A. Are MCDA methods benchmarkable? A comparative study of TOPSIS, VIKOR, COPRAS, and PROMETHEE II Methods. Symmetry 2020, 12, 1549. [Google Scholar] [CrossRef]
  31. Vavrek, R.; Bečica, J. Efficiency evaluation of cultural services in the Czech Republic via multi-criteria decision analysis. Sustainability 2020, 12, 3409. [Google Scholar] [CrossRef] [Green Version]
  32. Narayanamoorthy, S.; Annapoorani, V.; Kalaiselvan, S.; Kang, D. Hybrid Hesitant Fuzzy Multi-Criteria Decision Making Method: A Symmetric Analysis of the Selection of the Best Water Distribution System. Symmetry 2020, 12, 2096. [Google Scholar] [CrossRef]
  33. Liao, H.; Xu, Z. A VIKOR-based method for hesitant fuzzy multi-criteria decision making. Fuzzy Optim. Decis. Mak. 2013, 12, 373–392. [Google Scholar] [CrossRef]
  34. Xu, Z.; Zhang, X. Hesitant fuzzy multi-attribute decision making based on TOPSIS with incomplete weight information. Knowl. Based Syst. 2013, 52, 53–64. [Google Scholar] [CrossRef]
  35. Li, Z.-H. An Extension of the MULTIMOORA Method for Multiple Criteria Group Decision Making Based upon Hesitant Fuzzy Sets. J. Appl. Math. 2014, 2014, 527836. [Google Scholar] [CrossRef] [Green Version]
  36. Anitha, J.; Das, R. Optimization of Process Parameters in Electro Discharge Machine Using Standard Deviation, MULTIMOORA and MOOSRA Methods. In Innovative Product Design and Intelligent Manufacturing Systems; Springer: Berlin/Heidelberg, Germany, 2020; pp. 619–629. [Google Scholar]
  37. Anitha, J.; Das, R. Optimization of EDM Process Parameters Using Standard Deviation and Multi-objective Optimization on the Basis of Simple Ratio Analysis (MOOSRA). In Intelligent Manufacturing and Energy Sustainability; Springer: Berlin/Heidelberg, Germany, 2020; pp. 655–662. [Google Scholar]
  38. Maheshwari, N.; Choudhary, J.; Rath, A.; Shinde, D.; Kalita, K. Finite Element Analysis and Multi-criteria Decision-Making (MCDM)-Based Optimal Design Parameter Selection of Solid Ventilated Brake Disc. J. Inst. Eng. (India) Ser. C 2021. [Google Scholar] [CrossRef]
  39. Ramasamy, V.; Subramanian, Y.; Varadarajan, S.; Ramaswamy, K.; Kaliappan, K.; Arulmozhi, D.; Srinivasan, G.R.; Gubendiran, R.K. Influence of process parameters on the optimisation of crystalline phase, size and strain of multiferroic Bismuth Iron Tri Oxide (BiFeO3) nanoceramics: A MCDM based TOPSIS approach. Ceram. Int. 2020, 46, 1457–1471. [Google Scholar] [CrossRef]
  40. Şahin, M. Hybrid Multiattribute Decision Method for Material Selection. Int. J. Pure Appl. Sci. 2020, 6, 107–117. [Google Scholar]
  41. Yazdani, M.; Torkayesh, A.E.; Santibanez-Gonzalez, E.D.R.; Otaghsara, S.K. Evaluation of renewable energy resources using integrated Shannon Entropy—EDAS model. Sustain. Oper. Comput. 2020, 1, 35–42. [Google Scholar] [CrossRef]
  42. Afshar, M.R.; Shahhosseini, V.; Sebt, M.H. An interval type-2 fuzzy MCDM model for work package subcontractor prequalification. Soft Comput. 2021, 25, 635–648. [Google Scholar] [CrossRef]
  43. Arya, V.; Kumar, S. A new picture fuzzy information measure based on Shannon entropy with applications in opinion polls using extended VIKOR–TODIM approach. Comput. Appl. Math. 2020, 39, 197. [Google Scholar] [CrossRef]
  44. Li, H.; Wang, W.; Fan, L.; Li, Q.; Chen, X. A novel hybrid MCDM model for machine tool selection using fuzzy DEMATEL, entropy weighting and later defuzzification VIKOR. Appl. Soft Comput. 2020, 91, 106207. [Google Scholar] [CrossRef]
  45. Görçün, Ö.F. Efficiency analysis of Black sea container seaports: Application of an integrated MCDM approach. Marit. Policy Manag. 2020, 1–28. [Google Scholar] [CrossRef]
  46. Zha, S.; Guo, Y.; Huang, S.; Wang, S. A hybrid MCDM method using combination weight for the selection of facility layout in the manufacturing system: A case study. Math. Probl. Eng. 2020, 2020, 1320173. [Google Scholar] [CrossRef] [Green Version]
  47. Alao, M.A.; Ayodele, T.R.; Ogunjuyigbe, A.S.O.; Popoola, O.M. Multi-criteria decision based waste to energy technology selection using entropy-weighted TOPSIS technique: The case study of Lagos, Nigeria. Energy 2020, 201, 117675. [Google Scholar] [CrossRef]
  48. Salehi, V.; Zarei, H.; Shirali, G.A.; Hajizadeh, K. An entropy-based TOPSIS approach for analyzing and assessing crisis management systems in petrochemical industries. J. Loss Prev. Process Ind. 2020, 67, 104241. [Google Scholar] [CrossRef]
  49. Torkashvand, M.; Neshat, A.; Javadi, S.; Yousefi, H. DRASTIC framework improvement using Stepwise Weight Assessment Ratio Analysis (SWARA) and combination of Genetic Algorithm and Entropy. Environ. Sci. Pollut. Res. 2020. [Google Scholar] [CrossRef]
  50. Wang, R.; Li, X.; Li, C. Optimal selection of sustainable battery supplier for battery swapping station based on Triangular fuzzy entropy -MULTIMOORA method. J. Energy Storage 2021, 34, 102013. [Google Scholar] [CrossRef]
  51. Mohamadghasemi, A.; Hadi-Vencheh, A.; Hosseinzadeh Lotfi, F. The multiobjective stochastic CRITIC–TOPSIS approach for solving the shipboard crane selection problem. Int. J. Intell. Syst. 2020, 35, 1570–1598. [Google Scholar] [CrossRef]
  52. Peng, X.; Krishankumar, R.; Ravichandran, K.S. A novel interval-valued fuzzy soft decision-making method based on CoCoSo and CRITIC for intelligent healthcare management evaluation. Soft Comput. 2021. [Google Scholar] [CrossRef]
  53. Xu, C.; Ke, Y.; Li, Y.; Chu, H.; Wu, Y. Data-driven configuration optimization of an off-grid wind/PV/hydrogen system based on modified NSGA-II and CRITIC-TOPSIS. Energy Convers. Manag. 2020, 215, 112892. [Google Scholar] [CrossRef]
  54. Abdel-Basset, M.; Mohamed, R. A novel plithogenic TOPSIS- CRITIC model for sustainable supply chain risk management. J. Clean. Prod. 2020, 247, 119586. [Google Scholar] [CrossRef]
  55. Li, S.; Wang, B. Research on Evaluating Algorithms for the Service Quality of Wireless Sensor Networks Based on Interval-Valued Intuitionistic Fuzzy EDAS and CRITIC Methods. Math. Probl. Eng. 2020, 2020, 5391940. [Google Scholar] [CrossRef]
  56. Görçün, Ö.F. Evaluation of the selection of proper metro and tram vehicle for urban transportation by using a novel integrated MCDM approach. Sci. Prog. 2021, 104, 1–18. [Google Scholar] [CrossRef] [PubMed]
  57. Wei, G.; Lei, F.; Lin, R.; Wang, R.; Wei, Y.; Wu, J.; Wei, C. Algorithms for probabilistic uncertain linguistic multiple attribute group decision making based on the GRA and CRITIC method: Application to location planning of electric vehicle charging stations. Econ. Res. Ekon. Istraživanja 2020, 33, 828–846. [Google Scholar] [CrossRef] [Green Version]
  58. Mishra, A.R.; Rani, P.; Pandey, K. Fermatean fuzzy CRITIC-EDAS approach for the selection of sustainable third-party reverse logistics providers using improved generalized score function. J. Ambient Intell. Humaniz. Comput. 2021. [Google Scholar] [CrossRef]
  59. Piasecki, M.; Kostyrko, K. Development of Weighting Scheme for Indoor Air Quality Model Using a Multi-Attribute Decision Making Method. Energies 2020, 13, 3120. [Google Scholar] [CrossRef]
  60. Narayanamoorthy, S.; Annapoorani, V.; Kang, D.; Baleanu, D.; Jeon, J.; Kureethara, J.V.; Ramya, L. A novel assessment of bio-medical waste disposal methods using integrating weighting approach and hesitant fuzzy MOOSRA. J. Clean. Prod. 2020, 275, 122587. [Google Scholar] [CrossRef]
  61. Liaw, C.-F.; Hsu, W.-C.J.; Lo, H.-W. A Hybrid MCDM Model to Evaluate and Classify Outsourcing Providers in Manufacturing. Symmetry 2020, 12, 1962. [Google Scholar] [CrossRef]
  62. Keshavarz Ghorabaee, M.; Zavadskas, E.K.; Olfat, L.; Turskis, Z. Multi-criteria inventory classification using a new method of evaluation based on distance from average solution (EDAS). Informatica 2015, 26, 435–451. [Google Scholar] [CrossRef]
  63. Keshavarz Ghorabaee, M.; Zavadskas, E.K.; Amiri, M.; Esmaeili, A. Multi-criteria evaluation of green suppliers using an extended WASPAS method with interval type-2 fuzzy sets. J. Clean. Prod. 2016, 137, 213–229. [Google Scholar] [CrossRef]
  64. Walters, S.J. Quality of Life Outcomes in Clinical Trials and Health-Care Evaluation: A Practical Guide to Analysis and Interpretation; Wiley: New York, NY, USA, 2009. [Google Scholar]
  65. Keshavarz-Ghorabaee, M. Supplementary data for “Determination of objective weights using a new method based on the removal effects of criteria (MEREC)”. Figshare 2021. [Google Scholar] [CrossRef]
  66. Wludyka, P.S.; Nelson, P.R. An analysis-of-means-type test for variances from normal populations. Technometrics 1997, 39, 274–285. [Google Scholar] [CrossRef]
  67. SAS Institute Inc. JMP® 11 Basic Analysis; SAS Institute Inc.: Cary, NC, USA, 2013. [Google Scholar]
  68. Sitorus, F.; Brito-Parada, P.R. A multiple criteria decision making method to weight the sustainability criteria of renewable energy technologies under uncertainty. Renew. Sustain. Energy Rev. 2020, 127, 109891. [Google Scholar] [CrossRef]
  69. Zavadskas, E.K.; Podvezko, V. Integrated determination of objective criteria weights in MCDM. Int. J. Inf. Technol. Decis. Mak. 2016, 15, 267–283. [Google Scholar] [CrossRef]
  70. Krylovas, A.; Kosareva, N.; Dadelo, S. European Countries Ranking and Clustering Solution by Children’s Physical Activity and Human Development Index Using Entropy-Based Methods. Mathematics 2020, 8, 1705. [Google Scholar] [CrossRef]
  71. Li, H.; Wang, Y.; Li, Y.; Xiao, G.; Hu, P.; Zhao, R.; Li, B. Learning adaptive criteria weights for active semi-supervised learning. Inf. Sci. 2021, 561, 286–303. [Google Scholar] [CrossRef]
  72. Chernyi, S.; Budnik, V. Methods for optimizing solutions when considering group arguments by team of experts. AIP Conf. Proc. 2017, 1899, 060002. [Google Scholar]
  73. Saeed Iranmanesh, M.I.; Norallah Salehi, A.; Seyyed Abdolmajid Jalaee, B. Using Fuzzy Logic Method to Investigate the Effect of Economic Sanctions on Business Cycles in the Islamic Republic of Iran. Appl. Comput. Intell. Soft Comput. 2021, 2021, 8833474. [Google Scholar]
  74. Chumaidiyah, E.; Dewantoro, M.D.R.; Kamil, A.A. Design of a Participatory Web-Based Geographic Information System for Determining Industrial Zones. Appl. Comput. Intell. Soft Comput. 2021, 2021, 6665959. [Google Scholar]
  75. Phetpradap, P. A Fuzzy Soft Model for Haze Pollution Management in Northern Thailand. Adv. Fuzzy Syst. 2020, 2020, 6968705. [Google Scholar] [CrossRef]
  76. Javaherian, N.; Hamzehee, A.; Sayyadi Tooranloo, H. Designing an Intuitionistic Fuzzy Network Data Envelopment Analysis Model for Efficiency Evaluation of Decision-Making Units with Two-Stage Structures. Adv. Fuzzy Syst. 2021, 2021, 8860634. [Google Scholar]
  77. Wei, G.; Wu, J.; Guo, Y.; Wang, J.; Wei, C. An extended COPRAS model for multiple attribute group decision making based on single-valued neutrosophic 2-tuple linguistic environment. Technol. Econ. Dev. Econ. 2021. [Google Scholar] [CrossRef]
Figure 1. The weights of the comparative analysis.
Symmetry 13 00525 g001
Figure 2. The weights of the comparative analysis.
Symmetry 13 00525 g002
Figure 3. The graphical representation of correlation values in different categories.
Symmetry 13 00525 g003
Figure 4. The results of ANOM for variances for category (i).
Symmetry 13 00525 g004
Figure 5. The results of ANOM for variances for category (ii).
Symmetry 13 00525 g005
Figure 6. The results of ANOM for variances for category (iii).
Symmetry 13 00525 g006
Table 1. A summary of the recent studies.
No.Author(s)YearWeighting MethodApplication/Development
1Nguyen et al. [29]2020Standard DeviationFinancial performance of retailer companies
2Sałabun et al. [30]2020Equal Weights, Entropy and Standard DeviationBenchmarking of the MCDM methods
3Vavrek and Bečica [31]2020Coefficient of Variation, Standard Deviation and Equal WeightsCultural environment and development
4Narayanamoorthy et al. [32]2020Standard DeviationDevelopment of hesitant fuzzy MCDM approaches
5Anitha and Das [36,37]2020Standard DeviationOptimizing the process parameters in electro-discharge machines
6Ramasamy et al. [39]2020Standard DeviationOptimizing experimental conditions to synthesize Bismuth Iron Tri Oxide Nano powder
7Şahin [40]2020Standard Deviation and CRITICMaterial selection problem
8Yazdani et al. [41]2020EntropyEvaluation of renewable energy resources
9Arya and Kumar [43]2020EntropyDevelopment of a methodology using the picture fuzzy sets
10Li et al. [44]2020Entropy and DEMATELMachine tool selection problem in the manufacturing industry
11Görçün [45]2020EntropyEvaluation of container seaports in the Black sea region
12Zha et al. [46]2020Entropy, Delphi and fuzzy ANPFacility layout evaluation
13Alao et al. [47]2020EntropyEvaluation of technologies used in the waste-to-energy process
14Salehi et al. [48]2020EntropyEvaluation of crisis management systems
15Torkashvand et al. [49]2020Entropy and SWARAGroundwater vulnerability assessment
16Mohamadghasemi et al. [51]2020CRITICShipboard crane selection with interval type-2 fuzzy sets
17Xu et al. [53]2020CRITICConfiguration optimization in energy systems
18Abdel-Basset and Mohamed [54]2020CRITICSupply chain risk management
19Li and Wang [55]2020CRITICEvaluating the service quality of wireless sensor networks
20Wei et al. [57]2020CRITICLocation planning of electric vehicle charging
Stations
21Piasecki and Kostyrko [59]2020Entropy and CRITICPrioritization of indoor air pollutants
22Narayanamoorthy et al. [60]2020CRITICAssessment of bio-medical waste disposal methods
23Liaw et al. [61]2020CRITIC and DEMATELEvaluation and classification of outsourcing providers in manufacturing
24Maheshwari et al. [38]2021Standard DeviationEvaluation design parameters of solid ventilated brake disc
25Afshar et al. [42]2021EntropySubcontractor evaluation problem using type-2 fuzzy sets
26Wang et al. [50]2021EntropySupplier selection for battery swapping stations
27Peng et al. [52]2021CRITICHealthcare management evaluation
28Görçün [56]2021CRITICEvaluation of metro and tram vehicle for urban transportation
29Mishra et al. [58]2021CRITICSelection of sustainable third-party reverse logistics providers
30Peng et al. [52]2021CRITICFinancial risk evaluation
Table 2. The decision matrix of the illustrative example.
C 1 B C 2 B C 3 H C 4 H
A 1 450800054145
A 2 1091002160
A 3 100820031153
A 4 22093001162
A 5 5840023158
Table 3. The normalized decision matrix of the illustrative example.
C 1 C 2 C 3 C 4
A 1 0.011110.895
A 2 0.5000.8790.0370.988
A 3 0.0500.9760.5740.944
A 4 0.0230.8600.0191
A 5 10.9520.4260.975
Table 4. The values of S i j .
C 1 C 2 C 3 C 4
A 1 0.030.770.770.75
A 2 0.620.690.190.71
A 3 0.150.640.570.64
A 4 0.711.080.681.09
A 5 0.210.200.020.20
Table 5. The example utilized for making comparative analysis [62].
C 1 B C 2 B C 3 B C 4 H C 5 H C 6 H C 7 H
A 1 232642.370.0516789008.71
A 2 202202.20.0417191008.23
A 3 172311.980.1519210,8009.91
A 4 122101.730.219512,30010.21
A 5 1524320.1418712,6009.34
A 6 142221.890.1318013,2009.22
A 7 212622.430.0616010,3008.93
A 8 202562.60.0716311,4008.44
A 9 192662.10.0615711,2009.04
A 10 82181.940.1119013,40010.11
Table 6. The weights and correlation coefficients of the comparative analysis.
CRITICEntropyStandard DeviationMEREC
w 1 0.1710.1990.2210.324
w 2 0.1210.0200.0890.055
w 3 0.1100.0400.1150.086
w 4 0.2890.6600.2930.368
w 5 0.0750.0160.0800.044
w 6 0.1650.0520.1300.077
w 7 0.0690.0130.0730.045
r0.852 (p-value < 0.05)0.873 (p-value < 0.05)0.975 (p-value < 0.05)
Table 7. The criteria weights related to category (i).
Set 1Set 2Set 3Set 4Set 5Set 6Set 7Set 8Set 9Set 10
w 1 0.3870.2170.2580.2910.3840.2260.1130.2100.2130.161
w 2 0.1140.0870.1300.3260.2030.0700.1960.0740.3860.262
w 3 0.2230.2560.2450.1290.1410.2640.3270.2040.1700.286
w 4 0.1530.1990.2370.1040.1580.2680.2110.2660.0650.117
w 5 0.1230.2410.1290.1500.1140.1720.1520.2460.1660.173
Table 8. The criteria weights related to category (ii).
Set 1Set 2Set 3Set 4Set 5Set 6Set 7Set 8Set 9Set 10
w 1 0.0810.1050.0820.1050.1510.1280.0520.1310.1000.100
w 2 0.0850.1040.0700.1290.0440.0710.0520.1770.1070.126
w 3 0.0720.0930.1000.0450.1060.1090.1550.1180.1540.070
w 4 0.1060.0620.0650.0800.1180.0760.0940.0950.0490.151
w 5 0.0910.1360.1680.0890.0850.0900.1260.0440.1130.073
w 6 0.0980.0870.1470.1440.0990.1590.1170.1020.0870.131
w 7 0.1250.0630.0640.0580.1650.0580.0850.0760.1070.087
w 8 0.0490.1340.1090.1440.0750.0760.0970.0720.1050.090
w 9 0.1090.1080.0490.1300.1020.0890.1530.0940.1130.107
w 10 0.1850.1070.1460.0740.0550.1450.0690.0910.0640.065
Table 9. The criteria weights related to category (iii).
Set 1Set 2Set 3Set 4Set 5Set 6Set 7Set 8Set 9Set 10
w 1 0.0480.0980.0340.0330.0490.0490.0320.0530.0370.069
w 2 0.0790.0280.0440.0470.0570.0320.0720.0570.0540.049
w 3 0.0560.0360.0380.0380.0380.0510.0460.0270.0510.047
w 4 0.0710.0500.0580.0480.0680.0470.0450.0300.0440.062
w 5 0.0280.0450.0380.0920.0360.0540.0460.0710.0530.057
w 6 0.0330.0410.0690.0240.0490.0500.0700.0340.0930.038
w 7 0.0570.0500.0610.0510.0480.0460.0430.0370.0440.055
w 8 0.0490.0560.0400.0460.0350.0590.0530.0570.0540.043
w 9 0.0480.0450.0600.0690.0530.0750.0510.0430.0460.052
w 10 0.0450.0470.0620.0520.0400.0240.0380.0610.0670.042
w 11 0.0620.0360.0420.0710.0530.0510.0350.0710.0290.054
w 12 0.0330.0330.0470.0430.0570.0780.0460.0350.0560.054
w 13 0.0630.0770.0630.0660.0470.0490.0800.0540.0480.074
w 14 0.0480.0530.0470.0480.0320.0440.0610.0460.0270.055
w 15 0.0770.0660.0560.0480.0720.0580.0740.0650.0700.041
w 16 0.0370.0500.0400.0400.0500.0530.0530.0710.0480.055
w 17 0.0550.0430.0430.0380.0660.0440.0520.0450.0450.032
w 18 0.0420.0530.0580.0480.0430.0510.0490.0520.0290.040
w 19 0.0340.0400.0570.0390.0590.0350.0280.0470.0630.041
w 20 0.0330.0520.0430.0580.0470.0510.0280.0440.0410.040
Table 10. The correlation values of comparison in different categories.
Set No.Category (i)Category (ii)Category (iii)
CRITICEntropyStandard DeviationCRITICEntropyStandard DeviationCRITICEntropyStandard Deviation
Set 10.9500.9340.8760.7970.6640.7310.6370.6050.690
Set 20.8510.7780.9230.9590.9440.9520.6750.6080.651
Set 30.8100.8980.9560.6950.7310.7850.5100.4730.537
Set 40.9140.9730.9590.7470.6990.7740.7590.6980.734
Set 50.9470.9250.9170.7780.7980.8240.5490.5200.558
Set 60.6750.7510.8430.8170.7110.7700.6750.7320.802
Set 70.9040.9580.9680.7390.8020.8420.5930.5070.639
Set 80.8670.9410.9690.6800.8180.7840.6530.5620.651
Set 90.8200.8890.8670.7340.8000.8060.6290.4690.604
Set 100.6980.9150.9030.8290.7610.8240.6070.5500.601
Average0.8440.8960.9180.7770.7730.8090.6290.5720.647
Table 11. The variance of the weights determined using each method in category (iii).
Set No.MERECCRITICEntropyStandard Deviation
Set 10.00022570.00002710.00019580.0000311
Set 20.00025390.00005710.00032250.0000529
Set 30.00010730.00006810.00026400.0000501
Set 40.00023690.00007850.00037970.0000768
Set 50.00012150.00004780.00026590.0000436
Set 60.00015360.00006010.00036290.0000630
Set 70.00022410.00008450.00039380.0000557
Set 80.00018880.00005190.00029260.0000450
Set 90.00023620.00005380.00037440.0000476
Set 100.00011570.00004360.00025790.0000407
Average0.00018640.00005720.00031100.0000507
Publisher’s Note: MDPI stays neutral with regard to jurisdictional claims in published maps and institutional affiliations.

