
A Simulation on Relation between Power Distribution of Low-Frequency Field Potentials and Conducting Direction of Rhythm Generator Flowing through 3D Asymmetrical Brain Tissue


 ,
, 
Abstract
:1. Introduction
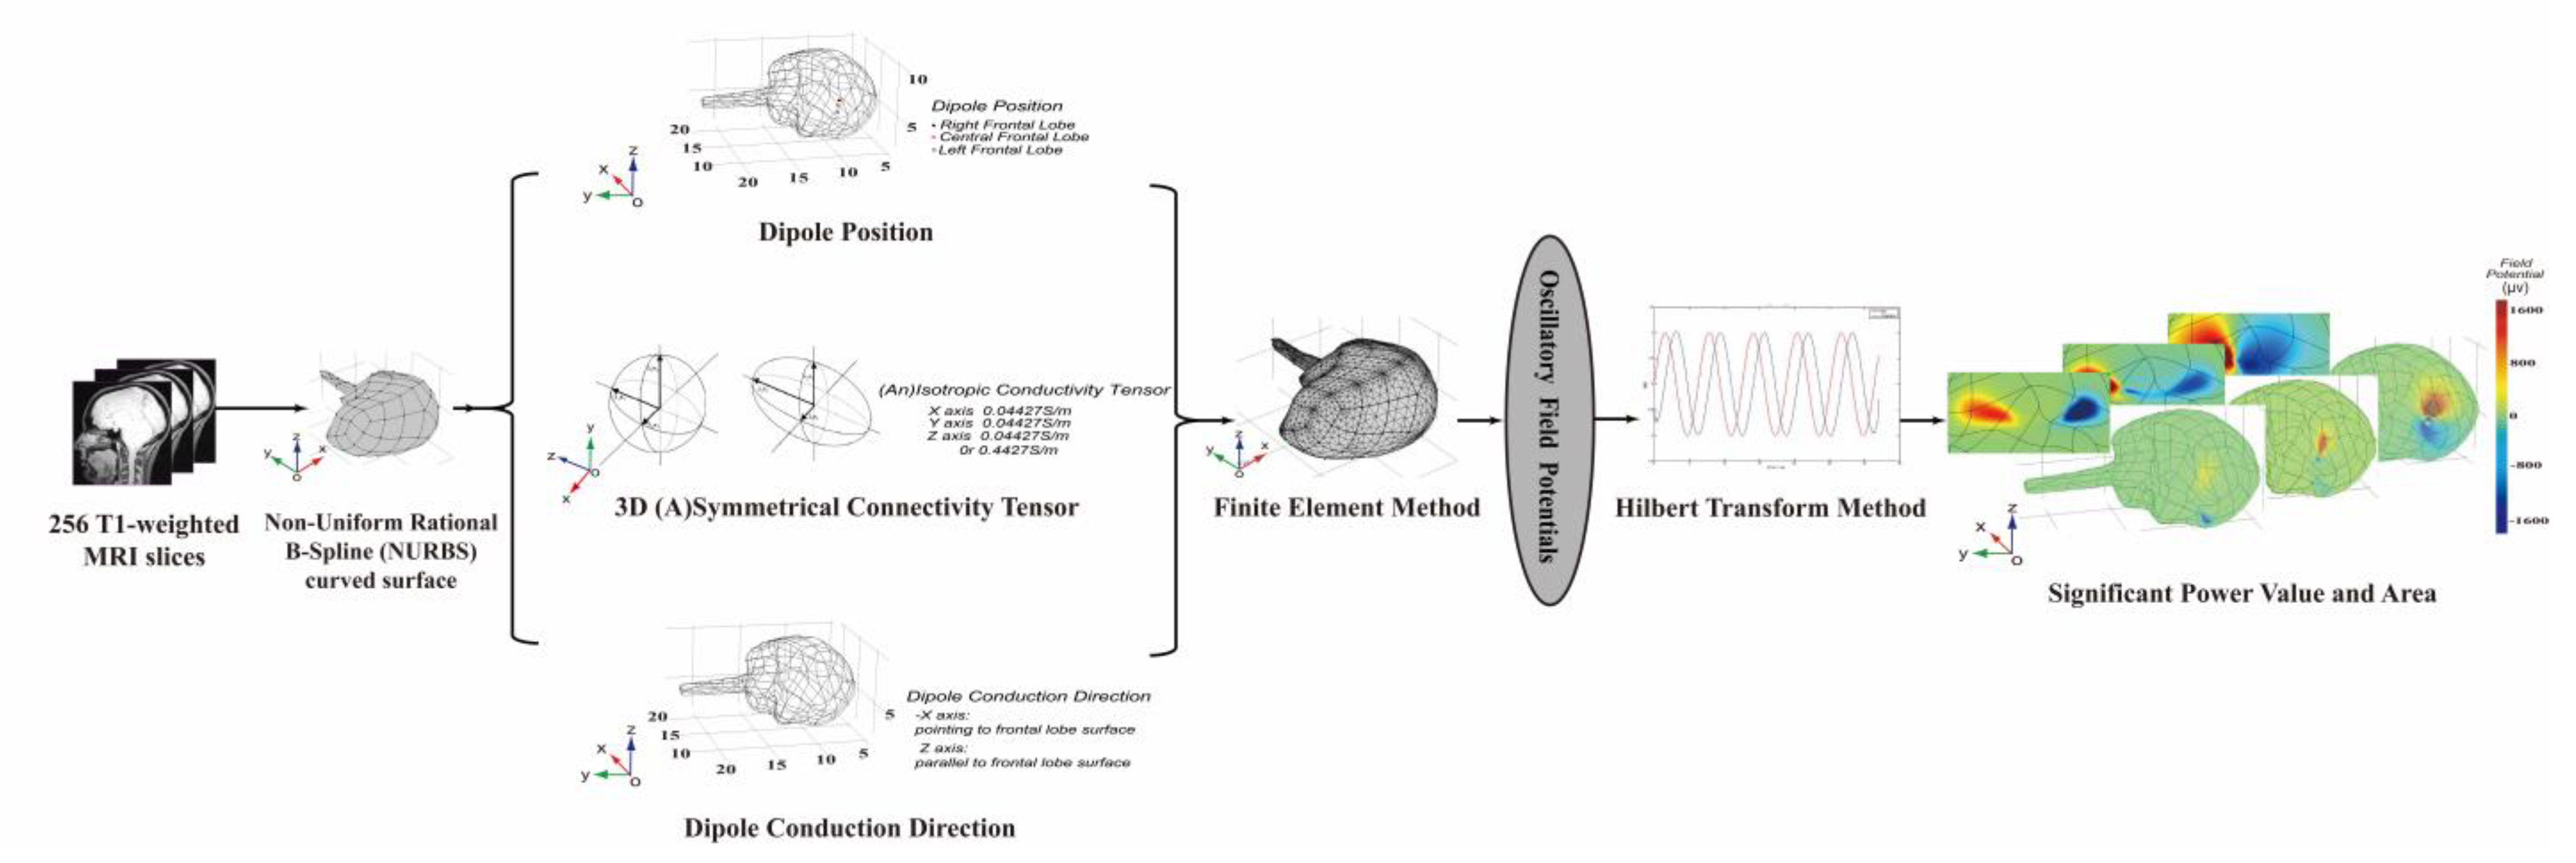
2. Methods
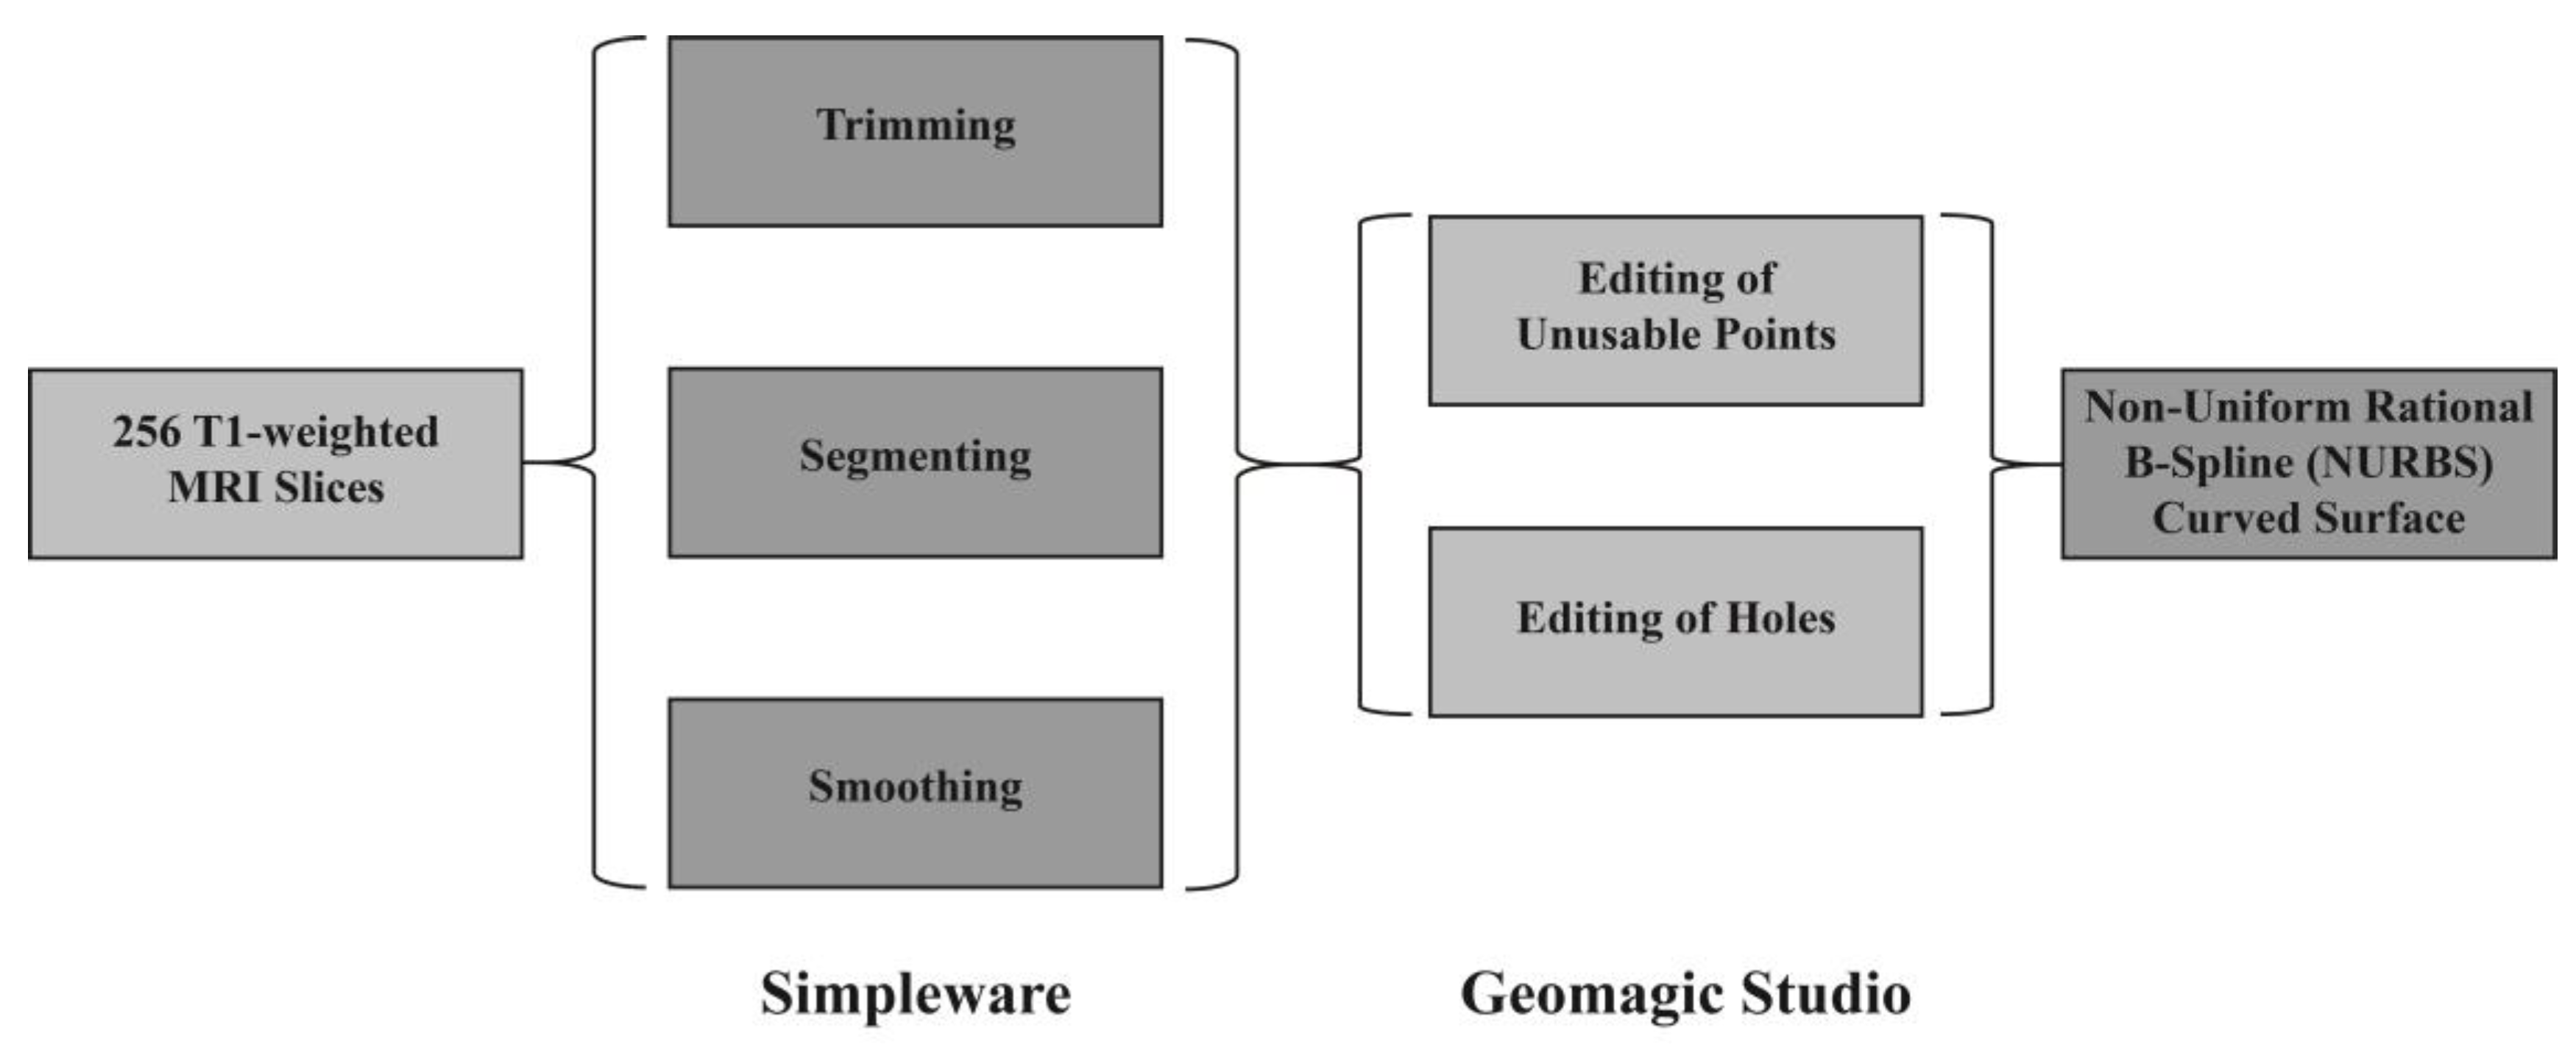
2.1. Model Building
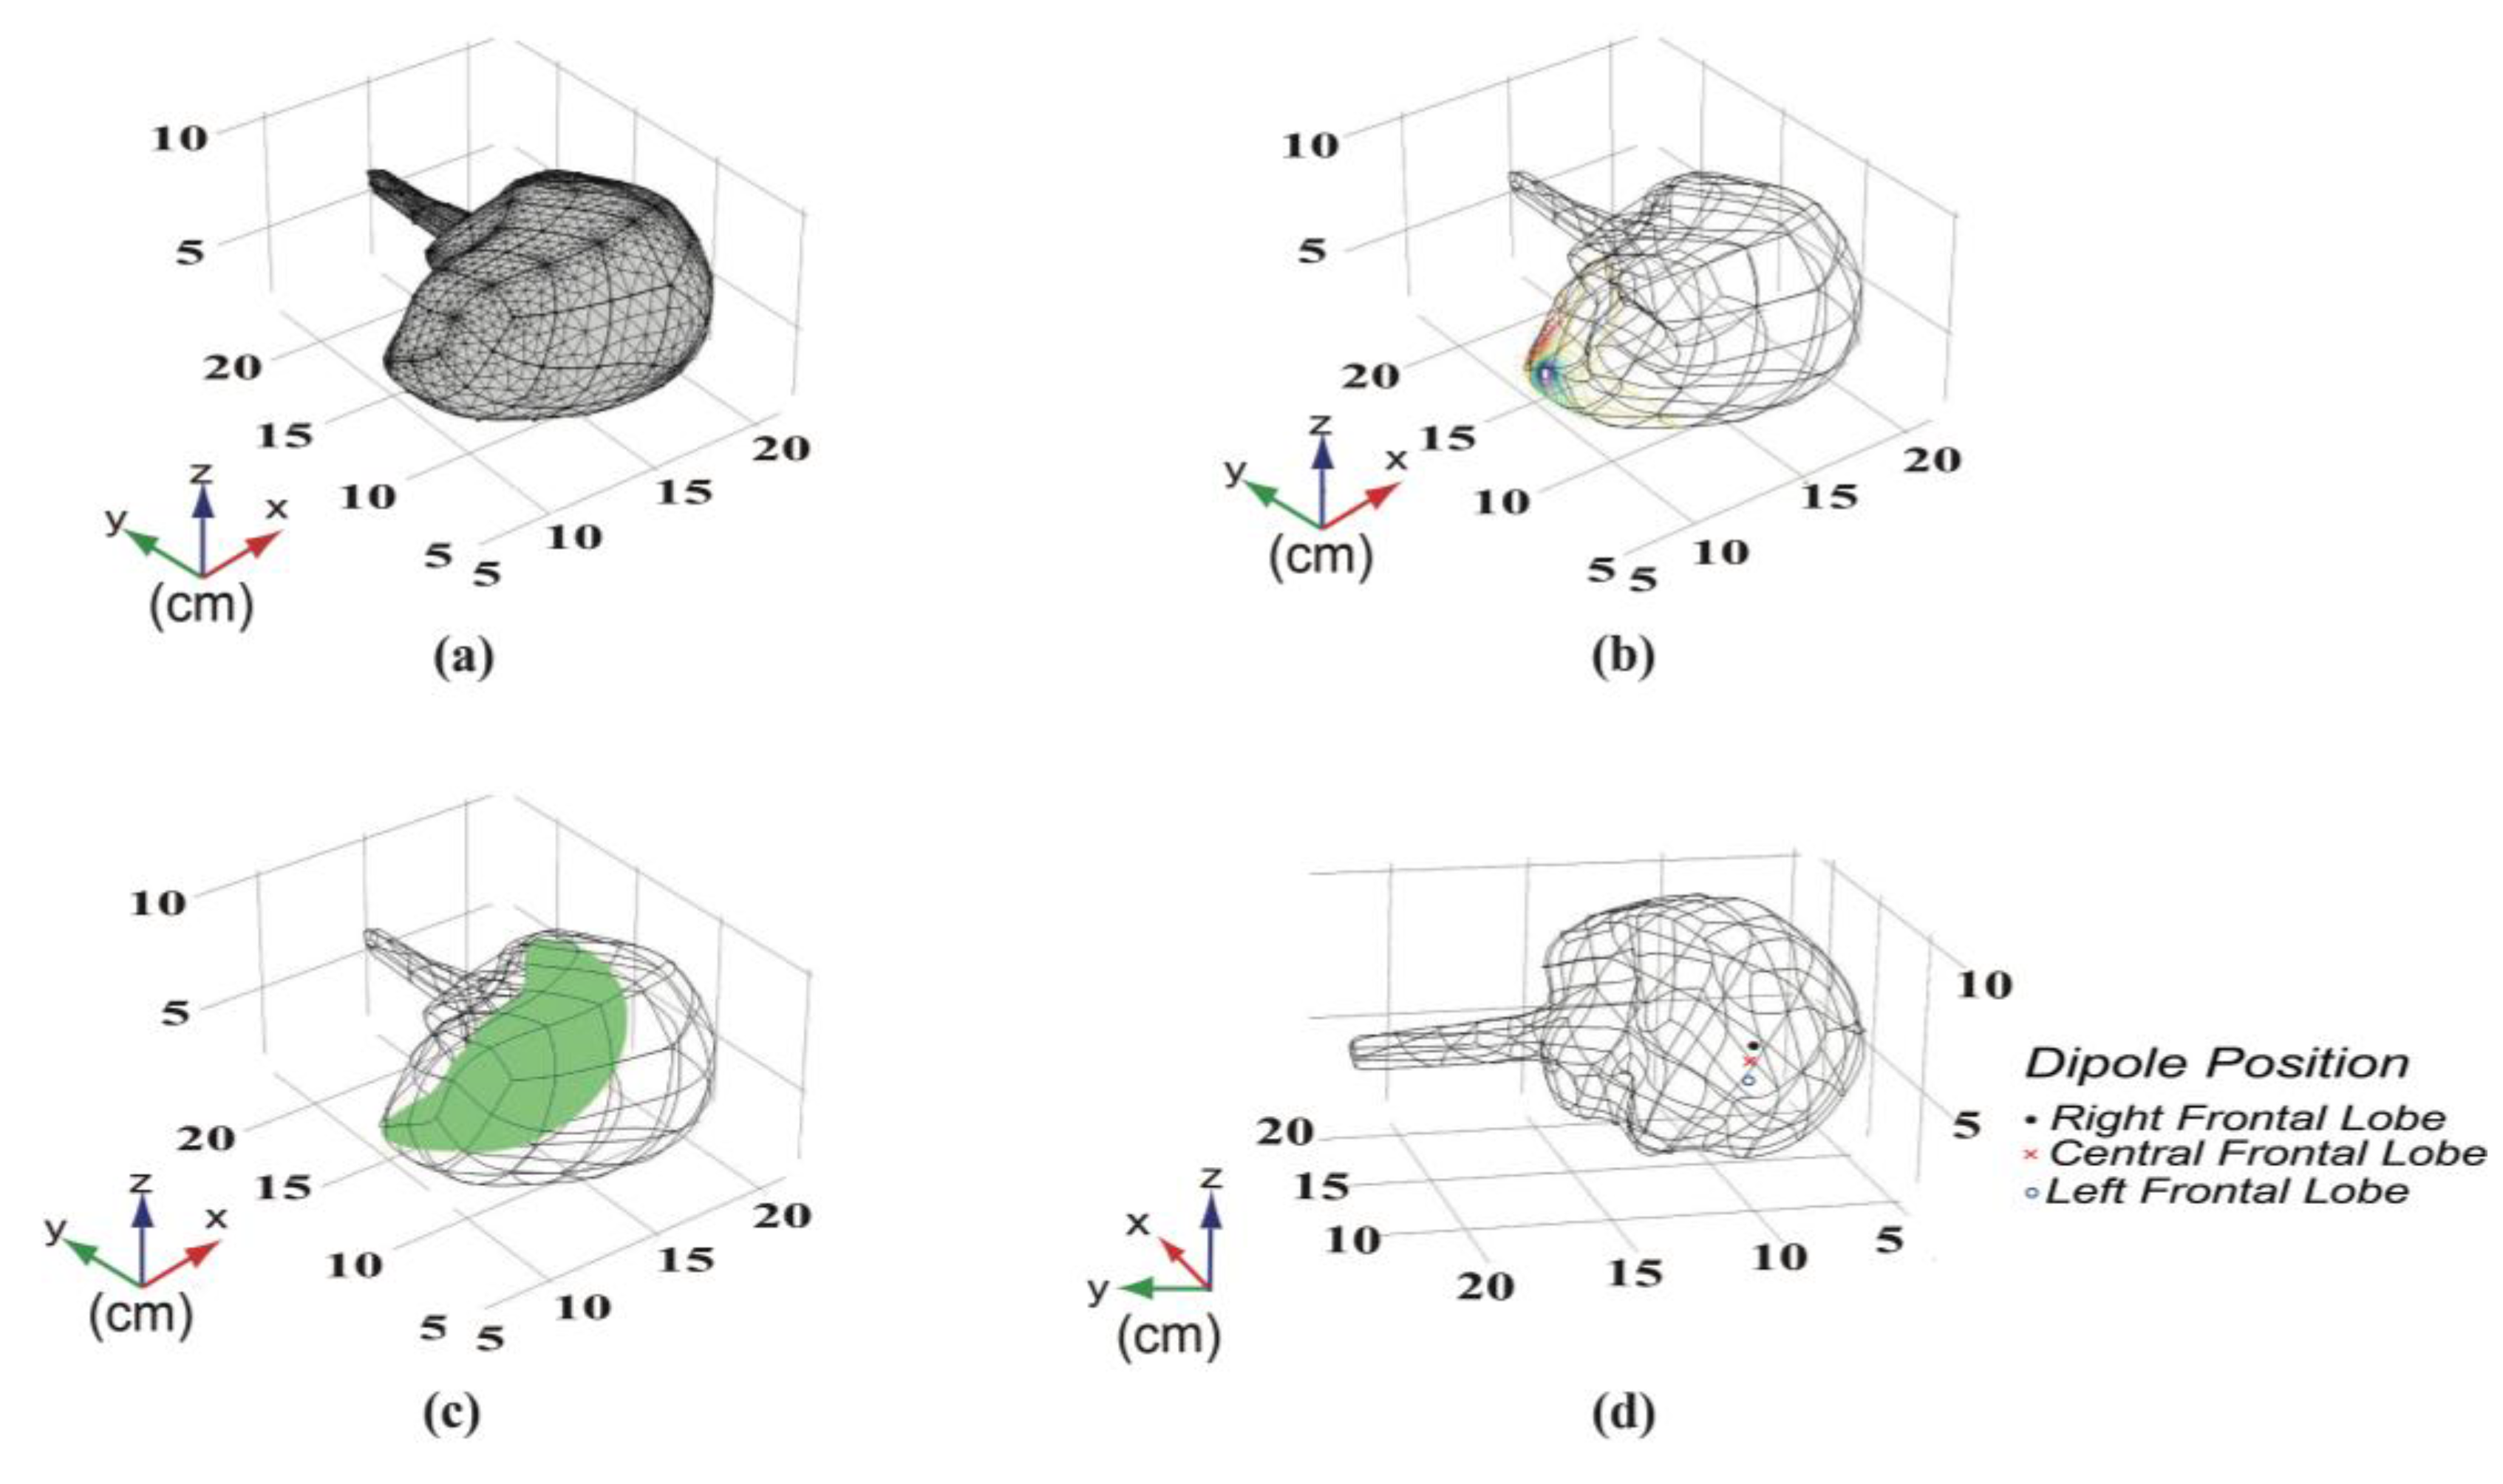
2.1.1. Reconstructed 3D Quasi-Real Head Model
2.1.2. Position and Conducting Direction of a Single Dipole Current
2.1.3. Symmetrical Conductivity and Asymmetrical Conductivity
2.2. Calculation Derivation
2.2.1. FP Derivations of Low-Frequency Simulated Rhythms
2.2.2. FP Power Derivations of Low-Frequency Simulated Rhythms
2.2.3. Value and Area of Significant Power
2.3. Validation Influence of Conducting Direction
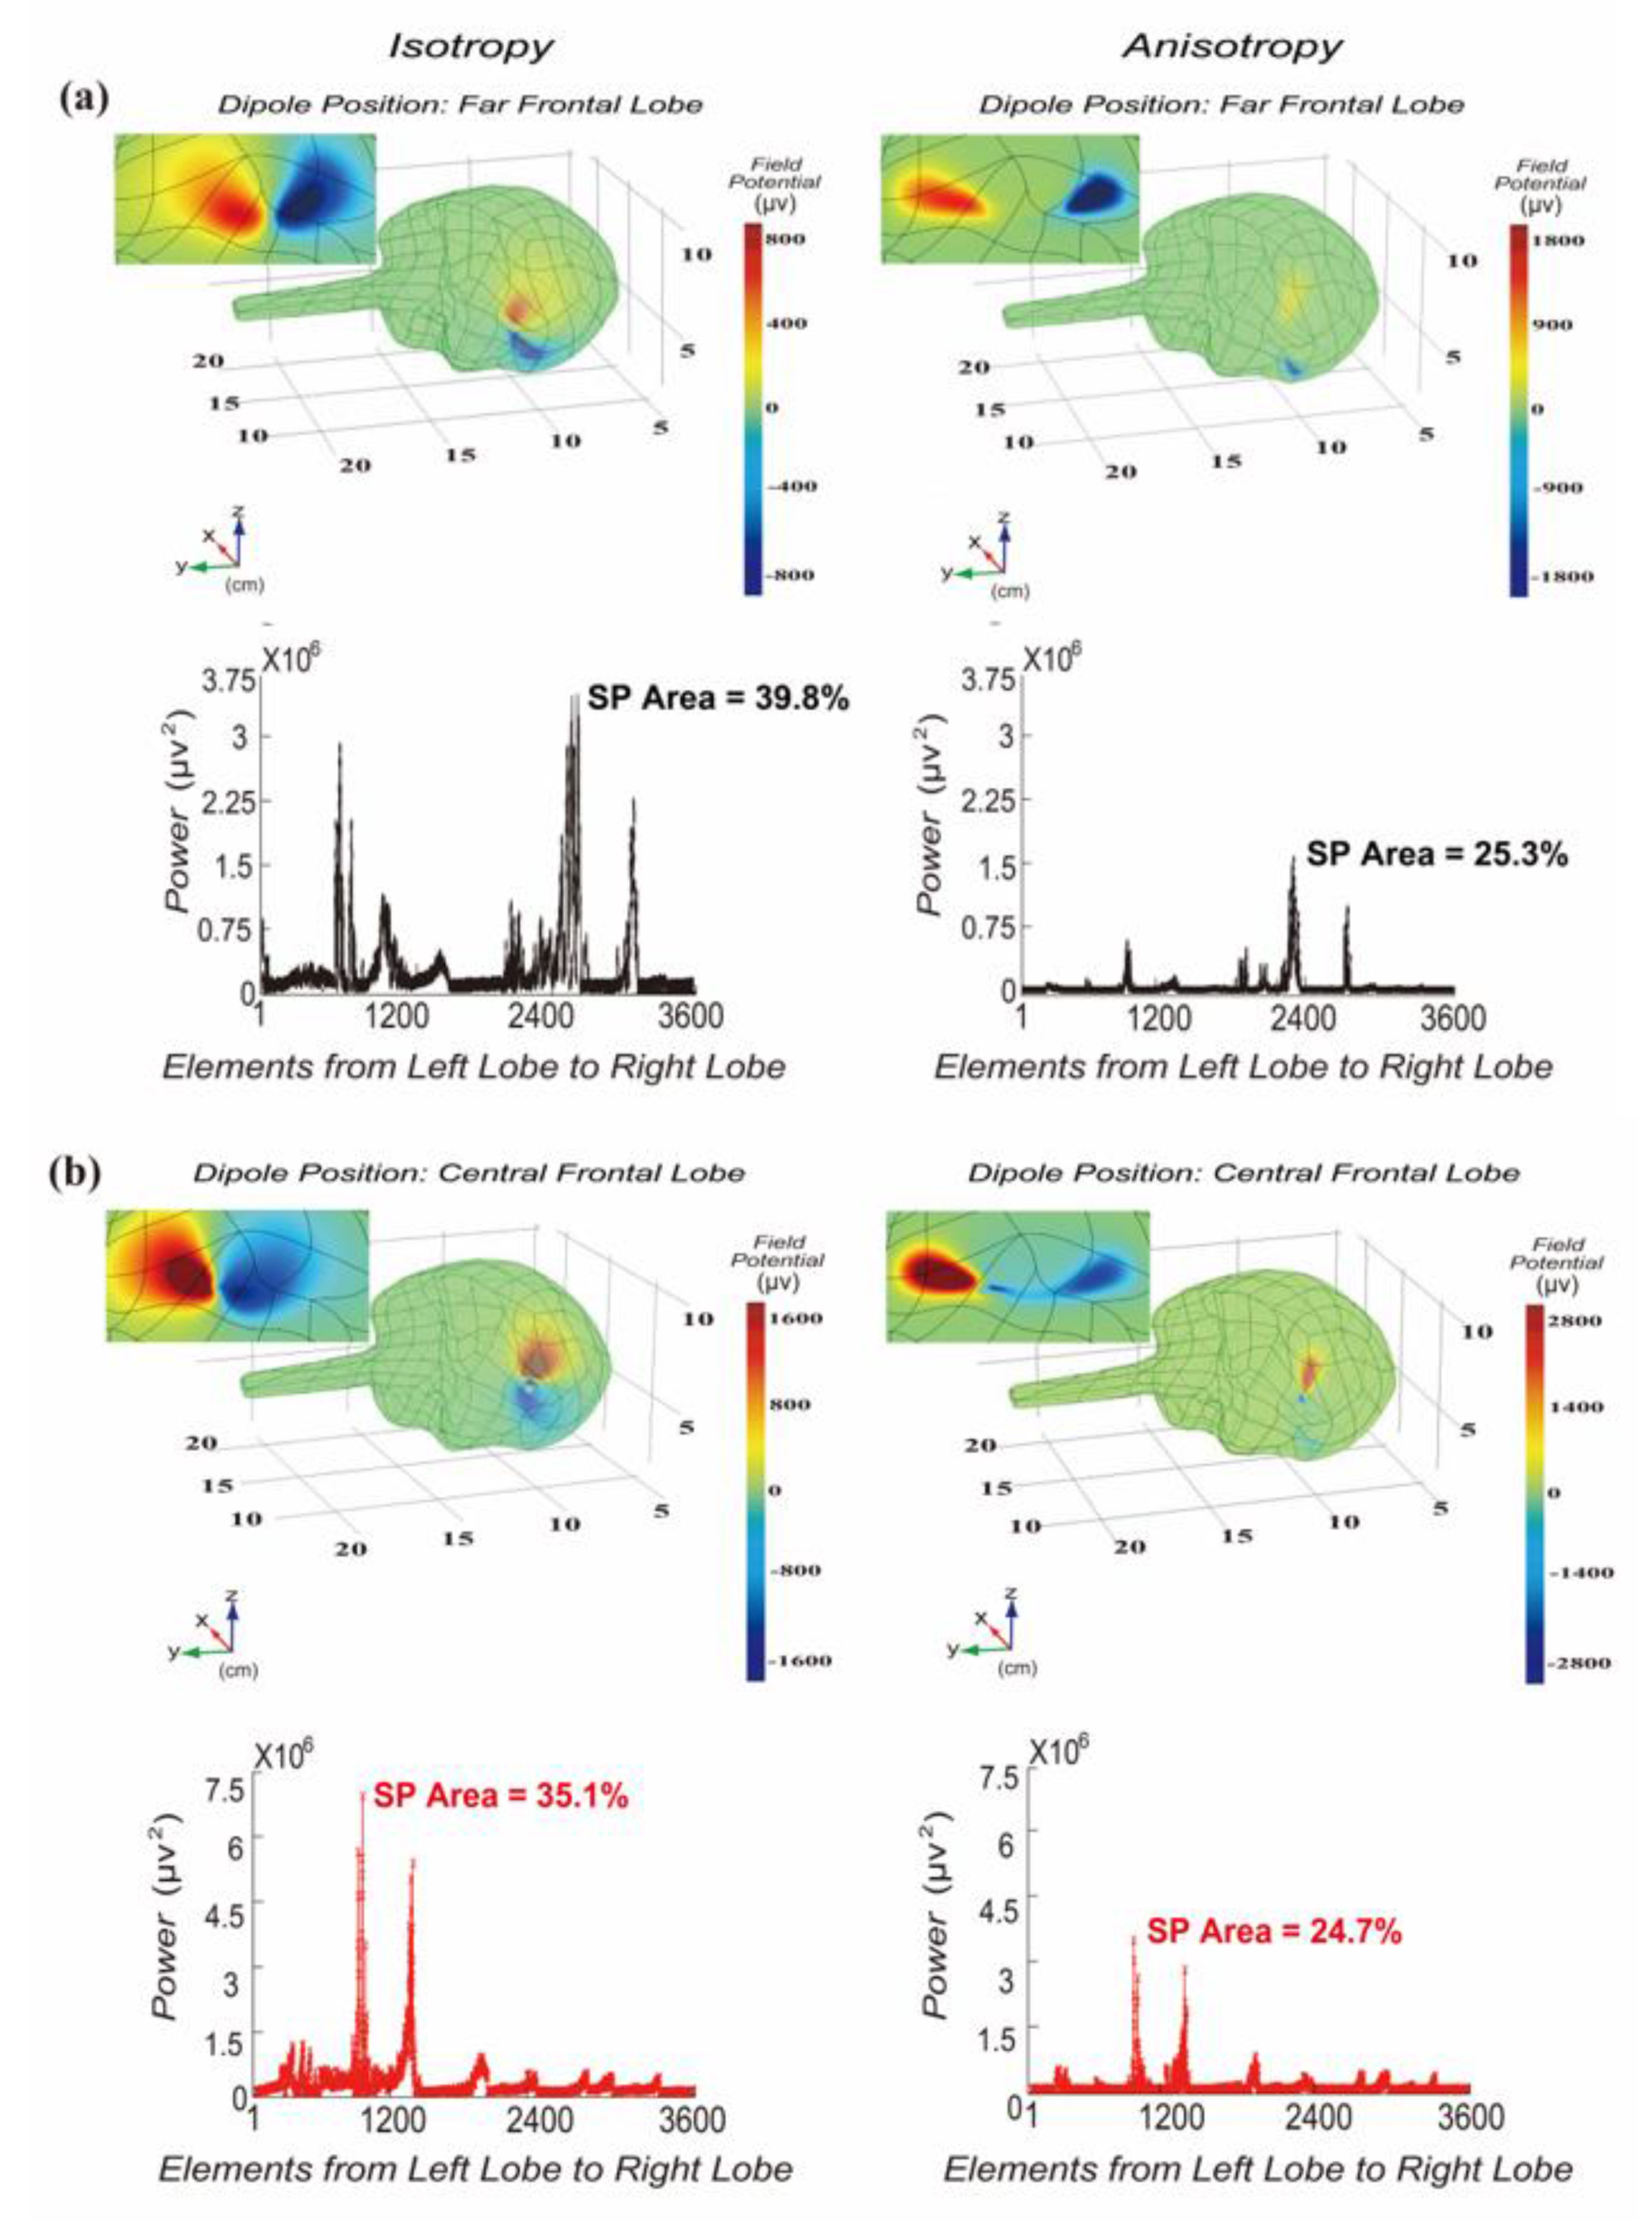
3. Results
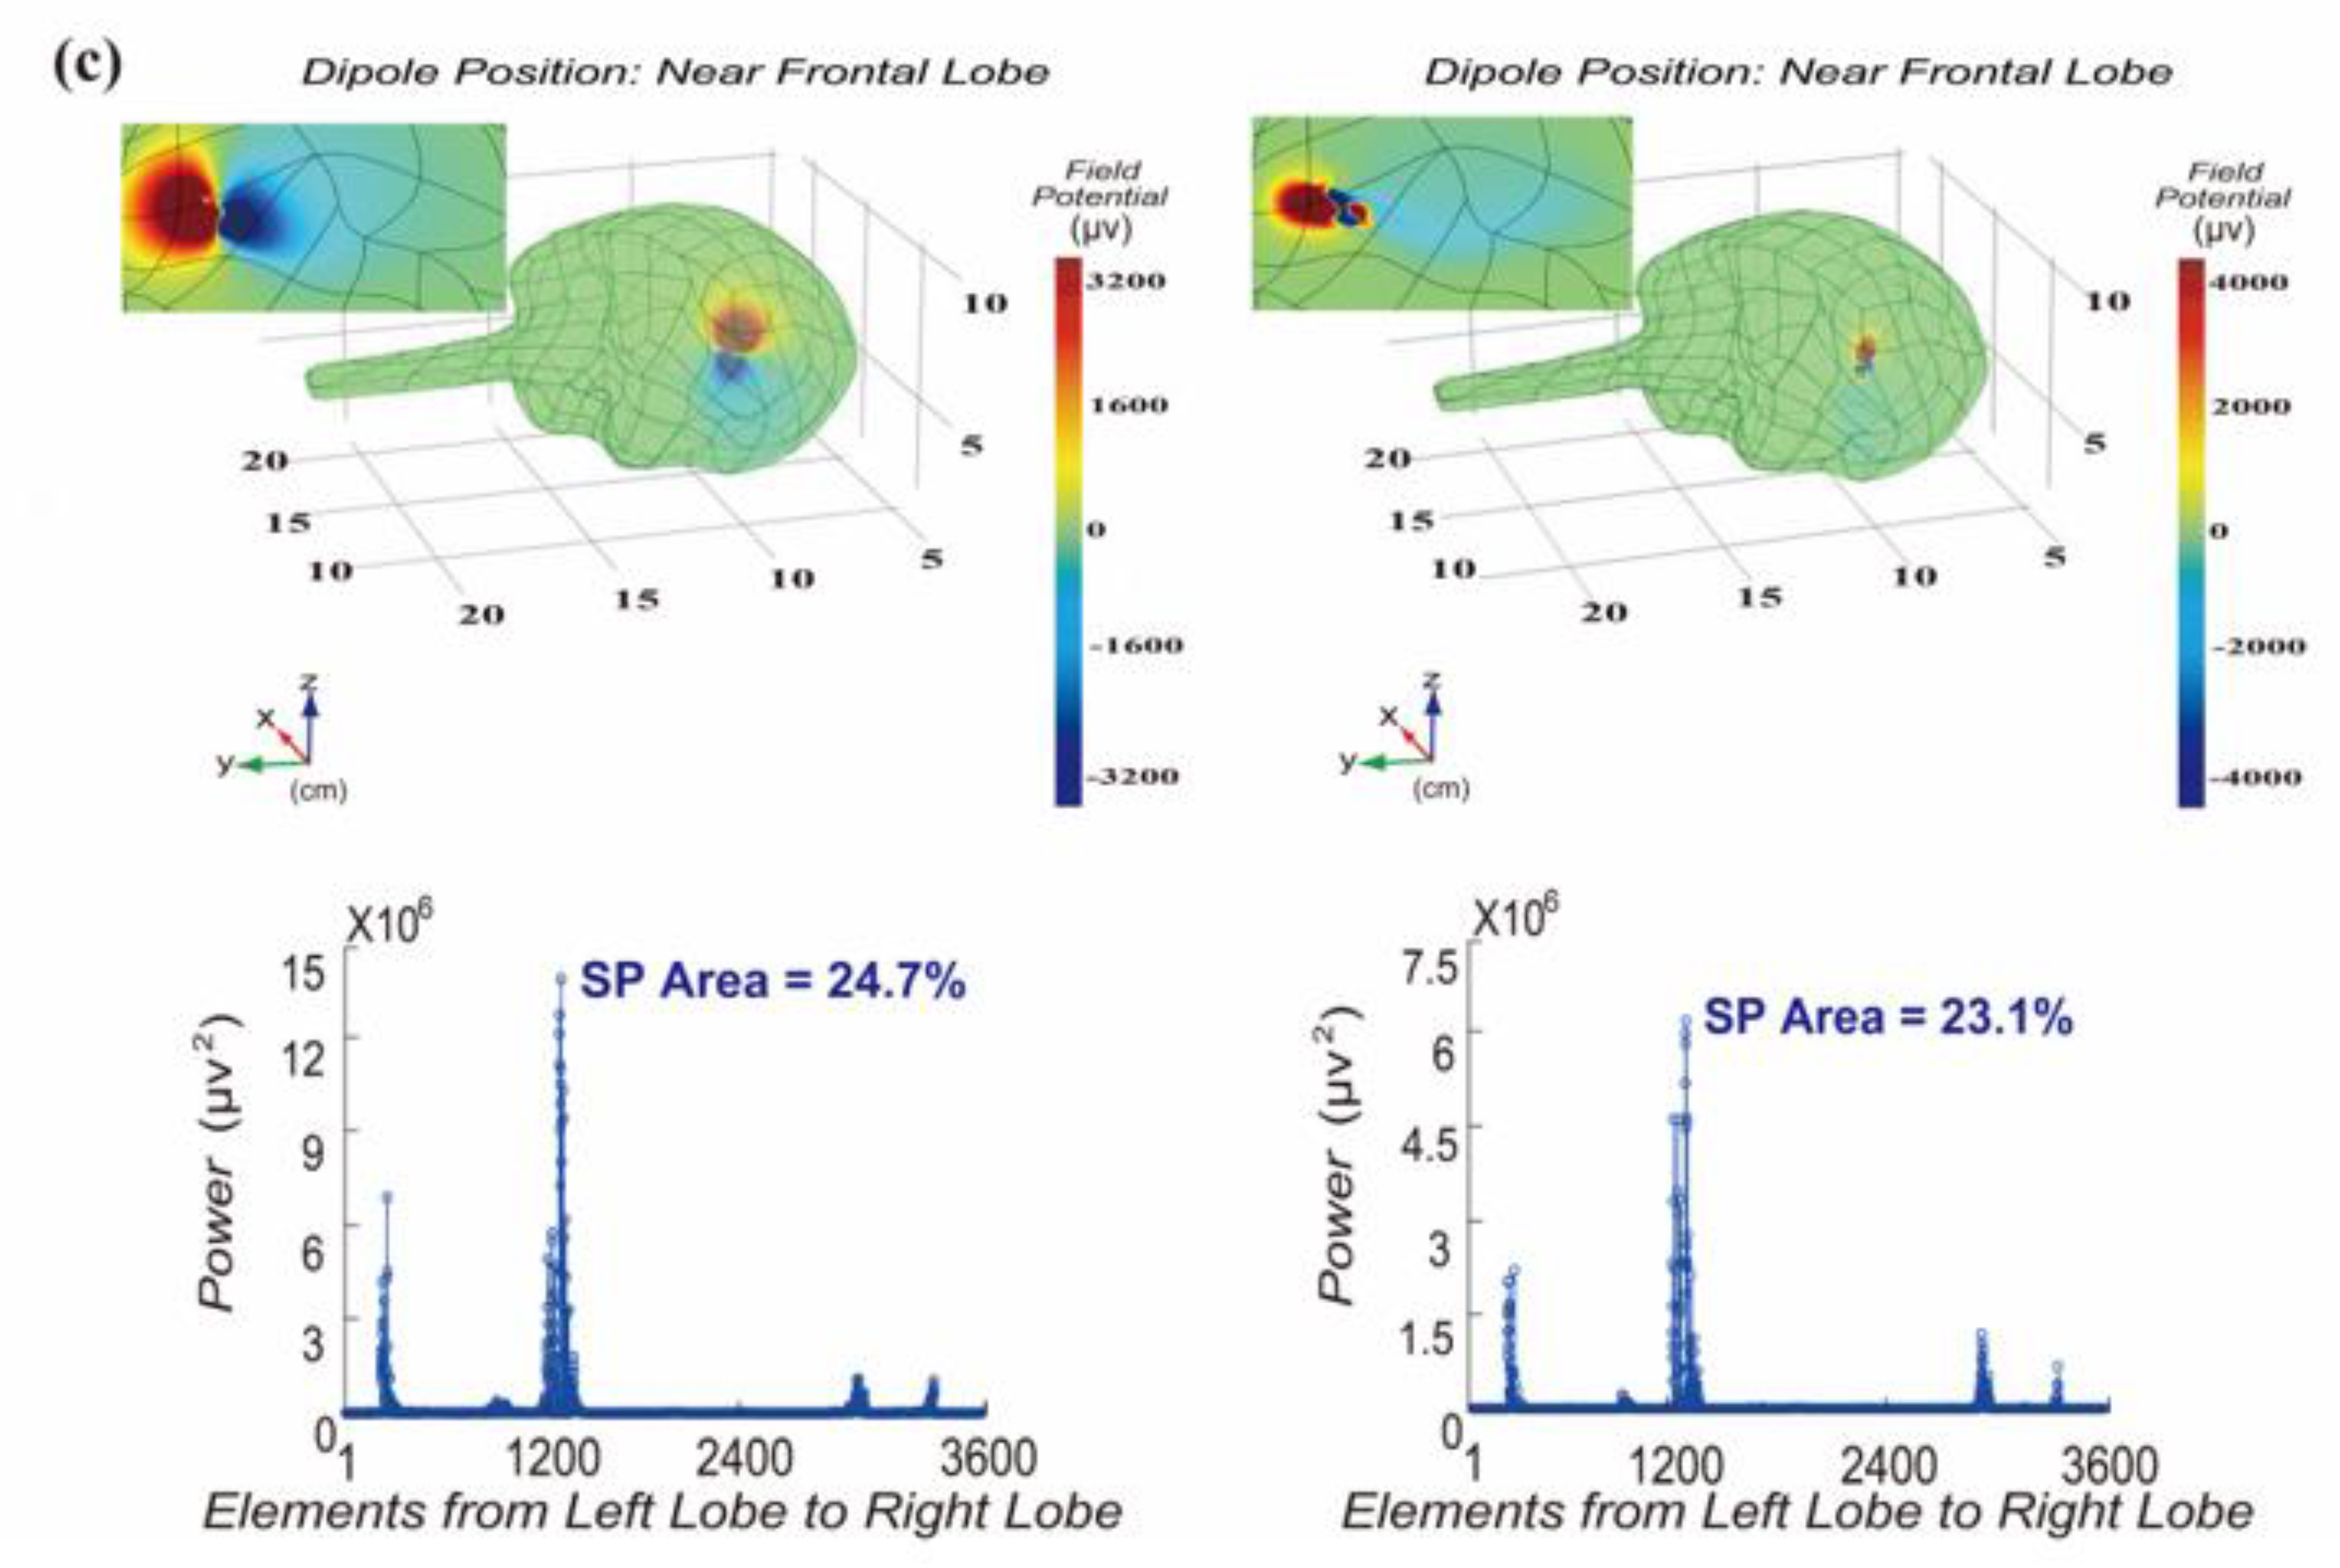
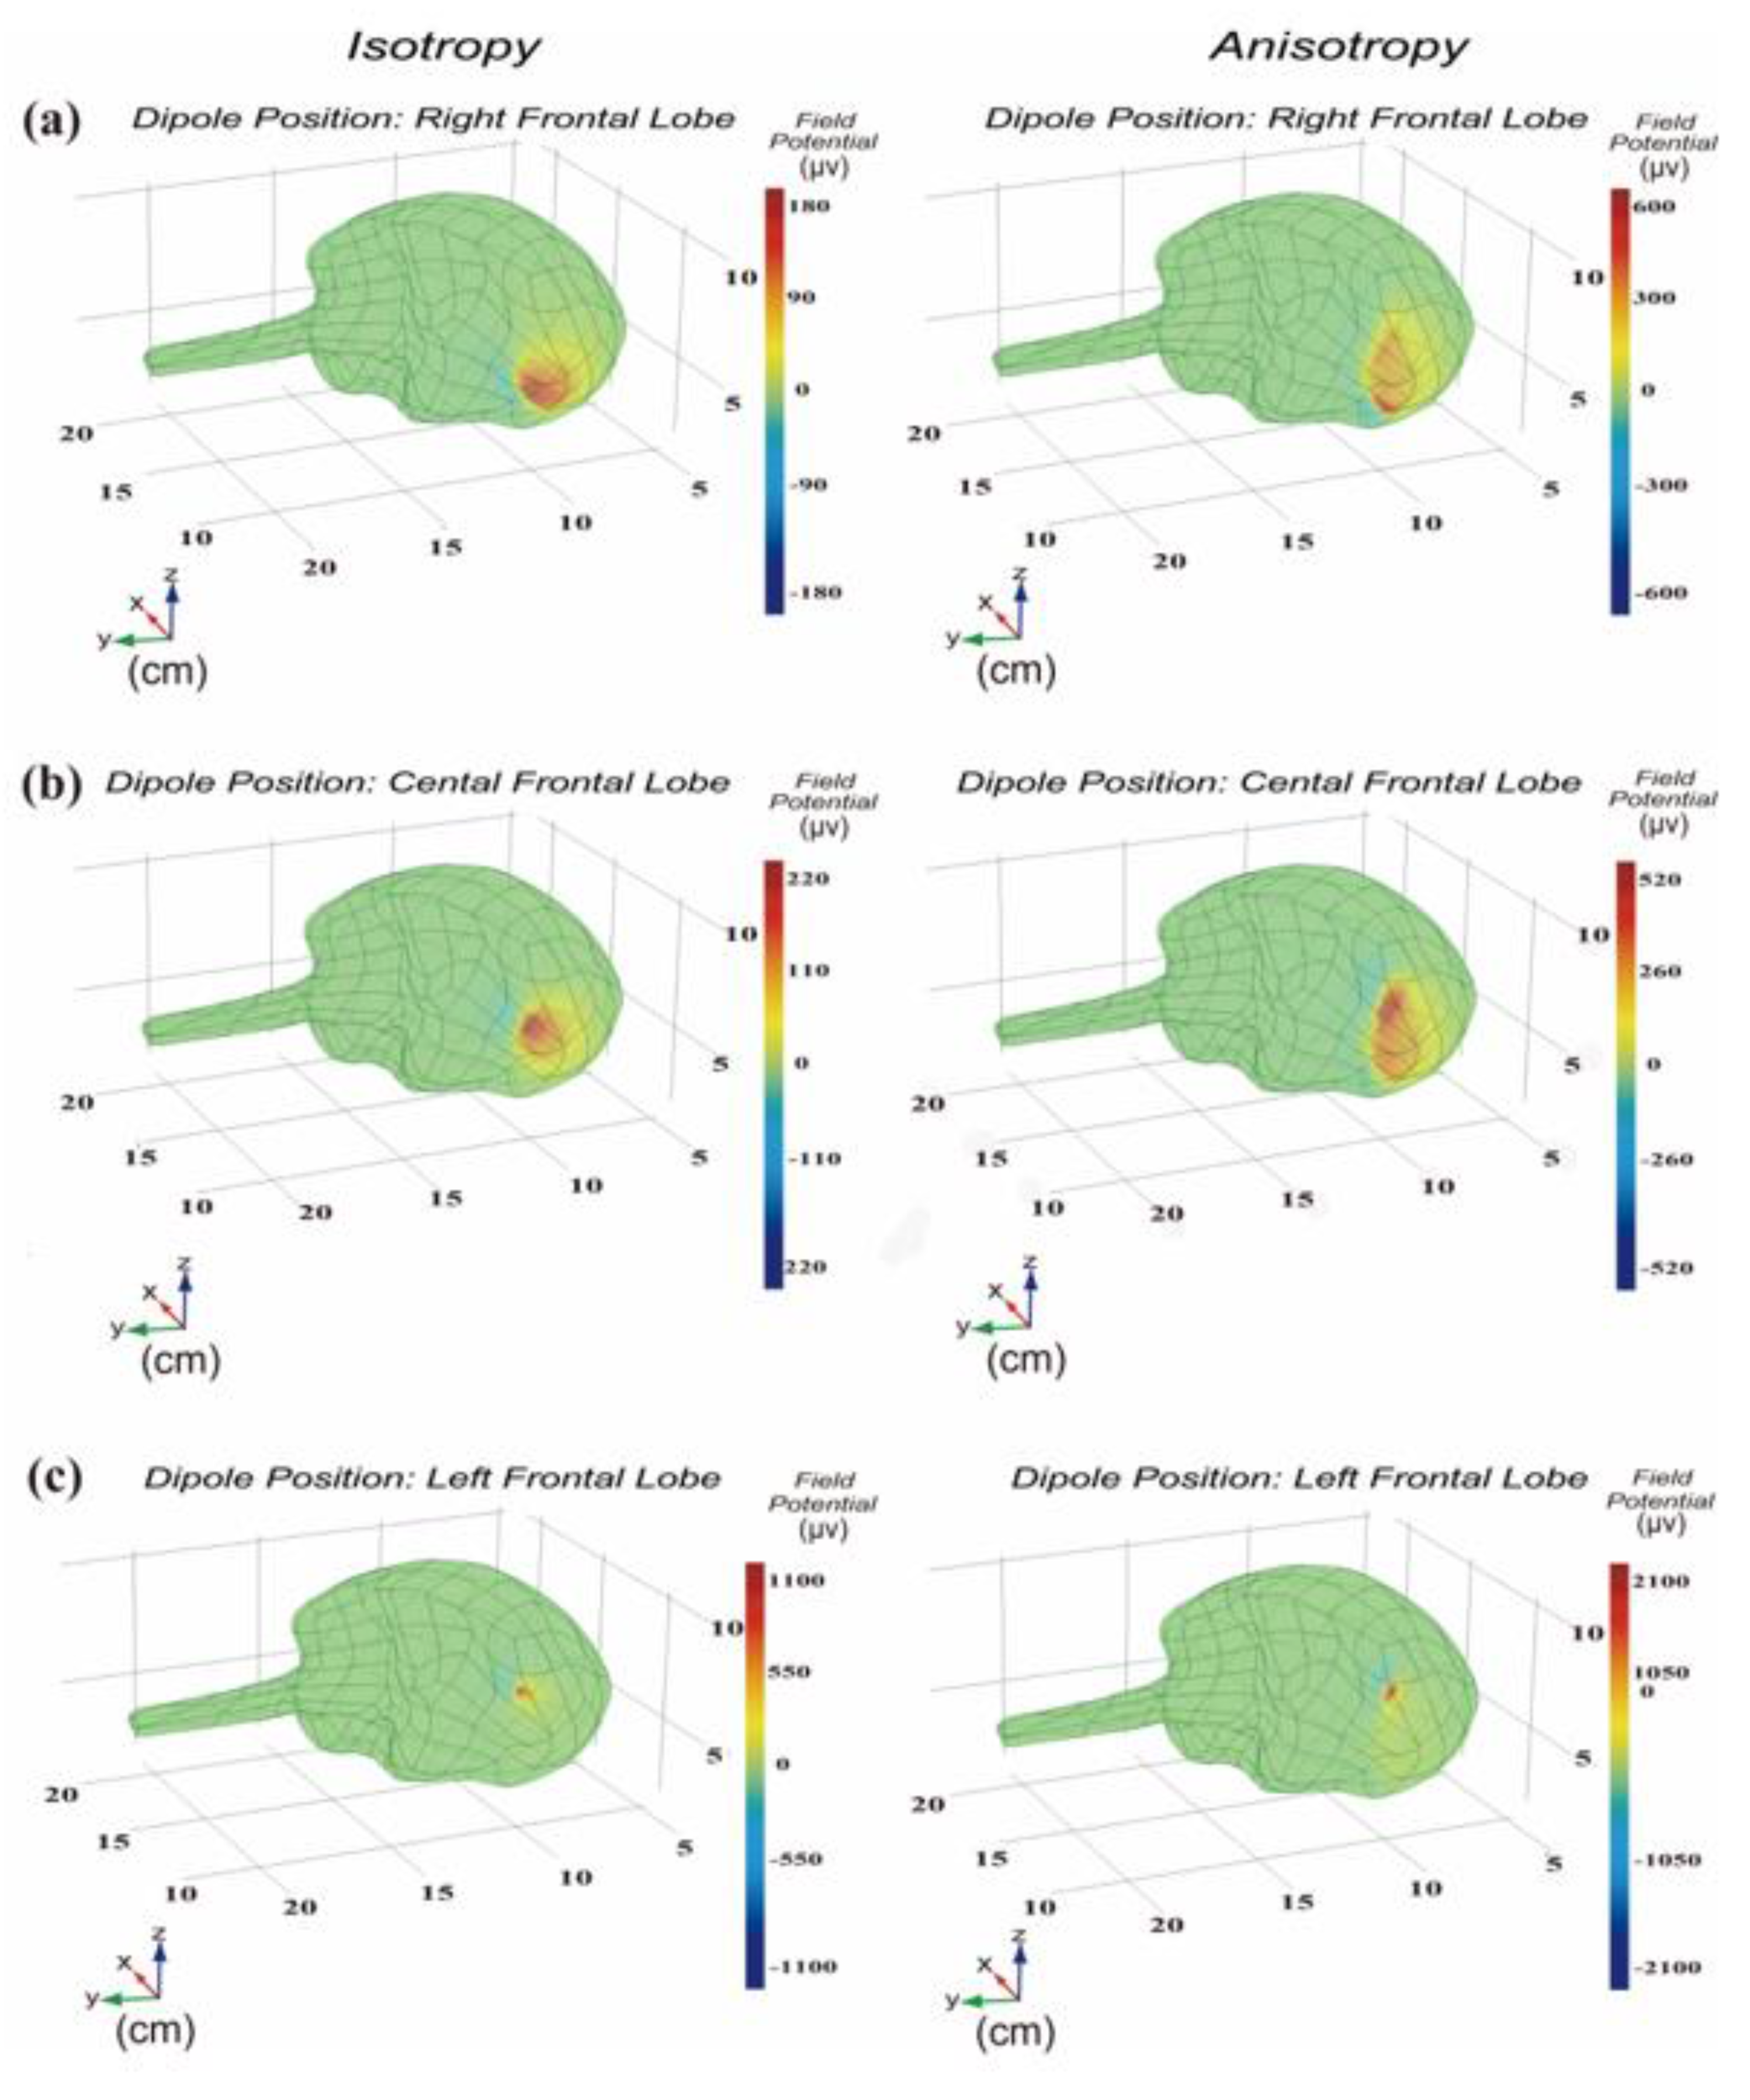
3.1. Distribution of Significant Power at Dipole Moment Pointing to Frontal Lobe Surface
3.2. Distribution of Significant Power at Dipole Moment Parallel to Frontal Lobe Surface
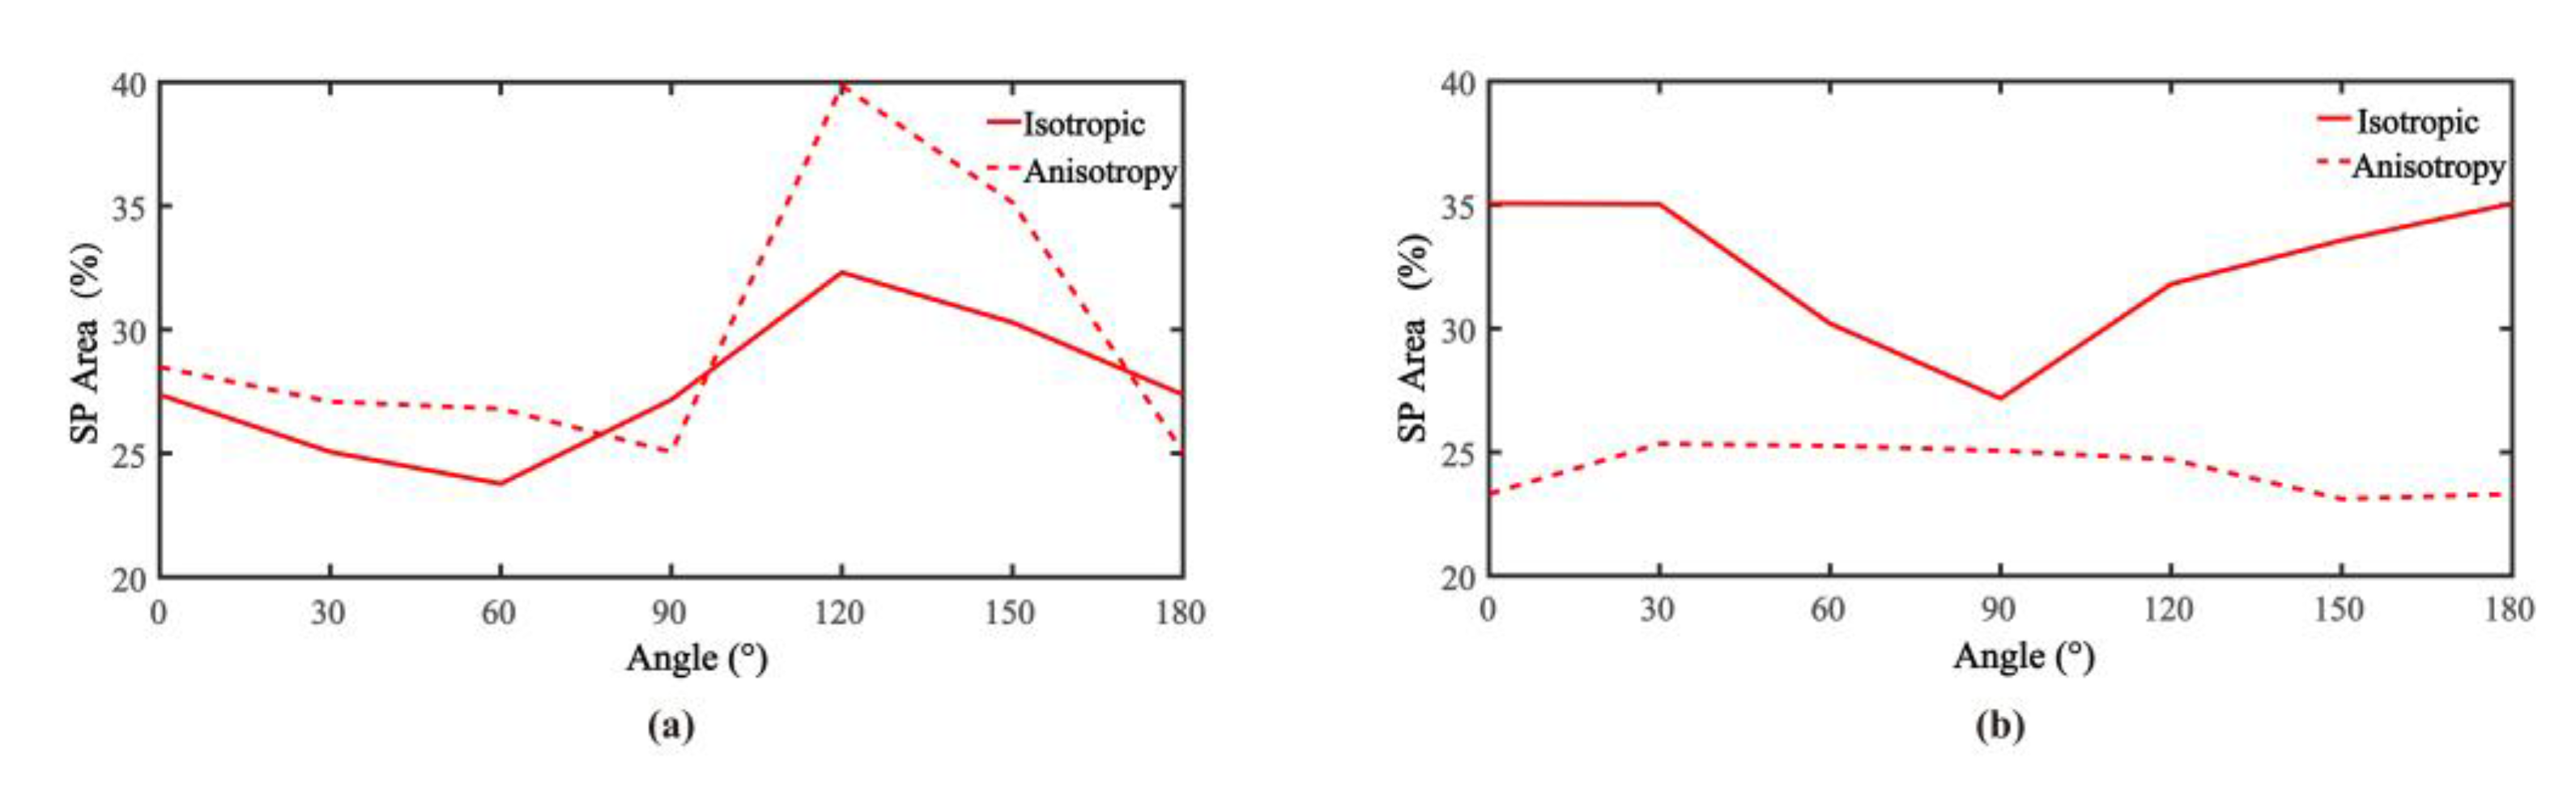
3.3. Validation of Influence of Dipole Moment on Area of Significant Power
4. Discussion
4.1. Power
4.2. Anisotropy
5. Conclusions
Author Contributions
Funding
Institutional Review Board Statement
Informed Consent Statement
Data Availability Statement
Conflicts of Interest
References
- McDonnell, J.; Murray, N.P.; Ahn, S.; Clemens, S.; Everhart, E.; Mizelle, J.C. Examination and Comparison of Theta Band Connectivity in Left- and Right-Hand Dominant Individuals throughout a Motor Skill Acquisition. Symmetry 2021, 13, 728. [Google Scholar] [CrossRef]
- Buzsáki, G. Rhythms of the Brain; Oxford University Press: Oxford, UK, 2009. [Google Scholar]
- Herweg, N.A.; Solomon, E.A.; Kahana, M.J. Theta Oscillations in Human Memory. Trends Cogn. Sci. 2020, 24, 208–277. [Google Scholar] [CrossRef]
- Fu, X.; Wang, Y.; Ge, M.; Wang, D.; Gao, R.; Wang, L.; Guo, J.; Liu, H. Negative Effects of Interictal Spikes on Theta Rhythm in Human Temporal Lobe Epilepsy. Epilepsy Behav. 2018, 87, 207–212. [Google Scholar] [CrossRef]
- Shirhatti, V.; Borthakur, A.; Ray, S. Effect of Reference Scheme on Power and Phase of the Local Field Potential. Neural Comput. 2016, 28, 882–913. [Google Scholar] [CrossRef]
- Alarcon, G.; Binnie, C.D.; Elwes, R.D.C.; Polkey, C.E. Power Spectrum and Intracranial EEG Patterns at Seizure Onset in Partial Epilepsy. Electroencephalogr. Clin. Neurophysiol. 1995, 94, 326–337. [Google Scholar] [CrossRef]
- Chauvière, L.; Rafrafi, N.; Thinus-Blanc, C.; Bartolomei, F.; Esclapez, M.; Bernard, C. Early Deficits in Spatial Memory and Theta Rhythm in Experimental Temporal Lobe Epilepsy. J. Neurosci. 2009, 29, 5402–5410. [Google Scholar] [CrossRef]
- Ge, M.; Wang, D.; Dong, G.; Guo, B.; Gao, R.; Sun, W.; Zhang, J.; Liu, H. Transient Impact of Spike on Theta Rhythm in Temporal Lobe Epilepsy. Exp. Neurol. 2013, 250, 136–142. [Google Scholar] [CrossRef] [PubMed] [Green Version]
- Lindén, H.; Pettersen, K.H.; Einevoll, G.T. Intrinsic Dendritic Filtering Gives Low-pass Power Spectra of Local Field Potentials. J. Comput. Neuroence 2010, 29, 423–444. [Google Scholar] [CrossRef] [PubMed]
- Winson, J. Loss of Hippocampal Theta Rhythm Results in Spatial Memory Deficit in the Rat. Science 1978, 201, 160–163. [Google Scholar] [CrossRef]
- Miriam, G.; Markus, B.; Tobias, B. Frequency- and State-dependent Effects of Hippocampal Neural Disinhibition on Hippocampal Local Field Potential Oscillations in Anesthetized Rats. Hippocampus 2020, 30, 1021–1043. [Google Scholar]
- Agrita, D.; Supratim, R. Spatial Spread of Local Field Potential is Band-pass in the Primary Visual Cortex. J. Neurophysiol. 2016, 116, 1986–1999. [Google Scholar]
- Bédard, C.; Rodrigues, S.; Roy, N.; Contreras, D.; Destexhe, A. Evidence for Frequency-dependent Extracellular Impedance from the Transfer Function between Extracellular and Intracellular Potentials. J. Comput. Neurosci. 2010, 29, 389–403. [Google Scholar] [CrossRef] [Green Version]
- Ge, M.; Fu, X.; Zhang, J.; Chen, S.; Chen, Y.; Gao, R.; Zhang, H. The Influences of Tissue Anisotropy and Source Activity on Power and Phase Stability of Low-frequency EEG Rhythms: A Mathematical Observation of the Forward Problem Model. Biomed. Phys. Eng. Express 2016, 2. [Google Scholar] [CrossRef] [Green Version]
- Łęski, S.; Lindén, H.; Tetzlaff, T.; Pettersen, K.H.; Einevoll, G.T. Frequency Dependence of Signal Power and Spatial Reach of the Local Field Potential. PLOS Comput. Biol. 2013, 9, e1003137. [Google Scholar] [CrossRef] [Green Version]
- Logothetis, N.K.; Kayser, C.; Oeltermann, A. In vivo Measurement of Cortical Impedance Spectrum in Monkeys: Implications for Signal Propagation. Neuron 2007, 55, 809–823. [Google Scholar] [CrossRef] [Green Version]
- Lubenov, E.V.; Siapas, A.G. Hippocampal Theta Oscillations are Travelling Waves. Nature 2009, 459, 534–539. [Google Scholar] [CrossRef]
- Brody, D.A.; Terry, F.H.; Ideker, R.E. Eccentric Dipole in a Spherical Medium: Generalized Expression for Surface Potentials. IEEE Trans. Bio. Med. Eng. 1973, 20, 141–143. [Google Scholar] [CrossRef] [PubMed]
- Torres, F. Electroencephalography: Basic Principles, Clinical Applications and Related Fields. Arch. Neurol. 1983, 40, 191–192. [Google Scholar] [CrossRef]
- Vecchio, A.; De Pascalis, V. EEG Resting Asymmetries and Frequency Oscillations in Approach/Avoidance Personality Traits: A Systematic Review. Symmetry 2020, 12, 1712. [Google Scholar] [CrossRef]
- Nicholson, P.W. Specific Impedance of Cerebral White Matter. Exp. Neurol. 1965, 13, 386–401. [Google Scholar] [CrossRef]
- Soret, M.; Bacharach, S.L.; Buvat, I. Partial-volume Effect in PET Tumor Imaging. J. Nucl. Med. 2007, 48, 932–945. [Google Scholar] [CrossRef] [Green Version]
- De Munck, J.C.; Wolters, C.; Clerc, M. EEG and MEG: Forward Modeling. In Handbook of Neural Activity Measurement; Brette, R., Destexhe, A., Eds.; Cambridge University Press: Cambridge, UK, 2012; pp. 192–256. [Google Scholar]
- Ding, N.; Simon, J.Z. Power and Phase Properties of Oscillatory Neural Responses in the Presence of Background Activity. J. Comput. Neuroence 2013, 34, 337–343. [Google Scholar] [CrossRef] [Green Version]
- Satzer, D.; Lanctin, D.; Eberly, L.E.; Abosch, A. Variation in Deep Brain Stimulation Electrode Impedance over Years Following Electrode Implantation. Stereotact. Funct. Neurosurg. 2014, 92, 94–102. [Google Scholar] [CrossRef] [PubMed] [Green Version]
- Wolters, C.H.; Anwander, A.; Tricoche, X.; Weinstein, D.; Koch, M.A.; Macleod, R.S. Influence of Tissue Conductivity Anisotropy on EEG/MEG Field and Return Current Computation in a Realistic Head Model: A Simulation and Visualization Study Using High-resolution Finite Element Modeling. NeuroImage 2006, 30, 813–826. [Google Scholar] [CrossRef] [Green Version]


Publisher’s Note: MDPI stays neutral with regard to jurisdictional claims in published maps and institutional affiliations. |
© 2021 by the authors. Licensee MDPI, Basel, Switzerland. This article is an open access article distributed under the terms and conditions of the Creative Commons Attribution (CC BY) license (https://creativecommons.org/licenses/by/4.0/).
Share and Cite
Cheng, H.; Ge, M.; Belkacem, A.N.; Fu, X.; Xie, C.; Song, Z.; Chen, S.; Chen, C. A Simulation on Relation between Power Distribution of Low-Frequency Field Potentials and Conducting Direction of Rhythm Generator Flowing through 3D Asymmetrical Brain Tissue. Symmetry 2021, 13, 900. https://0-doi-org.brum.beds.ac.uk/10.3390/sym13050900
Cheng H, Ge M, Belkacem AN, Fu X, Xie C, Song Z, Chen S, Chen C. A Simulation on Relation between Power Distribution of Low-Frequency Field Potentials and Conducting Direction of Rhythm Generator Flowing through 3D Asymmetrical Brain Tissue. Symmetry. 2021; 13(5):900. https://0-doi-org.brum.beds.ac.uk/10.3390/sym13050900
Chicago/Turabian StyleCheng, Hao, Manling Ge, Abdelkader Nasreddine Belkacem, Xiaoxuan Fu, Chong Xie, Zibo Song, Shenghua Chen, and Chao Chen. 2021. "A Simulation on Relation between Power Distribution of Low-Frequency Field Potentials and Conducting Direction of Rhythm Generator Flowing through 3D Asymmetrical Brain Tissue" Symmetry 13, no. 5: 900. https://0-doi-org.brum.beds.ac.uk/10.3390/sym13050900