
Force Analysis of Self-Anchored Suspension Bridges after Cable Clamp Slippage


School of Civil Engineering, Northeast Forestry University, Harbin 150040, China
*
Author to whom correspondence should be addressed.
Symmetry 2021, 13(8), 1514; https://0-doi-org.brum.beds.ac.uk/10.3390/sym13081514
Submission received: 22 July 2021
/
Revised: 13 August 2021
/
Accepted: 16 August 2021
/
Published: 18 August 2021
(This article belongs to the Special Issue Symmetry in Structural Health Monitoring)
Abstract
:The slippage of cable clamps during the long-term operation of suspension bridges is a common and detrimental phenomenon. From an experimental point of view, the cable clamp slippage of a suspension bridge was investigated to reveal the effect of this sliding on the force acting on the full bridge. The forces acting on the bridge before and after the slippage were analyzed using a finite element model. The calculation results showed that the cable clamp slippage directly affects the cable forces of the hangers. The hanger cable force decreased by 19.2% when the slippage reached 10.2 cm, while the maximum increase in the cable force of adjacent hangers was 147.7 kN, an increase of 7.25%. The variation of forces in the hanger cable disrupted the force balance of the main girder, thereby producing a torque effect at the corresponding position in the girder, i.e., increased torque. Meanwhile, the slippage affected the axial tension in the main cable and the main girder. The impact of the tower internal force was less than 1%. Hence, the study concluded that the effect of cable clamp slippage is better understood, ensuring the safety of the suspension bridge.
1. Introduction
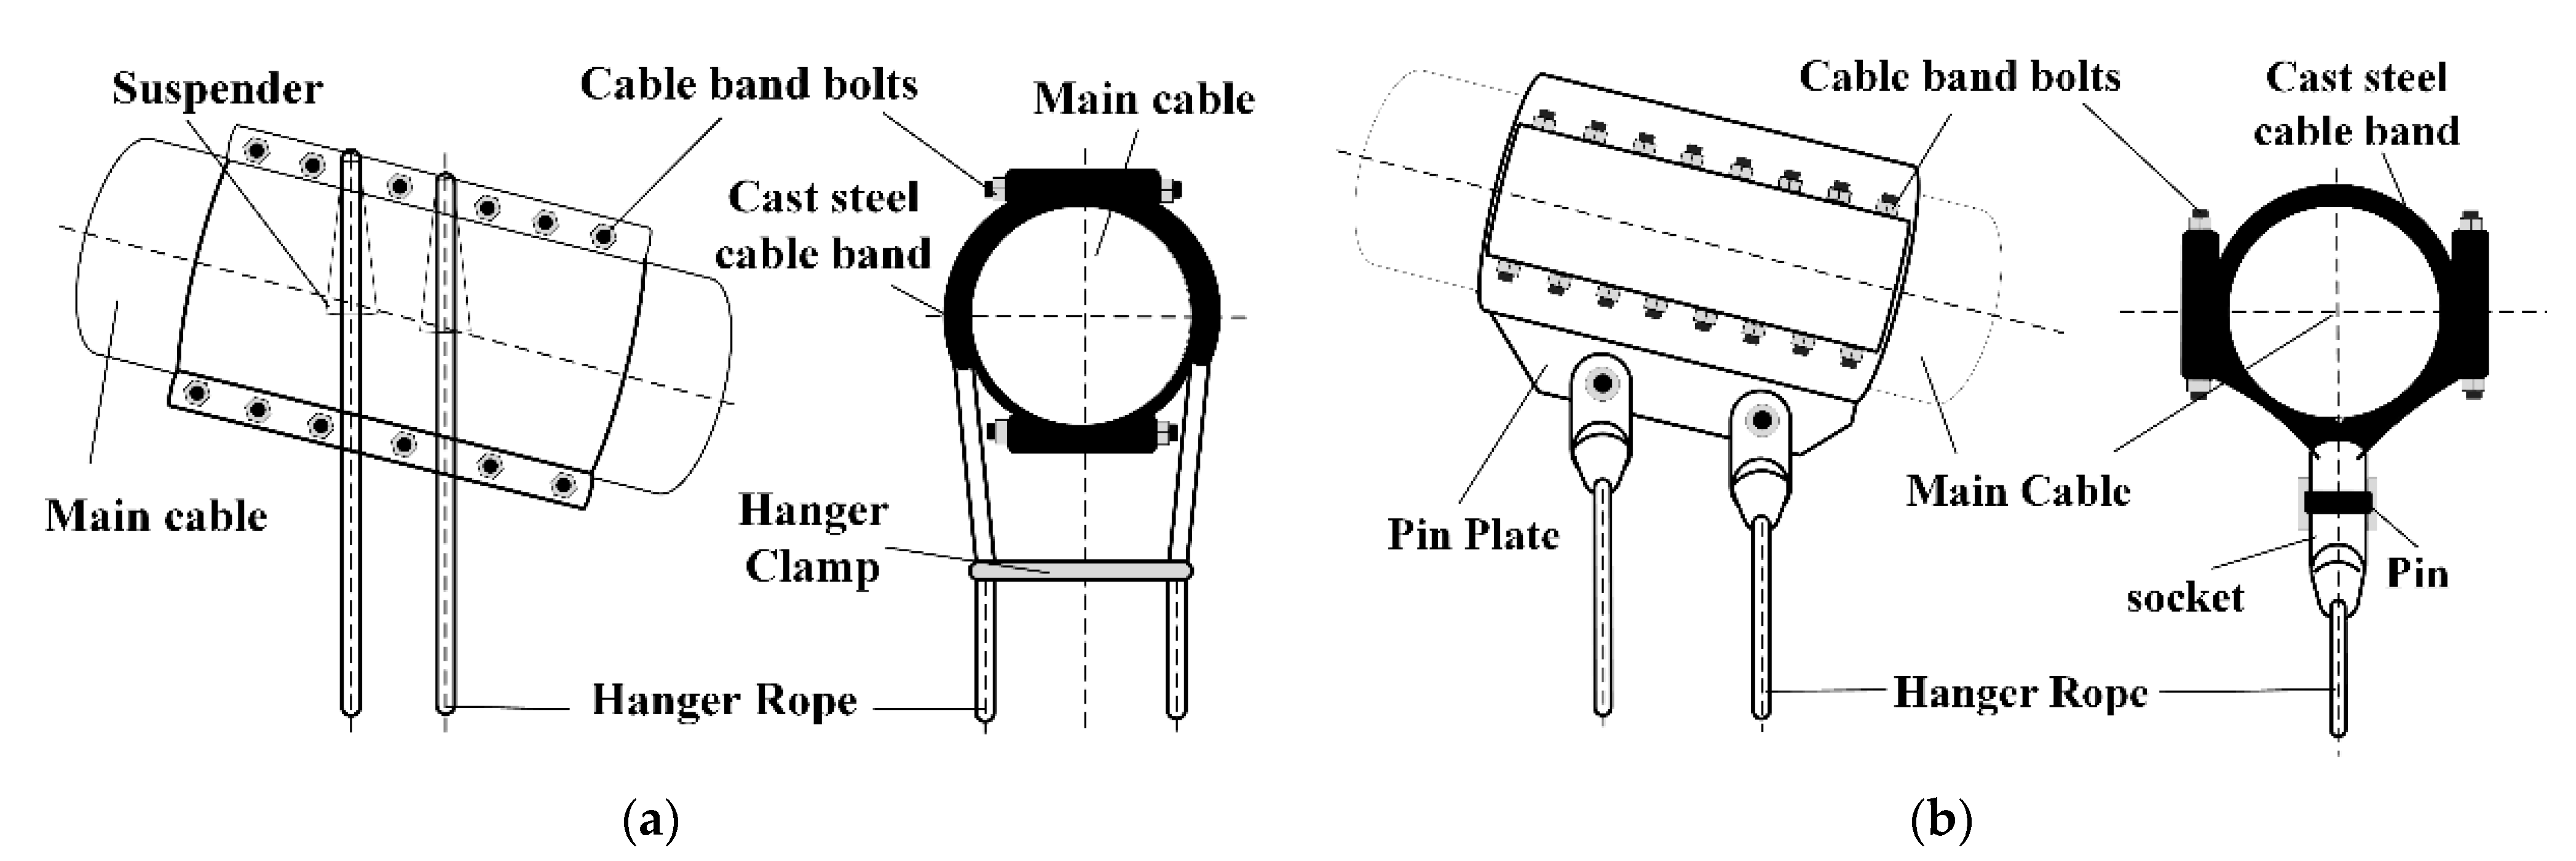
In suspension bridges, cable clamps are key nodes connecting the main cables and hangers. With the progress and development of suspension bridges, cable clamps have gradually evolved from eyebars and pin-type hinge structures to riding straddle and pin-type structures. The choice is closely related to the type of hanger used: riding straddle cable clamps are commonly used for wire rope hangers, whereas pin-type cable clamps are used for parallel wire hangers. In the U.S. and Japan, preference is given to riding straddle cable clamps, whereas pin-type cable clamps are more common in China and Europe [1]. Figure 1 shows the different types of cable clips.
During the construction and operation, the cable clamp will no longer be firmly anchored because of the loosening of the fastening bolts, the main cable has a thinner section under long-term loading, and the linear expansion coefficient is inconsistent under the influence of temperature. These factors are important inducements that cause slippage of the suspension bridge cable clamps. Therefore, the cable clamp slippage is a common phenomenon that is detrimental to suspension bridges. In the inspection manual for suspension bridges developed by the Honshu–Shikoku Bridge Construction Corporation, Japan, cable clamp slippage is listed as a key inspection item [2]. In the United States, the cable inspection and strength assessment guidelines provide detailed inspection requirements for hangers and cable clamps [3]. There are strict regulations on cable clamp slippage in the Chinese Highway Bridge Technical Condition Assessment Standard [4].
Cable clamps with poor anti-sliding performance tend to slide along the main cable, as shown in Figure 2, which directly causes a loss of stress in the entire structure and major safety hazards in the structural system. Insufficient anti-skid performance of the cable clamp will cause the cable clamp to slide down the main cable, which will lead to the redistribution of the internal force of the principal force-bearing components such as the main cable, hanger, and main beam. The internal force deviates from the design value and the safety reserve of the structure is cut. In practice, engineering problems due to the poor anti-sliding performance of cable clamps may force a project to be terminated or even rebuilt. Hence, scholars have extensively studied the problem of cable clamp slippage.
In 2000, Ji et al. analyzed the additional force due to the hanger pull acting on the screws in the hanger, with an objective to improve the cable clamp design of the Kurima Bridge, Japan. The Liaison Bridge Corporation proposed the application of pin-type cable clamps for the first time [5]. Since 2009, scholars have started paying attention to cable clamp slippage in suspension bridges. Ren et al. analyzed the anti-skid friction coefficient of a cable clamp and the main cable void ratio by conducting an anti-sliding test on the main cable and cable clamp [6]. Huang et al. studied the variations in the lateral displacement of the main cable and the lateral deflection angle of the cable clamp under the effect of hanger tension in the main cable [7]. In 2013, Li et al. determined the upper limit of the transverse elastic modulus based on the macroscopic force of an ideally arranged main cable [8]. In 2014, Ruan et al. studied and analyzed the spatial effect and stress distribution characteristics of a cable clamp [9]. Ma et al. conducted jack push tests on the main cable of a suspension bridge to analyze the friction coefficient of the cable clamp against sliding and the internal and external void ratios of the cable clamp [10]. Zhuge et al. studied the friction factor of a carbon fiber reinforced plastic (CFRP) cable–cable clamp interface [11]. Li et al. proposed the Tsai–Hill failure criterion for composite materials [12]. In 2015, Zhou et al. calculated the anti-sliding friction coefficient and the internal and external void ratios of a steel wire main cable clamp coated with a zinc–aluminum alloy [13]. In 2016, Sun et al. derived a simplified calculation formula to determine the increase in the elevation of the main cable mid-span control point and the average increment in the hanger cable force [14]. In 2018, Shen et al. analyzed the change laws of the ultimate anti-sliding friction resistance of a cable clamp under the action of the cable force, and the contact force between the main cable and the cable clamp surface [15,16]. In 2019, Ruan et al. proposed a theoretical model considering transversely isotropic materials based on the generalized Hooke’s law. Through anti-slipping performance tests, they determined the actual ultimate sliding resistance and comprehensive friction coefficient of a cable clamp [17]. In 2020, Miao et al. proposed a new slippage-based failure criterion based on an analytical model [18] and briefly revised the original slippage resistance formula using the Coulomb friction law.
In summary, most studies have been based on the interface performance of the main cable and the cable clamp, focusing on the analysis of the effects of the clamping force of the cable clamp and the friction coefficient on the anti-slipping performance. Studies on the total force acting on suspension bridges are lacking. The integrity of the overall structure of a full bridge following cable clamp slippage has rarely been studied. In practice, although cable clamp slippage is minor, it is a key factor causing a change in the forces acting on the entire bridge. Therefore, this study mainly analyzed the overall force acting on suspension bridges following cable clamp slippage.
In this paper, the influence of pin-type cable clamp slippage on a self-anchored suspension bridge is reported. Considering the geometric nonlinear influence of the bridge, a finite element simulation was conducted. First, we selected a large-span self-anchored bridge as an example to describe the geometry of self-anchored suspension bridges and the magnitude of the cable clamp slippage in detail. Subsequently, a method for simulating the cable clamp slippage was proposed and verified through examples. Additionally, the total force acting on the suspension bridge before and after cable clamp slippage was analyzed, and recommendations for operation and maintenance was provided.
2. Background
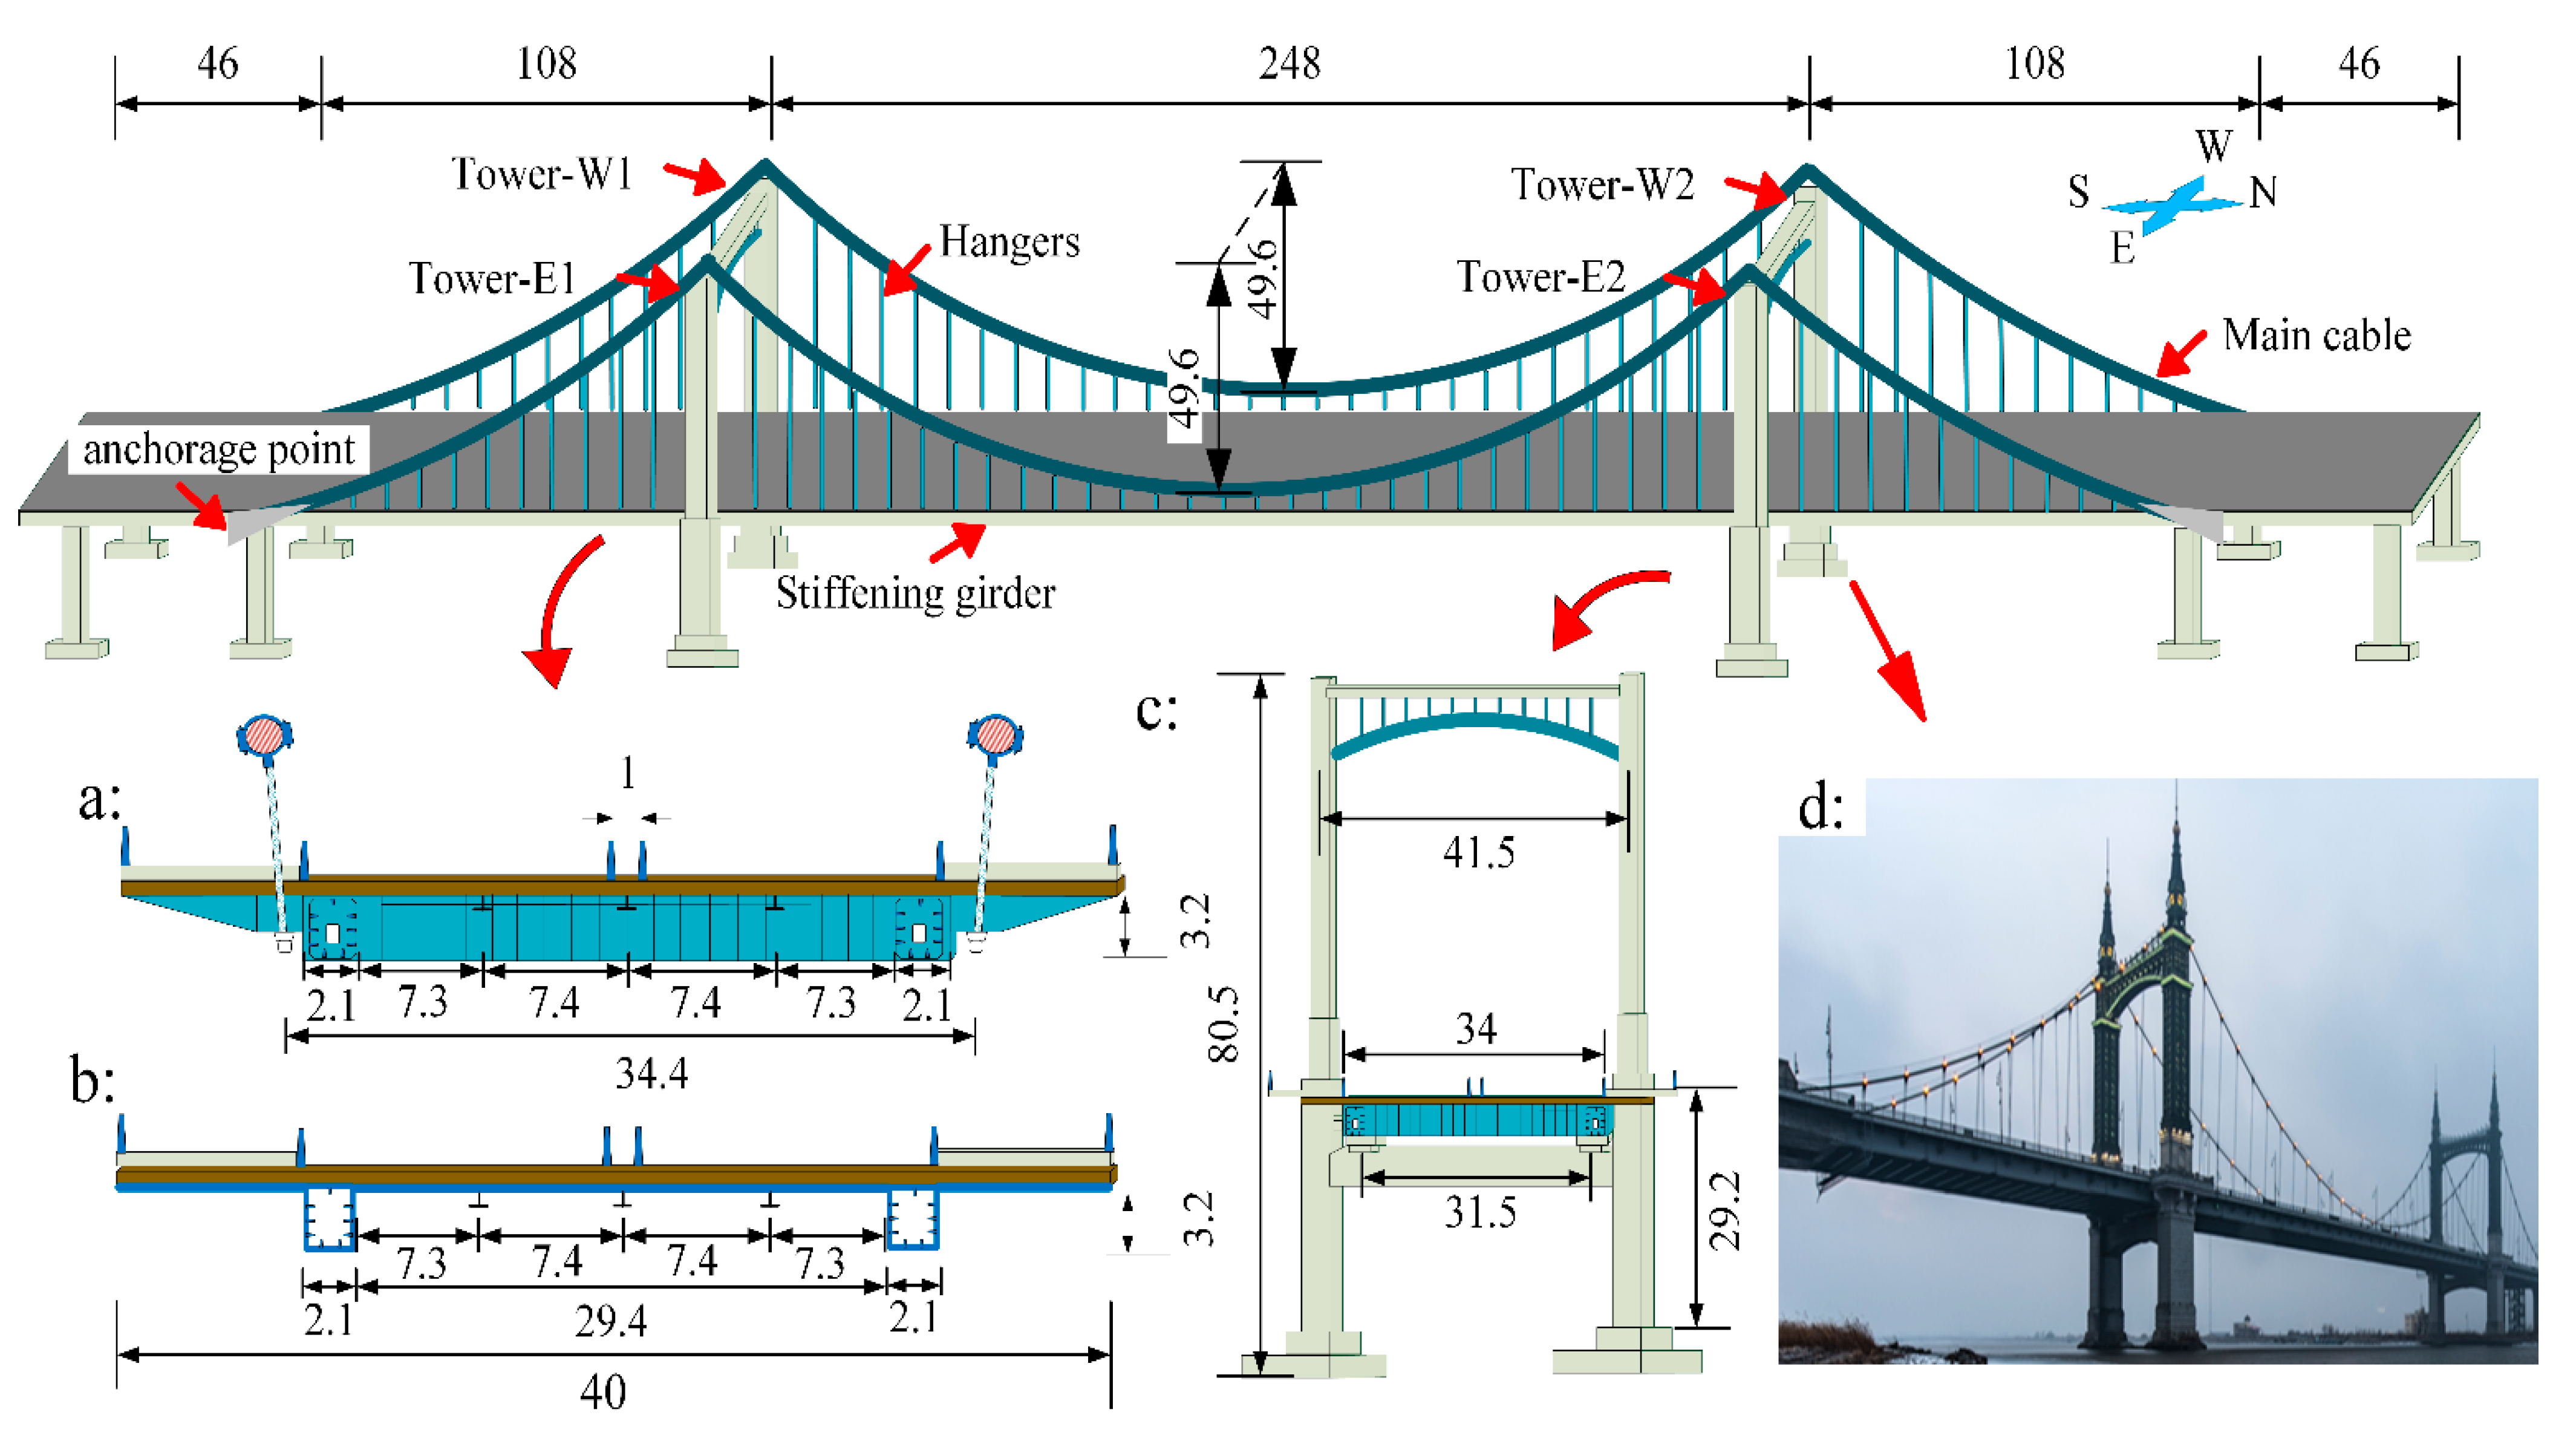
A self-anchored suspension bridge with double towers and double cable planes (see Figure 3) was selected as the research object. The main span, side span, auxiliary span, cable sag ratio, and sag-span ratio of this bridge are 248 m, 108 m, 46 m, 49.6 m, and 1/5, respectively. The main tower is a double-tower portal structure system with a height of 80.5 m; the main cable is a parallel steel wire; the hanger is a parallel steel wire strand; and the stiffening girder is a steel–concrete composite girder system.
The construction of this self-anchored suspension bridge was initiated in 2011. A recent structural inspection revealed that the cable clamp close to the main tower has caused severe cable clamp slippage, as shown in Figure 4. Hence, this bridge was thoroughly checked for cable clamp slippage.
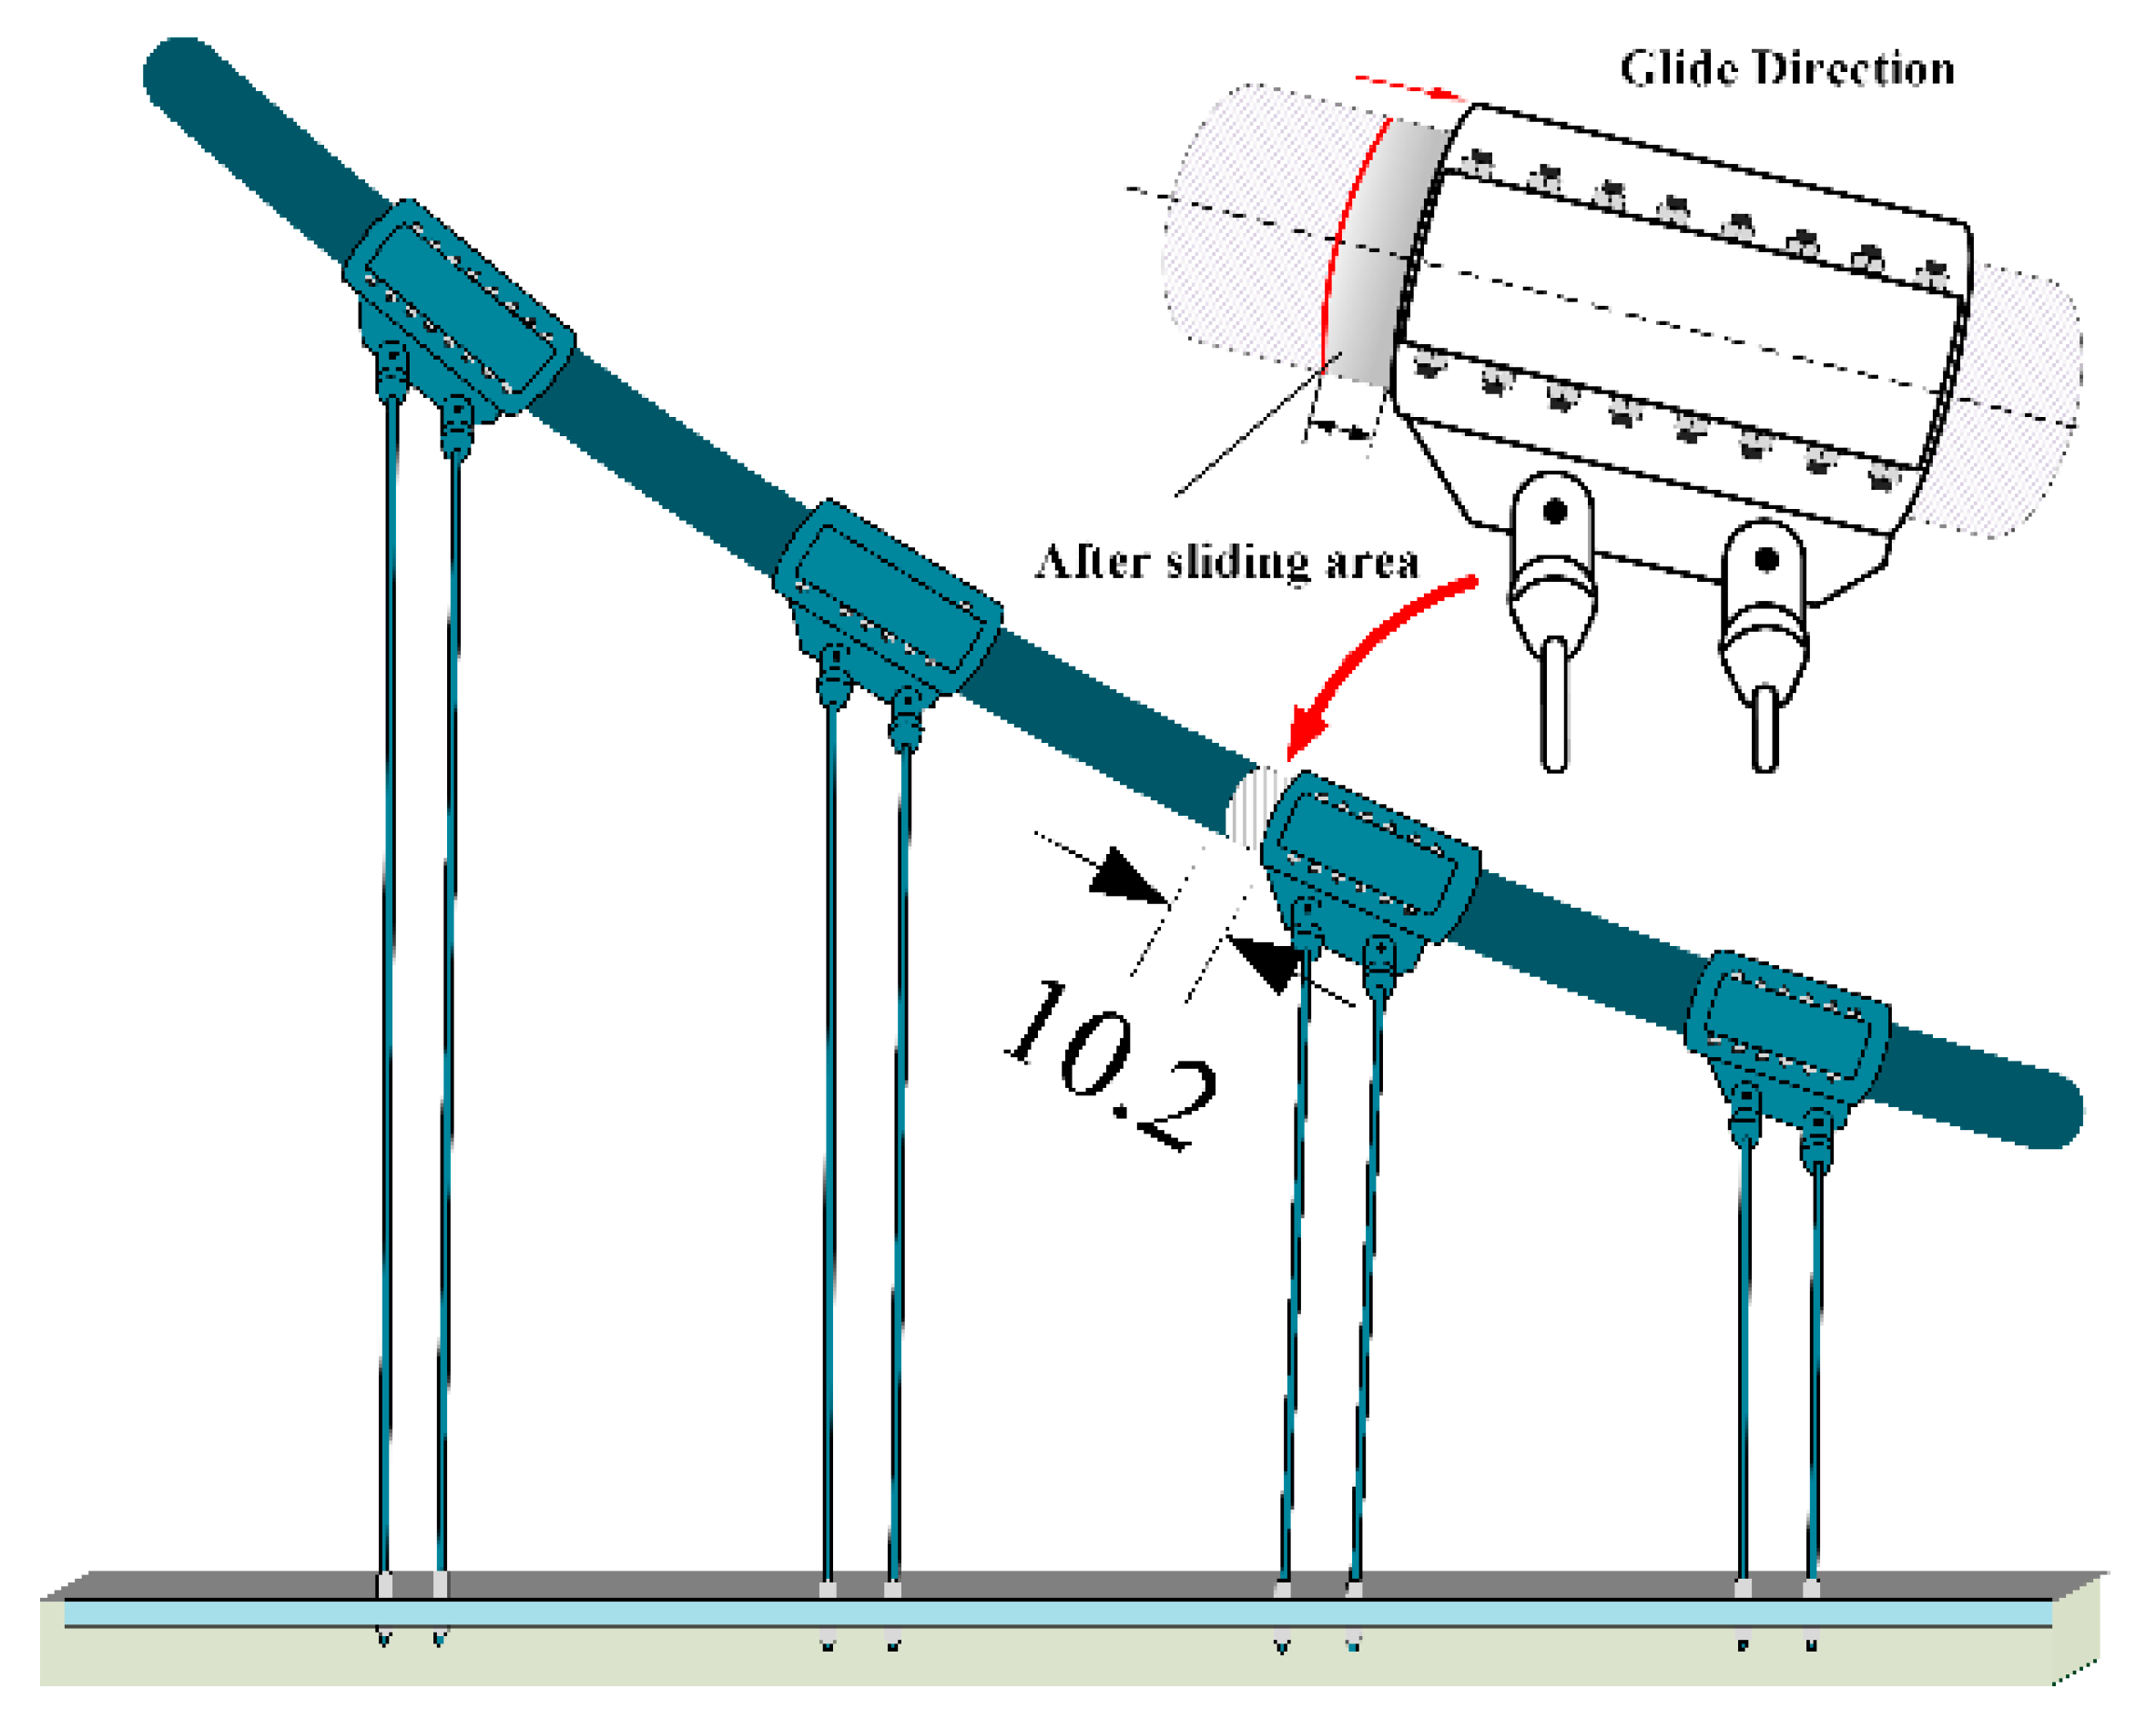
As showed in Figure 4, the sliding direction of the cable clamp is along the radial direction of the main cable. After inspection, the radial sliding distance of all cable clamps was measured in detail, and the number of each sliding cable clamp and the amount of slippage was recorded. In the establishment of the finite element model, adjusting the position of the cable clamp simulates the actual bridge stress condition. In order to emphasize the influence of the change in the position of the cable clamp on the whole bridge, the cable clamp with the largest slip amount is mainly simulated during the simulation.
During the inspection of the suspension bridge, it was found that the cable clamp that belonged to the third hanger in the mid-span direction of the W1 main tower was the most serious. A detailed inspection of the remaining cable clamps revealed that a total of 20 cable clamps in the whole bridge had slipped. Among them, there were 11 sliding positions of the west cable clamp, and 9 sliding positions of the east cable clamp. Figure 5 shows the downward positions of the cable clamps.
The measurements showed that five cable clamps slipped beyond 5 cm, and the maximum slippage was found to be 10.2 cm. Table 1 summarizes the slippage of the cable clip.
Because of the slipping of several cable clamps, the variation in the structural force acting on the full bridge is complicated. To eliminate the numerous interferences and obtain the most representative situation, the slipping of a single cable clamp on one side is employed for the simulation. We established a model for the slipping of this clamp. In addition to considering the weight of the main cable, stiffening beams, main tower, and hangers, it is necessary to consider auxiliary components, such as the bridge deck paving, sidewalks, and guardrails, and convert them into constant loads for the simulation analysis. The dead load distribution of the bridge deck paving asphalt, sidewalks, and guardrails and other ancillary components is 132 kN/m.
3. Simulation of Cable Clamp Slippage
3.1. Finite Element Modelingsubsection
MIDAS Civil was used to establish a finite element model for the theoretical calculations. The bridge is first assembled from a free cables state to a finished bridge state and then changed from a finished bridge state to a slip state. In a structural analysis, the equilibrium equation of the force should be established based on the geometric position of the structure after deformation, and the relationship between the force and the deformation is nonlinear. Therefore, the model cannot be established directly from the slip state. When building the model, the finished bridge state model must be established first, and then the slip state should be established based on the finished bridge state. The models currently employed can mainly be divided into nondamaged bridge completion stage models and single-hanger slip whole bridge models for calculation and comparison. The main girder and the main tower of the whole bridge model are simulated by beam elements, and the main cables and hangers are mainly stimulated by cable elements. Table 2 lists the main modeling material parameters.
To ensure that the force condition of the bridge is simulated correctly and is consistent with reality, when the model is established, the boundary conditions are as follows: consolidate the bottom nodes of the main tower; rigidly connect the top of the main cable to the main tower and then release the full fixation in the rest of the direction of the bridge displacement; rigidly connect the bottom of the main cable to the main girder and constrain all direction; elastic support simulation is adopted at each support of the main beam. The entire bridge is divided into 4706 elements and 5409 nodes. Among them, the main cable has 106 elements, and only 98 elements of the hanger are used as tensile members. Figure 6 shows the model diagram.
3.2. Simulation Steps for Cable Clamp Slippage
For cable clamp slippage, in this study, the method of double-cable element replacement with common nodes is adopted. A new construction stage after the last construction stage of the original bridge type is established and defined as the cable clamp slip stage. We compared the two stages and observed the variations in the structural parameters after cable clamp slippage. In the slipping stage, the original main cable element is passivated, and the adjusted main bridge state cable element is activated to ensure that the model follows the original design. In the sliding stage of the cable clamp, the original main cable element, without slipping of the cable clamp, is passivated, and the main cable element after the cable clamp slips is activated correspondingly. The model takes the original mechanical state when the bridge is erected under the original design without the stress cable length as the initial state, the adjusted cable element is used to re-calculate iteratively, and finally the model converges to the slip state to complete the cable clamp slip. In the simulation of the moved finite element model, the cable element of the aforementioned main cable is adjusted by modifying the unstressed length parameters of the main cable element. The original main cable element is controlled by the unstressed cable length given by the design, and the bridge is in the final state of the bridge with the original design cable length under the working force. The replaced cable element changes its unstressed length relative to the original cable element.
The modifications are as follows: Using the measured or known slippage of the cable clamp in the final slipping state, the stress-free length change in the main cable section before and after the slipping of the cable clamp node is calculated, and the stress-free length of the main cable element, before and after the slipping of the cable clamp node, is manually adjusted. The total unstressed length of the main cable element before and after the adjustment should be kept constant.
3.3. Verification of Measured Cable Force Against Model Cable Force
The hanger is the force transmission member that transfers the stiffening girder’s own weight and external load to the main cable. It is the link between the stiffening girder and the main cable that bears the axial tension. The magnitude of the constant load axial force in the hanger determines the behavior of the main cable in the suspension bridge. The overall linearity in the completed state of the bridge also determines the magnitude and distribution of the dead load bending moment of the stiffening girder; therefore, the hanger is key to studying the finished state of the bridge after completion of the suspension bridge. The cable force is the most intuitive measurement standard that reflects the overall force of the hanger [19]. The force distribution, between the main cable and the main girder of the actual spatial self-anchored suspension bridge, is mainly determined by the sling force, and the load on the main girder is transmitted by the hanger. Therefore, the load on the main beam is directly related to the weight of the main beam and the cable force of the sling.
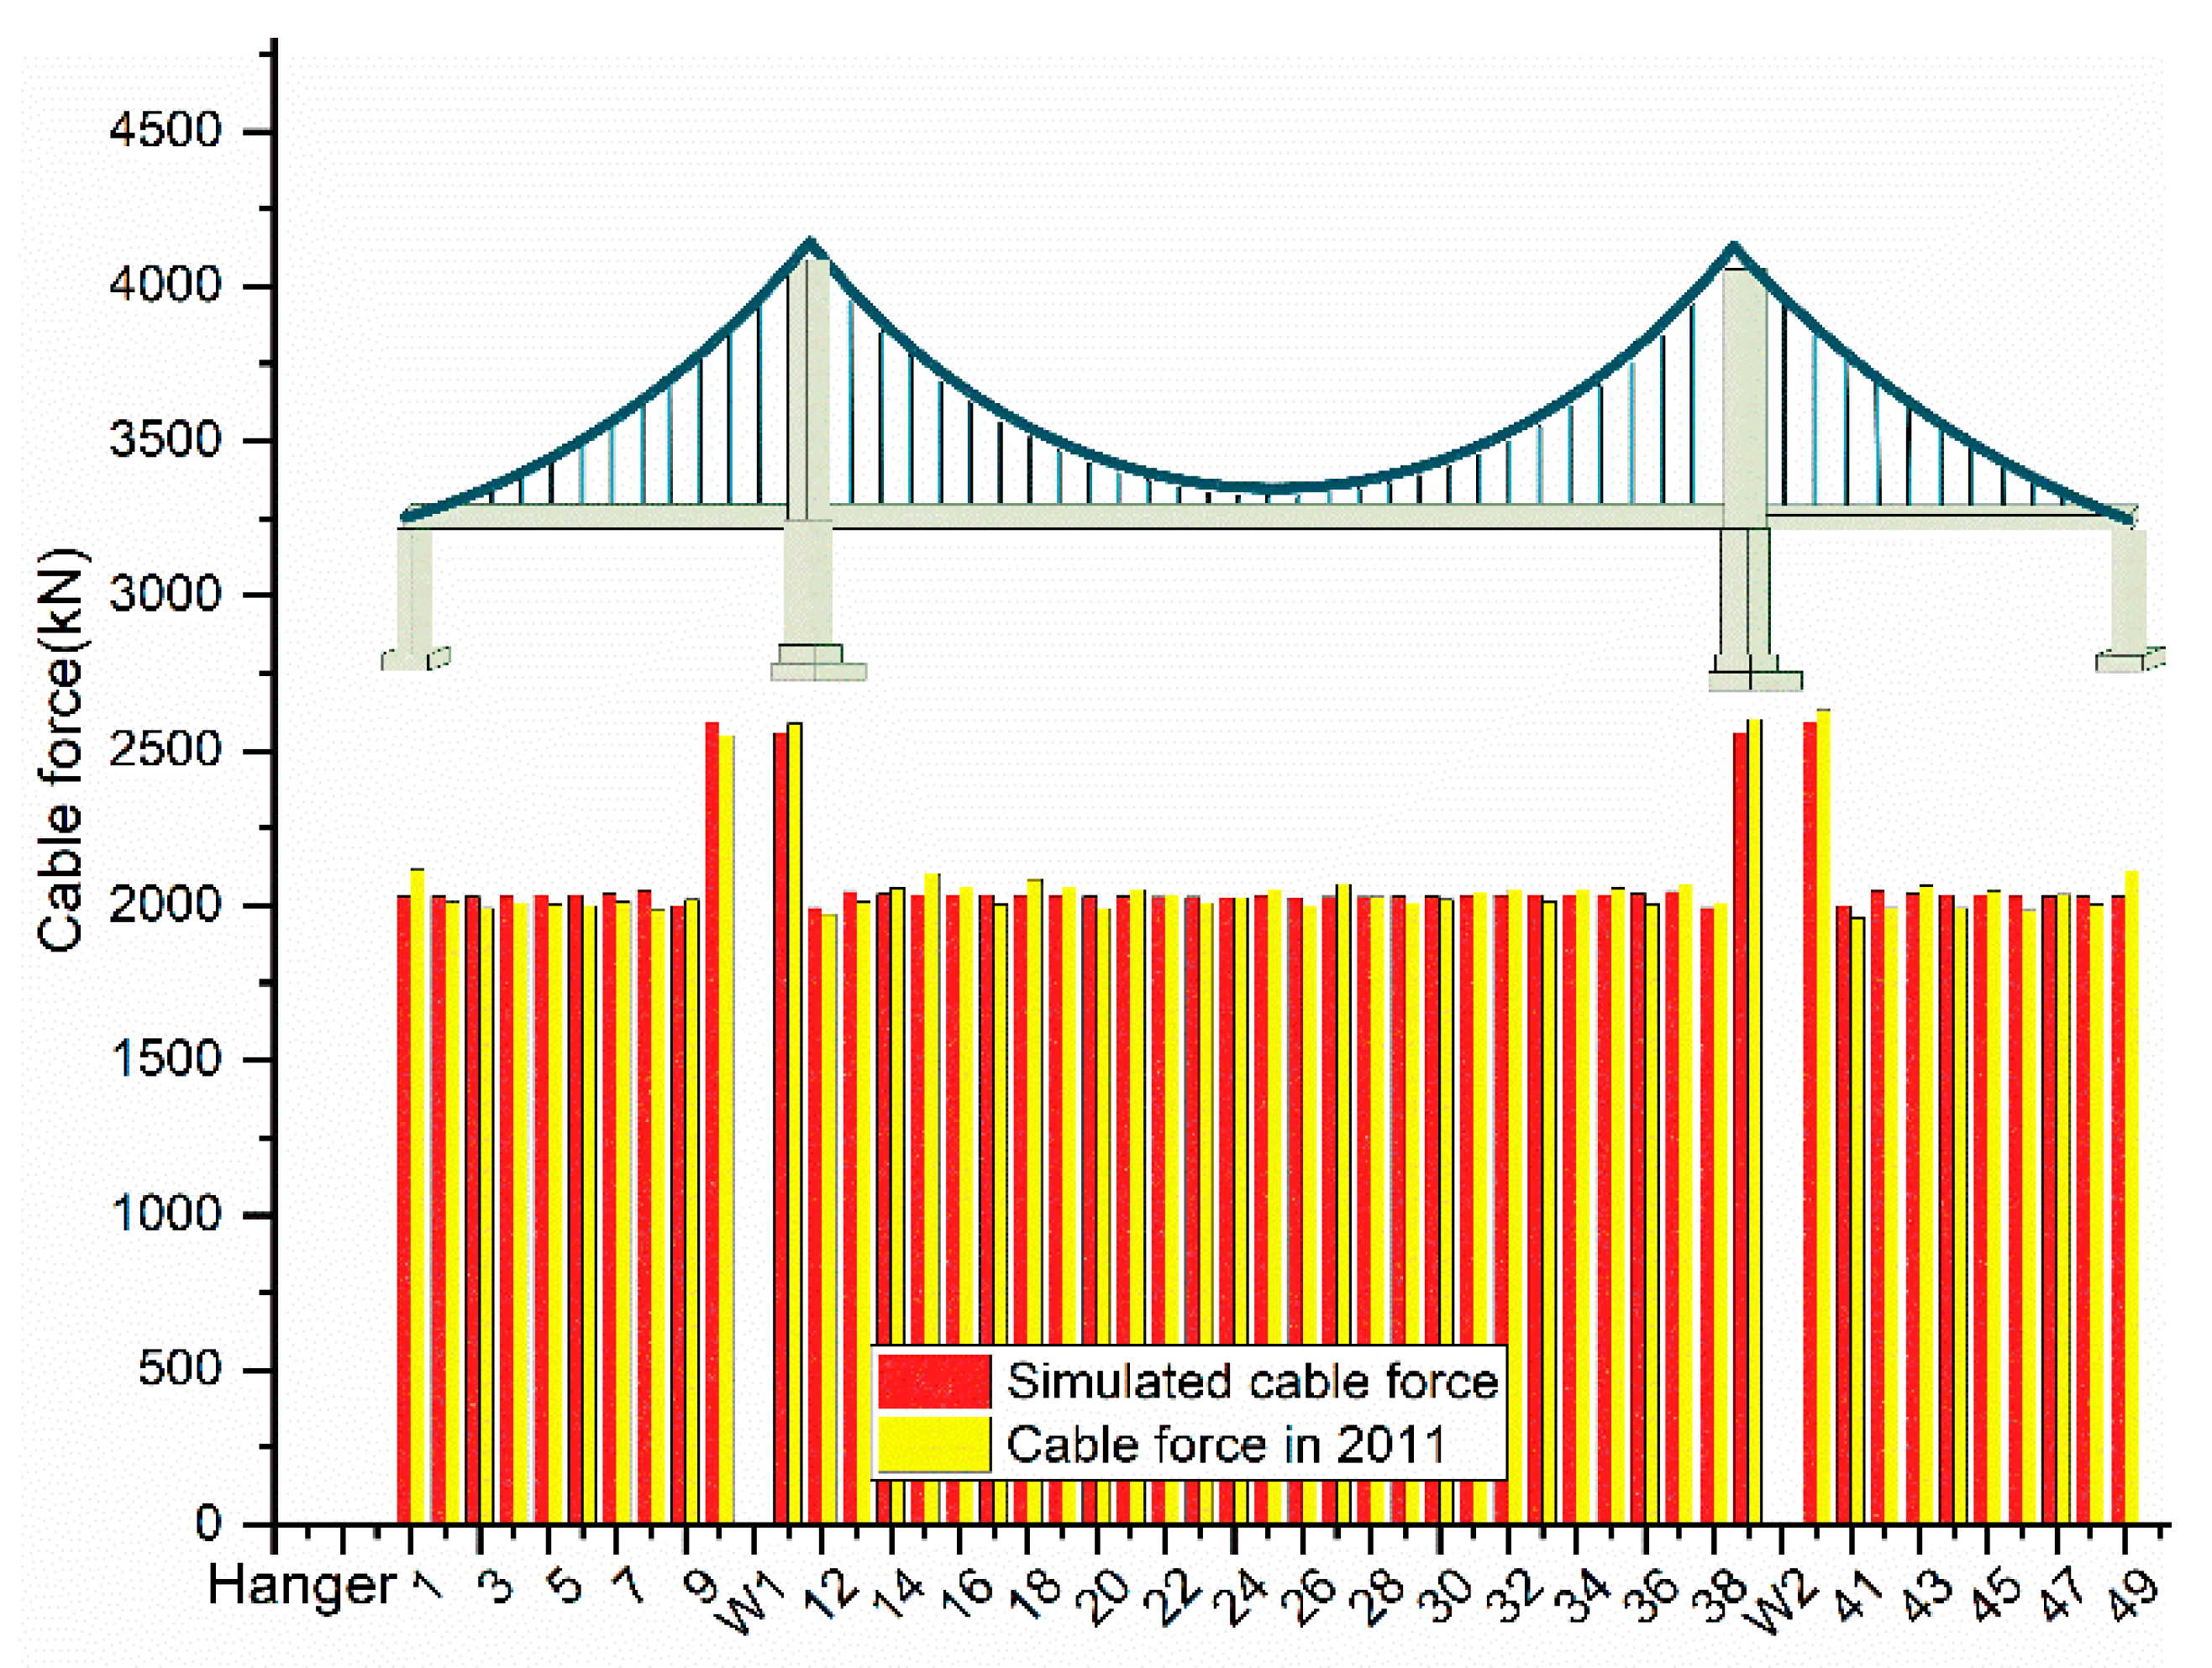
To ensure that the finite element simulation is consistent with the actual force trend in the actual completed state, the hanger cable force was used to verify the model. The verification method was used to measure the hanger frequency using the frequency method when the bridge was completed in 2011, and the result was then compared with the cable force obtained from the finite element method. The suspension bridge structure is a symmetrical structure, so only the cable forces of the model and actual bridge on one side of the structure are compared. As shown in Figure 7, the cable force distribution in the model is consistent with the actual cable force distribution trend of the bridge in 2011. The maximum cable force in the finite element model is 2590 kN, and the maximum cable force measured in the bridge in 2011 was 2629.8 kN. The difference is 39.8 kN, and the positions are all close to the hanger of the main tower.
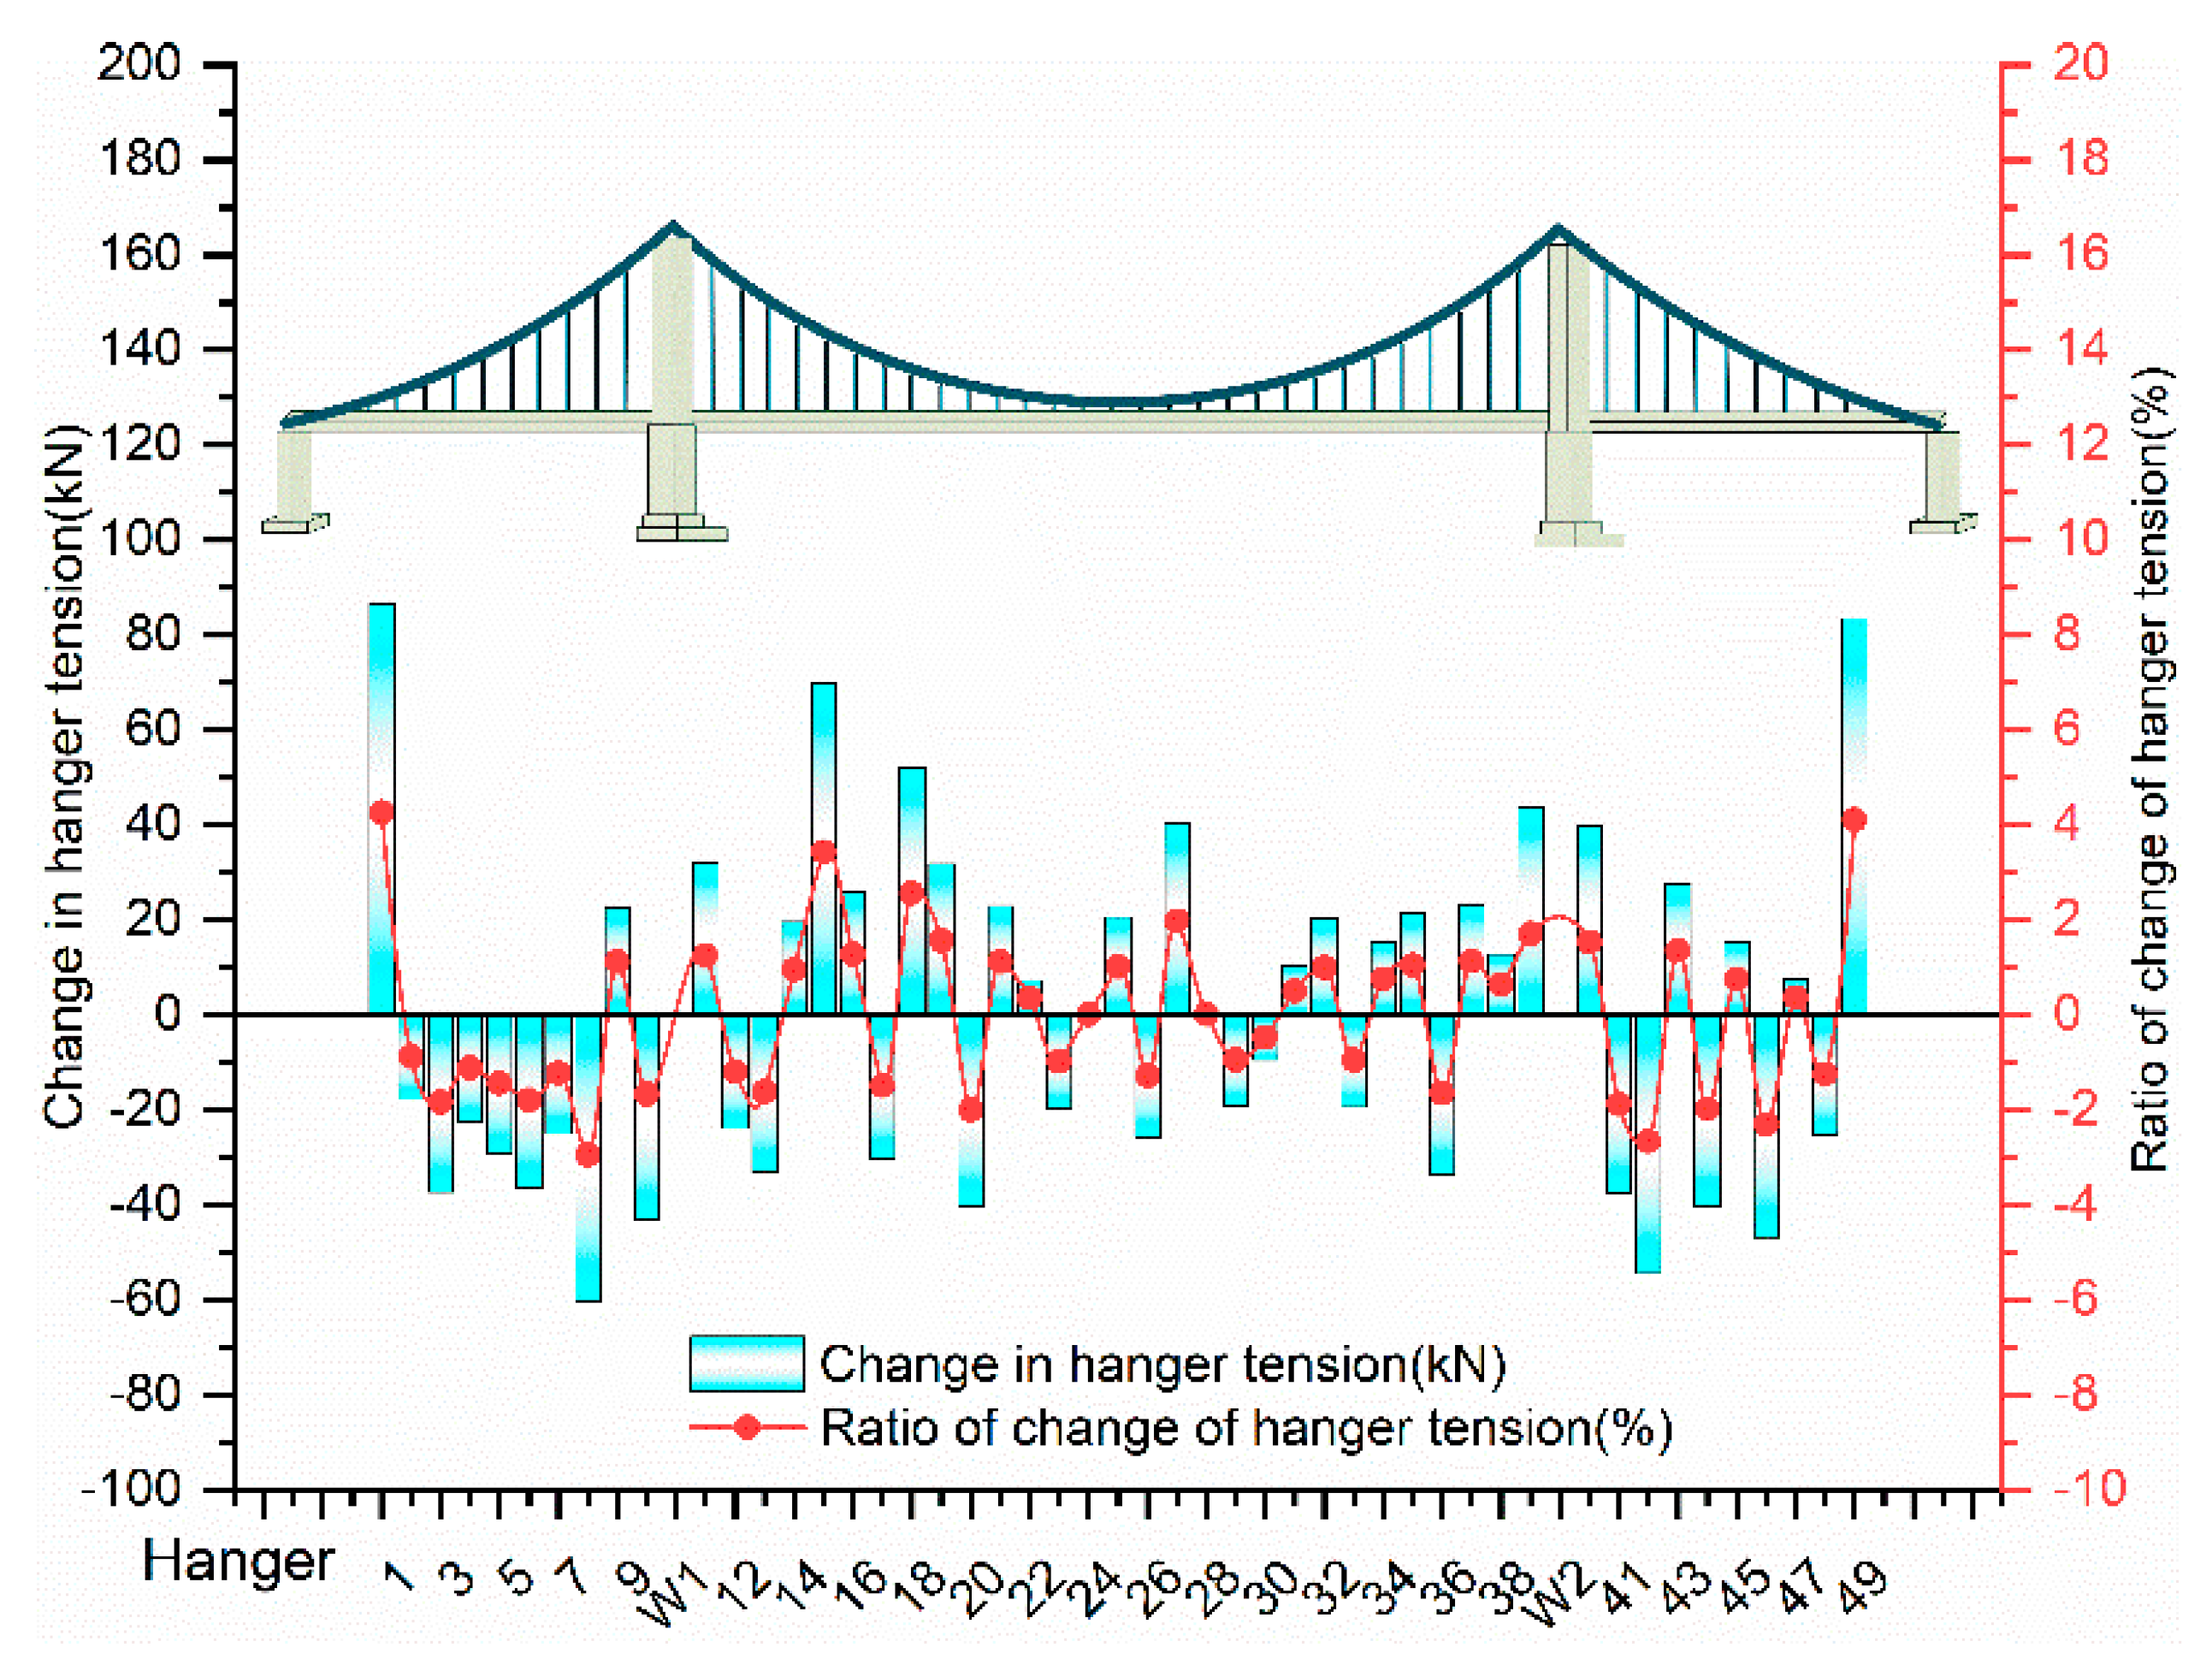
As shown in Figure 8, the difference between the cable force provided by the finite element model and the measured cable force of the bridge in 2011 is within the range of 60.3 to 86.5 kN, with the difference being <5%. The maximum rate of change on both sides of the hanger is 4.26%. This is because the length of the hanger on both sides is relatively short. In the actual test, the error of the cable force value calculated by the frequency method will be relatively high; nevertheless, the test result and overall trend in the model are in line with those observed in 2011 when the bridge was completed. Therefore, from the above comparison, it can be seen that the proposed model yields the same force state as that of the bridge in 2011. The model can be used to simulate the single point slip of the suspension bridge for a detailed analysis and calculation owing to the reliable accuracy.
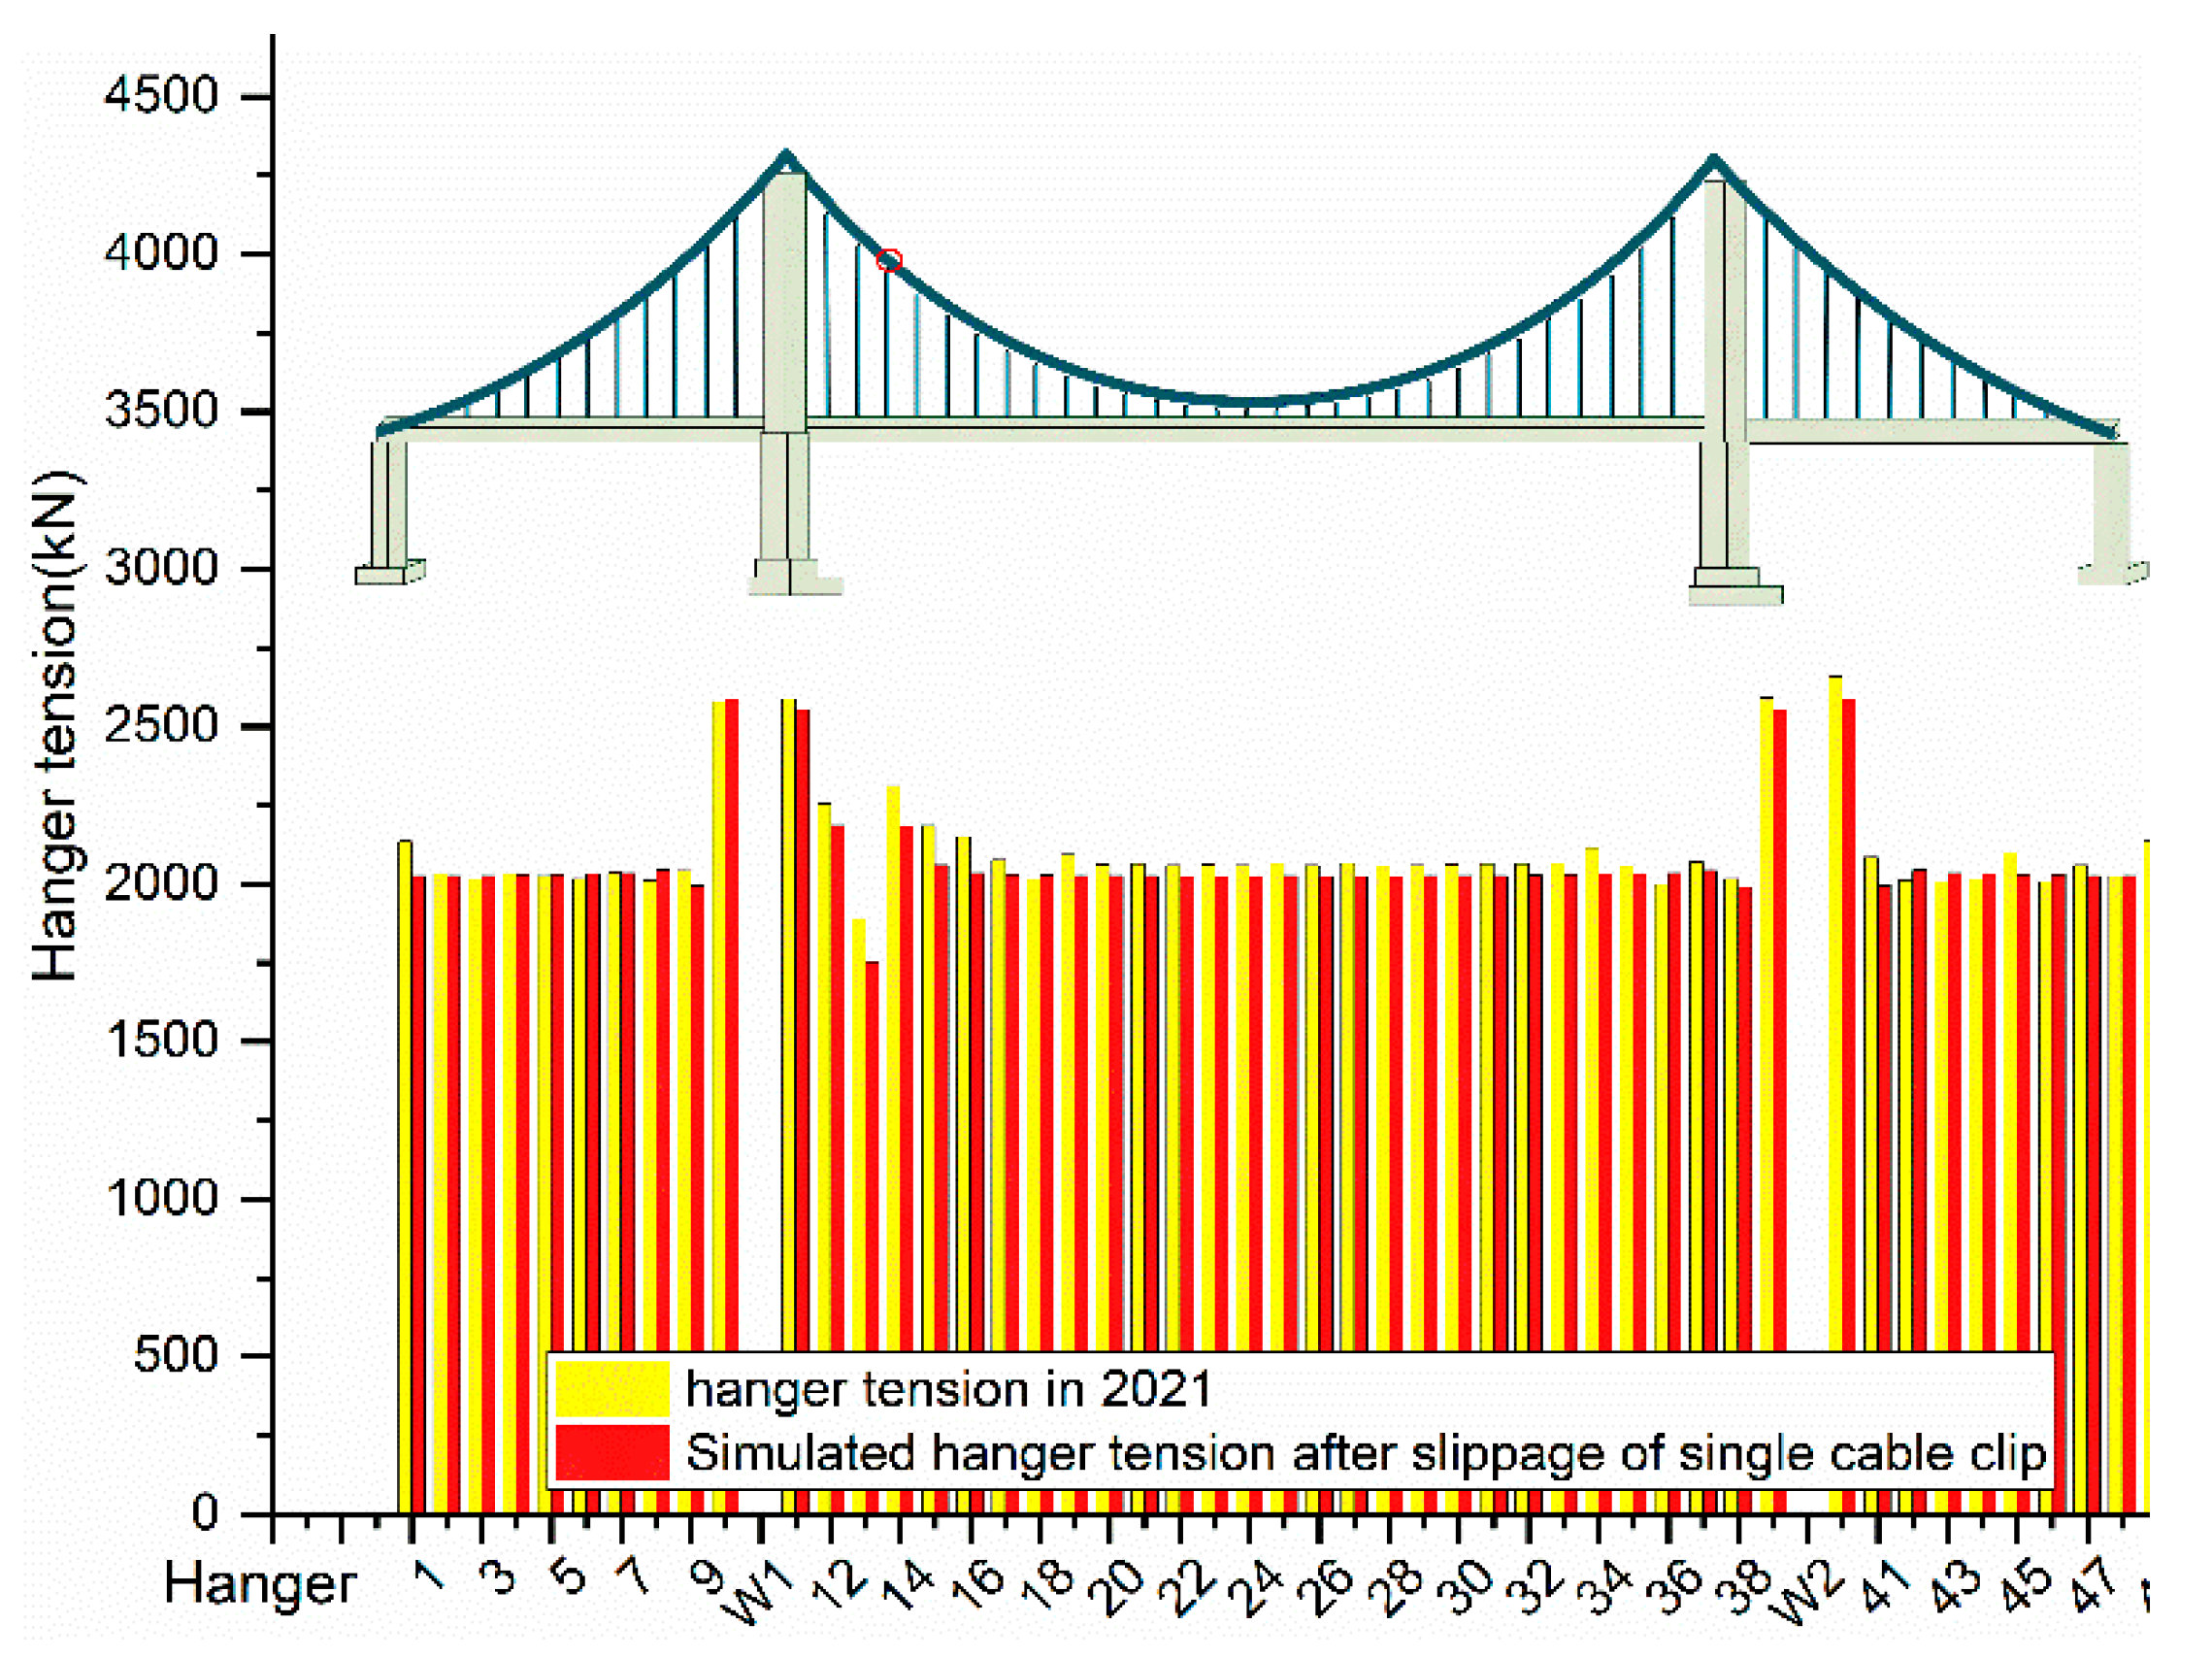
To further verify the accuracy of the clamp slipping model simulation, the hanger cable force after clamp slippage in the model is compared with the measured cable force of the suspension bridge. As shown in Figure 9, the trend in the simulated hanger tension after single-clamp slippage and the measured cable force is the same. The greater difference in the individual cable force can be attributed to the reallocation of the hanger tension after repeated cable clamp slippage during actual measurement. Nevertheless, the simulated hanger tension after the most severe clamp slippage coincides with the trend in the measured data. Hence, the simulation of the single-clamp slippage by the finite element model is accurate.
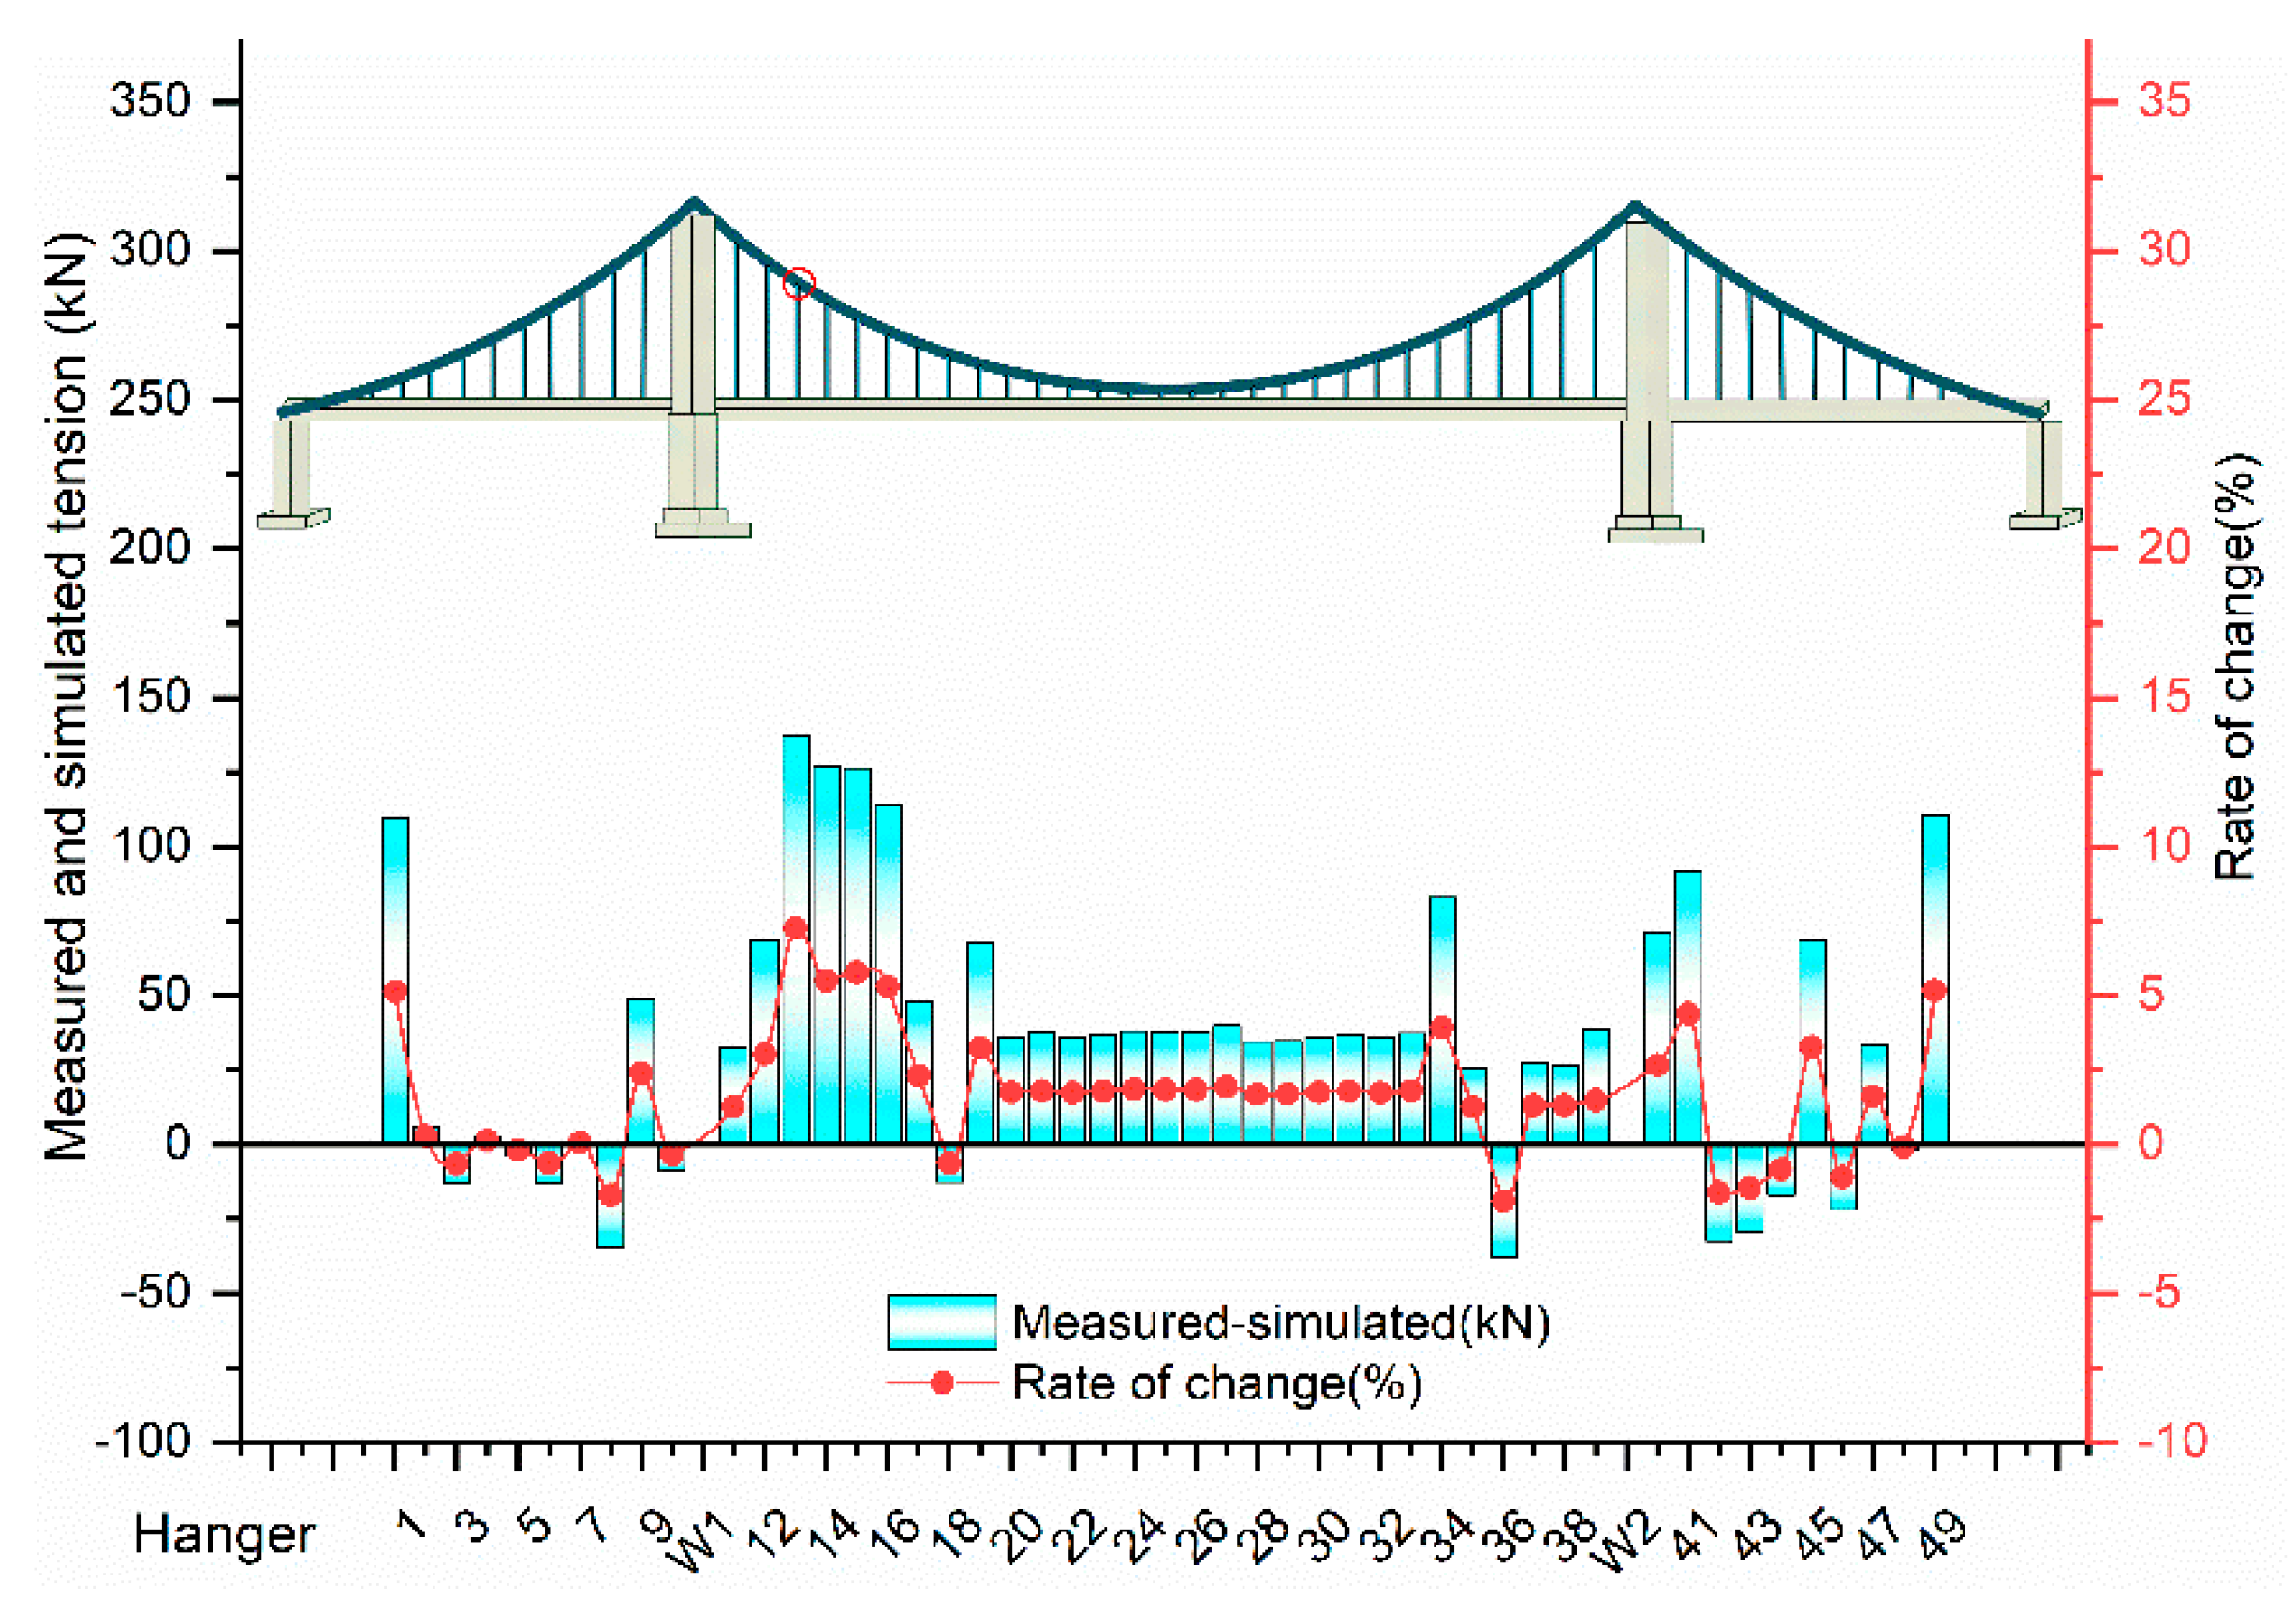
As shown in Figure 10, the overall cable force after the measured slip in 2021 is greater than the finite element model simulation result. The overall difference between the measured cable force and the simulated cable force is <10%, where the maximum difference in the measured and simulated cable forces after clamp slippage is 137.1 kN, and the simulated cable force is 7.26% lower than the measured cable force. The above comparison shows that the proposed finite element model yields the same result as the force state measured in 2021, indicating that the accuracy of the proposed suspension bridge model is reliable and can be used for further analysis and calculation.
4. Results of Finite Element Calculation
In the analysis to clearly illustrate the impact of cable clamp slippage on the overall structure of the self-anchored suspension bridge, this study conducted a single-point slip analysis to simulate and analyze the impact on the structure. The most serious clamp slipping location on this bridge is selected for the slippage simulation of the single cable clamp.
4.1. Hanger Cable Force before and after Cable Clamp Slippage
In the study of cable clamp slippage, it is found that the most direct result of slippage is the change in the magnitude of the cable force. As shown in Figure 11, the cable force before and after the slip of a single cable clamp is simulated using the finite element model, and it is found that the slippage decreases the cable force of this hanger, while the cable force of the two adjacent hangers relatively increases.
In combination with the cable force of the entire bridge hanger, the single-cable clamp slippage affects about two hanger positions at the front and rear, and the cable force of the hanger at the farthest distance is <1%. From the overall position, because of the stiffness of the main tower, the slippage in the middle span affects the cable force of the side span hanger by less than 1%.
Figure 12 focuses on the impact of single-cable clamp slippage on the cable force of adjacent hangers on the same side. As observed, the cable force at the slipping position is reduced by 392.6 kN, the hanger cable force drops by 19.2% compared with that before the slip, and the cable force of the four hangers before and after the slip is increased by 62.8, 123.3, 147.7, and 26.2 kN. Compared with pre-slip, the cable force growth rates are 2.45%, 6.19%, 7.25%, and 1.29%. The impact of the remaining hanger cable force is <1%. The single-clamp slippage affects other hanger cable forces. The impact is only in the range of the two hangers before and after.
4.2. Force Acting on the Main Girder before and after Cable Clamp Slippage
The suspension bridge is a flexible structure, wherein the stiffening girder mainly provides the torsional stiffness and load acting surface and transmits the load to the hanger. The hanger connects the main cable and the stiffening girder and distributes the load from the stiffening girder to the main cable. Therefore, the change in the hanger tension directly affects the force state of the main girder, and the effect of single-clamp slippage on the main girder is discussed here.
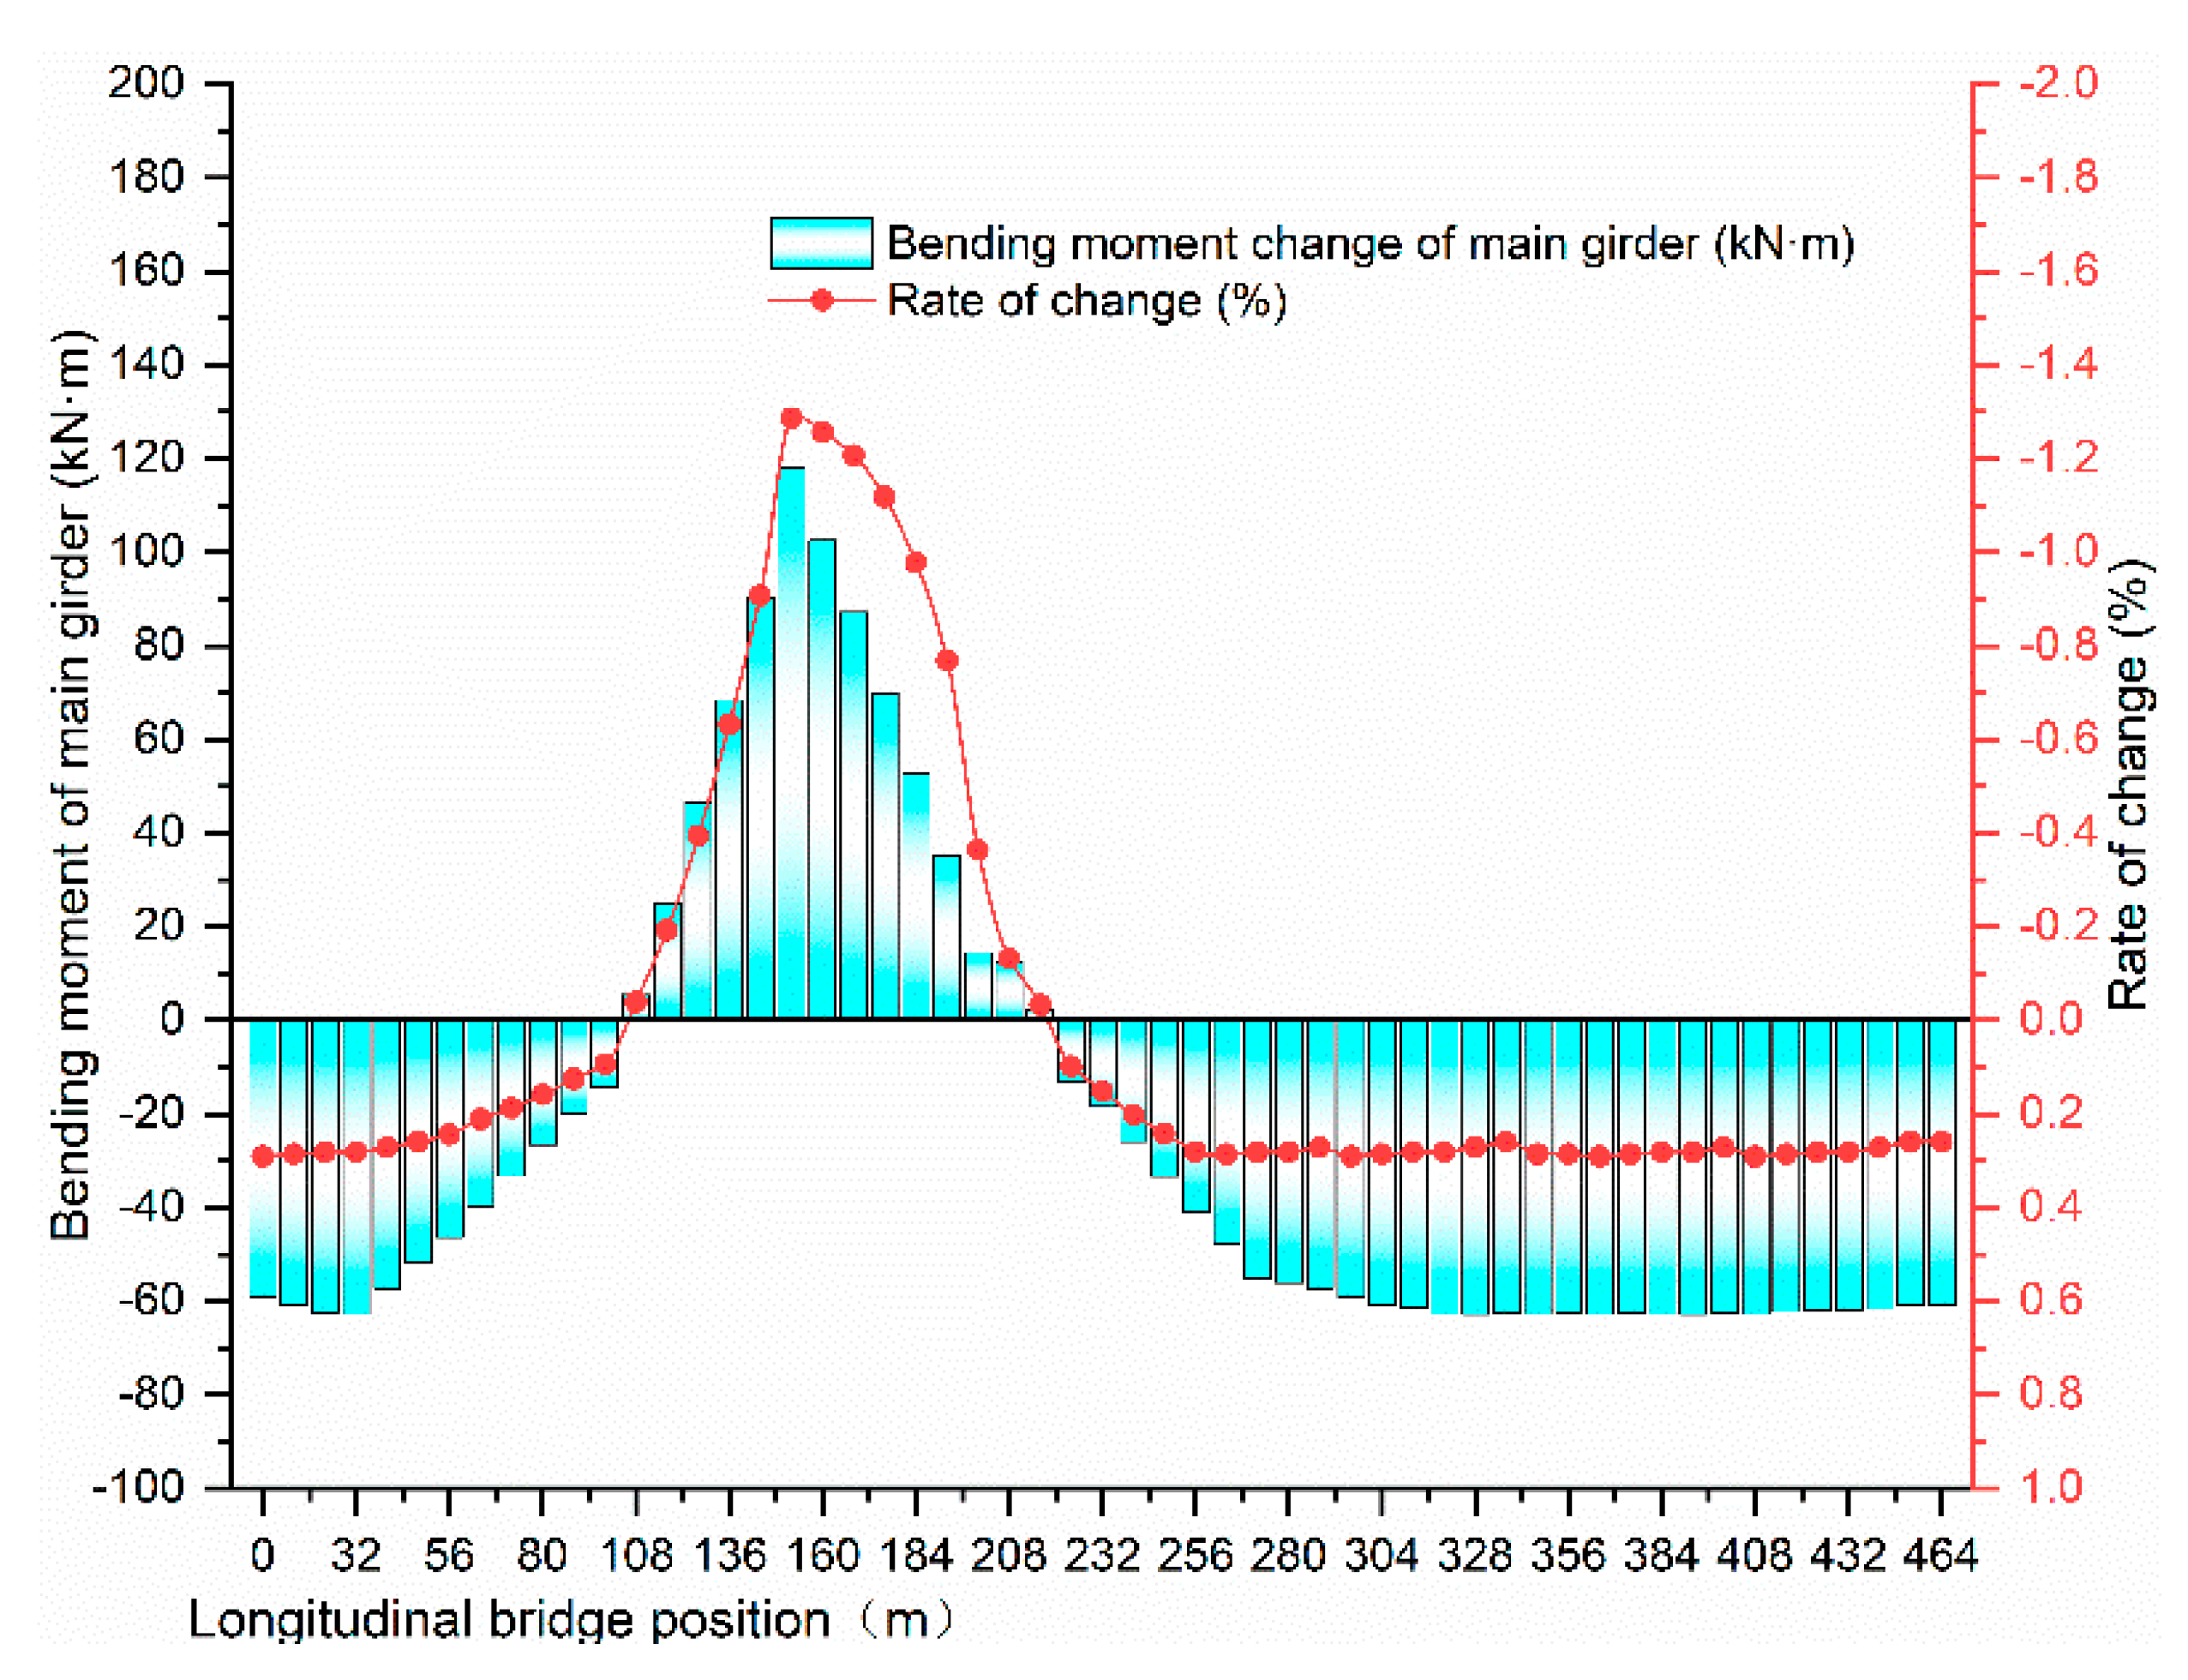
As shown in Figure 13, the maximum variation in the bending moment at the single-clamp slipping position is 118 kN, and the variation rate is 1.28%. This figure also shows that the magnitude of the effect decreases with the increase in the slipping cable clamp position distance, and the effect of mid-span slippage on the side-span main girder bending moment is <1%.
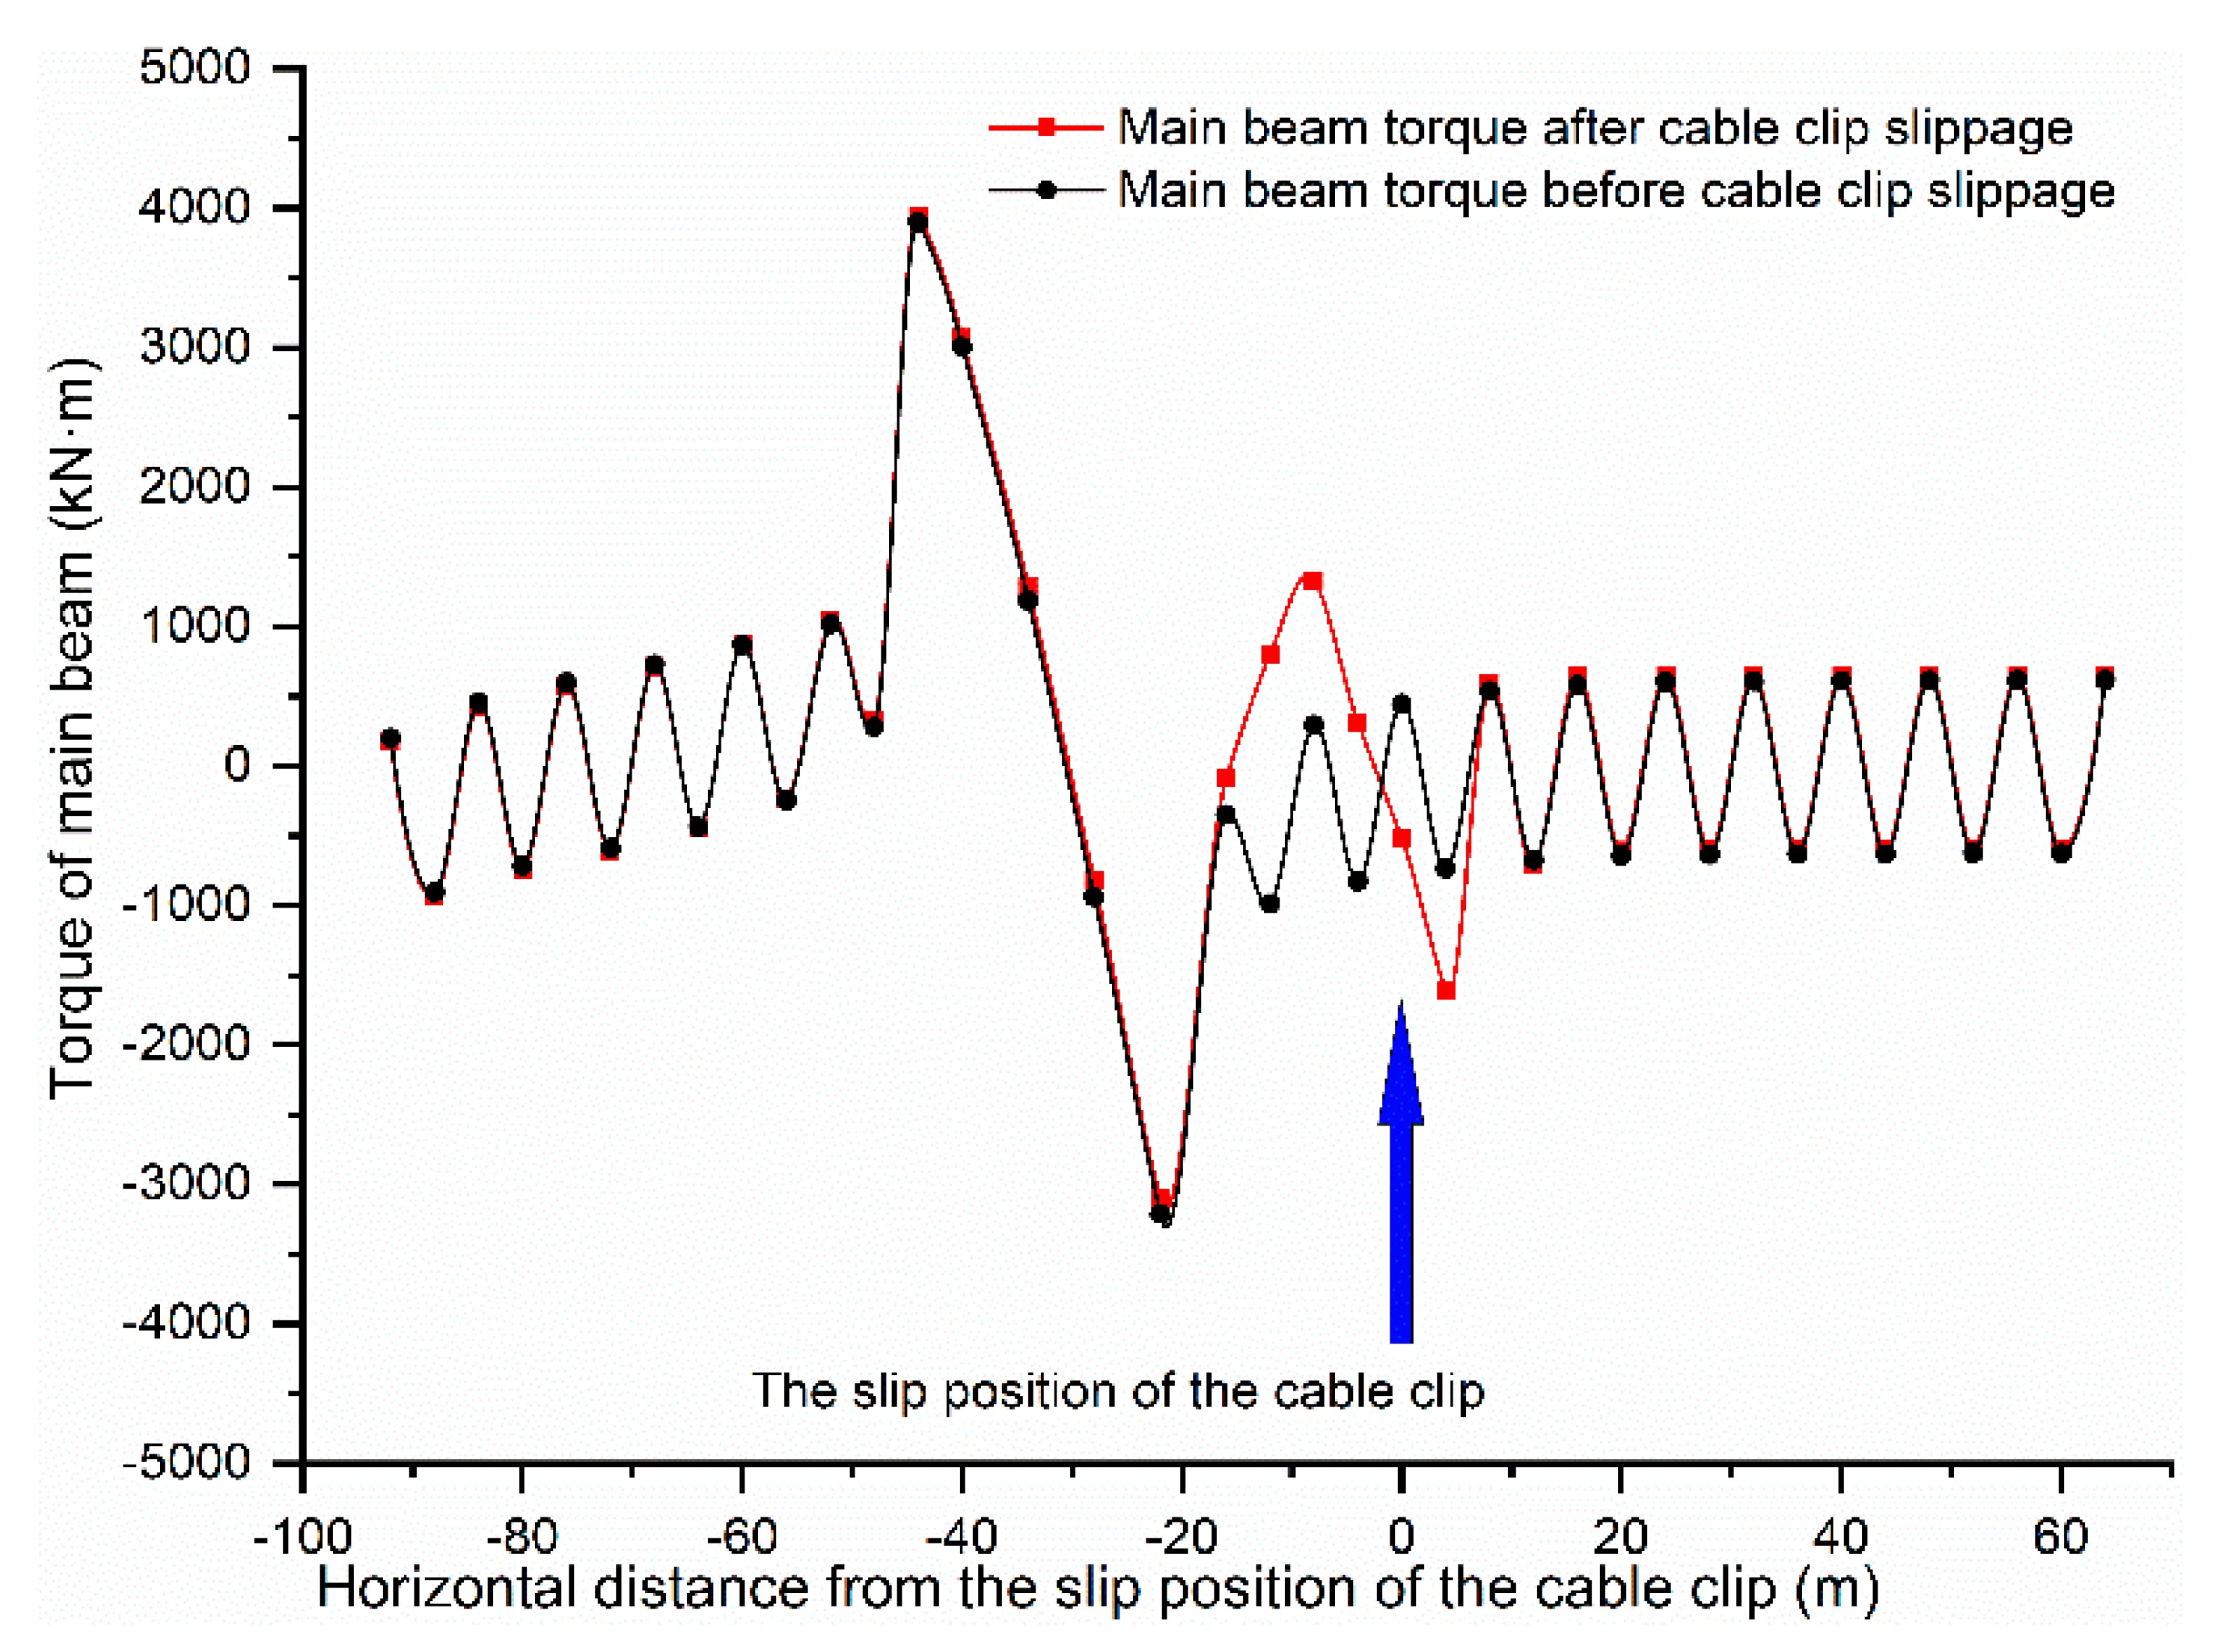
After cable clamp slippage, because of the change in the cable force of the horizontal symmetric hanger, the force of the main girder is no longer on the same horizontal plane. As a result, the change in the cable force causes a local torsion effect on the stiffened girder. To clearly analyze the influence range of the torque change in the main girder, the main girder at the cable clamp slipping position is taken as the 0 point, and the distance is used to represent the influence range. The change in the internal force of the main girder after slipping was carefully studied, and it was found that the influence of the slippage in the middle span was only within the middle span, and the influence on the side span was low.
From Figure 14, the biggest change in the torque of the main girder after the single cable clamp slips is the main girder between the W1 tower and W2 tower, while the main girder torque change of the side span is smaller. From a local analysis, the slippage of the cable clamp only has an impact on the torque near the hanger, and the range of the four hangers is approximately its range of influence. Through distance analysis, the influence range of the single cable clamp on the main girder torque after slipping is 24 m in total. Among them, the slip of the single cable clamp has a greater impact on the torque of the main beam close to the W1 main tower, with an impact range of 16 m, and an impact range of 8 m in the mid-span direction.
As shown in Figure 15, cable clamp slippage has a significant impact on the local torque of the main girder. The torque after slippage is 3.5 times that before slippage, and the maximum torque change after slippage is 1785 kN. In terms of the long-term torque effect, this is unfavorable to the main girder in terms of the force.
4.3. Forces Acting on the Main Cable before and after Cable Clamp Slippage
The main cable is the main load-bearing member of the structural system and is a geometrically varying body, mainly subjected to tension. The main cable has a high initial tensile force under constant loading, providing “geometric stiffness” for the subsequent structure, not only through its own elastic deformation, but also through the geometry to affect the system equilibrium. Hence, cable clamp slippage will have a corresponding effect on the tensile force.
As shown in Figure 16, the maximum effect of single-clamp slippage on the main cable force is at the slippage location, while the maximum main girder force is 527.6 kN, a change of 1.21% before and after slippage. The maximum change is 1.21%. The remaining positions of the main cable force change is <1%, and the middle-span clamp slippage has a certain effect on it. The main tower stiffness is higher on the mid-span side of the main cable, and the force change on the side span side of the main cable tension is <1%.
4.4. Forces in the Main Tower before and after Cable Clamp Slippage
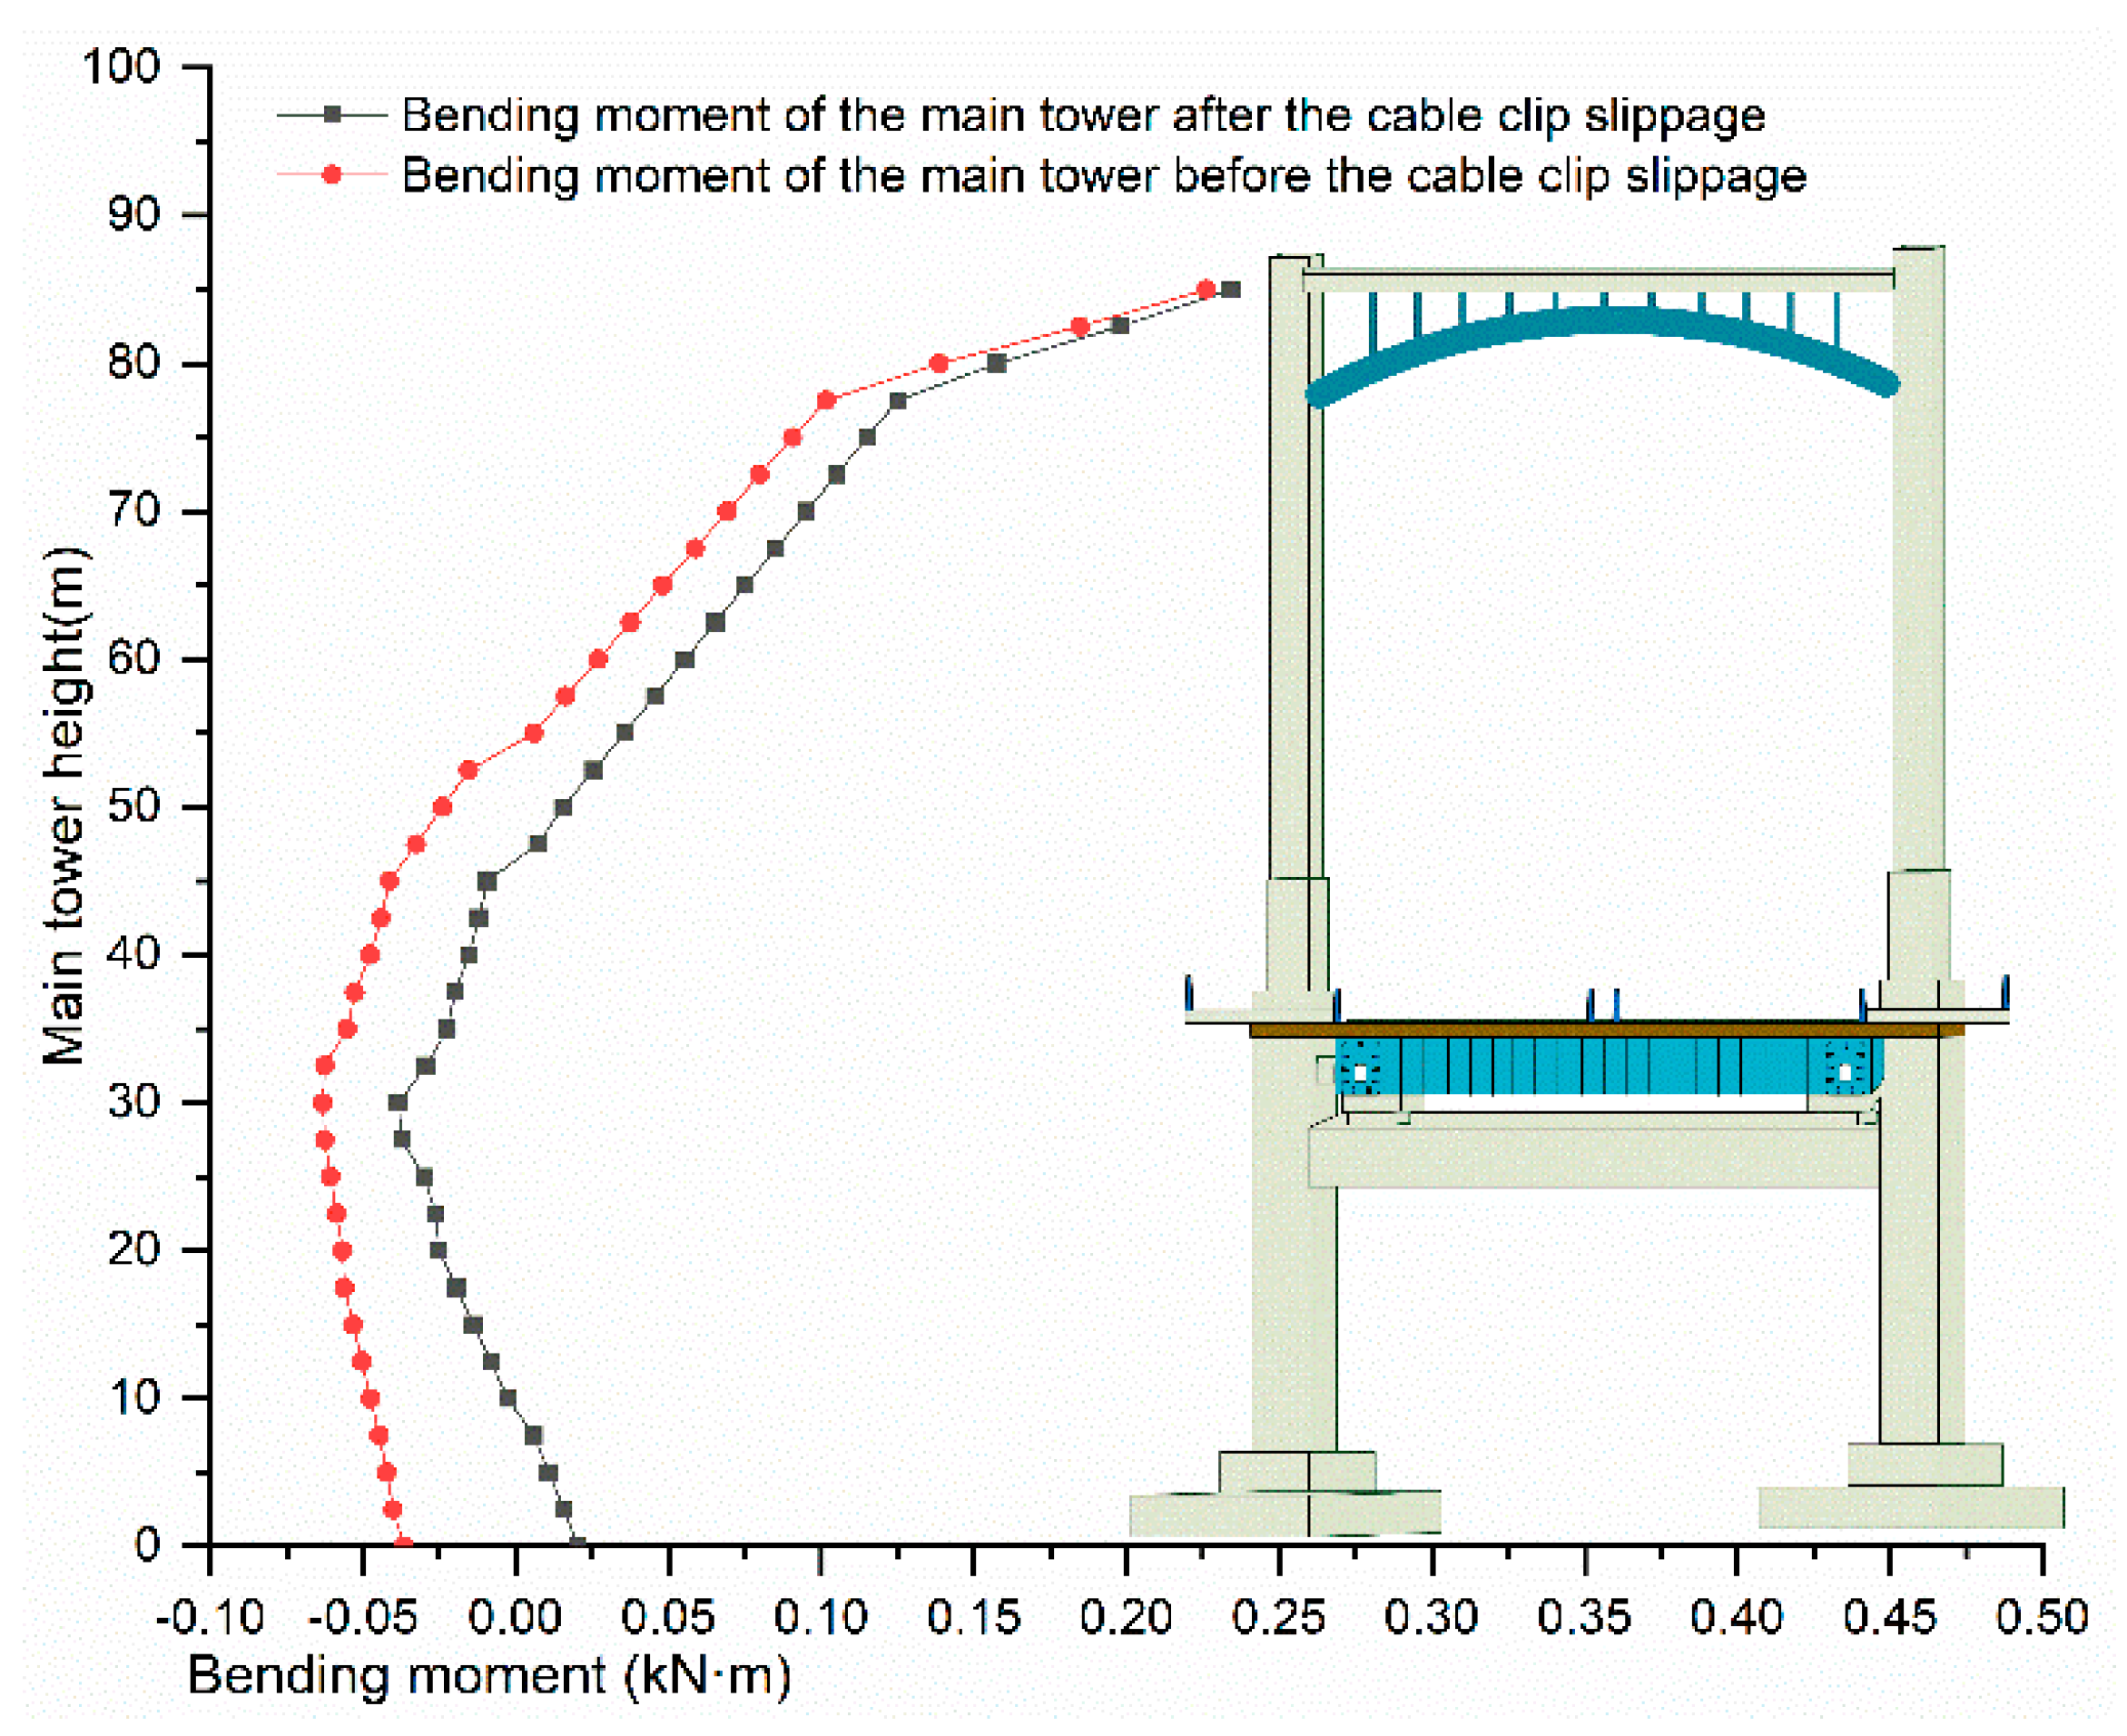
In a suspension bridge, the main tower is a compression-bending member. In the vertical direction, the main tower bears the vertical force of the main cable mainly through the constant load. In the longitudinal direction, the horizontal force of the main cable is balanced on both sides of the tower by the effect of the constant load, and no bending moment is generated on the tower. After cable clamp slippage, the unbalanced state of the load causes an unbalanced tension on both sides of the main tower, resulting in a horizontal displacement of the tower top. The single-clamp slippage at the mid span causes the main tower to produce a longitudinal top displacement of 0.242 mm.
After the horizontal displacement of the top of the tower, the horizontal force of the main cable on both sides of the main tower is rebalanced, the main tower is subjected to an unbalanced main cable tension, and the bending moment is changed. As shown in Figure 17, the trend in the main tower bending moment after slippage is consistent with that before slippage. Due to the single-clamp slippage, the maximum change value of the main tower is 0.0558 kN·m.
4.5. Suggestions for Handling Cable Clamp Slippage
A force analysis of self-anchored suspension bridges after single-clamp slippage revealed that cable clamp slippage, which typically brings about a minor change, directly affects the force of each main component. Practically, cable clamp slippage is not a fixed state, but a state that continues to deteriorate with the operational phase of the bridge. As more clamps slip, the slipping distance gradually increases, and the structural forces of the bridge tend to develop unfavorably. If this problem is ignored, the safety of the bridge will be compromised. Therefore, if slipping of cable clamps in suspension bridges is detected during structural inspection, a detailed investigation should be conducted immediately, and for cable clamps with slippage <5 mm, measures, such as re-torqueing of the bolts, should be taken to restore the slip resistance of the clamps to prevent further slippage. For cable clamps with a slippage >5 mm, immediate restoration and adjustment should be performed to ensure structural safety [20].
5. Conclusions
This study conducted an analysis of cable clamp slippage, a common phenomenon in actual bridges. To clarify the force acting on a self-anchored suspension bridge before and after cable clamp slippage, the slipping of a single clamp was used for the analysis. We focused on the forces acting on the hangers, main girder, main cable, and main tower before and after cable clamp slippage in the studied bridge. The main research results are as follows:
- (1)
- Simulations of the hanger cable force after single-clamp slippage revealed that the slippage directly affects the hanger cable force, and its influence range is at the two hanger positions before and after the change. After slippage, the corresponding hanger cable force was reduced by 19.2%, while the cable force of the adjacent hanger increased sharply (up to 7.25%).
- (2)
- The bending moment and torque of the main girder before and after single-clamp slippage revealed that the change in the bending moment of the main girder was up to 1.28%. Meanwhile, the local forces on the main girder induced by single-clamp slippage led to a torsion effect. As a result, the torque increased by 250%.
- (3)
- An analysis of the tension in the main cable before and after single-clamp slippage revealed a re-distribution of the main cable tension after the slippage. Specifically, the change in the main cable tension at the single-clamp slippage position was 1.21%, while the changes at the remaining positions were <1%.
- (4)
- After single cable clamp slippage, the top of the main tower exhibited a longitudinal displacement of 0.242 mm. Because of the greater rigidity of the main tower, the single-clamp slippage had a small effect on the bending moment of the main tower (up to 0.0558 kN).
In the study of cable clamp slips, it was found that the most direct effect after the cable clamp slips is the change in the force of the hanger. From the perspective of the whole bridge, the slip of the cable clamp will directly lead to the imbalance of the force on the main girder, and this problem will cause the main girder to be subjected to torsion for a long time. Changes caused by the slippage of the cable clamp are often not conducive to the safe use of the bridge. Future research will continue to focus on this area, focusing on the slippage of the cable clamp and the limit of the slippage of the cable clamp. These studies are of great importance to the safety performance of the bridge.
Author Contributions
Conceptualization, H.L. and Y.L.; methodology, Y.L.; software, C.L.; experiment, Y.L. and H.H.; data curation, Y.L.; writing—original draft preparation, Y.L.; writing—review and editing, H.L. and Q.S. All authors have read and agreed to the published version of the manuscript.
Funding
The research in this paper was supported by the Science and Technology Project of the Department of Transportation of Heilongjiang Province (2021HLJ01K42) and the Science and Technology Project of the Department of Transportation of Heilongjiang Province (2020HLJ018).
Institutional Review Board Statement
Not applicable.
Informed Consent Statement
Not applicable.
Data Availability Statement
The data that support the findings of this study are available upon reasonable request.
Conflicts of Interest
The authors declare that they have no conflict of interest.
References
- Xu, G. Design of Large-Span Railway Suspension Bridges; Shanghai Science and Technology Press: Shanghai, China, 2020. [Google Scholar]
- Bridge Research Office, Japan Institute of Territorial Technology Policy. Damage Cases of Road and Bridge with Tension Materials and Matters Needing Attention; Japan National Land Technology Policy Research Institute: Tokyo, Japan, 2018.
- National Academies of Sciences, Engineering, and Medicine. Guidelines for Inspection and Strength Evaluation of Suspension Bridge Parallel Wire Cables; The National Academies Press: Washington, DC, USA, 2004. [Google Scholar] [CrossRef]
- Institute of Highway Research, Ministry of Transport. Standards for Technical Condition Evaluation of Highway Bridges; JTG/T H21-2011; Ministry of Transport of the People’s Republic of China, Transportation Department: Beijing, China, 2011.
- Ji, L.; Li, H. Laidao Bridge Hanger and Clamp Design. Road Traffic Technol. 2000, 2, 22–26. [Google Scholar] [CrossRef]
- Ren, H.; Zhao, L.; Bai, F. Sliding resistance test and stress test analysis of main cable clamp of suspension bridge. North Traffic 2009, 3, 74–76. [Google Scholar] [CrossRef]
- Huang, H.; Zhang, J.; Liu, A.; Mei, L.; Li, Y. Experimental study on lateral displacement of main cable and lateral deflection angle of cable clamp of self-anchored suspension bridge with space cable plane. Highw. Eng. 2009, 34, 41–44. [Google Scholar] [CrossRef]
- Li, Z.; Jiang, J. Analysis and Research on Upper and Lower Clamp Structures of Suspension Bridges. Bridge Constr. 2013, 43, 60–65. [Google Scholar]
- Ruan, K. Research on spatial stress analysis of cable clamp of suspension bridge. Highw. Automob. Transp. 2014, 2, 170–173. [Google Scholar] [CrossRef]
- Ma, W.; Liu, S.; Wang, C.; Bao, Z.; Geng, J. Experimental study on void ratio of main cable and anti-slip of cable clamp of Liujiaxia Bridge. World Bridge 2014, 5, 59–62. [Google Scholar] [CrossRef]
- Zhang, Z.; Wang, S.; Ding, Y.; Qiang, S. Anti-slip Performance of Interface between Carbon Fiber-Reinforced Plastic Main Cable and Cable Clamp for Large-Span Suspension Bridges. J. Southwest Jiaotong Univ. 2014, 2, 208–212. [Google Scholar] [CrossRef]
- Li, Y. CFRP cable suspension bridge clamp design calculation method. China J. Highw. 2015, 28, 67–75. [Google Scholar]
- Zhou, Z.; Yuan, Q.; Zhou, C.; Shu, S. Experimental study on skid resistance of zinc-aluminum alloy coated steel wire main cable clamp of suspension bridge. World Bridge 2015, 5, 40–43. [Google Scholar] [CrossRef]
- Sun, Y.; Zhang, L.; Li, Z. Analysis of the influence of cable clamp on the finished state of self-anchored suspension bridge. J. Tongji Univ. (Nat. Sci. Ed.) 2016, 44, 24–28. [Google Scholar] [CrossRef]
- Shen, R.; He, K.; Miao, R. Limit anti-skid friction analysis of pinned cable clips based on multi-scale models. Bridge Constr. 2018, 48, 20–24. [Google Scholar] [CrossRef]
- Shen, R.; He, K.; Huang, Z. Analysis model of nonlinear relationship between main cable steel wires at cable clamp of suspension bridge. J. Archit. Sci. Eng. 2018, 35, 111–119. [Google Scholar] [CrossRef]
- Ruan, Y.; Luo, B.; Ding, M.; Huang, L.; Guo, Z. Theoretical and Experimental Study on the Anti-sliding Performance of Casting Steel Cable Clamps. Adv. Civ. Eng. 2019, 2019, 1–18. [Google Scholar] [CrossRef]
- Miao, R.; Shen, R.; Wang, L.; Bai, L. Theoretical and numerical studies of the slip resistance of main cable clamp composed of an upper and a lower part. Adv. Struct. Eng. 2020, 136943322096527. [Google Scholar] [CrossRef]
- Xiang, H. Theory of Higher Bridge Structure; China Communications Press: Beijing, China, 2007. [Google Scholar]
- Yuan, A.; Yang, T.; Xia, Y.; Qian, L.; Dong, L.; Jin, X. Replacement Technology of Long Suspenders of Runyang Suspension Bridge. China J. Highw. Transp. 2021, 34, 289–297. [Google Scholar] [CrossRef]
Figure 1.
Different types of cable clips: (a) abridged general view of a riding straddle cable clip; (b) abridged general view of a pin-type cable clamp.
Figure 1.
Different types of cable clips: (a) abridged general view of a riding straddle cable clip; (b) abridged general view of a pin-type cable clamp.

Figure 2.
Actual images of a cable clip after slipping.

Figure 3.
Overview of a self-anchored suspension bridge (m): (a) standard cross section at the hanger; (b) standard cross section without sling; (c) standard cross section of the main tower; (d) photo of a self-anchored suspension bridge.
Figure 3.
Overview of a self-anchored suspension bridge (m): (a) standard cross section at the hanger; (b) standard cross section without sling; (c) standard cross section of the main tower; (d) photo of a self-anchored suspension bridge.

Figure 4.
Image and schematic of a cable clamp after slipping.

Figure 5.
Positions of the cable clamps after slipping.

Figure 6.
Integral finite element model of a bridge.

Figure 7.
Verification of measured and simulated cable forces.

Figure 8.
Variations in the measured and simulated values of the hanger tensions.

Figure 9.
Cable forces after simulated slip of a single cable clip and measured hanger tension in 2021.
Figure 9.
Cable forces after simulated slip of a single cable clip and measured hanger tension in 2021.

Figure 10.
Variations in the simulated and measured hanger tensions after the simulated slip of a single cable clamp in 2021.
Figure 10.
Variations in the simulated and measured hanger tensions after the simulated slip of a single cable clamp in 2021.

Figure 11.
Diagram of hanger tension before and after the slip of a simulated single cable clip.

Figure 12.
Variation in the hanger tension before and after cable clip slippage.

Figure 13.
Variation in the bending moment of the main girder.

Figure 14.
Torque of the main girder.

Figure 15.
Variations in the main girder torque before and after cable clamp slippage.

Figure 16.
Rate of change of main cable tension before and after cable clip slippage.

Figure 17.
Bending moment diagram of main tower before and after cable clip slippage.


Table 1.
Slippage of the cable clip.
| Sample | 1 | 2 | 3 | 4 | 5 | 6 | 7 | 8 | 9 | 10 |
|---|---|---|---|---|---|---|---|---|---|---|
| Slippage (cm) | 10.2 | 5.1 | 2.3 | 5.4 | 3.3 | 5.7 | 3.2 | 2.2 | 1.7 | 1.3 |
| Sample | 11 | 12 | 13 | 14 | 15 | 16 | 17 | 18 | 19 | 20 |
| Slippage (cm) | 2.4 | 2.6 | 2.1 | 1.8 | 1.2 | 3.3 | 2.4 | 6.7 | 3.1 | 2.5 |
Table 2.
Specifications of the main components.
| Structural Part | Material | Modulus of Elasticity (MPa) | Design Compressive Strength (MPa) | Design Tensile Strength (MPa) |
|---|---|---|---|---|
| Main cable | Galvanized high-strength steel wire | 2 × 10⁵ | — | 1670 |
| Hanger | Galvanized high-strength steel wire | 2 × 10¹⁵ | — | 1770 |
| Concrete main girder | C50 concrete | 3.45 × 10⁴ | 22.4 | 1.83 |
| Tower column and lower girder of bridge tower | ||||
| Bridge deck | C55 concrete | 3.55 × 10⁴ | 24.4 | 1.89 |
| Composite girder steel girder | Q370qE | 2 × 10⁵ | 22.4 | 335 |
Publisher’s Note: MDPI stays neutral with regard to jurisdictional claims in published maps and institutional affiliations. |
© 2021 by the authors. Licensee MDPI, Basel, Switzerland. This article is an open access article distributed under the terms and conditions of the Creative Commons Attribution (CC BY) license (https://creativecommons.org/licenses/by/4.0/).
Share and Cite
MDPI and ACS Style
Li, H.; Liu, Y.; Li, C.; Hu, H.; Sun, Q. Force Analysis of Self-Anchored Suspension Bridges after Cable Clamp Slippage. Symmetry 2021, 13, 1514. https://0-doi-org.brum.beds.ac.uk/10.3390/sym13081514
AMA Style
Li H, Liu Y, Li C, Hu H, Sun Q. Force Analysis of Self-Anchored Suspension Bridges after Cable Clamp Slippage. Symmetry. 2021; 13(8):1514. https://0-doi-org.brum.beds.ac.uk/10.3390/sym13081514
Chicago/Turabian StyleLi, Hongfeng, Yancheng Liu, Chunwei Li, Hao Hu, and Quansheng Sun. 2021. "Force Analysis of Self-Anchored Suspension Bridges after Cable Clamp Slippage" Symmetry 13, no. 8: 1514. https://0-doi-org.brum.beds.ac.uk/10.3390/sym13081514
Note that from the first issue of 2016, this journal uses article numbers instead of page numbers. See further details here.