Article

Optimal Battery Energy Storage System Based on VAR Control Strategies Using Particle Swarm Optimization for Power Distribution System

by
Prakasit Prabpal
1,
Yuttana Kongjeen
2 and
Krischonme Bhumkittipich
1,*
1
Department of Electrical Engineering, Faculty of Engineering, Rajamangala University of Technology Thanyaburi, Pathum Thani 12110, Thailand
2
Department of Electrical Engineering, Faculty of Engineering and Architecture, Rajamangala University of Technology Isan, Nakhonratchasima 30000, Thailand
*
Author to whom correspondence should be addressed.
Submission received: 27 June 2021 / Revised: 30 July 2021 / Accepted: 9 September 2021 / Published: 14 September 2021

Abstract

:
We designed a battery energy storage system (BESS) based on the symmetrical concept where the required control is by the symmetrical technique known as volt/var control. The integration of BESS into the conventional distribution has significantly impacted energy consumption over the past year. Load demand probability was used to investigate optimal sizing and location of BESS in an electrical power system. The open electric power distribution system simulator (OpenDSS) was interfaced with MATLAB m-file scripts and presented by using time series analysis with load demand. The optimal BESS solution was adapted by using a genetic algorithm (GA) optimization technique and particle swarm optimization (PSO). The simulation results showed that the BESS was directly connected to the power grid with GA and PSO, and it was observed that BESS sizing also varied for these two values of 1539 kW and 1000 kW, respectively. The merit of those values is the power figure of the system, which is necessary for installation. Therefore, optimal sizing and location of the BESS are helpful to reduce the impact from the load demand to the total system loss and levelling of the energy demand from the power system network. The integration of the BESS can be applied to improve grid stability and store surplus energy very well. The grid increased the stability of the power system and reduced the impact from the large scale of BESS penetration.

1. Introduction

The rapid development worldwide is increasingly affecting the demand for electric power, which is exacerbating the electricity crisis. The higher demand for electricity causes the consumption of energy generated by power plants to affect environmental pollution. Renewable energy (RE) technologies, such as solar energy and wind turbines, have been designed to solve pollution problems. The RE used in the power system has an impact on power system management. Power system stability depends on the factors of power, such as early distribution system transmission. Energy management uses the demand quantity of electricity or the daily load demand of customers [1]. Energy management technology (EMT) determines whether there is sufficient power, regardless of whether the power source is solar, wind, or hydropower [2]. EMT can reduce fuel consumption in power generation systems. The importance of RE regards the need to manage power consumption in the power grid at the optimal time. These factors affect the planning of electric consumption from RE, including energy storage for a continuous energy supply. Energy storage technology (EST) has been implemented to support the limitations of renewable energy sources and applied to reduce energy demand conditions.
EST can be divided by separating technology: mechanical, electrochemical, electrical, thermochemical, chemical, and thermal, as expressed in Figure 1. The energy storage (ES) consists of cost, power, energy rating and density, life and cycle time, response time, efficiency, and self-discharge losses [3,4].
The ES application in the power system is mainly used to adapt to reduce the grid’s impact (the overview of the ES application is found in references [6,7,8]). The frequency regulation used injects and absorbs power to provide the grid with a frequency preset limit. Capacity firming that smooths the power output of the energy storage system was adapted by solving power oscillation and eliminating the rapid voltage on the power grid. The ramp rate control was able to limit the power ramps of wind or solar plants for reliable interconnection to the grid. Load levelling was used in the storage system’s power during low-load periods. It delivers reductions during periods of peak demand [9] in high-load facilities. The transmission and distribution investment on the grid consider an increase in capacity with a large storage space close to the load discharge during peak periods of the system. Peak shaving was used to reduce high-power demand during peak periods. The available power supply that can quickly respond to instant losses in generation or transmission outages is called spinning reserve. The power factor and voltage support were provided by reactive power compensation to regulate the voltage to improve power quality.
Battery energy storage system (BESS) is used to manage energy from renewable sources and surplus energy from the grid. Generally, the BESS management is based on power needs during peak periods, and it is a key factor in achieving sustainable energy for the grid. The power system management method with battery energy storage for power demand reduces the power generation capacity at peak times [10]. Energy system analysis presents an exception to many design options. It is unsettled by chance in crucial parameters, such as energy load size and future fuel price for the production of electric power [11]. According to the distribution of electric production plans, there is a difference in each season. Such seasonal factors affect the energy reserve planning due to environmental factors. The energy demand control of a peak load current in the electrical power system is a factor effect. It must be designed for the BESS to provide an adequate electric current. The power system includes a power plant, energy storage system, and industrial load, as shown in Figure 2. Therefore, the required conditions for the BESS include frequency controller power, a quality controller charge controller, and demand load on a peak time, respectively [12,13,14,15].
The Renewable Energy Systems (RES) can be classified as an installed BESS in a grid connection. There are distributed renewable energy systems [16,17], microgrids [18,19], renewable energy systems [20,21], and renewable energy power plants [22], with more details found in the given references [23,24]. These four systems are determined on the basis of their control and operation regimes, which also allows one to solve the problem of identifying the sizing criteria. The advantage of a BESS size is the low cost under conditions of power being supplied to the grid. Hence, the optimal sizing of the battery is determined on the basis of different criteria defined in relation to energy systems of various categories. Among the auxiliary technologies, the storage capabilities enhance the renewable energy system by implementing the optimal connection point for the battery. Figure 3 explains the distributed renewable energy system for grid connection. The integrated BESS wind turbines and solar photovoltaic cells are applied to solve the energy control in the distributed renewable energy systems. The BESS, as part of using, helps to solve energy management in the grid. The importance of BESS technology in solving the problem of sizing and allocation in distributed renewable energy systems can be observed. There is a parameter condition on the power capacity, namely, energy capacity. The BESS is calculated for different levels of mean load by the load profile in the daily load supplied to the system. The BESS is designed for the scenario in which the peak load condition is not charging based on peak load, but it is charging during times of low electricity demand.
The modern distribution power system is considered a system in which the BESS is integrated into a distribution system to solve its size and allocation. The distribution system installation of the BESS was implemented at a random or non-optimum size and location. It can increase the capacity, cause stability issues due to system losses, and has a high cost. Thus, the significance of distribution operations can be observed. The optimal size and location are determined ahead of installing the BESS in the electrical power system. The optimization techniques for the BESS problem were presented by the simulated annealing (SA), the iterative algorithm (IA), the enumerative method (EA), the genetic algorithm (GA), and particle swarm optimization (PSO) [25,26].

2. Problem Formation

The main aims of this study were to solve the sizing and allocation of BESS placement via optimization to reduce power loss. The importance of the operating condition is represented by the benefit regarding the sizing and location of power grids. Consequently, the power supporting energy demand from each load type of the power grid with the optimal condition of the BESS should be managed and provided. The energy consumed by the power grid was defined in terms of each load supplied to the BESS energy support. In this proposed methodology, various sizes of the battery were assigned to a bus in order to identify the minimum power loss.

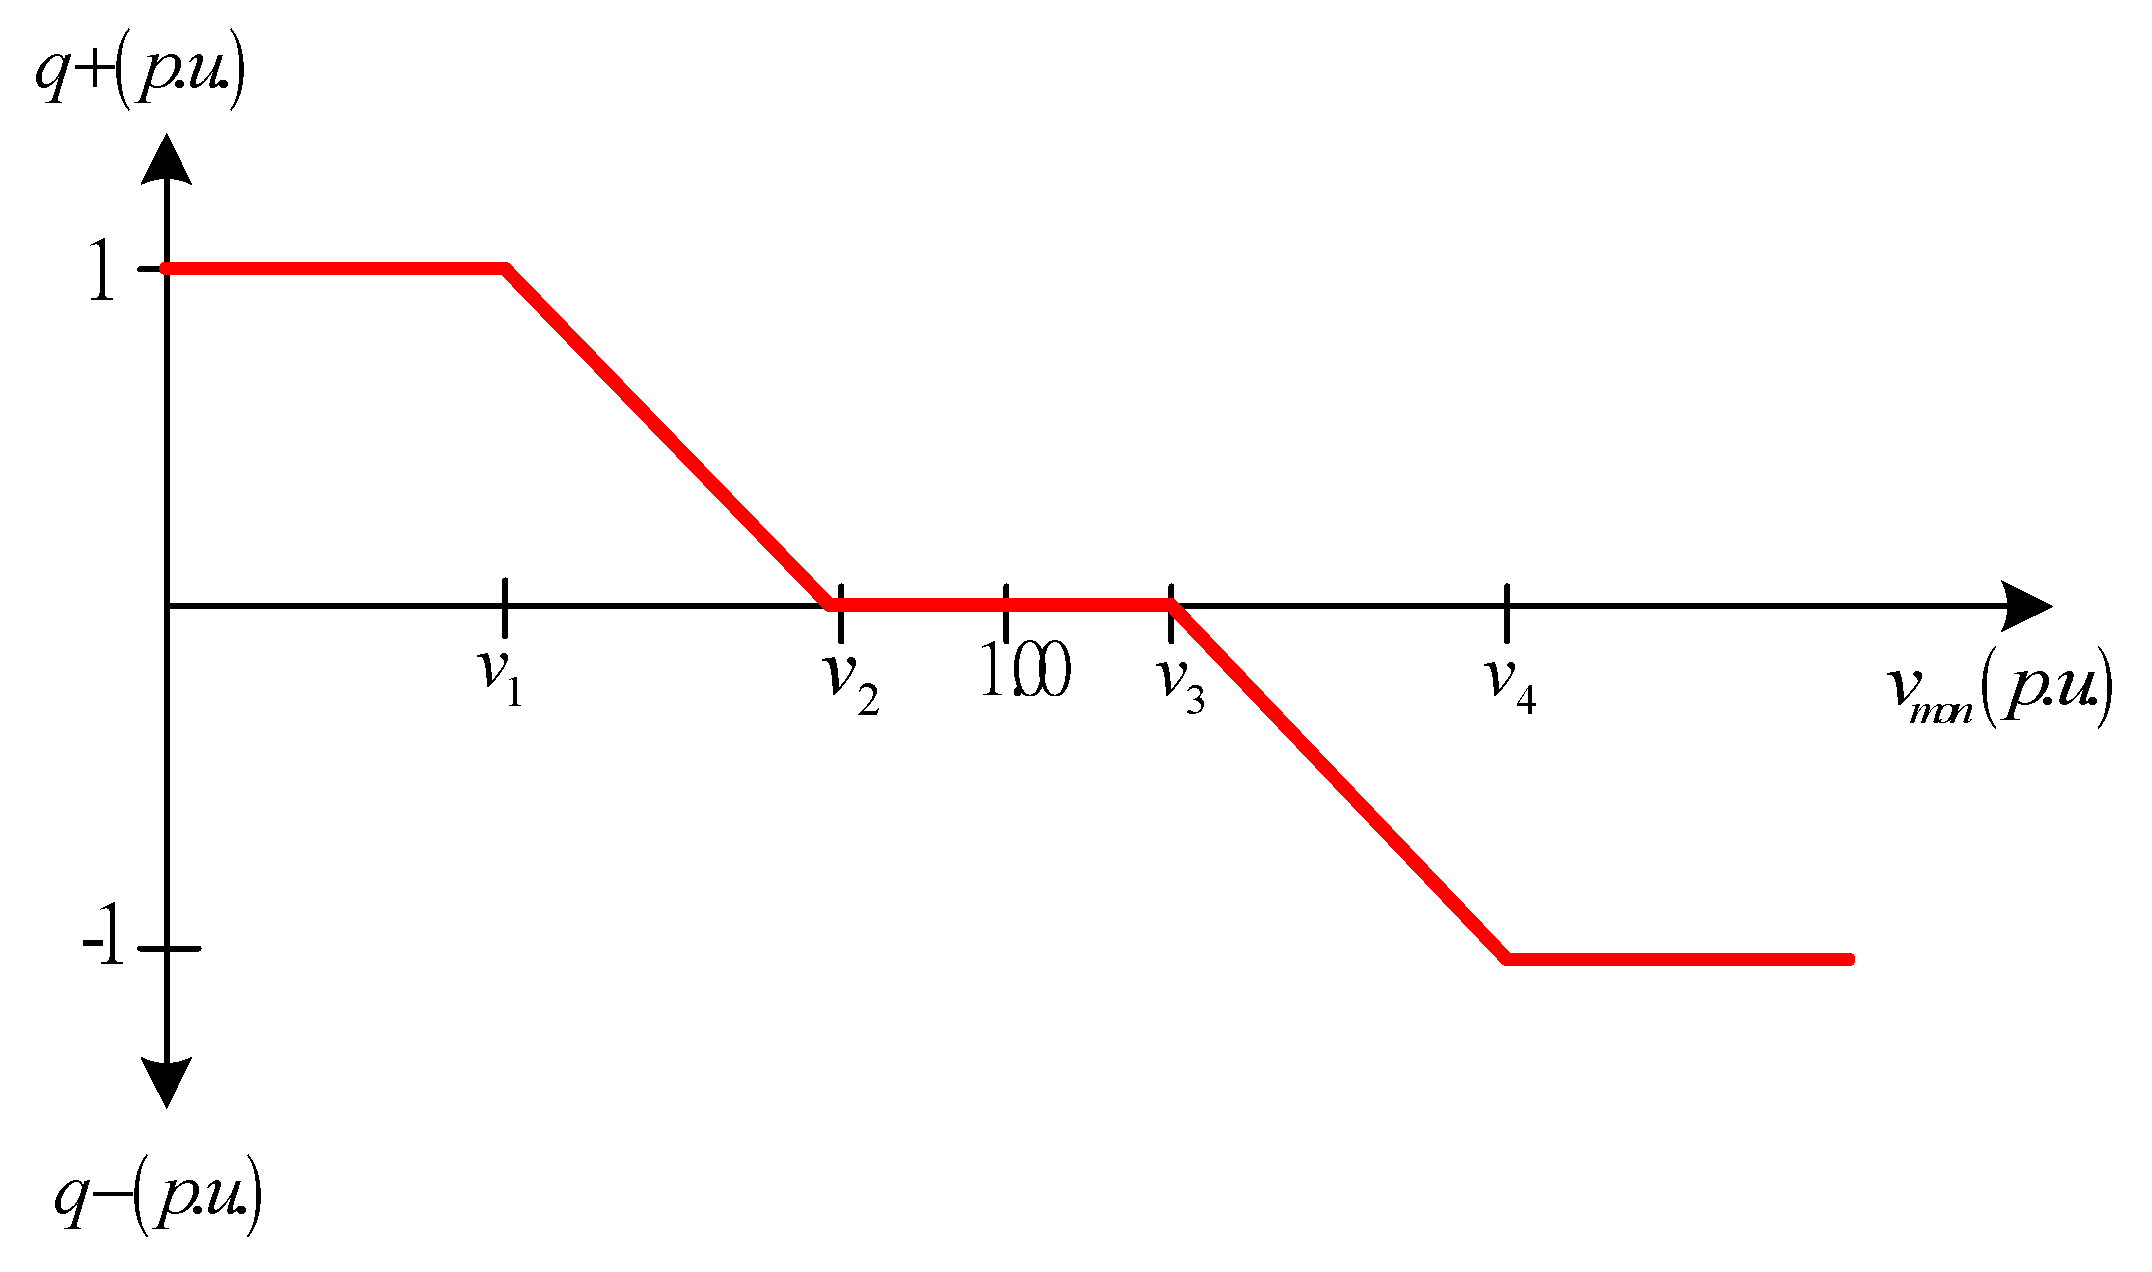
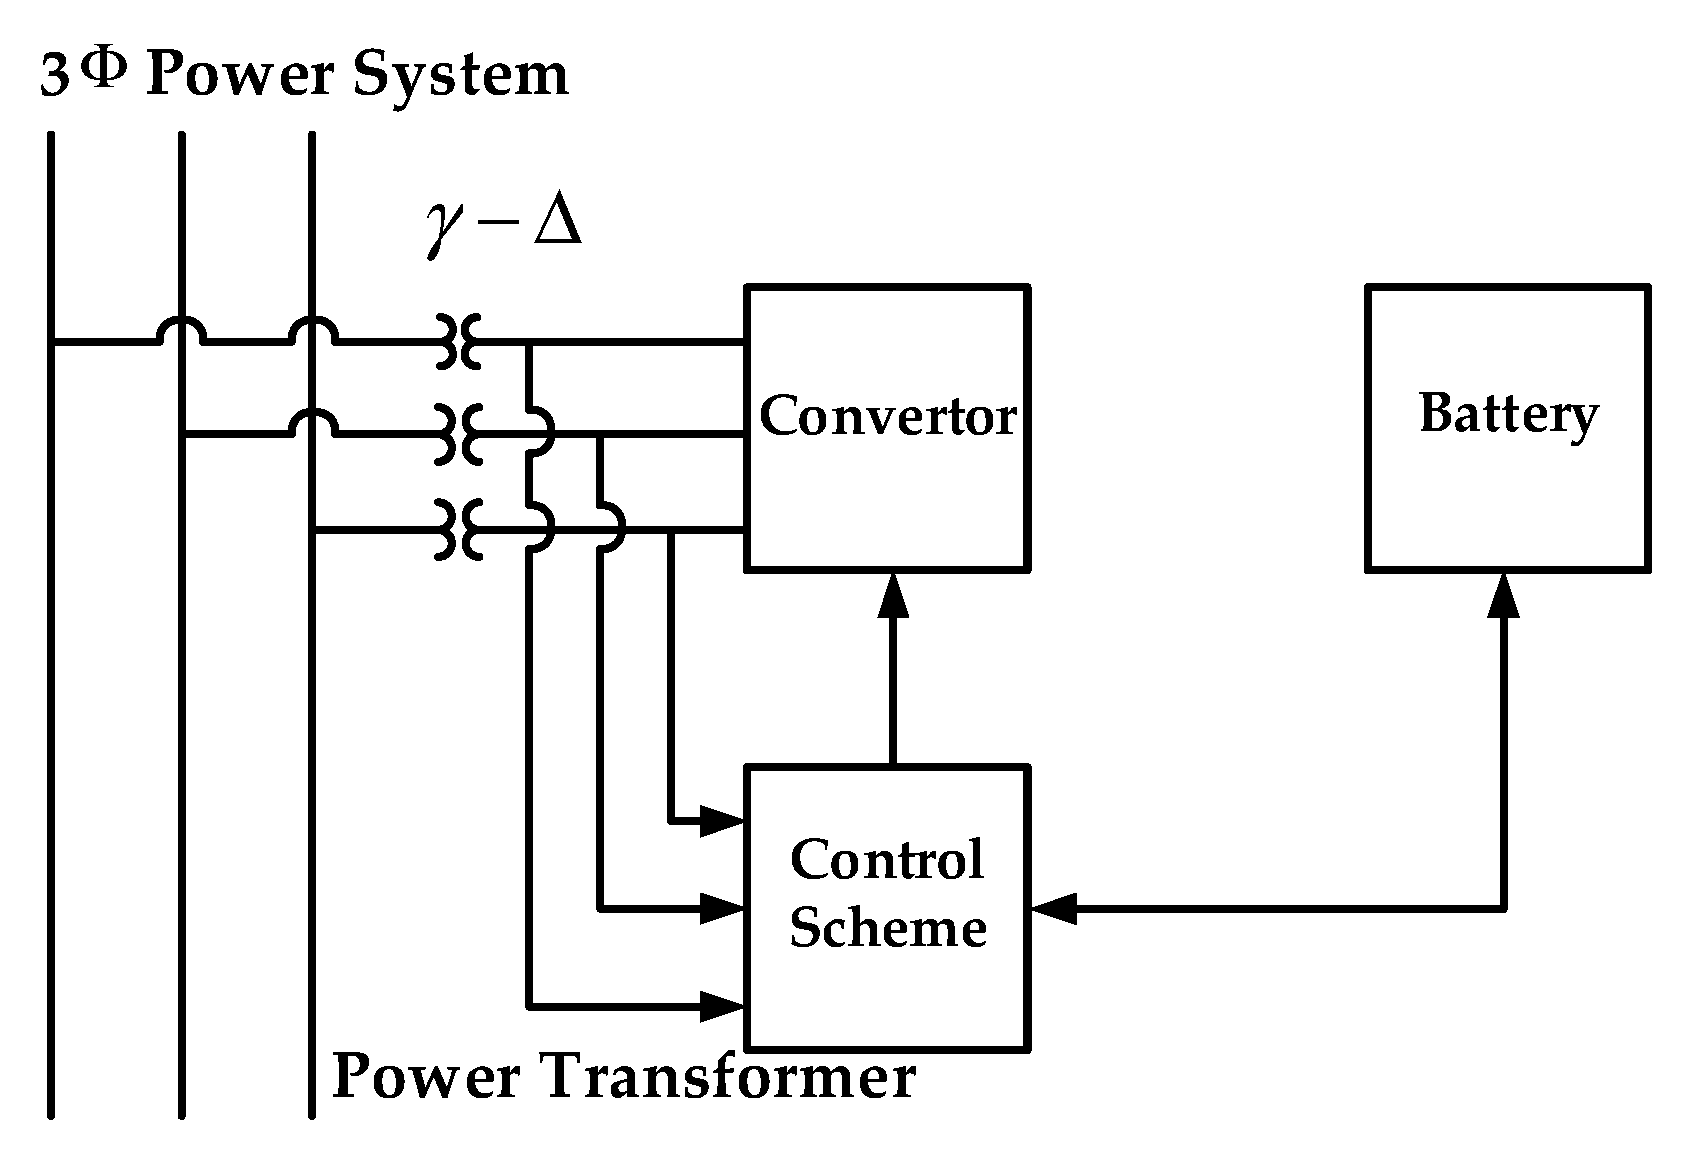
2.1. VAR Control for Smart Inverter in BESS

The alternating current (AC) power flow methods are more widely used in operation control systems than in calculations made by network sensitivity methods, which can more quickly identify problems. However, there are many critical factors in the power systems where voltage magnitudes are stable in accessing contingencies. In addition, voltage-ampere reactive (VAR) compensation was used to analyze only the MW flows, which are inadequate to indicate overloads, such as predomination on some circuits and underground cables. The VAR is used to measure the electrical power circuit of reactive power. The average electrical power is reactive power, whose active components originate from the inductors and capacitor. The unit of VAR is used to determine only the type of power that is observed in AC electrical circuits. Power flow analysis (PFA) is a crucial point to determine the power system state when energizing the power from the grid to each load. The PFA is used to find each branches’ and buses’ voltage level, power loss, and power flow. Generally, the complex network and modern load are used for nonlinear power flow analysis. It can be computed in Equation (1) as follows [27]:
I i n j ( v ) = Y s y s t e m V
where I i n j ( v ) is injection current of power conversion elements. Bus voltage can be presented in Equation (2) as follows:
V n + 1 = [ Y s y s t e m ] 1 I i n j ( v n ) n 0 , 1 , 2 , u n t i l c o n v e r g e d
Injected reactive power to the power system was affected by levelling of the voltage magnitude. Generally, the synchronizing process is one constraint needed to adjust the voltage magnitude equal to the grid. Therefore, power converter base control is an easy way to control the volt/var mode or reactive power control. Volt/var control scheme can be presented as shown in Figure 4 [28].
Figure 4 presents the voltage magnitude control criteria using reactive power injected into the grid from the converter base. It is called the Volt/var control function. This control function is used to operate the converter from a voltage magnitude setting or monitored voltage v m o n . Hence, the converter from the Volt/var control function can be adjusted for the reactive power Q ( t ) for voltage magnitude setting, and varies from the load variation of the grid. The reactive power can be presented by using active power and apparent power, as shown in Equation (3) [28].
| Q ( t ) | = { 0 ,   i f   P a c ( t ) < P min k var M a x × P a c ( t ) % P min N o V a r s ,   i f   P min P a c ( t ) < P max k var M a x ,   i f   P a c ( t ) P max
where P a c ( t ) and k var M a x are the active and maximum reactive power output of the converter, P min and P max are the power output boundary of the inverter (kW), and P min N o V a r s is the percentage of the minimum power of the converter. The inverter capability or the kVA rating output is related to the inverter properties and power limit excess condition. The inverter rating capability ( S ) is presented in a time step, as shown in Equation (4) follows:
S = P a c ( t ) + j Q a c ( t )
The electrical power system’s active and reactive power loss can be computed in a static state using the maximum load connected. Meanwhile, the loading variation from the grid in a time series or time step is needed to point step by using time resolution. The power loss of each time resolution becomes the total electrical energy losses (TEEL). The TEEL is used to investigate the energy losses from the electric sources to the electrical loads, as shown in Equation (5) follows:
T E E L = t = 1 24 i = 1 N B L ( R i × | I i t | 2 )
where N B L is a total number of transmission lines of the grid, R i is each resistance of the transmission line, i is the transmission line number, I i t is the current flow of a transmission line in a time step ( t ) , and t is the time step in 24 h.
Load voltage deviation (LVD) is used to solve the voltage magnitude by comparing the voltage standard or nominal voltage. Generally, the nominal voltage is defined by 1.0 p.u. The minimized value of LVD is needed to maintain and keep the value closer to zero. The LVD on the time series or time step is presented by Equation (6) as follows [29,30].
L V D = t = 1 24 ( i = 1 N n o d e | V i t V r e f V r e f | ) 24
where V i t is the node voltage ( i ) of a time step ( t ) , V r e f is the nominal or standard voltage, N n o d e is the total number of nodes in the electrical power system, and t represents the time step in 24 h.

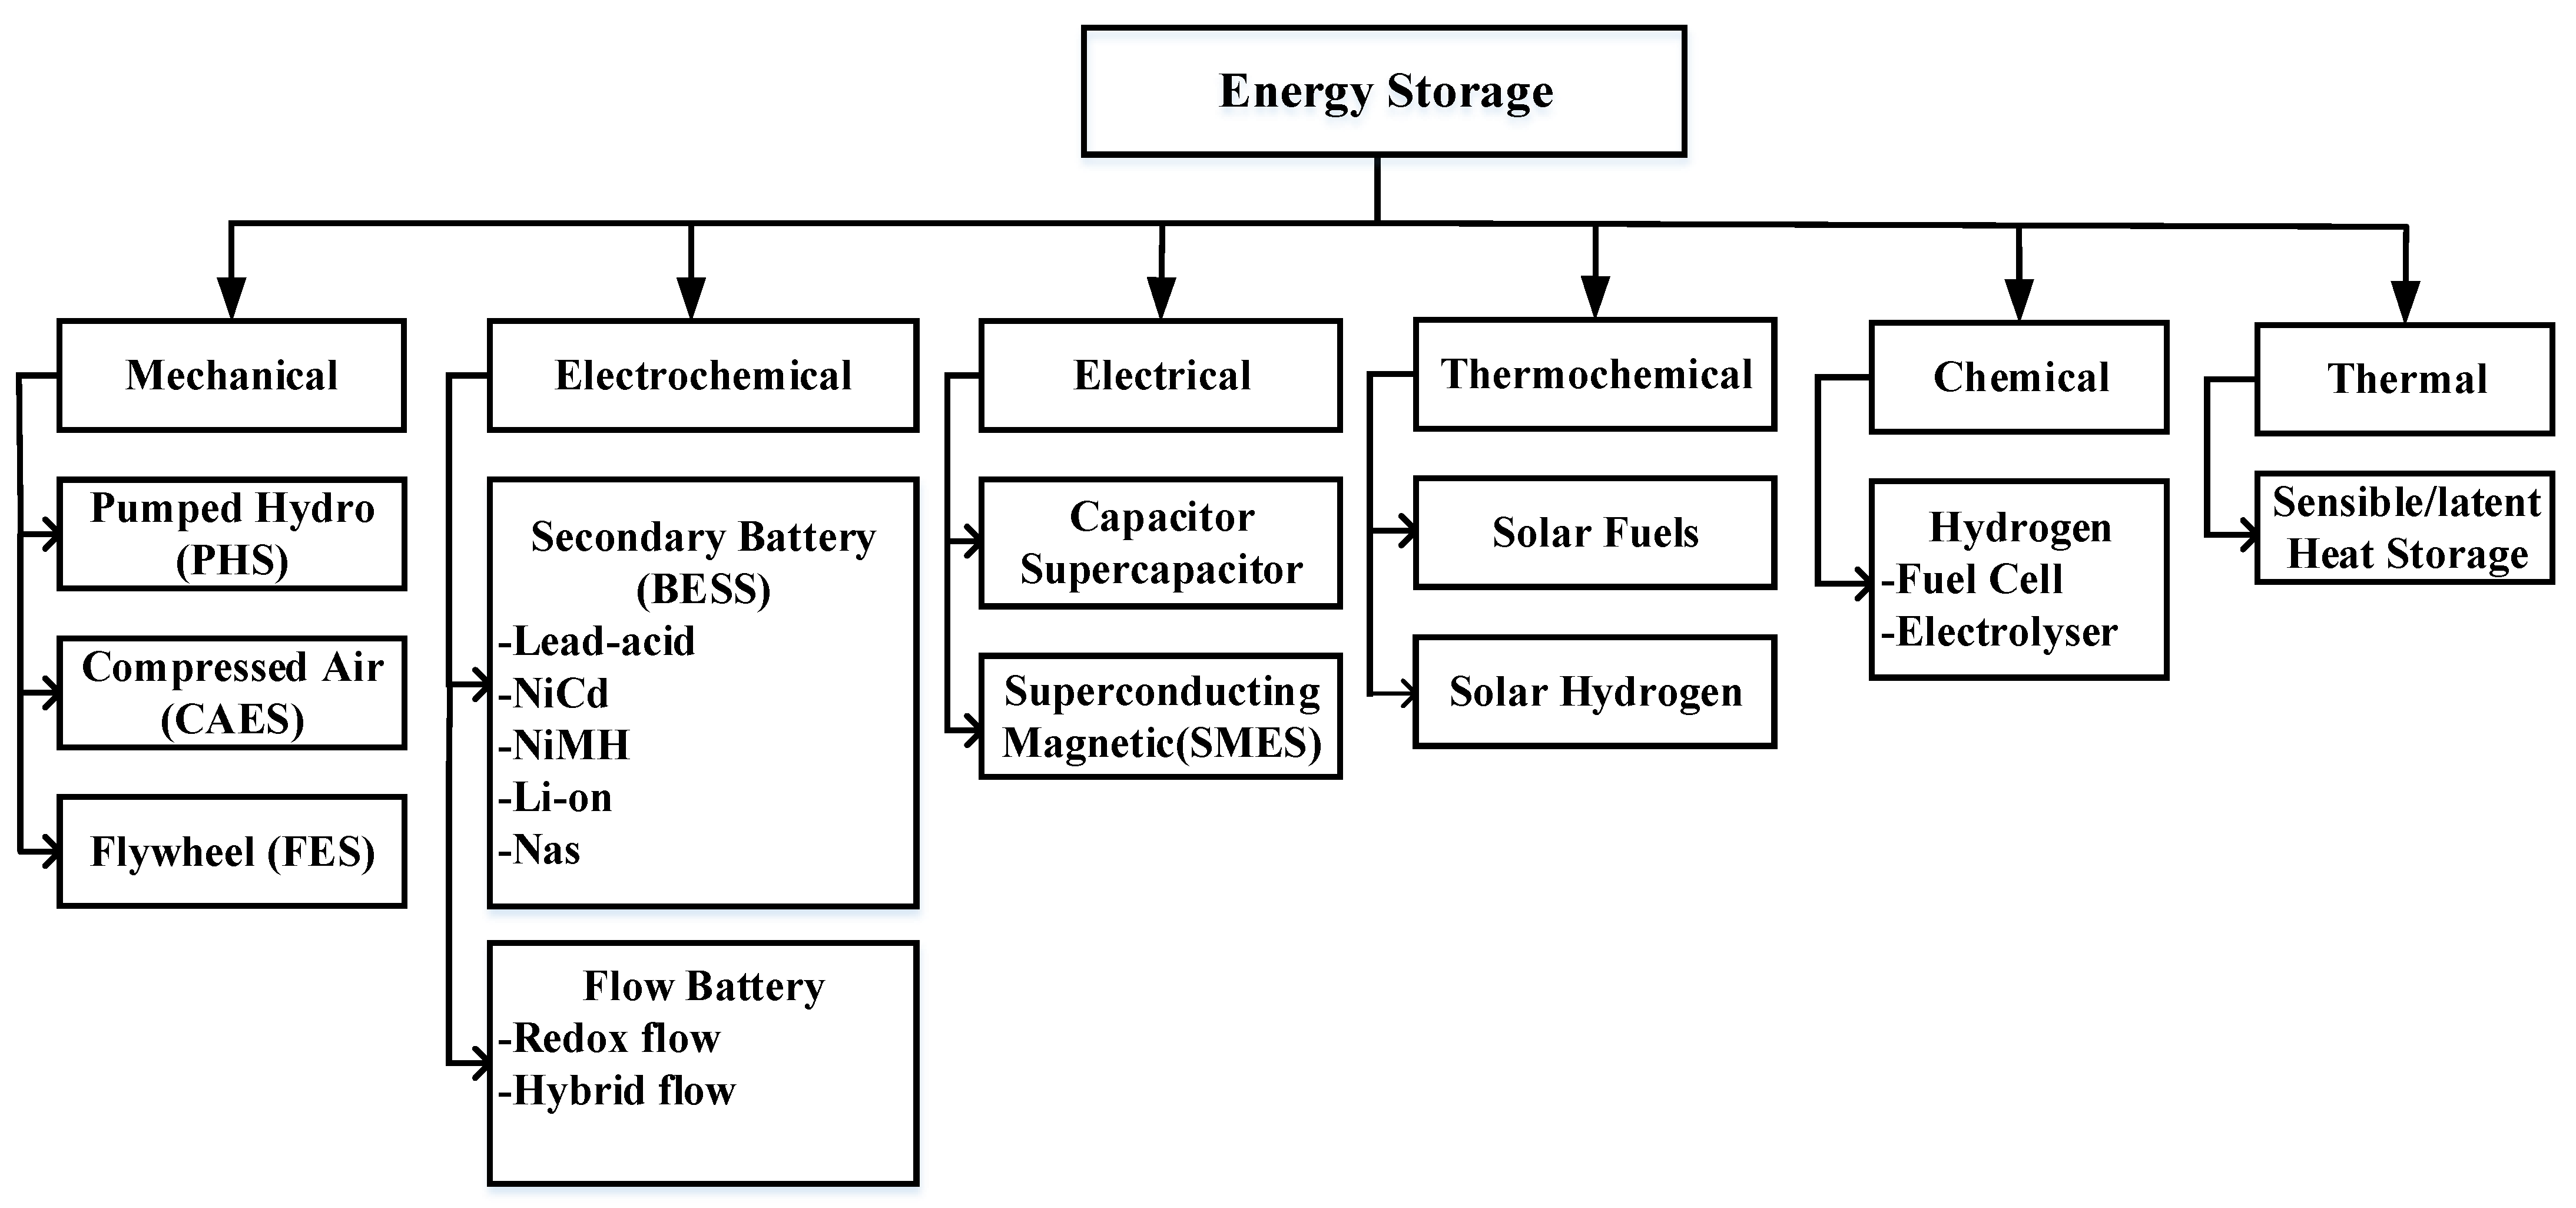
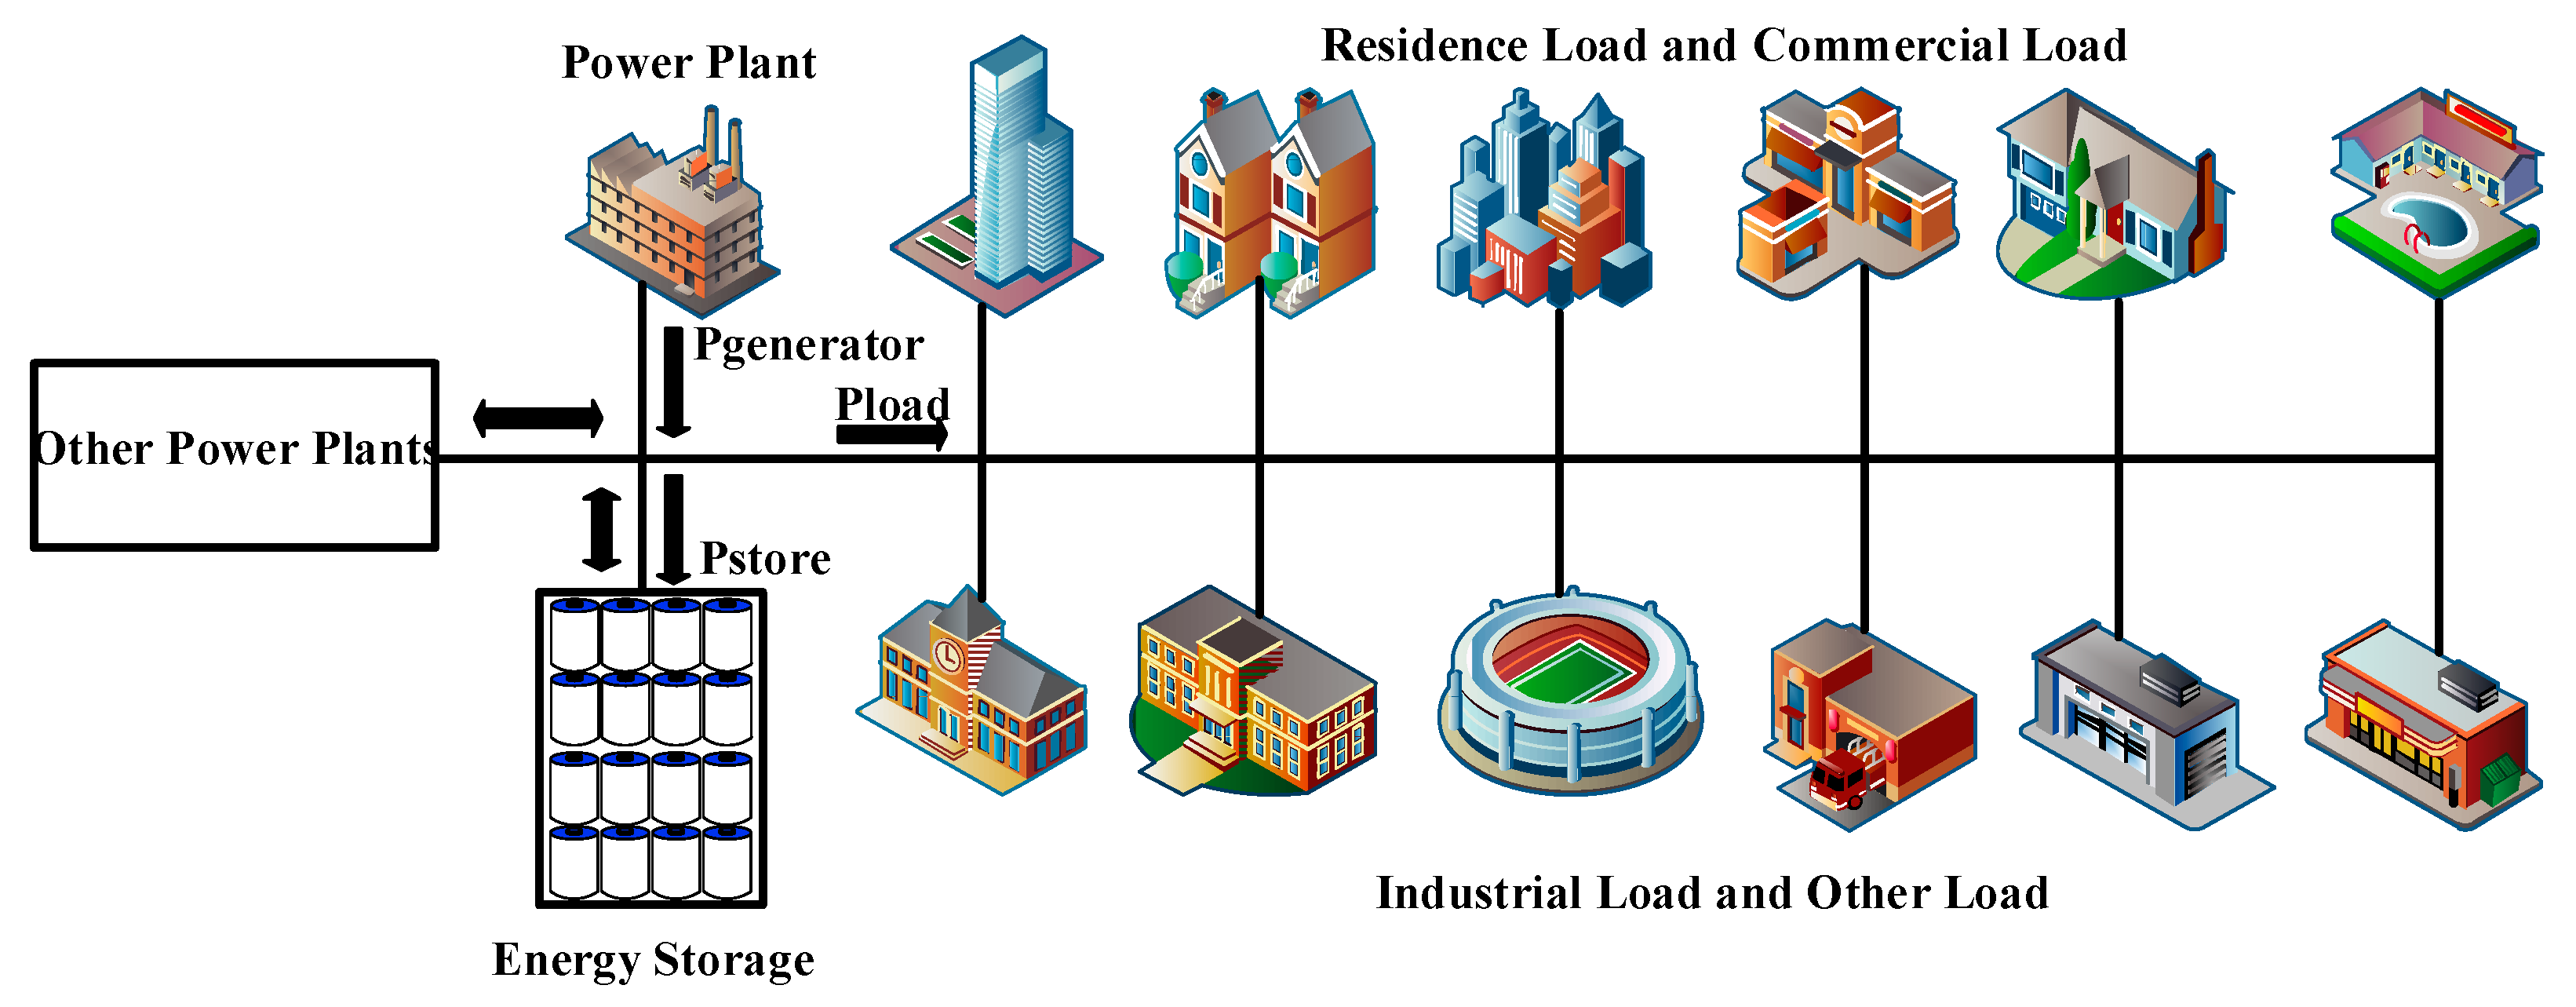
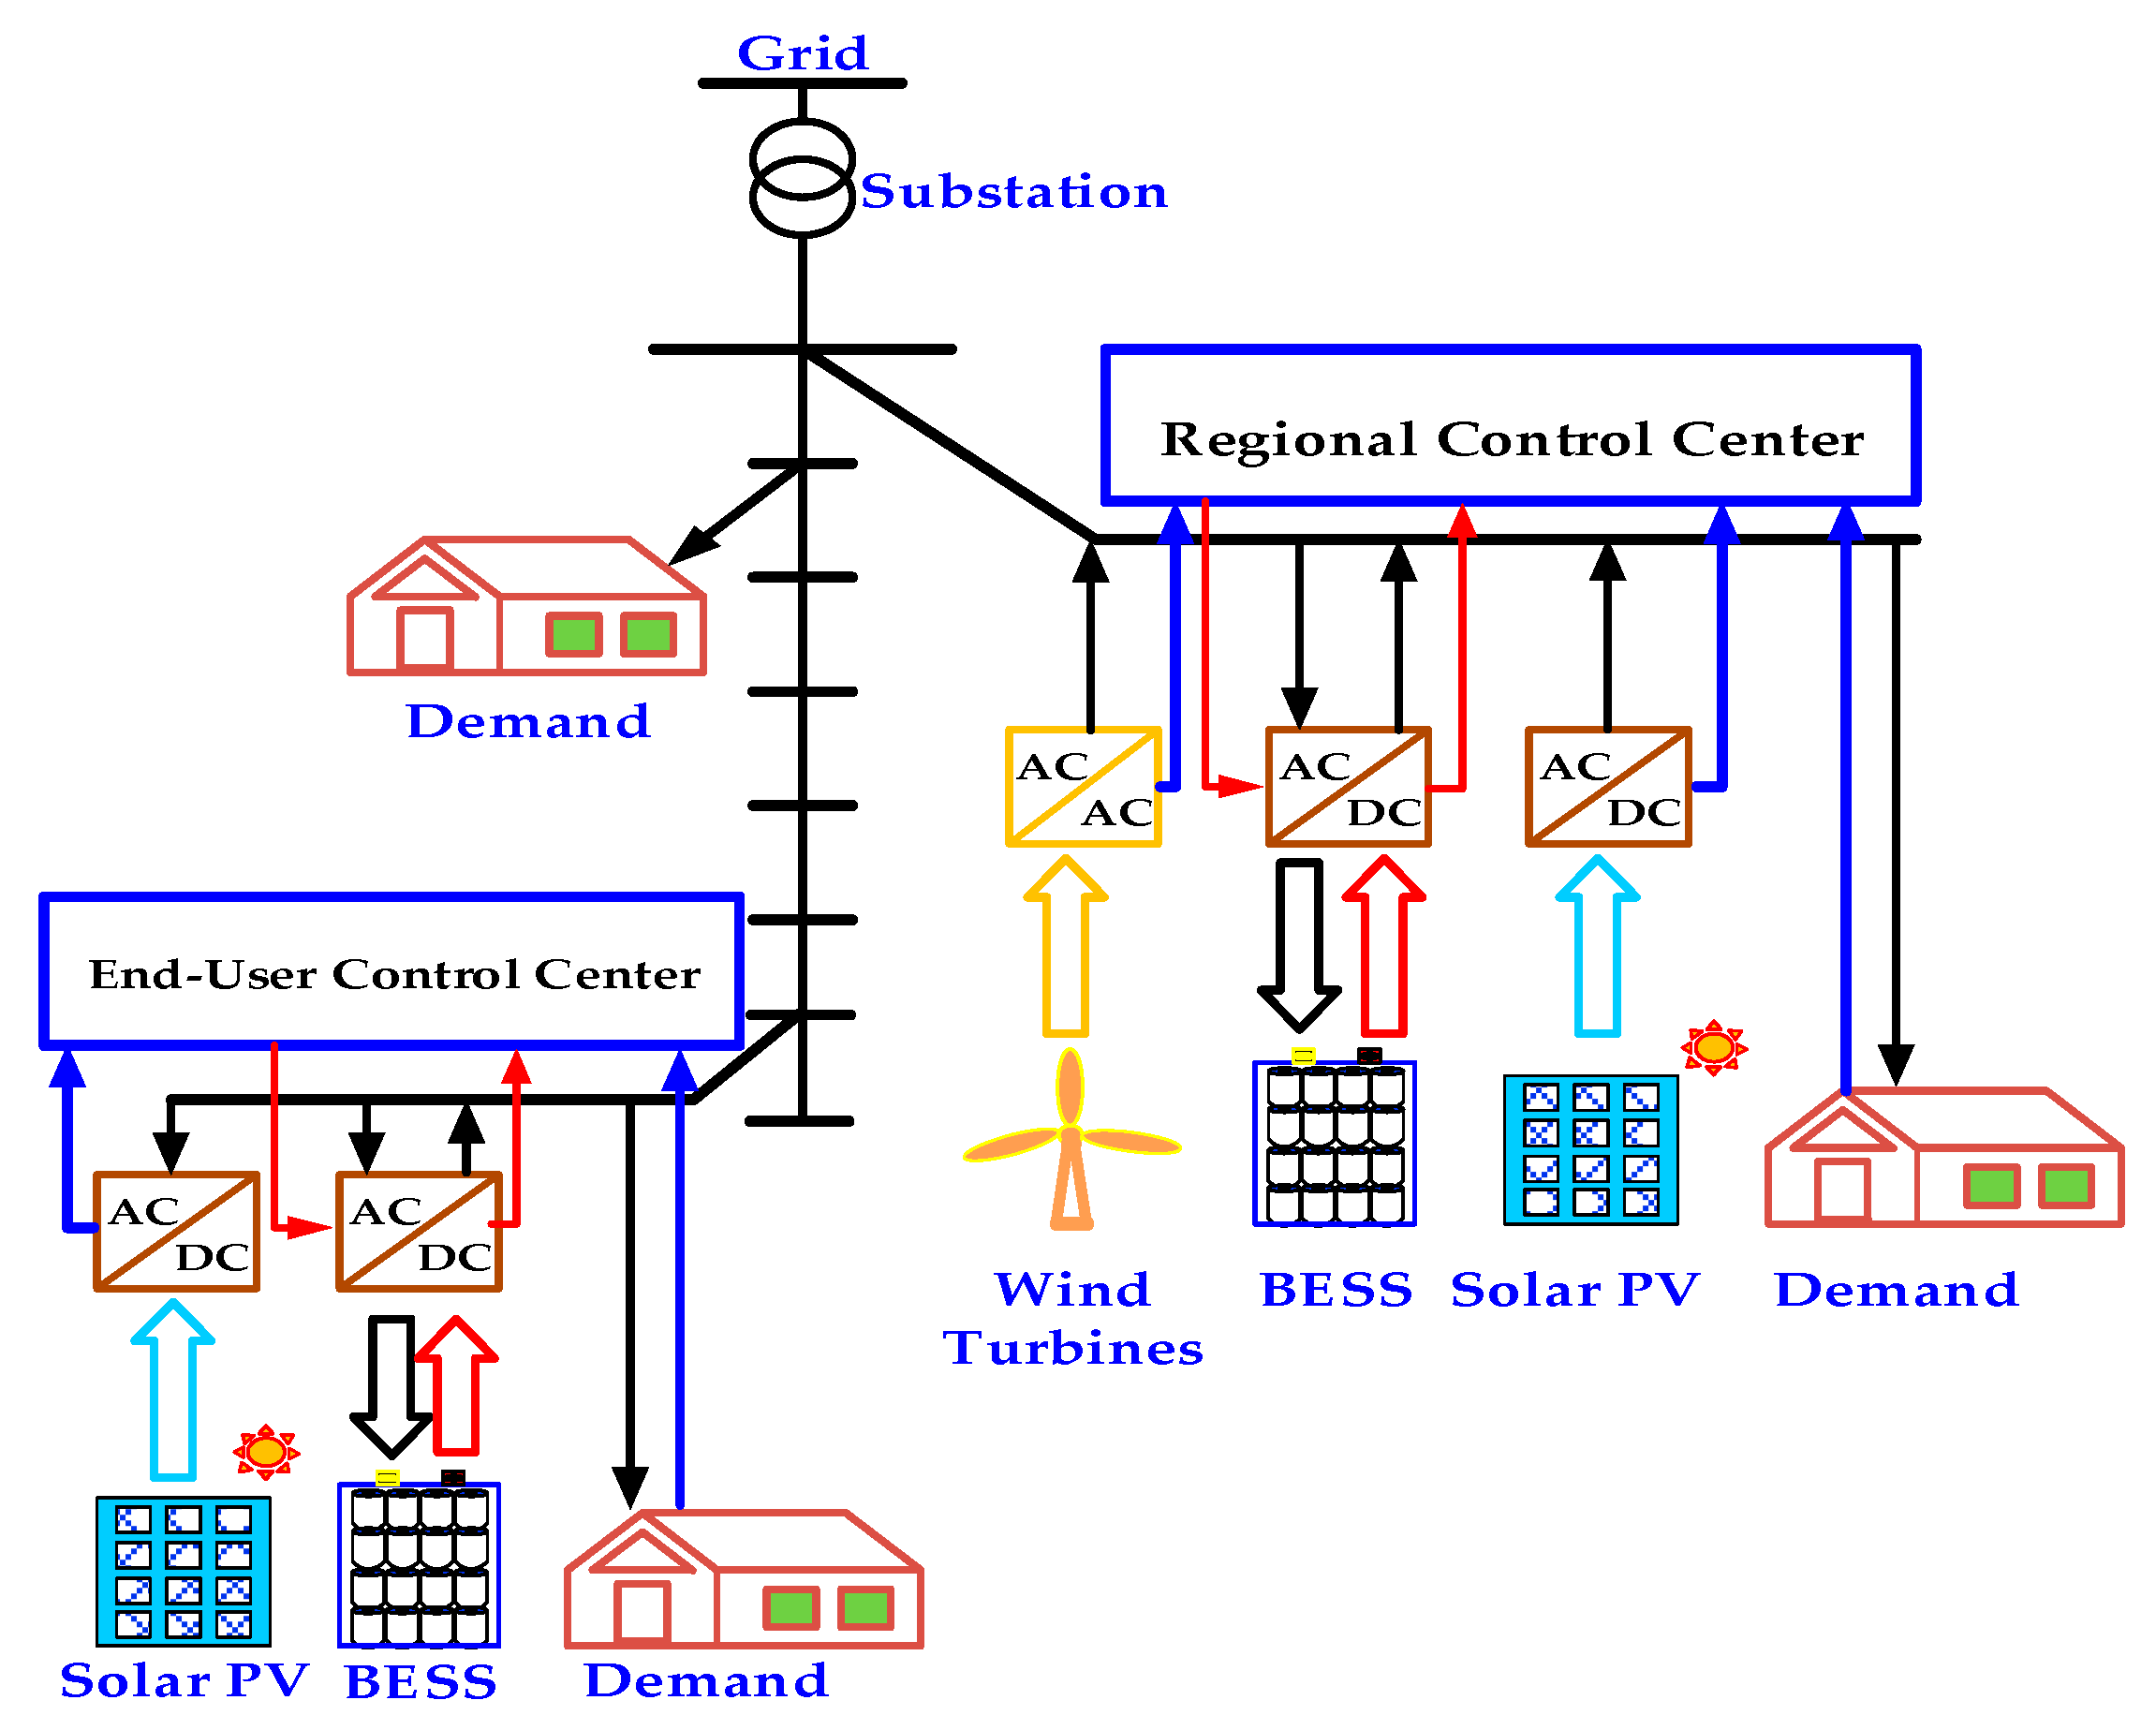
2.2. Battery Energy Storage System

The distribution system uses battery energy storage technology to support power in the system. There is a BESS component in power systems consisting of a battery model, charging, and discharging to solve such problems. Management of the frequency and voltage in the system excursions caused by the BESS requires the right timing to supply power to the system. The system stability is the main purpose of the BESS, which can help to reduce the requirement of the load in the peak demand. The performance of system stability depends on the transfer of maximum power by battery power and the power electronics circuit model. The power conversion units, as shown in a schematic of BESS control and interconnection, are displayed in Figure 5.

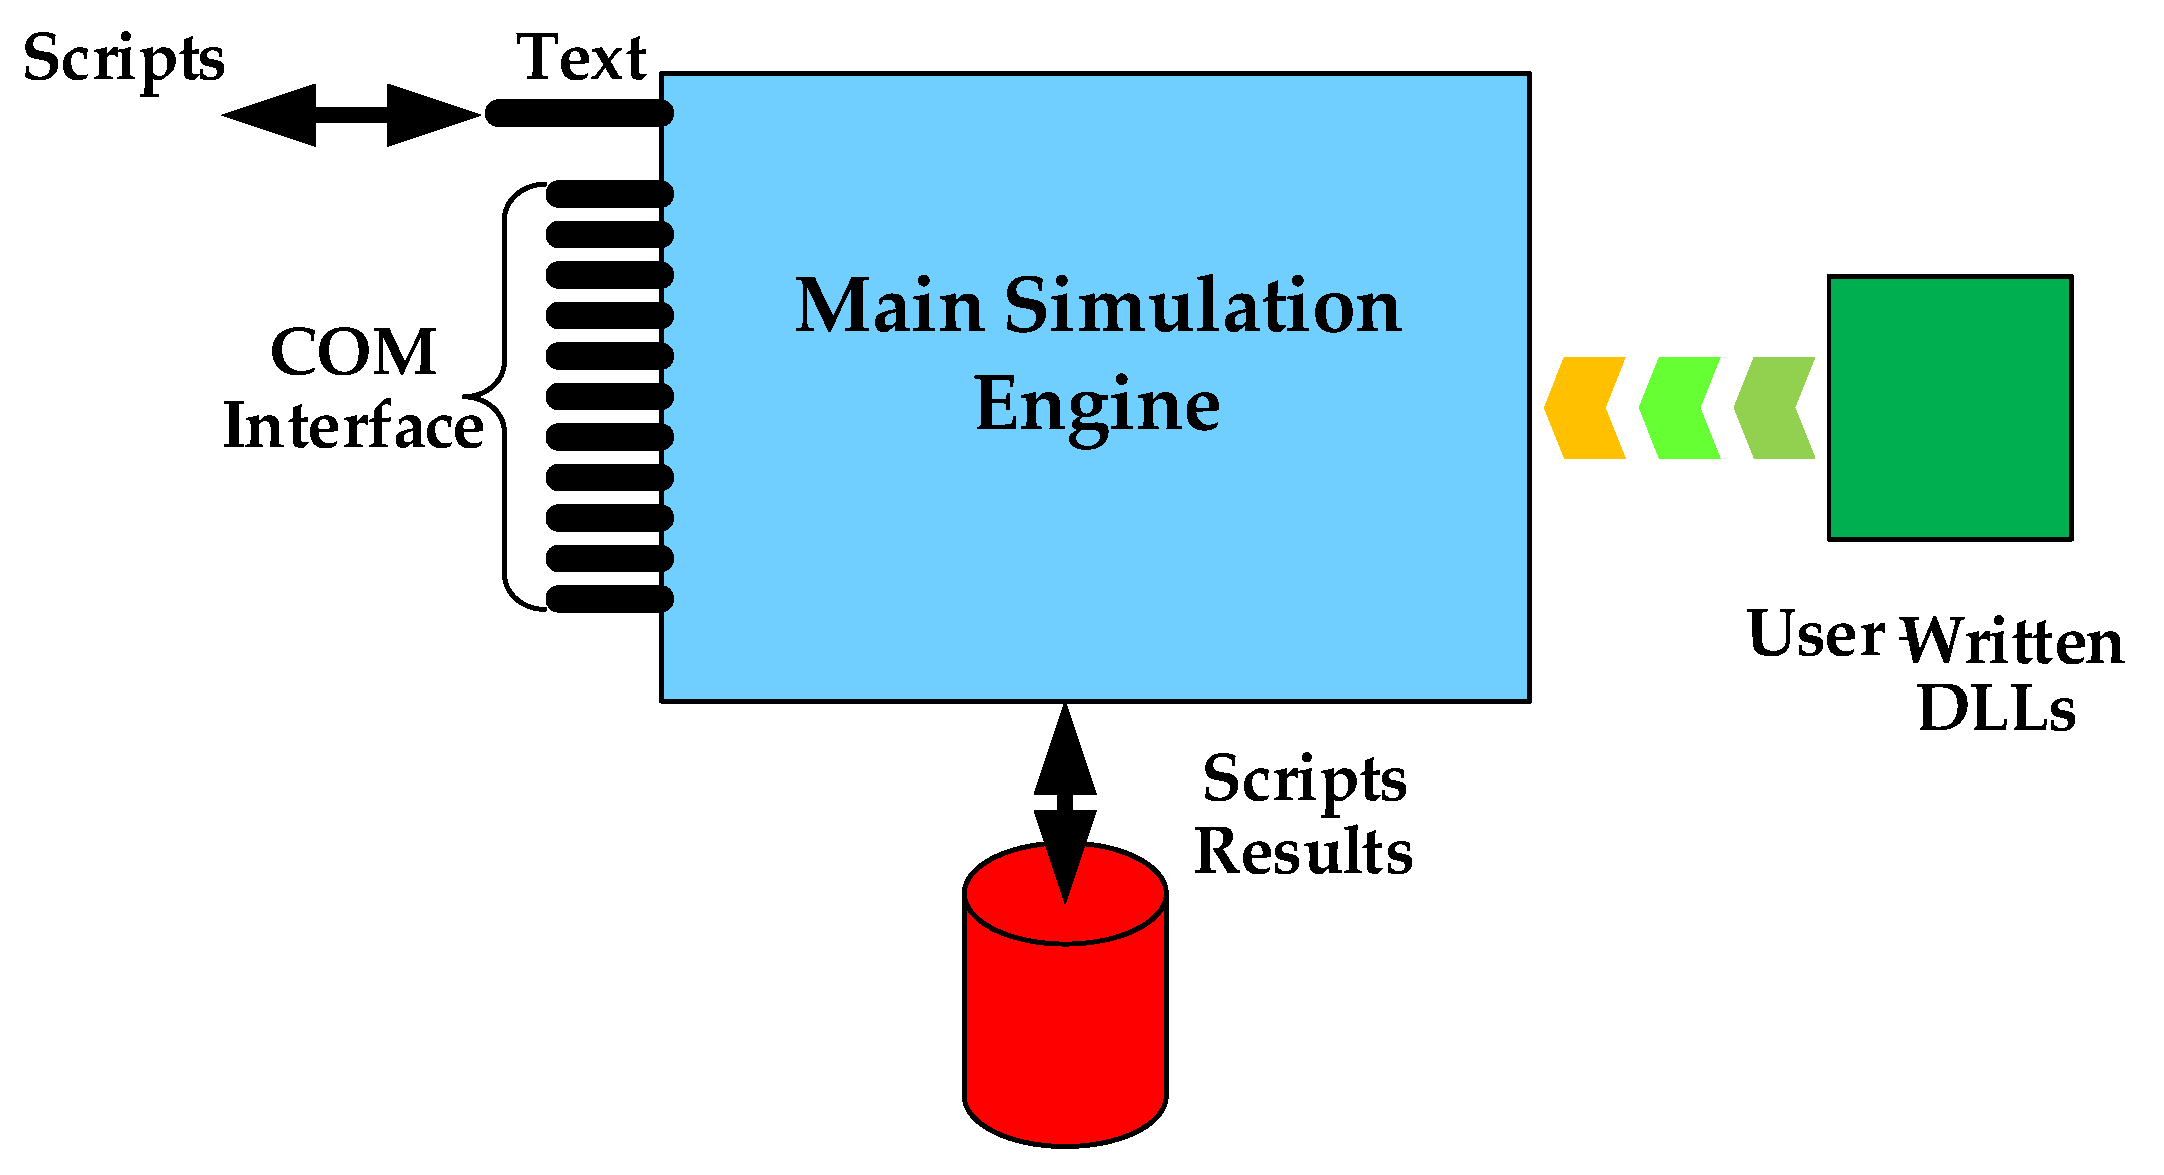
2.3. Application of Open Distribution System Simulator (OpenDSS)

OpenDSS software is an open-source license to cooperate with other grid modernization efforts active in the smart grid area. OpenDSS software can be an interfaced language code for MATLAB, Python, Excel VBA, and other ways to write code [31]. It has many built-in technical solutions, such as probabilistic logic, parameters, dynamics, harmonics, and fault current studies, including snapshot and time mode power flow. OpenDSS can analyze the condition multi-phase to solve electrical power distribution in the AC circuit model, transformers, energy storage devices, and renewable energy resources. The component object model (COM) interface method is used to solve part of the application in OpenDSS. It can be an interfaced main simulation engine whose script is used to control for simulation. The COM interface between OpenDSS and MATLAB m-files was used to communicate cover data and command control to exchange data. Therefore, the COM interface’s environmental structure, as shown in Figure 6, has a defined structure due to the use of scripts [32]. The electrical power system circuit design is cognate with the distribution system simulator (DSS) element and the component in OpenDSS software simulation. The direct connection shared library’s (DLL) OpenDSS COM interface consists of an element and component element, a PC element, controls, a meter, general properties, and a method. Meanwhile, the power flow solution of OpenDSS is defined based on the nodal admittance formulation. The nonlinear system admittance is as shown in Equation (7).
I P C ( V ) = Y S y s t e m · V
where Y S y s t e m is the matrix admittance of the system, I P C is the current compensation from the PC element in the circuits, and V is nodal voltage.

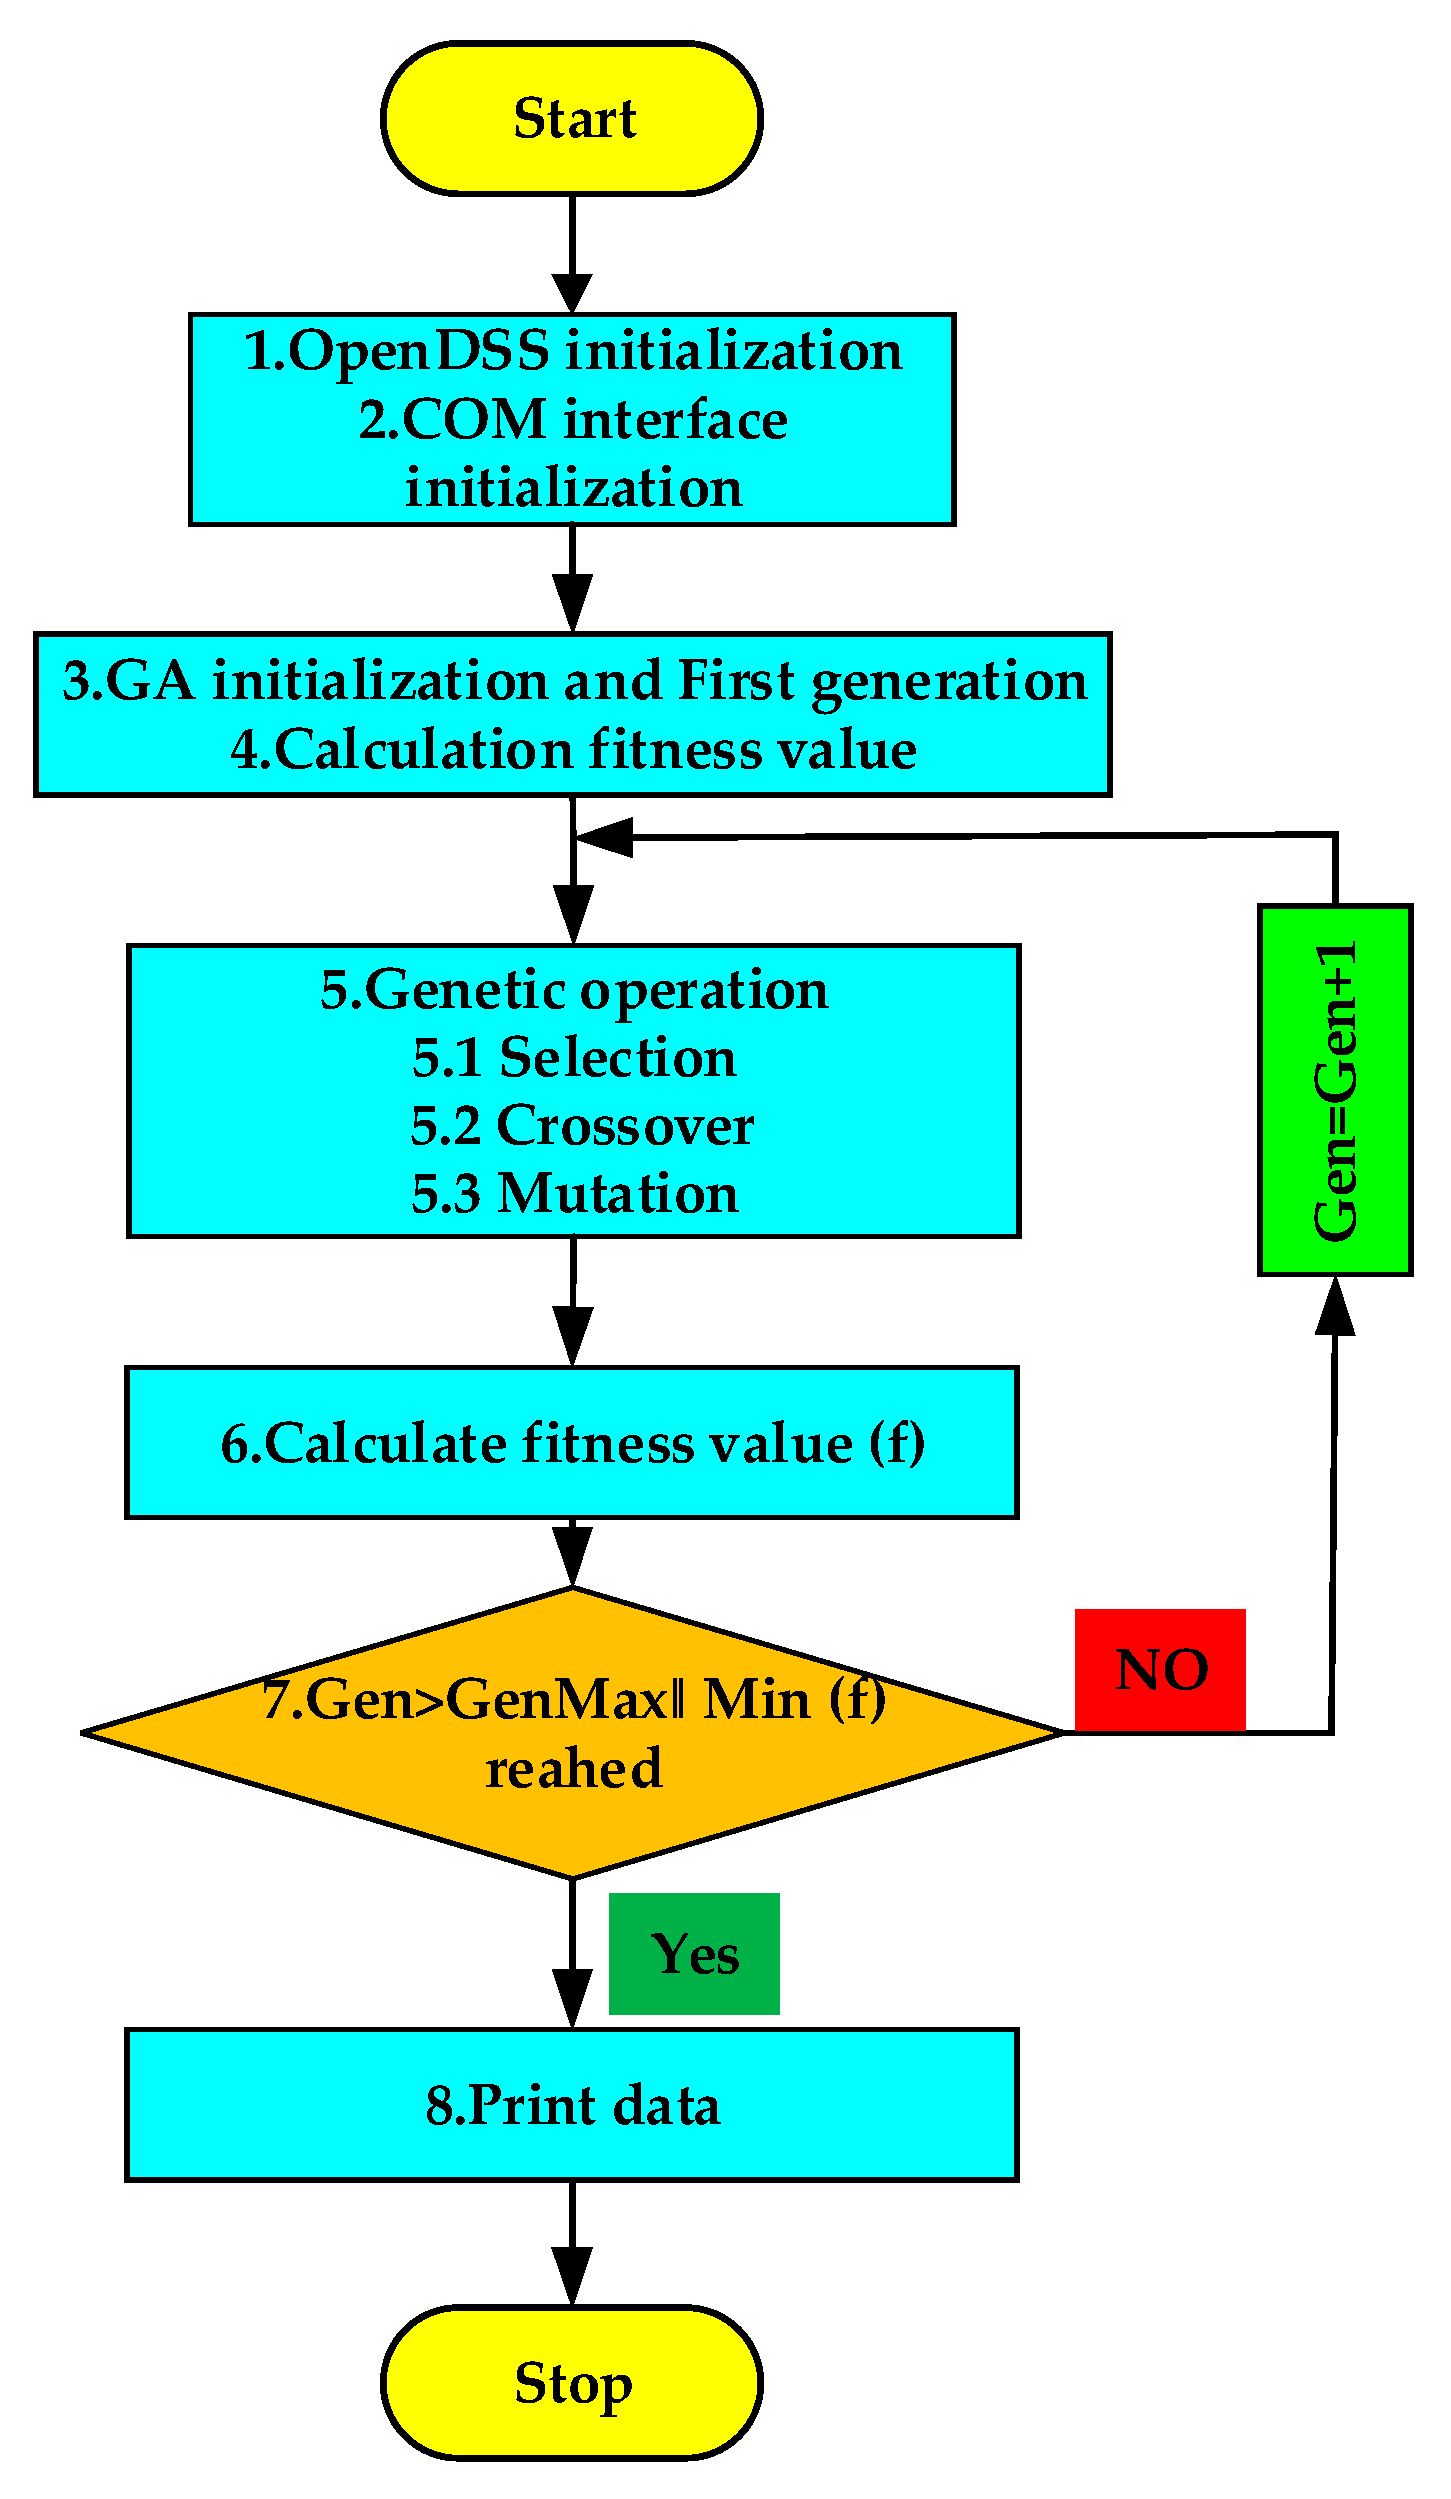
2.4. Genetic Algorithm (GA) Optimization Technique

The heuristic method based on a natural evolution assumes that GA is one of the optimization techniques. It begins with a specific number of chromosomes from a selected initial population. The fitness function is evaluated by a solution to the performance and problem.
Each chromosome is characterized by finding the sizing and location. Then, the performance of GA is evaluated by the fitness function [33]. The chromosomes of the previous population consist of a section process, a crossover process, and a mutation; are processed by the GA operation; and are used to identify new populations based on a random selection from the chromosomes of the previous population. This process is repeated until the minimum loss is exhausted. The process related to the stages of the BESS location is presented in Figure 7. This approach is applied to a single objective or modified in a multi-objective scenario to identify the optimal solution to the problem. Many studies have applied GA to determine the optimal BESS placement and optimal reconfiguration of the transmission line, such as the optimal solution of the power grid.

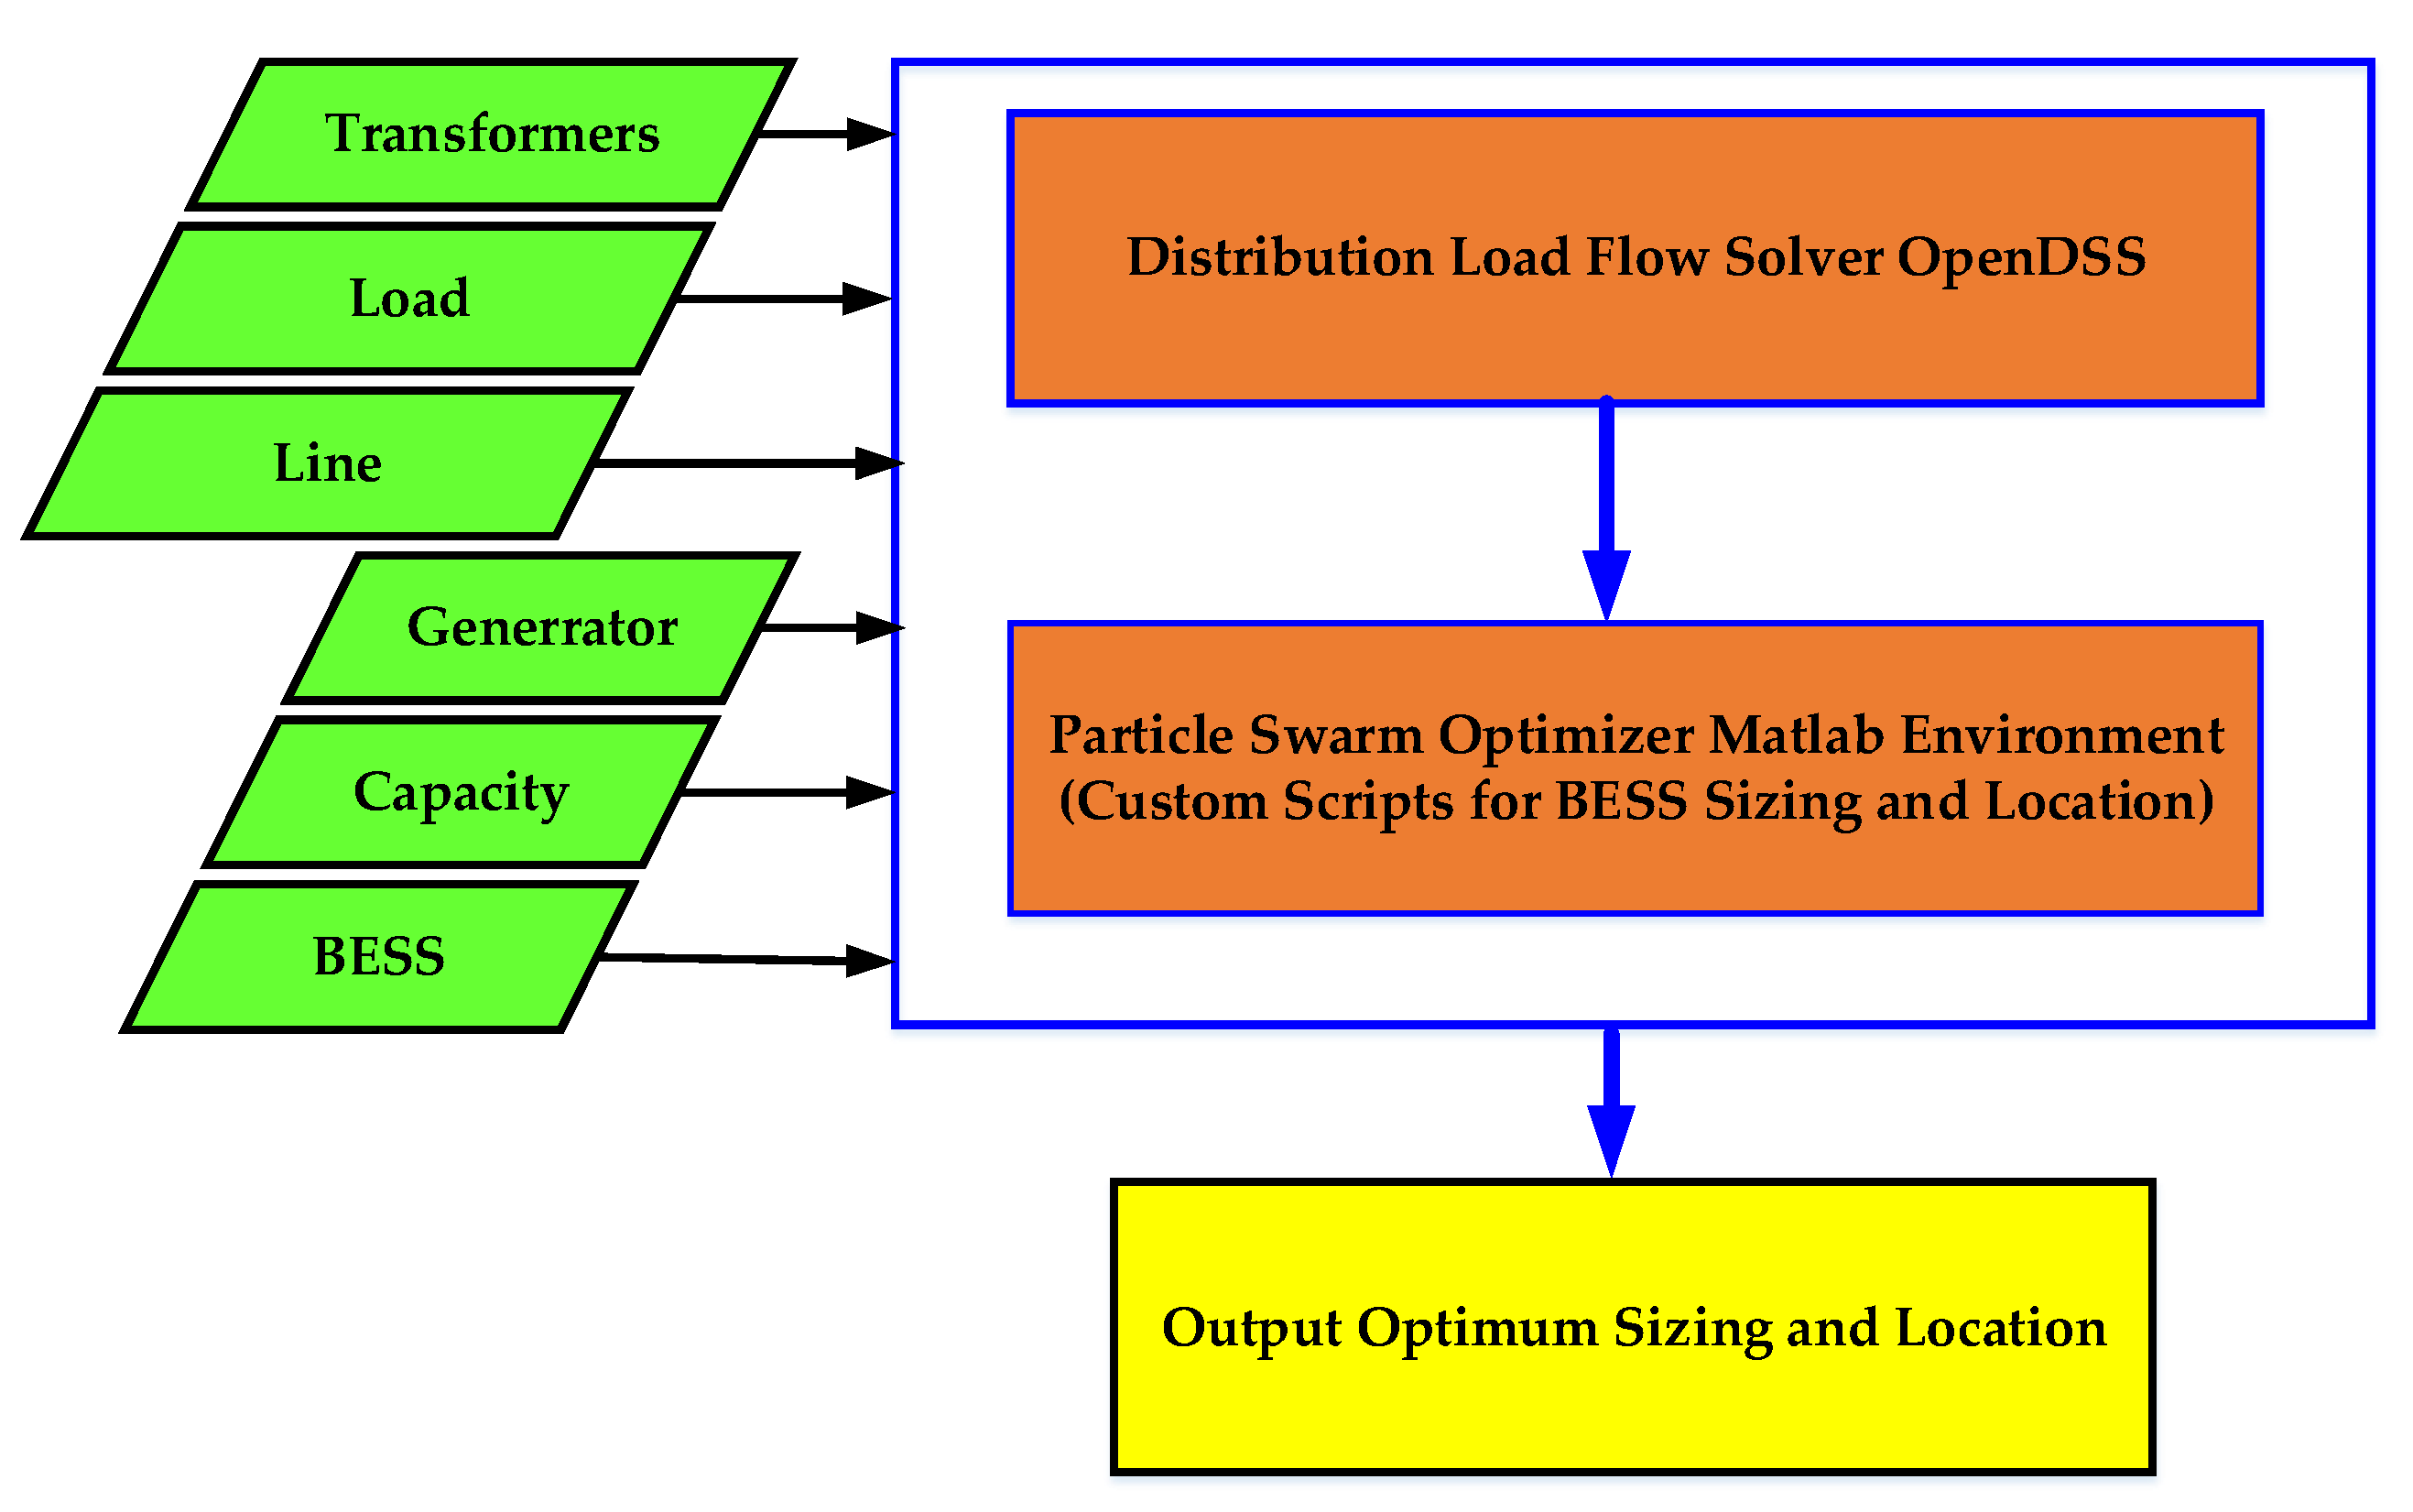
2.5. PSO Method for Optimal Sizing of BESS

The optimal sizing and location of the BESS can be obtained by using the optimization techniques such as the GA or the PSO. The optimization techniques are widely adopted to solve the problem of the electrical power system. Especially, the PSO is popularly used by representing the swarm to find the food by using velocity ( v i ) and position ( x i ) that simplifies use as shown in Figure 8. Generally, the convergence algorithm is robust, implying that PSO is less dependent on the initial points than other methods. In this work, the proposed PSO was used for finding the optimal sizing and location of the BESS. Therefore, the PSO related by two values by updating generations via optimal parameters on searching spaces at each particle. The Pbest and Gbest are the best solutions presented by each particle in all previous generations and the best values obtained by any previous iteration [32]. Therefore, particles improve their position and velocity, as shown in Equations (8) and (9) follows:
v i + 1 = v i + c 1 r 1 ( P b e s t x i ) + c 2 r 2 ( G b e s t x i )
x i + 1 = v i + 1 + x 1

3. Proposed Methodology

In this paper, the optimal sizing and location of the battery energy storage system integrated into the distribution were examined. The GA and PSO were selected to solve that problem for optimal sizing and location. The experiments were carried out on an IEEE 30 bus test system with a load demand and BESS. Furthermore, the analysis was adapted by using time series analysis in a day to collect load using the voltage ampere reactive (VAR) control in the experiments. The experimental system was composed of power energy charged by the battery and discharged during the peak period, consuming the converter’s power. The algorithm was used to find the optimal sizing and allocation of the BESS and then compared to the genetic algorithm (GA) and particle swarm optimization (PSO). The IEEE 30 test system was used to solve the optimal BESS under load variation, which operated at a nominal voltage of 132 kV. Daily load profiles of the grid were delivered by using the load demand of Figure 9. Therefore, the optimal sizing and location of the BESS were implemented by the GA and PSO based on OpenDSS with COM interfaced by integrating the IEEE 30 test system, as shown in Figure 10.
The optimal BESS sizing and location were defined by the objective function in Equation (10). The objective function was delivered in the three related functions, shown in Equations (11) and (12) follows.
min ( f ) = f 1 + f 2 × p e n n a l t y
f 1 ( x ) = t = 1 24 h r P S y s t e m D e m a n d , t
f 2 ( x ) = t 24 h r l = 1 N L R l , t ( P l , t 2 + Q l , t 2 V l , t 2 ) ;   l N L
where P S y s t e m D e m a n d represents the energy demand of from load profiles in 24 h, N L represents the total number of transmission lines of the grid, R l represents the resistance of the transmission line, V represents the voltage magnitude of the transmission line, P l and Q l represent the active and reactive power of the l transmission line, and t represents time periods in 24 h.
The total demand of energy is f 1 , the total loss of transmission is f 2 , and multiple with the penalty. There is the objective function of the optimized swarm loop. The grid’s optimal voltage condition is the injected power limit of the BESS, which is used to control and maintained the systems.
V min V B u s , i V max
P min P B E S S i P max
where V B u s , i is the bus voltage of the bus, V min and V max are the voltage tolerance of 0.95 and 1.05 p.u, P B E S S is real power injected into the grid from the BESS, P min and P max represent the real power limits of the BESS. The real power of the BESS injected into the grid is adapted to control the penalty condition, shown in Equations (14) and (15) follows.
P i n j = P B E S S P T o t a l L o a d P e n a l t y = { P i n j < 0 ;   P e n a l t y = 10,000 P i n j > 0 ;   P e n a l t y = 1
where P B E S S is the active power of BESS injected into the grid, P T o t a l L o a d is the total energy load demand, and P i n j is the total energy load demand balance from the grid.
The steps in interfacing OpenDSS to identify the optimal BESS sizing and location using GA and PSO are as follows:
  • Step 1: Initialization of OpenDSS.
    (1.1)
    IEEE 30 bus test system design in OpenDSS [34,35].
    (1.2)
    Initial load shape of residential load, commercial load, and BESS control.
  • Step 2: Initialization of COM interface between MATLAB and OpenDSS.
    (2.1)
    Initial COM interface between m-files and OpenDSS.
    (2.2)
    The formulation of the COM interface in OpenDSS is the objective function in Equation (10).
  • Step 3: GA and PSO for solving the optimal sizing and position of the BESS.
    (3.1)
    Initial parameters are given in Table 1.
    (3.2)
    The BESS sizing and location were randomly generated by using optimization techniques through the COM interface.
    (3.3)
    The objective function was used to find and compare for initializing the first fitness evaluation using computing analysis.
  • Step 4: A new population or particle swarm is randomly generated. The GA operations are consisting of a selection process, crossover process, and mutation process. Meanwhile, the PSO is defined by the new position and velocity for the particle swarm. So, the population or swarm is also obtained for the next generation.
  • Step 5: Computer analysis of the fitness evaluation of the new population or new position of the particle swarm.
  • Step 6: The condition and termination criteria consisting of reaching the Max. Generation is checked. If neither criterion is satisfied, go to Step 4; otherwise, proceed to Step 7.
  • Step 7: Stop the algorithm and present the output results.

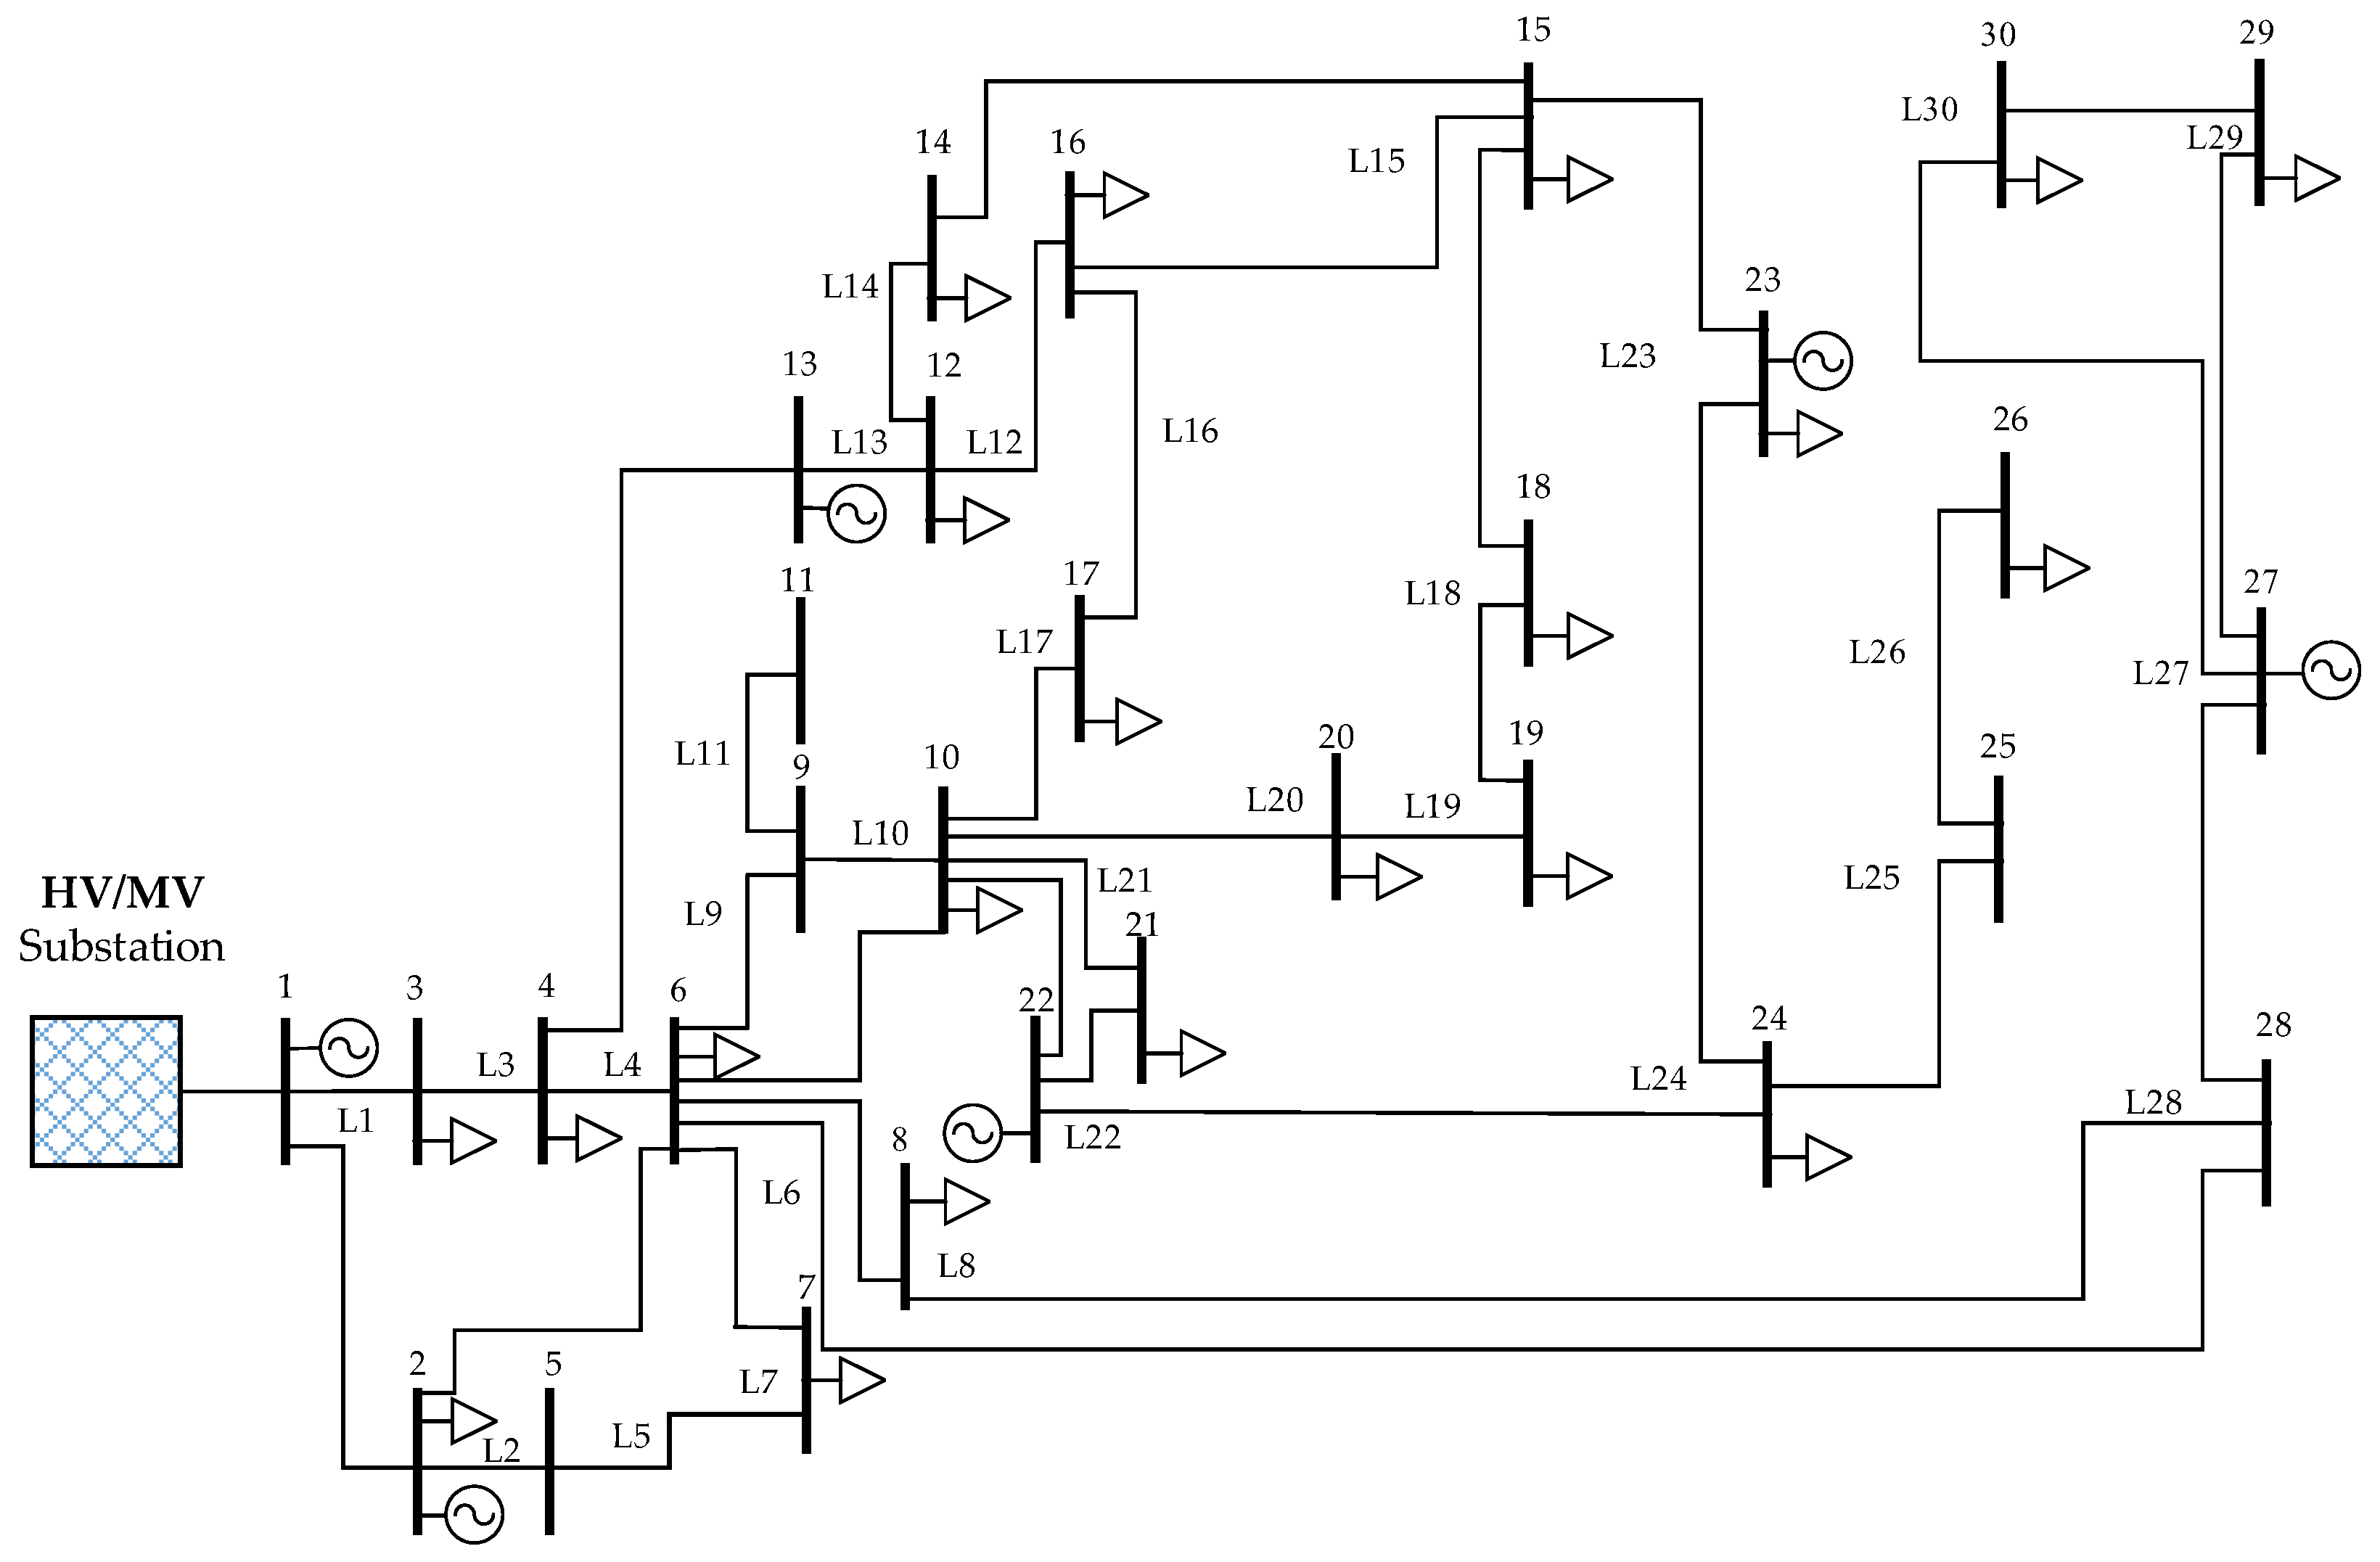
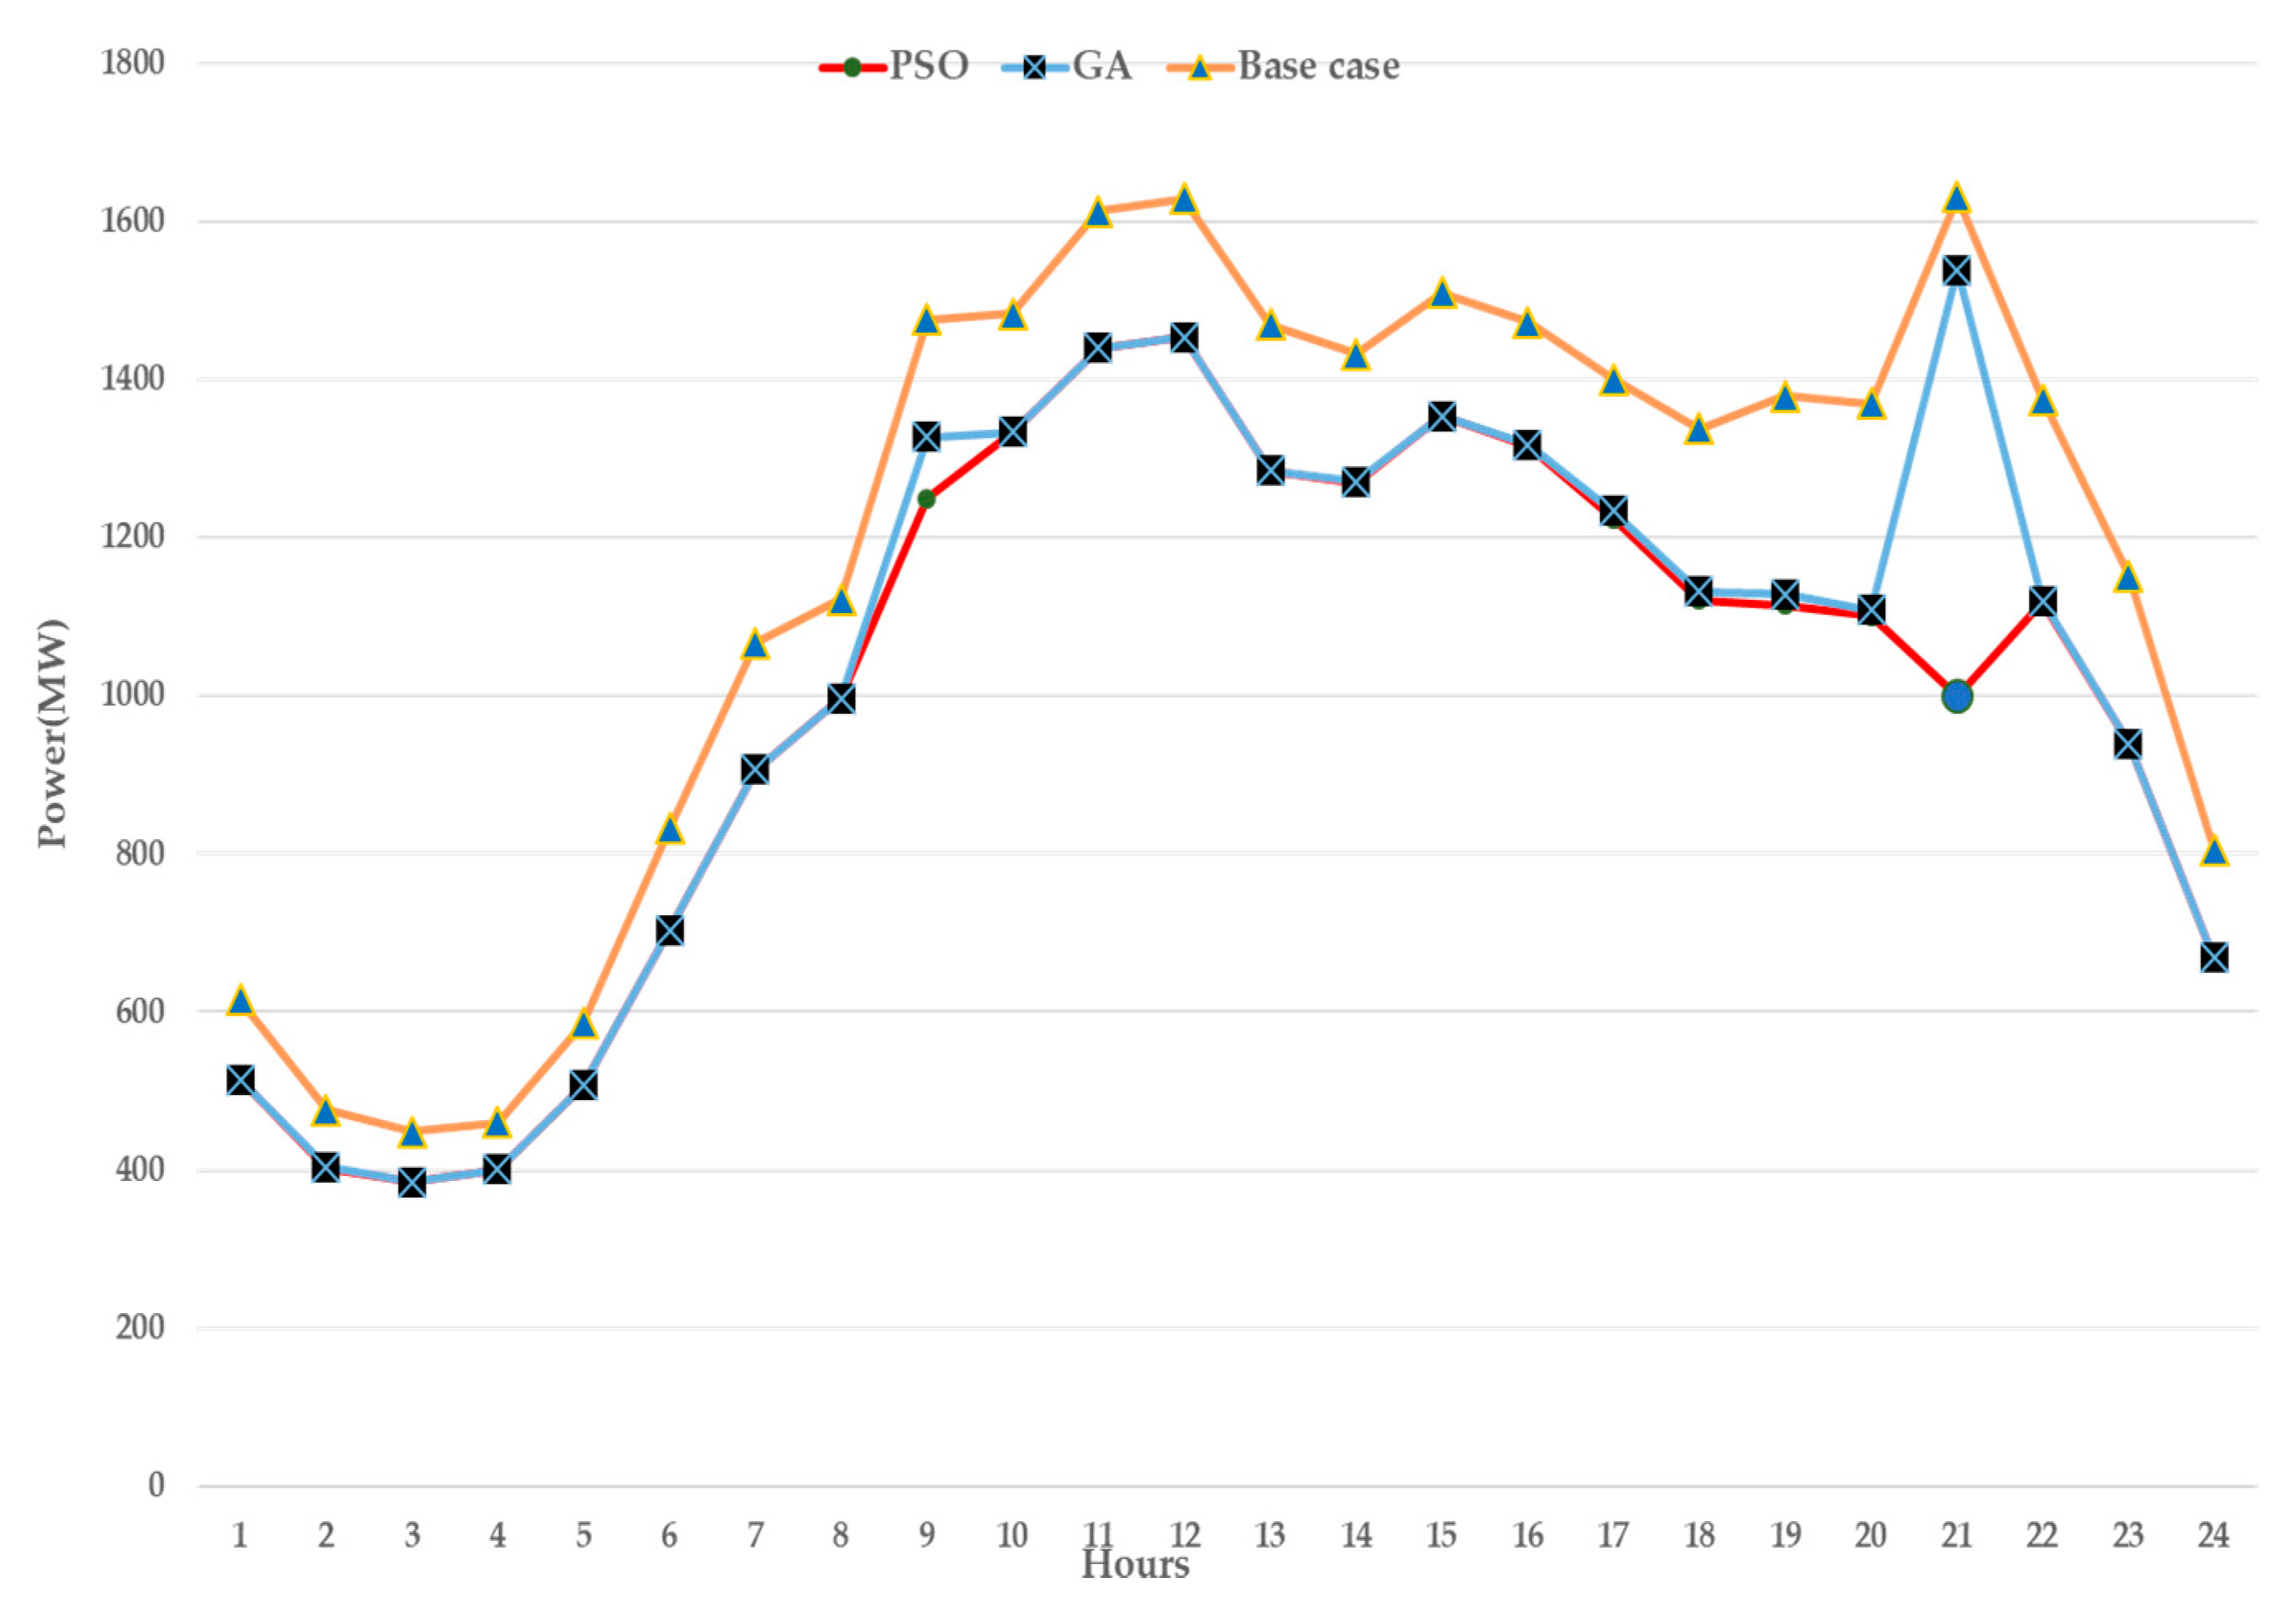
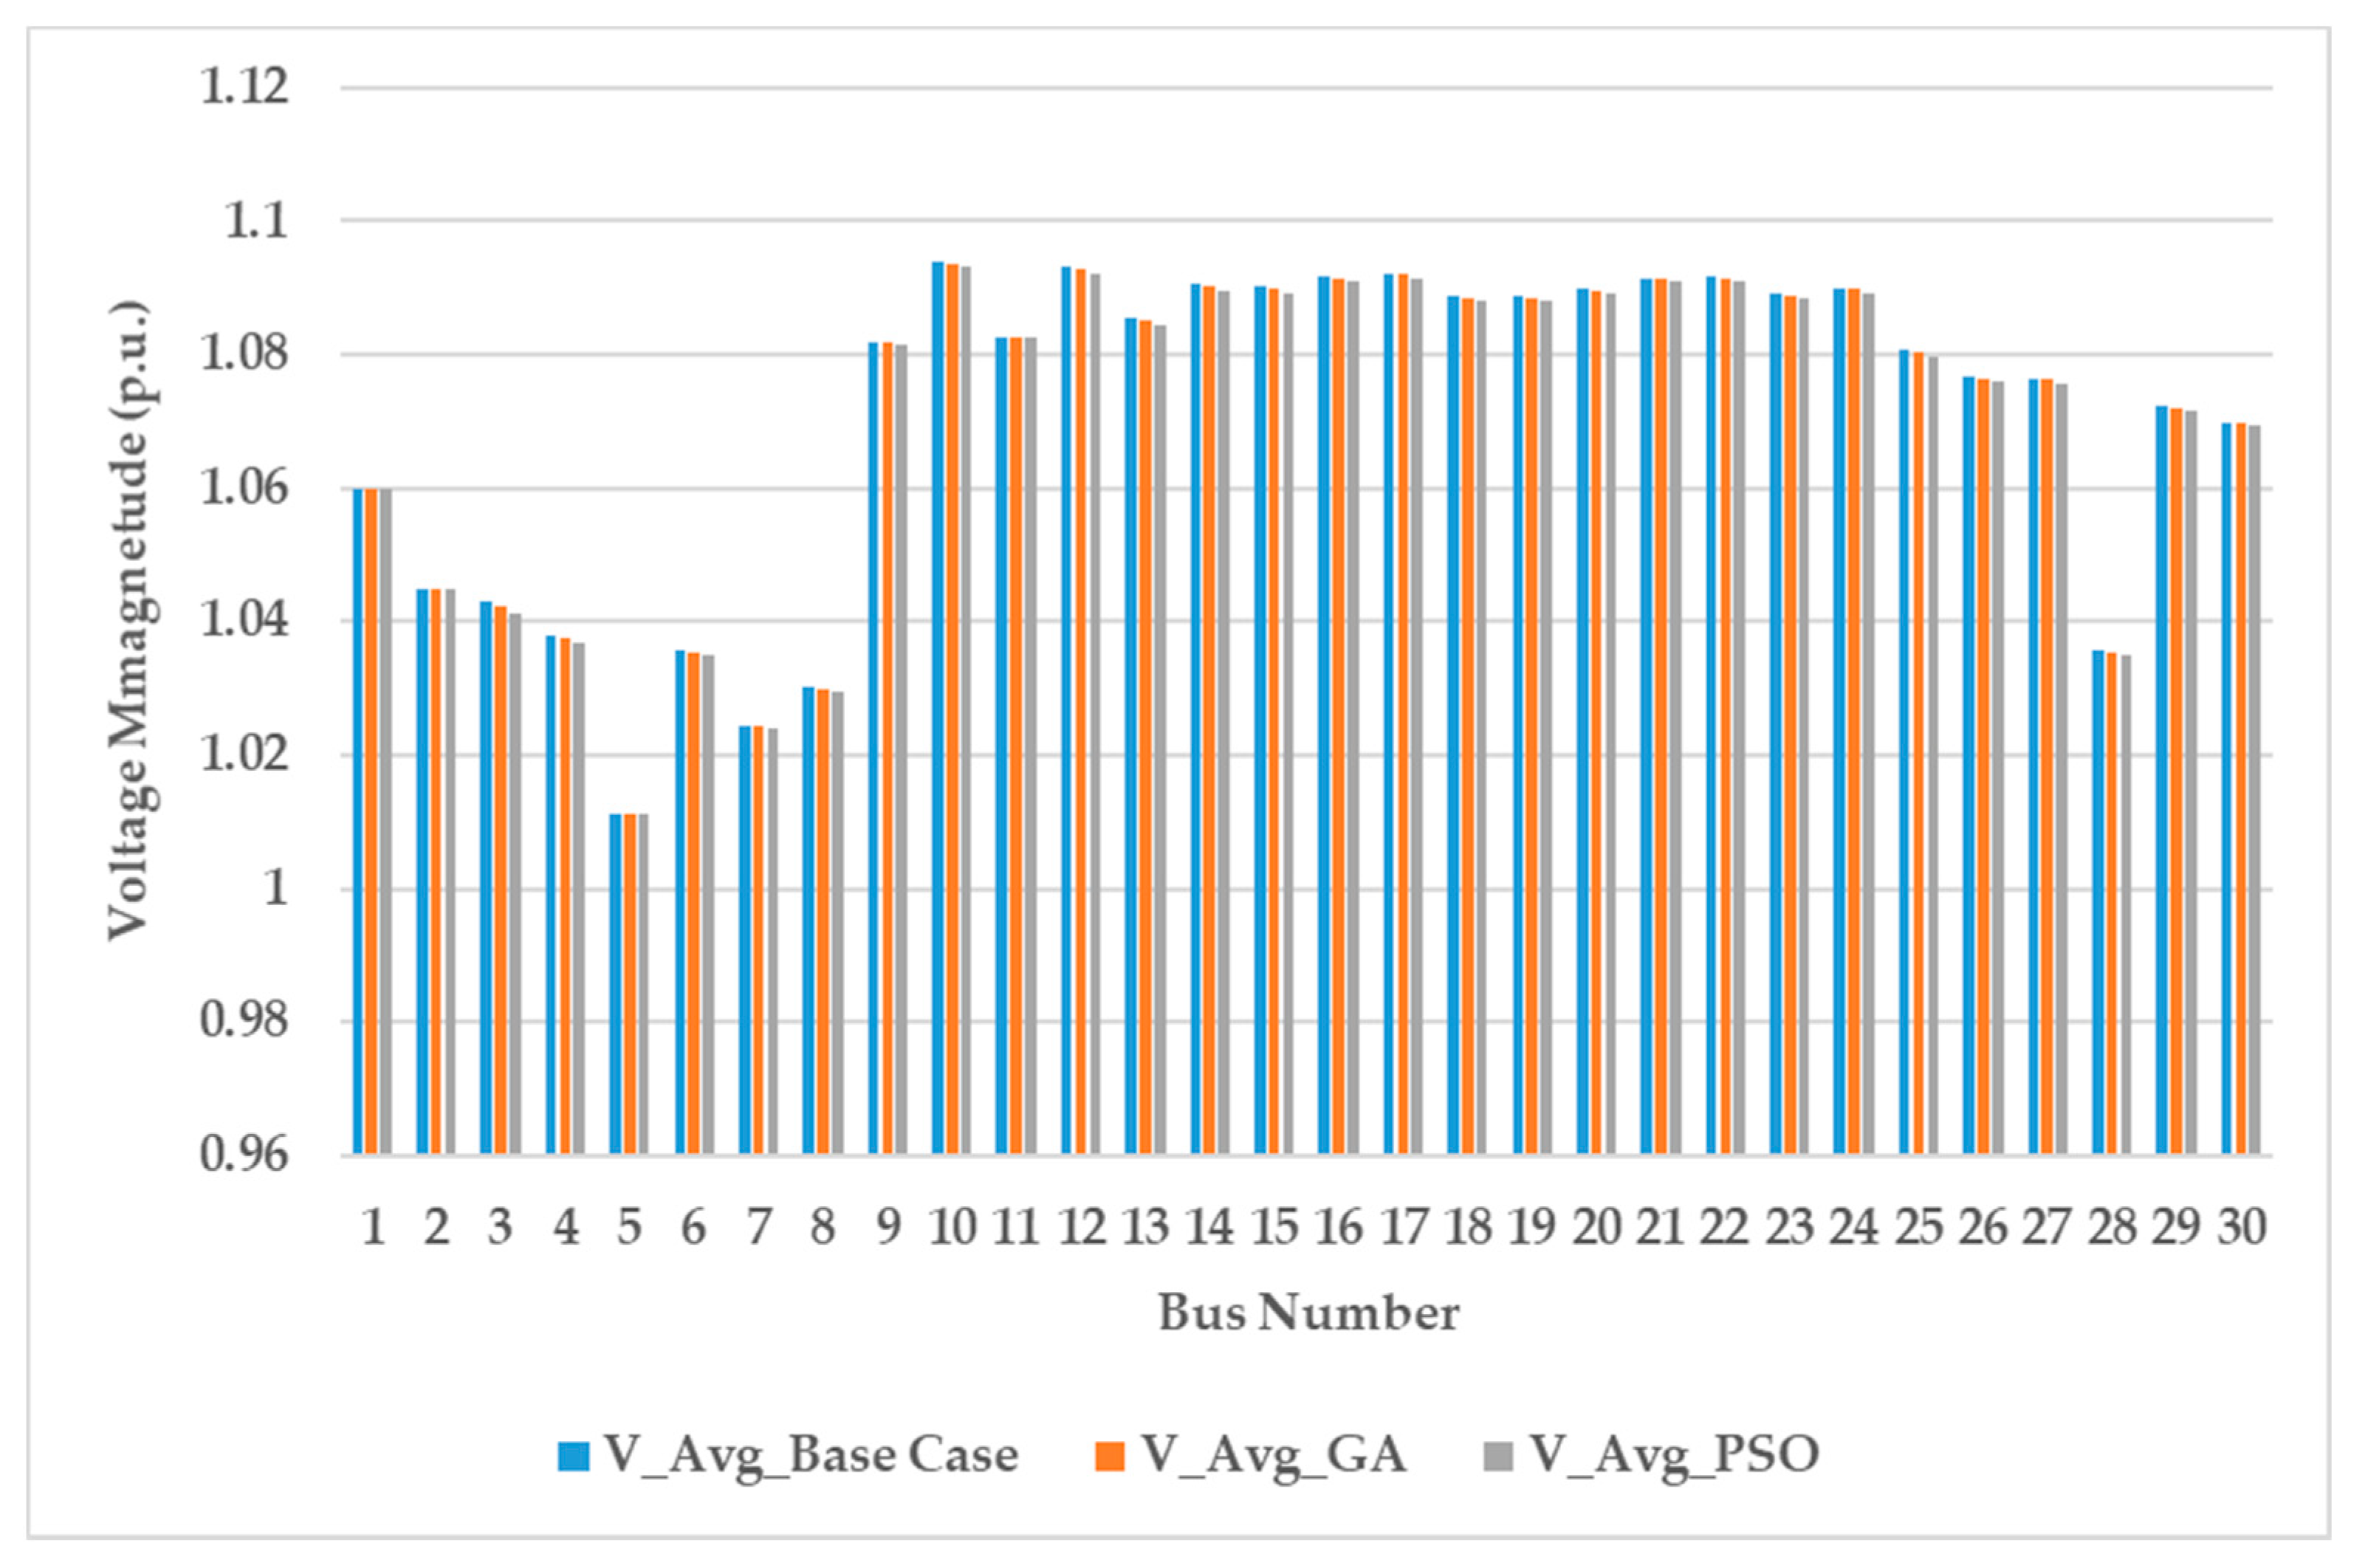
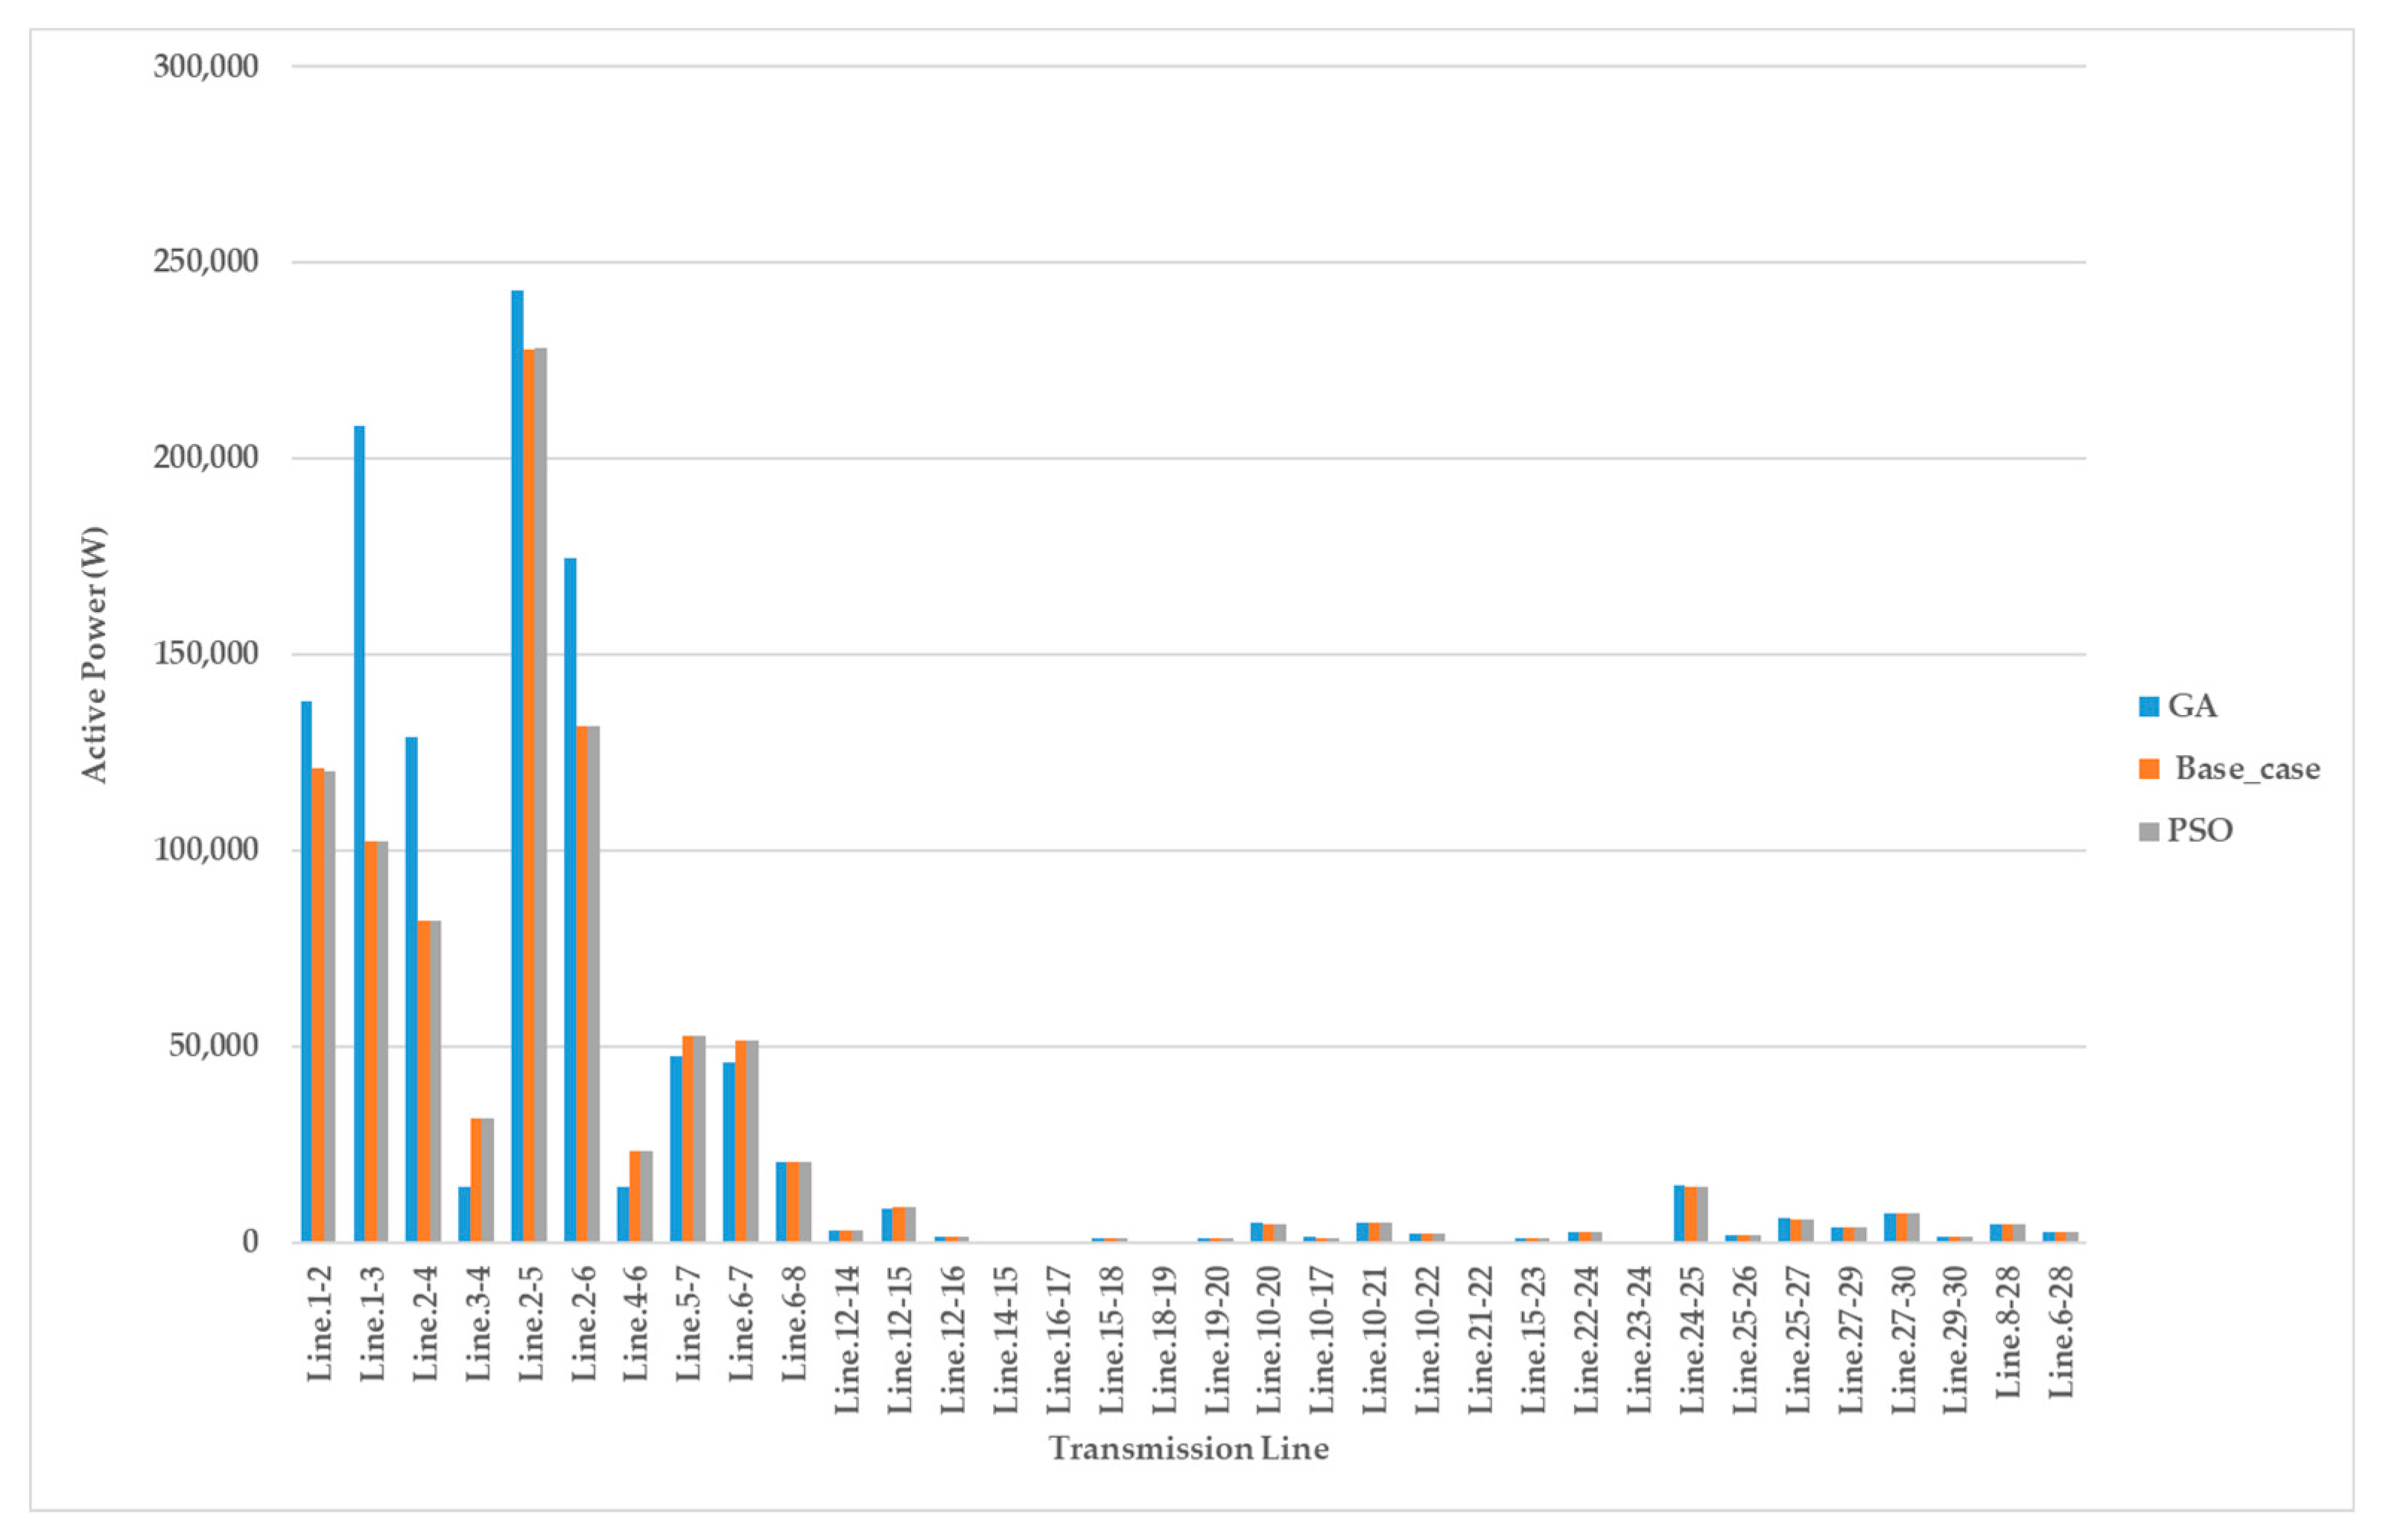
4. Simulation Results

This article presents the optimal sizing and location of the grid using OpenDSS using the GA and the PSO in the IEEE 30 bus test system. The comparison was divided into three cases: the Base case, the GA, and the PSO. The voltage magnitude level and the total energy loss were used to analyze the optimal condition of the BESS. The simulation results showed the optimal sizing and location when the real power of the BESS in the base case was set to 260.96 MW, that of GA was 261.24 MW, and that of PSO was 260.96 MW. Table 2 shows the data comparisons in each scenario type with available results: Max. p.u. voltage, Min. p.u. voltage, total active power, total reactive power, total active losses. The LVD comparison of energy loss volt-var control of the inverter reduced from the base case, GA at −0.31% and PSO at −0.95%, respectively. The TEEL comparison from the base case was best reduced for GA at −7.06% and more than for PSO at −7.27%, respectively. The LVD was major for reduced energy loss by using inverter control conditions in the system that was obtained as shown in Table 3. The BESS changed sizing and location when it showed a difference in the maximum p.u. voltage. However, increasing BESS installation may cause a daily load profile while reducing the demand energy in the peak load and total loss. The BESS can reduce the peak load of the active power source under the condition that it is connected to the grid. In this case, the BESS location changed with the GA in the grid, and the optimal BESS was at Bus No. 9 (1539 MW). Meanwhile, the optimal BESS with PSO was at Bus No. 3 (1000 MW).
Figure 11 shows the grid’s daily load profile or energy demand profiles related to the grid’s peak demand. In the case of PSO, the BESS could return power into the system using peak shaving for load demand, as shown in Figure 11. The results of the BESS integrated into the grid using the PSO technique indicated that its main contribution is to the flexibility, providing distribution expansion planning. Therefore, Table 1 shows the BESS results with the Max. p.u. voltage, Min. p.u. voltage, total active power, total reactive power, total active losses. It also compared the base case, GA case, and PSO case. From the integrated BESSs, we observed the average voltage profiles between the base case and installed GA and PSO cases with load profiles, as shown in Figure 12. The active power and reactive power were also compared, as shown in Figure 13 and Figure 14, respectively. The discrepancy inactive power may have occurred from the transmission line joint reflection effects, which may be introduced to the resonance peak power. This work was a simulation. However, the system was designed and compared to the standard system [23,36].
In this work, the optimal design system was operated under the symmetry condition, a cost-effective energy system shown in Figure 11. The saving energy was performed by the symmetrical model called IEEE 30 bus test based on power flow analysis, which was applied to achieve system balancing in the normalized charge state. The energy loss in the system can be controlled and minimized. In principle, the power source was applied by the charging system with low-power consumption. It can be configured by the energy storage system, which was symmetrical. It means that the power loss in the system can be balanced (symmetry) and achieved.

5. Conclusions

The optimal size and location of the BESS were used to solve the problem of peak load demand. The BESS was used to supply support power to the grid. The purpose was to use the BESS in the support peak load under the condition of identifying its optimal placement and smallest size. This goal was achieved using GA, PSO, and OpenDSS. The daily starting time for charging the grid charger by the BESS penetration level was defined based on the probability size and location. The simulation results showed the optimal sizing and location when the penetration level of the BESS varied. The BESS sizing and location were 1539 kW at bus No. 3 and 1000 kW at bus No. 9. The key factor regarding the optimal placement of the BESS was used to reduce the peak load to the total energy demand on the grid. However, the electrical power system displayed more variability on a large scale when the BESS was connected to the system. Notably, the optimal BESS placement at the low penetration level could increase the size. However, under the condition of a large-scale BESS, the penetration level can be improved, but the BESS sizing must be limited so that it does not exceed the demand from the grid. Therefore, future research could assess the impact of installing a multi-type BESS into the grid, with performance analysis undertaken and control carried out in time series. The IEEE 30 bus system is the standard system used to confirm the applied installation system, in which the calibration with the IEEE 30 bus system is the merit of modeling.

Author Contributions

P.P.: Conceptualization, Methodology, Software, Writing original draft preparation, Formal analysis; Y.K.: investigation, Validation, Writing review; K.B.: Conceptualization, Editing, Visualization, Supervision. All authors have read and agreed to the published version of the manuscript.

Funding

This research received no external funding.

Institutional Review Board Statement

Not applicable.

Informed Consent Statement

Not applicable.

Conflicts of Interest

The authors declare no conflict of interest.

References

  1. Ezhilarasan, S.; Palanivel, P.; Sambath, S. Design and Development of Energy Management System for DG Source Allocation in a Micro Grid with Energy Storage System. Indian J. Sci. Technol. 2015, 8, 1–9. [Google Scholar] [CrossRef]
  2. Qu, L.; Zhao, D.; Shi, T.; Chen, N.; Ding, J. Photovoltaic Generation Model for Power System Transient Stability Analysis. Int. J. Comput. Electr. Eng. 2013, 5, 297–300. [Google Scholar] [CrossRef]
  3. Shi, Y.; Xu, B.; Wang, D.; Zhang, B. Using Battery Storage for Peak Shaving and Frequency Regulation: Joint Optimization for Superlinear Gains. IEEE Trans. Power Syst. 2017, 33, 2882–2894. [Google Scholar] [CrossRef] [Green Version]
  4. Wong, L.A.; Ramchandaramurthy, V.K.; Taylor, P.; Ekanayake, J.B.; Walker, S.L.; Padmanaban, S. Review on the optimal placement, sizing and control of an energy storage system in the distribution network. J. Energy Storage 2019, 21, 489–540. [Google Scholar] [CrossRef]
  5. Zhao, H.; Wu, Q.; Hu, S.; Xu, S.; Rasmussen, C.N. Review of energy storage system for wind power integration support. Appl. Energy 2015, 137, 545–553. [Google Scholar] [CrossRef]
  6. Garimella, N.; Nair, N.-K.C. Assessment of battery energy storage systems for small-scale renewable energy integration. In Proceedings of the TENCON 2009 IEEE Region 10th Conference, Singapore, 23–26 January 2009; pp. 1–6. [Google Scholar]
  7. Nehrir, M.H.; Wang, C.; Strunz, K.; Aki, H.; Ramakumar, R.; Bing, J.; Miao, Z.; Salameh, Z. A Review of Hybrid Renewable/Alternative Energy Systems for Electric Power Generation: Configurations, Control, and Applications. IEEE Trans. Sustain. Energy 2011, 2, 392–403. [Google Scholar] [CrossRef]
  8. Nikoobakht, A.; Aghaei, J.; Shafie-Khah, M.; Catalao, J.P.S. Assessing Increased Flexibility of Energy Storage and Demand Response to Accommodate a High Penetration of Renewable Energy Sources. IEEE Trans. Sustain. Energy 2019, 10, 659–669. [Google Scholar] [CrossRef]
  9. Yang, Y.; Li, H.; Aichhorn, A.; Zheng, J.; Greenleaf, M. Sizing Strategy of Distributed Battery Storage System With High Penetration of Photovoltaic for Voltage Regulation and Peak Load Shaving. IEEE Trans. Smart Grid 2014, 5, 982–991. [Google Scholar] [CrossRef]
  10. Liu, X.; Aichhorn, A.; Liu, L.; Li, H. Coordinated Control of Distributed Energy Storage System with Tap Changer Transformers for Voltage Rise Mitigation Under High Photovoltaic Penetration. IEEE Trans. Smart Grid 2012, 3, 897–906. [Google Scholar] [CrossRef]
  11. Venu, C.; Riffonneau, Y.; Bacha, S.; Baghzouz, Y. Batterystorage system sizing in distribution feeders with distributed photovoltaic systems. In Proceedings of the 2009 IEEE PwerTech Bucharest, Bucharest, Romania, 9 October 2009. [Google Scholar]
  12. Dharmakeerthi, C.; Mithulananthan, N.; Saha, T. Impact of electric vehicle fast charging on power system voltage stability. Int. J. Electr. Power Energy Syst. 2014, 57, 241–249. [Google Scholar] [CrossRef]
  13. Mello, A.P.C.; Bernardon, D.P.; Pfitscher, L.L.; Canha, L.N.; Garcia, V.J.; Sperandio, M. Reconfiguration of distribution network considering distributed generation and multivariables criteria. In Proceedings of the Power Engineering Conference (UPEC), 2013 48th International Universities, Dublin, Ireland, 2–5 September 2013. [Google Scholar]
  14. Ravindra, H.; Faruque, M.O.; Schoder, K.; Steurer, M.; Mclaren, P.; Meeker, R. Dynamic interactions between distribution net-work voltage regulators for large and distributed PV plants. In Proceedings of the Transmission Distribution Conference Exposition (T&D), Orlando, FL, USA, 7–10 May 2012. [Google Scholar]
  15. Zillmann, M.; Yan, R.; Saha, T.K. Regulation of distribution network voltage using dispersed battery storage systems: A case study of a rural network. In Proceedings of the 2008 IEEE Power and Energy Society General Meeting, Detroit, MI, USA, 24–28 July 2011; pp. 1–8. [Google Scholar]
  16. Chua, K.H.; Lim, Y.S.; Taylor, P.; Morris, S.; Wong, J. Energy Storage System for Mitigating Voltage Unbalance on Low-Voltage Networks With Photovoltaic Systems. IEEE Trans. Power Deliv. 2012, 27, 1783–1790. [Google Scholar] [CrossRef]
  17. Su, W.-F.; Lin, C.-E.; Huang, S. Economic analysis for demand-side hybrid photovoltaic and battery energy storage system. In Proceedings of the Conference Record of the 1999 IEEE Industry Applications Conference, Phoenix, AZ, USA, 3–7 October 1999; Volume 3, pp. 2051–2057. [Google Scholar]
  18. Mercier, P.; Cherkaoui, R.; Oudalov, A. Optimizing a Battery Energy Storage System for Frequency Control Application in an Isolated Power System. IEEE Trans. Power Syst. 2009, 24, 1469–1477. [Google Scholar] [CrossRef]
  19. Oudalov, A.; Chartouni, D.; Ohler, C. Optimizing a Battery Energy Storage System for Primary Frequency Control. IEEE Trans. Power Syst. 2007, 22, 1259–1266. [Google Scholar] [CrossRef]
  20. Serban, I.; Marinescu, C. Battery energy storage system for frequency support in microgrids and with enhanced control features for uninterruptible supply of local loads. Int. J. Electr. Power Energy Syst. 2014, 54, 432–441. [Google Scholar] [CrossRef]
  21. Aditya, S.K.; Das, D. Application of battery energy storage system to load frequency control of an islanded power system. Int. J. Energy Res. 1999, 23, 247–258. [Google Scholar] [CrossRef]
  22. Divya, K.C.; Østergaard, J. Battery energy storage technology for power systems—An overview. Electr. Power Syst. Res. 2009, 79, 511–520. [Google Scholar] [CrossRef]
  23. Konneh, D.; Howlader, H.; Shigenobu, R.; Senjyu, T.; Chakraborty, S.; Krishna, N. A Multi-Criteria Decision Maker for Grid-Connected Hybrid Renewable Energy Systems Selection Using Multi-Objective Particle Swarm Optimization. Sustainability 2019, 11, 1188. [Google Scholar] [CrossRef] [Green Version]
  24. Huang, H.; Nie, S.; Lin, J.; Wang, Y.; Dong, J. Optimization of Peer-to-Peer Power Trading in a Microgrid with Distributed PV and Battery Energy Storage Systems. Sustainability 2020, 12, 923. [Google Scholar] [CrossRef] [Green Version]
  25. Esmin, A.A.; Lambert-Torres, G.; de Souza, Z.A.C. A hybrid particle swarm optimization applied to loss power minimi-zation. IEEE Trans. Power Syst. 2005, 20, 859–866. [Google Scholar] [CrossRef]
  26. Kerdphol, T.; Fuji, K.; Mitani, Y.; Watanabe, M.; Qudaih, Y. Optimization of a battery energy storage system using particle swarm optimization for stand-alone microgrids. Int. J. Electr. Power Energy Syst. 2016, 81, 32–39. [Google Scholar] [CrossRef]
  27. Kongjeen, Y.; Buayai, K.; Kerdchuen, K. Improving voltage of microgrid system based on VAR control strategies by intergrating solar power system. In Proceedings of the International Conference on Power Energy and Innovations (ICPEI 2020), Chiang Mai, Thailand, 14–16 October 2020. [Google Scholar]
  28. Dugan, R.; Montenegro, D. The Open Distribution System Simulator (OpenDSS); California EPRI: Washington, DC, USA, 2020. [Google Scholar]
  29. Kongjeen, Y.; Bhumkittipich, K. Modeling of electric vehicle loads for power flow analysis based on PSAT. In Proceedings of the 2016 13th International Conference on Electrical Engineering/Electronics, Computer, Telecommunications and Information Technology (ECTI-CON), Chiang Mai, Thailand, 28 June–7 July 2016; pp. 1–6. [Google Scholar]
  30. Kongjeen, Y.; Bhumkittipich, K. Impact of Plug-in Electric Vehicles Integrated into Power Distribution System Based on Voltage-Dependent Power Flow Analysis. Energies 2018, 11, 1571. [Google Scholar] [CrossRef] [Green Version]
  31. Dugan, R.C. Reference Guide The Open Distribution System Simulator (OpenDSS). 2018. Available online: epri.com (accessed on 11 September 2021).
  32. Olivella-Rosell, P.; Villafafila-Robles, R.; Sumper, A.; Bergas-Jané, J. Probabilistic Agent-Based Model of Electric Vehicle Charging Demand to Analyze the Impact on Distribution Networks. Energies 2015, 8, 4160–4187. [Google Scholar] [CrossRef]
  33. Kumawat, M.; Gupta, N.; Jain, N.; Bansal, R. Optimally Allocation of Distributed Generators in Three-Phase Unbalanced Distribution Network. Energy Procedia 2017, 142, 749–754. [Google Scholar] [CrossRef]
  34. Jamal, R.; Men, B.; Khan, N.H. A Novel Nature Inspired Meta-Heuristic Optimization Approach of GWO Optimizer for Optimal Reactive Power Dispatch Problems. IEEE Access 2020, 8, 202596–202610. [Google Scholar] [CrossRef]
  35. Wang, M.; Fan, Z.; Zhou, J.; Shi, S. Research on Urban Load Rapid Recovery Strategy Based on Improved Weighted Power Flow Entropy. IEEE Access 2021, 9, 10634–10644. [Google Scholar] [CrossRef]
  36. Gaing, Z.-L. A Particle Swarm Optimization Approach for Optimum Design of PID Controller in AVR System. IEEE Trans. Energy Convers. 2004, 19, 384–391. [Google Scholar] [CrossRef] [Green Version]
Figure 1. Energy storage classification [5].
Symmetry 13 01692 g001
Figure 2. Energy storage background.
Symmetry 13 01692 g002
Figure 3. The structure of a distributed renewable energy system.
Symmetry 13 01692 g003
Figure 4. Voltage magnitude control based on Volt/var control scheme in p.u.
Symmetry 13 01692 g004
Figure 5. Schematic of BESS control and interconnection diagram.
Symmetry 13 01692 g005
Figure 6. Component object model (COM) interface.
Symmetry 13 01692 g006
Figure 7. Flowchart of GA optimization technique.
Symmetry 13 01692 g007
Figure 8. Applying the PSO method for the optimal solution of BESS.
Symmetry 13 01692 g008
Figure 9. Daily load profile.
Symmetry 13 01692 g009
Figure 10. IEEE 30 bus test system.
Symmetry 13 01692 g010
Figure 11. Daily load profile using BESS.
Symmetry 13 01692 g011
Figure 12. Comparisons of the average voltage profiles between the base case (V_Avg_Base Case) and installed GA and PSO (V_Avg_GA, V_Avg_PSO) cases with load profiles.
Symmetry 13 01692 g012
Figure 13. Comparisons of active power.
Symmetry 13 01692 g013
Figure 14. Comparisons of reactive power.
Symmetry 13 01692 g014
Table 1. Parameters for configuration of optimization techniques.
ParametersGAPSO
Population size100100
Generation/Iteration200200
Number of Variables2
v 1 , v 2 -2, 2
Crossover0.8-
Mutation0.05-
Max. and Min. of BESS sizing (kW)1000–70,000
Max. and Min. of BESS location2–30
Table 2. Results for BESS.
Types of Results AvailableBase CaseGAPSO
Max p.u. voltage1.08221.08221.0822
Min p.u. voltage0.99120.991190.9912
Total Active Power (MW)260.965261.243260.965
Total Reactive Power (Mvar)−14.219−14.2094−14.219
Total Active Losses (MW)17.568617.590117.5686
Total Reactive Losses (Mvar)38.926439.000838.9264
Table 3. Results for LVD and TEEL.
ItemComparison Details
LVD (24 h)%TEEL (24 h)
(MW)
%
Base case40,862.380376.7790
GA40,475.97−0.3124.666−7.06
PSO40,733.57−0.9524.611−7.27
Publisher’s Note: MDPI stays neutral with regard to jurisdictional claims in published maps and institutional affiliations.

