1. Introduction
Symmetry is an issue that largely affects artificial neural networks. Symmetry can be found in the structure of the neural network itself; symmetric weight and many other related issues are also in the presented article.
The process of assembling parts into assembly units until the final product is achieved is one of the most important stages of the production process. During the process, specific features characterizing the product are created. This process also makes a major contribution to the product development itself. Planning the assembly process requires a series of analyses, i.e., the separation of assembly units and the determination of the relationships between them. The result of these analyses is the selection of the base parts for the separate assembly units and the specific assembly sequences, which are the basis for estimating assembly difficulties. Product quality and manufacturing costs depend mainly on the product structure; this structure describes the functionally imposed layout and the geometrically possible assembly sequences. It is natural to choose which one allows us to obtain a finished product in the shortest time.
Obtaining the most advantageous technology of assembling parts in given production conditions is an extremely important, multi-criteria and difficult to model task, which is mainly based on determining the assembly sequence plan (ASP) and selecting all the components of the production process, but also applies to balancing the assembly line (ALB). These issues are fundamentally related to the degree of automation of the considered process, but also to the production conditions in a given enterprise. Due to the complexity of the assembly sequence planning problem, its optimization is required in order to obtain an efficient computational approach. The aim is therefore to include the evaluation process and selecting the assembly sequence as early as possible in the product development phase. The high complexity of this process (great number of components) makes it difficult to determine the set of permissible assembly sequences and leads to a phenomenon that is difficult to solve, “combinatorial explosion”; therefore, one of the solutions to this problem is the heuristic approach presented in this publication, where neural networks based on selected DFA rating factors describing assembly sequences allow us to forecast a mechanical assembly time.
The paper, one by one, presents the optimization approach to the problem of assembly sequence generation with the use of heuristic methods, the issues of assembly sequence evaluation criteria and artificial neural networks in an assembly sequence planning problem. The most important part of the work is the concept of the system supporting the determination of the assembly sequence based on artificial neural networks and DFA rating factors for manual mechanical assembly.
2. Optimization Approach
Bio-inspired algorithms are quite modern, increasingly used, and efficient tools for the industry. However, from a mathematical point of view, these problems belong to the most general of non-linear optimization problems, where these tools cannot guarantee that the best solution will be found. The numerical cost and the accuracy of these algorithms depend, among others, “on the initialization of their internal parameters which may themselves be the subject of parameter tuning according to the application” [
1].
In the literature on the subject, various optimization algorithms are proposed to optimize the ASP problem. The most common classes of algorithms used to optimize ASP are meta-heuristic approaches. The meta-heuristic algorithm provides a solution framework to optimize different optimization problems with relatively few modifications to adapt them to a specific problem and limits the general computation time. This approach turns out to be, in many cases, sufficient due to the quality of the obtained results at appropriate costs in such a multi-criteria task as assembly sequence planning, where the set of feasible solutions to be analyzed is large [
2,
3,
4].
Studies on ASP have implemented different heuristic optimization algorithms, such as genetic algorithm (GA) [
5,
6,
7]. The authors of [
6] presented the application of genetic algorithms (GA) and the ant colony algorithm (ACO), using the example of reflector antenna assembly. The accurate simulation of the assembly was required to evaluate and optimize the ASP. The initial population was created by ACO and optimized by GA operators to generate an optimal solution. By releasing the information on the optimal solution to the ant search paths of ACO, convergence towards a globally optimal solution was accelerated. A model of the finite element simulation was used to simulate the dynamic assembly process of the reflectors according to the algorithm results of the proposed approach, which can improve the quality of the optimal solution and reduce the probability of finding a local optimal solution.
Another method based on a genetic algorithm [
7] was used in the process of planning the assembly sequence for satellites in the space industry. This method takes into account a process with a large number of connections in a multi-stage and parallel assembly. Priority relationships are established between the assembly units, and the assembly sequence is represented by a directed acyclic graph. Original, a two-part crossover and mutation operators for assembling sequence were proposed.
Another approach to generate acceptable assembly sequences is an algorithm based on a simulated annealing (SA) process [
8,
9]. The method is derived from an analogy with thermodynamics, and more specifically, with how a liquid solidifies to form a crystal structure. In [
8], the authors proposed a novel method under the name of genetic simulated annealing algorithm (GSAA) and ant colony optimization (ACO) algorithm for assembly sequence planning (ASP), which assist the planner in generating an effective assembly sequence with respect to a large constraint assembly perplexity.
The ant colony optimization (ACO) algorithm was also presented in [
6,
8,
10,
11,
12]. In [
12], an improved ASP-oriented ant colony algorithm was proposed in order to achieve an optimal or close to optimal assembly sequence. In this algorithm, the assembly operation constraint is introduced into the state transfer function as heuristic information, while the feasible transition area is set up by obtaining assembly relationships of the components. In addition, a dynamic change in pheromone trail persistence was also used.
Evolutionary algorithms (EA) for connector-based assembly sequence planning were also analyzed [
13], but they generated many erroneous searches and it was necessary to build a multi-agent connector-based evolution algorithm. Competition, crossover-mutation and learning were designed as the behaviors of agents that locate a lattice-like structure environment. The presented metaheuristic algorithms are highly efficient and seem to be interesting tools in solving ASP problems.
In [
14], the authors proposed a three-stage integrated approach with some heuristic working rules to assist the planner in generating an effective assembly sequence. In this work, the back-propagation neural network (NN) was employed to optimize the available assembly sequence.
The results show that the proposed model can facilitate assembly sequence optimization and allows the designer to recognize the contact relationship and assembly constraints of three-dimensional components.
Other approaches to this problem were presented of the basis of immune algorithm (IA) [
15,
16], scatter search algorithm (SSA) [
17], particle swarm optimization (PSO) [
15] and other heuristic methods (HM) [
4,
18,
19,
20].
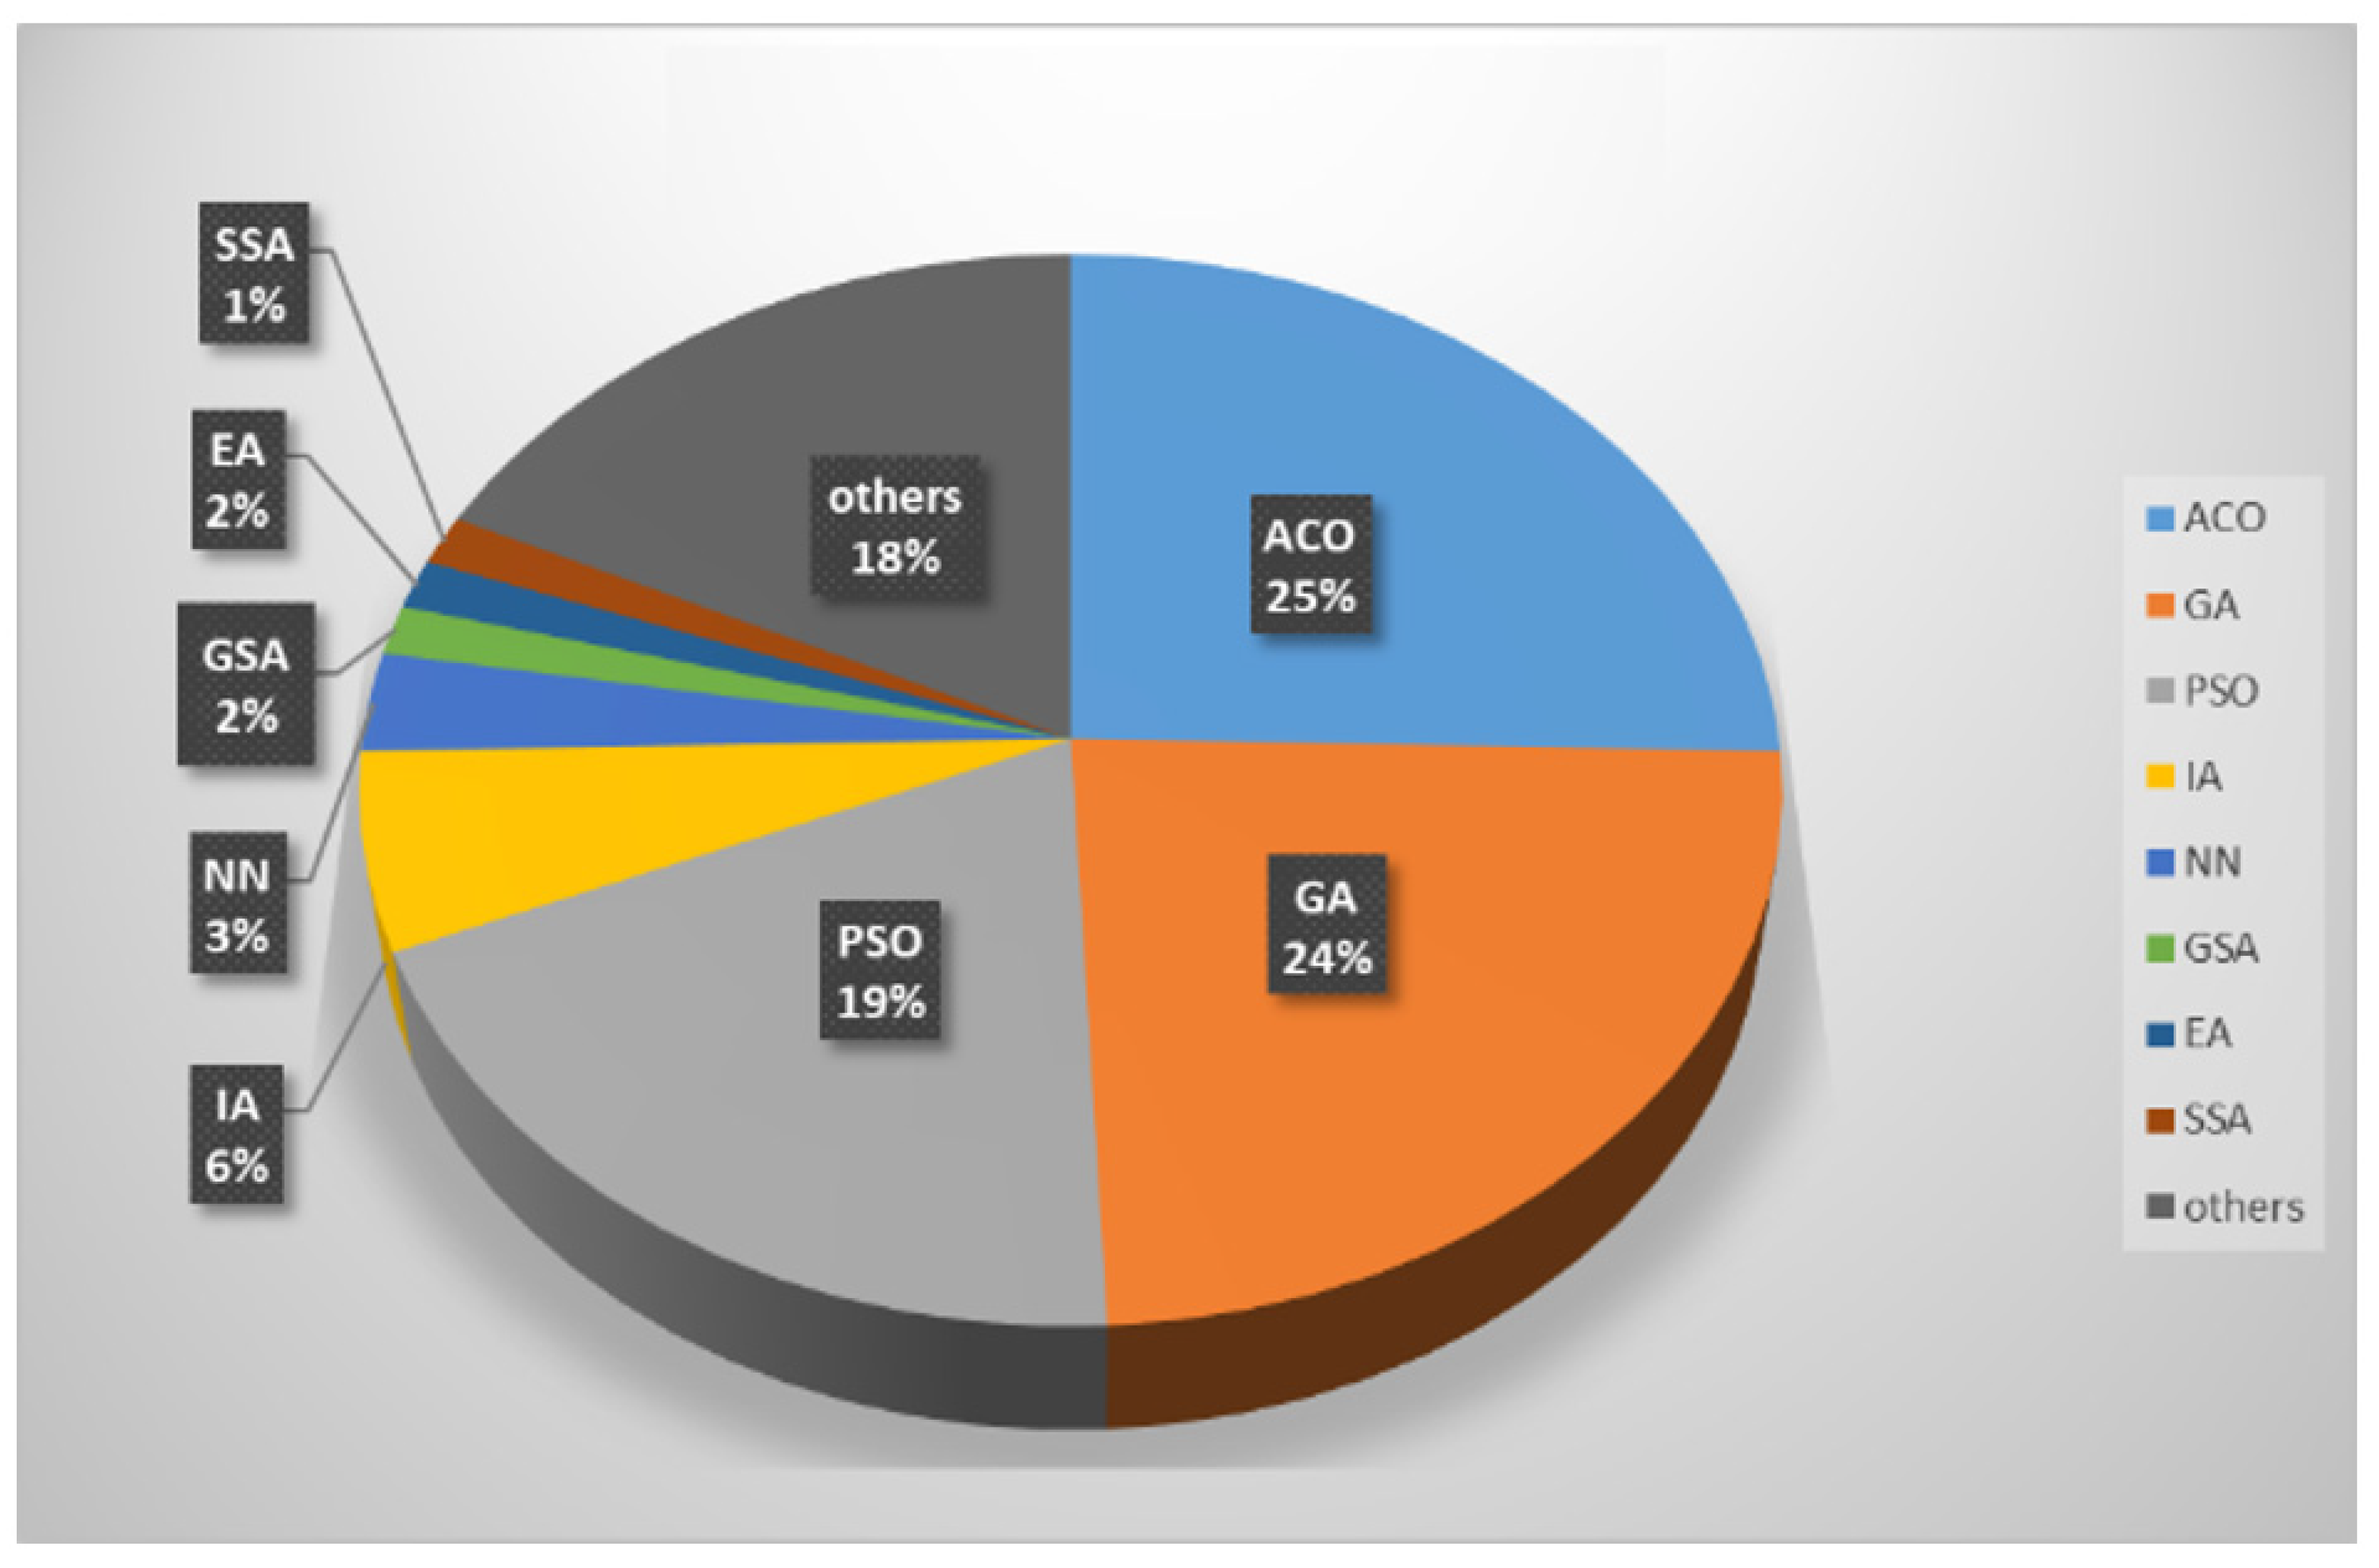
Figure 1 shows the published research on optimization ASP from analyzed articles and conference papers from the last twenty years based on the Google Scholar database.
2.1. Assembly Sequence Assessment Criteria
The planning of assembly sequences (ASP) consists of determining the feasible and, at the same time, the most advantageous order of joining assembly units due to certain criteria. The great complexity of the task of selecting the appropriate one from among all the acceptable and, at the same time, feasible ones, due to the constraints of the structural nature of the assembly sequence, is a consequence of the large number of possible combinations. It is, therefore, necessary, in the first stage, to limit the set of possible solutions, and then to evaluate them and select the most advantageous assembly sequence. This is inextricably linked with the use of certain criteria for this purpose, due to which the discussed process can be optimized. It is very often necessary to assign appropriate priorities/weights to the criteria used for the assessment that are tailored to the specific assembly process. In the literature on the subject, the assessment and selection of the most favorable sequence can be made according to various criteria, depending on the specifics of a process in the plant where the assembly takes place. Such criteria may be: the assembly time, the number of changes in the assembly directions, the number of tool changes, the stability of the assembly states that arise, the degree of difficulty in reaching the next process state, the complexity of the assembly unit movements, the correctness of the assembly itself or even the cost-effectiveness of the process. Selected data on the criteria for evaluating assembly sequences can be obtained automatically from the electronic construction documentation or supplemented on the basis of a case-by-case analysis.
2.2. Assembly Sequence Assessment Criteria Based on DFA Rating Factors
Design For Assembly (DFA) is one of the methodologies supporting the design of the assembly process. By introducing design changes, in line with the guidelines of the DFA methodology, we can achieve, above all, shorter assembly times, by reducing unnecessary components and the assembly tasks necessary to assemble the product. DFA analysis also highlights the possible weak points of the structure and helps to create a product that does not require major changes in further phases of the product lifecycle. Thanks to the introduction of DFA to the design process, the product development team proposes improved design solutions that are characterized by better indicators, such as a simple structure, which directly simplifies the assembly operations. The benefits of using this methodology are mainly due to the systematic review of functional requirements and the replacement of groups of elements by single integrated units–assembly modules. Generally, the designer carries out the presented analyses in a series of assessment charts. Next, the designer assesses the component functionality, manufacturing processes, form and assembly characteristics using values extracted from the charts according to component properties. Thus, the designer can quantify the suitability of the design. The best known DFA methods are the Boothroyd–Dewhurst System, the Lucas DFA Methodology and the Hitachi Assembly Ability Evaluation Method [
21,
22,
23]. The method proposed in this article was based on assembly sequence determination using artificial neural networks. It is related to manual assembly and is largely based on the assessment of transitions between individual assembly states using a score taken from the following DFA rating factors charts (these data are used to train the neural network):
The stability of the assembly unit (
Table 1).
The stability criterion determines the assembly sequences with the fewest unstable states. A stable unit is one that remains in the assembled position regardless of the force applied. The acting forces can be the force of gravity or the force associated with the movement of the part/assembly.
This is the criterion of the ability to move and orientate. Handling difficulties from the Boothroyd–Dewhurst table are rated from “easy to deliver and orientate—9” to “Requires gripping tools—0”. Details of the assessment are given in
Table 2.
The ease of connection criterion evaluates whether the part is easy to grasp and assemble in a given process state (
Table 3).
The accessibility of the joining location index (
Table 4).
The accessibility determines whether it is sufficient to secure the part. Accessibility depends on the location of the parts in the product or its subassembly.
3. Artificial Neural Networks in Assembly Sequence Planning Problem
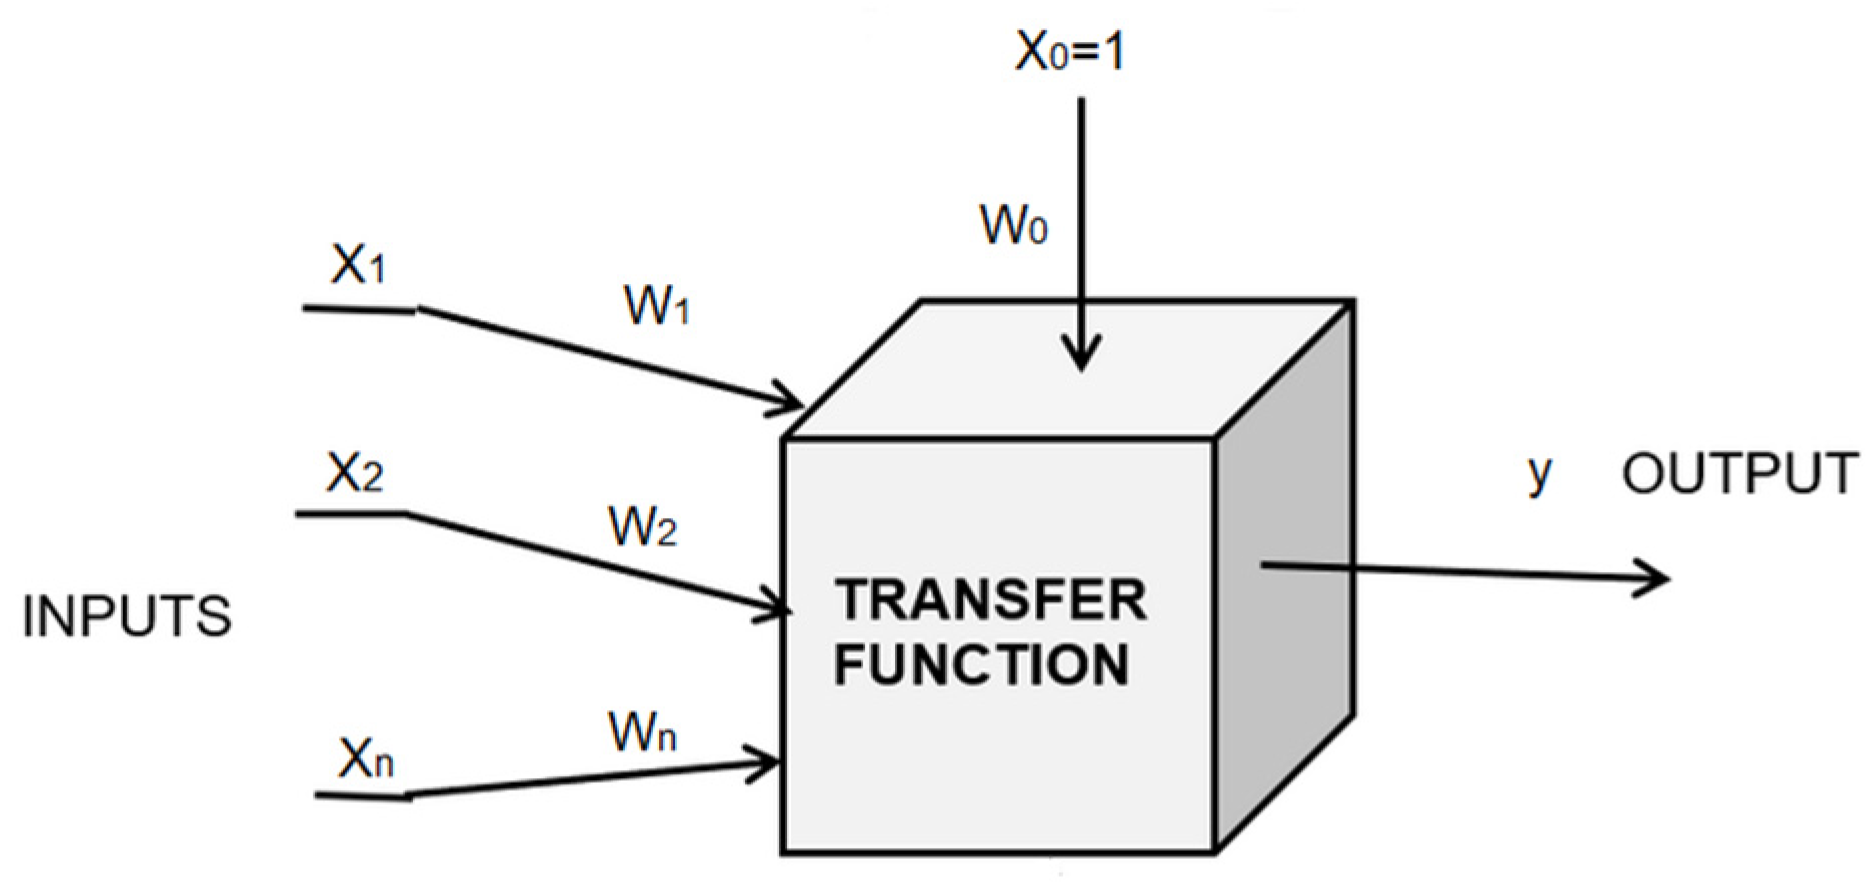
An assembly sequence planning problem belongs to a class of optimization problems known as NP-complete. For such a class of problems, in order to find an optimal solution with regard to specific criteria, it is necessary to search the entire set of feasible solutions to ensure finding the optimal assembly sequence. With high complexity and the interdisciplinary nature of assembly problems, this strategy is very time-consuming and not practical in most industrial applications. For this reason, other heuristic techniques are often used in this case, allowing to find a solution that is close to the optimal one. The authors of this paper proposed a new approach to the problem of planning the assembly sequences. For this purpose, they used artificial neural networks to predict the assembly time determined by the assessment of transitions between its individual states according to the selected DFA criteria. This solution is an information-processing model inspired by a natural biological system, in which the interconnected processing elements (neurons) x
n perform an input operation that will ultimately solve the problem of assessing the assembly sequence, whose optimization criterion comes down to determining the assembly time. Neurons are associated with synapses that are assigned weights with specific values, wk. Additionally, the intercept w
0–bias is defined as the sensitivity threshold. A neuron is in an active state when the sum of the weighted input signals is greater than or equal to the sensitivity threshold w0. The vector of input data introduced into the network is multiplied by the synaptic weights according to the function of the postsynaptic potential to obtain the signal y, which is the output value of the network.
Figure 2 shows the model of signal processing between neurons. The artificial neural network processes information by activating the neurons of the hidden and output layers with activation functions (transfer functions). The literature gives the highest efficiency of the logistic, exponential, linear, sine and hyperbolic tangent functions, which were used in the prediction model developed in this publication.
4. The Concept of the System Supporting the Determination of the Assembly Sequence Based on Artificial Neural Networks and DFA Rating Factors for Manual Assembly
The proposed method was based on artificial neural networks and selected DFA rating factors and aimed to assist in determining the order of manual assembly. It was assumed that, at the current stage of research, it is used in a specific mechanical production company, where the conditions of the assembly process are relatively constant for the introduced new products, which undergo the ASP process, and the assembly processes carried out in it were used to teach the network. Such a system, together with an increase in the number of analyzed assembly processes, improves the efficiency of new process time estimation. The stability of the conditions are related to a specific production company and its concerns, for example, the available machine park, production organization, process control and control, and the level of training of employees (these are constant elements for the network). As input data for the process, the previously discussed assessments of transition between individual assembly states were used based on selected DFA rating factors. The operation of the method is, therefore, aimed at estimating the time for all sequences permissible due to the constraints of a constructional nature (feasible), and thus enables the selection of the most favorable one, due to the analyzed criteria in relation to a specific assembly process.
4.1. Product Structure
The modified directed assembly state graph was adopted as the structure of the product intended for assembly. The parts in this digraph (or assembled assemblies) are marked as vertices, while the directed edges show possible sequences (paths) of joining them. It was assumed that the assembly of successive elements takes place by attaching to the n-th grade assembly a part or subassembly consisting of more parts (treated as a single assembled part). The directed edges in the digraph connecting the vertices contain information based on the assessment criteria (based on the DFA rating factors) for a specific transition between assembly states. The described digraph can be generated automatically on the basis of a CAD assembly drawing. The basis for carrying out the ASP, due to the specific criteria for a specific assembly process, is to obtain a set of all allowed and feasible assembly sequences. The matrix notation (e.g., in the form of a matrix of assembly states or a matrix of an assembly graph) of assembly units enables the determination of all variants of the order of joining assembly units using an appropriate algorithm (this procedure is not discussed in this paper, but comes down to finding all paths in the digraph leading from the vertex starting xs, constituting the base part, to the end vertex x
e, i.e., the last state of the already assembled product—x
s,…, x
e) [
23,
24,
25,
26,
27].
4.2. Assumptions of the Neural Network
In order to develop a predictive model for the evaluation of the assembly sequence, a set of data to teach the neural network was prepared, including input and output data. The input data were related to the DFA assessment criteria, which were divided into four groups: stability, the ability to change the orientation of the assembly unit, the ease of joining parts, and space availability during the connection process. The assembly time was included in the group of output data. The collection of an appropriate number of training data and the links between them was made. The numerical data entered into the network were normalized using the min–max function to values ranging from 0 to 1, according to the linear transformation, in order to ensure their uniformity and the compatibility between the variables in the process of signal processing by the neural network. For the assembly time prediction task, the network model with the best efficiency was selected, which was obtained by empirically testing its various parameters: the number of hidden neurons, the activation function and the network-learning algorithm. The neurons in the hidden layers process the signals from the input neurons and transform them into intermediate data that are then passed on to the output neuron. Hidden neurons allow for modeling complex relationships between data, and their number should be selected so that the structure of the network is not so extensive, while ensuring correct data processing. The network model takes into account the presence of an additional neuron with a value of +1, which is a generator of an artificial neuron causing neuron polarization and, as a result, improving the stability of the network in the process of learning it. The functions of neuron activation in the hidden and output layers, which were used in modeling the structure of the neural network, are shown in
Table 5.
The following algorithms were used to train the neural network: steepest descent, gradient scaling and Broyden–Fletcher–Goldfarb–Shanno. The principle of their operation boils down to minimizing the error function as a result of an iterative change of weights describing the neurons. The steepest descent method consists of finding the minimum of the error function in a given search direction until it turns out to be tangential to a certain line defining the constant value of the objective function. Successive directions of the search for the optimum of a function are orthogonal to the previous ones. The gradient scaling method does not require so many directions of searching for the minimum function. It consists of finding the correct direction on the multidimensional parabolic-shaped error surface on which the straight line is drawn and the minimum of the function for all points on the straight line is determined. Finding a minimum along a given direction results in determining a new search direction from that point. Repeating the process continues until the minimum of the function is found, according to the implementation of the constant shift towards decreasing values of the error function. The second derivative of the function in the following steps of the algorithm is zero. Maintaining this value is possible due to the existence of directions coupled with the previously selected directions. The Broyden–Fletcher–Goldfarb–Shanno method consists of changing the weights of individual neurons after each iteration of the algorithm as a result of taking into account the average error gradient. The search for the minimum error function is carried out by the steepest slope method, and then by the inverse estimation of the matrix of the second-order partial derivatives (Hessian). The division of the examples introduced into the network (input and output data) into training, testing and verification subsets also influences the achievement of the expected network results. Sufficient data should be provided for each of these subsets: (1) To understand the relationship between the data and learn to adapt to changing conditions. Cases from this set affect the change of other network parameters, e.g., the weight values assigned to individual neurons. (2) To check the results obtained by the network and the ability to generalize. Cases from this set are not used to modify network parameters. (3) To verify the network results on the basis of quantitative or qualitative datasets that were not used before. The selection of the best parameters of the artificial neural network was made on the basis of the correlation coefficient determining the effectiveness of the learning and testing process as well as the interpretation of the standard error function—the sum of the squared differences between the set values and those obtained in the output neuron:
where
n is the number of datasets teaching the neural network;
yi is the expected value in the output neuron; and
𝑦𝑖∗ is the actual value in the output neuron.
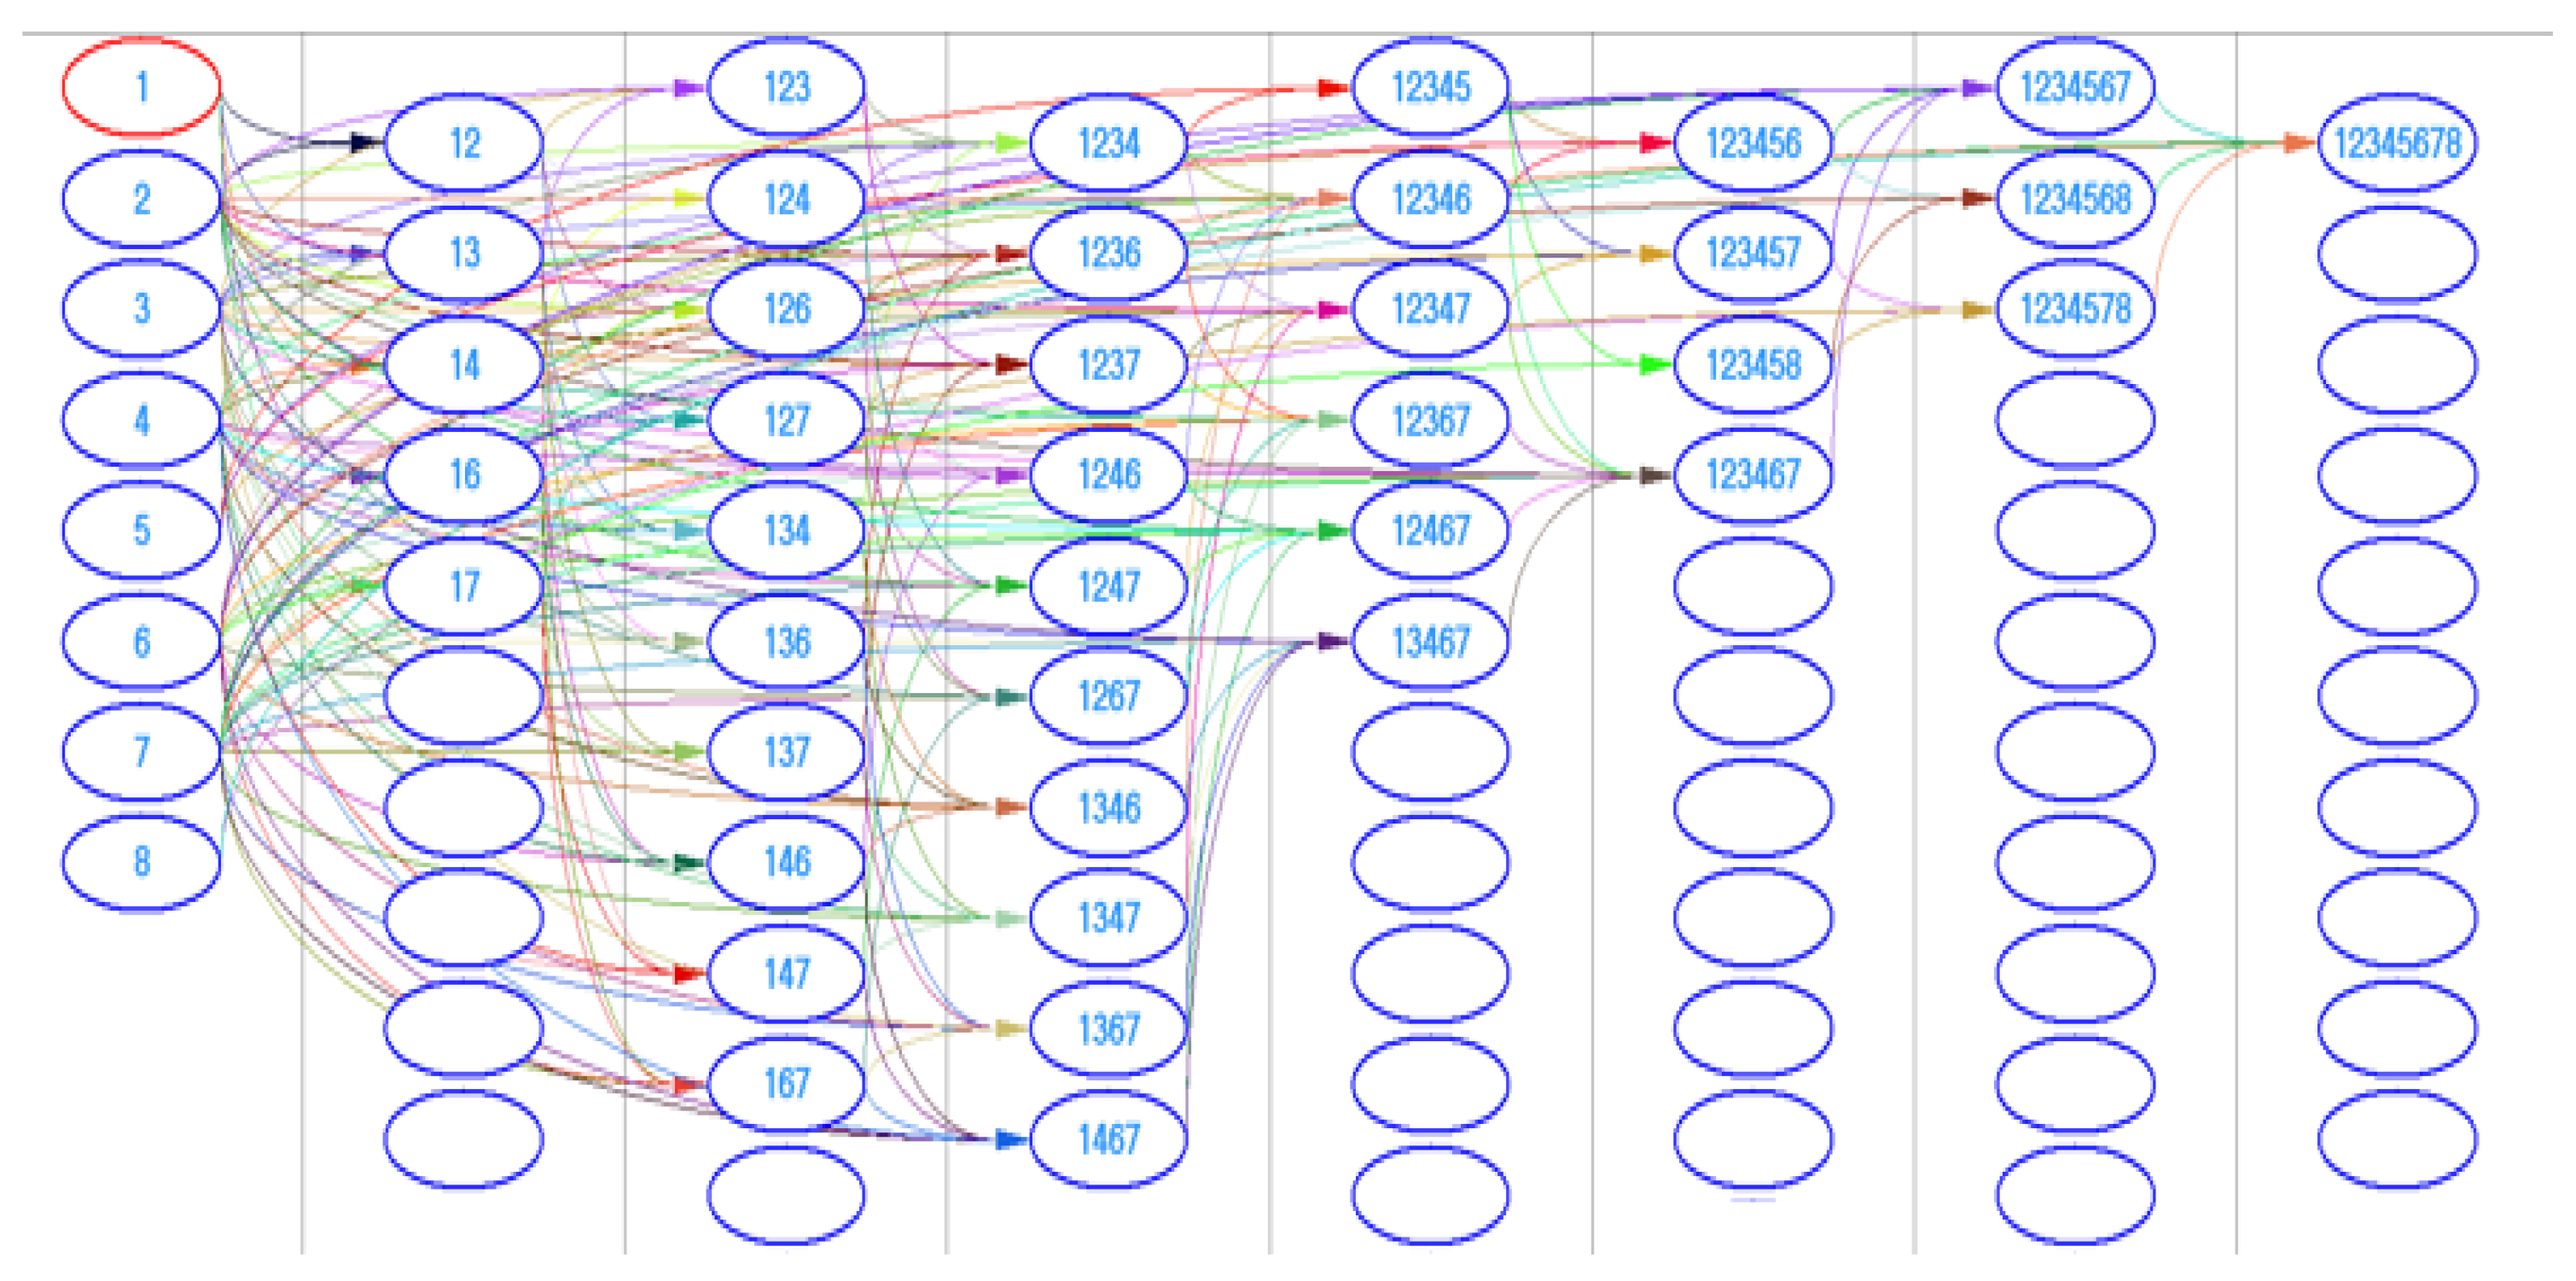
5. Example of Determining the Assembly Sequence
An example of determining the assembly sequence using artificial neural networks was made for a tractor door, consisting of 8 main assembly units such as: door–welded structure (part no. 1), lock (part no. 2), cassette lock (part no. 3), door reinforcement bar with passenger’s handle (part no. 4), lock cover (part no. 5), door seal (part no. 6), lower glass (part no. 7) and upper glass (part no. 8). Next, the basic part from which the assembly begins was assumed (door–welded structure, part no. 1). It was assumed that the assembly of the next units takes place by adding another assembly unit to the assembly state of the n-th stage. Then, the digraph and state matrix of the structural limitations of the assembly were built (shown in
Figure 3). Then, using the selected graph-searching algorithm (Dijkstry), all feasible (due to the constraints of the structural nature) assembly sequences were determined, which constitute the basis for further analysis.
The neural network model for planning the assembly sequence was selected on the basis of a multiple sampling algorithm that randomly presents 20,000 network variants with variable parameters:
The number of neurons in the hidden layer (from 1 to 15);
Values of the weights of individual neurons in the network (from −1 to +1);
Activation functions (linear, sigmoidal, exponential, hyperbolic tangent and sine);
Network learning algorithms (steepest gradient, scaled conjugate gradient and Broyden–Fletcher–Goldfarb–Shanno).
The constant parameters of the neural network are:
The number of input neurons (4)—the groups of DFA assessment criteria (stability, the possibility of changing the orientation of the assembly unit, ease of joining parts and space availability during the connection process);
The number of output neurons (1)—assembly time;
The division of the dataset entered into the neural network—70% training data, 15% testing data and 15% verification data;
The type of predictive model—regression;
The topography of the neural network—multilayer perceptron.
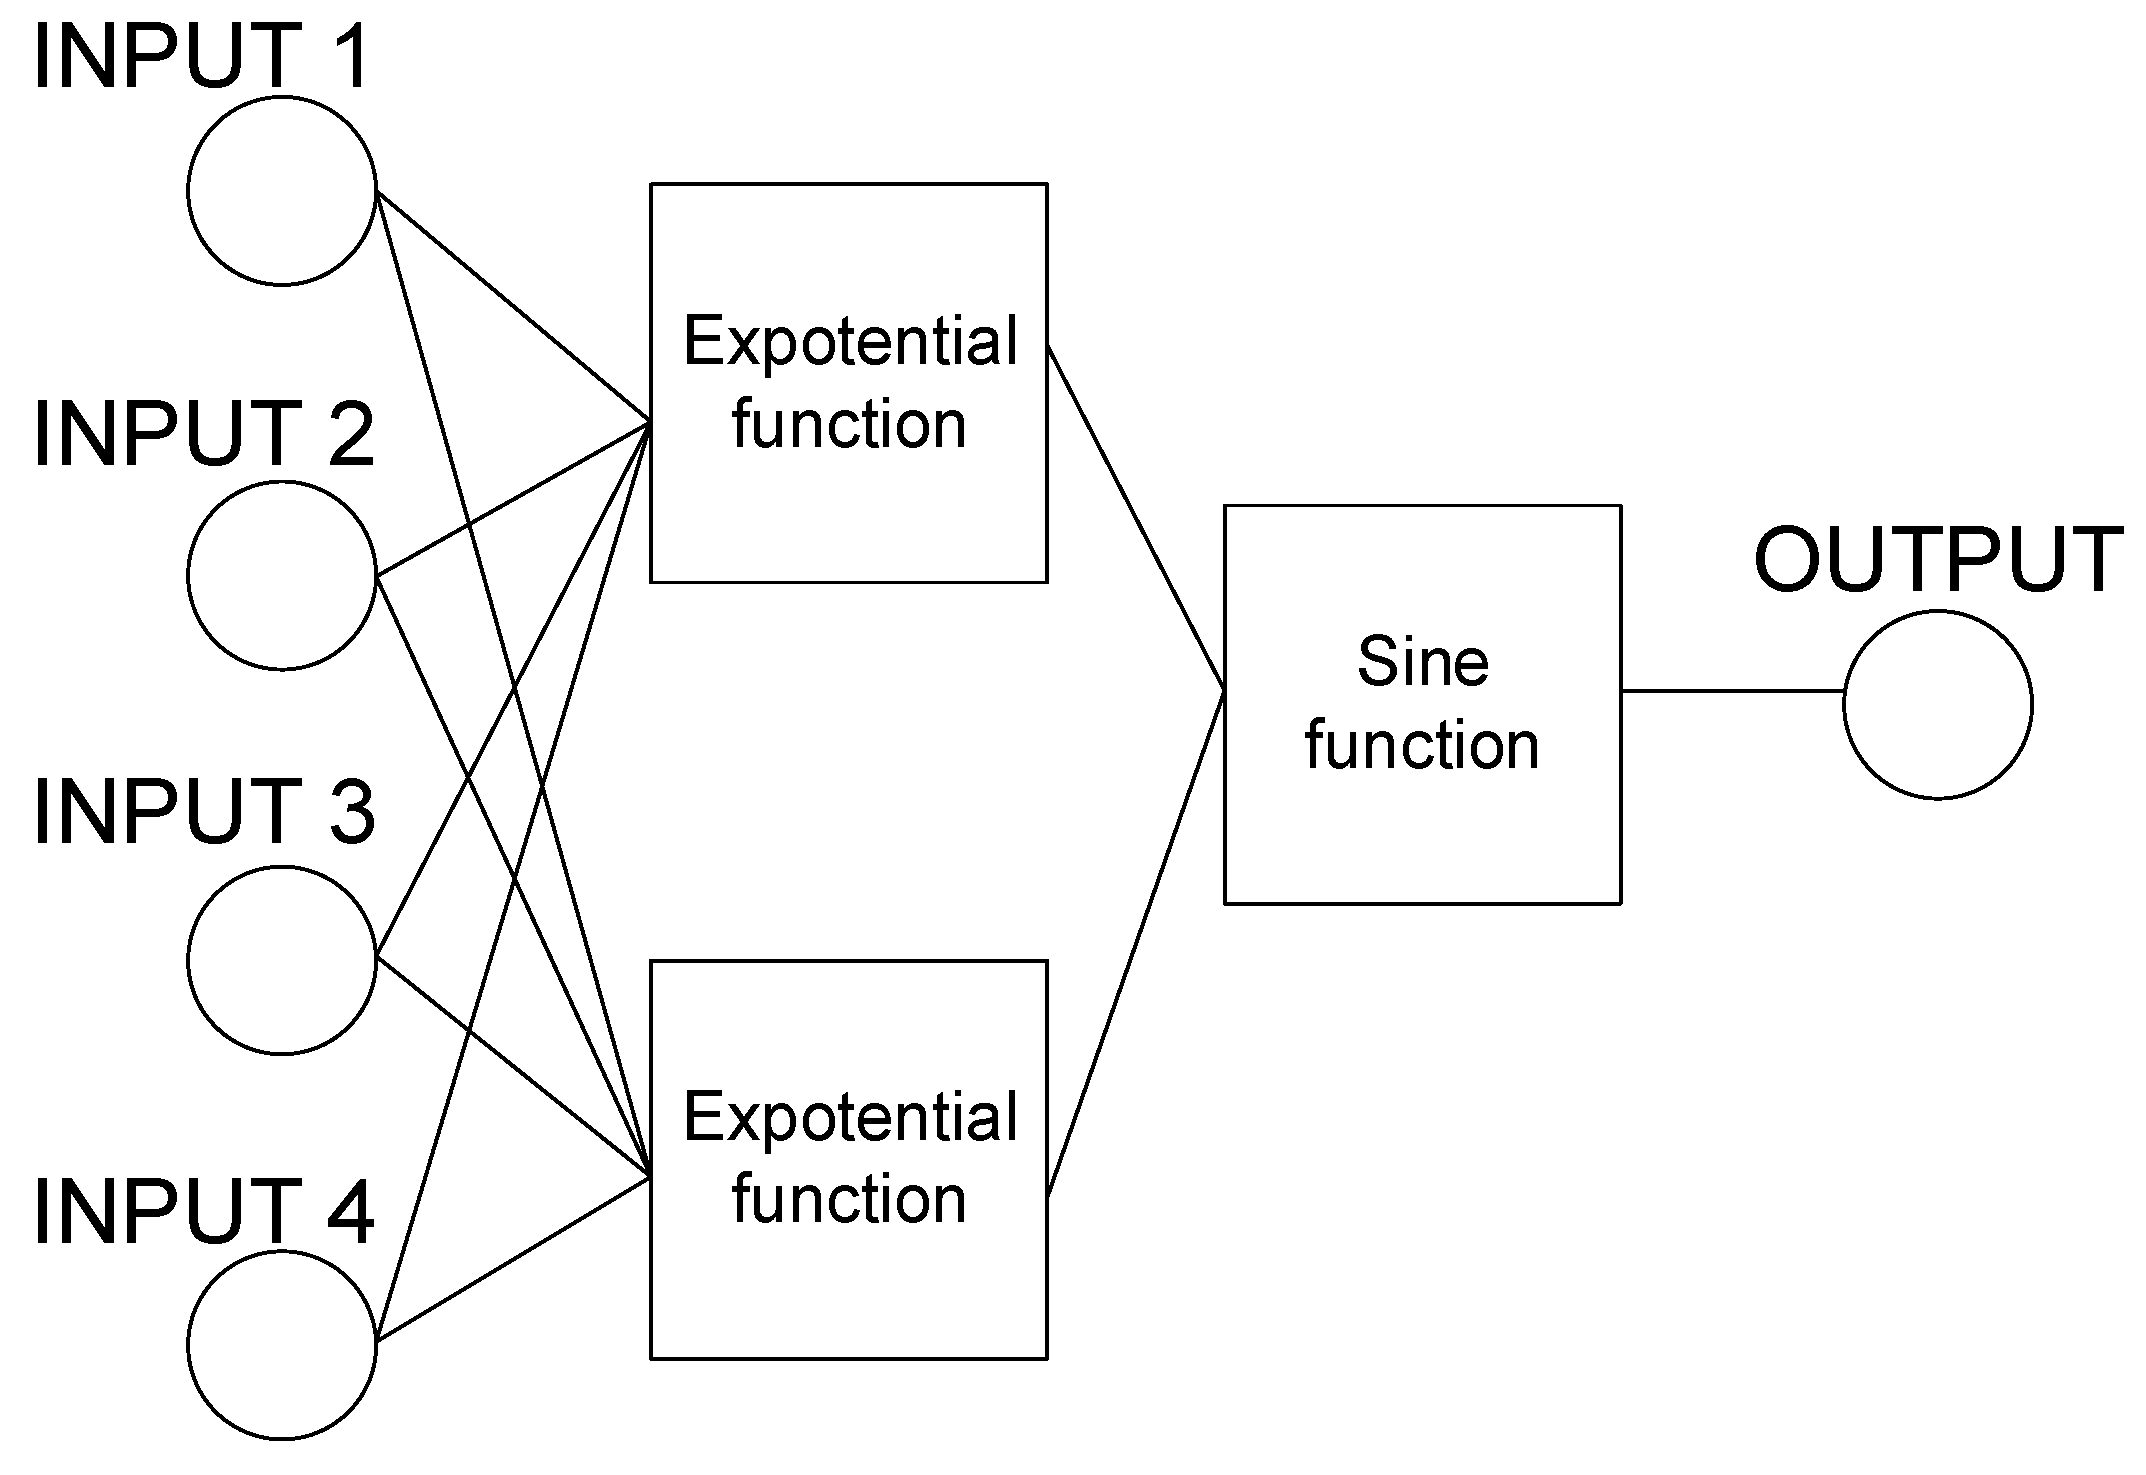
The neural network with the best parameters, confirmed by the highest correlation coefficient in the group of test and verification data, is given in
Table 6. The model of the MLP 4–2–1 network structure is shown in
Figure 4. The network selected for subsequent research consists of four input neurons, two hidden neurons and one output neuron. The Broyden–Fletcher–Goldfarb–Shanno algorithm was used for the network learning process, and the neurons in the hidden layer were activated with the exponential function and the output with the sine function. These network parameters made it possible to observe a strong correlation between the data, with the highest coefficient in the verification group R
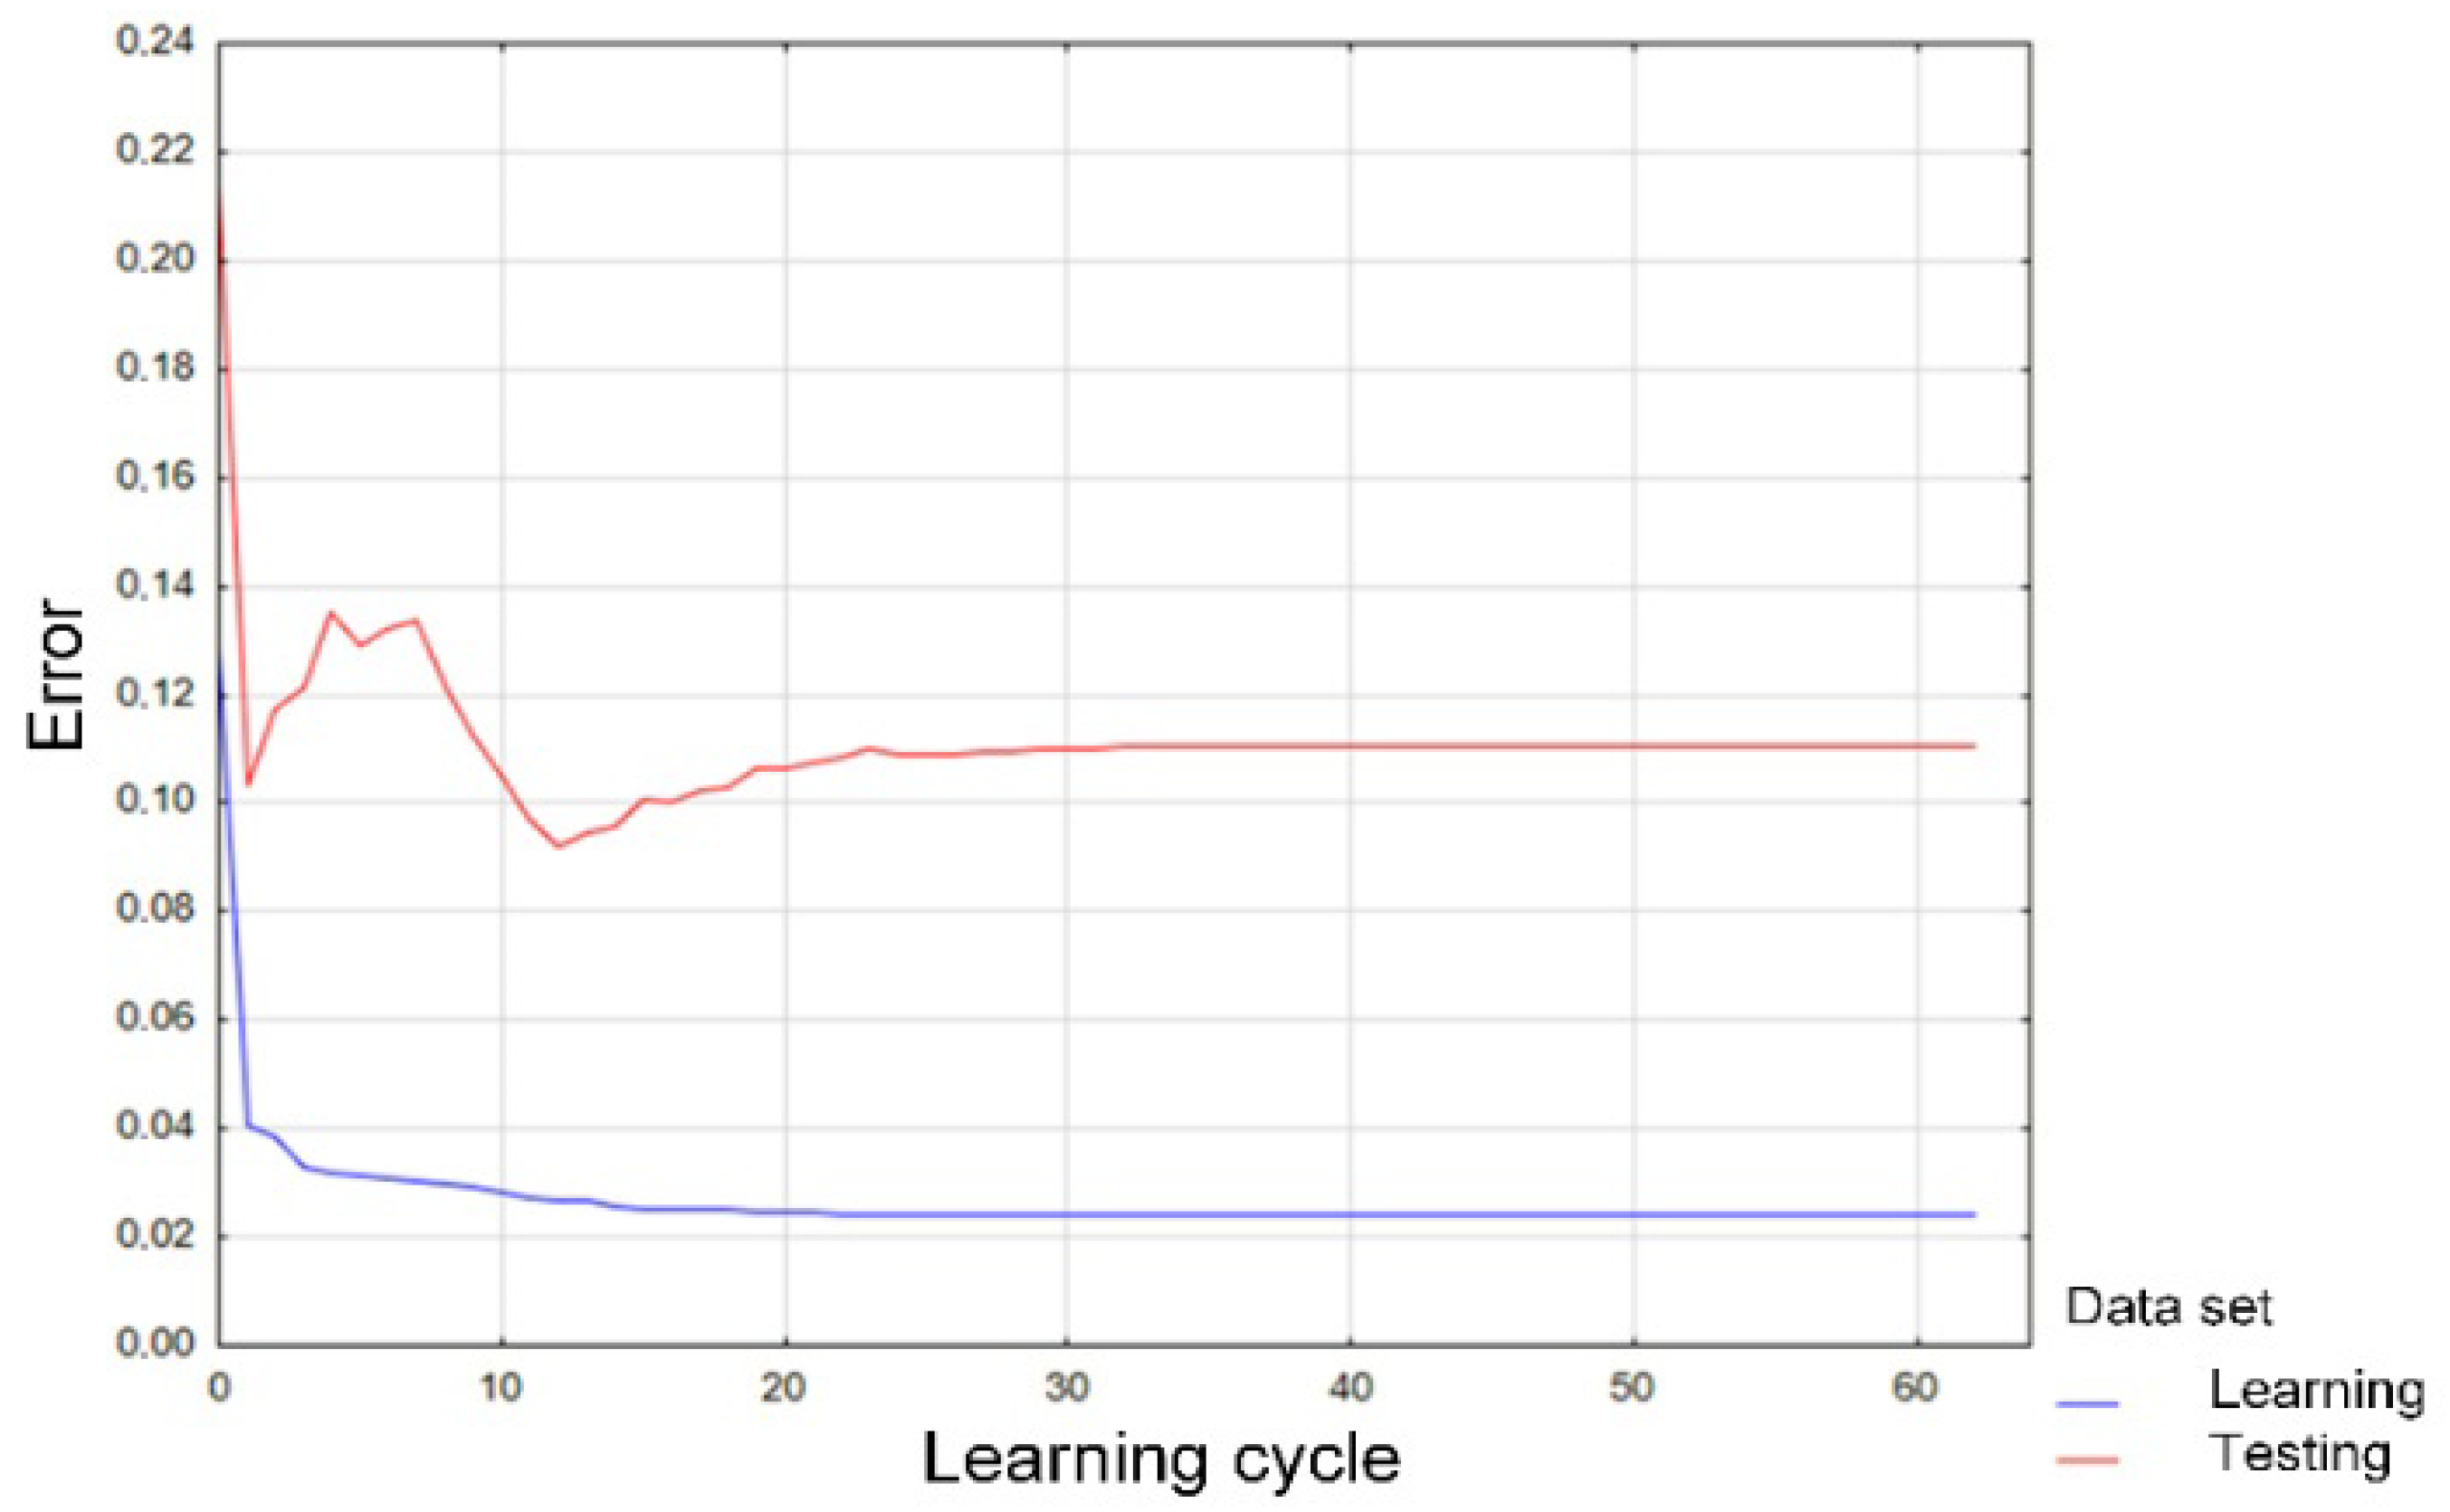
2 > 0.9 and the smallest SOS error < 0.1. This group is the most important, concerns data not included in the earlier stages of the analysis and presents the results of the predictions most reliably.
The minimum of the error function was found in the successive network training cycles. For the MLP 4–2–1 network, the optimum of the function was found in the 12th epoch in which the stabilization of the error value was noticeable.
Figure 5 shows a graph of the dependence of the network error value on the number of iterations of the training algorithm.
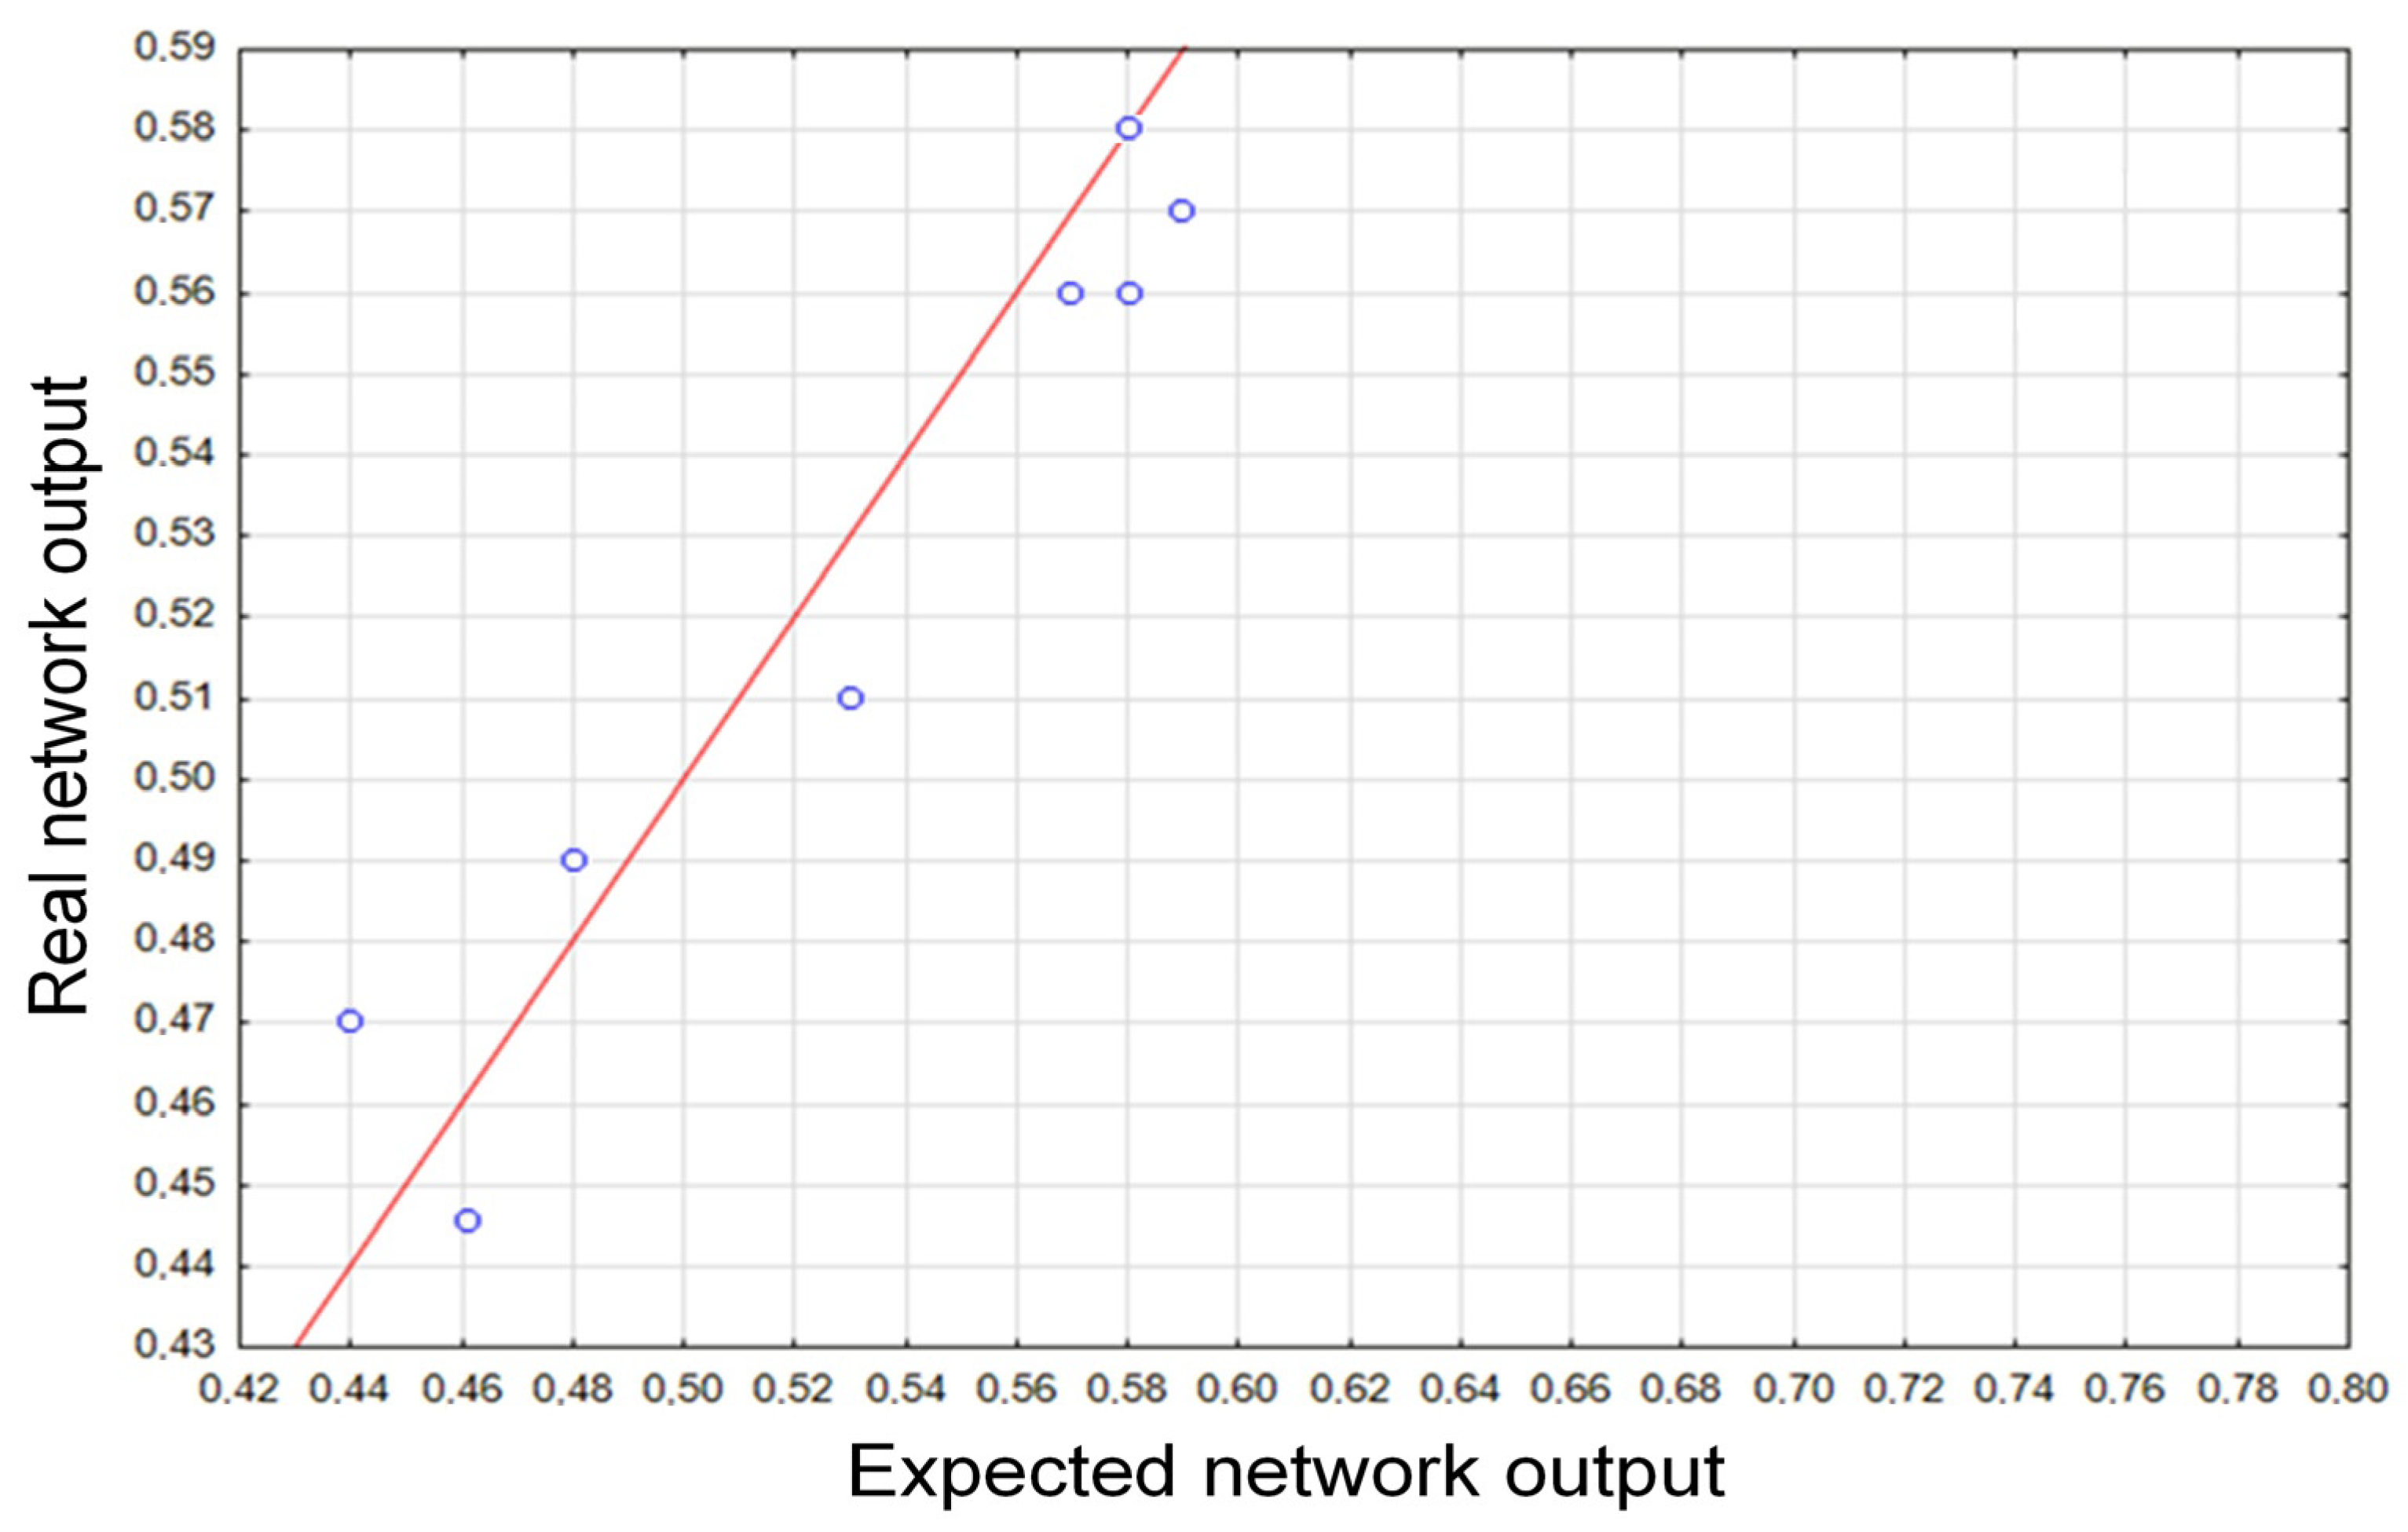
The application of the proposed solution requires the verification of the actual data obtained at the network output with the expected data, which are summarized in
Table 7, while the linear regression charts for these data are shown in
Figure 6.
6. Conclusions
The developed model of the artificial neural network supporting the assembly sequence planning was positively verified using data not included in the training algorithm. The prediction results are characterized by good correlation coefficients R2 > 0.9 for the group of verification data and an SOS error < 0.1. The predictive model presented in this publication is the beginning of work on the development of a universal tool for assessing the assembly sequence of various products, and thus obtaining a finished product in the shortest possible time. The use of the part DFA methodology to evaluate assembly sequences, which are the basis for network learning, is a novelty in this research area.
The effectiveness of the method depends mainly on the number of cases teaching the neural network that are able to generalize the knowledge and the neural network. Thus, a network constraint may be the presence of a large number of errors when predicting the assembly time on the base of DFA factors for other products.
The simulation results also suggest that the proposed neural predictor could be used as a predictor for assembly sequence planning system. Further research will be aimed at extending the learning dataset and verifying the assumptions of the network model made for other products in a specific industrial plant.
The aim of the authors is to develop the conducted research and verify the operation of the network on a wide range of products.
Author Contributions
Conceptualization, M.S. (Marcin Suszyński); methodology, M.S. (Marcin Suszyński) and K.P.; software, M.S. (Marcin Suszyński) and K.P.; validation, M.S. (Marcin Suszyński) and K.P.; formal analysis, M.S. (Marcin Suszyński) and K.P.; investigation, M.S. (Marcin Suszyński) and K.P.; resources, M.S. (Marcin Suszyński) and K.P.; data curation, M.S. (Marcin Suszyński); writing—original draft preparation, M.S. (Marcin Suszyński) and K.P.; writing—review and editing, M.S. (Marcin Suszyński) and K.P.; visualization, M.S. (Marcin Suszyński) and K.P.; supervision, M.S. (Marcin Suszyński); project administration, M.S. (Marcin Suszyński) and K.P.; funding acquisition; M.S. (Martin Svoboda) and V.Č.; validation, M.S. (Martin Svoboda) and V.Č.; review and editing. All authors have read and agreed to the published version of the manuscript.
Funding
This work was supported by the Ministry of Science and Higher Education of Poland (No. 0614/SBAD/1547).
Conflicts of Interest
The authors declare no conflict of interest.
References
- Orosz, T.; Rassõlkin, A.; Kallaste, A.; Arsénio, P.; Pánek, D.; Kaska, J.; Karban, P. Robust Design Optimization and Emerging Technologies for Electrical Machines: Challenges and Open Problems. Appl. Sci. 2020, 10, 6653. [Google Scholar] [CrossRef]
- Selvanayaki, K.; Kalugasalam, P. Intelligent brain tumor tissue segmentation from magnetic resonance image (mri) using meta heuristic algorithms. J. Glob. Res. Comput. Sci. 2013, 4, 13–20. [Google Scholar]
- Ibrahim, I.; Ibrahim, Z.; Ahmad, H.; Jusof, M.F.M.; Yusof, Z.M.; Nawawi, S.W.; Mubin, M. An assembly sequence planning approach with a rule-based multi-state gravitational search algorithm. Int. J. Adv. Manuf. Technol. 2015, 79, 1363–1376. [Google Scholar] [CrossRef] [Green Version]
- Abdullah, M.A.; Rashid, M.F.F.A.; Ghazalli, Z. Optimization of Assembly Sequence Planning Using Soft Computing Approaches: A Review. Arch. Comput. Methods Eng. 2019, 26, 461–474. [Google Scholar] [CrossRef]
- Chen, S.-F.; Liu, Y.-J. An adaptive genetic assembly-sequence planner. Int. J. Comput. Integr. Manuf. 2001, 14, 489–500. [Google Scholar] [CrossRef]
- Wang, D.; Shao, X.; Liu, S. Assembly sequence planning for reflector panels based on genetic algorithm and ant colony optimization. Int. J. Adv. Manuf. Technol. 2017, 91, 987–997. [Google Scholar] [CrossRef]
- Li, X.; Shang, J.; Cao, Y. An efficient method of automatic assembly sequence planning for aerospace industry based on genetic algorithm. Int. J. Adv. Manuf. Technol. 2017, 90, 1307–1315. [Google Scholar]
- Shan, H.; Zhou, S.; Sun, Z. Research on assembly sequence planning based on genetic simulated annealing algorithm and ant colony optimization algorithm. Assem. Autom. 2009, 29, 249–256. [Google Scholar] [CrossRef]
- Murali, G.B.; Deepak, B.B.V.L.; Bahubalendruni, M.V.A.R.; Biswal, B.B. Optimal Assembly Sequence Planning Towards Design for Assembly Using Simulated Annealing Technique. In Research into Design for Communities; Springer: Singapore, 2017; Volume 1, pp. 397–407. [Google Scholar]
- Kaur, S.; Agarwal, P.; Rana, R.S. Ant colony optimization: A technique used for image processing. Int. J. Comput. Sci. Technol. 2011, 2, 173–175. [Google Scholar]
- Wang, J.F.; Liu, J.H.; Hong, Y.F. A novel ant colony algorithm for assembly sequence planning. Int. J. Adv. Manuf. Technol. 2005, 25, 1137–1143. [Google Scholar] [CrossRef]
- Shi, S.C.; Li, R.; Fu, Y.L.; Ma, Y.L. Assembly sequence planning based on improved ant colony algorithm. Comput. Integr. Manuf. Syst. 2010, 16, 1189–1194. [Google Scholar]
- Zeng, C.; Gu, T.; Zhong, Y.; Cai, G. A Multi-Agent Evolutionary algorIthm for Connector-Based Assembly Sequence Planning. Procedia Eng. 2011, 15, 3689–3693. [Google Scholar] [CrossRef] [Green Version]
- Chen, W.; Tai, P.; Deng, W.; Hsieha, L. A three-stage integrated approach for assembly sequence planning using neural networks. Expert Syst. Appl. 2008, 34, 1777–1786. [Google Scholar] [CrossRef]
- Zhang, H.; Liu, H.; Li, L. Research on a kind of assembly sequence planning based on immune algorithm and particle swarm optimization algorithm. Int. J. Adv. Manuf. Technol. 2013, 71, 795–808. [Google Scholar] [CrossRef]
- Biswal, B.B.; Pattanayak, S.K.; Mohapatra, R.N.; Parida, P.K.; Jha, P. Generation of optimized robotic assembly sequence using immune based technique. In Proceedings of the ASME International Mechanical Engineering Congress and Exposition, Houston, TX, USA, 9–15 November 2012. [Google Scholar]
- Martı’, R.; Laguna, M.; Glover, F. Principles of scatter search. Eur. J. Oper. Res. 2006, 169, 359–372. [Google Scholar] [CrossRef]
- Guo, J.; Sun, Z.; Tang, H.; Yin, L.; Zhang, Z. Improved cat swarm optimization algorithm for assembly sequence planning. Open Autom. Control Syst. J. 2015, 7, 792–799. [Google Scholar] [CrossRef] [Green Version]
- Li, X.; Qin, K.; Zeng, B.; Gao, L.; Su, J. Assembly sequence planning based on an improved harmony search algorithm. Int. J. Adv. Manuf. Technol. 2015, 84, 2367–2380. [Google Scholar] [CrossRef]
- Ghandi, S.S.; Masehian, E. A breakout local search (BLS) method for solving the assembly sequence planning problem. Eng. Appl. Artif. Intell. 2015, 39, 245–266. [Google Scholar] [CrossRef]
- Sąsiadek, M.; Jakubowski, J. Product Development in Virtual Computer Integrated Engineering Systems using DfM and DfA Principles-part II. ICMD 2016, 2016. Available online: https://www.icmd2016.zcu.cz/public/conferences/1/schedConfs/1/program-en_US.pdf (accessed on 10 April 2022).
- Shetty, D.; Ali, A. A new design tool for DFA/DFD based on rating factors. Assem. Autom. 2015, 35, 0144–5154. [Google Scholar] [CrossRef]
- Suszyński, M.; Ciszak, O. Selection of Assembly Sequence for Manual Assembly Based on DFA Rating Factors. In Advances in Manufacturing II. Volume 2—Production Engineering and Management; Hamrol, A., Kujawińska, A., Francisco, M., Barraza, S., Eds.; Springer: Berlin/Heidelberg, Germany, 2019; pp. 45–57. [Google Scholar]
- Suszyński, M.; Żurek, J. Computer aided assembly sequence generation. Manag. Prod. Eng. Rev. 2015, 6, 83–87. [Google Scholar]
- Suszyński, M.; Żurek, J.; Legutko, S. Modelling of assembly sequences using hypergraph and directed graph. Teh. Vjesn. Tech. Gaz. 2014, 21, 1229–1233. [Google Scholar]
- Suszynski, M.; Peta, K. Assembly sequence planning using artificial neural networks for mechanical parts based on selected criteria. Appl. Sci. 2021, 11, 10414. [Google Scholar] [CrossRef]
- Butlewski, M.; Czernecka, W.; Pajzert, A.; Radziejewska, M.; Suszyński, M.; Feniser, C. Ergonomic criteria in the optimization of assembly processes. In Proceedings of the 6th RMEE2018—Performance Management or Management Performance; Publishing House: Cluj-Napoca, Romania, 2018; pp. 424–431. [Google Scholar]
| Publisher’s Note: MDPI stays neutral with regard to jurisdictional claims in published maps and institutional affiliations. |
© 2022 by the authors. Licensee MDPI, Basel, Switzerland. This article is an open access article distributed under the terms and conditions of the Creative Commons Attribution (CC BY) license (https://creativecommons.org/licenses/by/4.0/).


