A Review of New Analytic Techniques for Quantifying Symmetry in Locomotion
by
Elizabeth T. Hsiao-Wecksler
1, 
John D. Polk
2,3,
Karl S. Rosengren
4,*,
Jacob J. Sosnoff
5 and
Sungjin Hong
6 1
Department of Mechanical Science and Engineering, University of Illinois at Urbana-Champaign, IL, USA
2
Department of Anthropology, University of Illinois at Urbana-Champaign, IL, USA
3
Department of Surgery, University of Illinois at Urbana-Champaign, IL, USA
4
Department of Psychology, Northwestern University, IL, USA
5
Department of Kinesiology & Community Health, University of Illinois at Urbana-Champaign, IL, USA
6
Department of Psychology, University of Illinois at Urbana-Champaign, IL, USA
*
Author to whom correspondence should be addressed.
Symmetry 2010, 2(2), 1135-1155; https://0-doi-org.brum.beds.ac.uk/10.3390/sym2021135
Submission received: 12 May 2010
/
Revised: 9 June 2010
/
Accepted: 10 June 2010
/
Published: 14 June 2010
(This article belongs to the Special Issue Complexity and Symmetry)
Abstract
:We present a review of novel techniques developed by our research group to improve quantitative assessment of human movement, especially assessments related to symmetric and asymmetric gait patterns. These new methods use motion capture data of the lower limb joints (e.g., joint and body segment angular position and/or velocity, or joint center locations) and include: (1) Regions of Deviation (ROD) analysis, (2) complexity and variability of phase portraits, and (3) multivariate shape-alignment and decomposition. We provide example demonstrations of these techniques using data from infants, typical and atypically developing children, simulated injuries of a knee or ankle, and wheelchair propulsion.
Keywords:
gait; symmetry; complexity and variability; biomechanics; joint motion; movement analysis; PARAFAC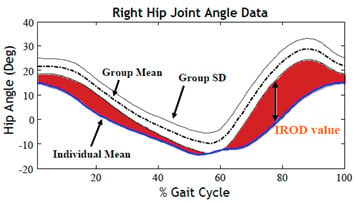
1. Introduction
Healthy, adult gait is often characterized as a bilateral symmetrical behavior, and such symmetry is advantageous because it increases energetic efficiency [1]. This symmetrical pattern is not found in the initial stages of walking, rather young infants move in an asymmetric fashion, eventually acquiring adult like patterns around 5 years of age [2]. The symmetrical pattern in older children and adults is often broken, however, due to pathology, disease, or injury. While there has been a large body of research examining healthy gait and various forms of pathological or injured gait, at present there are few tools designed to quantitatively measure deviations from symmetrical gait and to track changes in deviations over time. The goal of the present paper is to outline a number of procedures developed by our research group to quantitatively assess deviations from symmetry and to track changes in symmetry over time. We begin with a brief review of past work examining symmetry in human gait, and then provide an overview of the tools that we have been developing. In this later section, we review examples from our research to highlight the use of these tools.
1.1. Gait Symmetry
Human gait is often assumed to be symmetrical with right and left sides performing identical motions. While this assumption is often made for simplicity or to facilitate increased data collection [3,4,5], the assumption is rarely tested [6]. The majority of studies of human gait asymmetries have concentrated in two main areas: (1) determining if asymmetries exist in normal human gait (often interpreting these asymmetries in light of strength or laterality; see [6] for review), and (2) determining the magnitude and locations of asymmetries in individuals with gait pathologies or prostheses [7,8,9]. A more limited number of studies have addressed issues of asymmetry during recovery from injury [10,11,12]; however, most have done so using relatively simple statistical techniques (e.g., nonparametric analyses or simple ANOVA), as well as visual interpretation of the temporal effects using graphs [10,12,13]. Furthermore, most of these studies have analyzed only univariate descriptors of gait [7,8,9,11,14,15,16,17,18,19,20,21,22,23,24] which offer limited insight into gait complexity and the covariation in movement patterns across limbs.
Asymmetry in the gait of able-bodied subjects has been identified in several previous studies. While there are debates over the appropriate thresholds or methods for defining asymmetry [6], variables such as stride and step lengths [17,25], as well as ranges of joint motion [24], and velocity profiles [26,27] have all been observed to differ between sides of the body. In the majority of these studies, the sample sizes were moderate to small, and more work is necessary to assess the levels of asymmetry that characterize the lower limb movements during routine activities such as walking in healthy individuals, as well as the asymmetries that characterize the gait of injured individuals. In addition, the causes of these asymmetries in healthy and injured individuals are poorly understood and more research into the functional, anatomical and motor control factors that underlie asymmetries need to be explored in greater detail [6]. For example, while some studies have found differences in ground reaction force (GRF) characteristics and limb motions between sides of the body [28], more work is necessary to determine how these asymmetries are the product of subtle deviations in limb length, or physiological asymmetries in strength or laterality, i.e., limb preference [16,29]. In order to effectively assess the inter-relationships between multiple variables, more complex multivariate statistical techniques are required.
1.2. Multivariate Analyses of Human and Animal Gait and Motion
The goal of multivariate methods is to examine inter-relationships between multiple variables. However, these methods have been applied to only a small number of studies of gait in humans or animals [30,31,32,33,34,35], and in all of these investigations, principal components analysis (PCA) has been the only multivariate technique that was applied. This dimensional reduction technique uses mathematical procedures to combine correlated variables into a smaller number of uncorrelated components, while maximally retaining the data variance. This approach has been used for assessing covariation in GRF parameters, demonstrating that peak vertical and medial-lateral forces are correlated, while anterior-posterior (braking and propulsive) loads vary independently [35]. Williams et al. [34] have also demonstrated that asymmetries in GRF can distinguish veterinary (equine) gait pathologies. Sadeghi et al. [31,32,33,36] have used these techniques to evaluate unilateral and asymmetric patterns of muscle powers at the hip and knee in several subject populations, and they have proved useful for distinguishing asymmetries in muscular control of the hips during level walking in healthy subjects [31], as well as for discriminating the muscle powers used by older and younger subjects [32]. Only one study used PCA to integrate different kinds of data [30]. These authors used both electromyographic and kinematic data to understand the coordination between muscle activity and back motion in individuals with low back pain. From our review of this literature, it is clear that PCA and other multivariate techniques (i) can be effective for discriminating the factors that underlie complex motions and actions in gait, and (ii) are grossly underutilized in analyses of motion.
Great potential exists for the use of these techniques to characterize correlated patterns of movement (and the control of movement) across joints within limbs, to characterize normal levels of asymmetry, and to characterize the patterns of movement and asymmetry that are common to different acute and chronic injury. The results of PCA are highly dependent upon the choice of rotational criteria (e.g., [37]). This issue needs to be systematically evaluated before this technique can be shown to be clinically relevant. Furthermore, we are unaware of any studies that have used multivariate techniques to quantitatively track the recovery of injury through time.
1.3. Need for New Analysis Tools
While limb motions during human gait have been studied for nearly 170 years [38], the techniques that are commonly used to quantitatively describe limb motion are extremely simplistic and are either (i) unable to capture the complexity of human movement, (ii) unable to quantitatively assess covariation in joint posture within and between limbs, or (iii) difficult for clinical practitioners to relate to patient populations. The lack of analytical complexity is illustrated by the fact that the most common descriptors of gait are univariate measures such as stride and step length, and the durations of stance and swing phases of gait [7,8,9,11,14,15,16,17,18,19,20,21,22,23]. While these measures accurately describe the phase durations and limb displacements, they fail to capture the complex angular displacements of limb motion. In addition, quantitative assessments of joint angles are typically conducted at single discrete and easily defined points in time (e.g., heel-strike, mid-stance and toe-off), or examine individual joint angles displayed through a gait cycle. But again such measures fail to capture the nature of motion that occurs between these discrete temporal events, or the effects of one joint on another, respectively. Assessing covariation in limb movements has been attempted by using angle-angle phase portraits [39,40]. This technique is a useful visual tool for qualitative assessment of limb movements and gait pathologies. However, the popularity and clinical applicability of this method has waned, in part due to the lack of appropriate methodologies for quantitatively comparing phase portraits of different individuals or limbs. Fourier analyses of the phase shapes has been attempted [41], however, the resulting Fourier coefficients are sample dependent and difficult for clinicians to relate to their patients. Quantification of the kinematic and kinetic parameters for all limb segments and joints throughout an entire stride would permit both a more holistic representation of limb movement, as well as more clinically useful results that identify the nature of the asymmetry and the relative time that it occurs during a stride. Furthermore, the quantifying patterns of covariation in joint motion and asymmetry would be useful for clinical diagnosis of gait pathologies.
Techniques are needed that capture the fact that limb movements during gait are spatio-temporally complex, even during steady-state, constant speed locomotion. Each limb segment and joint undergoes a cyclic pattern of flexion, extension and to a lesser extent, rotation, abduction and adduction during each stride. Furthermore, the energetic cost of moving the limbs depends upon joint postures and segmental accelerations [42], so the movements or loads at one joint will have consequences both for the other joints of the ipsilateral limb as well as the motions and loads in the contralateral limb (i.e., physical therapists refer to such functional interdependence as the “kinetic chain” [43,44,45,46,47,48]). Most current tools for gait analysis are not designed to capture these complex and coupled behaviors.
The statistical tools that are currently used to describe gait, and gait asymmetry focus primarily on single joints, or use relatively simple measures of motion (e.g., stride and step length). These measures are unable to capture the dynamic aspects of gait such as simultaneous movements or asymmetries at multiple joints that occur at different times throughout a complete gait cycle or stride. Understanding the patterns of correlated joint movements across the limbs is particularly important for analyses of asymmetric gait, because unilateral pathologies at a single joint may have long lasting negative consequences on the range or speed of motion that are possible at other joints within the same limb, as well as joints in the uninjured limb.
2. New Tools for Capturing the Multivariate and Dynamic Nature of Gait
For the past few years, we have been focusing on developing new tools to assess gait, with a special focus on assessing deviations from symmetry. The focus on deviations from symmetry is derived from the assumption that symmetrical gait is not only indicative of healthy movement patterns, but that asymmetric gait can be indicative of less healthy movement patterns. Over time, the increased forces and torques placed on certain joints and muscles due to asymmetric gait may perturb the musculo-skeletal system ultimately leading to further declines in gait and movement capabilities.
The fundamental assumption of our work is that characterization of gait pathologies (i.e., description of the differences in movement patterns and control strategies from normal healthy gait) and analyzing changes in movement characteristics due to aging, disease or interventions can be achieved by investigating spatiotemporally correlated kinematic and kinetic patterns across the limbs. In this review, a number of techniques that our group has developed will be described that characterize the spatiotemporally complex and coupled nature of gait in a variety of different populations. The ultimate goal of these methods is to provide insight into control mechanisms that underlie gait pathology, to characterize the patterns of interrelationships among movement patterns, and to better capture potential changes in the locomotor system over time.
Techniques that can identify patterns of interrelationships of joint motion, identify the times during a gait cycle that are most deviant from healthy motion, or better summarize the multivariate nature of gait data have the greatest potential to provide the most clinically relevant results. To date, we have created a number of tools that focus on complex shape analytic methods. These include (1) Region of Deviation Analysis (ROD), (2) complexity and variability analysis of phase portraits, and (3) multivariate shape-alignment and decomposition. These techniques were developed using a series of different data sets including previously published data on gait ontogeny [49], a set of motion capture data of typically and atypically developing older children [50], and motion capture data that simulated injuries which restrict joint range of motion to either the right knee or ankle [51,52,53]. These later studies involved controlled experiments with healthy individuals that were fitted with an external brace to immobilize the desired joint to mimic asymmetrical joint impairment.
2.1. Regions of Deviation Analysis (ROD)
We developed a technique that we refer to as Regions of Deviation (ROD) analysis to provide quantitative metrics to describe and compare motion patterns in gait [51]. This approach can be used to evaluate deviations in symmetry between bilateral joints or deviation of an individual joint relative to healthy normative behavior. ROD analysis consists of two measures: Symmetry Regions of deviation (SROD) and Individual Regions of Deviation (IROD).
SROD analysis can be used to quantify deviations from symmetry and to determine when bilateral joint angle pairs demonstrate asymmetric behavior. In the case of an injury, SROD values are calculated from the angular difference between the affected and unaffected sides of a given joint computed over one gait cycle. These bilateral joint angle differences are then averaged over the total number of cycles for an experimental trial. The averaged difference is then compared to normative joint motion. Figure 1 provides an example of this approach using data that we collected from ten healthy young male subjects with or without a brace on the right knee to simulate an injury that would severely restrict the knee’s range of motion.
To perform the SROD procedure for a given test condition (i), e.g., healthy or injured, the bilateral angular difference between the affected (right) and unaffected (left) sides of a given joint (j) was first computed over one gait cycle, . Negative values indicate smaller values for the affected side, suggesting asymmetry in movement. In our initial study using bracing [51], this calculation was repeated for test data collected while the subject walked on a treadmill during three-minute trials of normal (unbraced) walking or walking with a brace on the right ankle or knee (i.e., 100+ gait cycles per test condition). These bilateral joint angle differences were then averaged over the total number of cycles (, where indicates ensemble average over a number of samples). For a given subject, this averaged difference was then compared to normative joint motion, i.e., average () and standard deviation () for the unbraced data of all test subjects (Equation 1).
Figure 1 illustrates graphically the technique for determining SROD values for the hip of a single subject during a trial when the right knee was braced and the knee’s range of motion was restricted. Note that hip motion, especially of the right hip, was also affected by bracing of the right knee, such that there was substantial deviation from bilateral symmetry throughout most of the gait cycle.
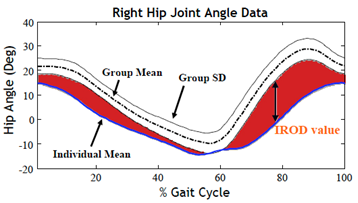
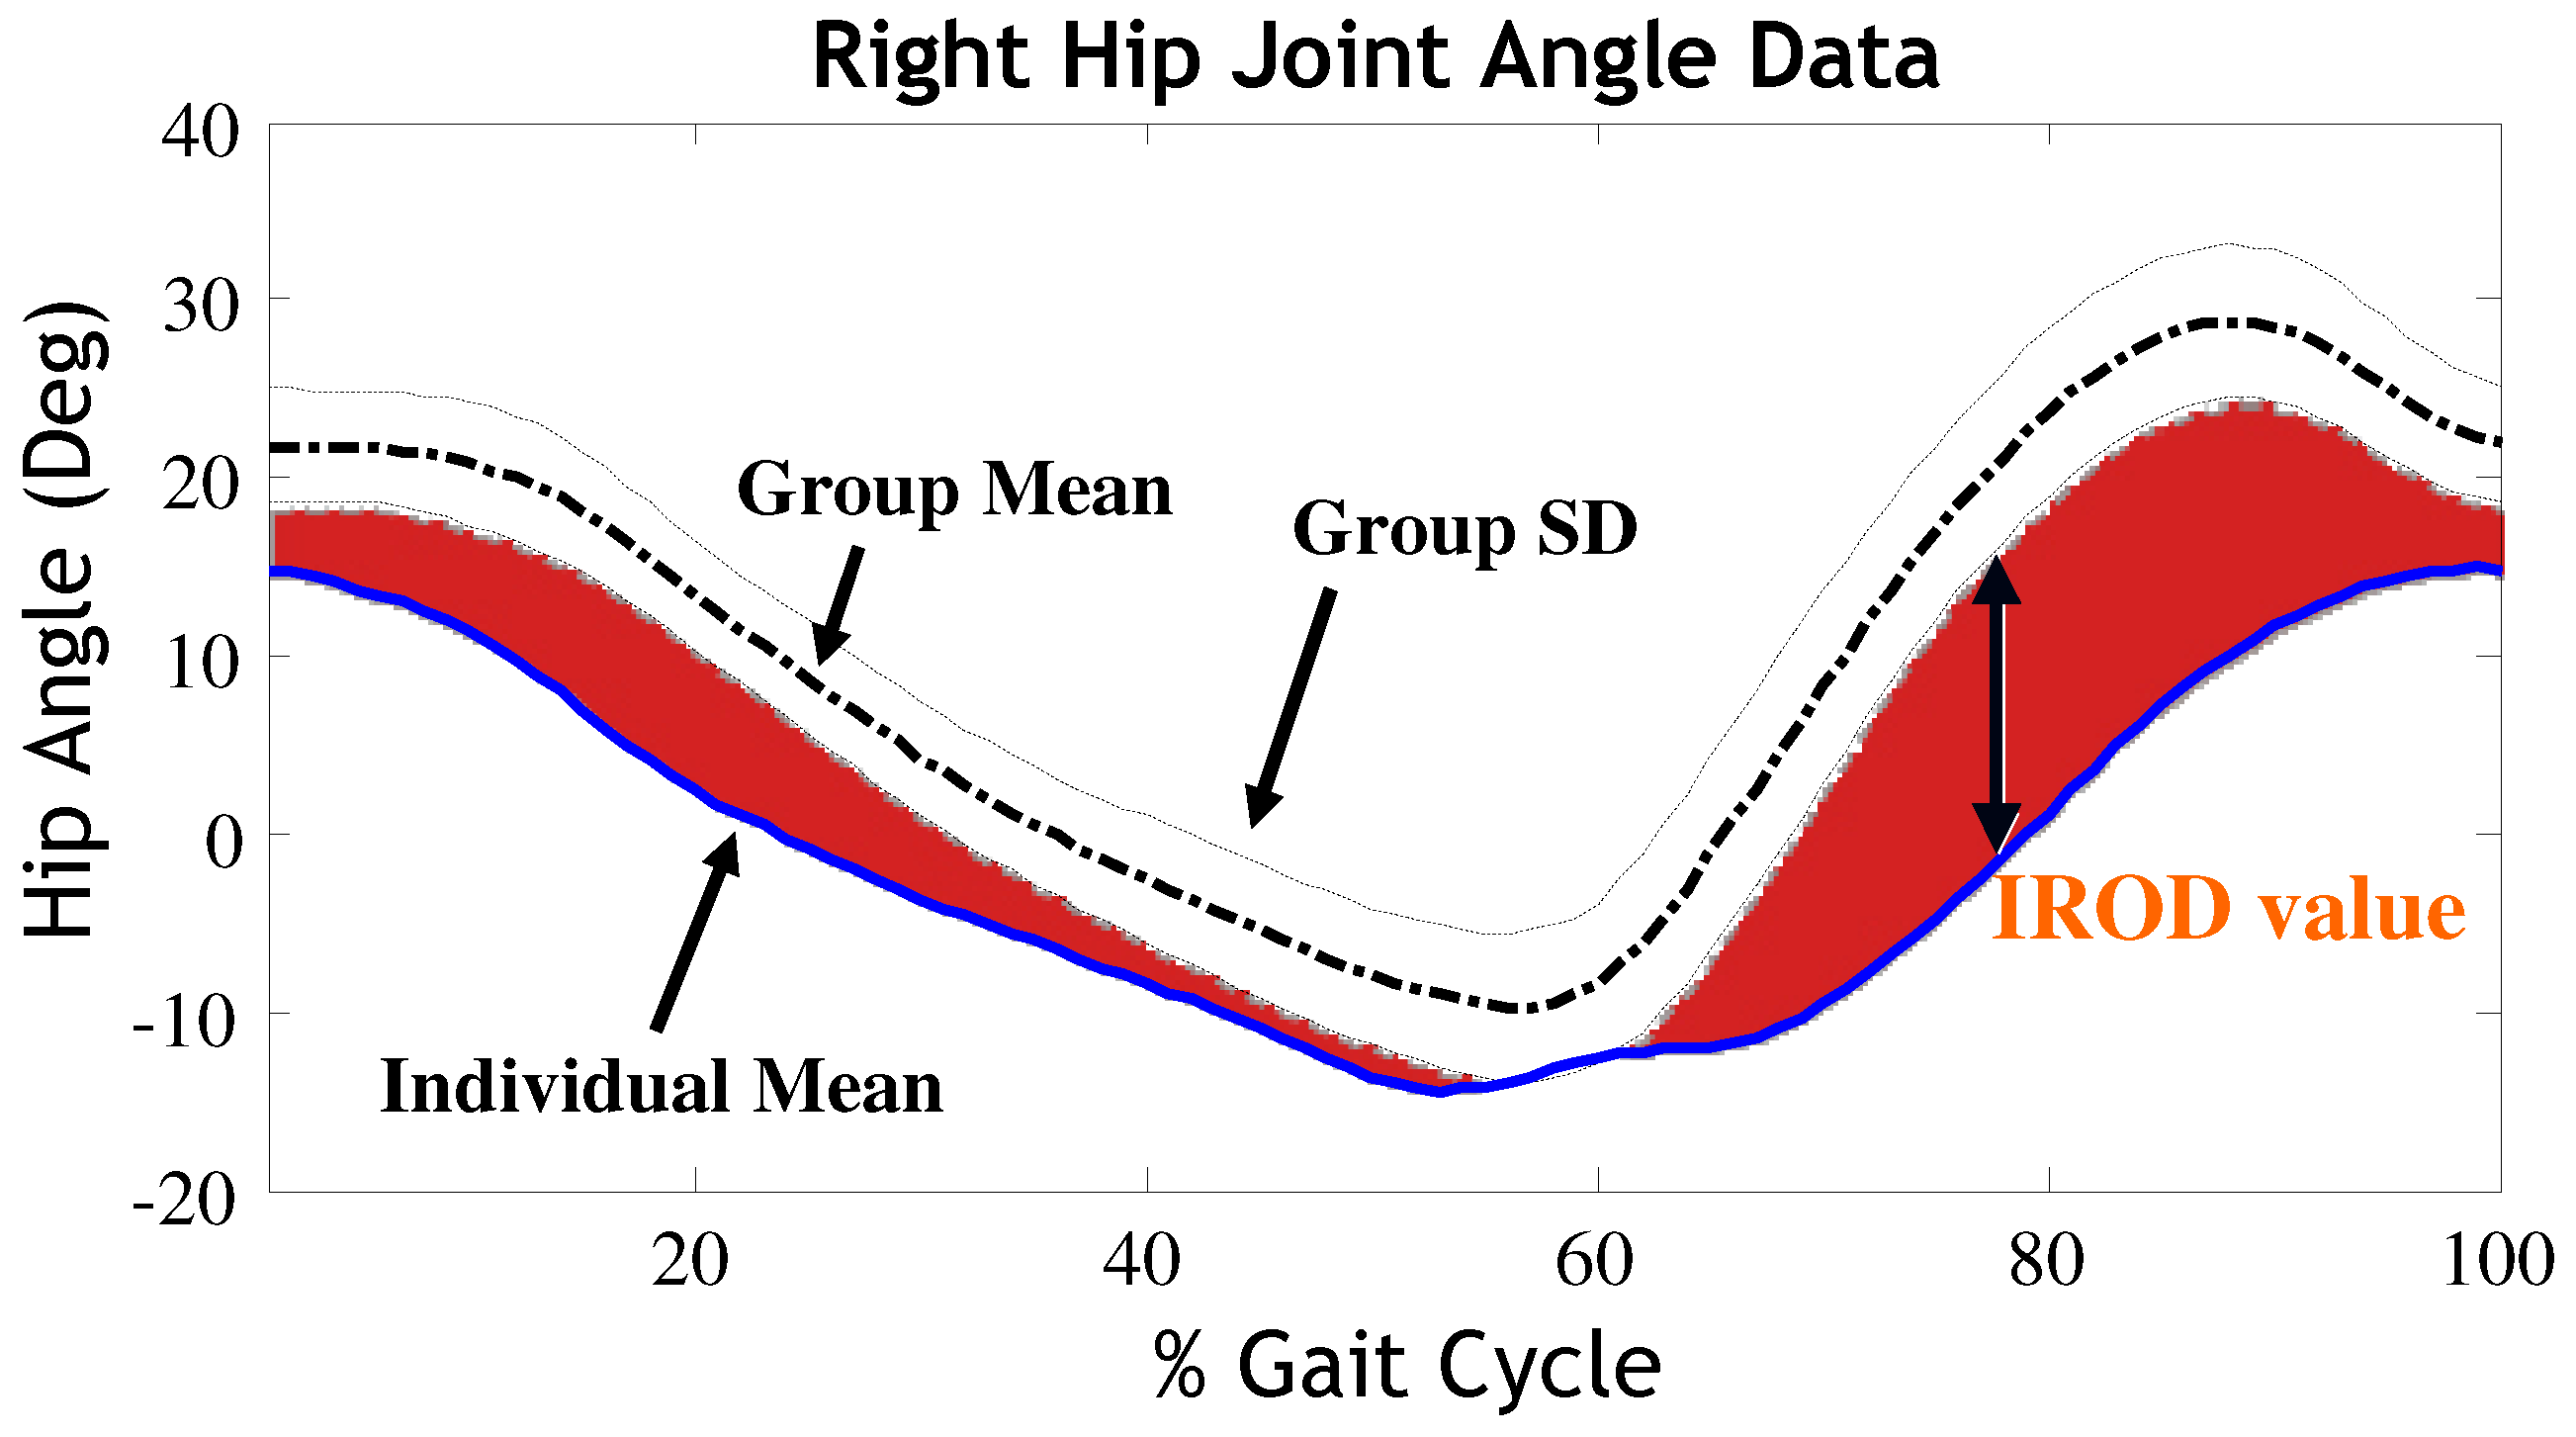
Individual ROD (IROD) analysis determines the magnitude and timing of asymmetric behavior of individual joints throughout the gait cycle. To perform this procedure, for a given joint, the averaged joint angle over multiple gait cycles was first determined . This subject-specific averaged joint angle was then compared to the average and standard deviation values of the same joint as computed from the normative healthy group and (), respectively (Equation 2). Figure 2 illustrates graphically how IROD values were determined for the affected hip of one subject during the knee-braced condition.
Preliminary work with this technique has allowed quantification of deviations in bilateral joint pair symmetry and individual joints by examining peak amplitude and timing differences in angular joint kinematic time series data when comparing unbraced and knee or ankle braced data [51]. While traditional measures (e.g., maximum range of motion) grossly detected asymmetries due to bracing, this analysis identified significant regions of asymmetry. That is, this method can identify where in the gait cycle the movement pattern deviates from a symmetric one.
The original ROD methodology allowed quantification of deviations in bilateral joint pair symmetry and individual joints by examining peak amplitude and timing differences in angular joint kinematic time series data. We recently refined this approach to use sequential t-tests to quantify locations in the gait cycle that are significantly different [54]. By examining whether observed symmetry differences due to impairment were significantly different from normal throughout the entire gait cycle, it is possible to get a sense of the true regions for which the movement patterns deviated from normal.
We recently demonstrated this method on canine gait data of healthy and injured Labrador Retrievers without and with unilateral cranial cruciate ligament deficiency in the hind limb [55]. This last study illustrates that this approach can be extended to evaluate variations in the symmetry of quadruped gait. This study also successfully demonstrated how the new method expanded analysis outside of predetermined areas of interest such as peak differences, thus identifying regions of significant variation from normal throughout the gait cycle. Further focusing on asymmetry magnitudes between limbs, rather than only assessing unilateral group means, may provide new insight into abnormal gait patterns. This work suggests that these sections (regions) during gait should be examined more thoroughly. These significant times and asymmetry magnitudes can then help researchers and clinicians understand the mechanisms involved in gait pathology and compensation.
2.2. Complexity and Variability of Phase Portraits
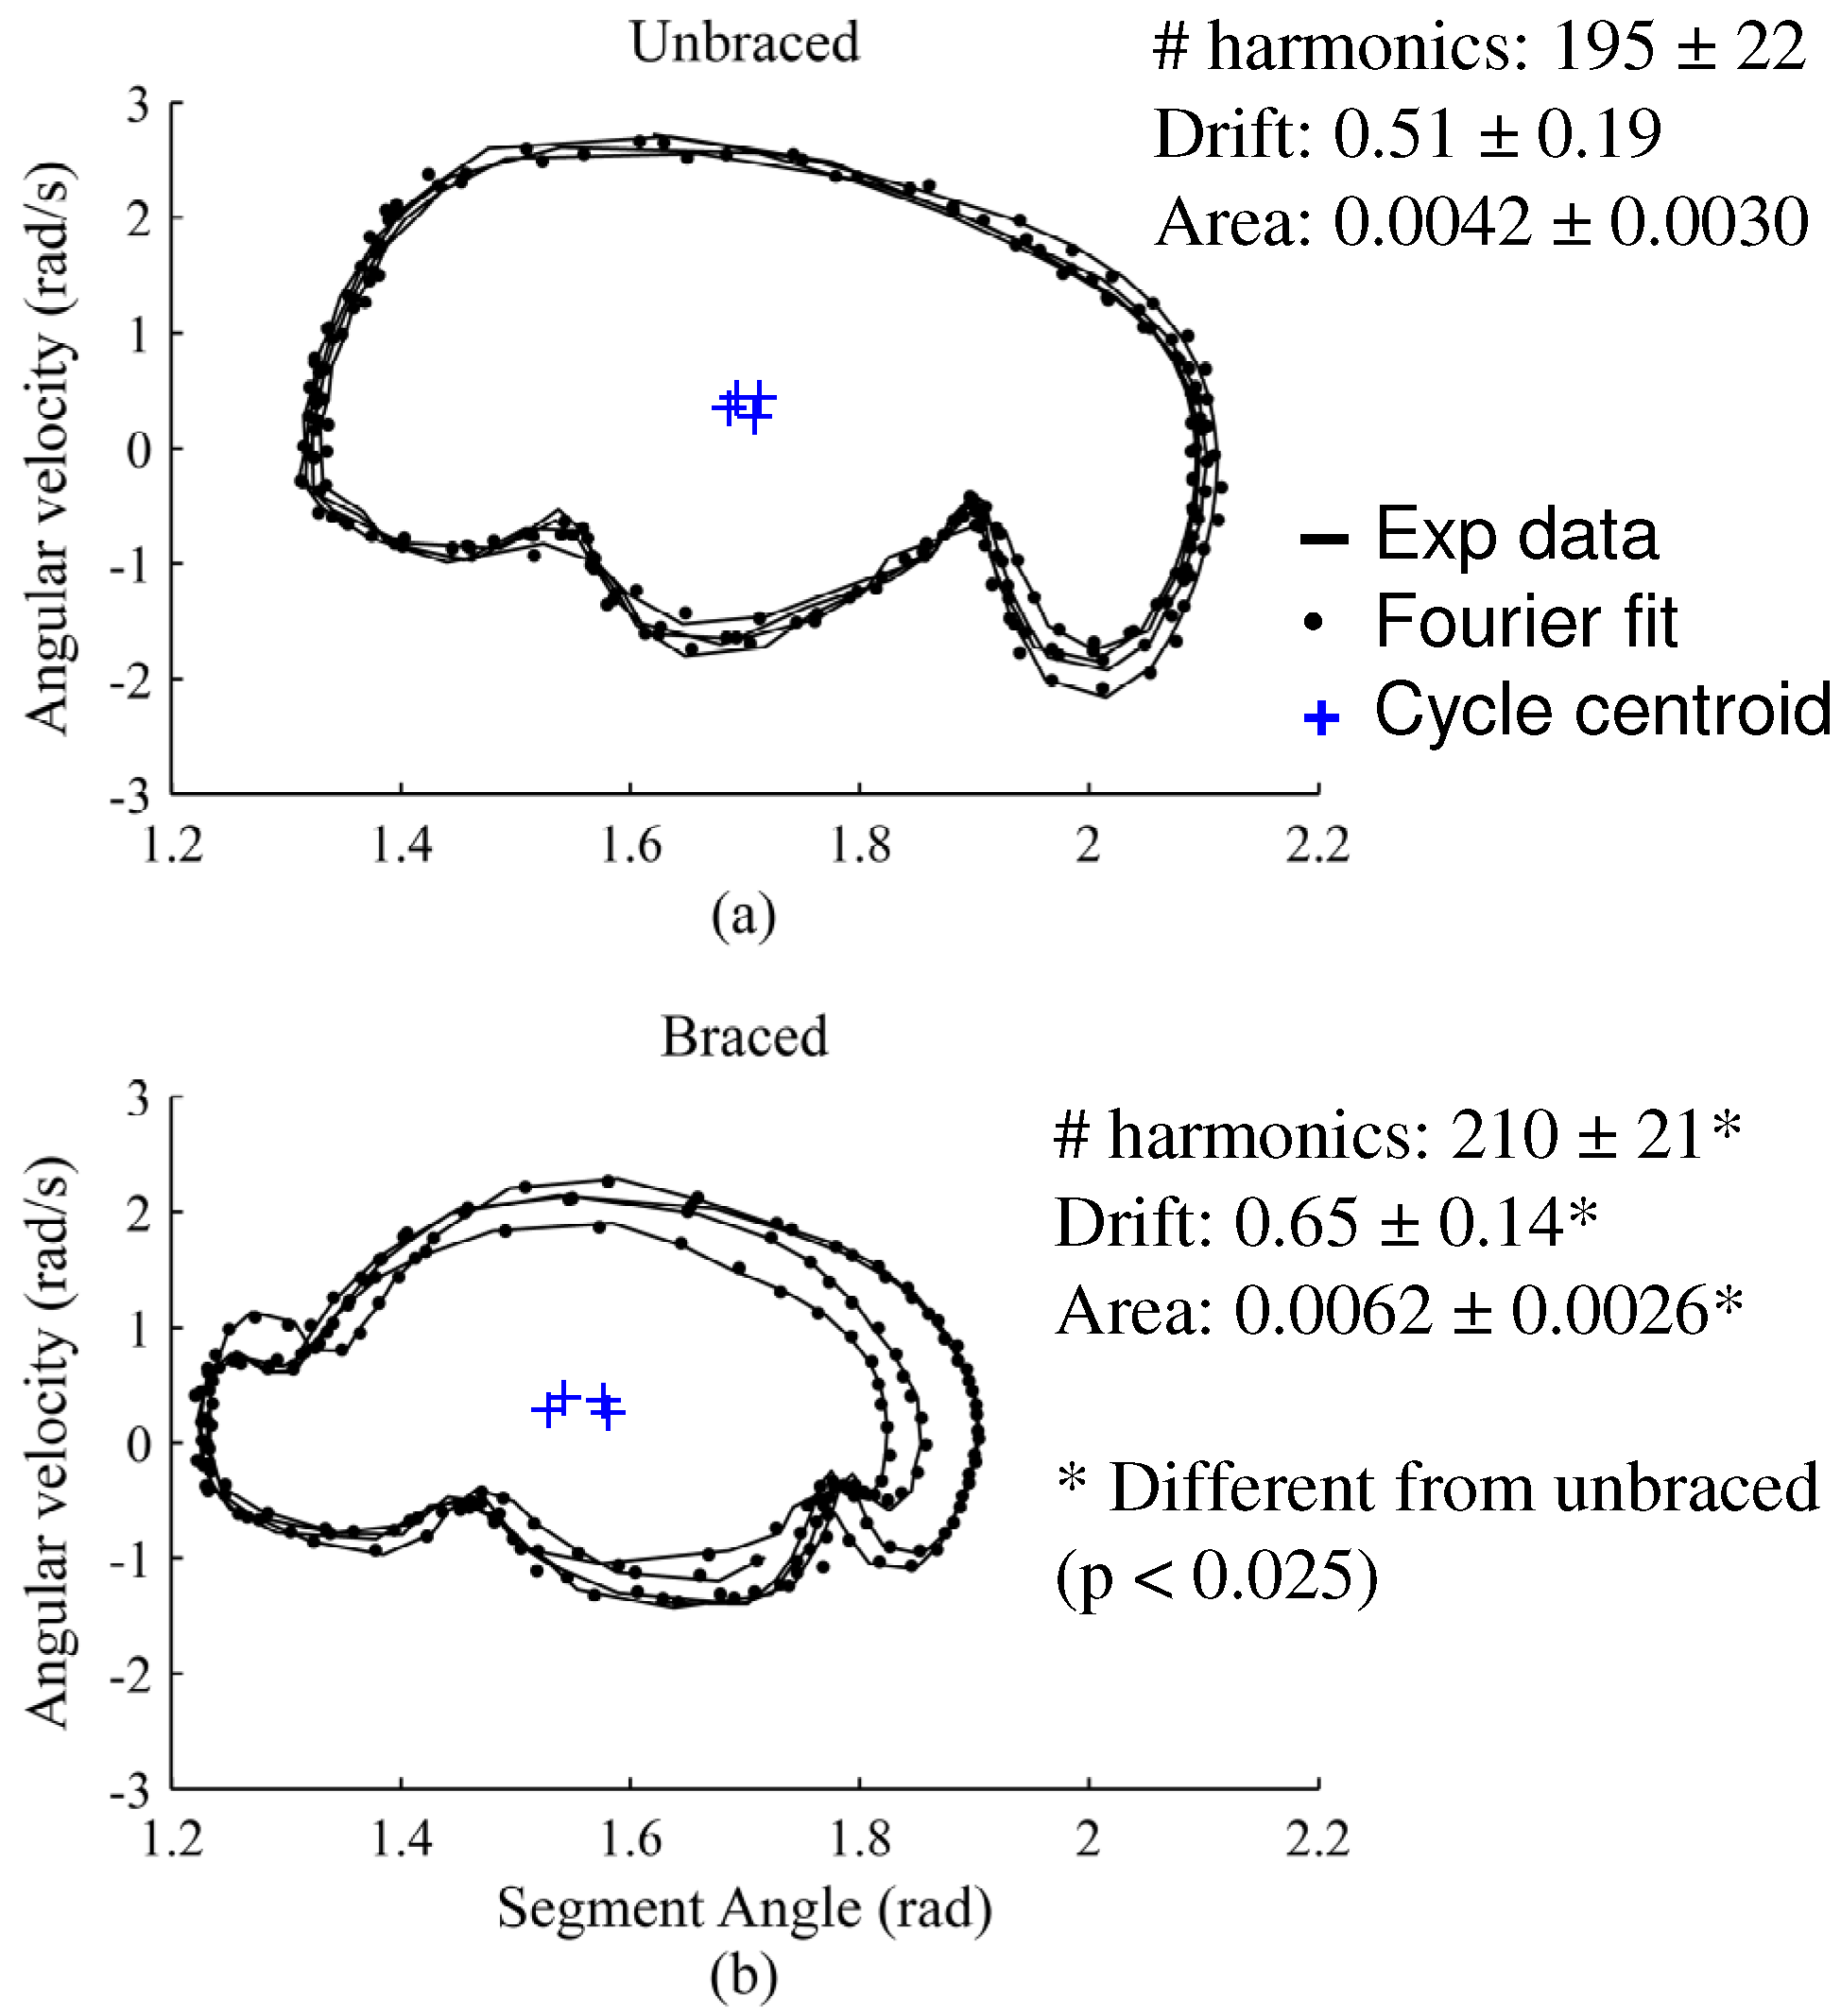
Planar phase portraits have been used to represent graphically the changes in joint angular position versus velocity over each gait cycle. Generally, these representations approximate elliptical shapes. Figure 3 shows example phase portraits from our work examining the influence of bracing a knee joint (adapted from data published in [52]). Researchers have generally described differences in phase portrait shapes, such as those shown in the figure qualitatively. However, qualitative assessment provides little diagnostic value and may not reflect significant differences in movement patterns. For this reason, we have been developing metrics to quantify changes in the variability and complexity of consecutive phase portraits generated by a specific body segment while doing repetitive cyclic movement. We have used this approach to examine symmetry between the movement patterns of the right and left lower limb [49,50,52].
Variability measures were based on the fluctuation in phase portrait centroid location between individual consecutive gait cycles. The variability of the centroid (i.e., the mean of all (x, y) data points for a given gait cycle, quantifies the inconsistency (or consistency) of phase portrait cycle location throughout a trial. Inter-cycle variability was assessed by measures used to quantify the fluctuations of the phase portrait centroid over consecutive gait cycles (i.e., centroid area and centroid drift). These measures were adapted from traditional center of pressure stabilogram analyses [56]. Centroid area was defined as the bivariate 95% confidence ellipse area swept out by the centroids over multiple consecutive gait cycles. The area measure gives a combined measure of the bivariate variability around the mean centroid. Centroid drift was defined as the path length or total point-wise Cartesian distance that the centroid traveled on the phase plane over the multiple gait cycles. Drift quantifies the distance that the centroid travels during the multiple gait cycles.
To quantify complexity, we assessed the frequency content of the phase portraits. In previous studies, we quantified complexity by computing a point-wise sum of squared errors (SSE) between a “full” and “reduced” elliptical Fourier analysis (EFA) fit for each trial [49,50]. The full fit included a high number of harmonics (500) to more completely describe the shapes, while the reduced fit was computed with a lower number of harmonics (e.g., 10). In our more recent research [52], data was collected while 20 healthy young male subjects walked on a treadmill during three-minute trials of normal (unbraced) or right knee-braced walking. EFA was performed on 20 consecutive gait cycles for each limb segment using a custom-modified version of an existing Matlab elliptical Fourier program [57], based on the methodology of Kuhl and Giardina [58]. Phase portrait data were first fit using a 500 harmonic elliptical Fourier series (“full fit”). All fits were computed with 200 points per cycle, i.e., 4000 points per trial.
Complexity was identified by the number of harmonics needed in the Fourier series to describe the shape of the full fit (Figure 3). This was done by first computing the “maximum” error between the full fit and worst possible fit (zero-order fit, i.e., mean centroid), and then finding the minimum number of harmonics to reduce the maximum error by 99.9%. To allow the complexity measures to control for size differences between phase portraits and be more comparable across individuals and body segments, we determined the number of harmonics necessary to achieve a certain (high) percentage of the full fit. A reduced fit eliminating 99.9% of maximum error was used because it was the lowest (statistically motivated) value that characterized most of the full fit shape features.
First, the maximum error was calculated as the SSE between the full fit and zero-order fit (average centroid):
where (xfull,i, yfull,i) is the ith point on the full fit curve, (xc, yc) is the average centroid (zero-order fit) over the multiple gait cycles for the given trial, and n is number of data points in the phase portrait time series. Next found the smallest number of harmonics, j, (reduced-order fit) was determined which satisfied:
where point (xj,i, yj,i) is the ith point on a reduced fit curve of j harmonics. That is, j was increased and the preceding was repeated until (4) was satisfied, i.e., until the error between the full- and j-harmonic fit was less than 0.1% of the maximum error:
The minimum integer j satisfying (5) then defines the complexity metric. A larger integer value of j suggests a more complex motion shape since more harmonics (higher frequencies) are needed to accurately describe more complex shapes.
We have also used this approach to quantify changes in complexity and variability in the gait of infants over the first few months of independent walking [48] and to quantify whether patterns of complexity and variability differ across the right and left side in children with developmental coordination disorder (DCD) [50]. In many cases, with populations such as this group, asymmetries in movement are described qualitatively [59]. By examining the absolute value of the difference in complexity and variability across the two sides using analysis of variance techniques to examine our complexity and variability measures, we were able to show that children with DCD exhibit significantly larger variation in the movement patterns of their right and left lower limbs than typically developing children [50]. We were also able to show that this increased pattern of variability occurred primarily in the stance phase of gait. This observation, linked with other known problems with balance control in this population, enable us to make new insights in to the control of movement and suggest new directions for potential interventions with children with gait difficulties. Our work with the application of these Fourier-based metrics has allowed us to better quantify complexity and variability in phase portrait shapes, and to quantitatively assess how deficiencies in motor control can affect gait symmetry.
2.3. Shape-alignment and Decomposition Analyses
Gait cycle shapes (e.g., the spatial displacement of a joint center over the course of a gait cycle (Figure 4)) can also be used to characterize motion in the lower limbs. Each “shape” can be represented by a time-ordered series of events that are comparable across subjects. These events may be kinematically defined (e.g., heel-strike, mid-stance, lift-off, mid-swing) or they may be more generally described as percentages of the gait cycle. These events can then be used as “landmarks” to compare motion to patterns of different groups using tools developed for the analysis of static shapes [60,61,62,63,64]. We are developing new techniques based on a combination of a superimposition and alignment techniques (Procrustes Analysis [PA] and Generalized Procrustes Analysis [GPA]) and a multivariate dimensional reduction technique (Parallel Factor Analysis [PARAFAC]) to characterize different gait perturbations [53]. GPA is an iterative procedure for translating, rotating, and scaling a set of shapes to determine the best alignment using a least-squares criterion [65,66]. GPA can be used to determine the consensus movement trajectory for multiple gait cycles for a particular research subject’s joint or for a population of subjects. In contrast, PA is a non-iterative procedure for optimally aligning landmark-based shapes [67]. We use this approach to determine the optimal alignment between any individual’s motion patterns and the normal consensus [53]. Following optimal alignment, the shape differences between the individual and consensus can be defined by a matrix of x and y residuals between the landmarks on the individual and consensus trajectories. Variance in these residuals can be parsimoniously assessed using PARAFAC. This method is ideally suited to the given task since it can simultaneously decompose data collected in three or more modes, where each mode is believed to cause some systematic variation in the data [68]. Examples of data modes include subjects, % gait cycle, injury status, and side of the body, among others. Like PCA, PARAFAC allows for the extraction of components that explain the variation of the entire system of conditions under study. However, PARAFAC is more advantageous than PCA, because PARAFAC overcomes the problems of rotational indeterminacy inherent in PCA and because PARAFAC can simultaneously incorporate more data modes [68]. Thus, PARAFAC could produce solutions that enable a better understanding of the complex interrelationships between lower limb impairments and deviations from healthy symmetric gait patterns.
In order to determine how particular gait perturbations cause deviations from normal motion, we analyzed the normal unbraced, right ankle-braced, and right knee-braced data from [51]. Twenty-one gait cycles were obtained for each of 10 subjects for each condition. Each gait cycle was transformed to contain 100 data points starting with heel-strike. We determined separate GPA consensus shapes based on all normal gaits for the knee and ankle motion patterns. Separate GPA consensus trajectories were calculated for the right and left sides for each of these conditions (Figure 4). GPA was further used to calculate the overall consensus shape for normal (non-braced) knee and ankle motion patterns. These consensus shapes were then used as a reference for allignment of each individual’s right and left normal, knee braced and ankle-braced shapes by GPA. We used PA for these comparisons between individual and overall normal consensus trajectories [53]. Following the optimal PA alignment, the shape differences between the individual trajectories and the corresponding consensus was described by a series of 100 x and 100 y residuals (i.e., 1 x and 1 y residual for the comparison of each of the 100 landmarks), which were analyzed by PARAFAC. In our application, PARAFAC was used to identify and quantify residual patterning that systematically varied in three modes: brace, affected vs. unaffected side of the body, between-subject variation, and temporal variation over the gait cycle. In particular, PARAFAC distinctively identified key times during the gait cycle that were most affected by the impairment. By identifying the key times, changes in magnitude of the trajectories at these times were determined.
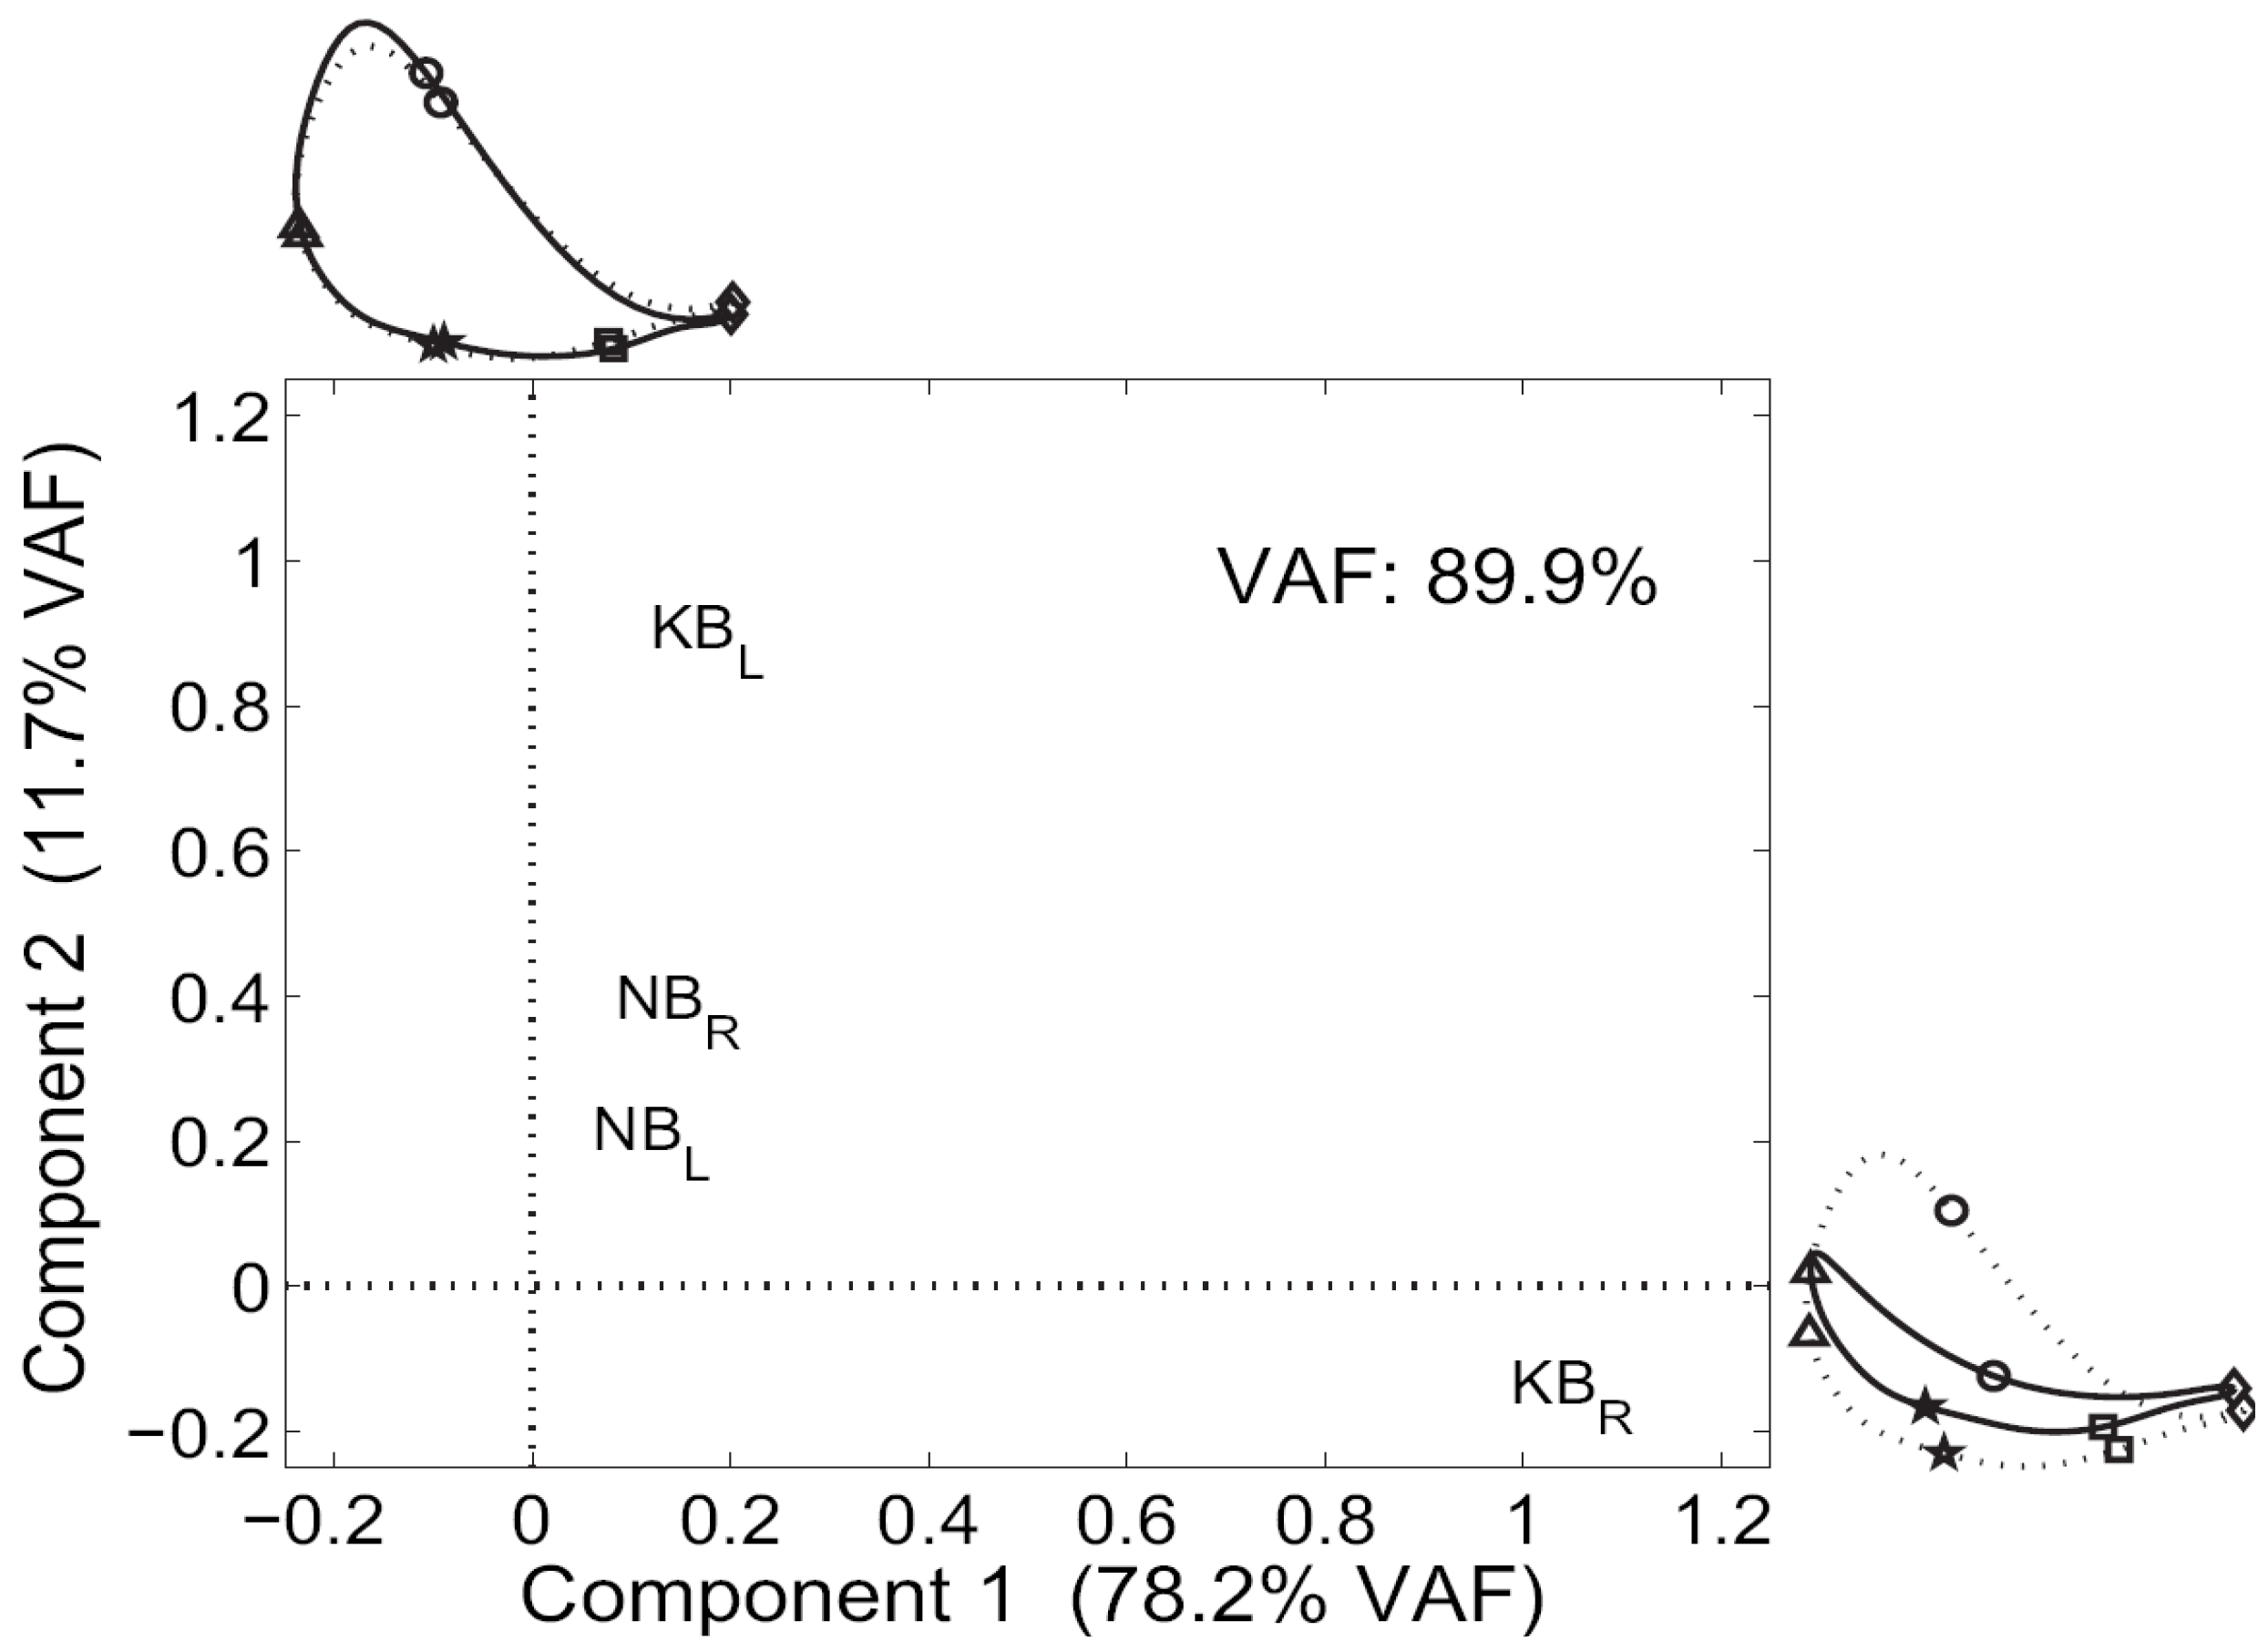
In this paper, we present a sample of our results to demonstrate the utility of our method for identifying asymmetries in limb motion. Figure 5 illustrates the effect of the knee brace on ipsilateral and contralateral ankle motion. Component 1 distinguishes the braced right ankle motion from the normal and contralateral braced ankle profiles. Component 2 mostly describes further differences (in symmetry) between normal ankle movement patterns as well as distinguishing the motion of the unbraced left ankle from normal motion profiles. Normal (non-braced) motion shows only a small amount of asymmetry, while the motion patterns of the right and left ankles for the braced condition are vastly different. Idealized motion trajectories are shown in Figure 5 to illustrate the effect of the knee brace on the ipsilateral and contralateral ankle motion.
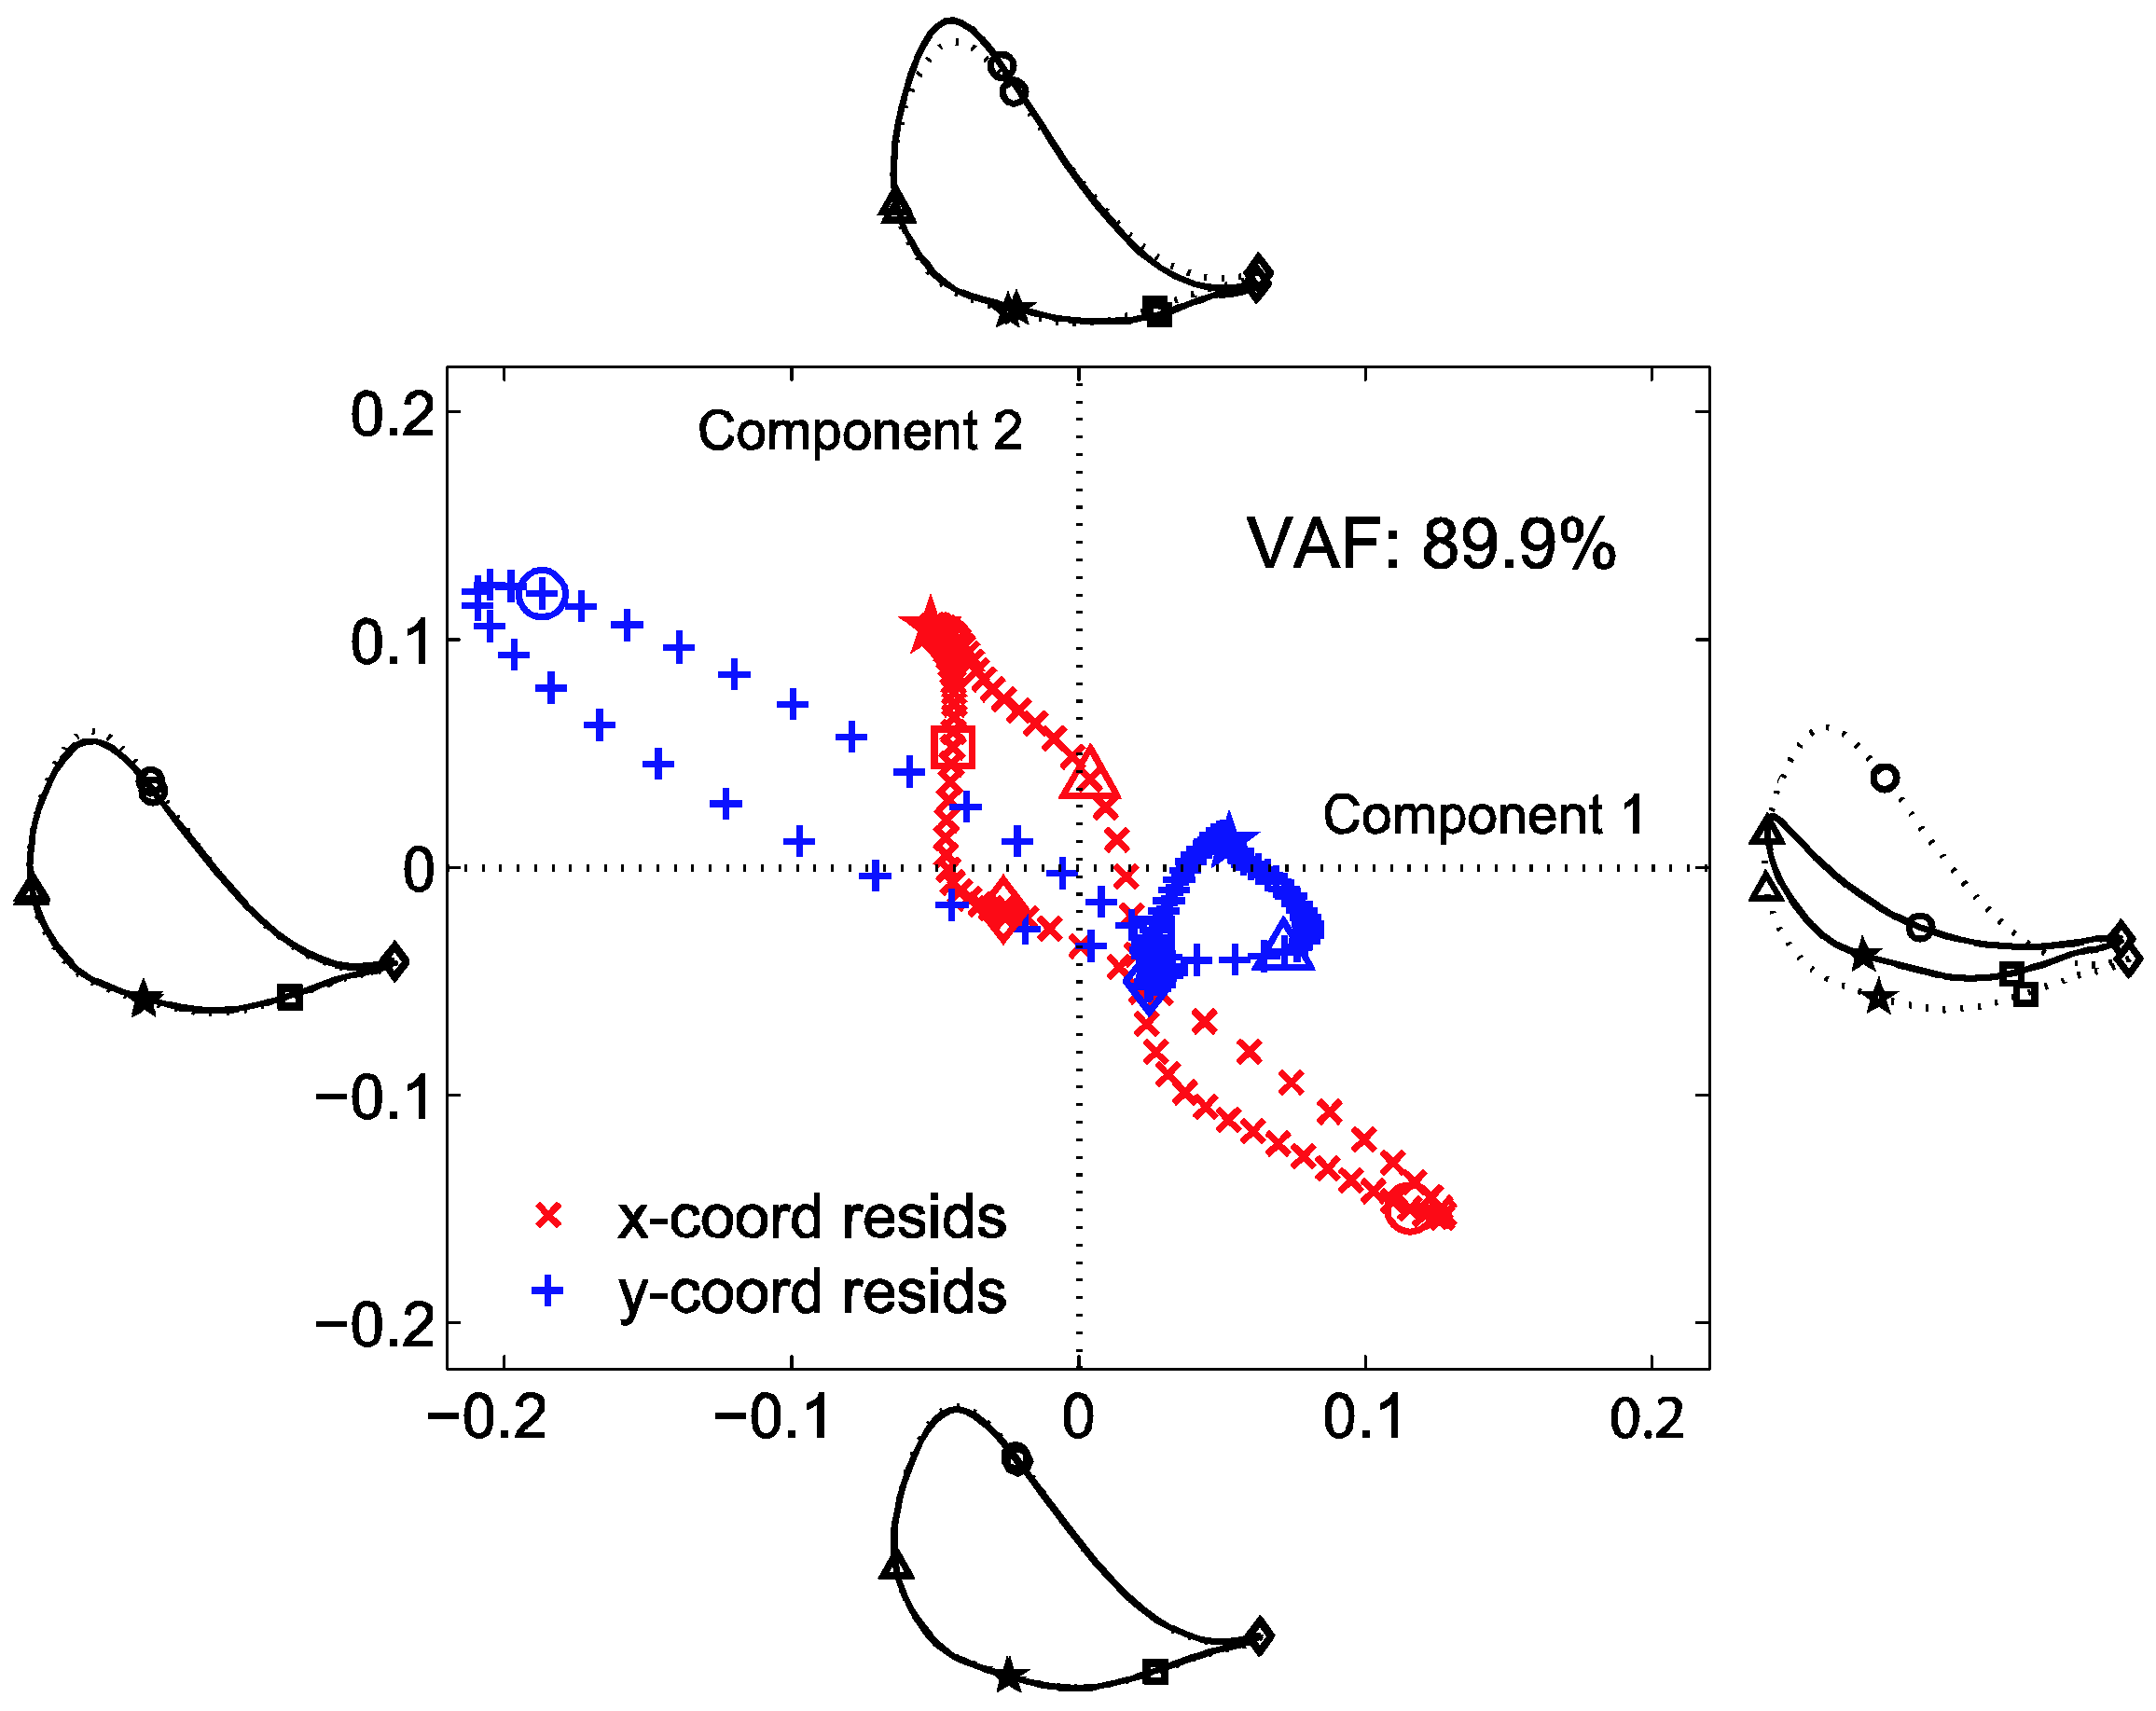
One of the principal advantages of PARAFAC is that it allows identification of the time points during the gait cycle that are most responsible for explaining the effect of gait perturbations. Figure 6 illustrates the magnitude and direction of the residual deviations for the ankle motion when individuals wear a knee brace on the right side compared to the normal non-braced condition. Wearing the knee brace results in a flatter motion profile for the ankle. During stance phase (i.e., along the bottom of the idealized profile), the braced trajectory is slightly elevated relative to normal; while during swing phase, the braced trajectory does not extend as far upward as the normal profile. The magnitude of this effect is illustrated in the plots of x and y residuals. For example at 80% of the gait cycle (denoted by circles in Figure 6), the y coordinate shows high negative weights along component 1, while the x residual shows positive weights along component 1. Component 2 explains the effect of the right knee brace on the contralateral ankle motion (Figure 5). The perturbation here largely results in an increase in the height of the ankle during swing, as noted by the high positive y residuals on component 2.
In summary, our analyses with GPA, PA and PARAFAC have revealed that gait cycle shapes associated with various lower limb impairments (ankle or knee braces worn on one side of the body) can be meaningfully characterized and distinguished from healthy (unbraced) motion patterns [53]. This technique has great potential for application to other gait data, particularly higher-order shapes (velocity and acceleration profiles) that provide more insight into the control strategies that underlie the observed motion patterns. This technique shows promise in enabling us to detect how one limb or joint may influence other parts of the system.
2.4. Application beyond Gait: Manual Wheelchair Propulsion
The approaches we have described can be used to quantify a wide range of movement patterns that follow a cyclical pattern. For example, we have begun to expand our research program to the examination of manual wheelchair propulsion utilizing the metrics that we have developed [70]. There are a number of similarities between over ground walking and manual wheelchair propulsion. For instance, similar to gait, in wheel chair propulsion there are symmetric motions of the right and left arms during locomotion. Likewise in wheel chair propulsion hand contact transmits forces that are ultimately transmitted to the ground in a manner that is analogous to heel contact. Finally, in wheel chair propulsion the release point in which the hand releases from the wheel is analogous to toe-off in walking. Obviously, there are differences between wheelchair propulsion and human gait as well as similarities, we provide this example primarily to show another type of movement pattern that can be examined using our techniques.
Movements, such as wheelchair propulsion result from a complex interplay of control processes operating at unique timescales. Ultimately, the interaction of control processes lead to dynamic fluctuations in motor output. Theoretically, movements that result from a greater interaction of control processes are more complex. As such it is maintained that variability and complexity in motor output provides novel information concerning its underlying control [71]. Moreover, it has been suggested that as individuals develop proficiency in a motor skill their output becomes less variable and more complex [72]. Although there has been considerable work examining manual wheelchair propulsion, there has been a lack of research examining variability in wheelchair propulsion and how it changes with various parameters including expertise.
In an ongoing study, we rely on phase-portrait representations of upper arm limb segments to quantify complexity and variability during manual wheelchair propulsion [71]. Inter-cycle complexity and variability have been assessed by quantifying fluctuations in the upper arm phase portraits over multiple propulsion cycles at a range of speeds. This research study utilized the metrics presented above [52] to quantify changes in the variability and complexity of motion patterns brought about by manual wheelchair propulsion experience. These pilot data suggest that slower speeds resulted in more complex and less variable motion patterns. It is possible that these metrics will provide novel information concerning whether or not pathology (e.g. neuromuscular disease, shoulder dysfunction, etc.) influences these metrics.
3. Conclusions
With the advent of computerized motion capture technology, it is possible to record body movements during specific tasks such as walking, running, etc. However, most current methods for analyzing these data primarily examine discrete events, focus primarily on single joints, or use relatively simple measures of motion (e.g., stride and step length). Thus, these approaches fail to exploit the richness of the motion capture data for providing better understanding of these complex motion patterns.
Walking is a spatiotemporally complex behavior. Each body segment is connected to another segment, and each body motion thus is coupled to the others during walking. Restrictions to any joint should cause correlated responses in other joints within the same (ipsilateral) and contralateral limbs. This effect is often seen in impaired gait compensation strategies that are caused by trauma or pathology, such as leg injuries or stroke. Physical development across the lifespan also results in changes in movement strategies, from crawling to initial walking to mature walking to aged walking. Yet few analysis tools have been developed that can quantitatively characterize these changes or differences in movement patterns.
3.1. Advantages of New Methods
We have recently developed a number of techniques to examine the complex interactions between body segments and joints used while walking. This work has led to techniques based on shape analysis, multivariate statistics, Fourier analysis, time normalization and temporal cross-correlation that can better identify changes in movement symmetry, timing, and coupling [49,50,51,52,53,54,69,70,73,74,75].
In this paper, we present three techniques that we have developed for quantitative characterization of complex motion patterns that may demonstrate symmetry or asymmetry. These techniques have been developed to characterize regions or periods of deviation in joint symmetry, quantify the complexity and variability of phase portrait shapes, and explore multivariate alignment and decomposition of gait shapes derived from joint center locations [49,50,51,52,53,54].
Regions of Deviation (ROD) analysis can provide better understand changes/differences in the timing and magnitude of joint kinematics in terms of bilateral symmetry and individual joint behavior. The original ROD technique allowed statistical quantification of deviations by examining peak amplitude and timing differences in kinematic time series data (joint angular position) [51] We have recently enhanced the approach by using piecewise t-tests throughout the gait cycle to better identify all of the deviant locations over the gait cycle [54]. We are currently exploring opportunities to apply this technique to different gait parameters (such as joint kinetics), and assessment of changes in gait behavior while recovering from lower limb injury (ankle sprains) or surgical intervention (knee meniscectomy).
Phase-portrait representations of limb segments can be used quantify the complexity and variability of motions. This method allowed us to quantify differences in phase portraits of lower limb segments (as opposed to lower limb joints). This technique has been found to be effective at distinguishing group differences and providing insight into the complexity and variability of these movement patterns through inter-subject and inter-cycle differences. To quantify complexity, we assessed the frequency content of the phase portraits. We used a Fourier-based approach to examine changes in gait complexity by quantifying the behaviors of the near elliptical angular phase portraits for the lower limb segments. Inter-cycle variability was assessed by quantifying fluctuations of the phase portrait centroid over multiple gait cycles, similar to traditional stabiliogram analyses of standing balance data. Variability was characterized by the drift and confidence area generated by the inter-cycle excursion of the phase portrait centroid. We used different iterations of this technique to examine gait differences due to child development [49], children with Developmental Coordination Disorder [50], and controlled joint mobility (using knee bracing) [52].
Gait cycle shapes, such as the spatial (x, y) displacement of a joint center over a gait cycle, can also be used to understand how particular gait perturbations cause asymmetries and deviations from normal motion. We expect that different lower limb impairments will result in different deviations from normal (i.e., healthy) gait cycle shapes. Using a multi-step process, Generalized Procrustes Analysis (GPA) was used first to construct a consensus healthy normative shape for each joint center’s displacement trajectory. Normal and perturbed motion profiles were then compared using Procrustes Analysis (PA) to obtain a matrix of residual differences for each pair of landmarks on the normal and perturbed trajectories. Finally, Parallel Factor Analysis (PARAFAC) was used to decompose deviations from the GPA consensus for both the healthy and perturbed data simultaneously. By simultaneously analyzing the data from various different experimental conditions, PARAFAC allows for the extraction of factors (or components) that are common to the entire system of conditions under study. Thus, PARAFAC produces solutions that lead to a better understanding of the complex interrelationships between lower limb impairments and deviations from healthy gait patterns. We have found that PARAFAC can be quite effective in identifying components that distinguish perturbed motion profiles from normal healthy ones, and identifying the timing, magnitude and direction of the spatial deviations that are most responsible for explaining these deviations [53].
The three techniques that we have presented can be used for examining a variety of complex motion patterns in different subject or patient populations. All three techniques provide methods for quantitatively comparing motion patterns between groups with different characteristics and within an individual overtime. They all can be used to quantify differences from a normal pattern that are due to disease or injury and can be used to assess the effectiveness of interventions and treatments. However, the particular technique to be used will be determined by the research or clinical question to be addressed, the number of gait cycles or trials that can be collected, and the data acquisition capabilities present in the laboratory or clinic. For these techniques to be most useful in clinical settings more affordable motion capture systems must be developed, a larger normal reference data set for general comparison needs to be established, these techniques need to be translated in to easy-to-use software, and further research must be conducted to determine how deviations from a normal pattern are related to underlying biomechanical and anatomical properties. This last issue is a major one, as there is no straightforward mapping between structural changes in the biomechanical system and the resulting movement pattern due to multiple and flexible forms of compensation. However, our techniques do provide a more detailed approach to how changes in one part of the system may influence more distal movement patterns in other parts of the system.
3.2. Summary
In this review we have described a number of techniques developed by our research team to quantify the variability and complexity of locomotion in developing children, children with developmental coordination disorder, healthy adults wearing a knee brace to simulate injury, quadrupeds, and in individuals using wheel chairs. In much of this research we have explored how a variety of conditions or injuries leads to deviations from the normally symmetric gait patterns found in young healthy adults. We have been exploring better ways to quantify these deviations so that ultimately we can develop more sensitive measures to detect and diagnose when individuals movement patterns diverge from normal, healthy patterns. An important aspect of this continued research is to gain a better understanding of how and when deviations from symmetry lead to degraded movement patterns and how and when asymmetric movement patterns over time may place increased stress on other parts of the system with potentially harmful consequences. Ultimately, we hope our research in this area will lead to improved diagnostic methods, improved monitoring of injury rehabilitation, and improved interventions for individuals with movement difficulties.
Acknowledgements
This work was funded by grants from the National Science Foundation (#0727083), and the Mary Jane Neer Disability Research Fund, Center for Advanced Studies, and Campus Research Board at the University of Illinois. The authors thank our collaborators Harry Dankowicz, Michael R. Lague, and Jesse Spencer-Smith, and graduate students K. Alex Shorter, Louis A. DiBerardino, Nate E. Helwig and Kiwon Park for their assistance on this body of work.
References and Notes
- Lai, K.A.; Lin, C.J.; Jou, I.M.; Su, F.C. Gait analysis after total hip arthroplasty with leg-length equalization in women with unilateral congenital complete dislocation of the hip-comparison with untreated patients. J. Orthopaed. Res. 2001, 19, 1147–1152. [Google Scholar] [CrossRef]
- Sutherland, D. The development of mature gait. Gait Posture 1997, 6, 162–170. [Google Scholar] [CrossRef]
- Arsenault, A.B.; Winter, D.A.; Marteniuk, R.G. Bilateralism of EMG profiles in human locomotion. Am. J. Phys. Med. Rehabil. 1986, 65, 1–16. [Google Scholar]
- Ounpuu, S.; DeLuca, P.; Davis, R.; Romness, M. Long-term effects of femoral derotation osteotomies: An evaluation using three-dimensional gait analysis. J. Pediat. Orthoped. 2002, 22, 139–145. [Google Scholar] [CrossRef]
- Ounpuu, S.; Gage, J.R.; Davis, R.B. 3-Dimensional lower-extremity joint kinetics in normal pediatric gait. J. Pediat. Orthoped. 1991, 11, 341–349. [Google Scholar] [CrossRef]
- Sadeghi, H.; Allard, P.; Prince, F.; Labelle, H. Symmetry and limb dominance in able-bodied gait: A review. Gait Posture 2000, 12, 34–45. [Google Scholar] [CrossRef]
- DeVita, P.; Hortobagyi, T.; Barrier, J.; Torry, M.; Glover, K.L.; Speroni, D.L.; Money, J.; Mahar, M.T. Gait adaptations before and after anterior cruciate ligament reconstruction surgery. Med. Sci. Sport. Exercise 1997, 29, 853–859. [Google Scholar] [CrossRef]
- Griffin, M.P.; Olney, S.J.; McBride, I.D. Role of symmetry in gait performance of stroke subjects with hemiplegia. Gait Posture 1995, 3, 132–142. [Google Scholar] [CrossRef]
- Skinner, H.B.; Effeney, D.J. Gait analysis in amputees. Am. J. Phys. Med. 1985, 64, 82–89. [Google Scholar]
- Visser, E.D.; Veth, R.P.H.; Schreuder, H.W.B.; Duysens, J.; Mulder, T. Reorganization of gait after limb-saving surgery of the lower limb. Am. J. Phys. Med. Rehabil. 2003, 825–831. [Google Scholar] [CrossRef]
- Becker, H.P.; Rosenbaum, D.; Kriese, T.; Gerngross, H.; Claes, L. Gait asymmetry following successful surgical-treatment of ankle fractures in young-adults. Clin. Orthop. Related Res. 1995, 262–269. [Google Scholar]
- Mittlmeier, T.; Weiler, A.; Sohn, T.; Kleinhans, L.; Mollbach, S.; Duda, G.; Sudkamp, N.P. Functional monitoring during rehabilitation following anterior cruciate ligament reconstruction. Clin. Biomech. 1999, 14, 576–584. [Google Scholar] [CrossRef]
- Tang, S.F.T.; Chen, C.P.C.; Hong, W.H.; Chen, H.T.; Chu, N.; Leong, C.P. Improvement of gait by using orthotic insoles in patients with heel injury who received reconstructive flap operations. Am. J. Phys. Med. Rehabil. 2003, 82, 350–356. [Google Scholar] [CrossRef] [PubMed]
- Grieve, D.W. Gait patterns and the speed of walking. Biomed. Eng. 1968, 119–122. [Google Scholar]
- Craik, R.L.; Oatis, C.A. Clinical Gait Analysis: Theory and Application; Mosby: St. Louis, MO, USA, 1995. [Google Scholar]
- Bruyn, J.; Bryden, P.; Perry, S. The effect of lateral preference on gait symmetry. J. Sport Exercise Psychol. 2003, 25, S32–S32. [Google Scholar]
- Chodera, J.D. Gait analysis from footprints. Physiotherapy 1974, 60, 179–181. [Google Scholar] [PubMed]
- Crowe, A.; Samson, M.M. 3-D analysis of gait: The effects upon symmetry of carrying a load in one hand. Hum. Movement Sci. 1997, 16, 357–365. [Google Scholar] [CrossRef]
- Diop, M.; Rahmani, A.; Belli, A.; Gautheron, V.; Geyssant, A.; Cottalorda, J. Influence off speed variation and age on the asymmetry of ground reaction forces and stride parameters of normal gait in children. J. Pediatr. Orthoped. 2004, 13, 308–314. [Google Scholar] [CrossRef]
- Draper, E.R.C. A treadmill-based system for measuring symmetry of gait. Med. Eng. Phys. 2000, 22, 215–222. [Google Scholar] [CrossRef]
- Hausdorff, J.M. Stride variability: Beyond length and frequency. Gait Posture 2004, 20, 304–304. [Google Scholar] [CrossRef]
- Knoll, Z.; Kocsis, L.; Kiss, R.M. Gait patterns before and after anterior cruciate ligament reconstruction. Knee Surg. Sports Traumatol. Ar. 2004, 12, 7–14. [Google Scholar] [CrossRef] [PubMed]
- Salamon, A.; Nikolic, V.; Jo-Osvatic, A.; Andric, V. Longitudinal gait analysis of injured ankle joint. Period. Biol. 2002, 104, 317–320. [Google Scholar]
- Stefanyshyn, D.J.; Engsberg, J.R. Right-to-left differences in the ankle joint complex range of motion. Med. Sci. Sport. Exercise 1994, 26, 551–555. [Google Scholar] [CrossRef]
- Chodera, J.D.; Levell, R.W. Footprint patterns during walking. In Perspectives in Biomedical Engineering; Kenedi, R.M., Ed.; University Park Press: Baltimore, MD, USA, 1973; pp. 81–90. [Google Scholar]
- Law, H.T. Microcomputer-based low-cost method for measurement of spatial and temporal parameters of gait. J. Biomed. Eng. 1987, 9, 115–120. [Google Scholar] [CrossRef]
- Allard, P.; Lachance, R.; Aissaoui, R.; Duhaime, M. Simultaneous bilateral 3-D able-bodied gait. Hum. Movement Sci. 1996, 15, 327–346. [Google Scholar] [CrossRef]
- Giakas, G.; Baltzopoulos, V. Time and frequency domain analysis of ground reaction forces during walking: An investigation of variability and symmetry. Gait Posture 1997, 5, 189–197. [Google Scholar] [CrossRef]
- Perttunen, J.R.; Anttila, E.; Sodergard, J.; Merikanto, J.; Komi, P.V. Gait asymmetry in patients with limb length discrepancy. Scand. J. Med. Sci. Sports 2004, 14, 49–56. [Google Scholar] [CrossRef] [PubMed]
- Lamoth, C.J.; Meijer, O.G.; Daffertshofer, A.; Wuisman, P.I.; Beek, P.J. Effects of chronic low back pain on trunk coordination and back muscle activity during walking: changes in motor control. Eur. Spine J. 2005, 29, 29. [Google Scholar] [CrossRef] [PubMed]
- Sadeghi, H.; Prince, F.; Sadeghi, S.; Labelle, H. Principal component analysis of the power developed in the flexion/extension muscles of the hip in able-bodied gait. Med. Eng. Phys. 2000, 22, 703–710. [Google Scholar] [CrossRef]
- Sadeghi, H.; Prince, F.; Zabjek, K.F.; Sadeghi, S.; Labelle, H. Knee flexors/extensors in gait of elderly and young able-bodied men (II). Knee 2002, 9, 55–63. [Google Scholar] [CrossRef]
- Sadeghi, H. Local or global asymmetry in gait of people without impairments. Gait Posture 2003, 17, 197–204. [Google Scholar] [CrossRef]
- Williams, G.E.; Silverman, B.W.; Wilson, A.M.; Goodship, A.E. Disease-specific changes in equine ground reaction force data documented by use of principal component analysis. Am. J. Vet. Res. 1999, 60, 549–555. [Google Scholar] [PubMed]
- Wilson, J.F.; Rochelle, R.D.; Bischoff, J.E. Identification and correlation of human footfall load parameters using multivariate analysis. J. Biomech. Eng. 1997, 119, 115–123. [Google Scholar] [CrossRef] [PubMed]
- Sadeghi, H.; Allard, P.; Barbier, F.; Sadeghi, S.; Hinse, S.; Perrault, R.; Labelle, H. Main functional roles of knee flexors/extensors in able-bodied gait using principal component analysis (I). Knee 2002, 9, 47–53. [Google Scholar] [CrossRef]
- Dien, J.; Beal, D.J.; Berg, P. Optimizing principal components analysis of event-related potentials: Matrix type, factor loading weighting, extraction, and rotations. Clin. Neurophysiol. 2005, 116, 1808–1825. [Google Scholar] [CrossRef] [PubMed]
- Weber, W.E. Mechanik der Menschlichen Gehwerkzeuge; Dietrichschen Buchhandlung: Gottingen, Germany, 1836. [Google Scholar]
- Hurmuzlu, Y.; Basdogan, C.; Carollo, J.J. Presenting joint kinematics of human locomotion using phase plane portraits and poincare maps. J. Biomech. 1994, 27, 1495–1499. [Google Scholar] [CrossRef]
- Goswami, A. A new gait parameterization technique by means of cyclogram moments: Application to human slope walking. Gait Posture 1998, 8, 15–36. [Google Scholar] [CrossRef]
- Wu, W.H.; Meijer, O.G.; Lamoth, C.J.C.; Uegaki, K.; van Dieen, J.H.; Wuisman, P.; de Vries, J.I.P.; Beek, P.J. Gait coordination in pregnancy: transverse pelvic and thoracic rotations and their relative phase. Clin. Biomech. 2004, 19, 480–488. [Google Scholar] [CrossRef]
- Winter, D.A. Biomechanics and Motor Control of Human Movement; 2nd Edition; Wiley: New York, NY, USA, 2004. [Google Scholar]
- Palmitier, R.A.; An, K.N.; Scott, S.G.; Chao, E.Y. Kinetic chain exercise in knee rehabilitation. Sport. Med. 1991, 11, 402–413. [Google Scholar] [CrossRef]
- Chu, D.A. Rehabilitation of the lower extremity. Clin. Sport. Med. 1995, 14, 205–222. [Google Scholar]
- Morrissey, M.C.; Hudson, Z.L.; Drechsler, W.I.; Coutts, F.J.; Knight, P.R.; King, J.B. Effects of open versus closed kinetic chain training on knee laxity in the early period after anterior cruciate ligament reconstruction. Knee Surg. Sports Traumatol. Ar. 2000, 8, 343–348. [Google Scholar] [CrossRef] [PubMed]
- Macintyre, J.G. 5-year follow-up of open or closed kinetic chain exercises for patellofemoral pain. Clin. Sport. Med. 2005, 15, 199–200. [Google Scholar] [CrossRef]
- Maffiuletti, N.A.; Bizzini, M.; Schatt, S.; Munzinger, U. A multi-joint lower-limb tracking-trajectory test for the assessment of motor coordination. Neurosci. Lett. 2005, 384, 106–111. [Google Scholar] [CrossRef] [PubMed]
- Fleming, B.C.; Oksendahl, H.; Beynnon, B.D. Open- or closed-kinetic chain exercises after anterior cruciate ligament reconstruction? Exerc. Sport Sci. Rev. 2005, 33, 134–140. [Google Scholar] [CrossRef] [PubMed]
- Polk, J.D.; Spencer-Smith, J.; DiBerardino, L.; Ellis, D.; Downen, M.; Rosengren, K.S. Quantifying variability in phase portraits: Application to gait ontogeny. Infant Behav. Develop. 2008, 31, 302–306. [Google Scholar] [CrossRef] [PubMed]
- Rosengren, K.S.; Deconinck, F.J.; Diberardino, L.A., 3rd; Polk, J.D.; Spencer-Smith, J.; De Clercq, D.; Lenoir, M. Differences in gait complexity and variability between children with and without developmental coordination disorder. Gait Posture 2009, 29, 225–229. [Google Scholar] [CrossRef] [PubMed]
- Shorter, K.A.; Polk, J.D.; Rosengren, K.S.; Hsiao-Wecksler, E.T. A new approach to detecting asymmetries in gait. Clin. Biomech. 2008, 23, 459–467. [Google Scholar] [CrossRef] [PubMed]
- DiBerardino, L.A., 3rd; Polk, J.D.; Rosengren, K.S.; Spencer-Smith, J.B.; Hsiao-Wecksler, E.T. Quantifying complexity and variability in phase portraits of gait. Clin. Biomech. 2010, 25, 552–556. [Google Scholar] [CrossRef] [PubMed]
- Helwig, N.E.; Hong, S.; Polk, J.D.; Lague, M.R. Analysis of Gait Cycle Shapes Using Parallel Factor Analysis. In Proceedings of the 34th Annual Meeting of the American Society of Biomechanics, Providence, RI, USA, 18–21 August, 2010. [Google Scholar]
- DiBerardino, L.A.; Ragetly, C.A.; Hong, S.; Griffon, D.J.; Hsiao-Wecksler, E.T. Improving Regions of Deviation Gait Symmetry Analysis with Pointwise T-Tests. In Proceedings of the 34th Annual Meeting of the American Society of Biomechanics, Providence, RI, USA, 18–21 August, 2010. [Google Scholar]
- DiBerardino, L.A.; Hong, S.; Ragetly, C.A.; Thomas, E.J.; Hsiao-Wecksler, E.T. Analysis and Classification Methods for Healthy and Cruciate-Deficient Dogs. In Proceedings of the 45th Annual Society of Engineering Science Conference, Urbana, IL, 12–15 October, 2008. [Google Scholar]
- Prieto, T.E.; Myklebust, J.B.; Hoffmann, R.G.; Lovett, E.G.; Myklebust, B.M. Measures of postural steadiness: Differences between healthy young and elderly adults. IEEE Trans. Biomed. Eng. 1996, 43, 956–966. [Google Scholar] [CrossRef]
- Thomas, D. Elliptical Fourier shape descriptors. Available online: http://www.mathworks.com/matlabcentral/fileexchange/12746 (Accessed on 1 June 2010).
- Kuhl, F.P.; Giardina, C.R. Elliptic Fourier features of a closed contour. Comput. Graph. Image Process. 1982, 18, 236–258. [Google Scholar] [CrossRef]
- Larkin, D.; Hoare, D. Out of step: Coordinating kids movement. Active Life Foundation: Perth, Australia, 1991. [Google Scholar]
- Collard, M.; O’Higgins, P. Ontogeny and homoplasy in the papionin monkey face. Evol. Dev. 2001, 3, 322–331. [Google Scholar] [CrossRef] [PubMed]
- Hennessy, R.J.; Moss, J.P. Facial growth: Separating shape from size. Eur. J. Orthodont. 2001, 23, 275–285. [Google Scholar] [CrossRef]
- Lague, M.R. Another look at shape variation in the distal femur of Australopithecus afarensis: Implications for taxonomic and functional diversity at Hadar. J. Hum. Evol. 2002, 42, 609–626. [Google Scholar] [CrossRef] [PubMed]
- Kaliontzopoulou, A.; Carretero, M.A.; Llorente, G.A. Multivariate and geometric morphometrics in the analysis of sexual dimorphism variation in Podarcis lizards. J. Morphol. 2007, 268, 152–165. [Google Scholar] [CrossRef] [PubMed]
- Gunz, P.; Bookstein, F.L.; Mitteroecker, P.; Stadlmayr, A.; Seidler, H.; Weber, G.W. Early modern human diversity suggests subdivided population structure and a complex out-of-Africa scenario. Proc. Nat. Acad. Sci.USA 2009, 106, 6094–6098. [Google Scholar] [CrossRef] [PubMed]
- Gower, J.C. Generalized procrustes analysis. Psychometrika 1975, 40, 33–51. [Google Scholar] [CrossRef]
- Ten Berge, J.M.F. Orthogonal Procrustes rotation for two or more matrices. Psychometrika 1977, 42, 267–276. [Google Scholar] [CrossRef]
- Schonemann, P.H.; Carroll, R.M. Fitting one matrix to another under choice of a central dilation and a rigid motion. Psychometrika 1970, 35, 245–256. [Google Scholar] [CrossRef]
- Harshman, R.A.; Lundy, M.E. The PARAFAC model for three-way factor analysis and multidimensional scaling. In Research Methods for Multimode Data Analysis; Law, H.G., Snyder, C.W., Jr., Hattie, J., McDonald, R.P., Eds.; Praeger: New York, NY, USA, 1984; pp. 122–215. [Google Scholar]
- Park, K.; Dankowicz, H.; Hsiao-Wecksler, E.T. Characterization of Spatiotemporally Complex and Coupled Gait Patterns Using Cross-Correlation. In Proceedings of the 16th US National Congress on Theoretical and Applied Mechanics (USNCTAM), State College, PA, USA, 27 June–2 July, 2010. [Google Scholar]
- Sosnoff, J.J.; DiBerardino, L.A.; Park, K.; Rampurawala, Z.; Daigle, S.; Hsiao-Wecksler, E.T. Complexity and Variability in Manual Wheelchair Propulsion. In Proceedings of the 16th US National Congress on Theoretical and Applied Mechanics (USNCTAM), State College, PA, USA, 27 June–2 July, 2010. [Google Scholar]
- Davids, K.; Bennett, S.; Newell, K. Variability in the Movement System: A Multidisciplinary Perspective; Human Kinetics: Champaign, IL, USA, 2006. [Google Scholar]
- Newell, K.; Vaillancourt, D. Dimensional change in motor learning. Hum. Movement Sci. 2001, 20, 695–715. [Google Scholar] [CrossRef]
- Helwig, N.E.; Hong, S.; Hsiao-Wecksler, E.T. Time-Normalization Techniques for Gait Data Curves. In Proceedings of the 33rd Annual Meeting of the American Society of Biomechanics, State College, PA, USA, 26–29 August, 2009. [Google Scholar]
- Helwig, N.E.; Hong, S.; Hsiao-Wecksler, E.T. Partitioning Gait Cycle Curves into Temporal and Intensity Differences. In Proceedings of the 33rd Annual Meeting of the American Society of Biomechanics, State College, PA, USA, 26–29 August, 2009. [Google Scholar]
- Helwig, N.E.; Hong, S.; Hsiao-Wecksler, E.T.; Polk, J.D. Methods to temporally align gait cycle data. 2010; in preparation. [Google Scholar]
Figure 1.
Example of SROD data for hip joint movement resulting from a single individual wearing a knee brace (KB) that restricts movement of the right knee. These data are compared to ensemble-averaged group mean and standard deviation values during normal unbraced (UB) walking. (Adapted from [51].)

Figure 2.
Example of IROD data for right hip joint movement for a single individual wearing a knee brace on the right knee compared to ensemble-averaged group mean and standard deviation values during normal unbraced walking. (Adapted from [51].)
Figure 2.
Example of IROD data for right hip joint movement for a single individual wearing a knee brace on the right knee compared to ensemble-averaged group mean and standard deviation values during normal unbraced walking. (Adapted from [51].)

Figure 3.
Phase portraits of right thigh during normal unbraced and braced walking over four cycles. Values for complexity (# harmonics) and variability (drift and area) for 20 consecutive gait cycles for 20 healthy male subjects, derived from results in [52].
Figure 3.
Phase portraits of right thigh during normal unbraced and braced walking over four cycles. Values for complexity (# harmonics) and variability (drift and area) for 20 consecutive gait cycles for 20 healthy male subjects, derived from results in [52].

Figure 4.
Average (over subjects) gait cycle shapes in the non-braced (black dotted), knee-braced (red solid), and ankle-braced (blue dashed) conditions after alignment with GPA consensus. The symbols square, star, triangle, circle, and diamond represent 20%, 40%, 60%, 80%, and 100% of the gait cycle, respectively.

Figure 5.
Condition weights for the effect of wearing a right knee brace on ankle motion patterns. KB = knee brace, NB = no brace. R and L indicate right and left sides, respectively. Idealized motion trajectories are shown to aid interpretation. Dotted line = normal, Solid = braced. Symbols follow Figure 4.


© 2010 by the authors; licensee MDPI, Basel, Switzerland. This article is an Open Access article distributed under the terms and conditions of the Creative Commons Attribution license (http://creativecommons.org/licenses/by/3.0/).
Share and Cite
MDPI and ACS Style
Hsiao-Wecksler, E.T.; Polk, J.D.; Rosengren, K.S.; Sosnoff, J.J.; Hong, S. A Review of New Analytic Techniques for Quantifying Symmetry in Locomotion. Symmetry 2010, 2, 1135-1155. https://0-doi-org.brum.beds.ac.uk/10.3390/sym2021135
AMA Style
Hsiao-Wecksler ET, Polk JD, Rosengren KS, Sosnoff JJ, Hong S. A Review of New Analytic Techniques for Quantifying Symmetry in Locomotion. Symmetry. 2010; 2(2):1135-1155. https://0-doi-org.brum.beds.ac.uk/10.3390/sym2021135
Chicago/Turabian StyleHsiao-Wecksler, Elizabeth T., John D. Polk, Karl S. Rosengren, Jacob J. Sosnoff, and Sungjin Hong. 2010. "A Review of New Analytic Techniques for Quantifying Symmetry in Locomotion" Symmetry 2, no. 2: 1135-1155. https://0-doi-org.brum.beds.ac.uk/10.3390/sym2021135