Symmetry and Asymmetry in Bouncing Gaits

Dipartimento di Fisiologia Umana, Università degli Studi di Milano, 20133 Milan, Italy
Symmetry 2010, 2(3), 1270-1321; https://0-doi-org.brum.beds.ac.uk/10.3390/sym2031270
Submission received: 16 December 2009
/
Revised: 18 June 2010
/
Accepted: 24 June 2010
/
Published: 25 June 2010
(This article belongs to the Special Issue Feature Papers: Symmetry Concepts and Applications)
Abstract
:In running, hopping and trotting gaits, the center of mass of the body oscillates each step below and above an equilibrium position where the vertical force on the ground equals body weight. In trotting and low speed human running, the average vertical acceleration of the center of mass during the lower part of the oscillation equals that of the upper part, the duration of the lower part equals that of the upper part and the step frequency equals the resonant frequency of the bouncing system: we define this as on-off-ground symmetric rebound. In hopping and high speed human running, the average vertical acceleration of the center of mass during the lower part of the oscillation exceeds that of the upper part, the duration of the upper part exceeds that of the lower part and the step frequency is lower than the resonant frequency of the bouncing system: we define this as on-off-ground asymmetric rebound. Here we examine the physical and physiological constraints resulting in this on-off-ground symmetry and asymmetry of the rebound. Furthermore, the average force exerted during the brake when the body decelerates downwards and forwards is greater than that exerted during the push when the body is reaccelerated upwards and forwards. This landing-takeoff asymmetry, which would be nil in the elastic rebound of the symmetric spring-mass model for running and hopping, suggests a less efficient elastic energy storage and recovery during the bouncing step. During hopping, running and trotting the landing-takeoff asymmetry and the mass-specific vertical stiffness are smaller in larger animals than in the smaller animals suggesting a more efficient rebound in larger animals.

1. Introduction
1.1. The Motor and the Machine
Locomotion results from the interaction of a motor, represented by the skeletal muscles, and a machine, the limb lever system (Figure 1). The muscles transform chemical energy of fuel ∆G into heat and positive mechanical work, Wm+, given by the product of muscular force and muscle shortening. The primary muscle shortening, similar to the motion of the pistons in a car engine, is not suitable to sustain locomotion directly. Positive muscular work must be done on a lever system, which has the task to interact appropriately with the surrounding to promote locomotion. The minimum, inevitable, work which has to be done to maintain the motion of any object in a surrounding, is given by the product of the resistance offered by the surrounding, the external frictional drag, times the distance covered during the motion. The overall efficiency of the locomotory apparatus may therefore be expressed as the ratio between the minimum work necessary to maintain motion and the chemical energy transformed by the muscles, i.e.,
Equation 1 can be rewritten as:
showing that the chemical energy expenditure per unit of the distance covered during locomotion, the so called cost of transport, is greater the greater the external drag and the smaller the overall efficiency.
Overall efficiency = (Distance•drag)/∆G
∆G/Distance = Drag/Overall efficiency
1.2. The Problem of Terrestrial Locomotion
Figure 2 shows that, for a given body weight on the abscissa, the weight specific cost of transport is smaller in swimming of fishes, intermediate in flying birds and insects and maximum in walking and running on earth [1]. This in spite of the fact that the frictional drag offered by the water in swimming is much greater than that offered by the air in terrestrial locomotion, and that in flying the body must be continuously supported against gravity, whereas in terrestrial locomotion the body is supported by the ground. These data show that, for some reason, the overall efficiency in terrestrial locomotion is less than in swimming and flying. An exception to this general rule is represented by the similar cost of transport found in some running, swimming and flying mammals (bats) [2].
The overall efficiency (equation 1) can be written as
i.e., as the product of the efficiency of muscular contraction (Wm+/∆F) and the efficiency of the machine (Distance drag)/Wm+), which we may call propulsive efficiency. The muscular efficiency indicates the ability of the motor to transform chemical energy into positive work by reducing to a minimum the losses into heat. The propulsive efficiency, on the other hand, is an indication of the ability of the machine to utilize in the best way the positive work supplied by the muscles to move the body forwards against the resistance offered by the surrounding.
Overall efficiency = (Wm+/∆F) (Distance drag)/Wm+)
A difference in muscular efficiency can hardly explain the different cost of transport in swimming, flying and terrestrial locomotion. The maximum muscular efficiency, in a complete cycle of contraction and aerobic recovery, is about 0.25 both in human [3] and in the frog skeletal muscle [4]. In addition, humans can reduce drastically the cost of transport by means of a bicycle indicating that the limiting factor is the propulsive efficiency, not the efficiency of muscular contraction. In fact, by using a bicycle, i.e., a clever lever system applied to the leg, the overall efficiency attains 0.22, a value approaching the maximum efficiency of muscular contraction [5]. According to equation (2) this indicates a value of propulsive efficiency approaching unity: (Distance drag)/Wm+) = 0.22/0.25 = 0.88. It is therefore the propulsive efficiency, which is much smaller in walking and running than in flying and swimming. Why?
1.3. Positive and Negative Muscular Work
During running on the level at a constant average speed we feel our muscles contracting actively and our energy expenditure is evidently increased relative to the resting condition indicating that muscular force performs positive work. What is used for the positive work done by the muscles? Air resistance is negligible except at high running speeds [6,7] and no work is done against the frictional force on the ground if no skidding takes place. In fact work is force times displacement and if the foot does not move relative to the ground the work done against the frictional force offered by the ground is nil. It is not nil when we run on sand [8] and, in fact, we feel the difference. Therefore, a negligible amount of the positive work done by the muscles is dissipated against external frictions.
Since gravitational potential energy and kinetic energy of the body are unchanged at the end of the run on the level at a constant average speed, the positive work done by the muscles is found neither as an average increase in gravitational potential energy, as when climbing a hill, nor as an average increase in kinetic energy, as at the start of a race. Where does it go? The answer shows immediately why the propulsive efficiency of terrestrial locomotion is so low. The positive work done by the muscles is used to increase temporarily the kinetic and/or the gravitational potential energy of the body, but subsequently these energies return into the muscles themselves when these decelerate and/or lower the body in another phase of the step. In other words, in terrestrial locomotion on the level at a constant average speed, the muscles create mechanical energy to destroy it immediately after: this makes walking and running so expensive.
This also shows an important link between mechanics of terrestrial locomotion and muscle physiology: the muscles in vivo are requested not only to behave as a motor, transforming chemical energy into positive mechanical work, but also as an active brake, absorbing kinetic and/or potential energy of the body simultaneously with the chemical energy required to remain active. In this case the muscular force performs negative work, Wm−, because the displacement of its point of application is opposite to the direction of the force. This is quite a performance of muscle (we cannot reverse or even stop the movement of the pistons in an activated car engine or the rotor of an activated electrical motor without excessive heating of it). In spite of the fact that the braking function of muscle has been extensively studied, e.g., [9,10,11,12,13], it is less understood than its motor function and yet it is as frequently used in exercise.
In fact, we can classify all the muscular exercises on the basis of the ratio between negative and positive work done by the muscular force as qualitatively shown in Figure 3. It can be seen that only in some exercises the muscular force performs almost solely positive work, namely the ratio between negative and positive work approaches zero. In these exercises the positive work done by the muscles is dissipated by large external friction, as in pumping blood by the heart, or in some kind of swimming or soaring. In other exercises, the muscles perform mainly positive work, but also negative work, for example in walking uphill [14], at the start of a race [15], in quiet breathing [16] or in cycling at a high pace [17]. As mentioned above, in walking and running on the level at a constant average speed the muscles perform about the same amount of positive and negative work. Negative work becomes obviously preponderant when the average mechanical energy of the body decreases, as in downhill walking [14] and ski alpine [18].
At this point we should ask again: why so much more of this uneconomical negative work occurs in terrestrial locomotion than in swimming and flying? The answer is simple. Contrary to swimming or flying where the extremity of the fins or of the wings can slide relatively to the air or to the water, in terrestrial locomotion the velocity of the foot relative to the ground reduces to zero at each step. After the thrust, a fish or a bird can move through the water or the air perfectly still, whereas an inexorable back and forth movement of the limbs is always present in terrestrial locomotion. The fixed point of contact on the ground makes stricter than in swimming and flying the dependence of the velocity of muscular contraction, and then of the force developed by the muscles, from the speed of locomotion, . In fact, since the velocity of the foot relative to the ground is nil during contact, the lower limb must be moved backward relative to the center of mass of the body by muscular contraction with a velocity that will depend on the speed of the center of mass relative to the ground, i.e., on the speed of locomotion. This has been shown during sprint running where the power developed during the push changes with increasing running speed [15]. This is one of the factors setting a limit to the maximal speed attained in running. In addition, it is the origin of the negative work done by the muscles during constant speed locomotion.
Figure 4 shows that in the motion of a wheel, the forward velocity vector is at each instant perpendicular to the link between center of gravity and point of contact on the ground, so that no component of the velocity along the link exists and the velocity can be maintained constant during a cycle. On the contrary, during locomotion, the movement is similar to that of a square wheel. At each step the center of gravity is successively behind and in front of the point of contact. When it is behind the point of contact, a forward deceleration of the center of gravity of the body takes place due to the projection of the velocity vector along the more or less rigid link connecting the center of gravity with the foot. The center of gravity must then be reaccelerated forwards, when it is in front of the point of contact, to maintain the average speed constant. The forward deceleration of the center of gravity during the braking phase of the step is a problem; in fact it implies a loss of kinetic energy of the body and subsequent energy expenditure to restore the kinetic energy loss. Where kinetic energy ends up during the braking phase of the step?
1.4. Two Partial Solutions: Pendular Exchange in Walking and Storage-Release of ‘Elastic’ Energy in Bouncing Gaits
The locomotory system tries its best to reduce the negative effect of this loss of energy by two fundamental mechanisms: the pendular mechanism of walking where, during its forward deceleration, the center of gravity is raised with the consequence that kinetic energy is transformed in part into gravitational potential energy. This is an attempt of the machine, the lever system, to increase the propulsive efficiency by maintaining constant, as much as possible, the total mechanical energy of the center of mass of the body. However this mechanism works only over a limited range of speeds. The other fundamental mechanism, more suitable at higher locomotion speeds, is the ‘elastic’ mechanism of running, hopping and trotting, where, during the forward deceleration, the center of gravity is lowered with the consequence that both kinetic and gravitational potential energy of the center of mass decrease and increase simultaneously resulting in large changes of the total mechanical energy of the center of mass. This is a complete defeat of the machine attempts to increase the propulsive efficiency, but it gives the chance to store some of kinetic and gravitational potential energy absorbed by muscle-tendon units during the brake and to restore part of it during the subsequent push.
1.5. The Stretch-Shorten Cycle of Muscle-Tendon Units
Evidence of an enhancement of positive work production induced by previous stretching of muscle-tendon units was found both on human running [19], on living animals during running, hopping and trotting [20,21,22] and on man’s forearm flexors and isolated specimens in controlled laboratory conditions [23,24,25,26,27] (Figure 5).
2. Experimental Section
What follows in this section was initiated by two classic papers of Fenn [29,30]. The division of the work done to sustain locomotion into external and internal work derives from Koenig’s theorem, stating that the total kinetic energy of a system of particles is given by the sum of (a) the kinetic energy of a point moving with the velocity of the center of gravity and having the mass of the whole system, and (b) the kinetic energy associated with the velocity of the particles relative to the center of mass. The increment of the total kinetic energy of the system in a given time equals the work done in that time by all the forces acting on the system, external (to increase the kinetic energy of the center of mass) and internal (to increase the kinetic energy of the particles calculated from their velocity relative to the center of mass). During locomotion external positive work has to be done to increase kinetic and gravitational potential energy of the center of mass of the body, whereas internal work has to be done mainly to accelerate the limbs relative to the center of mass (see below).
2.1. External Work
At each step of walking and running, the change in kinetic energy of forward motion of the center of mass of the body, Ekf = 0.5 Vf2 Mb, where Vf is the instantaneous forward velocity of the center of mass and Mb is the body mass, is associated with a vertical displacement of the center of mass and, as a consequence, with a change in gravitational potential energy, Ep = Mb g H, where H is the height of the center of mass. Contrary to walking where the changes of Ekf and Ep are in opposition of phase, in human running (Figure 6) as well as in running birds, trotting dogs, monkey and rams, hopping kangaroos and springhare (Figure 7) the Ekf and Ep changes are almost simultaneously absorbed by the muscles during the brake when muscular force performs external negative work, Wm−, and restored during the push when muscular force performs external positive work, Wm+, i.e., the change in the total mechanical energy of the center of mass, ∆Etot,cm, is
Note that the vertical velocity of the center of mass, Vv, and as a consequence the kinetic energy of vertical motion, Ekv=0.5 Vv2 Mb, are nil at the bottom and the top of the trajectory of the center of mass. It follows that Ekv does not affect the increment in gravitational potential energy, ∆Ep, which represents the positive work done against gravity, and the increment of the total mechanical energy of the center of mass, ∆Etot,cm, which represents the positive external work done, Wext.
Using the definition of work, the external work done at each instant is given by:
where Fr is the resultant of all external forces acting on the body, φ is the angle between Fr and displacement of the center of mass, Dcm, and f, d and a are the projections of Fr, Dcm and the acceleration of the center of mass in forward, vertical and lateral directions. The characters in Bold indicate that the displacement in forward direction and the force in vertical direction are responsible for most of Wext. In the lateral direction both displacement and force are small (about 1% of vertical and forward work in walking [31]) and are neglected in this study.
Wext = Fr Dcm cos ϕ = fh dh + fv dv + fl dl ≈ Mb ah dh + (Weight + Mb av) dv
As mentioned above, Wm− and Wm+ are called external negative and positive work because a force external to the body system is necessary to change the mechanical energy of the center of mass, Etot,cm. Since air resistance is negligible at most locomotion speeds the external force resulting in a change of Etot,cm is the ground reaction force. For this reason, external work is measured using a force-platform whose output signals are proportional to the force impressed by the feet on it during the run (Figure 8). In the experiments presented in this paper, the force platform used was sensitive to the forward and vertical components of the force, neglecting the lateral component.
The procedure followed to determine the curves in Figure 6 and Figure 7, and the external work, has been described in detail in several studies [34,35,36]. In short: the horizontal force and the vertical force minus the body weight were integrated electronically to determine the instantaneous velocity of the center of mass of the body to yield the instantaneous kinetic energy, Ek = Ekf + Ekv. The change in potential energy Ep was calculated by integrating vertical velocity as a function of time to yield vertical displacement, and multiplying this by body weight. The total mechanical energy of the center of mass as a function of time Etot,cm was obtained by adding the instantaneous kinetic and potential energies. The positive external mechanical work was obtained by adding the increments in total mechanical energy over an integral number of strides.
2.2. Within-Step Analysis of the Potential-Kinetic Energy Transduction
The transduction taking place within the step r(t) between gravitational potential energy Ep and kinetic energy of the center of mass Ek can be determined from the absolute value of the changes, both positive and negative increments, of Ep, Ek and Ecm in short time intervals within the step cycle [37]:
r(t) = 1 − |∆Ecm(t)|/(|∆Ep(t)| + |∆Ek(t)|)
The Ep - Ek transduction is complete (r(t) = 1) during the aerial phase (ballistic lift and fall) when no external work is done by the muscular force. However, the Ep - Ek transduction also occurs during contact, when the body is partially supported by the foot on the ground in the upper part of the trajectory of the center of mass (0 < r(t) < 1).
The Ep - Ek transduction is nil (r(t) = 0) in two phases of the bouncing step, α and β, where Ek increases, respectively decreases, simultaneously with the gravitational potential energy Ep. In fact, in this case the sum |∆Ep(t)| + |∆Ek(t)| would equal |∆Ecm(t)|, and the ratio in equation (4) would equal unity resulting in r(t) = 0. Note that positive and negative external work is done both in the phases α and β of the step (r(t) = 0) and in the phases of the step where a transduction occurs between Ek and Ep (0 < r(t) < 1).
In the following text r(t) was calculated from the absolute value of the time derivative of Ep, Ek and Ecm in the time interval comprised between two Ep valleys. The cumulative value of energy recovery, Rint(t), resulting from the instantaneous Ek - Ep transduction, was measured from the area below the r(t) record divided by the step period: Rint(t) = (∫0tr(u)du)/τ. At the end of the step Rint(τ) = Rint.
2.3. Internal Work
As W.O. Fenn noted in 1930 [29]: ‘If the kinetic energy is calculated in relation to the ground, then the limb going backwards has very small kinetic energy although the actual effort on the part of the runner is as great in pushing it backwards as in pushing it forwards.’ This clearly shows that internal work must be measured as the kinetic energy changes of the limbs relative to the center of mass of the body and not relative to the ground. Calculation of internal work is more complicated than for external work; the records of the mechanical energy level of the individual body segments, obtained by cinematography, are far more complex, difficult to interpret and inherently more noisy. Furthermore, calculation of internal work requires assumptions about the physical properties of the body segments, as well as regarding a possible transfer of energy to and from different body segments. In addition internal work is done not only to accelerate the limbs, but also against gravity to lift the limbs in equal and opposite movements, which are not measured as external work with the force-platform method, and may (or may not) be sustained by a pendular transfer of kinetic into gravitational potential energy during the oscillation of the limb. All these possibilities of error have been analyzed by [29], [38] and [39] with the conclusion that the internal work is most accurately measured as the kinetic energy changes of the limbs relative to the center of mass, including energy transfer only between segments of the same limb (e.g., from thigh to leg).
As shown in [40] and [41], the mass-specific internal work done per unit distance to accelerate the limbs relative to the center of mass of the body, Wint/MbL, can now be conveniently calculated from the experimental values of step length L (m), average running speed (m s−1), step frequency f (Hz) and mass of the body Mb (kg) according to the equation:
The mass-specific positive work done per unit distance at different running speeds calculated from equation 5 is in good agreement with experimental data measured assuming a transfer of energy between the two segments of each limb in [29], [38] and [39].
Equation 5 shows that the internal work is greater when a given running speed , is sustained with a greater step frequency and a shorter step length. This is particularly relevant when we will consider how the symmetry of the rebound in bouncing gaits affects step frequency.
2.4. Total Work
This was measured by Fenn [29,30], and by Cavagna and Kaneko [38] as the sum of the absolute values of external and internal work neglecting energy transfer between the kinetic energy of the center of mass and that of the limbs. There has been uncertainty concerning a possible transfer between the mechanical energy of the center of mass and that of the limbs [14,29,38,40,42,43,44,45,46,47]. This external-internal energy transfer may possibly occur when the center of mass of the body accelerates or decelerates during ground contact. For example, if the center of mass decelerates forwards, the limbs tend to maintain their forward velocity by inertia and, therefore, to accelerate forwards relative to the center of mass. Consequently, in this case, the increase in kinetic energy of the limbs relatively to the center of mass is not due to positive work done by the muscles. This example shows that, while the body is in contact with the ground, external forces may change the movement of the limbs relative to the center of mass, and such movement, therefore, cannot be attributed solely to internal forces. This effect was tested by comparing the internal work calculated taking into account the described effect of inertia with the internal work calculated as the sum of the increments in kinetic energy of the limbs relative to the center of mass: the ratio between the two values was 0.97 ± 0.03 (mean ± S.D., N = 106) in walking and 1.03 ± 0.03 (mean ± S.D., N = 123) in running [39].
A maximum transfer between the mechanical energy of the center of mass and that of the limbs is obtained by summing at each instant the kinetic energy of center of mass relative to the surrounding with that of the limbs relative to the center of mass. This procedure however is not correct because, for a given change in velocity of the center of mass relative to the surrounding, the corresponding change in kinetic energy depends on the average speed of locomotion, which per se cannot affect the transfer between kinetic energy of the center of mass relative to the surrounding and kinetic energy of the limbs relative to the center of mass.
On the other hand, as mentioned above, the internal work calculated solely from the velocity changes of the limbs relative to the center of gravity may be: i) increased by the work done against gravity in equal and opposite vertical movements of the limbs (which would not be measured as external work), and ii) decreased by a pendular transfer between gravitational potential energy and kinetic energy during the oscillation of the limb. These possibilities were taken into account with the conclusion that the estimate of the total work as the sum of the absolute values of Wext and Wint, measured from the kinetic energy changes of the limbs relative to the center of mass, is substantially correct [39].
3. The on-Off-Ground Asymmetry
3.1. The Spring-Mass Model
The mechanical energy changes of the center of mass during a step of running, hopping and trotting (Figure 6 and Figure 7) suggest an elastic rebound of the body. This interpretation was substantiated by the high efficiency of positive work production measured during running (~50%) indicating that about half of positive work was delivered at very low cost as elastic recoil energy from the stretched contracted muscle-tendon units [19].
A spring-mass model was proposed by Blickhan to simulate the bounce of the body [32]. This model was largely used in the interpretation of experiments aimed to determine the changes in spring stiffness and step frequency with speed [48], with grounds of different compliance [49,50,51] and the effect of spring stiffness on energy expenditure [51,52].
In the present study the rebound of the whole body is analyzed from the displacement of the center of mass of the whole body. Individual limbs swing and contact phases are not considered in the analysis because their actions sum up in the displacement of the whole body center of mass.
The bouncing step is often divided into a contact time, during which the foot in running, or the feet in hopping and trotting are on the ground, and an aerial time, during which the body is airborne. This division is inappropriate when analyzing the apparent elastic bounce of the body in physical terms. In fact, an aerial time may not occur at all in the bouncing step: during trotting and in human running at very low speeds the vertical oscillation of the center of mass of the body may take place entirely in contact with the ground [53]. Even in the presence of an aerial phase, the vertical displacement of the center of mass of the body below and above the instant the foot contacts and leaves the ground bears no relation with the amplitude of the oscillation. In the harmonic oscillator the amplitude of the oscillation is the maximum deformation of the system from its resting equilibrium position. Both in the spring-mass model [32] as in the real bouncing step, the vertical oscillation takes place above and below an equilibrium position where the vertical force equals body weight.
The apparent elastic bounce of the body therefore has been divided into two parts: a part taking place when the vertical force exerted on the ground is greater than body weight (lower part of the oscillation, called effective contact time tce) and a part taking place when this force is smaller than body weight (upper part of the oscillation, called effective aerial time, tae) [53]. Note that, according to this division, the lower part of the oscillation takes place always in contact with the ground, whereas the upper part of the oscillation includes a fraction of the contact time and may or may not include an aerial time.
During running on the level, the vertical momentum lost and gained during tce (lower part of the oscillation) must equal the vertical momentum lost and gained during tae (upper part of the oscillation), i.e.,
where and are the average vertical accelerations of the center of mass during the effective contact time tce and the effective aerial time tae, respectively. Some relevant physiological consequences predicted by Blickhan’s model for running and hopping are discussed below.
3.2. The Symmetric Rebound
At low speeds of running and in trotting the duration of the lower part of the vertical oscillation, tce, is about equal to that of the upper part, tae (Figure 9 and Figure 10). This was called a symmetric rebound [53]. Using Blickhan’s words, in this condition: “The mass oscillates around the resting position determined by the spring stiffness and the animal weight. The contact time approaches the period of the oscillator”.
According to equation 6, a symmetric rebound (i.e., tce = tae) implies the same average vertical acceleration during the lower and the upper part of the vertical oscillation of the center of mass (i.e., = ). In human running this condition is met up to ~11 km h−1: and increase similarly with speed, but never exceed 1 g [54]. Most of the vertical oscillation of the center of mass takes place in contact with the ground and the step frequency f equals the resonant frequency of the bouncing system, fs (Figure 9 and Figure 10). Note that the resonant frequency of the bouncing system calculated as fs = 1/(2 tce) coincides, as a first approximation, with the frequency calculated as fs = (k/Mb)1/2/(2π), where Mb is the body mass and k/Mb is the mass specific vertical stiffness, i.e., the slope of a linear fit between vertical acceleration of the center of gravity and vertical displacement of the center of gravity during tce [53]. This shows that the vertical displacement during tce changes with time similarly to the half period of a sine function, as predicted by the model. The mass specific vertical stiffness, k/Mb, and as a consequence the resonant frequency of the bouncing system, fs, increase with the speed of locomotion in all the animals tested in previous studies [53,55]. In humans fs remains about constant up to ~11 km h−1 and then increases with speed [53,54].
3.3. The on-off-ground Asymmetric Rebound
Figure 9 shows that in human running the effective contact time, tce, decreases with increasing speed above approximately 11 km h−1 whereas tae remains approximately constant. The decrease of tce with running speed can be explained as follows. The fraction of the step length, Lce, taking place during the lower part of the oscillation, i.e., during tce, tends to a constant value [53,54]. This is possibly due to anatomical and/or functional factors limiting the angle swept by the body structures connecting center of mass and point of contact on the ground during tce. It follows that with increasing running speed, , the half period of the oscillation, which is tce ~ Lce/, necessarily decreases.
In order to maintain a symmetric rebound, tae should decrease with speed similarly to tce, but this would imply and (equation 6). In young and adult humans, however, increases with running speed beyond 1g, whereas cannot increase beyond 1g (note that would attain a maximum value of 1 g if tae would equal the aerial time). As a consequence, a greater duration of tae relative to tce is necessary to compensate for the lower acceleration during tae relative to tce (equation 6). This translates into an asymmetric rebound, i.e., tae > tce and in a step frequency, f = 1/(tce + tae) lower than the apparent resonant frequency of the bouncing system fs = 1/(2tce). The same is true for all speeds of hopping (Figure 11).
This asymmetry of the rebound therefore is an on-off-ground asymmetry, expression of the amount of force impressed to the body during the lower part of the oscillation when both positive and negative works are done. Using Blickhan’s words, in this condition: “The time course of the ground reaction force approaches a sine half-wave whose amplitude greatly exceeds the animal weight”.
In conclusion: in the symmetric rebound, at low running speeds and in trotting, the step frequency equals the resonant frequency of the bouncing system, whereas in the on-off-ground asymmetric rebound, at high running speeds and in hopping, the step frequency is lower than the resonant frequency of the bouncing system. The question arises: how the step frequency change induced by the symmetry and the on-off-ground asymmetry of the rebound affects the mechanical work done to sustain locomotion and the corresponding energy expenditure?
3.4. Effect of Step Frequency on Mechanical Power Output
Direct experience gives us a qualitative indication. We can walk or run at a given speed with our natural, freely chosen step frequency and feel comfortable. Or we can force ourselves to walk and run at the same speed with a longer step length, i.e., with a step frequency lower than the natural one, and we clearly feel that the impact against the ground is annoyingly increased. Or we can force ourselves to walk or run at the same speed with a shorter step length, i.e., with a step frequency higher than the natural one: in this case we feel that the impact against the ground is decreased, but that we have to make an effort to stiffen the lower limbs in order to accelerate them back and forth more frequently.
The square wheel model, described above (Figure 4), not only shows the origin of the external work, but also shows its dependence on the step frequency (Figure 12). In fact, the horizontal component of the braking force, directed backwards, will decrease by increasing the number of spokes, in a polygonal wheel, because at the moment of the impact of the spokes on the ground, the direction of the link between center of mass and ground will approach the vertical. It follows that the braking action of the ground, and therefore the external work which has to be done at each step to counteract the braking action of the ground, will be smaller the greater the number of spokes, i.e., in our analogy, the greater the step frequency and the smaller the step length (Figure 12, middle panel).
In a wheel the spokes can rotate continuously around the center of mass with a constant velocity without inverting their motion as indicated in the middle panels of Figure 12. Their kinetic energy, due to their motion relative to the center of mass, can therefore be maintained constant. In locomotion, on the contrary, the lower limbs, corresponding to the spokes of the wheel, do not complete their rotation around the center of mass. As indicated by the two arrows in the bottom panels of Figure 12, the limbs must invert their motion at each step relatively to the center of mass, i.e., they must be "reset" at each step. As described in section 2.1, this implies internal work to be done by the muscles to sustain the kinetic energy changes of the limbs due to their velocity changes relative to the center of mass of the body. The shorter the step length, i.e., the greater the step frequency at a given speed, the greater will be the "internal power" because the limbs must be reset more times in a minute (Figure 12, bottom panel).
In conclusion we see that a change of the step frequency at a given speed is expected to have an opposite effect on the external work done at each step and on the internal power: at low step frequency we should have a high external work per step and low internal power, vice versa at high frequencies. This poses the question of how the total mechanical power, external plus internal, may change with step frequency.
3.5. Difference between Frequency Minimizing Mechanical Power Output and Freely Chosen Step Frequency
To answer the question posed in section 3.4 (Figure 12), the total mechanical power output (see section 2.4) was measured during human running at different speeds maintained each with different step frequencies, dictated by a metronome, lower and higher than the natural one (Figure 13).
In the left graphs of Figure 13, the external and the internal power outputs were measured by multiplying the positive work done at each step, both external and internal work, times the step frequency (step-average power). This power corresponds to the ratio between positive work done at each step and duration of the entire step, which includes the duration of the positive work phase, plus the negative work phase, plus the duration of the aerial phase. A limit to the step average power, i.e., to the maximum positive work done in one minute, is set by the necessity to absorb a corresponding adequate volume of oxygen in one minute, i.e., by the "aerobic power" of the subject. In the right graphs of Figure 13, the external and the internal power outputs were measured by dividing the positive work done at each step by the time during which positive work is done (push-average power). This power is set free by the muscles immediately during contraction and is limited by the so-called "anaerobic power", whose upper limit is much greater than that of the "aerobic power" [56]. It can be seen that: i) a change of the step frequency at a given speed has opposite effects on the external mechanical power, which decreases with increasing step frequency, and the internal mechanical power, which increases with step frequency, and ii) a step frequency exists at which the total mechanical power reaches a minimum (white arrows), and iii) the step frequency for a minimum of mechanical power differs from the freely chosen step frequency (black arrows).
The two frequencies, minimizing the step average power (fo,step) and the push average power (fo,push) are plotted as a function of running speed in Figure 14, together with the freely chosen step frequency (Natural). The ‘optimal’ step frequencies fo,step and fo,push are about the same at the lowest running speeds, when the duration of the aerial phase is negligible, and become progressively more different with increasing speed. If the duration of the push were one half the duration of the step for both the external and internal work, the values on the ordinate of the right panels of Figure 13 would be twice the values on the left panels and fo,push would be equal to fo,step. However this is true only for the internal push average power, but not for the external push average power, which increases more than twice, due to the relative increase of the duration of the aerial phase. In other words, as the running speed increases, the external positive work to be done during the ground contact to accelerate and lift the center of mass of the body is concentrated in a progressively smaller fraction of the step period. It follows that the total push average power reaches a minimum at a frequency value, fo,push, greater than the step average power, fo,step.
Figure 14 shows that the frequency minimizing the step-average power equals the freely chosen step frequency at about 13 km h−1: it is higher at lower speeds and lower at higher speeds. The frequency minimizing the push-average power approaches the freely chosen step frequency at high speeds (around 22 km h−1 for the untrained subjects of Figure 13 and Figure 14).
3.6. Tuning Step Frequency to the Resonant Frequency of the Bouncing System in Human Running
At running speeds lower than about 13 km h−1, down to the very low speeds explored, the freely chosen step frequency is lower than the frequencies minimizing the step average and the push average powers. This is due to the fact the external work done at each step is greater than the minimum possible value required to sustain locomotion; in turn this is due to a greater external work done against gravity during the vertical oscillation of the center of gravity. At about 5 km h−1 we choose to run with a vertical displacement of the center of gravity of about 6 cm with a step frequency of 2.7 Hz instead of using an apparently less expensive vertical displacement of about 3 cm at 4 Hz. When the speed increases from 5 to 13 km h−1 the vertical displacement of the center of mass increases whereas the step frequency remains about constant [53]. The constant step frequency in this range of speeds with the associated increase of the vertical oscillation of the center of gravity is suggestive of a progressive increase of the deformation of a constant period system. In a spring-mass system, in fact, the period of the oscillation is independent of its amplitude. It is therefore possible that this constant natural frequency is adopted because it coincides with the resonant frequency of the body bouncing system. Tuning the step frequency to the resonant frequency of the bouncing system during running at low speeds may result in a minimum of metabolic energy expenditure and in a maximum of the efficiency of conversion of stored chemical energy into positive mechanical work.
This possibility was investigated by measuring the metabolic energy expenditure, from the oxygen consumption in unit time, the total mechanical power (section 2.4), and the mechanical efficiency during running at three given speeds (5.3, 8.0 and 11.1 km h−1) with different step frequencies [41]. The energy expenditure was found to be minimal and the mechanical efficiency maximal at the freely chosen step frequency (Figure 15). At a given speed, an increase in step frequency above the freely chosen step frequency results in an increase in energy expenditure despite a decrease in mechanical power. On the other hand, a decrease in step frequency below the freely chosen step frequency results in a larger increase in energy expenditure associated with an increase in mechanical power (Figure 15). When the step frequency, f, is forced to values above or below the freely chosen step frequency, the resonant frequency of the system, fs = (k/Mb)1/2/(2π), is forced to change similarly by adjusting the stiffness of the bouncing system. However the best match between f and fs takes place only in proximity of the freely chosen step frequency (2.6–2.8 Hz). It is concluded that during running at speeds less than 13 km h−1 energy is saved by tuning step frequency to the resonant frequency of the bouncing system, even if this requires a mechanical power larger than necessary [41].
3.7. The Two Power Limits Conditioning Step Frequency at High Running Speeds
As described in section 3.3, the effective contact time, tce, decreases when the running speed is increased above ~11 km h−1 (Figure 9) [53]. In order to maintain the step frequency, f = 1/(tce + tae), tuned, as at low speeds, to the increasing resonant frequency of the bouncing system, fs = 1/(2tce), the effective aerial time tae should decrease with speed similarly to tce. Young and adult subjects however do not adopt this choice in human running: tae is maintained about constant with the consequence that f becomes progressively less than fs [53,54,57]. In spite of this, the freely chosen step frequency f becomes greater than the frequency minimizing the step-average power. Indeed, at the highest speeds attained (around 21 km h−1), it was simply impossible for the untrained subjects of Figure 14 to run with the low step frequency and the large step length required to minimize the total step-average mechanical power. The limit is set by the maximum anaerobic push-average power, which can be developed by the runner’s muscles immediately during contraction. Between 13 and 22 km h−1 the freely chosen step frequency is intermediate between a frequency minimizing the step-average power, eventually limited by the maximum oxygen intake (aerobic power), and a frequency minimizing the push average power, set free by the muscles immediately during contraction (anaerobic power). The first need prevails at the lower speed, corresponding to long distance running for these subjects, the second need prevails at the higher speed.
In conclusion: factors that determine the choice of the step frequency in human running are: i) tuning the step frequency f to the resonant frequency of the system fs, and ii) choosing a step frequency that minimize the total (external plus internal) aerobic-limited step-average power, within the limits set by the anaerobic-limited push-average power. The first strategy, corresponding to a symmetric rebound, is usually adopted at low running speeds and abandoned for the second strategy, corresponding to an asymmetric on-off-ground rebound, at high running speeds. This is done by increasing the average upward acceleration above 1 g, with the consequence that tae exceeds tce and the step frequency becomes lower than the frequency of the system. In this way, the increment of the aerobic step-average power is contained. In other words, running with high, long leaps is a convenient strategy to adopt, provided that enough anaerobic power is at disposal to allow these leaps. It is interesting to note that old subjects never adopt the second strategy during running: the average upward acceleration never exceeds 1g and the bounce is symmetric at all running speeds (Figure 16) [57]. This allows development of a lower force during the push, but the increase in step frequency results in a greater internal power at high speeds. In contrast, the second strategy is adopted by young subjects, resulting in a lower step frequency, which limits the increase of the internal power at high speeds [57].
4. The Landing-Takeoff Asymmetry
Blickhan’s spring-mass model assumes: i) the same height and velocity of the center of mass at landing and takeoff, and ii) the same characteristics of the “spring”, i.e., of the muscle-tendon units, when the spring is compressed after landing (the muscle-tendon units are stretched) as when the spring extends to take off (the muscle-tendon units shorten). As the author proposing the model pointed out, this is a simplification because, using his words: i) “animals in general do not have a similar takeoff and landing velocity as assumed in the model. They take off with straightened legs and land with bent legs”, and ii) “the leg has to be more stiff during landing than during takeoff” [32].
The deviation from Blickhan’s symmetrical model has recently been determined [36,58,59] by measuring the kinetic and the gravitational potential energy of the center of mass of the body during its lift and descent at each bouncing step (Figure 17). The aim of these experiments was to determine if and to what extent a possible different response of the muscle-tendons units to stretching and shortening affects the timing of negative and positive work performance during their stretch-shortening cycles (Figure 5).
4.1. Height of the Center of Mass at Touch Down and Takeoff
Figure 17 and Figure 22 show that during human running, the aerial phase - when present - is not ‘centered’ on the vertical oscillation of the center of mass. The height of the center of mass at the instant of takeoff is greater than its height at the instant of touch down indicating that the ballistic lift of the center of mass is less than its ballistic fall. This is shown in Figure 18 where the open circles indicate the ratio between upward displacement of the center of mass taking place at each step during contact Sc,up and the total upward displacement Sv,up, whereas the filled circles indicate the ratio between downward displacement of the center of mass taking place at each step during contact Sc,down and the total downward displacement Sv,down. It can be seen that the fraction of the vertical displacement taking place when the foot is in contact with the ground Sc/Sv is greater during the lift than during the downward displacement of the center of mass [58].
The relative amount of the vertical displacement of the center of mass taking place during contact decreases markedly with speed due to the increase of the vertical displacement during the aerial phase. Sc/Sv approaches unity at the lowest speeds (when the aerial phase may be nil) and decreases to ~0.6 during the lift and to ~0.4 during the downward displacement at ~20 km h−1.
For comparison, the open squares in Figure 18 indicate the ratio between the upward displacement of the center of mass of the body taking place at each step when the vertical force is greater than body weight, Sce,up, and the total upward displacement Sv,up, whereas the filled squares indicate the ratio between the downward displacement of the center of mass of the body taking place at each step when the vertical force is greater than body weight, Sce,down, and the total downward displacement Sv,down. It can be seen that the fraction of the vertical displacement Sce/Sv, comprised from the lowest point of the trajectory of the center of mass to the equilibrium point where the vertical force equals body weight (see section 3.1), changes with speed less than Sc/Sv and approaches one half of Sv (Figure 18).
This finding supports the idea that the vertical oscillation of the spring mass system is centered about the equilibrium point where the vertical force equals body weight, and that ‘landing’ and ‘takeoff’ are better represented by the instants where the vertical force increases above, respectively falls below body weight, rather than by the instants the foot actually contacts and leaves the ground. In other words, the landing-takeoff asymmetry evidenced by the different height of the center of mass at touch down and takeoff bears no relation with loading and unloading of the spring-mass system during the bounce. Indeed, landing and takeoff in the real sense may not occur at all during low speed running (see upper left panel in Figure 17).
In order to detect a possible different response of muscle-tendon units to stretching (loading of the system) and shortening (unloading of the system), a comparison must be made between the mechanical events taking place during the descent and the lift of the center of mass at the two equilibrium points where the vertical force equals body weight. As it will be shown below, a landing-takeoff asymmetry persists even at these equilibrium points (Figure 19).
4.2. The Four Phases of the Bounce and the Transduction of Mechanical Energy during the Running Step
The apparent bounce of the body is described in Figure 19 considering the succession of its four phases above and below the equilibrium points where the vertical force equals body weight during the downward displacement and during the lift: i) downward acceleration, Sae,down, ii) downward deceleration. Sce,down, iii) upward acceleration, Sce,up and iv) upward deceleration, Sae,up [58].
The gravitational potential energy changes (blue-red) and the translational kinetic energy changes in the sagittal plane (green), both normalized to vary from zero to one, are plotted in Figure 19, together with the cumulative value of energy recovery, Rint(t), resulting from the instantaneous Ep-Ek transduction during the step (see section 2.2) [37]. The blue sections of Ep refer to a vertical force less than body weight, with lighter blue indicating the aerial phase. The red sections of Ep refer to a vertical force greater than body weight.
When describing the four phases of the oscillation of the center of mass, the blue-red transitions indicate a more appropriate definition of ‘landing’ and ‘takeoff’ than the usual definition based on the actual contact and aerial phases of the step. However, in order to avoid confusion with the classical contact scheme, the blue-red transitions may be called ‘effective landing’ and ‘effective takeoff’ in agreement with the definitions of ‘effective contact contact time’ (tce) and ‘effective aerial time’ (tae ) given in section 3.1 (Figure 9, Figure 10 and Figure 11). Note that: i) the blue-red transitions indicate the instants where the system is loaded/unloaded beyond its equilibrium position; ii) these transitions are always detectable, even in the absence of an aerial phase; iii) the part of the oscillation below the blue-red transitions represents half period of the resonant system; iv) the division based on the contact/aerial phase, when present, gives no indication on the characteristics of the rebound of the body.
First phase: Sae,down. The downward acceleration occurs during the Sae,down fraction of the step, comprised between the maximum of Ep and the maximum of Ekv (downward displacement with a vertical force exerted on the ground less than body weight). The Ep into Ek transduction takes place entirely during this phase and is indicated by the large increment of the Rint(t) curve after the maximum of Ep. The kinetic energy of the center of mass Ek attains its maximum value in the running step in close proximity to the end of this phase due to the increment of Ek,v caused by gravity.
Second phase: Sce,down. The downward deceleration occurs during the Sce,down fraction of the step comprised between the maximum of Ekv and the minimum of Ep (downward displacement with a vertical force exerted on the ground greater than body weight). In this phase, the muscle-tendon units simultaneously absorb translational kinetic energy Ek and gravitational potential energy Ep. The Ep-Ek transduction is nil during this phase as indicated by the upper horizontal tract of the Rint(t) curve (β fraction of the step). Note that the maximum of kinetic energy Ek in the running step, attained before the negative work phase, is consistent with a high velocity of stretching of the muscle-tendon units and, according to the force-velocity relation, with a high force exerted by the forcibly stretched muscle (Figure 5).
Third phase: Sce,up. The upward acceleration occurs during the Sce,up fraction of the step, comprised between the minimum of Ep and the maximum of Ekv (lift with a vertical force exerted on the ground greater than body weight). In this phase of the step muscle-tendon units shorten delivering both Ek and Ep. The Ep-Ek transduction is nil during most of this phase as shown by the lower horizontal tract of the Rint(t) curve, corresponding to the initial part of the α fraction of the step, when Ek and Ep simultaneously increase.
Fourth phase: Sae,up. The upward deceleration occurs during the Sae,up fraction of the step, comprised between the maximum of Ekv and the maximum of Ep (lift with a vertical force exerted on the ground less than body weight). During this phase Ekv decreases by definition, but Ekf continues to increase resulting in an increase of Ek: the push of the foot that is about to leave the ground accelerates the body forwards even though the vertical force has dropped below body weight. Ek and Ep increase simultaneously, as indicated by the lower horizontal tract of the Rint(t) curve extending well into this phase (α fraction of the step). The transduction of Ek into Ep is limited to the last part of the lift and is smaller than the transduction of Ep into Ek during the downward displacement. The protracted execution of positive external work at the end of the lift takes place at a progressively slower pace resulting in a blunt attainment of a plateau by Ecm (see black line in Figure 17 and inset in Figure 20), which contrasts with the sharper decrease of Ecm at the end of the plateau. These findings are the mechanical counterpart of the observation that in running the lower limb is more extended at takeoff than at landing (insets of Figure 19 from [60]).
4.3. Positive and Negative Work Durations and Muscle-Tendon Units Response during Stretching and Shortening
The succession of events described above results in a duration of positive external work to accelerate and lift the center of mass at each step, tpush, greater than the duration of negative external work to absorb gravitational potential energy and kinetic energy of the center of mass during the deceleration downwards and forwards, tbrake (Figure 20).
During running on the level at a constant speed, the momentum lost during negative work equals the momentum gained during positive work:
According to equation 7, a difference in work duration, tpush > tbrake, which we may consider as representative of the landing-takeoff asymmetry, implies an average force exerted by muscles during the brake after landing, greater than that exerted during the push before takeoff, i.e., > . The landing-takeoff asymmetry increases with / and is expression of the difference in force exerted during negative and positive work. Note that in the bounce of the symmetric spring-mass model with no hysteresis = . The landing-takeoff asymmetry therefore may be expression of the deviation of the muscle-tendon unit’s response from that of an elastic structure. Other factors bound to the geometry of the limbs lever system (the machine, see Figure 1) during the brake and the push will be discussed below.
4.4. Effect of Running Speed on Landing-Takeoff Asymmetry in Adult Humans
The positive and negative external work durations are plotted in Figure 20 as a function of the running speed. Data were obtained on ten adult subjects (average age 28 years) [58]. It can be seen that the duration of positive external work is greater than the duration of negative external work up to a speed of about 14 km h−1.
A comparison between Figure 9 and Figure 20 shows that in human running the discrepancy betweentae and tce increases with speed, whereas the discrepancy between tpush and tbrake decreases with speed. Apparently, the increase of the vertical push with speed, making the on-off-ground rebound asymmetric (tae > tce), has an opposite effect on the landing take-off asymmetry (tpush > tbrake): the greater the force during the rebound, the smaller its difference between stretching and shortening. This finding may be explained as follows.
In muscle-tendon units, muscle and tendon are two structures in series subjected to the same force at their extremities. When the unit is stretched during negative work, the lengthening of the two structures will depend on their stiffness: the lower the stiffness the greater the lengthening. The stiffness of muscle is greater the greater its activation [61]. When muscle activation is progressively increased with running speed, muscle fibers oppose a progressively greater force to stretching and the tendon will absorb a progressively greater fraction of the lengthening imposed to the muscle-tendon unit. It follows that muscle lengthening during negative work, and its subsequent shortening during positive work, will be greater at low than at high speeds. At speeds greater than ~14 km h−1, muscle activation may be increased to such an extent that muscle fibers are held almost isometric so that the length change is taken almost completely by tendons. Experiments on turkeys [62] and kangaroos [21] have shown that the length change of the muscle-tendon units bending and extending the ankle, while the foot is on the ground in a running step on the level, is mostly due to tendon stretching and recoil, with a small change in length of muscle fibers.
According to the force-velocity relation of muscle contractile component initially described by Hill [9] and Katz [10], the force exerted by each active muscle fiber is greater during stretching than during shortening, i.e., muscle exhibits a large hysteresis in its stretch-shorten cycle (clearly visible in the lower panel of Figure 5). On the contrary, tendon and other passive structures such as ligaments approach an elastic structure with small hysteresis [63,64,65]. A decrease in muscle length change relative to tendon length change with increasing running speed would then reduce the hysteresis of the muscle-tendon unit as a whole, approaching that of a spring with similar characteristics during stretch and recoil.
It is therefore reasonable to assume that the landing-takeoff asymmetry in humans, i.e., tpush > tbrake due to > , is greater at low than at high running speeds due to a contribution of muscle to the length change of the muscle-tendon unit, which is greater at low than at high speeds (Figure 21).
This interpretation is consistent with the increase in peak muscle stress with speed of gallop in horses, associated with an increase in the calculated elastic strain energy in the tendons relative to the total work done per stride [66].
Direct measurements of fiber length of lower limbs muscles have been made by ultrasonic photography in humans [67,68,69,70,71,72,73] and sonomicrometry in animals simultaneous with force measurements using tendon force buckles [21,74]. These studies helped to show the relation between the force-length relation of muscle fibers and the torque-angle relation at the corresponding joint [67,73], and to elucidate the muscle-tendon interaction during the stretch-shorten cycle [69,70,71]. It must pointed out here that the Ecm curve in Figure 17 and Figure 20 indicate the total mechanical energy of the center of mass of the body and tpush and tbrake indicate the time during which Ecm is respectively increased and decreased by the action of distal, proximal, lower limbs, upper limbs, trunk, agonistic, antagonistic muscles during the rebound of the body. For this reason the hypothesis put forward in Figure 21 is necessarily speculative, but on the other hand it may show the final result of all muscle-tendon interactions on the whole body during the bounce.
Using an indirect approach, it has been suggested that the energy expenditure during running is due to the cost of generating force in quasi isometric contracting fibers, and not due to the work done by them [75,76]. The cost would be greater the shorter the contact time due to a faster turnover of cross-bridge cycling. The same argument has been used to explain the preferred hopping and running frequencies in humans [77]. On the other hand recent findings show that the metabolic energy expenditure decreases when hopping frequency is increased above the preferred frequency and the contact time is decreased [78,79]. Furthermore, a contribution of the contractile machinery to the mechanical work done is evidenced at low running speeds in humans by a greater energy expenditure when the mechanical work and the contact time are made greater by decreasing the step frequency below the freely chosen step frequency [41] (Figure 15). These findings indicate that positive work production by muscles is increased when the duration of the stretch-shorten cycle is increased. Figure 21 suggests that both views, i.e., tendon vs. muscle contribution to mechanical work, may possibly apply to human running depending on the speed of the run.
4.5. The Landing-Takeoff Asymmetry in Old Humans
As described above, the landing-takeoff asymmetry in human running has been thought to derive from, or at least to be consistent with, the physiological property of muscle to resist stretching (after landing) with a force greater that it can develop during shortening (before takeoff). In old age, muscular force is reduced, but the deficit in force is less during stretching than during shortening. This has been shown in experiments on isolated muscle specimens [80,81] and in vivo on humans [82,83,84,85]. The effect of this change of muscle contractile properties with age on the mechanics of locomotion is unknown. We hypothesized that the greater force exerted during stretching relative to shortening by aged muscle would increase the landing-takeoff asymmetry in running. As described below, this in fact what we found in experiments comparing the landing-takeoff asymmetry of eight old subjects (average age 73.6 ± 5.5 years) with that of eight young subjects (average age 20.8 ± 1.6) (36).
Figure 22 and Figure 23 show that the lift of the center of mass taking place in contact with the ground is greater in the old subjects than in the young subjects. However, as described above (Figure 18), it is more appropriate to consider the asymmetry of the events taking place during the lift and the descent of the center of mass above and below the equilibrium position when the vertical force equals body weight. These are depicted in Figure 24 by the changes in gravitational potential energy, Ep, translational kinetic energy, Ek = Ekf + Ekv, and their transduction Rint(t) during loading (red) and unloading (blue) of the system relative to its equilibrium position, regardless of the contact time and the aerial phase. These records have been described in detail above (section 4.2, Figure 19). It can be seen here that in the old subject the landing-takeoff asymmetry is greater than in the young subject due to a transduction of Ep into Ek during the descent that is much larger than the almost absent Ek into Ep transduction during the lift.
Figure 24 shows that the ratio Rint,down/Rint,up is much larger in the old subject than in the young subject. The physiological meaning of this finding is described below.
In running, the kinetic energy of forward motion Ekf increases and decreases essentially in phase with the potential energy Ep [19] with the consequence that the Ekf- Ep transduction is negligible. It follows that in running the Ek - Ep transduction takes place essentially between gravitational potential energy Ep and kinetic energy of vertical motion Ekv. As mentioned above (section 2.2), this transduction is obviously complete during the aerial phase when the support of the body on the ground is nil [r(t) = 1], but it also occurs during contact when the body is only partially supported by the foot on the ground in the upper part of the trajectory of the center of mass [0 < r(t) < 1].
During running, therefore, Rint gives a quantitative measure of the ‘lack of support‘ of the body on the ground over the whole step cycle, including both the aerial phase and the ground contact phase. Rint would attain unity in a hypothetical ‘step’ made up completely by an aerial phase.
In the elderly, Rint,old is about 70% of the value attained by the young subjects. This gives a measure of the greater support on the ground during the step in the old subjects relatively to the young subjects. A lower flight time was in fact found in the elderly [72].
The Ek-Ep transduction has a different meaning during the descent Rint,down and during the lift Rint,up of the center of mass.
Rint,down, i.e., the Ep into Ek transduction during the fall, can be viewed as a mechanism exploiting gravity to passively increase the vertical downward velocity and as a consequence the kinetic energy. Rint,down precedes the negative work phase of the step. This has two physiological effects: (i) provides mechanical energy to be stored within the muscle-tendon units during the subsequent brake, but (ii) requires an adequate muscular force to be exerted during subsequent stretching. In the elderly, Rint,down,old is about 85% of the value attained by the young subjects.
Rint,up, i.e., the Ek into Ep transduction during the lift, follows the positive work phase of the step and is greater the greater the push-average power developed before takeoff. In fact, the greater the push, the greater the increment in kinetic energy of vertical motion and therefore its subsequent decrement when the center of mass is lifted during the phase of partial support and the aerial phase. The push-average power depends in turn on the capability (i) to recover elastically the mechanical energy stored during the preceding negative work phase, and (ii) to add work done during shortening by the contractile component. A large Rint,up therefore relies on an adequate muscular force to be exerted during shortening by the muscle-tendon units. In the elderly, Rint,up,old is about 60% of the value attained by the young subjects.
Since Rint,down is 15% less in the elderly than in the young subjects whereas Rint,up is 40% less, the ratio Rint,down/Rint,up is appreciably greater in the old subjects than in the young subjects. As mentioned above, a large Rint,down requires a large force to be exerted during the following negative work phase (stretching), whereas a large Rint,up requires a large force to be exerted during the preceding positive work phase (shortening). The finding that Rint,down is less affected by age than Rint,up suggests that the deficit in force during stretching is less than the deficit in force during shortening, which, as mentioned above, is a characteristics of aged muscle [80,81,82,83,84,85].
The mechanical energy changes described in Figure 24 result in a ratio tpush/tbrake, which is on average greater in the old subjects than in the young subjects (Figure 25), indicating that / is less in the old subjects than in the young subjects due to a greater tpush with a similar tbrake. This indicates a lower force during shortening relative to stretching in old age, which also is qualitatively consistent with the more asymmetric force-velocity relation described in aged muscle [80,81,82,83,84,85].
Note that the landing-takeoff asymmetry is larger in the elderly (Figure 25) where the on-off-ground asymmetry is nil (Figure 16) due to a lower average acceleration upwards [57], whereas the contrary is true for the young subjects, where the landing-takeoff asymmetry is lower (Figure 25) and the on-off ground asymmetry is larger (Figure 16) due to a greater average acceleration upwards [57]. In both cases, age and average running speed, the landing-takeoff asymmetry, which suggests a lack of elastic storage and recovery in the rebound of the body, is associated with a lower force applied to the muscle-tendon units during their stretch-shorten cycle. As discussed above, an increase in force, at high running speeds and in the young subjects, would privilege the role of tendon relative to that of muscle within muscle-tendon units (Figure 21).
4.6. Asymmetric Motor or Asymmetric Machine?
As described in section 1.1 (Figure 1) locomotion results from the interaction of a motor, the muscular system, with a machine, the skeletal lever system. In section 4.4 and section 4.5, the landing-takeoff asymmetry during human running was attributed to the characteristics of the motor, i.e., the skeletal muscle, to resist forcible stretching, while active, with a force greater than that developed during shortening (the force-velocity relation of the contractile component). The force-velocity relation of muscle however is not the only candidate to be considered as a cause of the landing-takeoff asymmetry. As Prof. Mc Neil Alexander pointed out in conversation (personal communication, 5 July 2006), the different length of the moment arms between heel and ankle and between ankle and toe during stance should be taken into account as a possible explanation of the landing-takeoff asymmetry in human running.
The absolute amount of negative work (during the brake) equals that of positive work (during the push) when running on the level at a constant speed. Since work is force times displacement, the greater force developed during the brake implies a displacement of the center of mass of the body in the sagittal plane smaller during negative work than during positive work. This is what one may expect from the asymmetric lever system of the human foot, since the moment arm between heel and ankle, operating after landing (brake), is shorter than the moment arm between ankle and toe, operating before takeoff (push) [87]. The consequences of forward transition of the point of force application on the mechanics of running have been recently analyzed by Bullimore and Burn [88]. The following alternative hypothesis could therefore be made to explain the landing-takeoff asymmetry of running. The force during the brake is greater than during the push because the displacement of the center of mass during negative work is smaller than that during positive work due to the asymmetric lever system. In other words, the greater force exerted during the brake may be required to cope with the smaller displacement at disposal during negative work. From this point of view, the difference in force may not be the consequence of the force-velocity relation of muscle, but would be the consequence of the asymmetric lever system, which would then be the initial cause of the landing-takeoff asymmetry. The question therefore arises: what is the cause of the landing-takeoff asymmetry in human running? The motor, the machine or both?
As shown in section 3.1 (Figure 7), the bouncing mechanism of running initially described for humans [19] also applies to hopping, running birds and trotting quadrupeds [22]. These animals use a machine (lever system) to promote locomotion, which differs from that of humans. The landing-takeoff asymmetry, i.e., the ratio tpush/tbrake was therefore measured in hopping, running and trotting animals to determine if it persists in spite of the different machines involved in these different types of locomotion [89]. In the elastic rebound of a spring-mass system, the mechanical energy of the center of mass at the equilibrium position during the descent equals the mechanical energy of the center of mass at the equilibrium position during the lift [32]. This because the kinetic and gravitational potential energy of the center of mass is stored during the descent as elastic potential energy and converted without losses back into kinetic and gravitational potential energy attaining the same value during the lift. Figure 26 shows that this condition is approached in the bounce of a kangaroo. The vertical interrupted lines drawn through the peaks of Ekv, i.e., at the equilibrium position where the vertical force equals body weight, intersect the Ecm curve at about the same value during the descent and the lift of the center of mass. On the contrary, the rebound of the body in the animals showing a large landing-takeoff asymmetry, i.e., a large ratio tpush/tbrake, differs drastically from an elastic rebound. Consider for example the running turkey in Figure 26, which shows the greatest landing-takeoff asymmetry and also most of the tracings of human running in Figure 17. The intersection of the interrupted lines with the Ecm curve shows that the mechanical energy during the lift is less than the mechanical energy during the fall. A possible cause of this energy difference is that some losses occur in the stretch-shorten cycle of muscle-tendon units. During the stretch these losses are expected to occur due to cross-bridge detachment if muscle instead of tendon is forcibly lengthened, i.e., if tendons are stiffer than muscle. Due to these losses, some energy must be added to complete the lift of the center of mass and to accelerate it forwards to the velocity attained before the brake. This additional energy must derive from the active muscular contraction, which according to the force-velocity relation of the contractile component, is characterized by a lower force developed during shortening. This lower force necessarily requires more time to restore the momentum lost during stretching when the force is higher, thus explaining the landing-takeoff asymmetry, i.e., tpush > tbrake.
The ratio tpush/tbrake, which is a measure of the landing-takeoff asymmetry of the bounce, is given in Table 1 together with the mass specific vertical stiffness of the bouncing system k/Mb. Both tpush/tbrake and k/Mb are greater in the animals of smaller size and body weight suggesting that the landing-takeoff asymmetry of the bounce increases with the stiffness of the bouncing system.
4.7. Different Machines with the Same Motor
Locomotion is carried on in the animals of Figure 27 and in humans with a large diversity in the anatomy and geometry of their machines, i.e., of the lever systems, which promote forward movement of the body. The different machines serve different tasks and are used differently during the step. For example, whereas in human running, the point of force application between the foot and the ground moves forwards during the stance phase, in bird running landing takes place on the front of the foot far from the ankle which is shifted upwards relative to the ground. Thanks to this geometry the digits of birds, instead of the knee, occupy a front position when the legs are flexed against the body during the flight and are ready to grasp support at landing or a prey during flight. Also in hopping and trotting contact with the ground takes place with the front of the foot. In hopping a long duration of the aerial phase is required to allow repositioning of the same two feet over which each bounce takes place, whereas in trotting a minimal, often absent, aerial phase is inserted between bounces on two (front-back) feet of opposite sides of the body. The characteristics of the environment may also modify the anatomy of the locomotory machine. Differences in hind limb anatomy and in hopping mechanics have been found in two species of wallabies inhabiting different environments [90]. Other examples could be made showing how different machines evolved differently in order to fulfill different requirements in different surroundings and are used differently during locomotion because of their different geometries and structure.
In contrast with the large diversities mentioned above, the motor operating the different machines, remained largely the same throughout evolution maintaining, from frog to humans, its basic property to resist stretching with a force greater than that developed during shortening, as described by the force-velocity relation of muscle contractile component.
The finding that the landing-takeoff asymmetry in all the animals studied takes place always in one direction, i.e., with tpush > tbrake, never the reverse, in spite of the diverse geometries of the lever systems involved, body mass and step frequencies, strongly suggests that the different machines are used to comply with the asymmetric response of their motor during negative and positive work performance. This requirement results in a trend of the Ecm curve (rounded attainment of plateau and sharp departure from plateau) which is very similar in the 7 kg turkey of Figure 26 running at 12 km h−1, and in a 73 kg human running at 13.5 km h−1 (Figure 17), in spite of more than a ten folds difference attained by Ecm during the step (~40 J in the turkey and ~600 J in the human) and of the striking difference of the two locomotory machines.
It must be pointed out that other factors, in addition to the force-velocity relation of muscle and the different geometry of the limbs lever system may affect the landing-takeoff asymmetry. These are:
1) Energy losses (e.g., during the impact at initial ground contact) could partially explain the observed asymmetry. These have been discussed at the end of section 4.6.
2) In this study only translational (horizontal and vertical) energies are considered to estimate breaking and pushing times. Additionally muscles can contribute to forces changing the body’s angular momentum. These effects are neglected here and may affect landing-takeoff asymmetry. The whole-body angular momentum was found to be small in walking [91]. We found no similar measurements during running.
3) Muscle activation. In fact, by changing muscle activation even a larger force than during eccentric muscle work could be generated during muscle shortening. However, this is not observed in the experiments described above: a greater force is measured during stretching consistent with the force-velocity relation.
4) Given the large number of limb and trunk muscles that produce, absorb and re-distribute energy within the limbs and body during the bounce, it is possible that antagonistic work done by muscles against others may contribute to the observed landing-takeoff asymmetry.
4.8. Factors Affecting the Elastic Storage Mechanism
As described in section 4.4 and section 4.5, the landing-takeoff asymmetry, i.e., the ratio tpush/tbrake decreases with speed in human running: above 14 km h−1 tpush ~ tbrake as expected in an elastic rebound (Figure 20). As discussed above, this finding has been explained with an increase of muscle activation with speed privileging the role of tendons relative to muscle within muscle-tendon units (Figure 21). This mechanism may conveniently apply to kangaroo hopping which approaches an elastic rebound, i.e., tpush ~ tbrake, with most of the length change taken up by tendons [21]. This is consistent with the high force, which must be developed by muscle to attain the high upward acceleration we measured in these animals (Table 1). Furthermore, the efficiency of external work production in kangaroos increases with speed suggesting an improved elastic storage and recovery as the force exerted on the ground increases [22].
It has been shown that force enhancement following muscle stretch has a transient character, i.e., it disappears rapidly at the end of stretching and, with it, the elastic energy stored within tendons and other undamped elastic elements [92]. This transient character of elastic storage and recovery may contribute to the observed decrease of the landing-takeoff asymmetry with running speed in humans.
However important exceptions indicate that other factors must be taken into account when comparing different groups of subjects. For example the landing-takeoff asymmetry is greater in the springhare than in the kangaroo in spite of a similarly high upward acceleration (Table 1a). On the other hand the landing-takeoff asymmetry is almost nil in the rams which show the lowest upward acceleration (Table 1b).
As described in section 4.5 (Figure 22, Figure 23, Figure 24 and Figure 25), one of this factors, found in humans, is age: during running the landing-takeoff asymmetry is greater in old subjects than in young subjects suggesting a less elastic rebound in the elderly [36].
Another factor is size. Data in Table 1 suggest that the landing-takeoff asymmetry is greater in small than in large animals. The hypothesis that small animals are unable to utilize an elastic storage mechanism during the bouncing step as efficiently as large animals do was put forward on the basis that the efficiency of the transformation of metabolic energy into mechanical work is less in small than in large animals [42].
The efficiency of the transformation of metabolic energy into external work is given in Table 1 for some of the animals (mean of the lowest and highest values of the curves in Figure 10 of [22]. It can be seen that a larger landing-takeoff asymmetry in the smaller animals, i.e., a greater ratio tpush/tbrake, is associated with a lower metabolic efficiency supporting the hypothesis that the landing-takeoff asymmetry is a measure of a lack of elasticity in the bouncing step. Both metabolic inefficiency and landing-takeoff asymmetry independently show that elastic energy storage is less efficient in small animals.
It has been suggested that the elastic storage mechanism is lower in small animals because their tendons are relatively thicker than those of large animals. This was measured by comparing small kangaroo rats with large kangaroos [93] and calculated from measurements of muscle and tendon dimensions in kangaroos [94] and quadrupedal mammals [95,96]. This hypothesis is consistent with the findings reported in Table 1, showing that the landing-takeoff asymmetry, i.e., the deviation from an elastic bounce, is associated in the smaller animals with a greater stiffness of the system. The greater mass specific vertical stiffness in small animals implies a greater resonant frequency of the bouncing system fs = (1/2π)√k/Mb which in turn is bound to a greater step frequency (Table 1). More steps, i.e., a greater step frequency, are required to cover a given distance in the animals of smaller dimensions. This requires a greater frequency of the bouncing system, i.e., a greater mass specific vertical stiffness, with the drawback of a less efficient elastic rebound resulting in a greater landing-takeoff asymmetry.
5. Concluding Remarks
The experimental findings described above can be interpreted considering: 1) Why muscular work has to be done to maintain locomotion on the level at a constant step-average speed, 2) The tools at disposal to perform this work, and 3) How these tools can be utilized to minimize this work.
5.1. Muscular Work Requirements
Basically these result from:
i) The impact of the body against the ground, causing a deceleration forwards with a loss in kinetic energy which must be restored by a subsequent push on the ground to maintain the average speed constant.
ii) The velocity of the foot relative to ground being nil during the ground contact phase. Since the average speed forwards of the foot must obviously equal that of the center of mass of the body over the entire stride cycle, it is clear that the lower limb must be accelerated each step relative to the center of mass, requiring work to be done by muscles to account for this change in shape of the system.
This mechanism of progression implies that when a given speed is maintained with longer steps, at a lower frequency, the impact against the ground is increased, whereas when the same speed is maintained with shorter steps, at a greater frequency, the lower limb must be accelerated relative to the center of mass more times per minute. It follows that a step frequency change at a given speed of locomotion has an opposite effect on the work done per step to overcome the braking action of the ground and on the power spent to reset the lower limb relative to the center of mass (Figure 12).
Therefore, the possibility exists to choose a step frequency, which minimizes the total mechanical power spent to maintain locomotion (Figure 13).
5.2. Tools at Disposal
The bouncing body is a multi-segment system driven by muscle-tendon units. In each unit, muscle is the motor, i.e., a structure capable to compensate for energy losses by transforming chemical energy into positive mechanical work, whereas the tendon is a passive elastic structure capable of storing and releasing mechanical energy with a small energy loss due to its small elastic hysteresis. In different animals, large differences exist within each muscle-tendon unit between muscle fiber and tendon lengths, and the thickness of tendons may be different related to body mass. These anatomical differences translate into a different mass specific vertical stiffness, which, as discussed above (section 4.6, section 4.7 and Table 1), may affect elastic storage and recovery. However the following general mechanism operates in all muscle-tendon units, independent of their anatomical structure.
In each unit, the nervous system can change muscle force and stiffness by changing both the number of muscle fibers brought from the relaxed into the contracting state and the average force developed by each fiber. Since muscle and tendon within the muscle-tendon unit are two structures in series subjected to the same force, a change in muscle force and stiffness will necessarily modify the relative length change and work done by the muscle and by the tendon when the unit lengthens and shortens during each bounce. More of the length change and work will be taken up by muscle when its force and stiffness are low, whereas more of the length change and work will be taken by tendon when muscle force and stiffness are high.
A fundamental property of muscle is to resist stretching with a force greater than that developed during shortening. It follows that for a given length change of each active muscle fiber the area below the force-length diagram during stretching (negative work) is greater than the area below the force-length diagram during shortening (positive work) (Figure 5), the difference being greater the greater the amplitude and the velocity of the length change. In conclusion: the energy loss in the stretch-shorten cycle of muscle is greater than the energy loss in the stretch-shorten cycle of tendon.
Therefore, the possibility exists to develop a lower force with the drawback of a higher energy loss in the stretch-shorten cycle (large landing-takeoff asymmetry), or to develop a higher force with a lower energy loss in the stretch-shorten cycle (small landing-takeoff asymmetry) (Figure 21).
5.3. Strategies Used
The muscular work requirements (section 5.1) and the tools at disposal (section 5.2) suggest that in bouncing gaits energy may be saved by: i) minimizing the total mechanical power output using an appropriate step frequency and the ii) minimizing the energy loss in the stretch-shorten cycle approaching a more ‘elastic’ rebound using a greater muscle activation.
Since only humans can be asked to run at a given speed with different step frequencies, the first possibility was investigated during human running only (Figure 13). It was found that the freely chosen step frequency coincides with the frequency minimizing the step-average mechanical power at ~13 km h−1 (Figure 14) [40]. At lower and higher speeds the freely chosen step frequency requires a step-average mechanical power greater than the minimal attainable with higher, respectively lower step frequencies (Figure 14). This finding clearly shows that other factors in addition to minimizing mechanical power determine the freely chosen step frequency. The experiments described in Figure 14, Figure 15 and Figure 16 suggest that, at least in human running, these factors are: i) a reduced metabolic energy expenditure obtained at low speeds by tuning step frequency to the resonant frequency of the bouncing system, and ii) a limited force at disposal during the push at high speeds.
It is known that in a force-driven oscillator, the frequency requiring the minimum work to maintain oscillation is the resonant frequency of the system, fs. As explained in section 3.2, the freely chosen step frequency f equals the resonant frequency of the system when the rebound is symmetric, with an equal duration of the oscillation above and below the position where the vertical force equals body weight. The symmetric rebound implies an average vertical acceleration during the push less than 1 g, i.e., a low muscle activation, a large landing-takeoff asymmetry and a less ‘elastic’ bounce (Figure 21). In spite of this drawback, a freely chosen step frequency of 2.6–2.8 Hz in humans is tuned to the resonant frequency of the bouncing system up to ~11 km h−1 (Figure 9) resulting in a lower metabolic energy expenditure (Figure 15).
With increasing running speed fs necessarily increases (section 3.3, Figure 9). In order to maintain a symmetric rebound, i.e., f = fs, the step frequency should increase to values requiring a step-average power output much greater than that attainable with a lower step frequency (compare Figure 9 with Figure 14). In young and adult humans this condition is met by increasing the vertical push on the ground to attain an average upward acceleration grater than 1 g: the on-off-ground rebound becomes asymmetric, f < fs (Figure 16), the step frequency is decreased, but not enough to attain the frequency minimizing the step-average power (f0,step in Figure 14). In old humans the average acceleration upwards never exceeds 1 g, the rebound remains symmetric at all speeds, i.e., f = fs (Figure 16), resulting in a large increase with speed of the power spent to reset the limbs and in a greater landing-takeoff asymmetry (Figure 23, Figure 24 and Figure 25). Both in young and old subjects, therefore, the constraint to the attainment of the ‘optimal’ step frequency minimizing the step-average power at high running speeds is a limited force at disposal during the push, a limit particularly evident in the elderly.
The finding that the symmetric rebound occurs not only at low speeds of human running in adults and young subjects [53,54], but also at all running speeds in old human subjects (Figure 16) and at all trotting speeds (Figure 10), suggests that the stiffness of the system can be adjusted to step frequency by controlling muscle activation. In this case it would not be appropriate to define one resonant frequency. In fact, many resonant frequencies would exist according to the degree of muscle activation. However, contrary to this line of thought, Figure 15 shows that when the step frequency is forced to increase above the freely chosen step frequency by stiffening the system, the energy expenditure increases despite a reduction in mechanical work. It is possible that the ‘resonant’ frequency of the bouncing system results not only from the activation of the muscles directly involved in energy storage and release during the bounce of the body, but also from the time necessary to reset the limbs. An example supporting this idea is hopping: the on-off-ground asymmetric rebound is adopted even at the lowest speeds and a low step frequency is maintained about constant at all speeds with a continuous increase with speed of the resonant frequency of the bouncing system (Figure 11). The dissociation between resonant frequency of the system and step frequency in hopping suggests that a factor, which may affect the freely chosen step frequency is the time required to reset the limbs, particularly large when both feet must be reset during the aerial phase.
Acknowledgements
The author wishes to thank Mario Legramandi for his suggestions and help in the preparation of this manuscript.
List of Symbols
| α β | step phases during which Ep and Ek increase (α) or decrease (β) simultaneously. |
| τ | step period, i.e., period of repeating change in the mechanical energy of the center of mass. |
| Ek | kinetic energy of the center of mass in the sagittal plane. |
| Ekf | kinetic energy of forward motion of the center of mass. |
| Ekv | kinetic energy of vertical motion of the center of mass. |
| Ep | gravitational potential energy of the center of mass. |
| Ecm | mechanical energy of the center of mass. |
| average force during negative external work. | |
| average force during positive external work. | |
| Fv | vertical force. |
| g | acceleration of gravity. |
| H | height of the center of mass of the whole body. |
| Mb | body mass. |
| r(t) | instantaneous recovery of mechanical energy calculated from the absolute value of the changes, both increments and decrements, in Ep, Ek and Ecm during each time interval in the step period. |
| Rint | cumulative energy recovery attained at the end of the step due to Ek - Ep transduction. |
| Rint,down | fraction of Rint attained during the downward displacement of the center of mass. |
| Rint,up | fraction of Rint attained during the lift of the center of mass. |
| Sae,up | upward displacement of the center of mass taking place during its upward deceleration. |
| Sae,down | downward displacement of the center of mass taking place during its downward acceleration. |
| Sc,down | downward vertical displacement of the center of mass during contact. |
| Sce,down | downward displacement of the center of mass from the equilibrium position where Fv = Mb g to the lowest point of its trajectory. |
| Sce,up | upward displacement of the center of mass from the lowest point of its trajectory to the equilibrium position where Fv = Mb g. |
| Sc,up | upward vertical displacement of the center of mass during contact. |
| Sv,down | downward vertical displacement of the center of mass. |
| Sc | vertical displacement of the center of mass during contact: Sc = (Sc,up + Sc,down)/2. |
| Sv,up | upward vertical displacement of the center of mass. |
| Sv | vertical displacement of the center of mass: Sv = (Sv,up + Sv,down)/2. |
| tbrake | duration of negative external work production. |
| tpush | duration of positive external work production. |
| W+kf | Positive work done at each step to increase the forward speed of the center of mass. |
| W+v | Positive work done at each step to sustain the gravitational potential energy changes of the center of mass. |
| W+ext | Positive work done at each step to increase the mechanical energy of the center of mass. |
References
- Tucker, V.A. Aerial and terrestrial locomotion: a comparison of energetics. In Comparative Physiology; Bolis, L., Schmidt-Nielsen, K., Maddrell, H.P., Eds.; North Holland: Amsterdam, The Netherlands, 1973; pp. 63–76. [Google Scholar]
- Williams, T.M. The evolution of cost efficient swimming in marine mammals: limits to energetic optimization. Phil. Trans. R. Soc. Lond. 1999, 354, 192–201. [Google Scholar] [CrossRef]
- Margaria, R. Sulla fisiologia e specialmente sul consumo energetico della marcia e della corsa a varie velocità ed inclinazioni del terreno. Atti Reale Accad. Naz. Lincei (Memorie) 1938, 7, 299–368. [Google Scholar]
- Wilkie, D.R. Thermodynamics and the interpretation of biological heat measurements. Prog. Biophys. Mol. Biol. 1960, 10, 259–298. [Google Scholar] [CrossRef]
- Dickinson, S. The efficiency of bicycle-pedalling, as affected by speed and load. J. Physiol. 1929, 67, 242–255. [Google Scholar] [CrossRef]
- Hill, A.V. The air-resistance to a runner. Proc. R. Soc. Lond. Ser. B 1928, 102, 380–385. [Google Scholar] [CrossRef]
- Pugh, L.G.C.E. The influence of wind resistance in running and walking and the mechanical efficiency of work against horizontal or vertical forces. J. Physiol. 1971, 213, 255–276. [Google Scholar] [CrossRef] [PubMed]
- Lejeune, T.M.; Willems, P.A.; Heglund, N.C. Mechanics and energetics of human locomotion on sand. J. Exp. Biol. 1998, 201, 2071–2080. [Google Scholar] [PubMed]
- Hill, A.V. The heat of shortening and the dynamic constants of muscle. Proc. R. Soc. Lond. Ser. B 1938, 126, 136–195. [Google Scholar]
- Katz, B. The relation between force and speed in muscular contraction. J. Physiol. 1939, 96, 45–64. [Google Scholar] [CrossRef] [PubMed]
- Abbott, B.C.; Aubert, X.M. The force exerted by active striated muscle during and after change of length. J. Physiol. 1952, 117, 77–86. [Google Scholar] [PubMed]
- Edman, K.A.P.; Elzinga, G.; Noble, M.I.M. Enhancement of mechanical performance by stretch during titanic contractions of vertebrate skeletal muscle fibers. J. Physiol. 1978, 281, 139–155. [Google Scholar] [CrossRef] [PubMed]
- Lombardi, V.; Piazzesi, G. The contractile response during steady lengthening of stimulated frog muscle fibers. J. Physiol. 1990, 431, 141–171. [Google Scholar] [CrossRef] [PubMed]
- Minetti, A.E.; Ardigò, L.P.; Saibene, F. Mechanical determinants of gradient walking energetics in man. J. Physiol. 1993, 472, 725–735. [Google Scholar] [CrossRef] [PubMed]
- Cavagna, G.A.; Komarek, L.; Mazzoleni, S. The mechanics of sprint running. J. Physiol. 1971, 217, 709–721. [Google Scholar] [CrossRef] [PubMed]
- Campbell, E.J.M.; Agostoni, E.; Newsom Davis, J. The Respiratory Muscles: Mechanics and Neural Control; Lloyd-Luke: London, UK, 1970; pp. 115–137. [Google Scholar]
- Kaneko, M.; Yamazaki, T. Internal mechanical work due to velocity changes of the limb in working on a bicycle ergometer. In Biomechanics VI, Proceedings of the Sixth International Congress of Biomechanics, Copenhagen, Denmark; University Park Press: Baltimore, MD, USA, 1978; Volume 1, pp. 86–92. [Google Scholar]
- Minetti, A.E.; Ardigò, L.P.; Susta, D.; Cotelli, F. Using leg muscles as shock absorbers: theoretical predictions and experimental results of drop landing performance. Ergonomics 1998, 41, 1771–1791. [Google Scholar] [CrossRef] [PubMed]
- Cavagna, G.A.; Saibene, F.P.; Margaria, R. Mechanical work in running. J. Appl. Physiol. 1964, 19, 249–256. [Google Scholar] [CrossRef] [PubMed]
- Alexander, R.M.; Vernon, A. The mechanics of hopping by kangaroos (Macropodidae). J. Zool. 1975, 177, 265–303. [Google Scholar] [CrossRef]
- Biewener, A.A.; Konieczynski, D.D.; Baudinette, R.V. In vivo muscle force-length behavior during steady-speed hopping in tammar wallabies. J. Exp. Biol. 1998, 201, 1681–1694. [Google Scholar] [PubMed]
- Cavagna, G.A.; Heglund, N.C.; Taylor, C.R. Mechanical work in terrestrial locomotion: two basic mechanisms for minimizing energy expenditure. Am. J. Physiol. 1977, 233, R243–R261. [Google Scholar] [CrossRef] [PubMed]
- Cavagna, G.A.; Dusman, B.; Margaria, R. Positive work done by a previously stretched muscle. J. Appl. Physiol. 1968, 24, 21–32. [Google Scholar] [CrossRef] [PubMed]
- Cavagna, G.A.; Citterio, G. Effect of stretching on the elastic characteristics and the contractile component of frog striated muscle. J. Physiol. 1974, 239, 1–14. [Google Scholar] [CrossRef] [PubMed]
- Heglund, N.C.; Cavagna, G.A. Mechanical work, oxygen consumption, and efficiency in isolated frog and rat muscle. Am. J. Physiol. 1987, 253, C22–C29. [Google Scholar] [CrossRef] [PubMed]
- Cavagna, G.A.; Heglund, N.C.; Harry, J.D.; Mantovani, M. Storage and release of mechanical energy by contracting frog muscle fibers. J. Physiol. 1994, 481, 689–708. [Google Scholar] [CrossRef] [PubMed]
- Mantovani, M.; Heglund, N.C.; Cavagna, G.A. Energy transfer during stress relaxation of contracting frog muscle fibers. J. Physiol. 2001, 537, 923–939. [Google Scholar] [CrossRef] [PubMed]
- Levin, A.; Wyman, J. The Viscous Elastic Properties of Muscle. Proc. R. Soc. Lond. B 1927, 101, 218–243. [Google Scholar] [CrossRef]
- Fenn, W.O. Frictional and kinetic factors in the work of sprint running. Am. J. Physiol. 1930, 92, 583–611. [Google Scholar] [CrossRef]
- Fenn, W.O. Work against gravity and work due to velocity changes in running: movements of the Center of Gravity Within the Body and Foot Pressure on the Ground. Am. J. Physiol. 1930, 93, 433–462. [Google Scholar] [CrossRef]
- Cavagna, G.A.; Saibene, F.P.; Margaria, R. External work in walking. J. Appl. Physiol. 1963, 18, 1–9. [Google Scholar] [CrossRef]
- Blickhan, R. The spring-mass model for running and hopping. J. Biomech. 1989, 22, 1217–1227. [Google Scholar] [CrossRef]
- Cavagna, G.A.; Thys, H.; Zamboni, A. The sources of external work in level walking and running. J. Physiol. 1976, 262, 639–657. [Google Scholar] [CrossRef]
- Cavagna, G.A. Force platforms as ergometers. J. Appl. Physiol. 1975, 39, 174–179. [Google Scholar] [CrossRef]
- Cavagna, G.A.; Franzetti, P.; Fuchimoto, T. The mechanics of walking in children. J. Physiol. 1983, 343, 323–339. [Google Scholar] [CrossRef]
- Cavagna, G.A.; Legramandi, M.A.; Peyré-Tartaruga, L.A. The landing-take-off asymmetry of human running is enhanced in old age. J. Exp. Biol. 2008, 211, 1571–1578. [Google Scholar] [CrossRef] [PubMed]
- Cavagna, G.A.; Willems, P.A.; Legramandi, M.A.; Heglund, N.C. Pendular energy transduction within the step in human walking. J. Exp. Biol. 2002, 205, 3413–3422. [Google Scholar] [PubMed]
- Cavagna, G.A.; Kaneko, M. Mechanical work and efficiency in level walking and running. J. Physiol. 1977, 268, 467–481. [Google Scholar] [CrossRef]
- Willems, P.A.; Cavagna, G.A.; Heglund, N.C. External, internal and total work in human locomotion. J. Exp. Biol. 1995, 198, 379–393. [Google Scholar]
- Cavagna, G.A.; Willems, P.A.; Franzetti, P.; Detrembleur, C. The two power limits conditioning step frequency in human running. J. Physiol. 1991, 437, 95–108. [Google Scholar] [CrossRef] [PubMed]
- Cavagna, G.A.; Mantovani, M.; Willems, P.A.; Musch, G. The resonant step frequency in human running. Pflugers Arch. 1997, 434, 678–684. [Google Scholar] [CrossRef]
- Heglund, N.C.; Fedak, M.A.; Taylor, C.R.; Cavagna, G.A. Energetics and mechanics of terrestrial locomotion. IV. Total mechanical energy changes as a function of speed and body size in birds and mammals. J. Exp. Biol. 1982, 97, 57–66. [Google Scholar] [PubMed]
- Cavagna, G.A.; Franzetti, P. The determinants of the step frequency in walking in humans. J. Physiol. 1986, 373, 235–242. [Google Scholar] [CrossRef]
- Alexander, R.M. Optimization and gaits in the locomotion of vertebrates. Physiol. Rev. 1989, 69, 1199–1227. [Google Scholar] [CrossRef] [PubMed]
- Aleshinsky, S.Y. An energy ‘sources’ and ‘fractions’ approach to the mechanical energy expenditure problem, I–V. J. Biomech. 1986, 19, 287–315. [Google Scholar] [CrossRef]
- Williams, K.R.; Cavanagh, P.R. A model for the calculation of mechanical power during distance running. J. Biomech. 1983, 16, 115–128. [Google Scholar] [CrossRef]
- Caldwell, G.E.; Forrester, L.W. Estimates of mechanical work and energy transfers: demonstration of a rigid body power model of the recovery leg in gait. Med. Sci. Sports Ex. 1992, 24, 1396–1412. [Google Scholar] [CrossRef]
- McMahon, T.A.; Cheng, G.C. The mechanics of running: how does stiffness couple with speed? J. Biomech. 1990, 23, 65–78. [Google Scholar] [CrossRef]
- Ferris, D.P.; Farley, C.T. Interaction of leg stiffness and surface stiffness during human hopping. J. Appl. Physiol. 1997, 82, 15–22. [Google Scholar] [CrossRef] [PubMed]
- Ferris, D.P.; Liang, K.; Farley, C.T. Runners adjust leg stiffness for their first step on new running surface. J. Biomech. 1999, 32, 787–794. [Google Scholar] [CrossRef]
- Kerdok, A.E.; Biewener, A.A.; McMahon, T.A.; Weyand, P.G.; Herr, H.M. Energetics and mechanics of human running on surfaces of different stiffnesses. J. Appl. Physiol. 2002, 92, 469–478. [Google Scholar] [CrossRef] [PubMed]
- McMahon, T.A.; Valiant, G.; Frederick, E.C. Groucho running. J. Appl. Physiol. 1987, 62, 2326–2337. [Google Scholar] [CrossRef]
- Cavagna, G.A.; Franzetti, P.; Heglund, N.C.; Willems, P.A. The determinants of the step frequency in running, trotting and hopping in man and other vertebrates. J. Physiol. 1988, 399, 81–92. [Google Scholar] [CrossRef]
- Schepens, B.; Willems, P.A.; Cavagna, G.A. The mechanics of running in children. J. Physiol. 1998, 509, 927–940. [Google Scholar] [CrossRef] [PubMed]
- Farley, C.T.; Glasheen, J.; McMahon, T.A. Running springs: speed and animal size. J. Exp. Biol. 1993, 185, 71–86. [Google Scholar] [PubMed]
- Margaria, R. Biomechanics and Energetics of Muscular Exercise; Clarendon Press: Oxford, UK, 1976. [Google Scholar]
- Cavagna, G.A.; Legramandi, M.A.; Peyré-Tartaruga, L.A. Old men running: mechanical work and elastic bounce. Proc. R. Soc. B-Biol. Sci. 2008, 275, 411–418. [Google Scholar] [CrossRef] [PubMed]
- Cavagna, G.A. The landing-take-off asymmetry in human running. J. Exp. Biol. 2006, 209, 4051–4060. [Google Scholar] [CrossRef] [PubMed]
- Cavagna, G.A. The two asymmetries of the bouncing step. Eur. J. Appl. Physiol. 2009, 107, 739–742. [Google Scholar] [CrossRef] [PubMed]
- Muybridge, E. The Human Figure in Motion; Dover Publications Inc.: New York, NY, USA, 1955. [Google Scholar]
- Morgan, D.L. Separation of active and passive components of short-range stiffness of muscle. Am. J. Physiol. 1977, 232, C45–C49. [Google Scholar] [CrossRef] [PubMed]
- Roberts, T.J.; Marsh, R.L.; Weyand, P.G.; Taylor, C.R. Muscular force in running turkeys: the economy of minimizing work. Science 1997, 275, 1113–1115. [Google Scholar] [CrossRef]
- Ker, R.F.; Bennett, M.B.; Bibby, S.R.; Kester, R.C.; Alexander, R.M. The spring in the arch of the human foot. Nature 1987, 325, 147–149. [Google Scholar] [CrossRef]
- McMahon, T.A. The spring in the human foot. Nature 1987, 325, 108–109. [Google Scholar] [CrossRef]
- Alexander, R.M. Tendon elasticity and muscle function. Comp. Biochem. Physiol. 2002, 133A, 1001–1011. [Google Scholar] [CrossRef]
- Biewener, A.A. Muscle–tendon stresses and elastic energy storage during locomotion in the horse. Comp. Biochem. Physiol. 1998, 120B, 73–87. [Google Scholar] [CrossRef]
- Fukunaga, T.; Kawakami, Y.; Kuno, S.; Funato, K.; Fukashiro, S. Muscle architecture and function in humans. J. Biomechanics 1997, 5, 457–463. [Google Scholar] [CrossRef]
- Kubo, K.; Kanehisa, H.; Kawakami, Y.; Fukunaga, T. Elasticity of tendon structures of the lower limbs in sprinters. Acta Physiol. Scand. 2000, 168, 327–335. [Google Scholar] [CrossRef] [PubMed]
- Kubo, K.; Kanehisa, H.; Takeshita, D.; Kawakami, Y.; Fukashiro, S.; Fukunaga, T. In vivo dynamics of human medial gastrocnemius muscle-tendon complex during stretch-shortening cycle exercise. Acta Physiol. Scand. 2000, 170, 127–135. [Google Scholar] [CrossRef]
- Kurokawa, S.; Fukunaga, T.; Fukashiro, S. Behavior of fascicles and tendinous structures of human gastrocnemius during vertical jumping. J. Appl. Physiol. 2001, 90, 1349–1358. [Google Scholar] [CrossRef] [PubMed]
- Kawakami, Y.; Muraoka, T.; Ito, H.; Kanehisa, H.; Fukunaga, T. In vivo muscle fiber behavior during counter-movement exercise in humans reveals a significant role for tendon elasticity. J. Physiol. 2002, 540, 635–646. [Google Scholar] [CrossRef]
- Karamanidis, K.; Arampatzis, A. Mechanical and morphological properties of different muscle-tendon units in the lower extremity and running mechanics: effect of aging and physical activity. J. Exp. Biol. 2005, 208, 3907–3923. [Google Scholar] [CrossRef] [PubMed]
- Kawakami, Y.; Fukunaga, T. New insights into in vivo human skeletal muscle function. Exerc. Sport Sci. Rev. 2006, 34, 16–21. [Google Scholar] [CrossRef] [PubMed]
- McGuigan, M.P.; Yoo, E.; Lee, D.V.; Biewener, A.A. Dynamics of goat distal hind limb muscle-tendon function in response to locomotor grade. J. Exp. Biol. 2009, 212, 2092–2104. [Google Scholar] [CrossRef] [PubMed]
- Kram, R.; Taylor, C.R. Energetics of running: a new perspective. Nature 1990, 346, 265–267. [Google Scholar] [CrossRef] [PubMed]
- Alexander, R.M.; Ker, R.F. Running is priced by the step. Nature 1990, 346, 220–221. [Google Scholar] [CrossRef] [PubMed]
- Farley, C.T.; Blickhan, R.; Saito, J.; Taylor, C.R. Hopping frequency in humans: a test of how springs set stride frequency in bouncing gaits. J. Appl. Physiol. 1991, 71, 2127–2132. [Google Scholar] [CrossRef] [PubMed]
- Grabowski, A.M.; Herr, H.M. Leg exoskeleton reduces the metabolic cost of human hopping. J. Appl. Physiol. 2009, 107, 670–678. [Google Scholar] [CrossRef] [PubMed]
- Moritz, C.T. A spring in your step: some is good, more is not always better. J. Appl. Physiol. 2009, 107, 643–644. [Google Scholar] [CrossRef] [PubMed]
- Phillips, S.K.; Bruce, S.A.; Woledge, R.C. In mice, the muscle weakness due to age is absent during stretching. J. Physiol. 1991, 437, 63–70. [Google Scholar] [CrossRef] [PubMed]
- Ochala, J.; Dorer, D.J.; Frontera, W.R.; Krivickas, L.S. Single skeletal muscle fiber behavior after a quick stretch in young and older men: a possible explanation of the relative preservation of eccentric force in old age. Pflugers Arch. 2006, 452, 464–470. [Google Scholar] [CrossRef] [PubMed]
- Vandervoort, A.A.; Kramer, J.F.; Wharram, E.R. Eccentric knee strength of elderly females. J. Gerontol. 1990, 45, B125–B128. [Google Scholar] [CrossRef] [PubMed]
- Porter, M.M.; Vandervoort, A.A.; Kramer, J.F. Eccentric peak torque of the plantar and dorsiflexors is maintained in older women. J. Gerontol. A Biol. Sci. Med. Sci. 1997, 52, B125–B131. [Google Scholar] [CrossRef]
- Pousson, M.; Lepers, R.; Van Hoecke, J. Changes in isokinetic torque and muscular activity of elbow flexors muscles with age. Exp. Gerontol. 2001, 36, 1687–1698. [Google Scholar] [CrossRef]
- Klass, M.; Baudry, S.; Duchateau, J. Aging does not affect voluntary activation of the ankle dorsiflexors during isometric, concentric and eccentric contractions. J. Appl. Physiol. 2005, 99, 31–38. [Google Scholar] [CrossRef] [PubMed]
- Vogel, H.G. Influence of maturation and age on mechanical and biochemical parameters of connective tissue of various organs in the rat. Connec. Tissue Res. 1978, 6, 161–166. [Google Scholar] [CrossRef]
- Carrier, D.R.; Heglund, N.C.; Earls, K.D. Variable gearing during locomotion in the human musculoskeletal system. Science 1994, 265, 651–653. [Google Scholar] [CrossRef] [PubMed]
- Bullimore, S.R.; Burn, J.F. Consequences of forward translation of the point of force application for the mechanics of running. J. Theor. Biol. 2006, 238, 211–219. [Google Scholar] [CrossRef] [PubMed]
- Cavagna, G.A.; Legramandi, M.A. The bounce of the body in hopping, running and trotting: different machines with the same motor. Proc. R. Soc. B-Biol. Sci. 2009, 276, 4279–4285. [Google Scholar] [CrossRef] [PubMed]
- McGowan, C.P.; Baudinette, R.V.; Biewener, A.A. Differential design for hopping in two species of wallabies. Comp. Biochem. Physiol. 2008, 150A, 151–158. [Google Scholar] [CrossRef] [PubMed]
- Herr, H.; Popovic, M. Angular momentum in human walking. J. Exp. Biol. 2008, 211, 467–481. [Google Scholar] [CrossRef] [PubMed]
- Cavagna, G.A.; Mazzanti, M.; Heglund, N.C.; Citterio, G. Mechanical transients initiated by ramp stretch and release to Po in frog muscle fibers. Am. J. Physiol. 1986, 251, C571–C579. [Google Scholar] [CrossRef] [PubMed]
- Biewener, A.A.; Alexander, R.M.; Heglund, N.C. Elastic energy storage in the hopping of kangaroo rats (Dipodomys spectabilis). J. Zool. 1981, 195, 369–383. [Google Scholar] [CrossRef]
- Bennett, M.B.; Taylor, G.C. Scaling of elastic strain energy in kangaroos and the benefits of being big. Nature 1995, 378, 56–59. [Google Scholar] [CrossRef] [PubMed]
- Alexander, R.M.; Jayes, A.S.; Maloiy, G.M.O.; Wathuta, E.M. Allometry of the leg muscles of mammals. J. Zool. 1981, 194, 539–552. [Google Scholar] [CrossRef]
- Pollock, C.M.; Shadwick, R.E. Allometry of muscle, tendon, and elastic energy storage capacity in mammals. Am. J. Physiol. 1994, 266, R1022–R1031. [Google Scholar] [CrossRef] [PubMed]
Figure 1.
Active muscles use chemical energy during both shortening (positive work) and stretching (negative work). Mechanical energy input in the active muscles during negative work is used together with chemical energy to produce positive work during shortening. Positive work is then used by the skeletal lever system (the machine) to produce movement of the whole body during locomotion.

Figure 2.
For a given body weight, the cost of transport is greater in terrestrial locomotion then in flying and swimming due to a lower overall efficiency. Modified from [1].
Figure 2.
For a given body weight, the cost of transport is greater in terrestrial locomotion then in flying and swimming due to a lower overall efficiency. Modified from [1].

Figure 3.
Only in few exercises muscular force performs almost solely positive work (motor function, left) or almost solely negative work (brake function, right). In most cases, both positive and negative work are done, indicating that negative work is not only a laboratory maneuver, but also a common physiological function of muscle, particularly exploited in terrestrial locomotion.

Figure 4.
Contrary to the motion of a wheel, where the velocity of the center of mass can be maintained constant during each cycle, the structure of the locomotory apparatus, as a ‘square wheel’, results in a forward velocity change of the velocity of the center of mass at each step.
Figure 4.
Contrary to the motion of a wheel, where the velocity of the center of mass can be maintained constant during each cycle, the structure of the locomotory apparatus, as a ‘square wheel’, results in a forward velocity change of the velocity of the center of mass at each step.

Figure 5.
The stretch-shorten cycle of muscle-tendon units, i.e., the succession of negative and positive work, which naturally occurs during terrestrial locomotion, has been simulated on isolated muscle under laboratory conditions. The oscilloscope records below represent dynamic tension-length diagrams obtained during stretching and shortening at a constant speed, on a Levin and Wyman ergometer [28], of an electrically stimulated toad sartorius muscle [23]. In the bottom photograph a line was drawn through the isometric force values developed before stretching and shortening to obtain the static force-length diagram, i.e., the force developed isometrically at each length during tetanic electrical stimulation. In each of the four average length tested, records were obtained during shortening from a state of isometric contraction, without previous stretching (lower curve), and during forcible stretching (upper curve) followed immediately by shortening (middle curve). The area below the curve obtained during stretching represents the negative work done by the muscular force, whereas the areas below the curves obtained during shortening represent the positive work. It can be seen that the positive work done after stretching is greater than the positive work done from a state of isometric contraction without previous stretching. This shows the possibility of energy storage and recovery in a stretch-shortening cycle of muscle-tendon units as it occurs in the bouncing step.

Figure 6.
Mechanical energy changes of the center of mass of the body during a few steps of running at 12 km h−1 in man (59 kg, 1.72 m, 24 years). As in a bouncing elastic system [32], no appreciable transduction occurs during the step between the changes in gravitational potential energy Ep (dotted line) and kinetic energy of forward motion Ekf, whereas an appreciable transduction occurs between Ep and kinetic energy of vertical motion Ekv (see section 2.2 below). Both Ekf and Ep+Ekv changes are absorbed by muscle-tendon units (decrement c’) during the phase of negative work, and restored to the initial value during the phase of positive work (increment c). Since the Ep + Ekv curve and the Ekf curve are almost exactly in phase, the external work Wext is about equal to the sum of the absolute values of the work done against gravity, Wv, and of the work done to accelerate the body forwards, Wf. Modified from [33].

Figure 7.
Mechanical energy changes of the center of mass of the body during running steps of man and birds: turkey (Meleagris gallopavo) and rhea (Rhea Americana) (left column of records); hopping steps of kangaroos (Megaleia rufa) and springhare (Pedetes cafer) (middle column of records); and trotting steps of monkey (Macaca speciosa), dog (Canis familiaris) and ram (Ovis musimon) (right column of records). Note that gravitational potential energy Ep and kinetic energy of forward motion Ekf change in phase in hopping and trotting as in running. Other indications as in Figure 6. From [22].

Figure 8.
A kangaroo (Megaleia rufa) hopping on a 4 m long, 0.5 m wide force-platform inserted with its surface at the level of the floor in a 50 m long corridor in the basement of the Istituto di Fisiologia Umana, Università degli Studi di Milano. Experiments described in [14]. Picture made by Norman Heglund.

Figure 9.
Human running. Upper panel. The filled diamonds indicate the step period (T), the open triangles indicate the duration of the effective aerial time (tae) and the open squares indicate the duration of the effective contact time (tce). The continuous line indicates the actual ground contact time (tc) and the dotted line indicates the actual aerial time (ta). Lower panel. The filled diamonds indicate the step frequency (f = 1/T), the open diamonds indicate the resonant frequency of the bouncing system (fs = (k/ Mb)1/2/(2π) ≈ 1/(2 tce)) and the continuous line indicates the frequency (fc) calculated assuming that the actual time of contact corresponds to one half-period of the oscillation of the elastic system. Note that a division of the step based on the actual ground contact and aerial times (continuous and dotted lines) shows the largest asymmetry just when tce and tae show that the rebound is symmetric and fs = f. Note also that fc approaches f at high speeds just when the rebound becomes asymmetric as shown by tae > tce and fs > f. The vertical bars indicate the standard deviation of the mean of 193 runs by ten untrained male subjects (weight 75.7 ± 4.99 kg). Modified from [53].

Figure 10.
Data for trotting. Same indications as in Figure 9. Note that the step is symmetric over the whole speed range. Modified from [53].

Figure 11.
Data for hopping. Same indications as in Figure 9. Note that the step is asymmetric over the whole speed range. Modified from [53].

Figure 12.
By increasing the number of spokes in a polygonal wheel external work per step is decreased, but internal power is increased. Modified from [56].
Figure 12.
By increasing the number of spokes in a polygonal wheel external work per step is decreased, but internal power is increased. Modified from [56].

Figure 13.
Weight-specific mechanical power output during human running at the indicated speeds with the different step frequencies given on the abscissa (five untrained male subjects, 37 yr, 75 kg). Each point refers to a run made by a subject. The filled symbols and the × symbols indicate the external power output to accelerate and lift the center of gravity of the body. The open symbols and the + symbols indicate the internal power to accelerate the limbs relative to the center of gravity of the body. In the left panels, power was calculated by dividing the positive work done at each step by the duration of the step (step-average power). In the right panels, power was calculated by dividing the positive work done at each step by the time during which positive work is done (push-average power). The upper curve indicates the total power calculated as the sum of the external and internal powers. It can be seen that the total power attains a minimum, indicated on the abscissa by the open arrow, at a step frequency, which is higher for the push-average power than for the step-average power. The freely chosen step frequency is indicated on the abscissa by the closed arrow. Modified from [40].

Figure 14.
The filled circles indicate the freely chosen step frequency during human running (filled arrows in Figure 13). Vertical bars indicate the standard deviation of the mean of 170 runs. The open squares and triangles indicate, respectively, the frequencies at which the step-average power (fo,step: open arrows in the left panels of Figure 13) and the push-average power (fo,push: open arrows in the right panels of Figure 13) are minimal. Modified from [40].

Figure 15.
Effect of a step frequency change at the three indicated running speeds on the metabolic energy power expenditure (upper panels), the total mechanical power (middle panels) and the mechanical efficiency (lower panels). The open circles and the continuous line represent the average of data obtained on five subjects. The filled circles and the dotted line at 5.3 km h−1 represent the average of data obtained on one subject only. Means values ± SD when SD larger than symbol size; the number of items in the mean is given by the figures near the symbols of the upper panels. From [41].

Figure 16.
The freely chosen step frequency (f, continuous line) is greater in the old subjects (74 yr) than in the young subjects (21 yr). In addition, over most of the running speed range, the freely chosen step frequency is similar to the resonant frequency of the system (fs, interrupted line) in the old subjects (left panel), whereas it is less than the frequency of the system in the young subjects (right panel, with old subjects lines superposed in grey for comparison). Vertical bars indicate the standard deviation of the mean. Modified from [57].

Figure 17.
Mechanical energy of the center of mass of the body during human running steps at the indicated speeds. In each panel the curves show the gravitational potential energy (Ep, blue), the kinetic energy of vertical motion (Ekv, red), the kinetic energy of forward motion (Ekf, brown), the kinetic energy of motion in the sagittal plane (Ek = Ekv + Ekf, green), and the total translational energy of the center of mass of the body in the sagittal plane (Ecm = Ep + Ek, black). The interrupted vertical lines through the peaks of Ekv indicate when the bouncing system is loaded with a vertical force equal to body weight. The red horizontal bars indicate the time during which positive external work is done, tpush (increment of Ecm), whereas the blue horizontal bars indicate the time during which negative external work is done, tbrake (decrement of Ecm). The gap between red and blue bars indicates the duration of the aerial time (when present). The landing-takeoff asymmetry, indicated by tpush > tbrake, measures the discrepancy from an elastic rebound where tpush = tbrake. Subject: 72.5 kg mass, 1.79 m height, 23 yrs old [58].

Figure 18.
The open circles indicate the ratio between the upward displacement of the center of mass of the body taking place at each step during contact Sc,up and the total upward displacement Sv,up. The filled circles indicate the ratio between downward displacement of the center of mass taking place at each step during contact Sc,down and the total downward displacement Sv,down. The open squares indicate the ratio between the upward displacement of the center of mass of the body taking place at each step when the vertical force is greater than body weight, Sce,up, and the total upward displacement Sv,up. The filled squares indicate the ratio between the downward displacement of the center of mass of the body taking place at each step when the vertical force is greater than body weight, Sce,down, and the total downward displacement Sv,down. It can be seen that: i) Sc/Sv ~ 1 at very low speeds when the aerial phase may be nil (see upper left panel of Figure 17), ii) the decrease of Sc/Sv with speed, due to the increased duration of the aerial phase, is greater for the downward displacement (down) than for the upward displacement (up), i.e., the ballistic fall is greater than the ballistic lift, and iii) the fraction of the vertical displacement corresponding to the amplitude of the oscillation Sce/Sv changes less with speed and approaches one half of Sv, both during compression (down) and recoil of the spring (up). The vertical bars indicate the standard deviation of the mean. Modified from [58].

Figure 19.
Changes in gravitational potential energy of the center of mass of the body, Ep, and in kinetic energy of its motion in the sagittal plane, Ek = Ekv + Ekf (green), are plotted with the simultaneous Ep - Ek transduction during the step Rint(t) (black) (see section 2.2). The energy curves are normalized to oscillate between zero and one. Same step illustrated in Figure 17 at 13.5 km h−1. The different colors in the Ep curve distinguish the fractions of the step where the vertical force exerted on the ground is greater than body weight (red), and lower than body weight (blue), with lighter blue indicating the aerial phase. The four phases correspond to the vertical displacement during the upward acceleration Sce,up (red) and deceleration Sae,up (blue), and the downward acceleration Sae,down (blue) and deceleration Sce,down (red). The vertical dotted lines are drawn through the two peaks of Ek and encompass the fraction of the step where a transduction occurs between Ep and Ek as indicated by the increments of the Rint(t) curve. Note that the transduction of Ek into Ep during the lift is smaller than the transduction of Ep into Ek during the downward displacement. In the horizontal tracts of the Rint(t) curve no transduction occurs between Ep and Ek and muscle-tendon units absorb simultaneously Ep and Ek (phase β) and increase simultaneously Ep and Ek (phase α). Note that whereas most of β is confined within Sce,down, α extends beyond Sce,up within a large fraction of Sae,up due to a continuing increase of Ek. Modified from [58]. Pictures of man running from [60].

Figure 20.
The times during which positive external work is done at each running step during the push (red circles below and red bars in Figure 17) and negative external work is done during the brake (blue circles below and blue bars in Figure 17) are plotted as a function of the running speed. The inset shows that the increment of Ecm lasts more (note the blunt end) than the decrement of Ecm (note the sharp start) resulting in a positive work duration greater than the negative work duration up to ~14 km h−1. This suggests that muscle-tendon units act differently during shortening (push) and stretching (brake). Above ~14 km h−1, the duration of positive and negative work is approximately equal, suggesting that the response to shortening and stretching is similar, as assumed in the spring-mass model. Modified from [58]. Pictures of man running from [60].

Figure 21.
Hypothesis: at low speeds when muscular force is lower (pink bars) muscle contributes with tendon (brown spring) to length change and work. At high speeds when muscular force is higher (red bars) muscle contracts quasi isometrically: length change and work (shaded area in the insets) are mainly sustained by tendon and other passive structures. Insets modified from [63].

Figure 22.
The aerial phase is not centered on the vertical oscillation of the center of mass: Ep is greater at takeoff than at landing. The asymmetry is greater in the old subject. Other indications as in Figure 17. Modified from [36].

Figure 23.
The open circles indicate the ratio between the upward displacement of the center of mass of the body taking place at each step during contact Sc,up and the total upward displacement Sv,up. The filled circles indicate the ratio between downward displacement of the center of mass taking place at each step during contact Sc,down and the total downward displacement Sv,down. It can be seen that the decrease of Sc/Sv with speed, due to the increased duration of the aerial phase, is greater for the downward displacement (down) than for the upward displacement (up), i.e., the ballistic fall is greater than the ballistic lift. This is particularly true for the old subjects who maintain contact with the ground for almost the whole of the lift of the center of mass of the body. This is shown clearly in Figure 22 by the intercept of the dotted lines with the Ep curve (blue). The vertical bars indicate the standard deviation of the mean. Old subject’s curves are reproduced in grey on the right panel for comparison. Modified from [36].

Figure 24.
Changes in gravitational potential energy of the center of mass of the body, Ep, and in kinetic energy of its motion in the sagittal plane, Ek = Ekv + Ekf (green), are plotted with the simultaneous Ep-Ek transduction during the step Rint(t) (black). See legend to Figure 19 for explanation. Same steps illustrated in Figure 22. Note that, particularly in the old subject, the transduction of Ek into Ep during the lift, Rint,up, is smaller than the transduction of Ep into Ek during the downward displacement, Rint,down. In the horizontal tracts of the Rint(t) curve no transduction occurs between Ep and Ek and muscle-tendon units absorb simultaneously Ep and Ek (phase β) and increase simultaneously Ep and Ek (phase α). Note that whereas most of β is confined within Sce,down, α extends beyond Sce,up within a large fraction of Sae,up more in the old subject than in the young subject. In this Figure an extreme case is shown of the effect of aging regardless of training [72]: the old subject records were obtained on our oldest subject (80 yr) who was exceptionally trained, and compared with a normally trained young subject (21 yr). Modified from [36].

Figure 25.
Positive and negative external work durations in old subjects and in young subjects with superposed the old subject’s lines (gray) for comparison. The time during which positive external work is done at each step during the push (red circles), and negative external work is done during the brake (blue circles) are plotted as a function of the running speed. It can be seen that the duration of positive external work is greater than the duration of negative external work up to a speed of ~13 km h−1 [36] indicating an average force during the brake greater than during the push, which is qualitatively consistent with the force-velocity relation of muscle. This suggests that work done by muscle within the muscle-tendon units at low speeds is progressively substituted, with increasing speed, with elastic energy storage and recovery by tendons (see section 4.4 and Figure 21). On average, the ratio tpush/tbrake is greater in the old subjects suggesting a less elastic behavior, possibly also due, at least in part, to changes in tendons mechanical properties caused by collagen reduction [86]. Modified from [36].

Figure 26.
Mechanical energy of the center of mass of the body during steps of hopping, running and trotting animals at the indicated speeds. Left column larger animals, right column smaller animals. Indications as in Figure 17. From [89].

Figure 27.
Positive and negative work durations in hopping, running and trotting steps at different speeds. It can be seen that the duration of positive work tpush (red) is greater than the duration of negative work tbrake (blue) in all the animals in spite of their different anatomy, body weight and systems of locomotion. From [89].


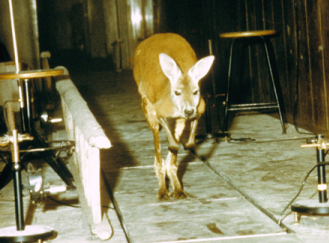
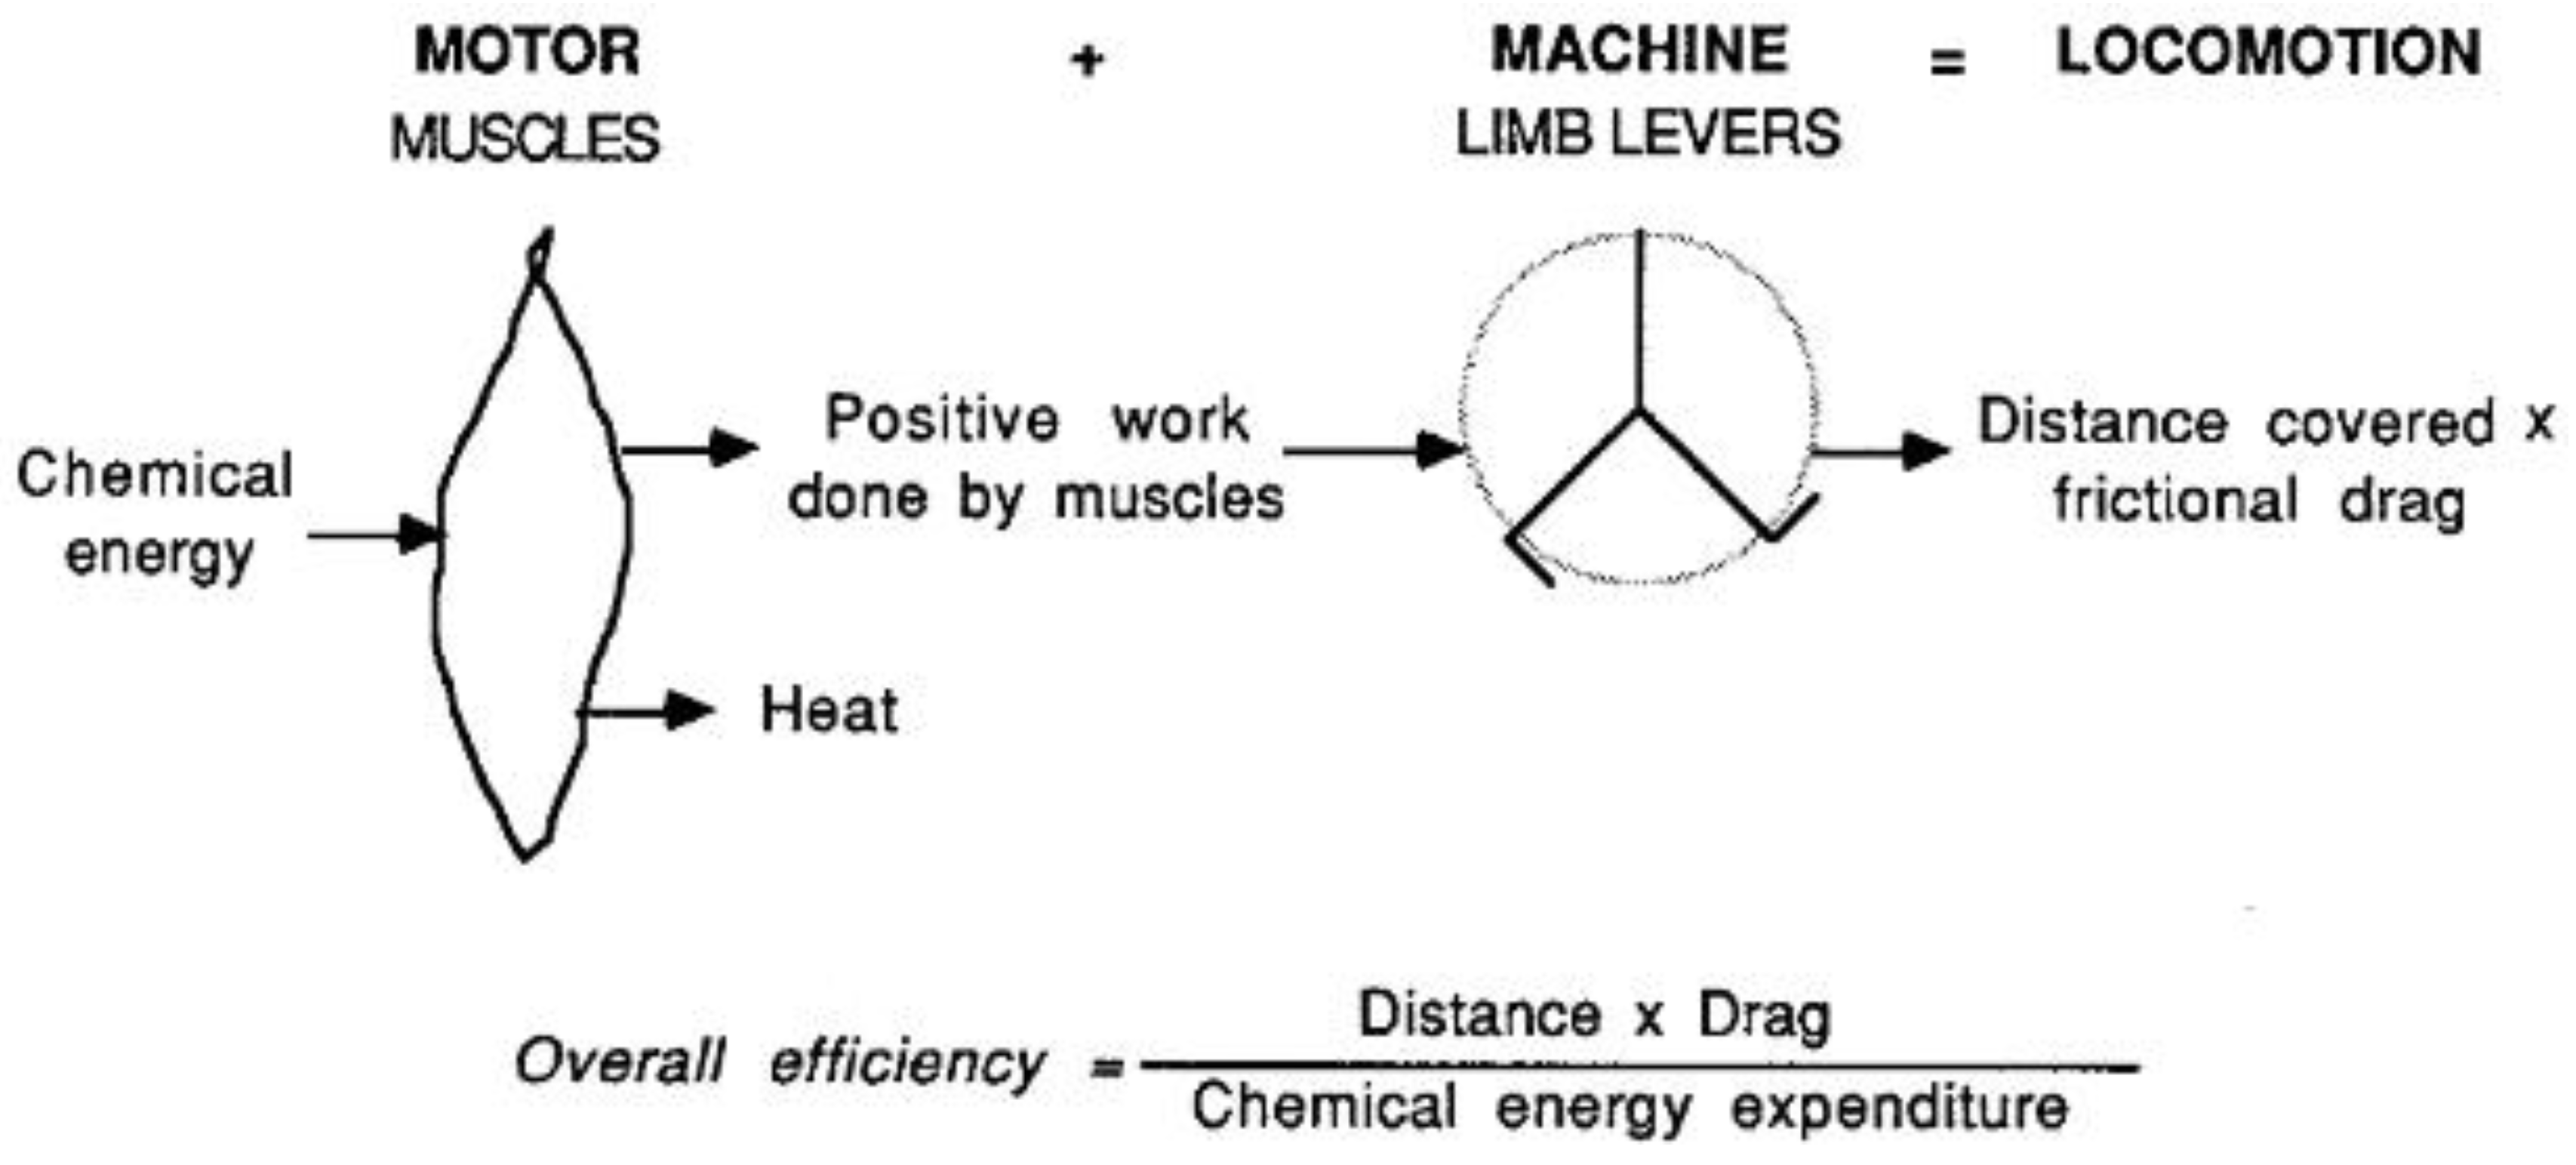
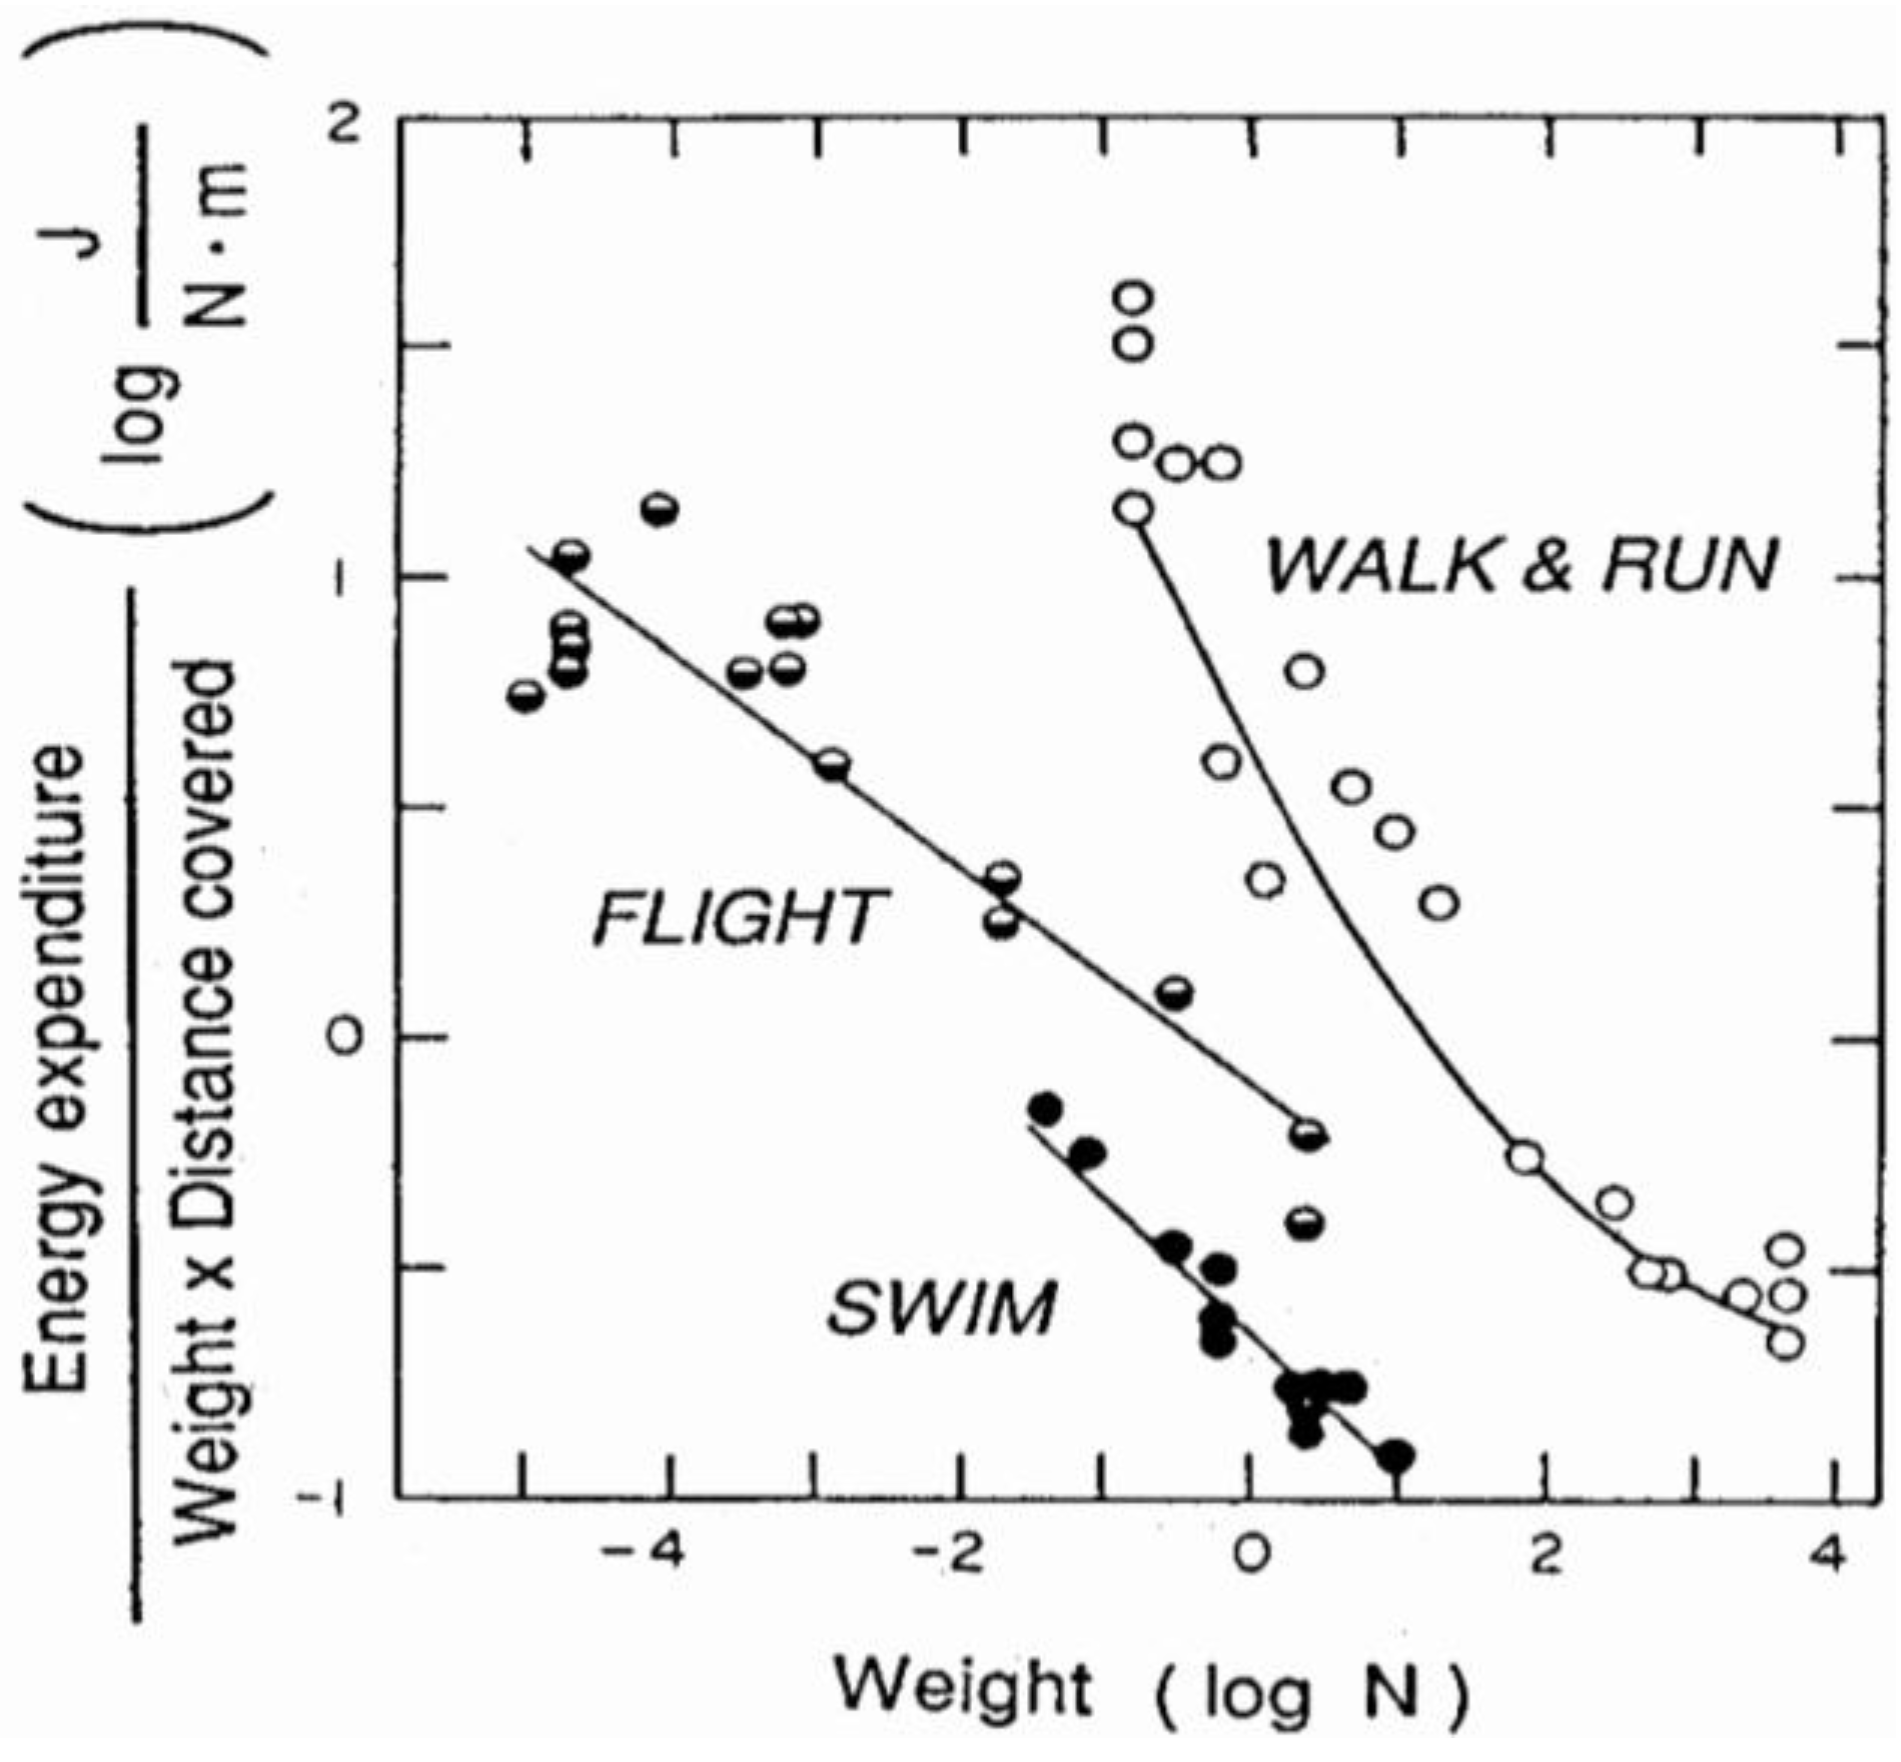
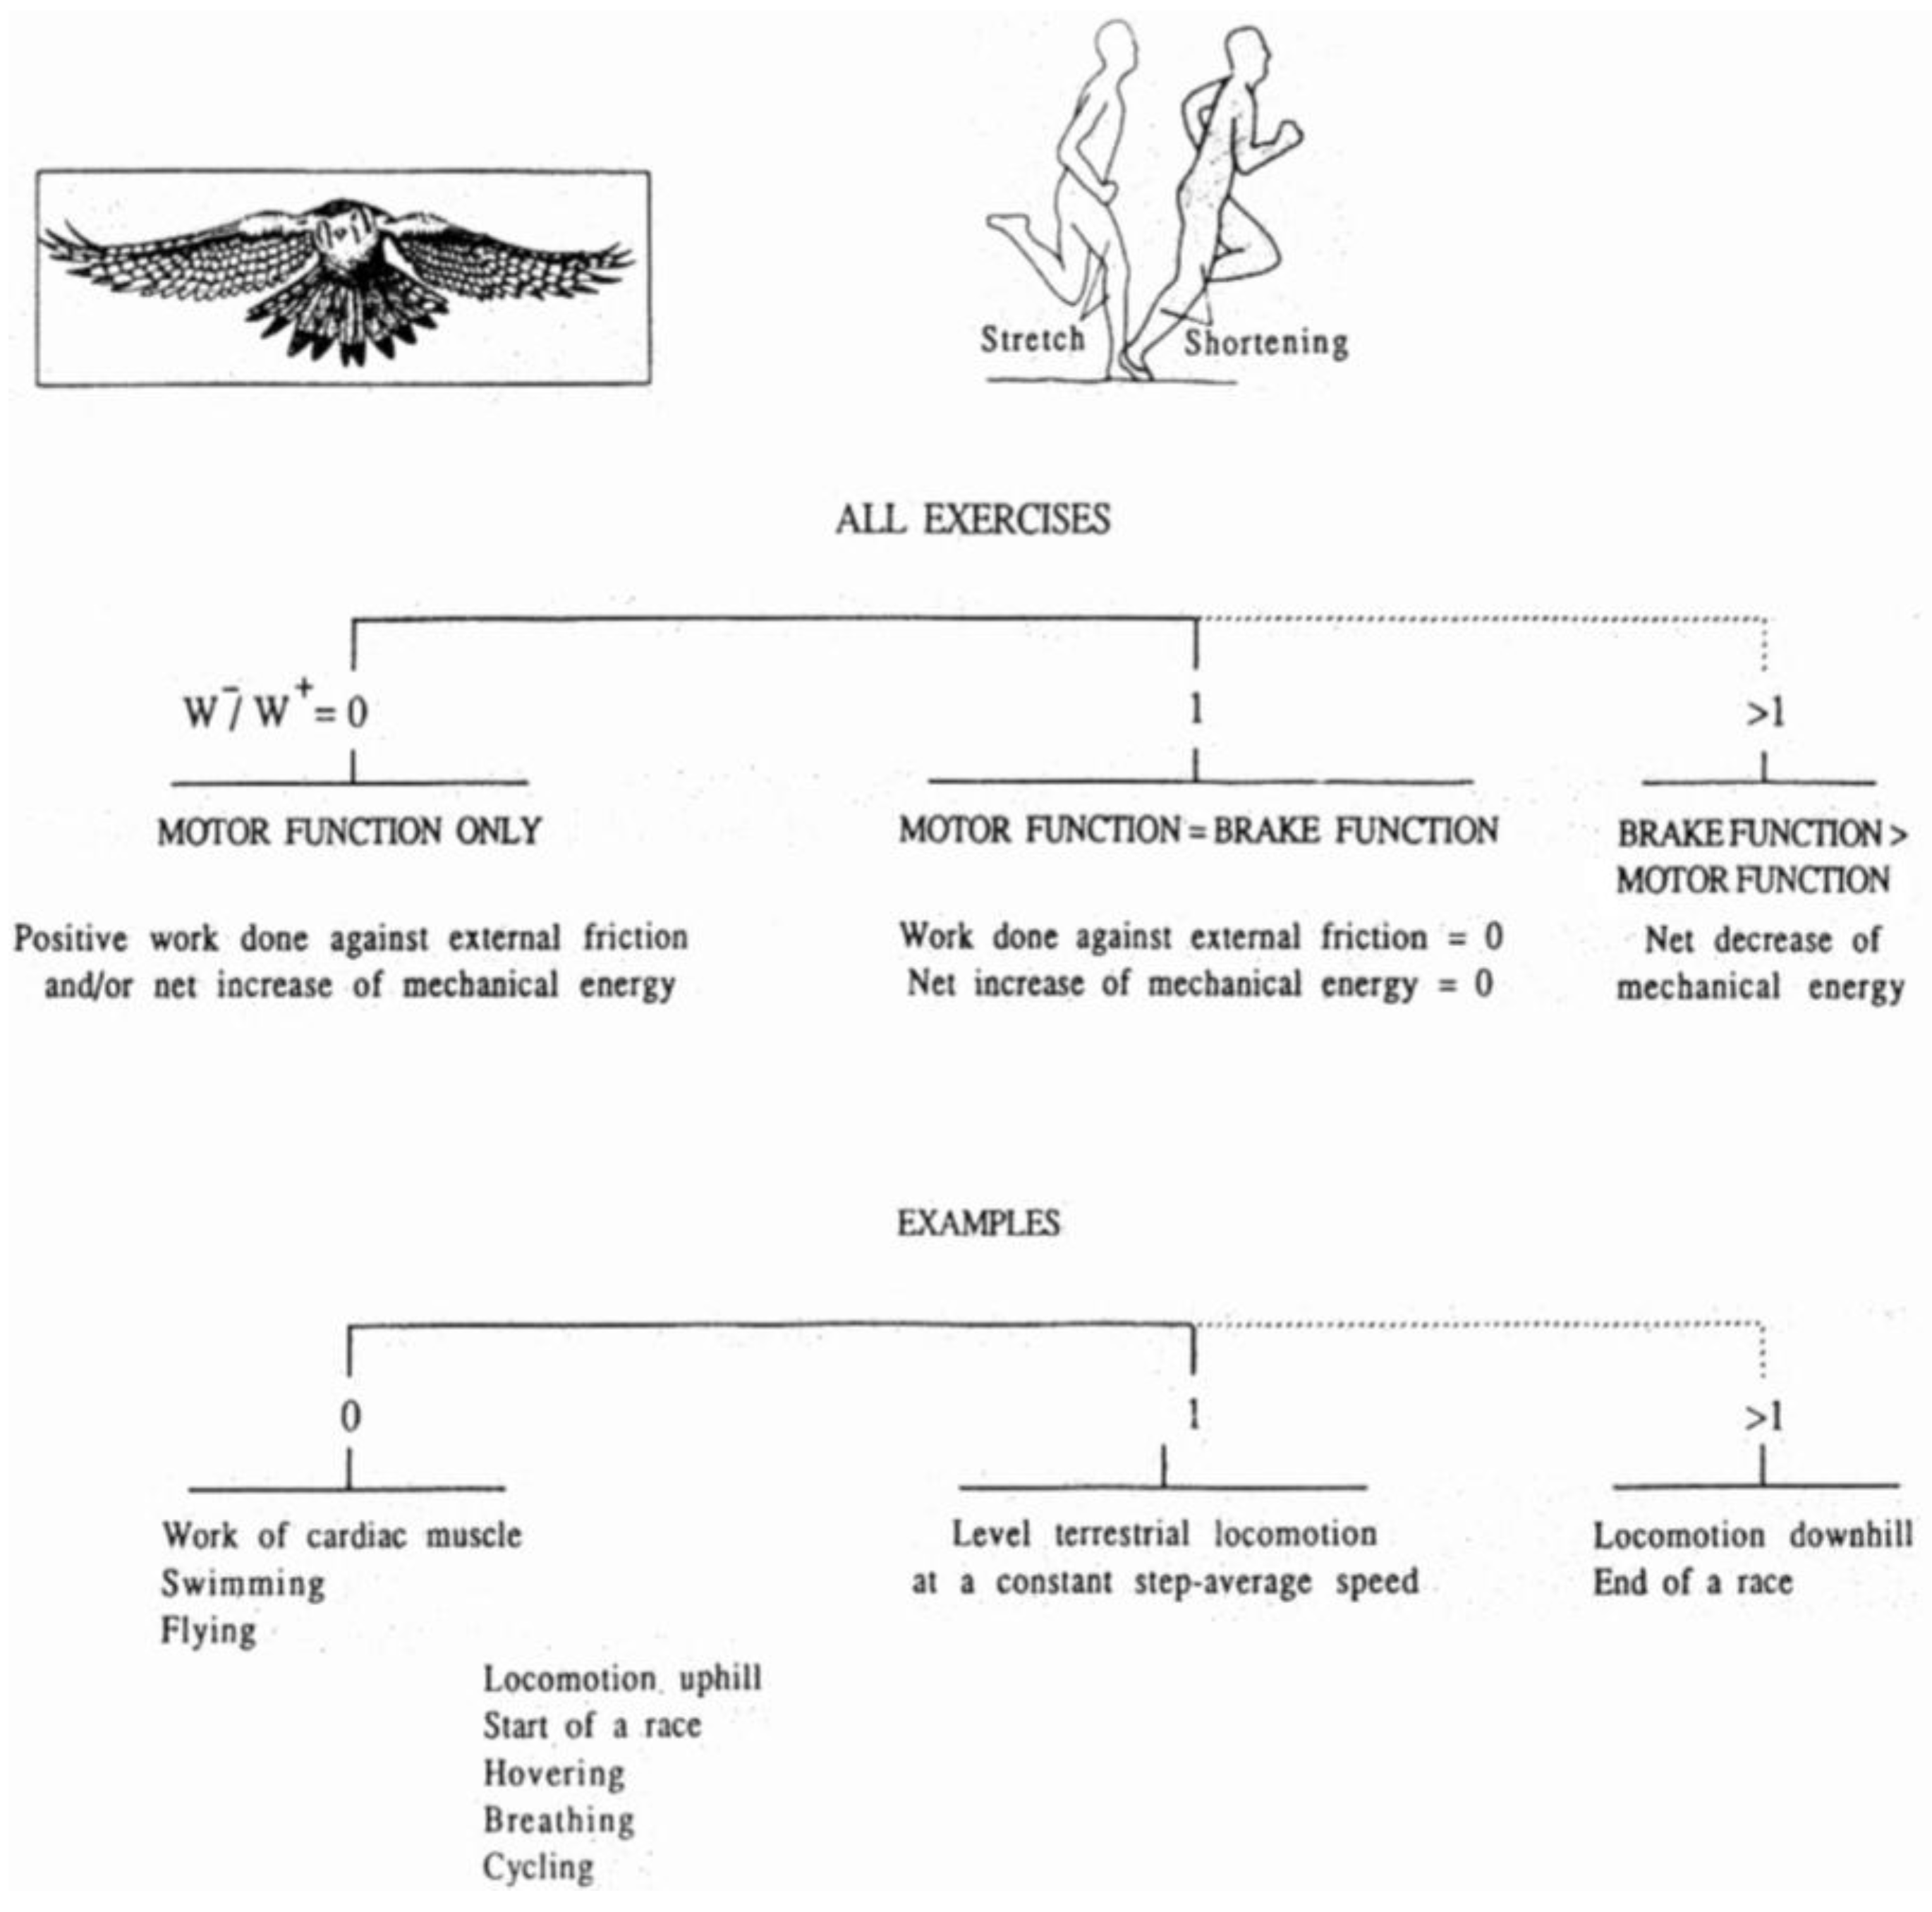
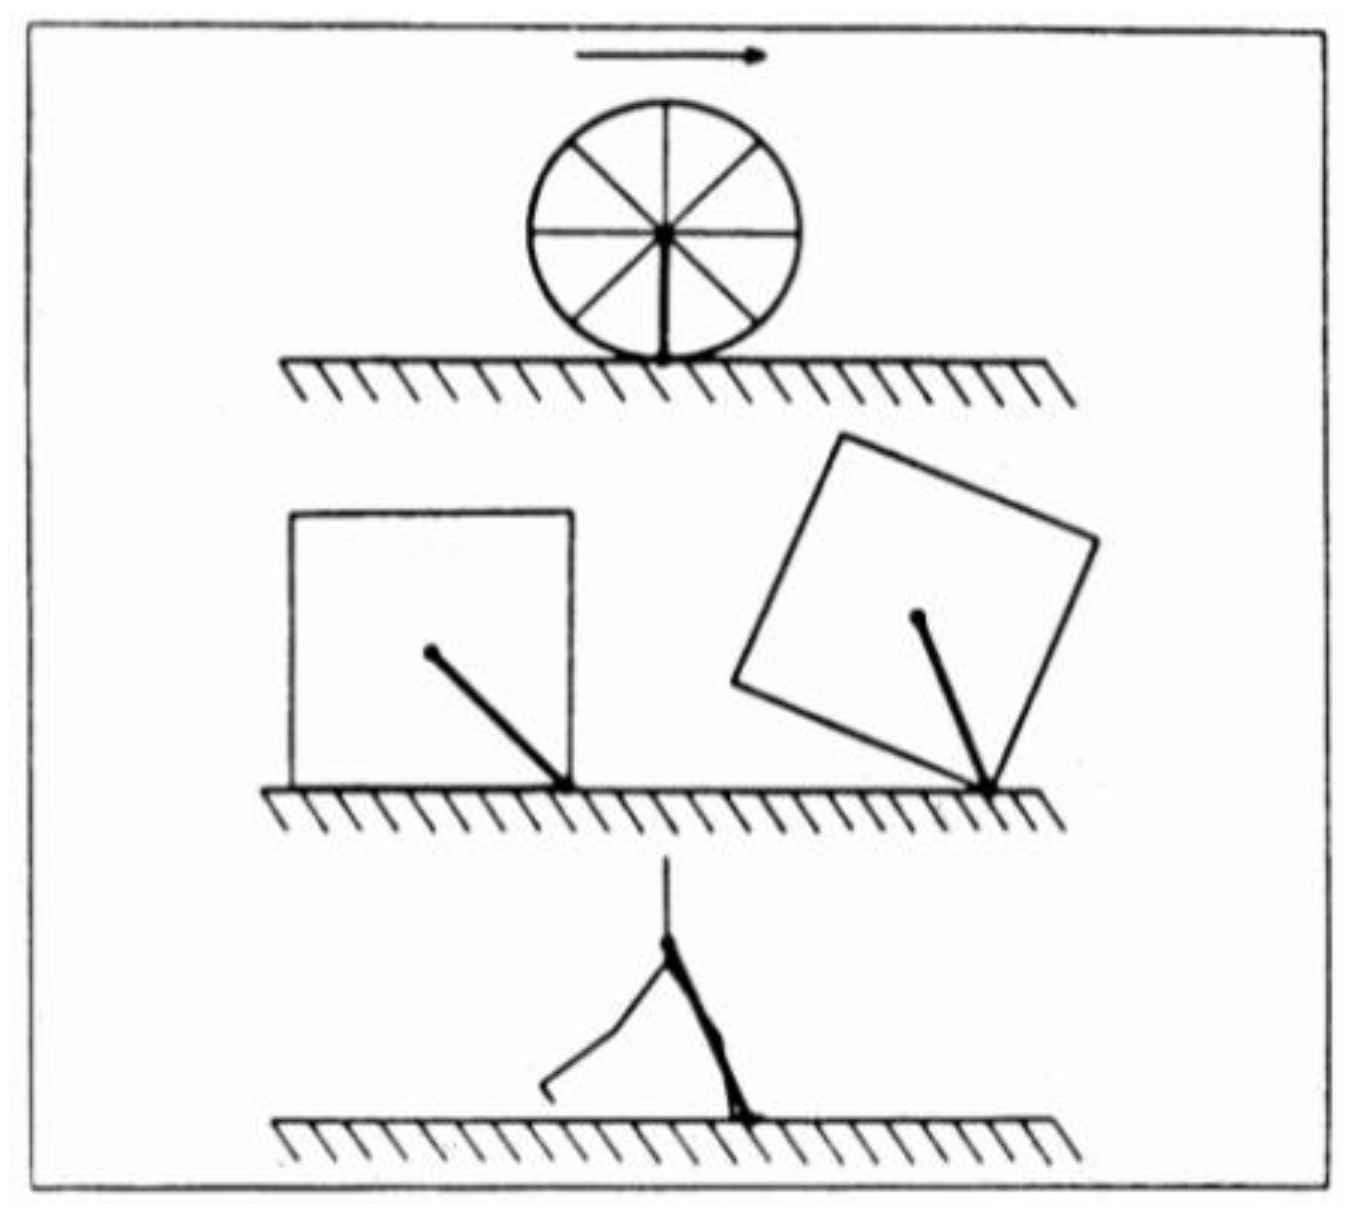
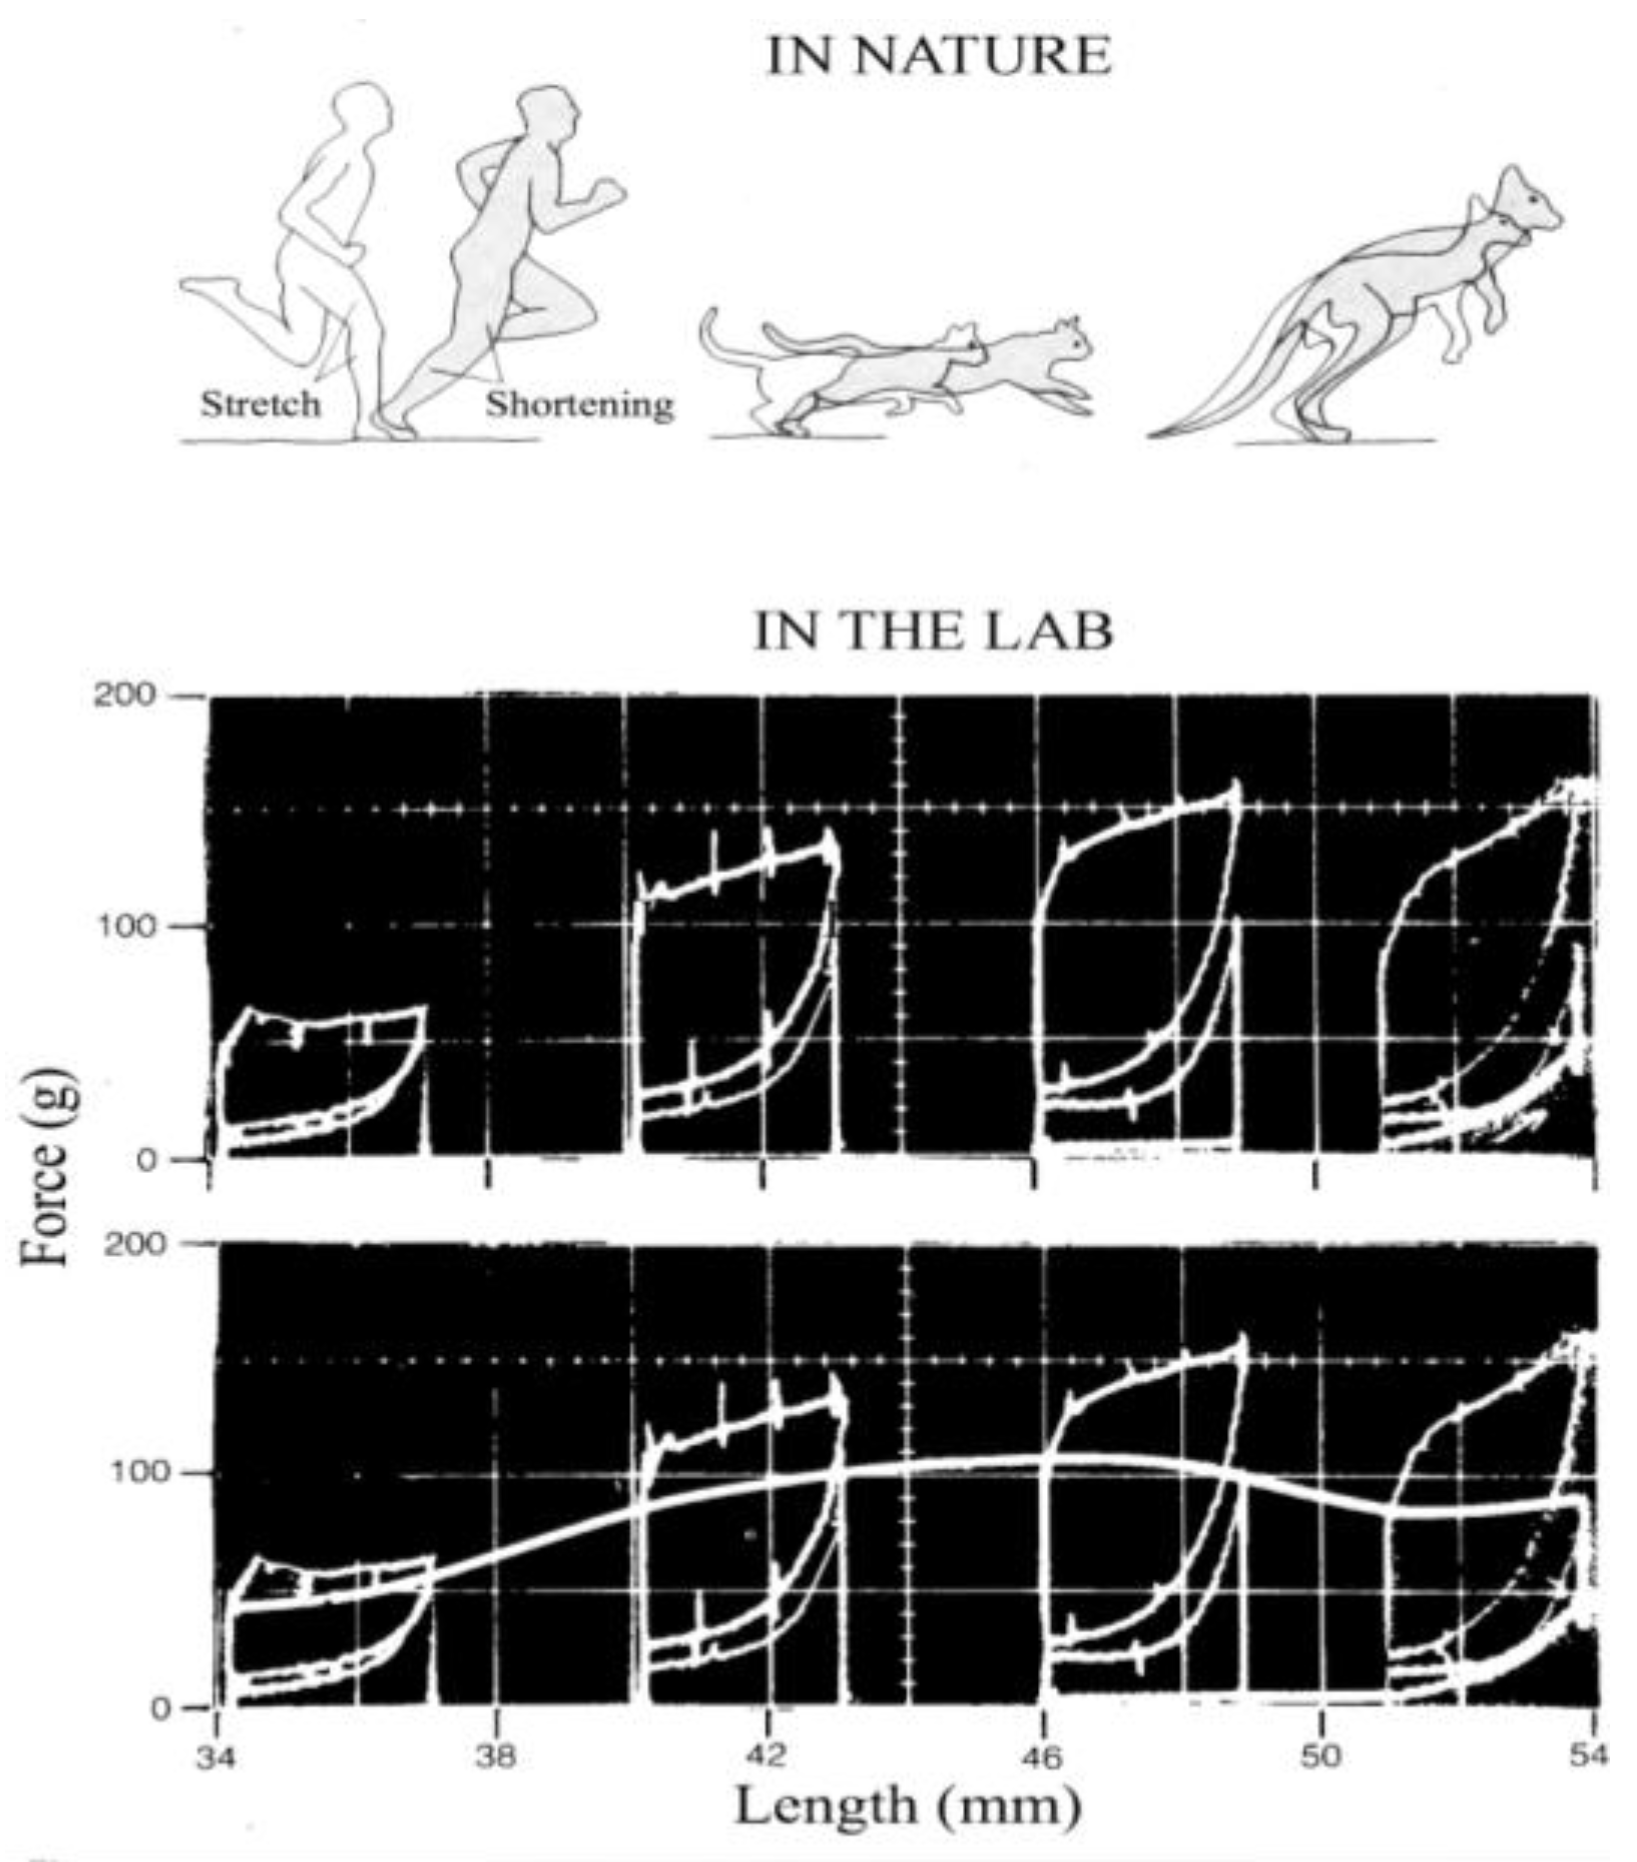
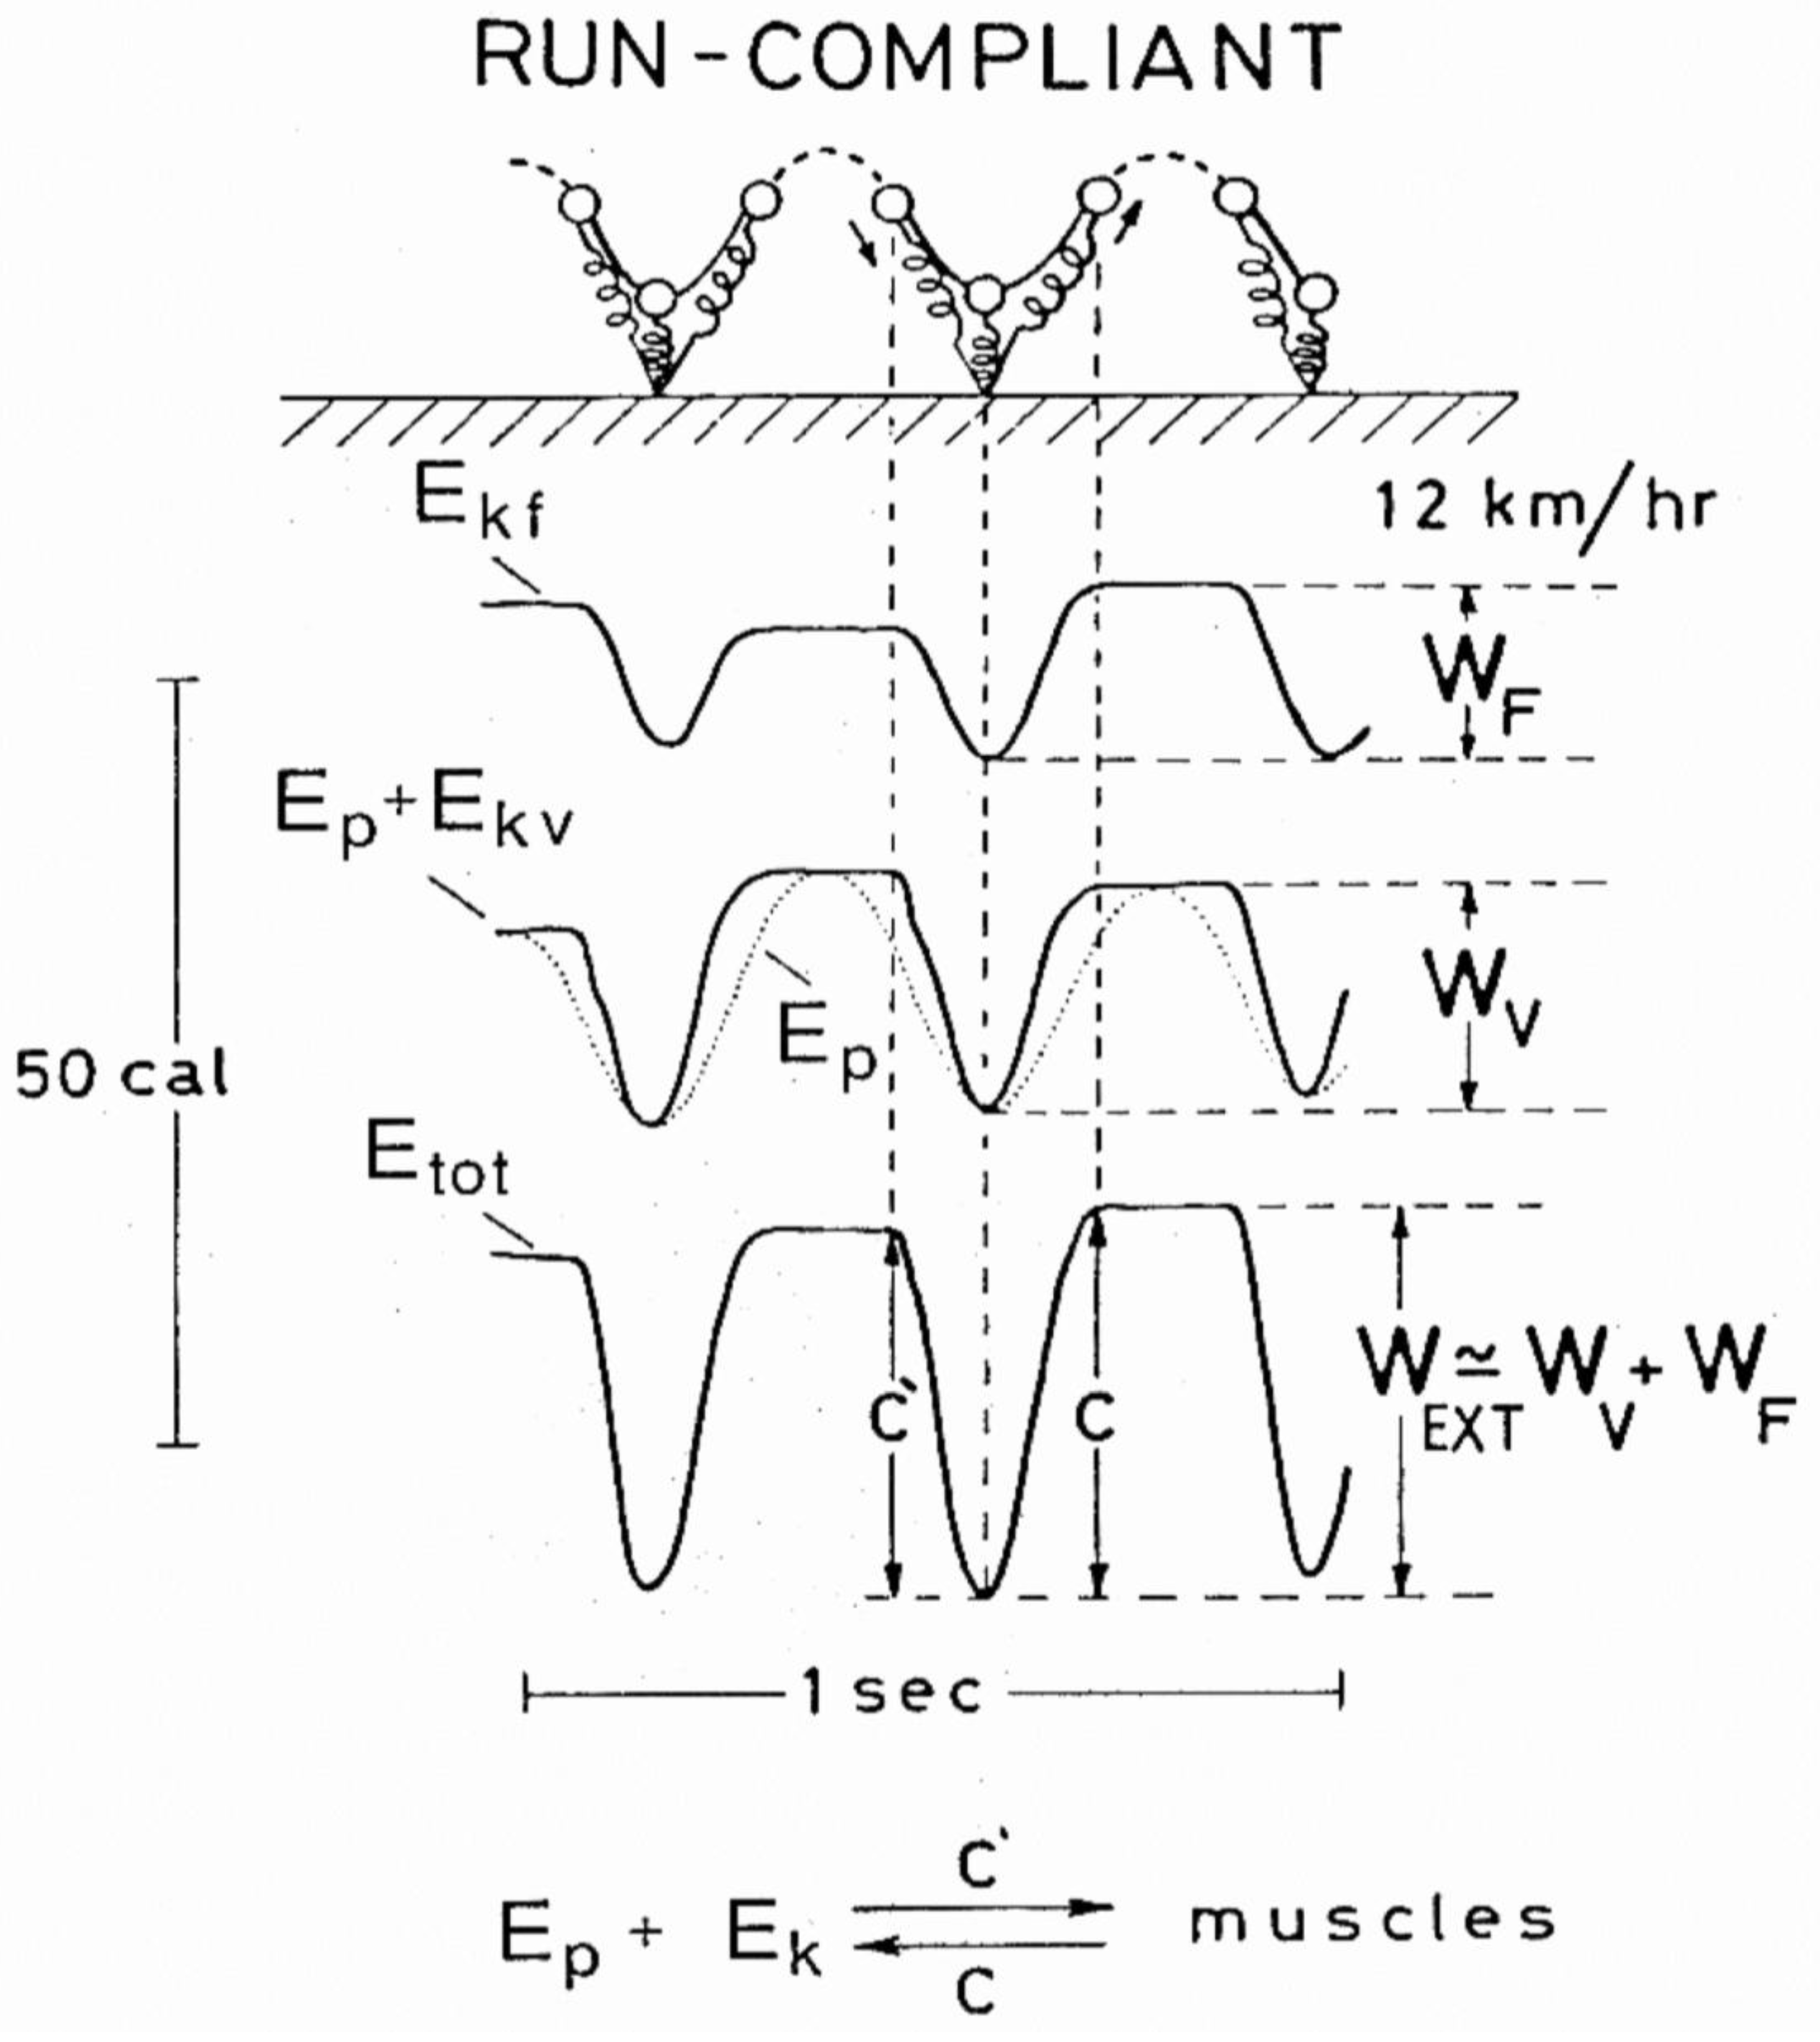
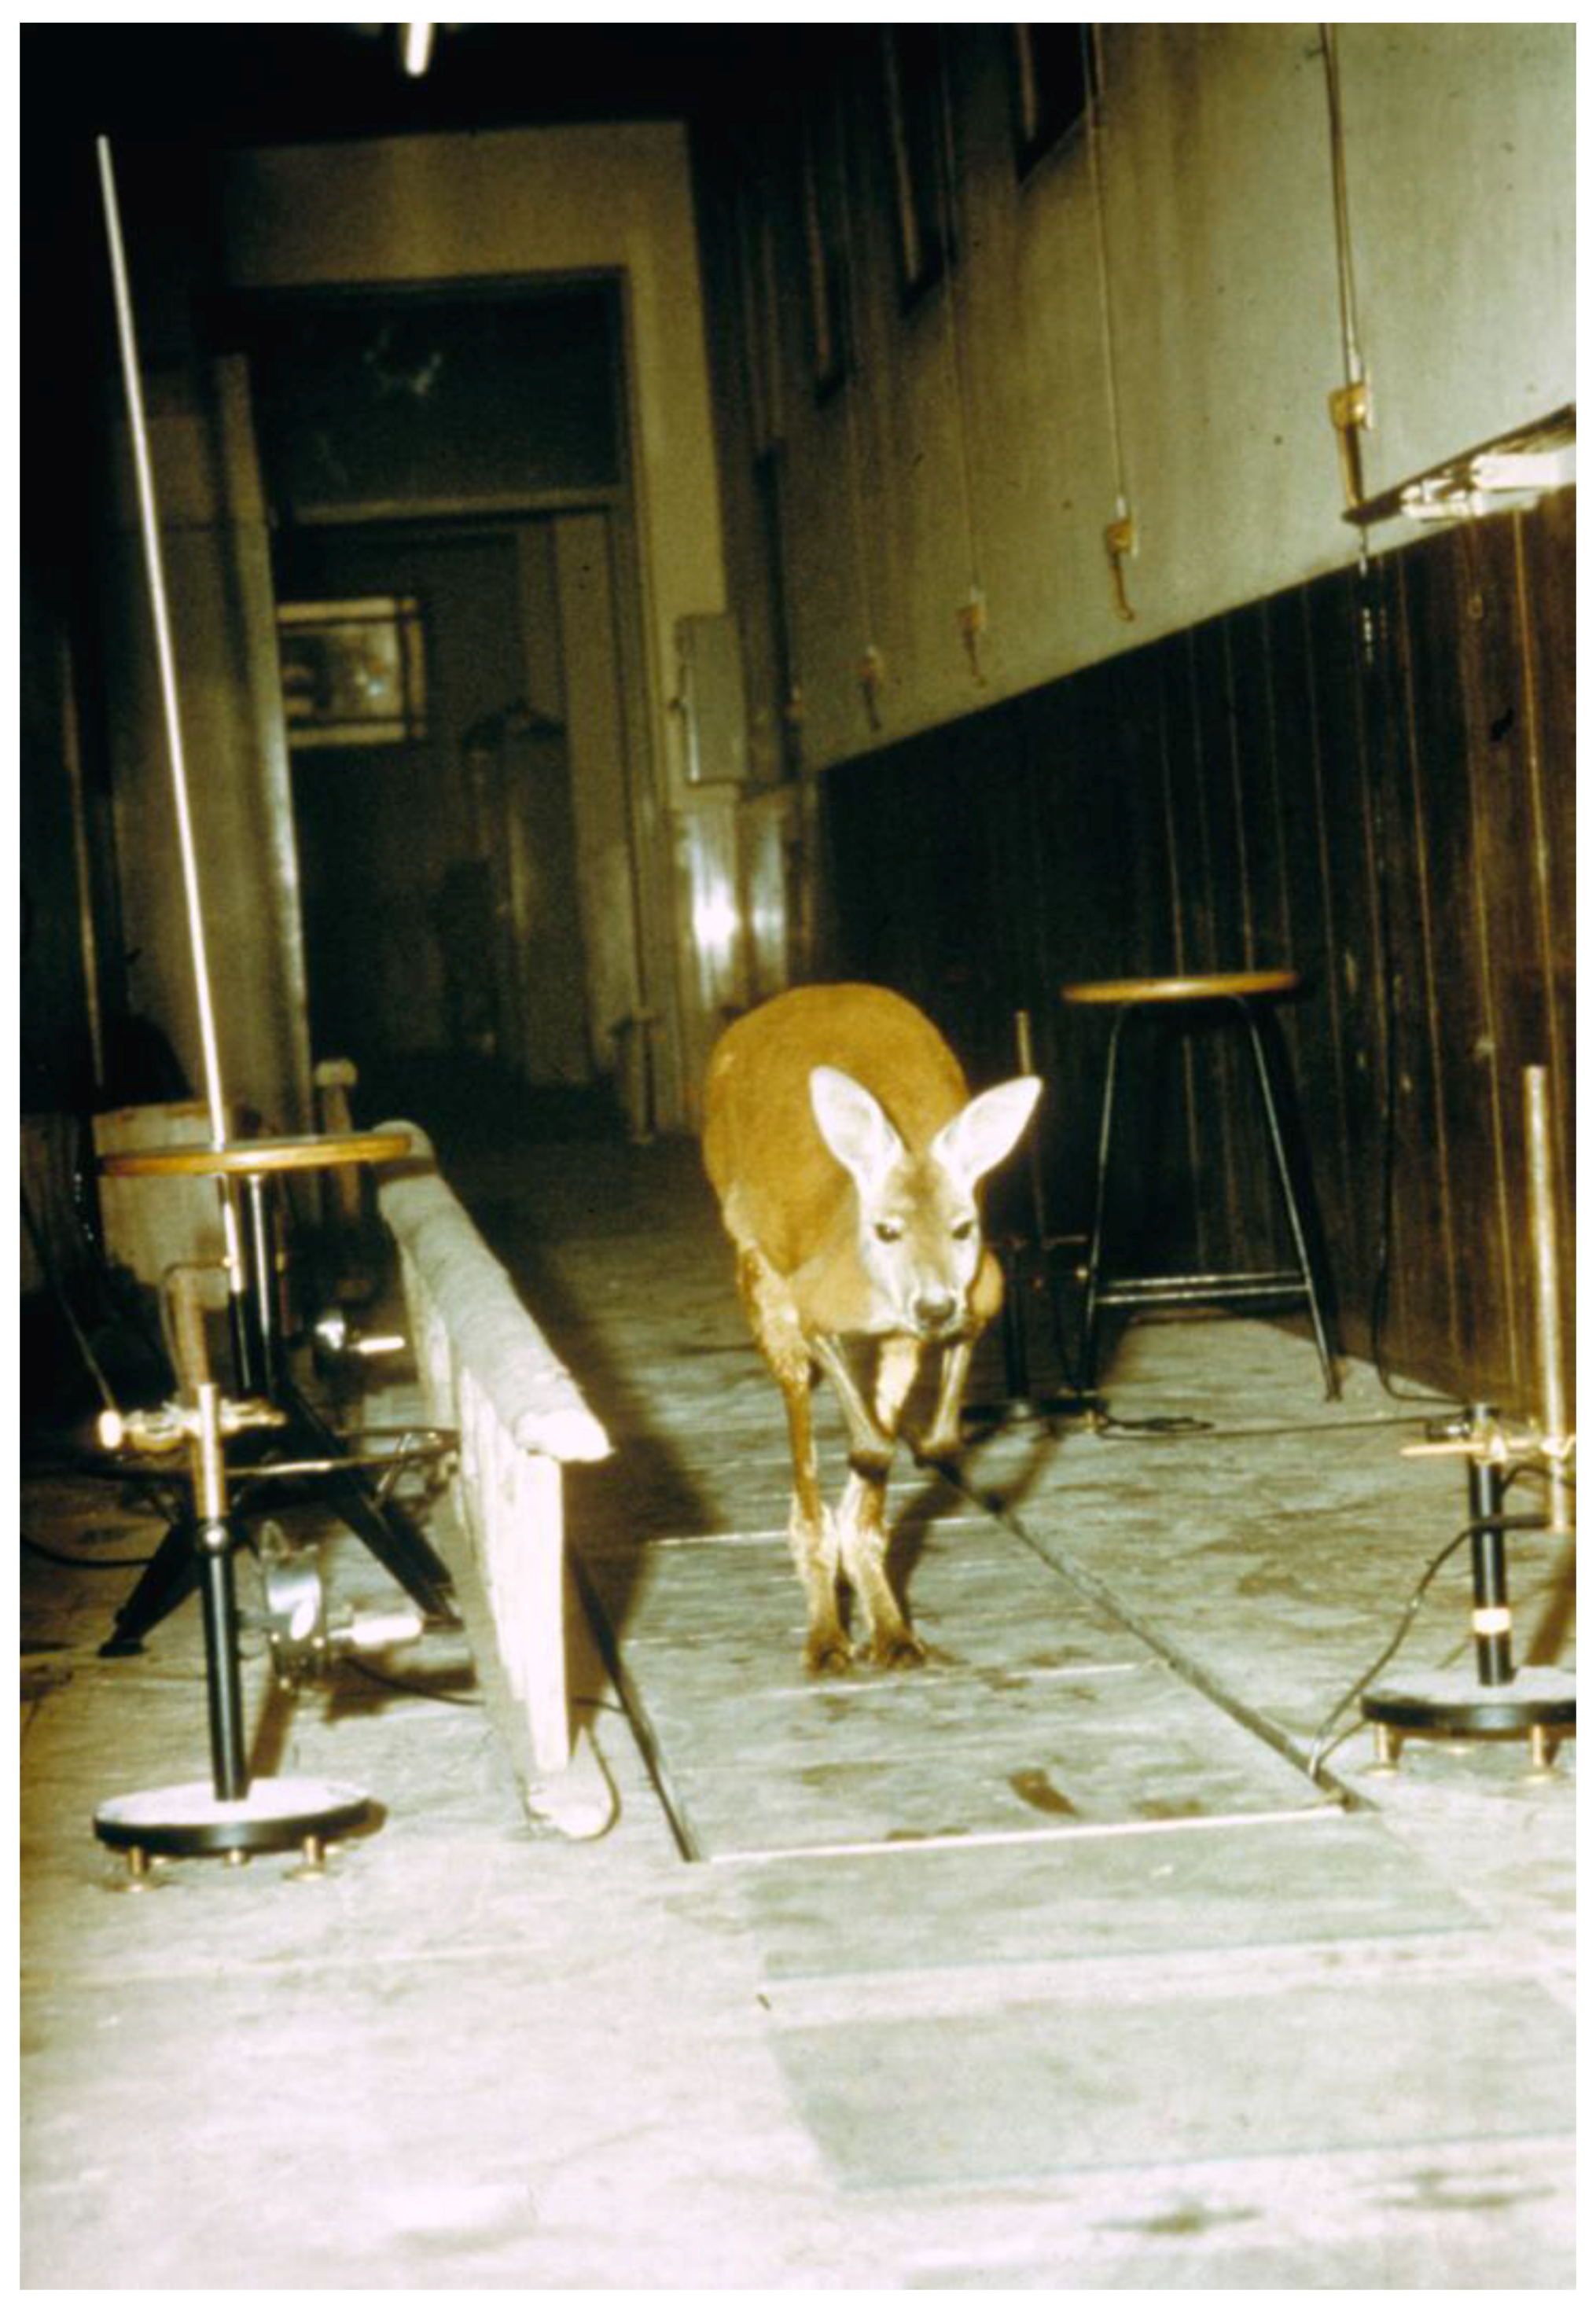
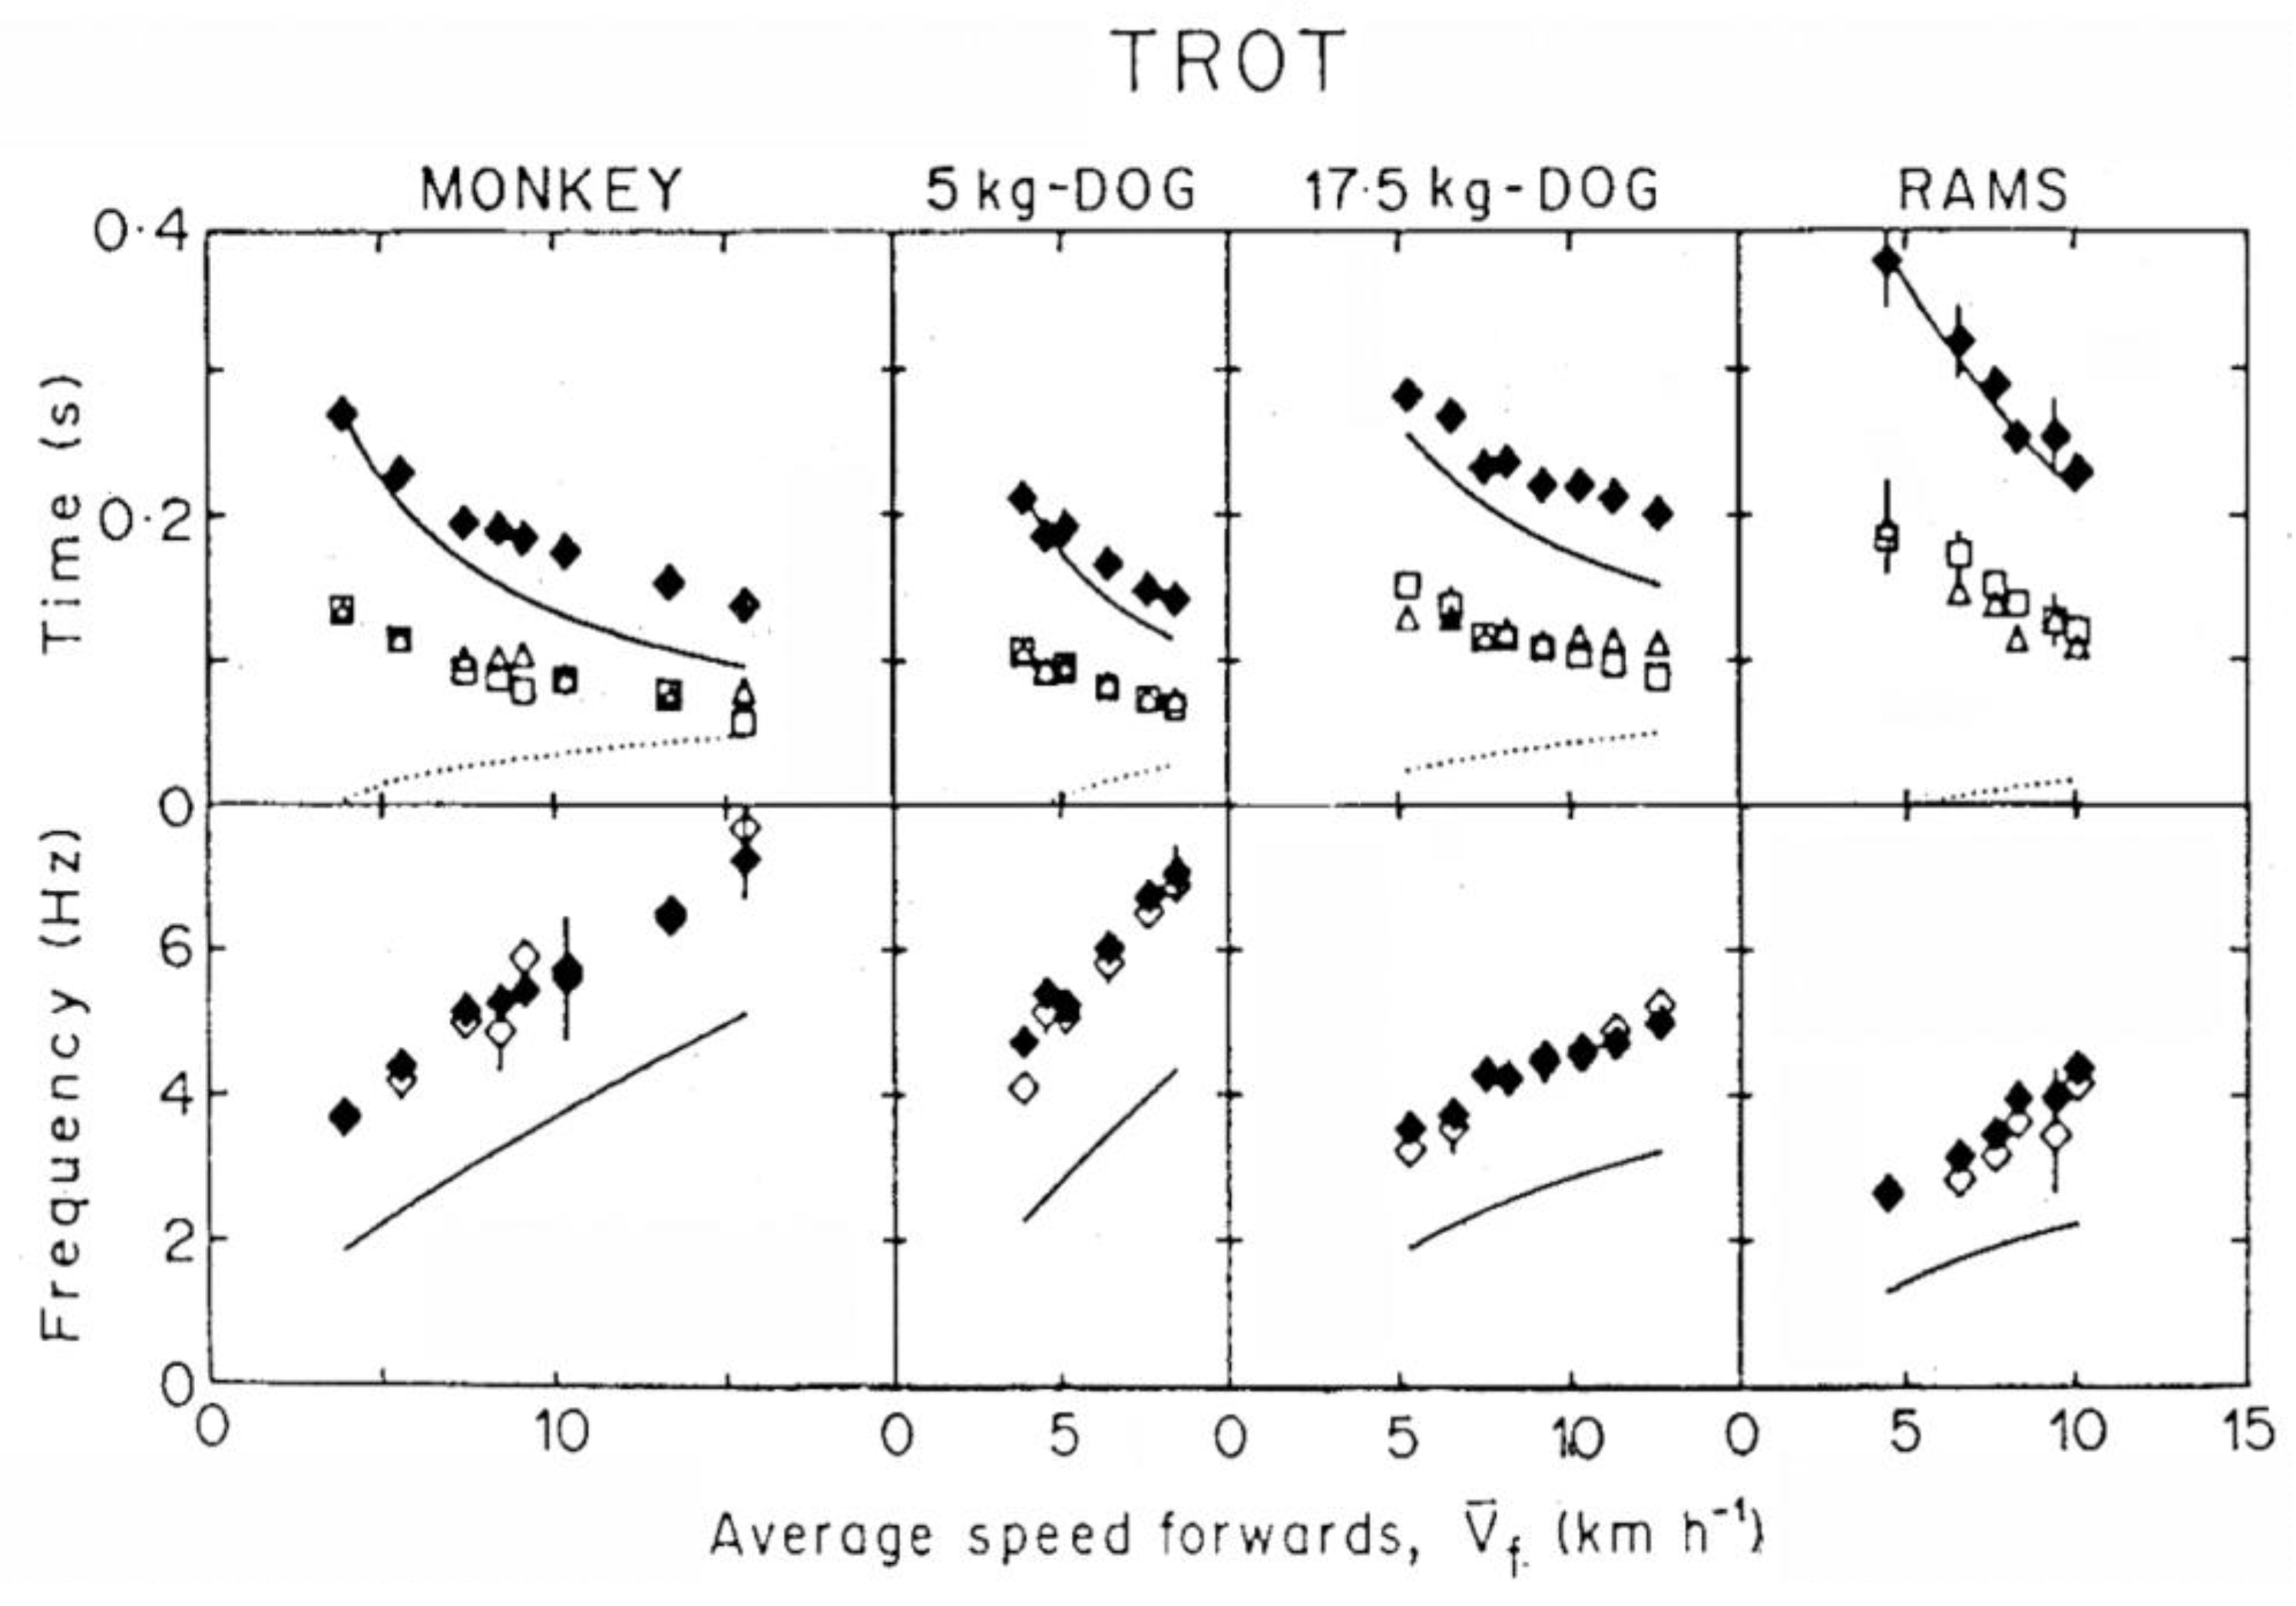
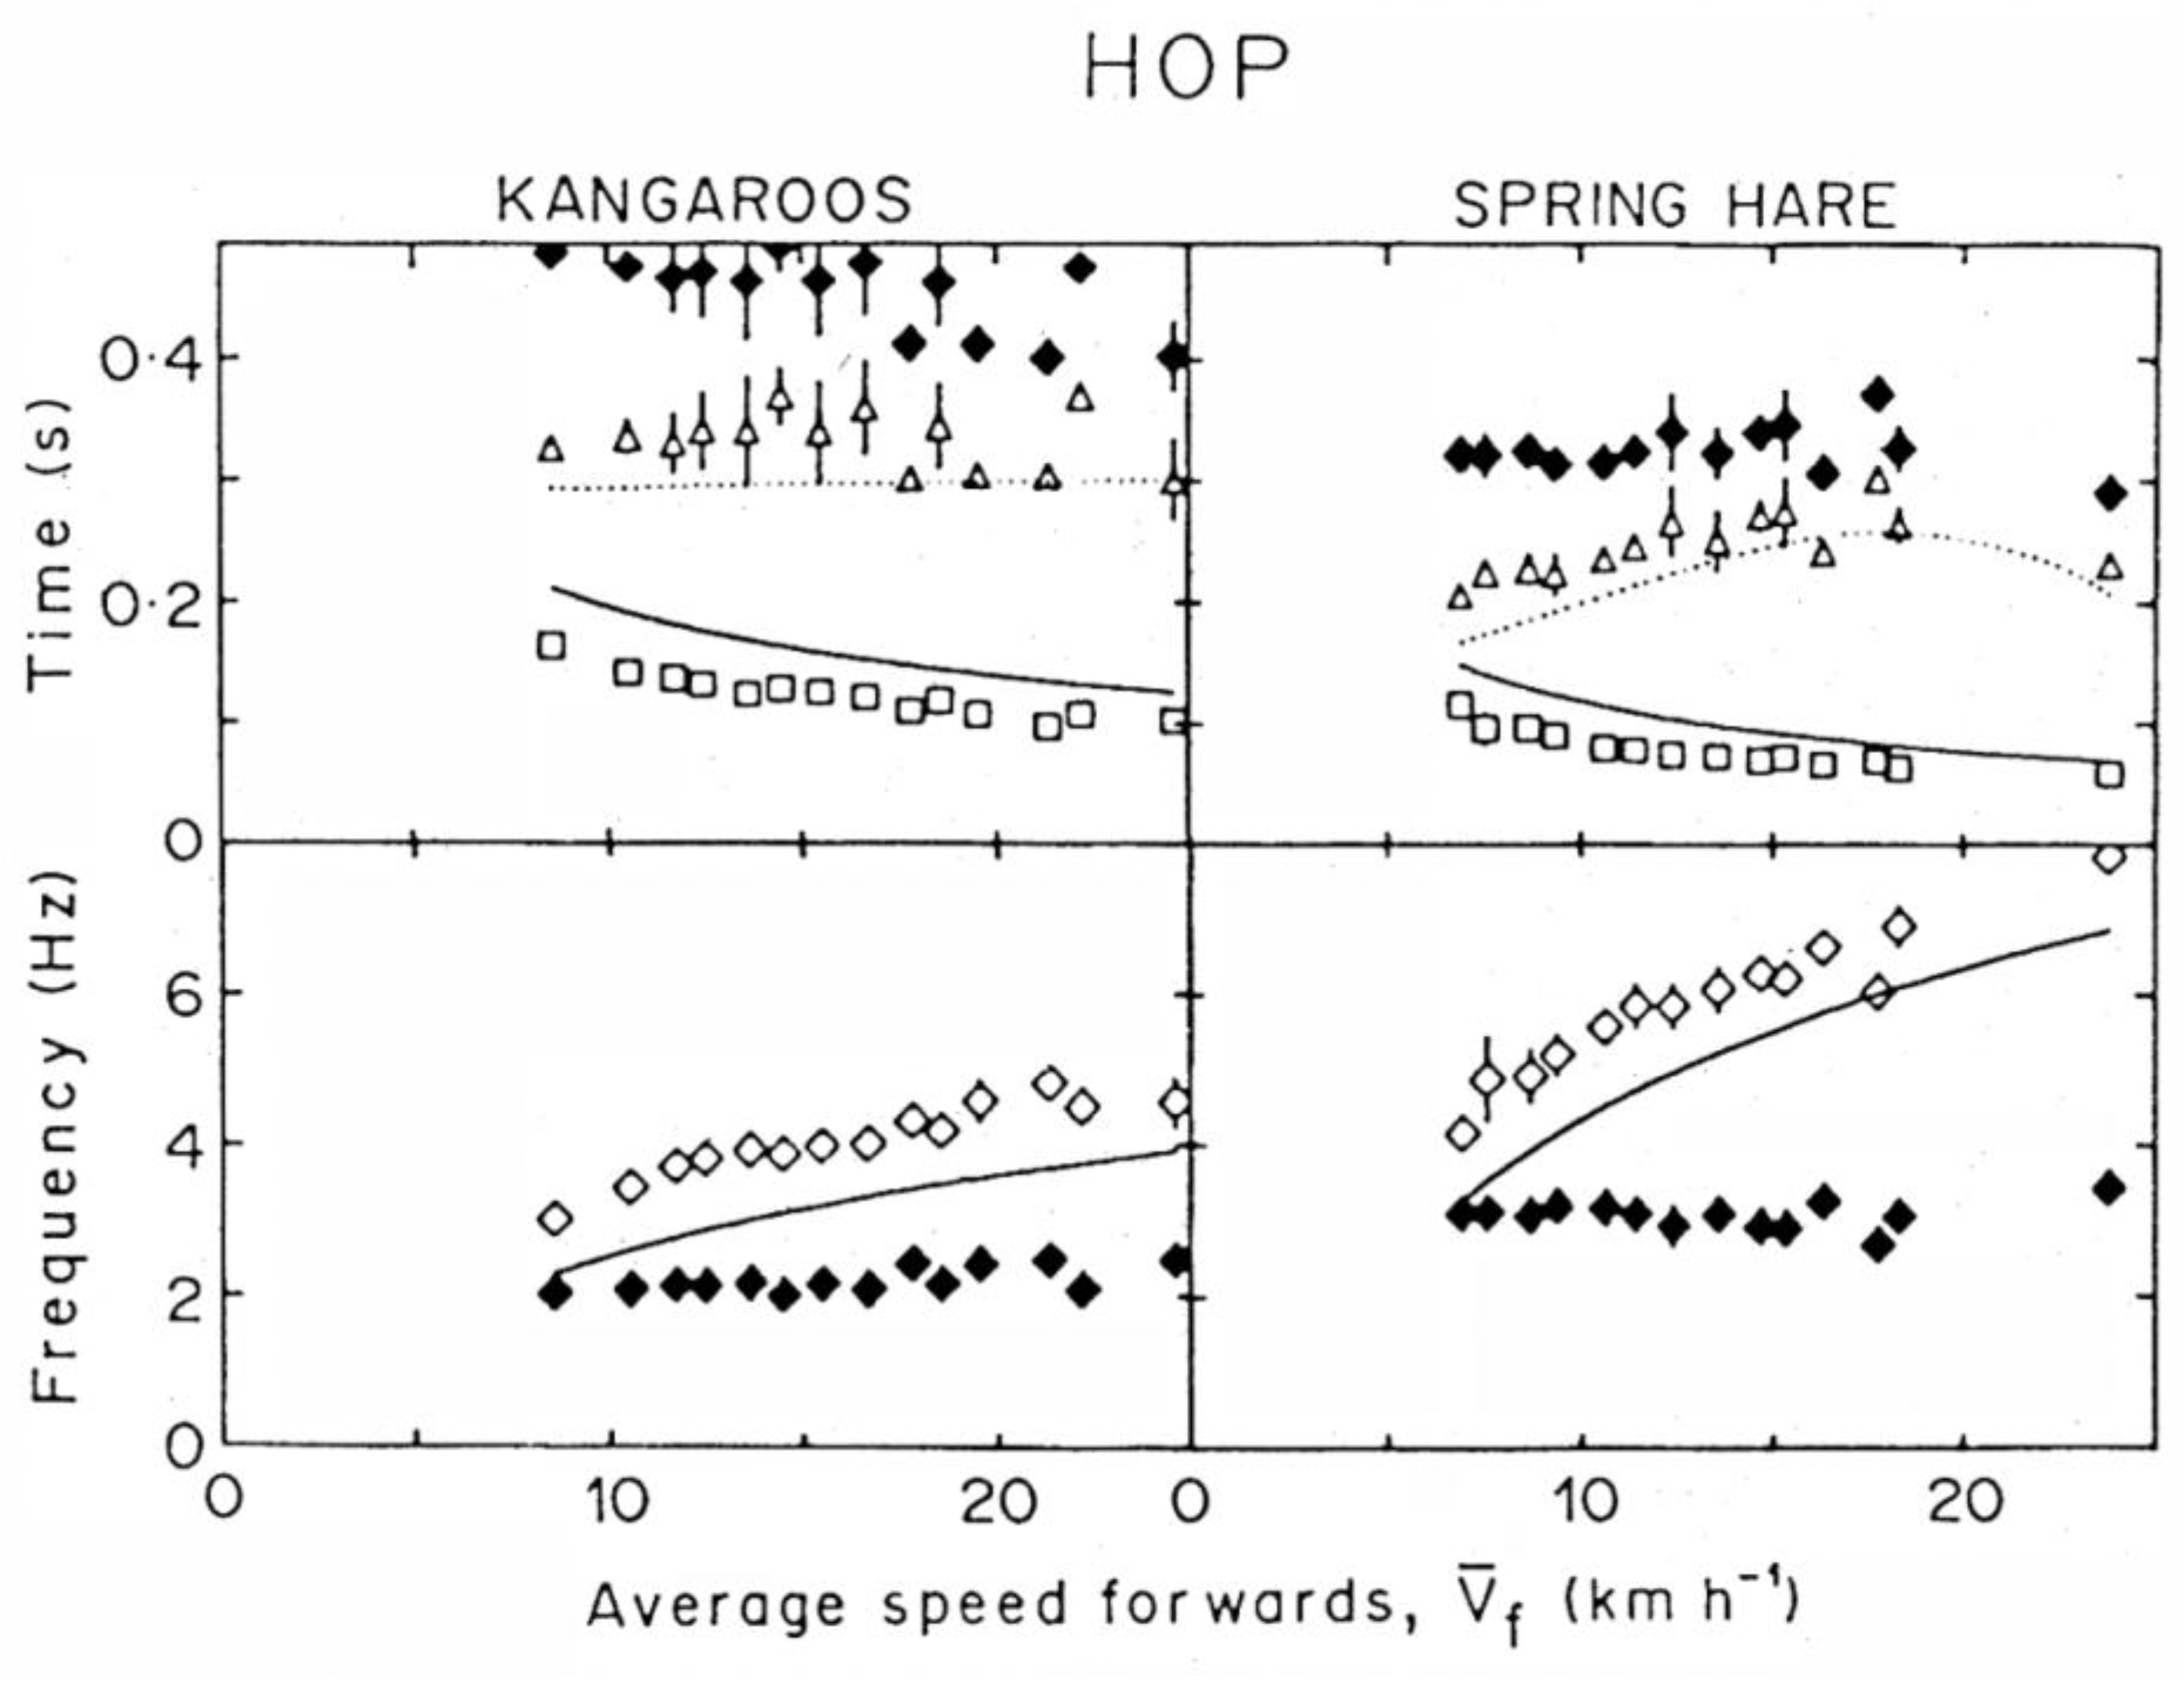
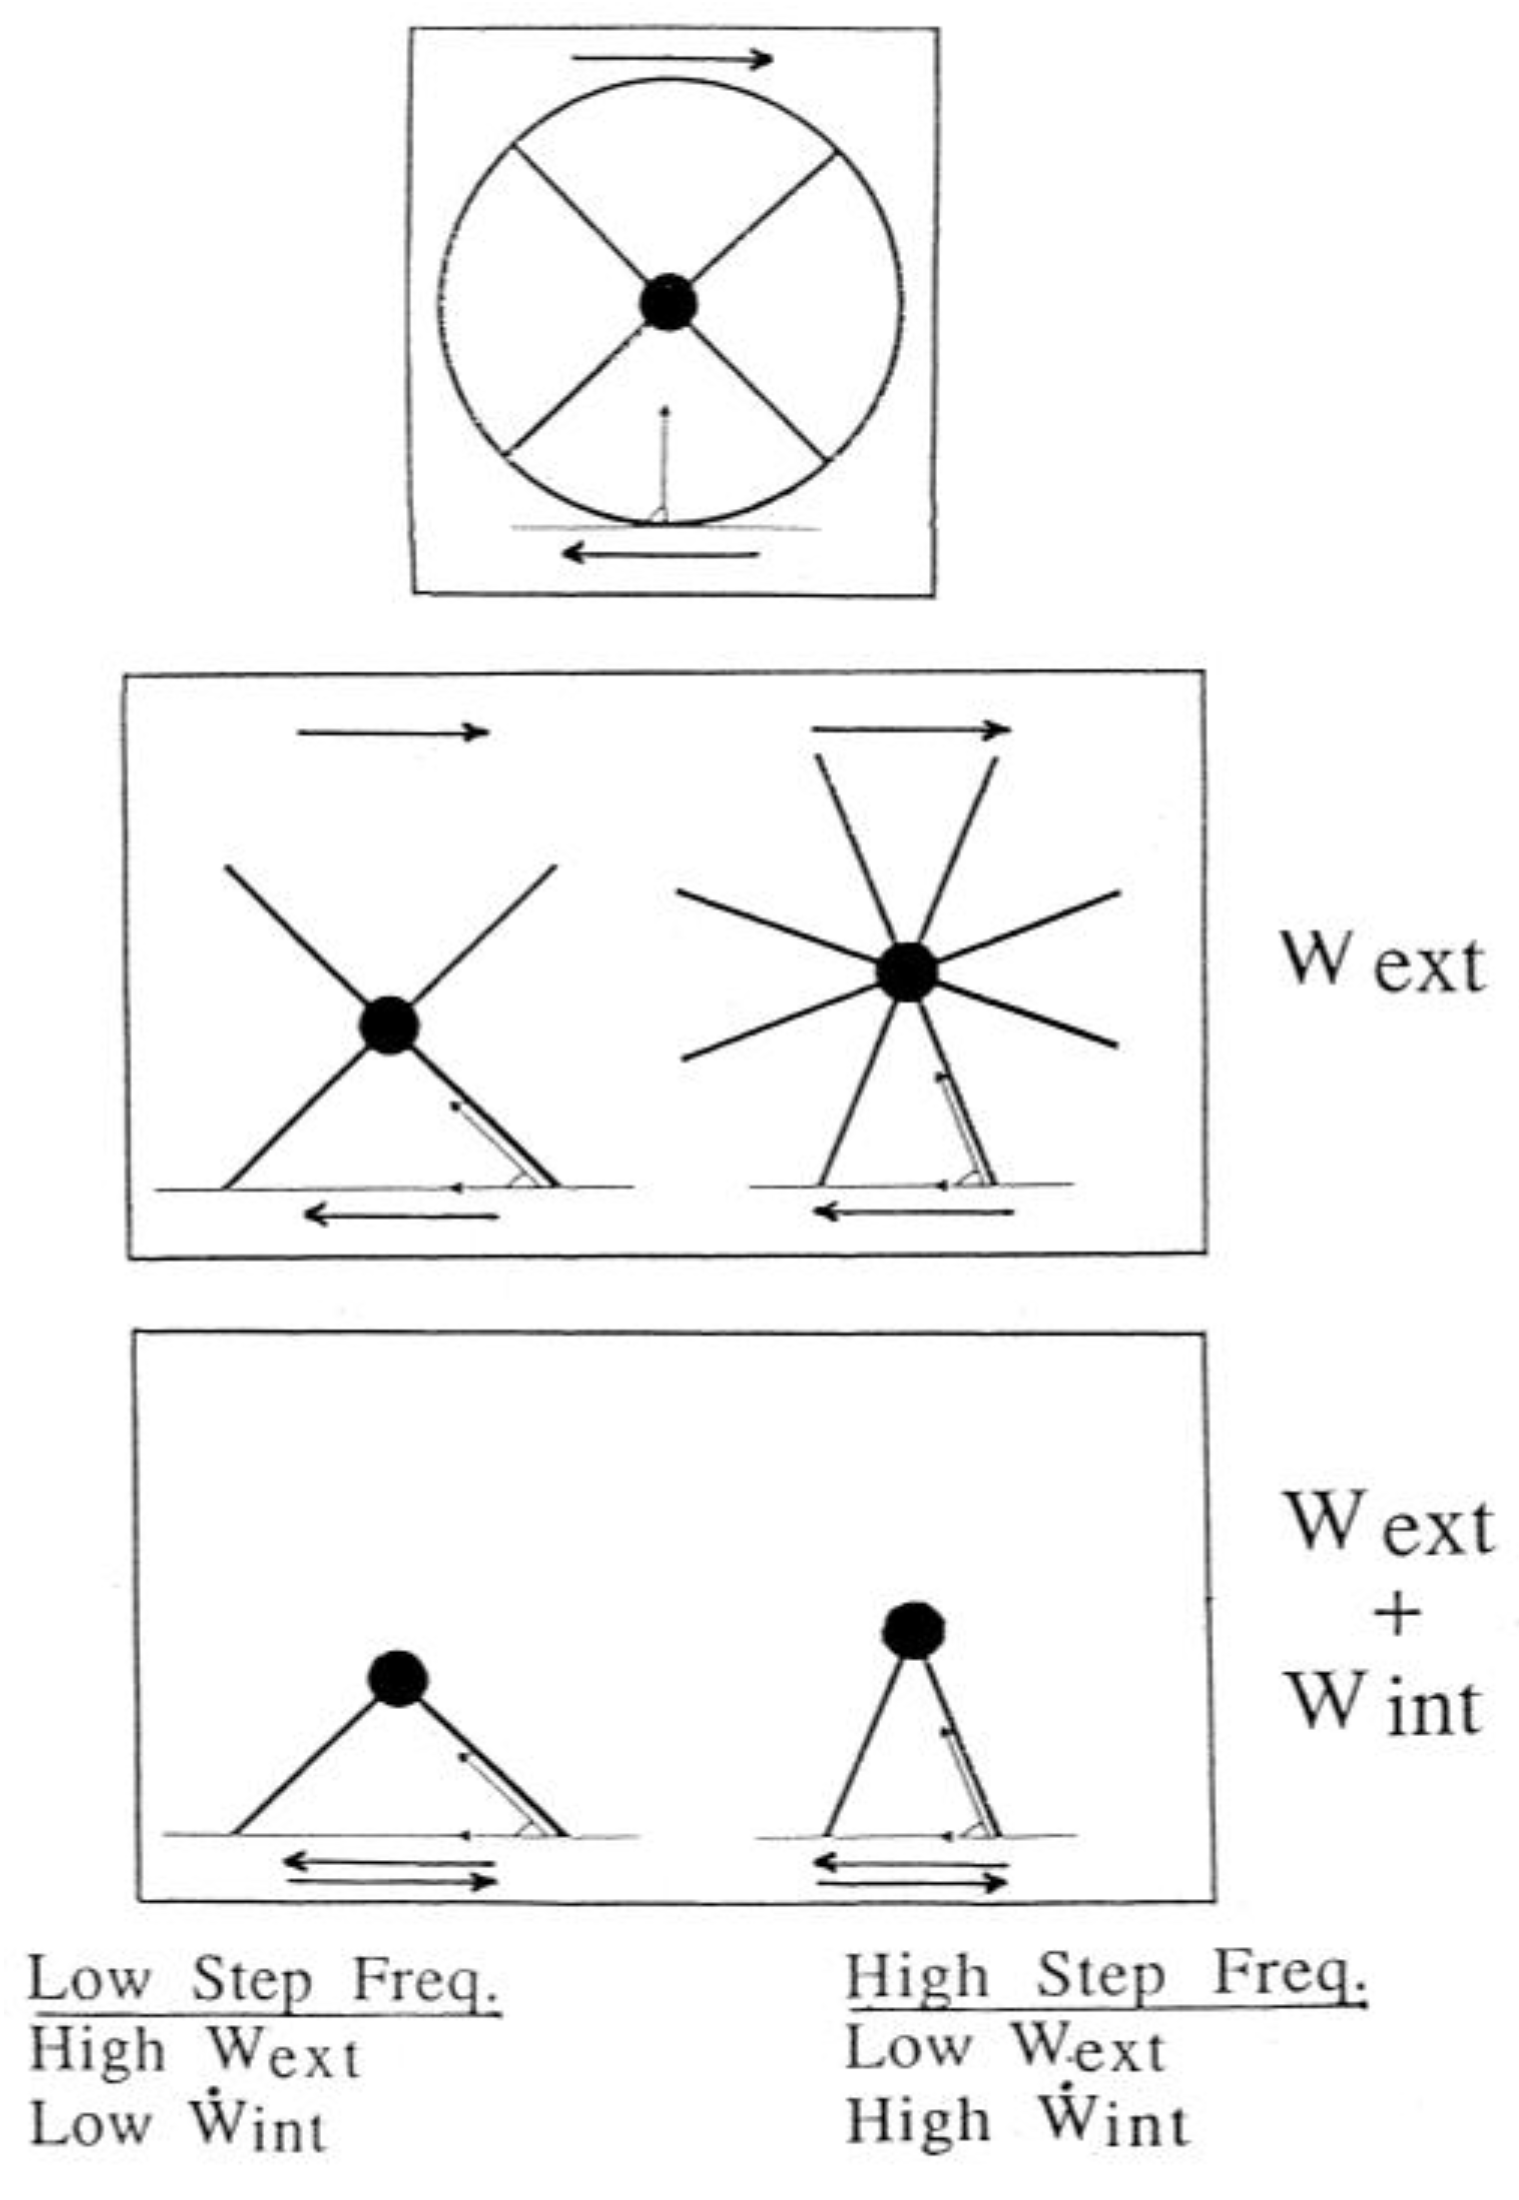
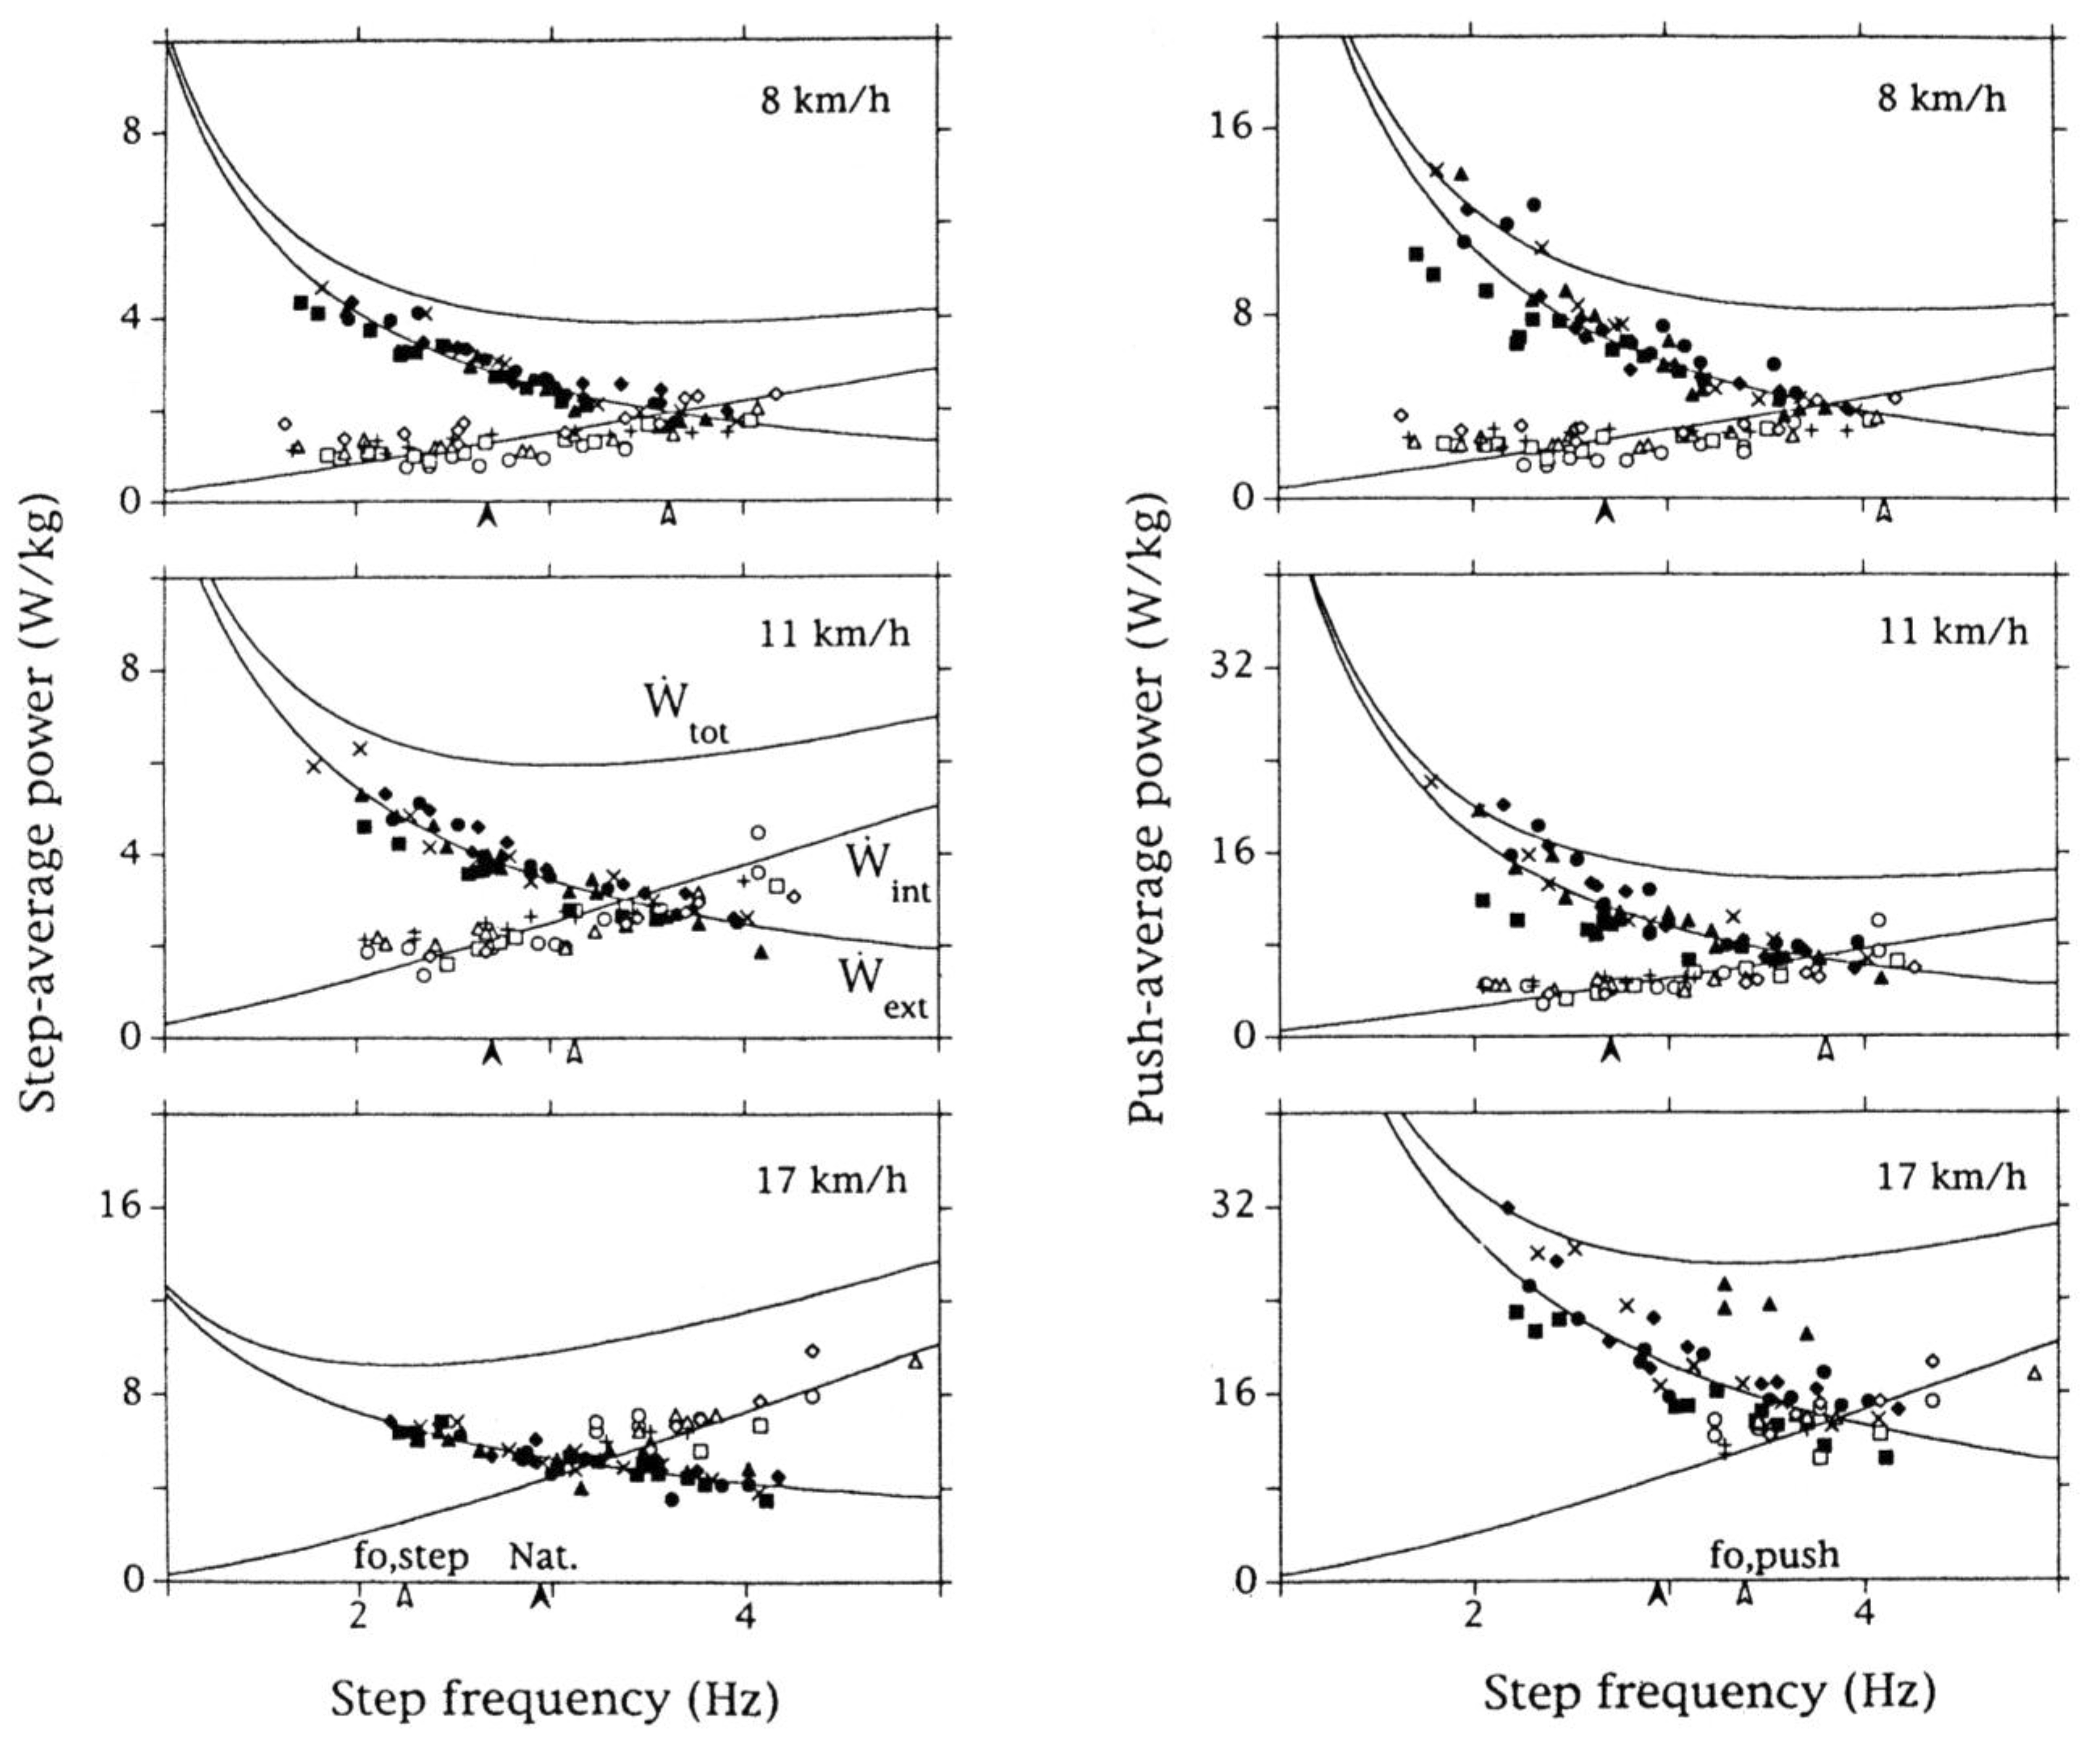
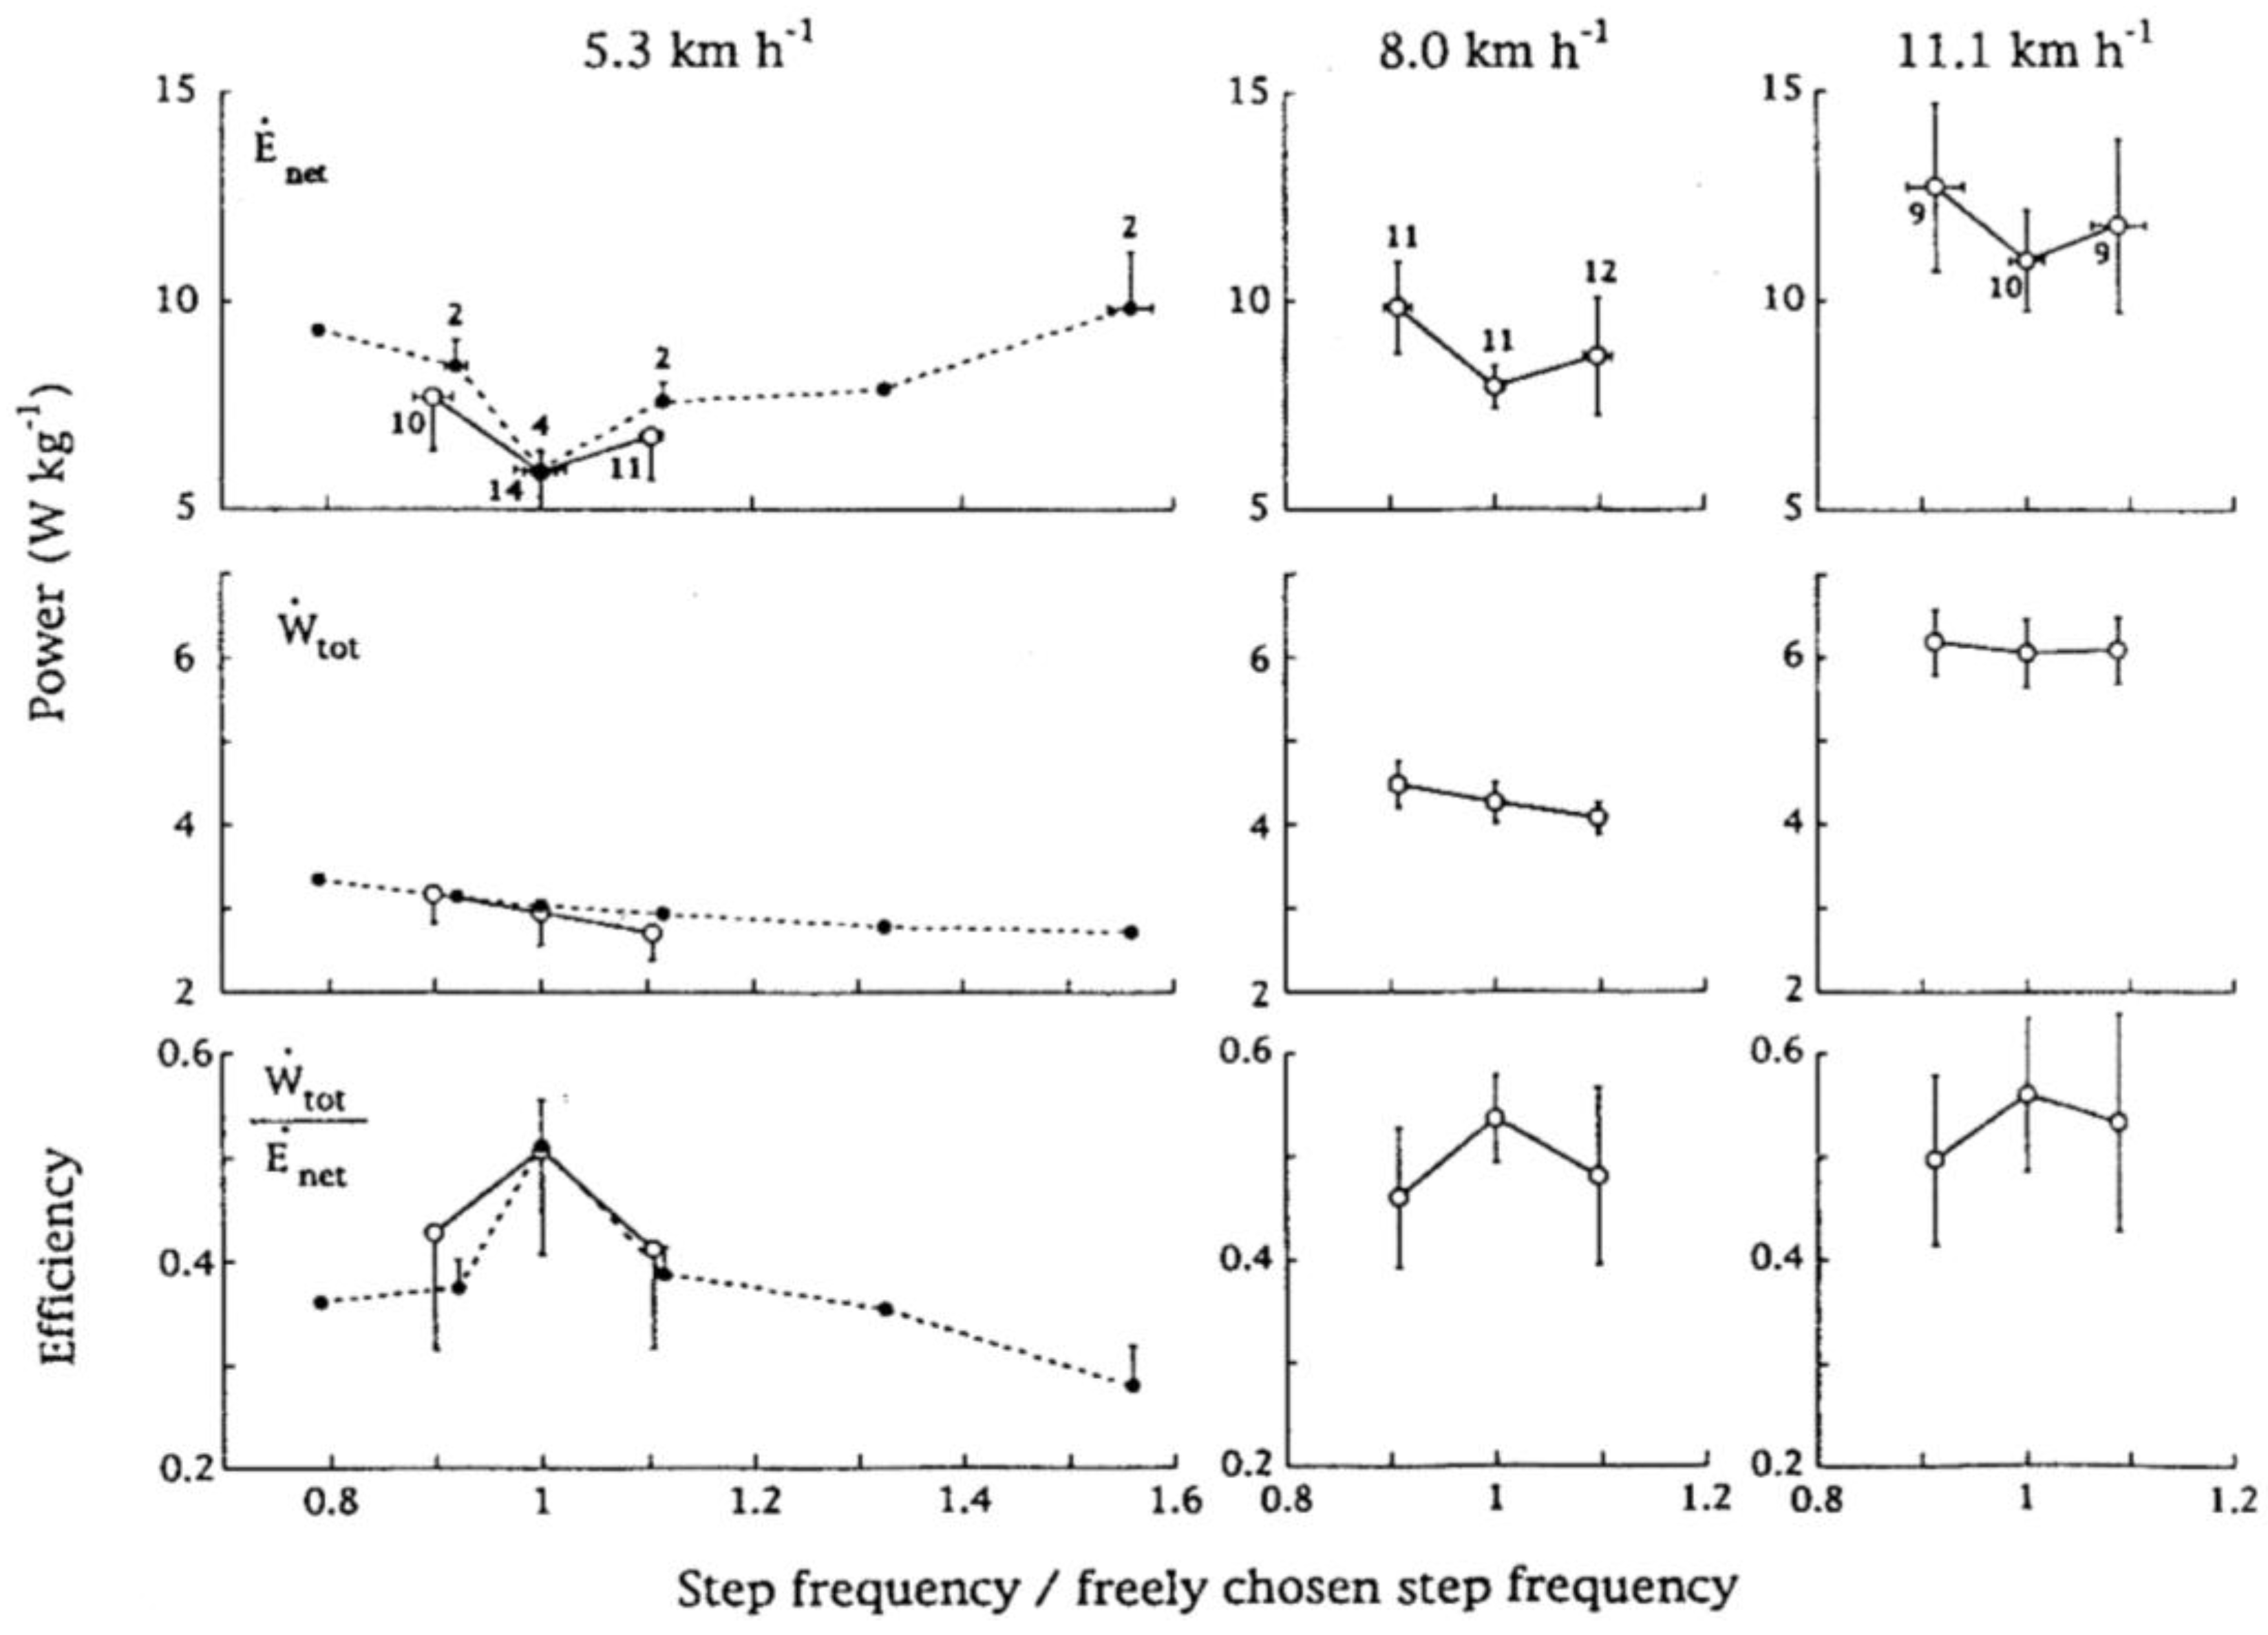
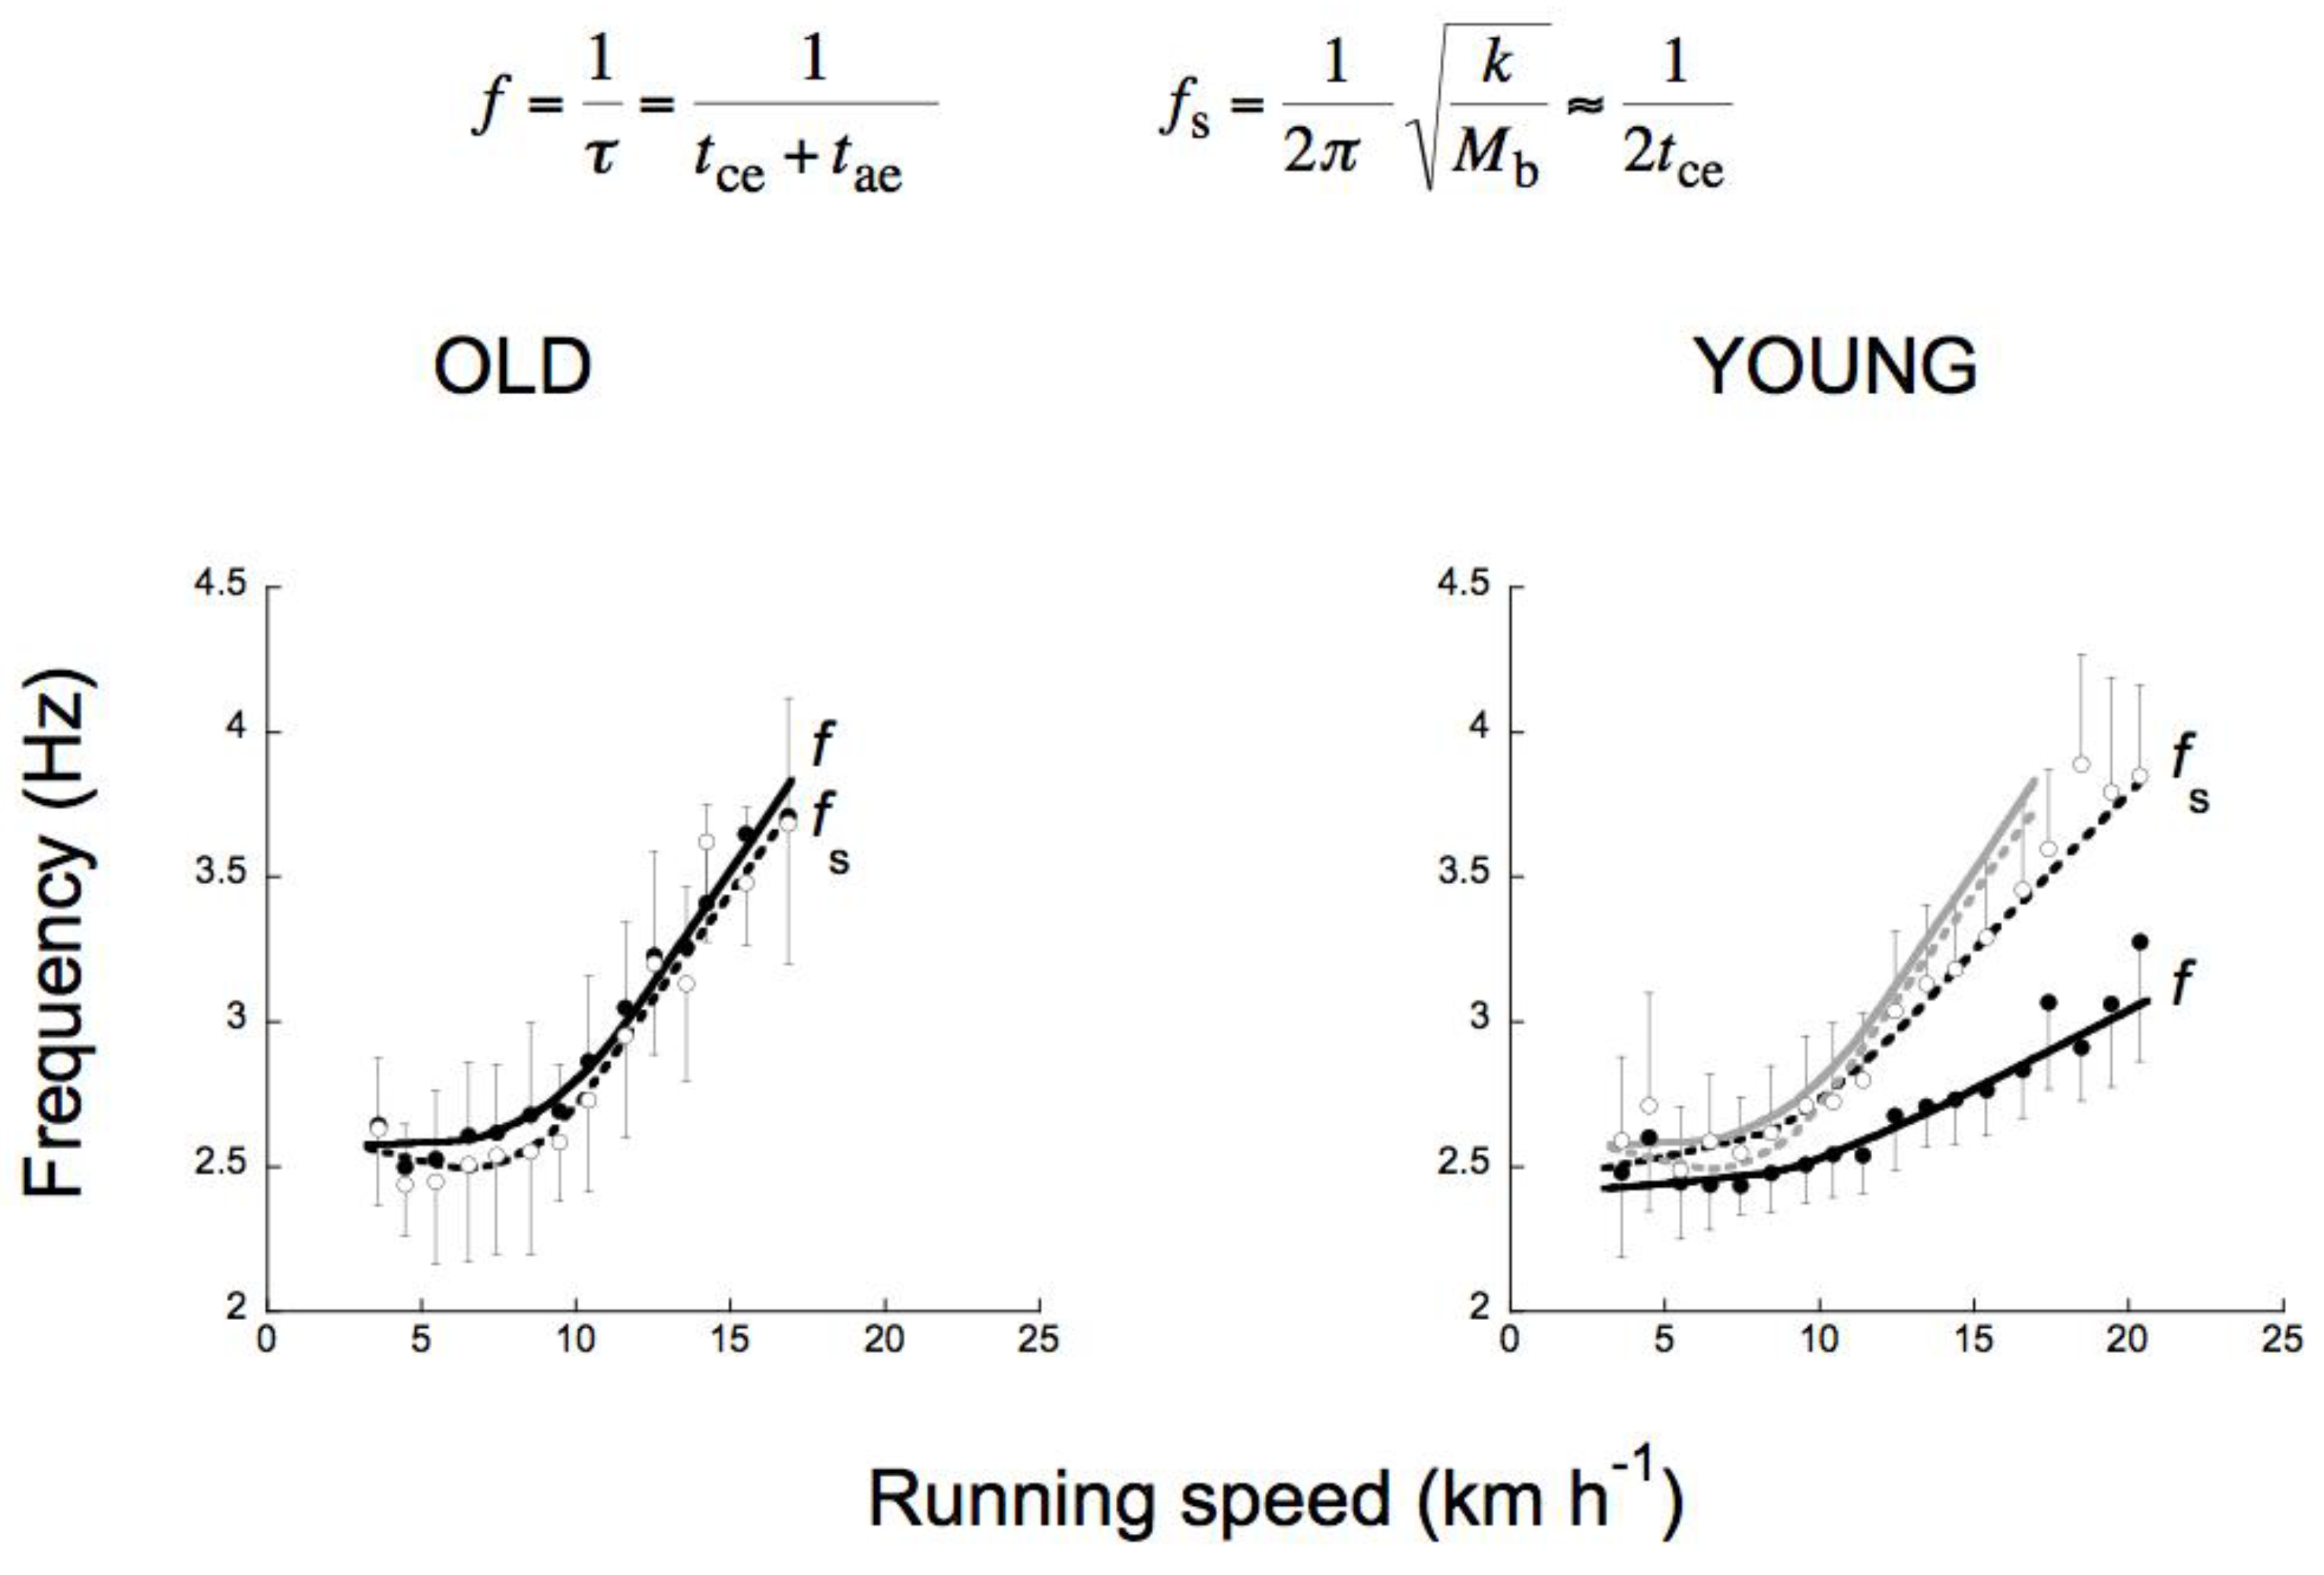
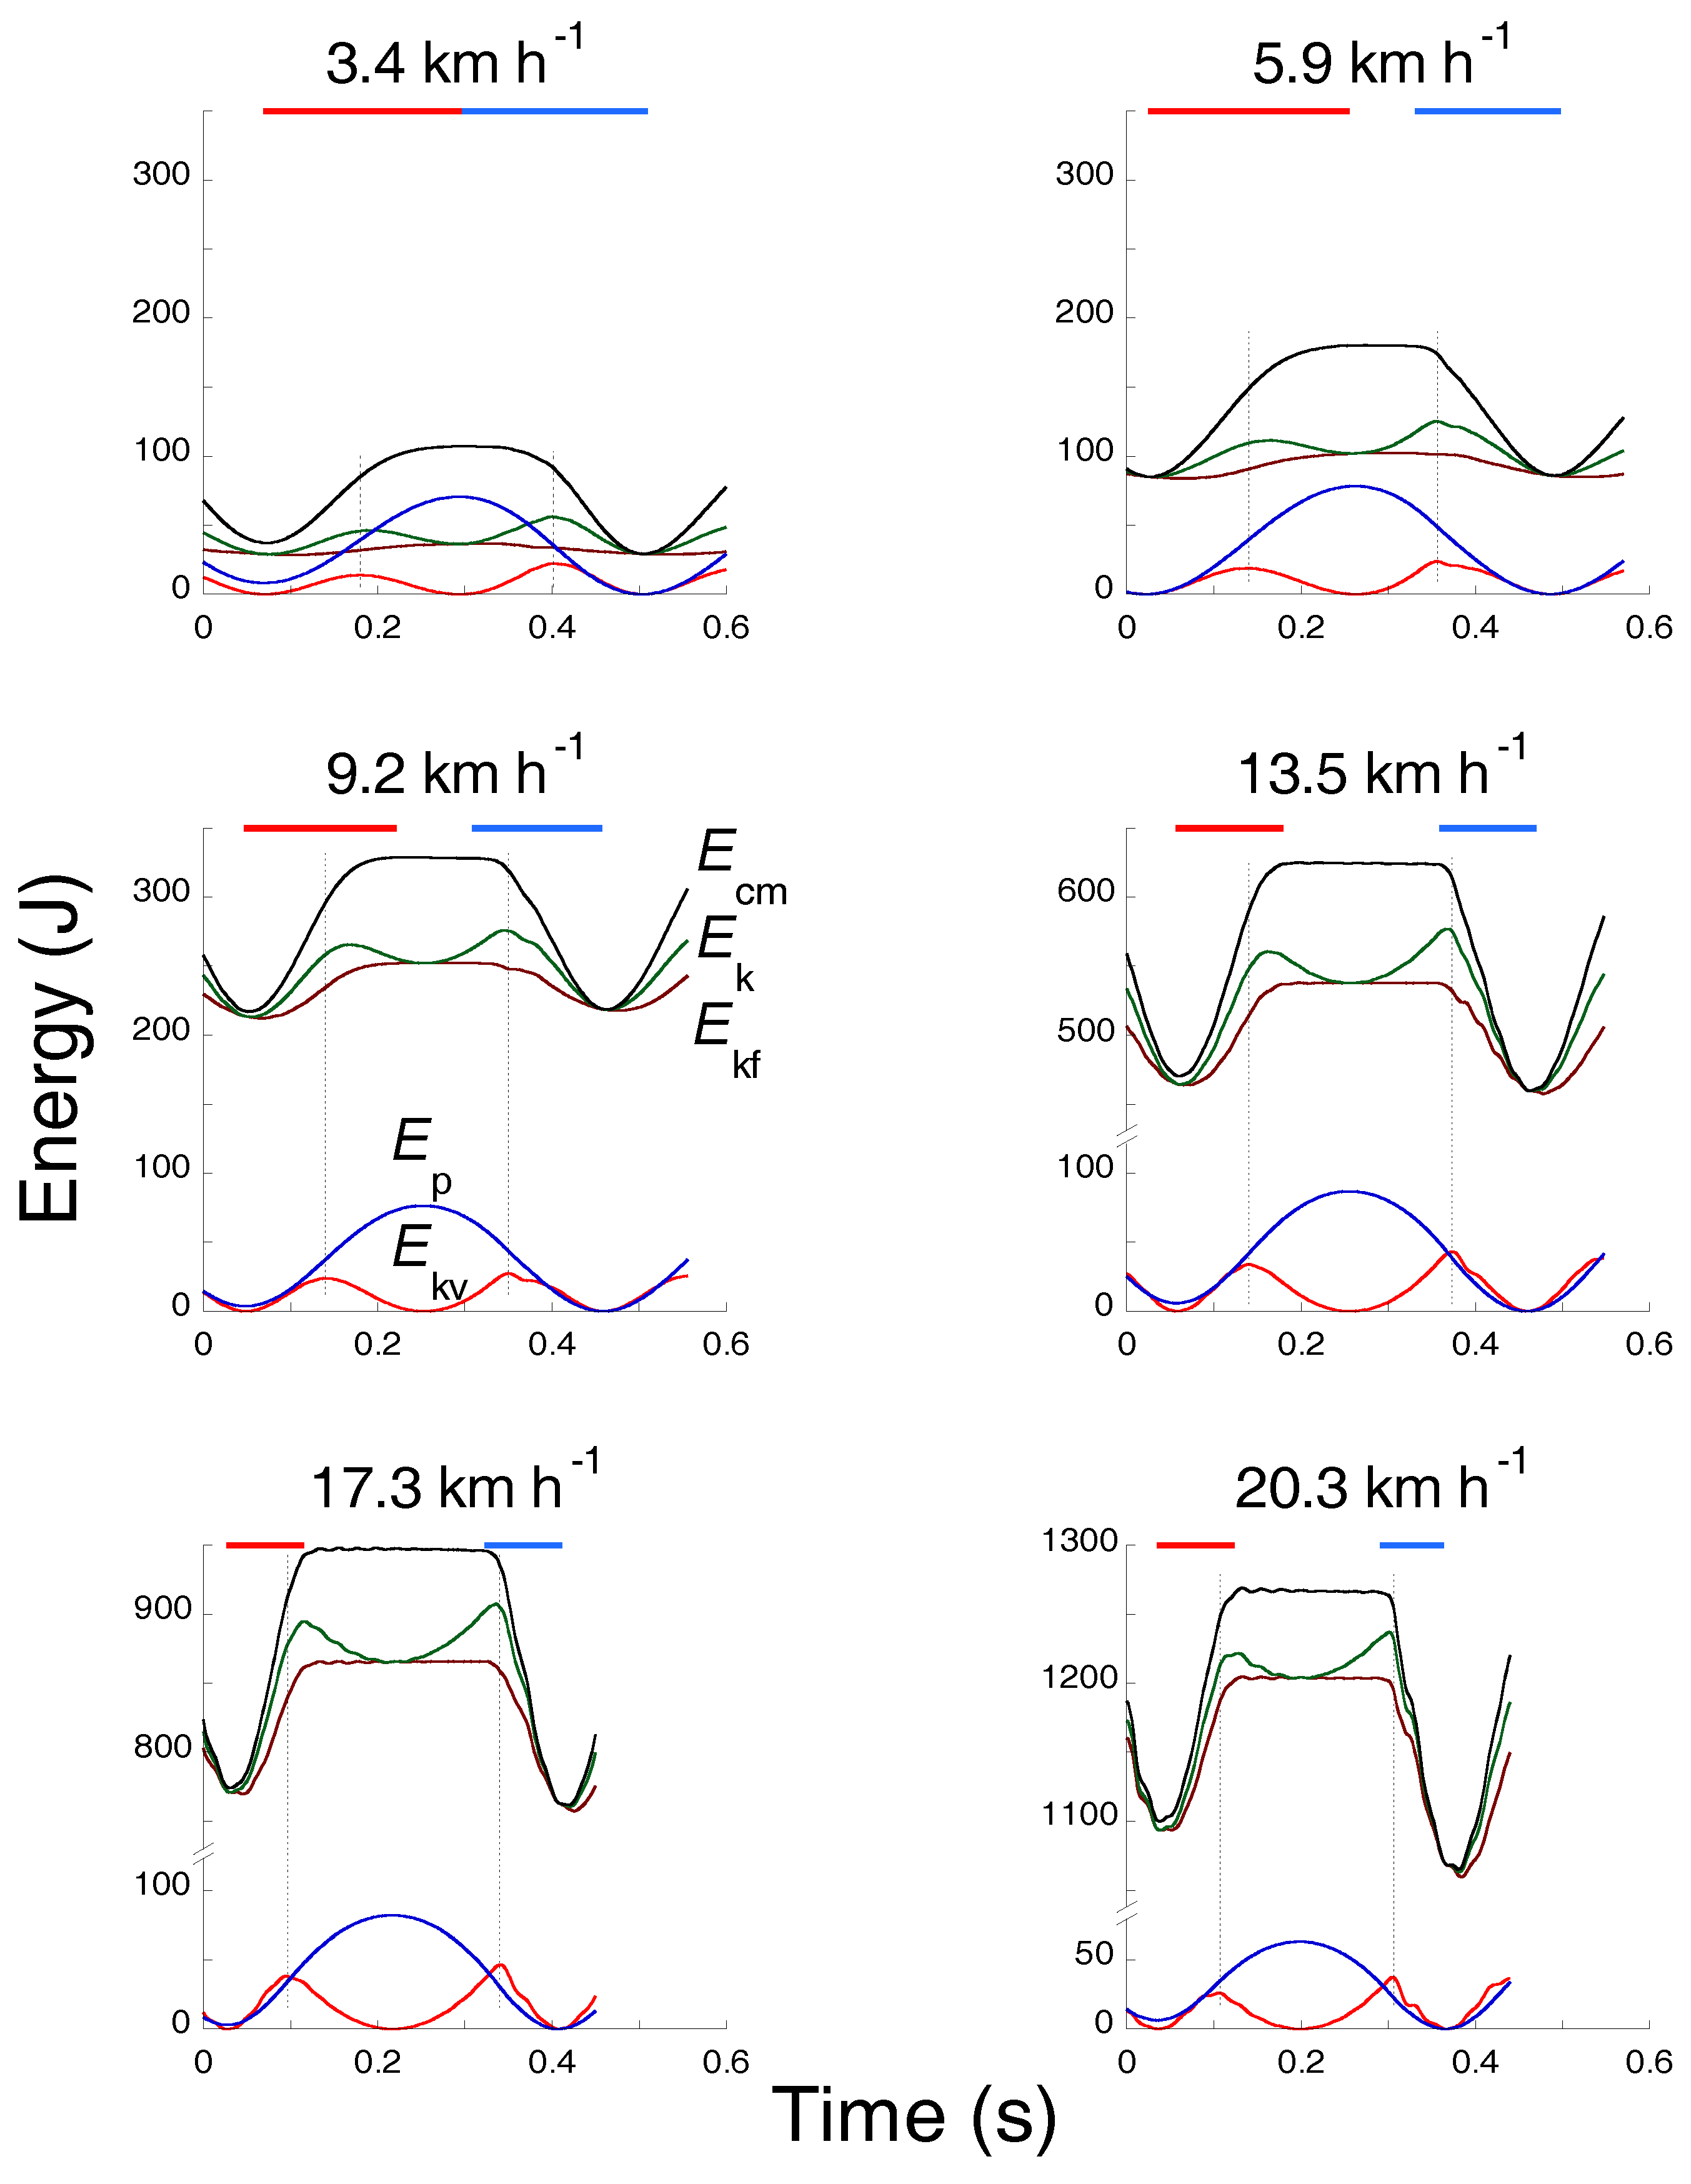
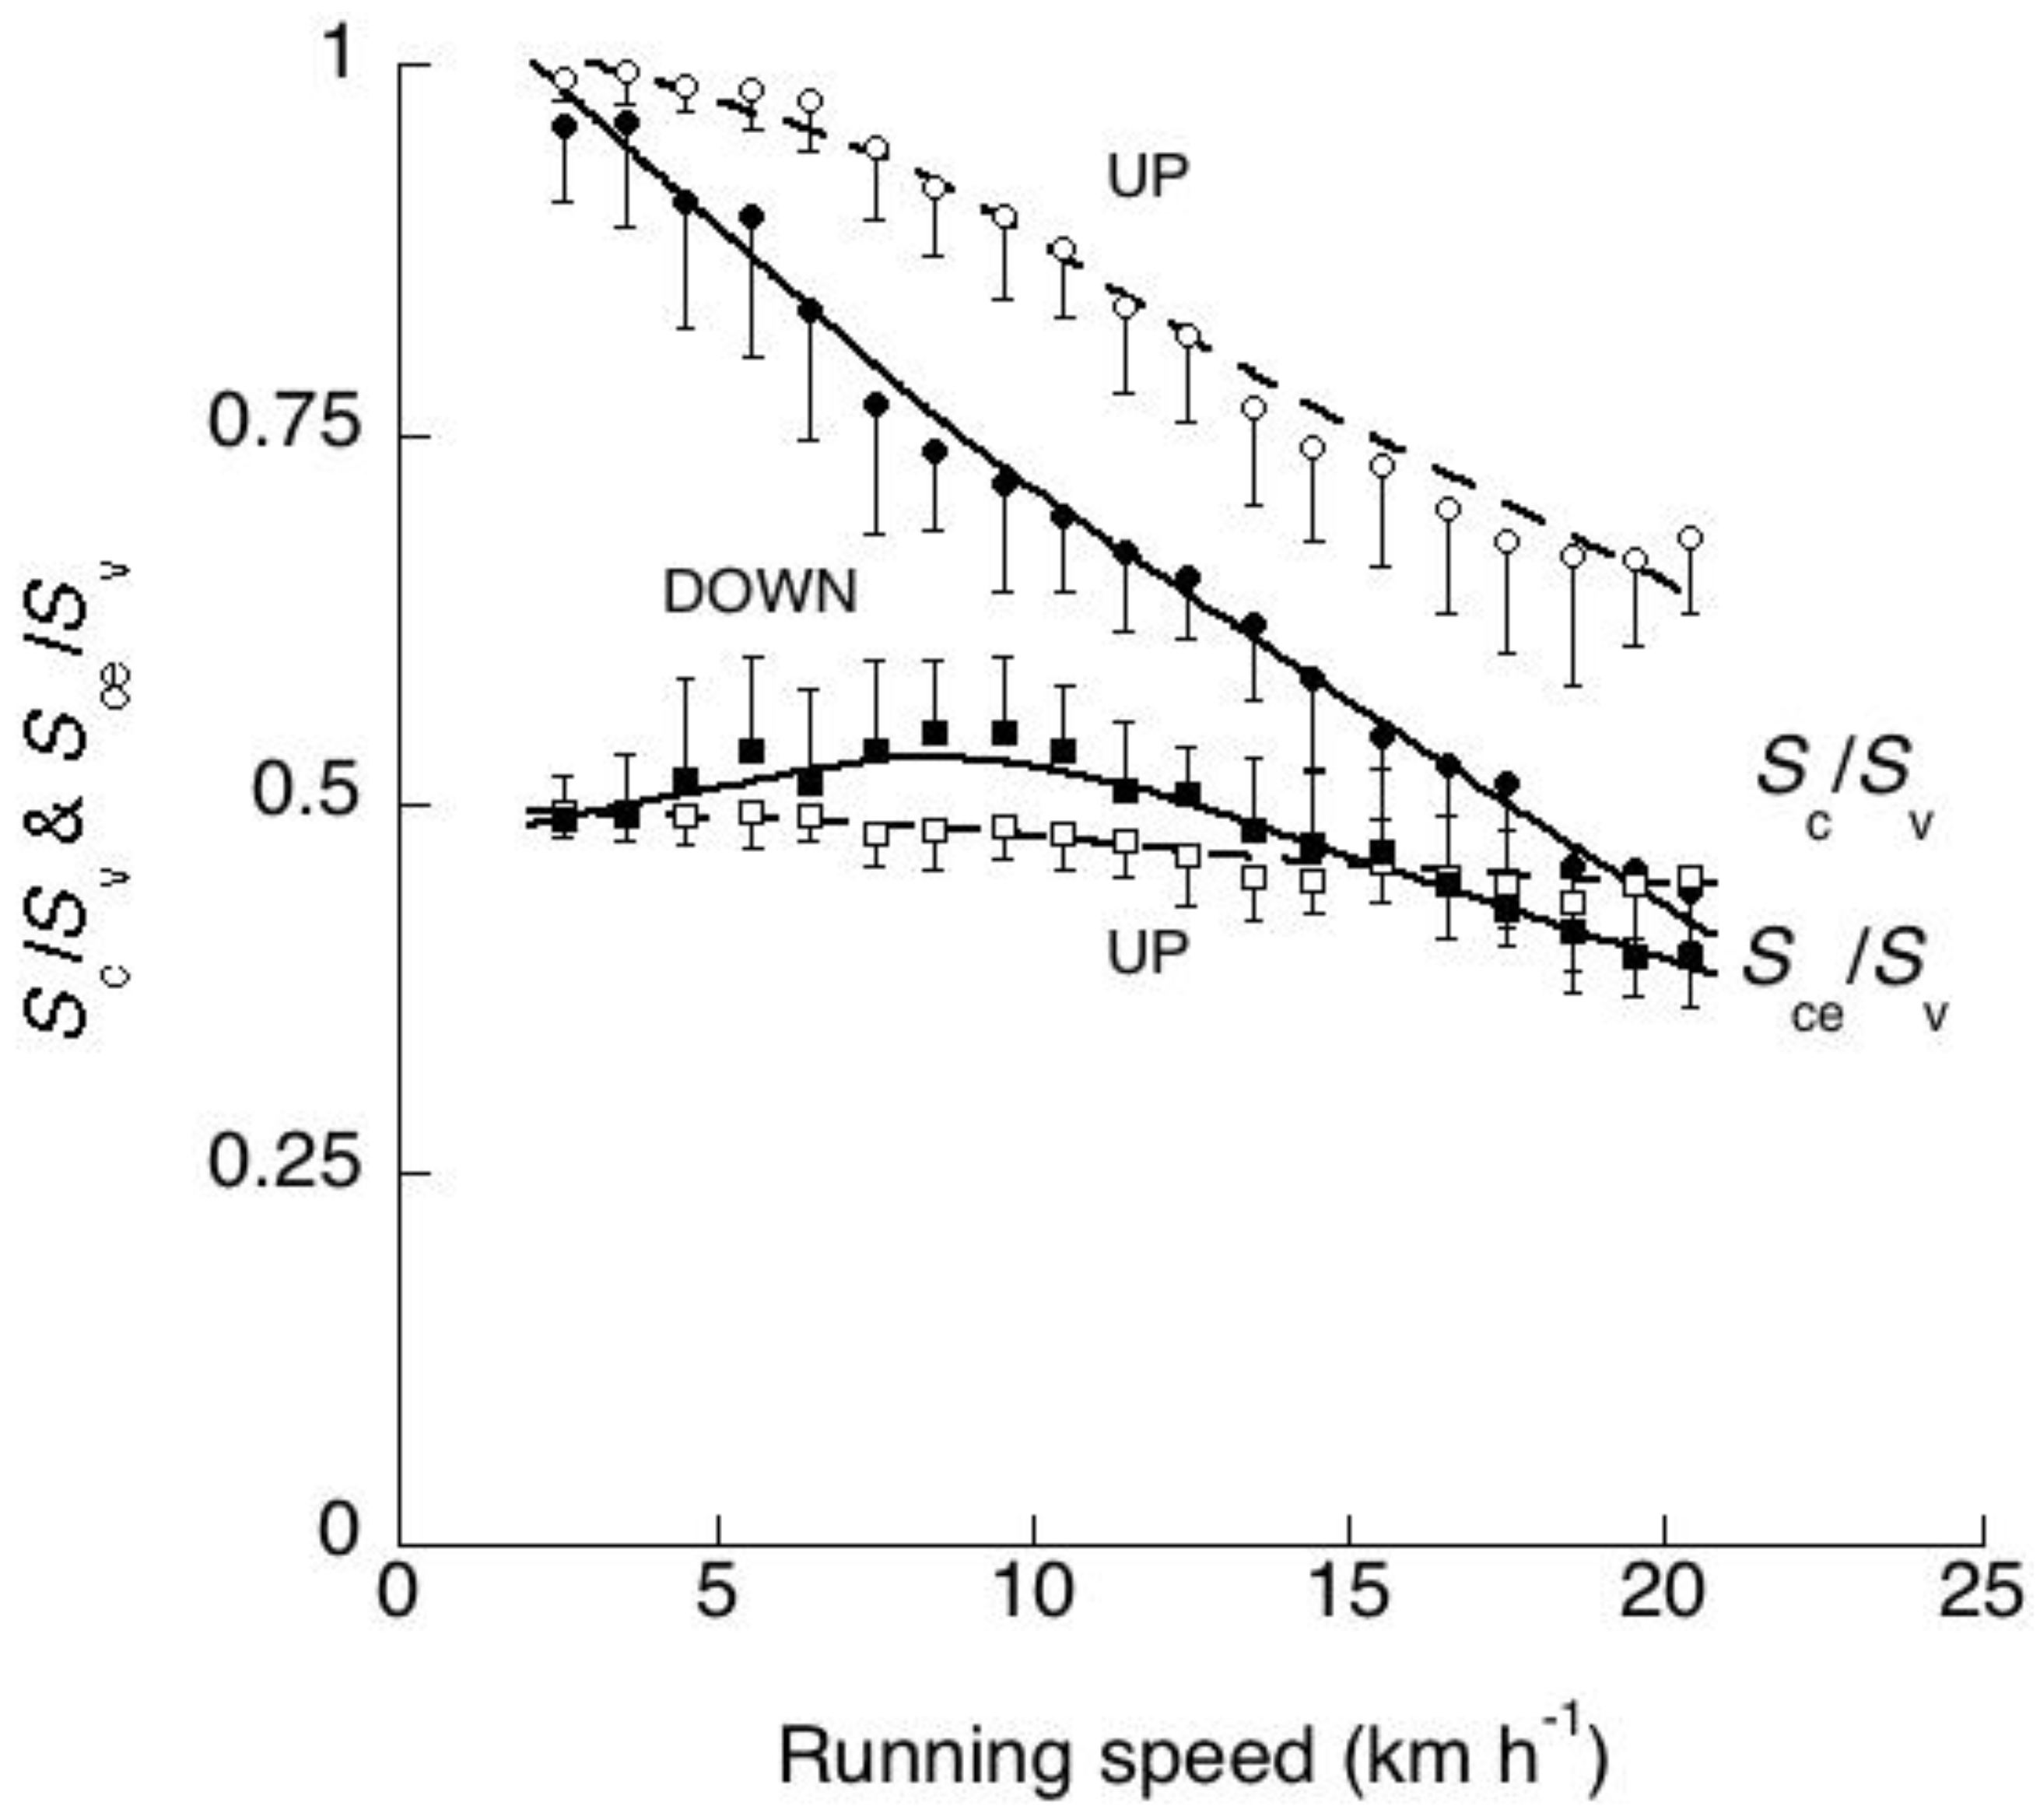
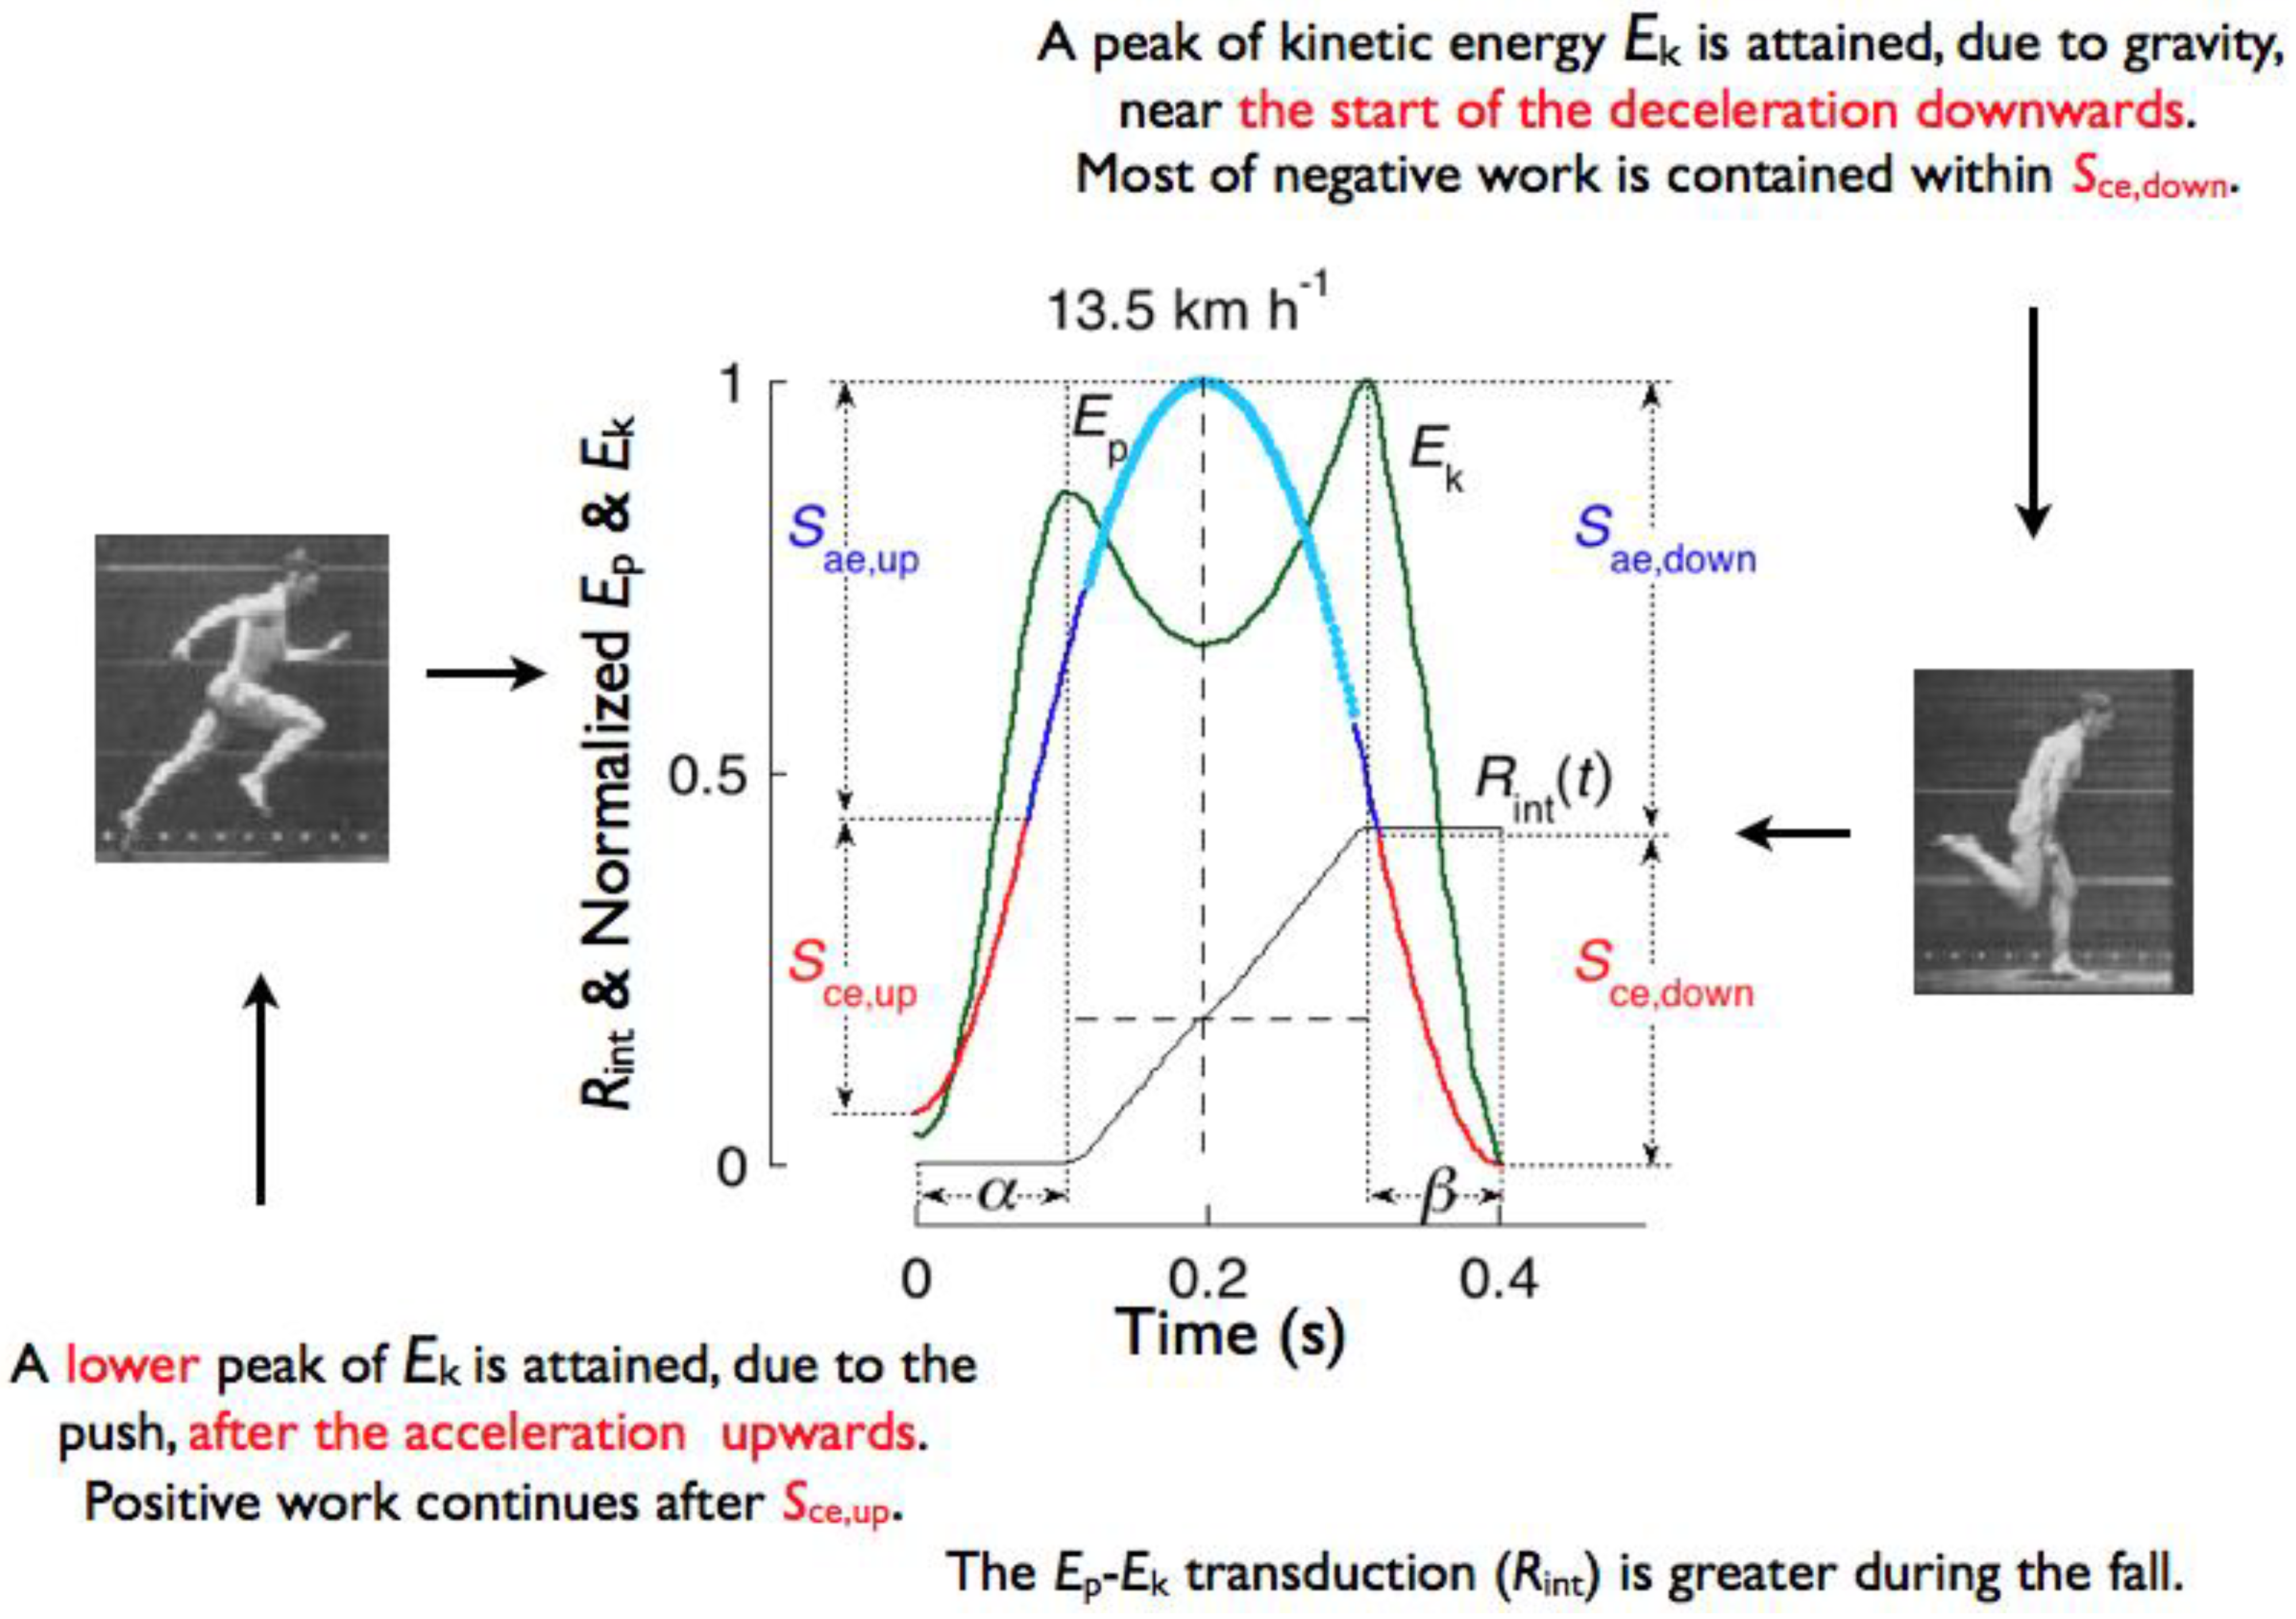
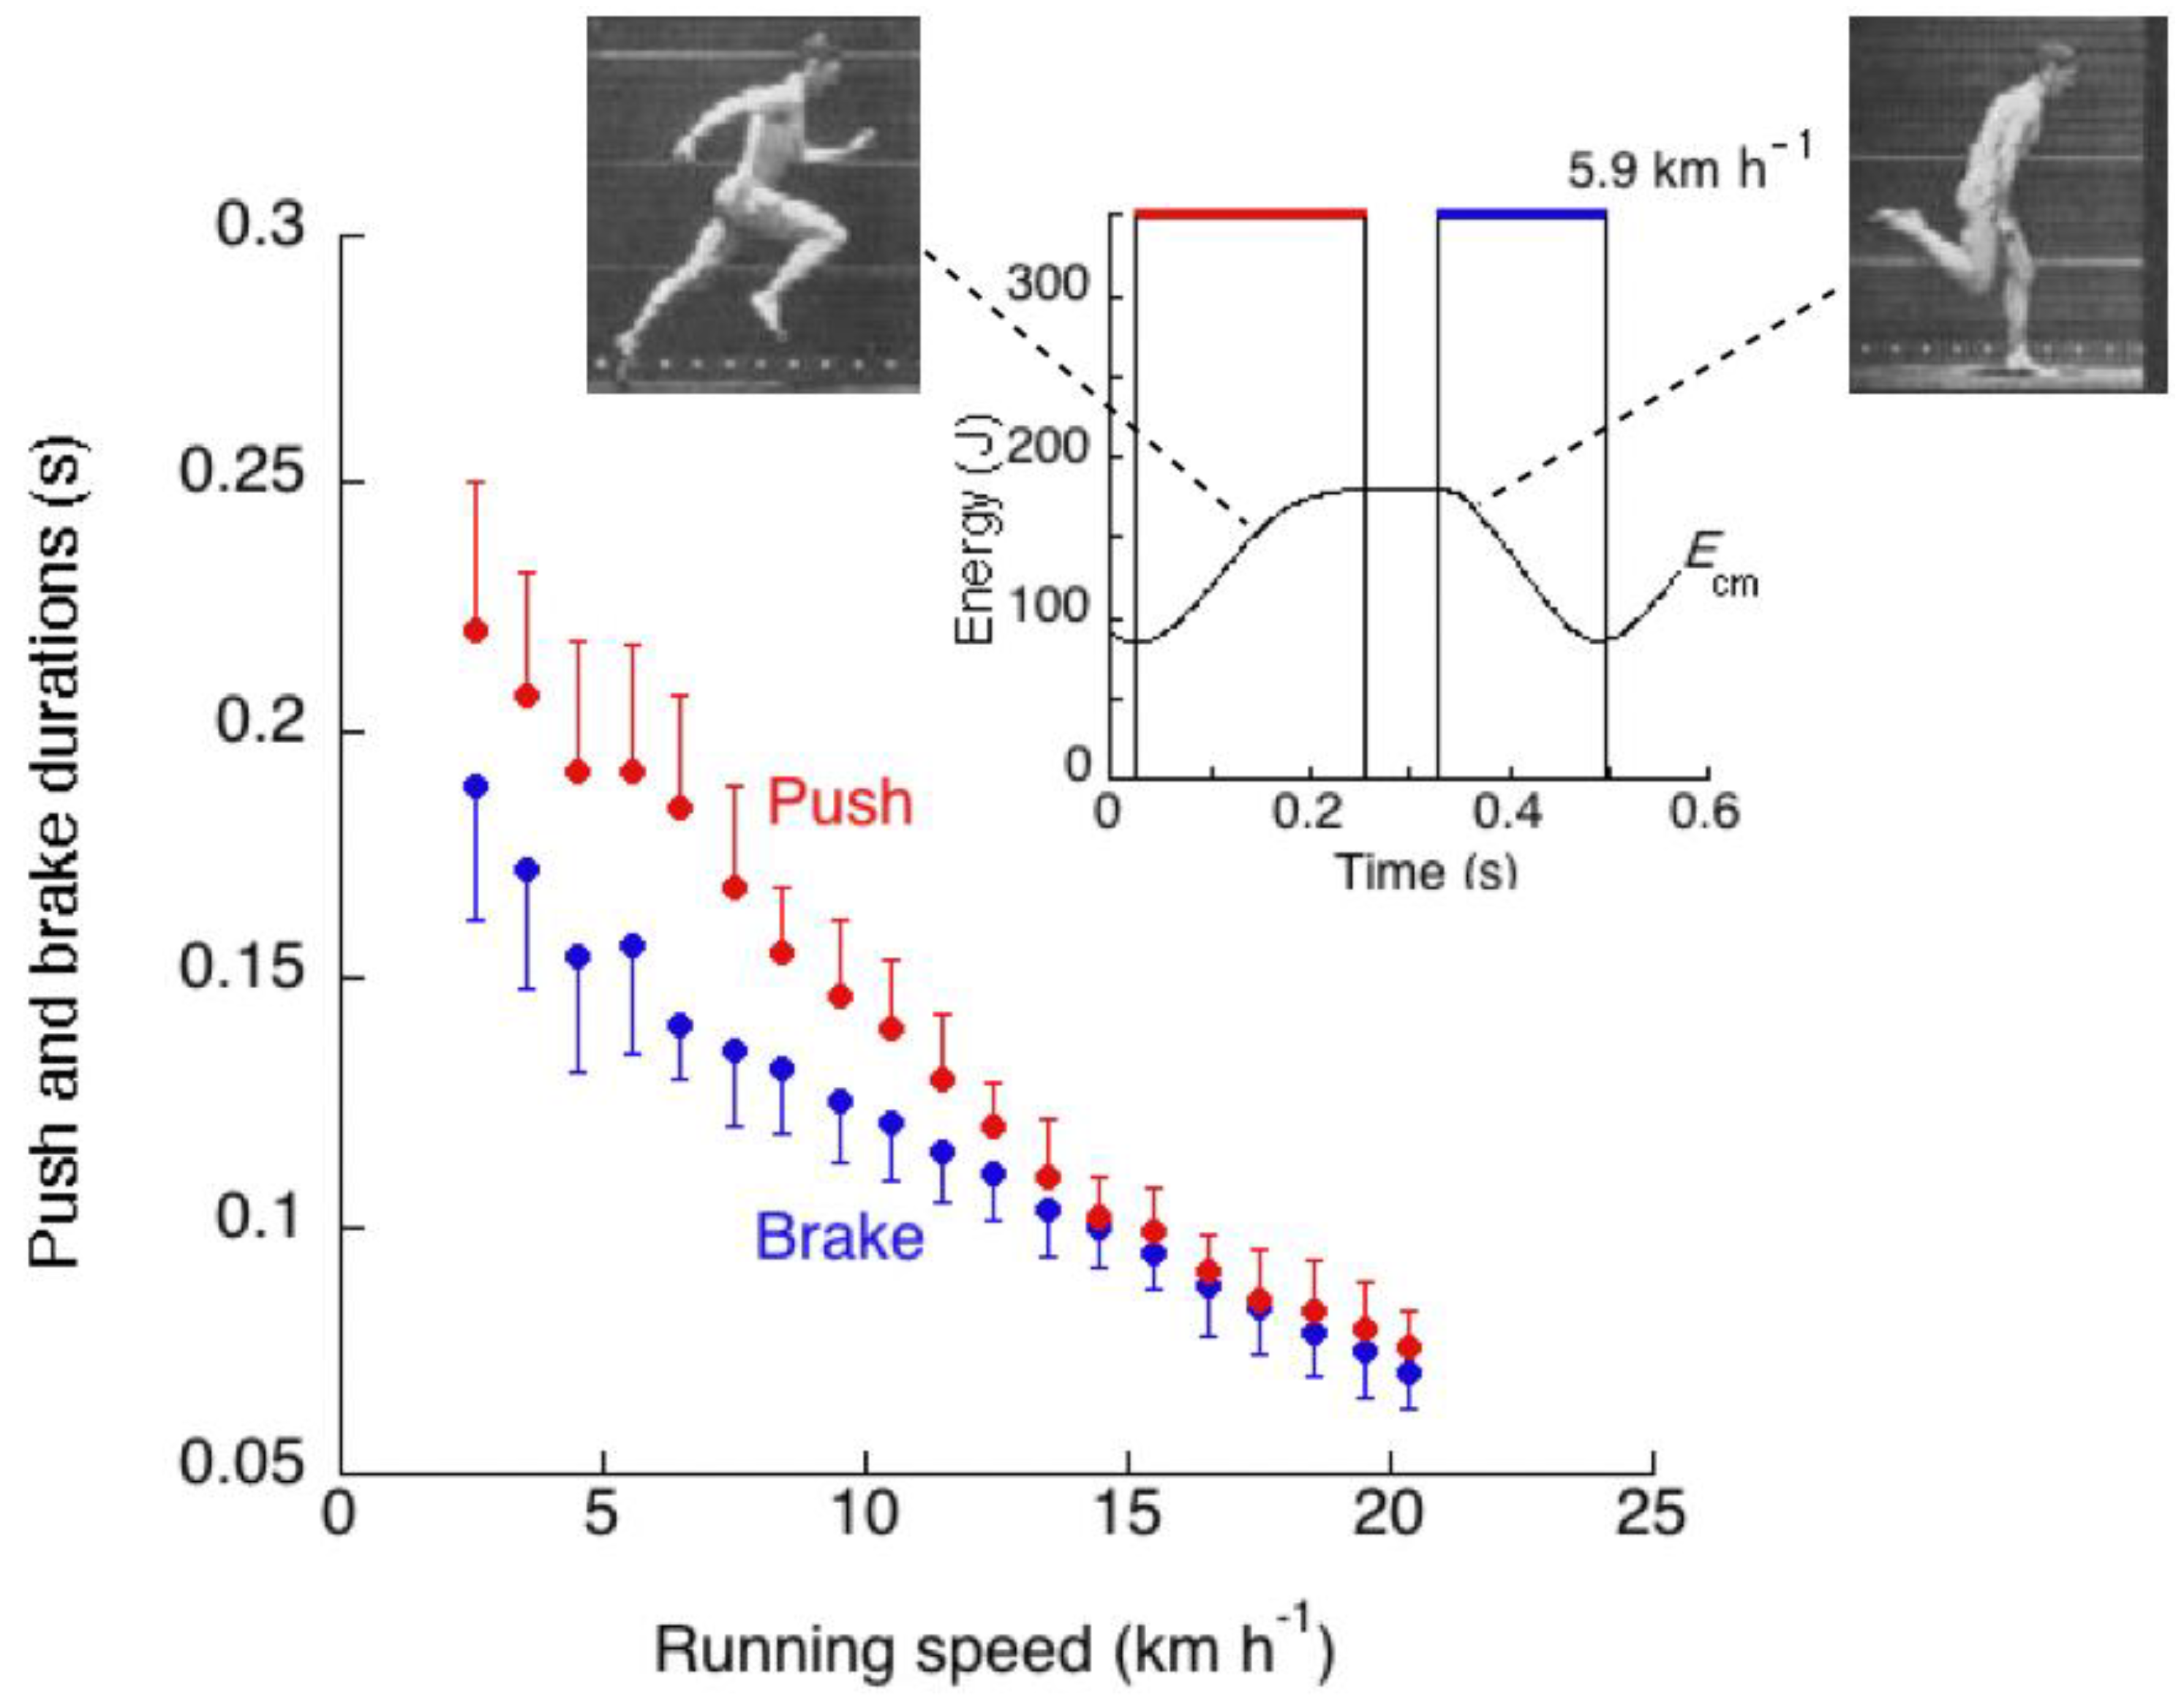
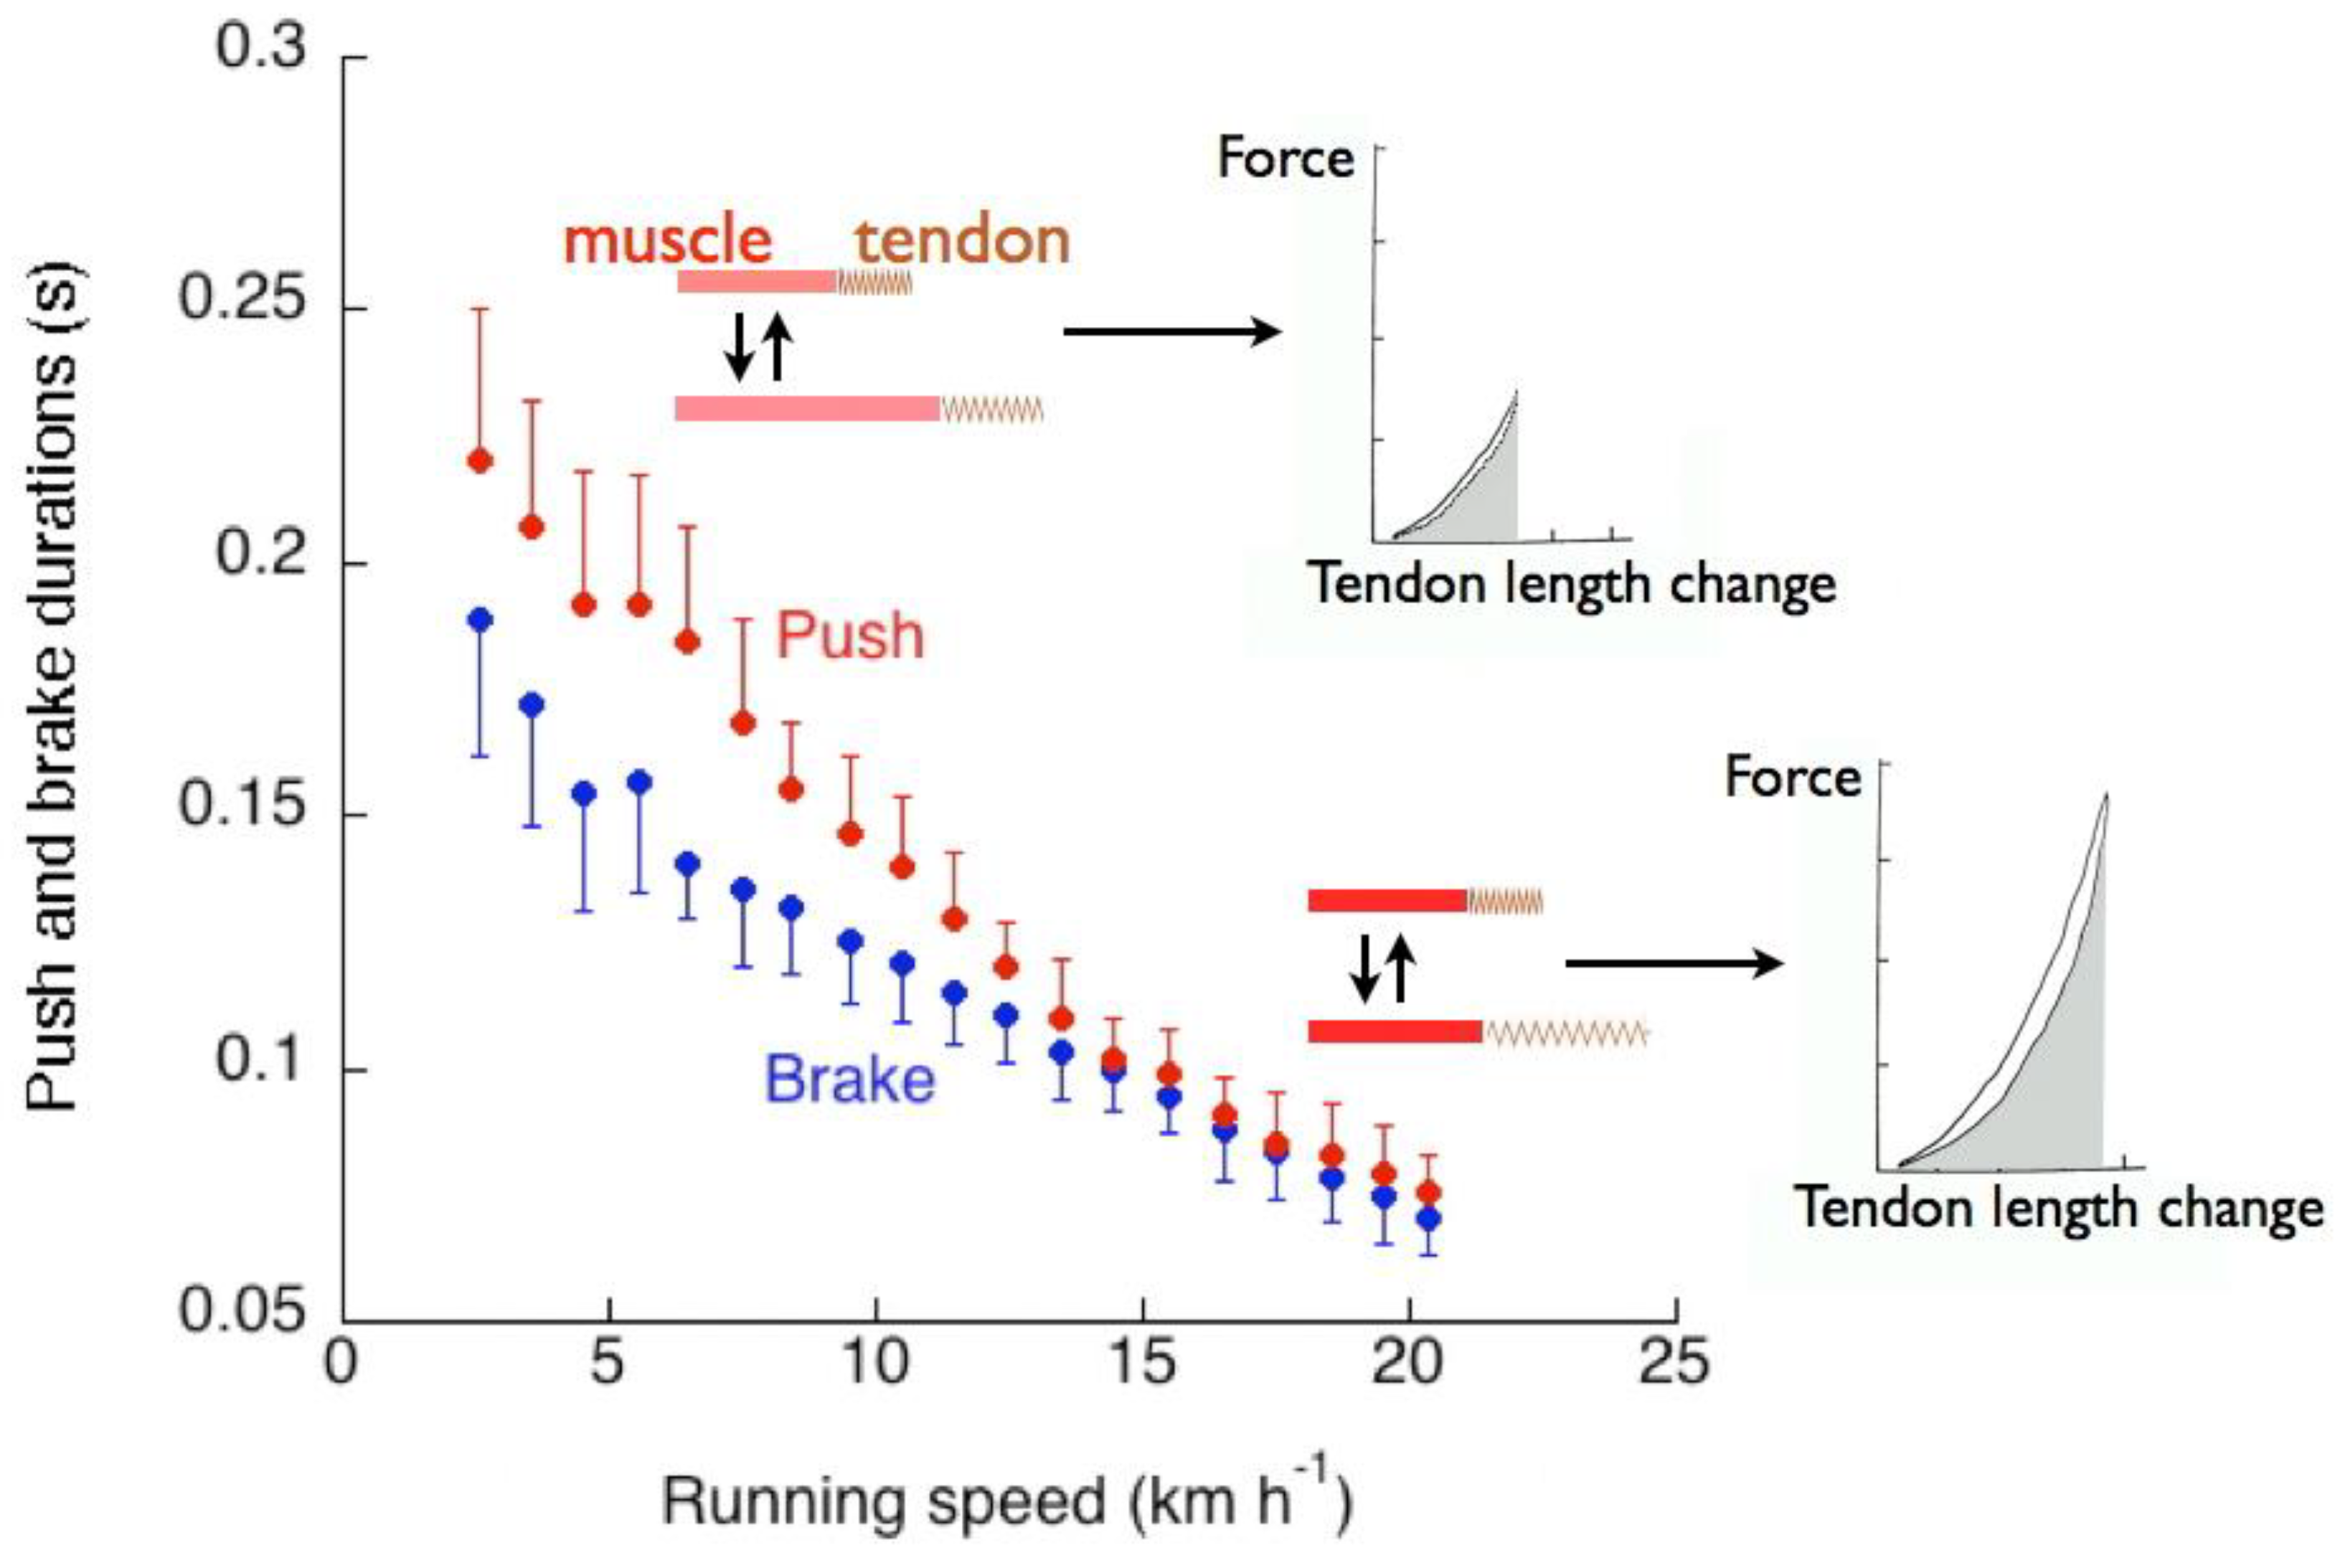
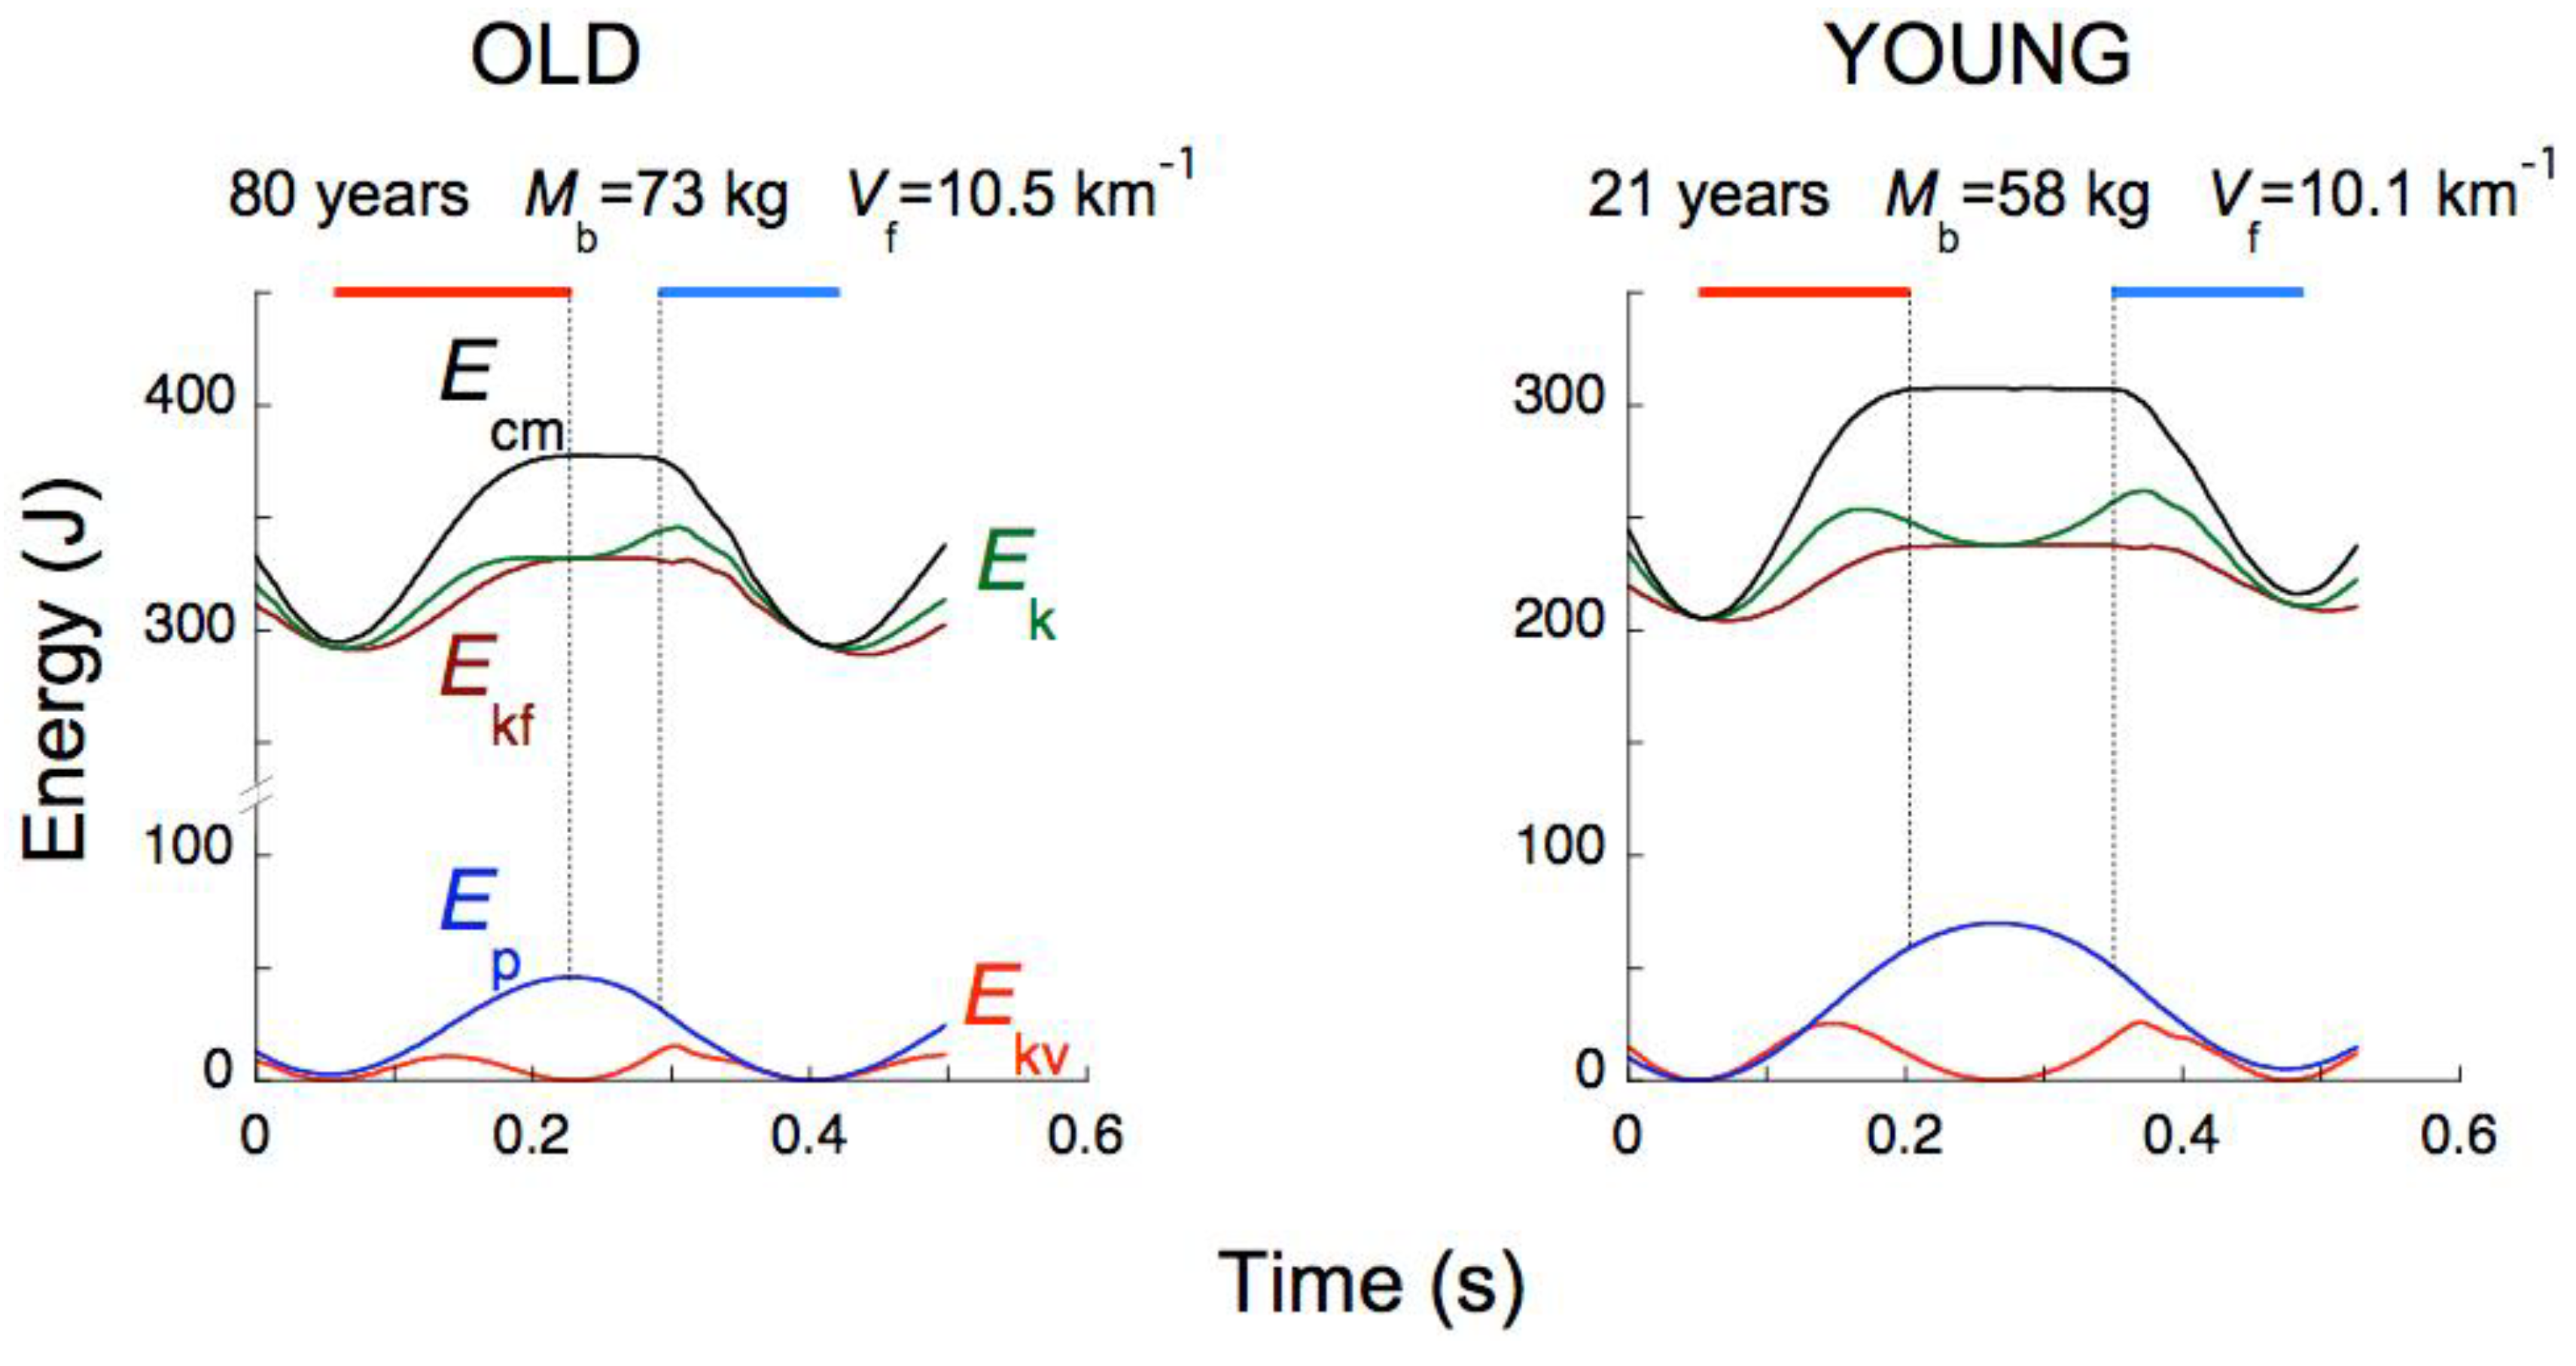
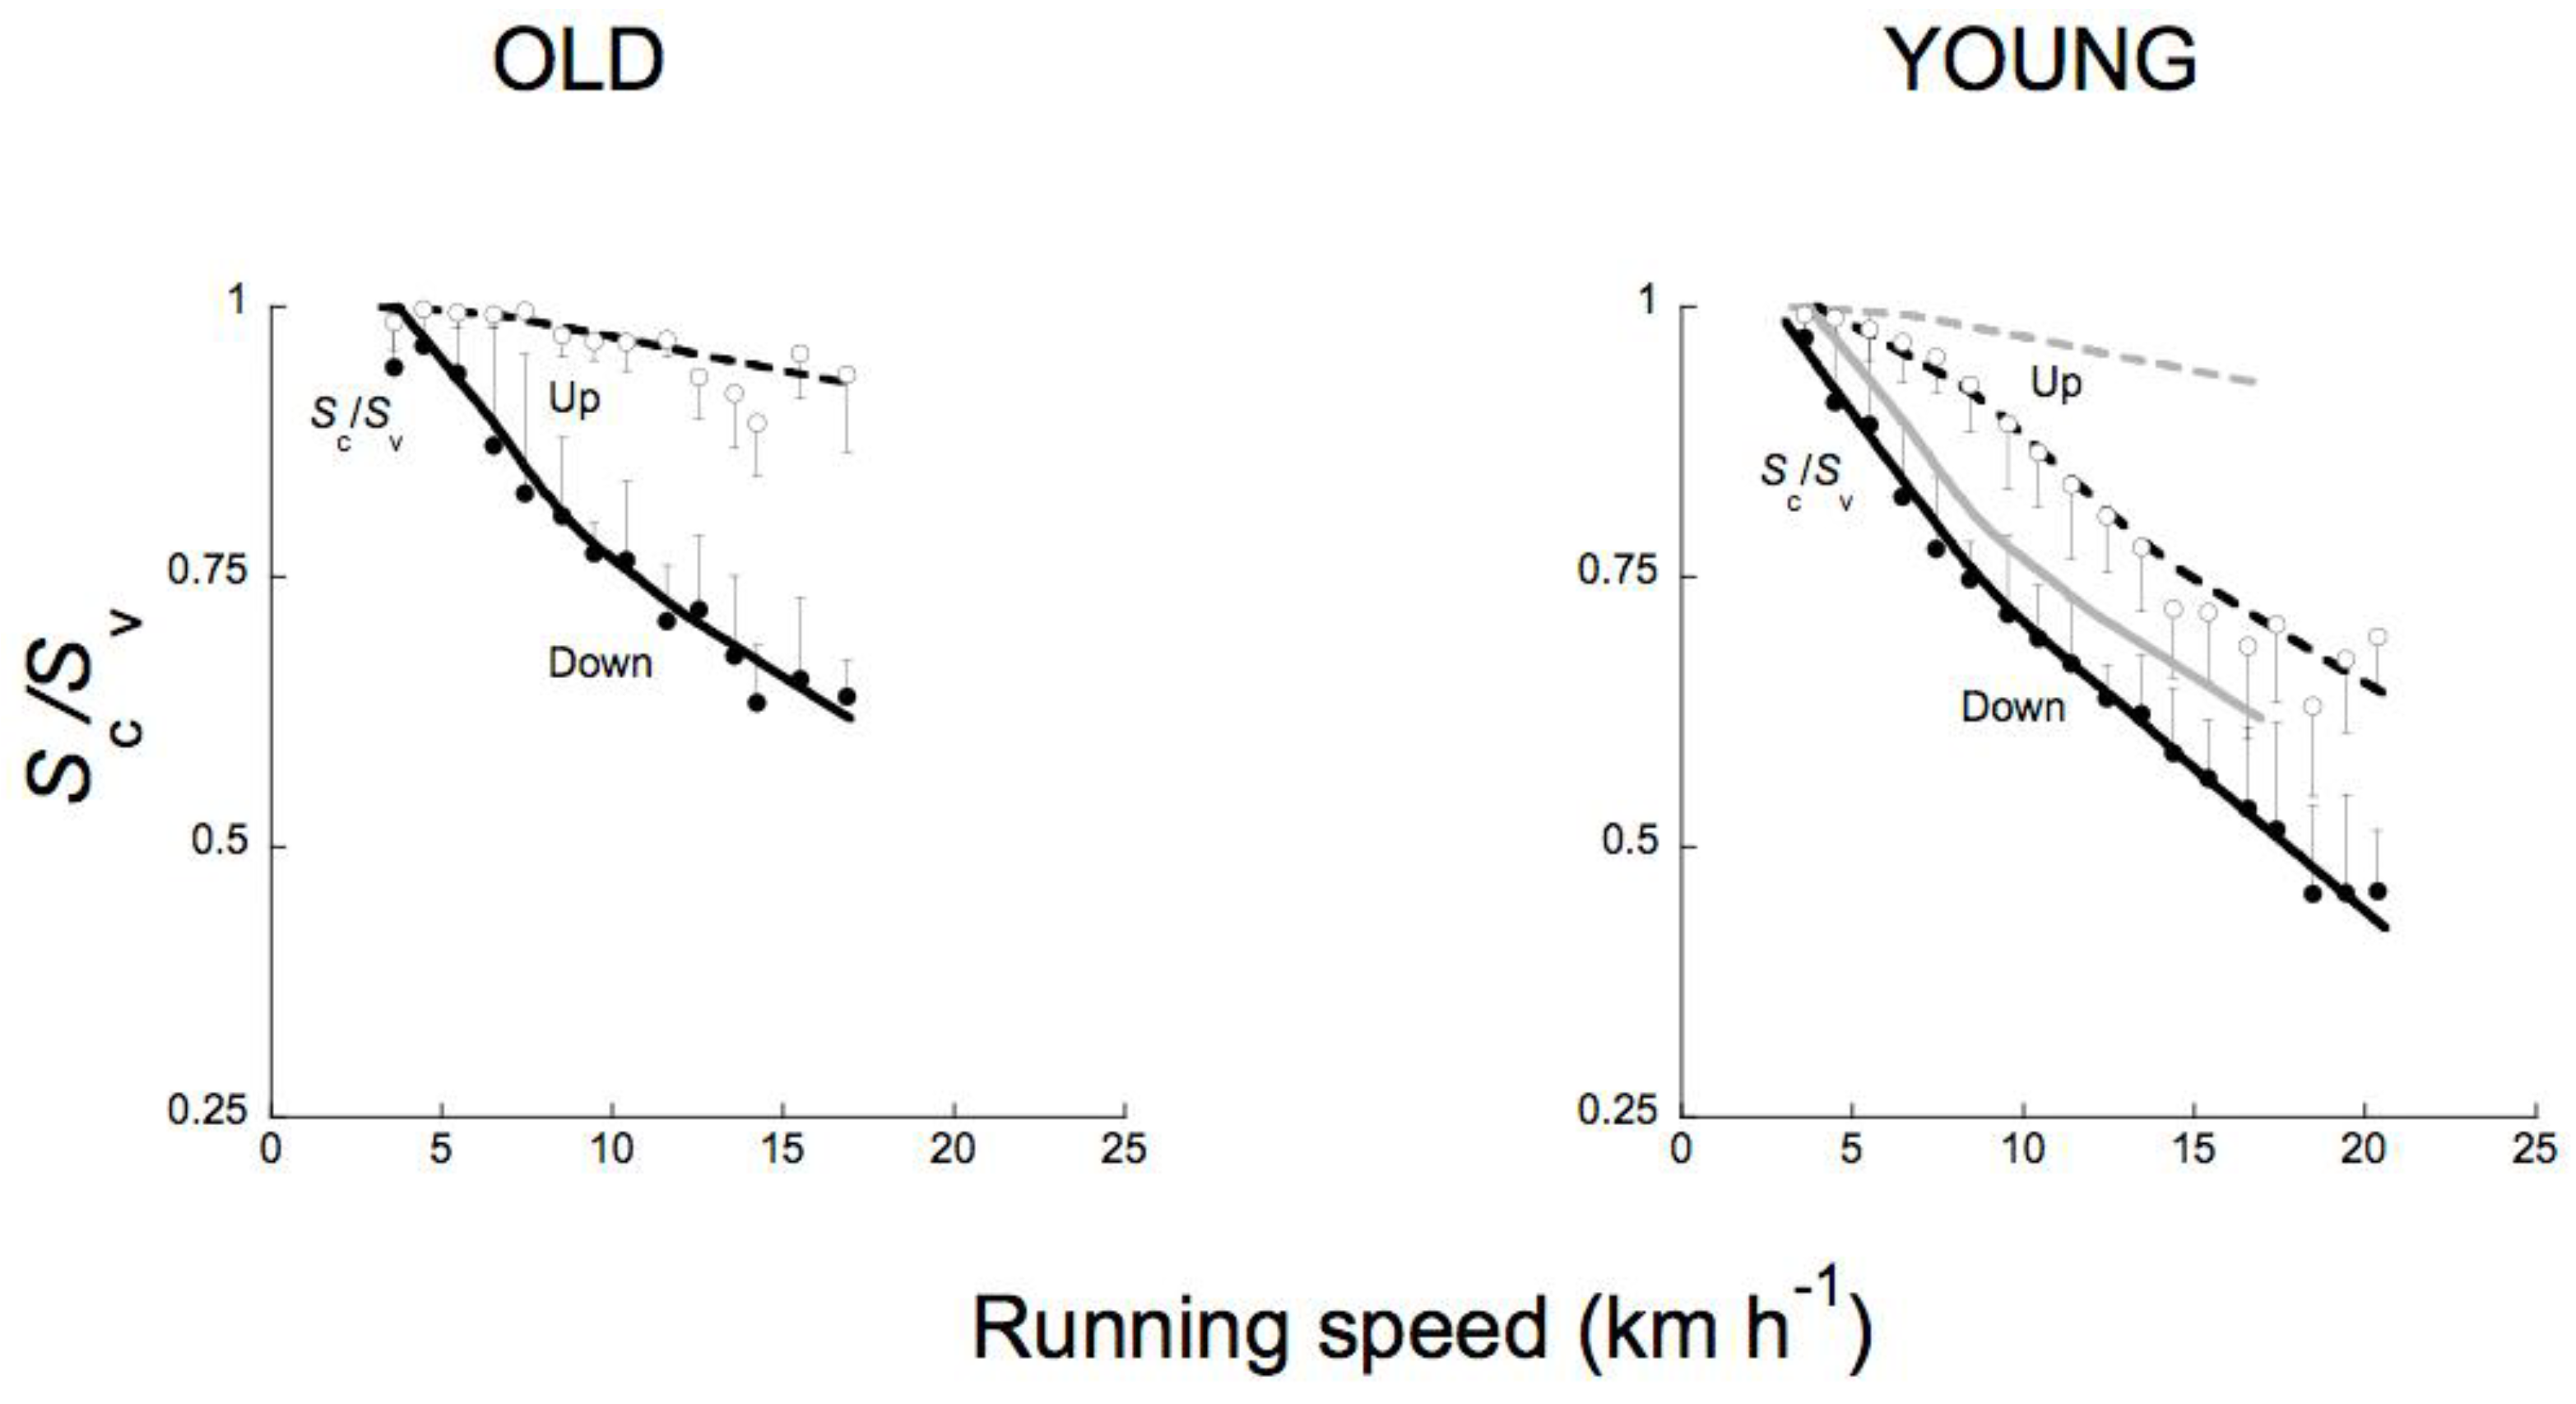
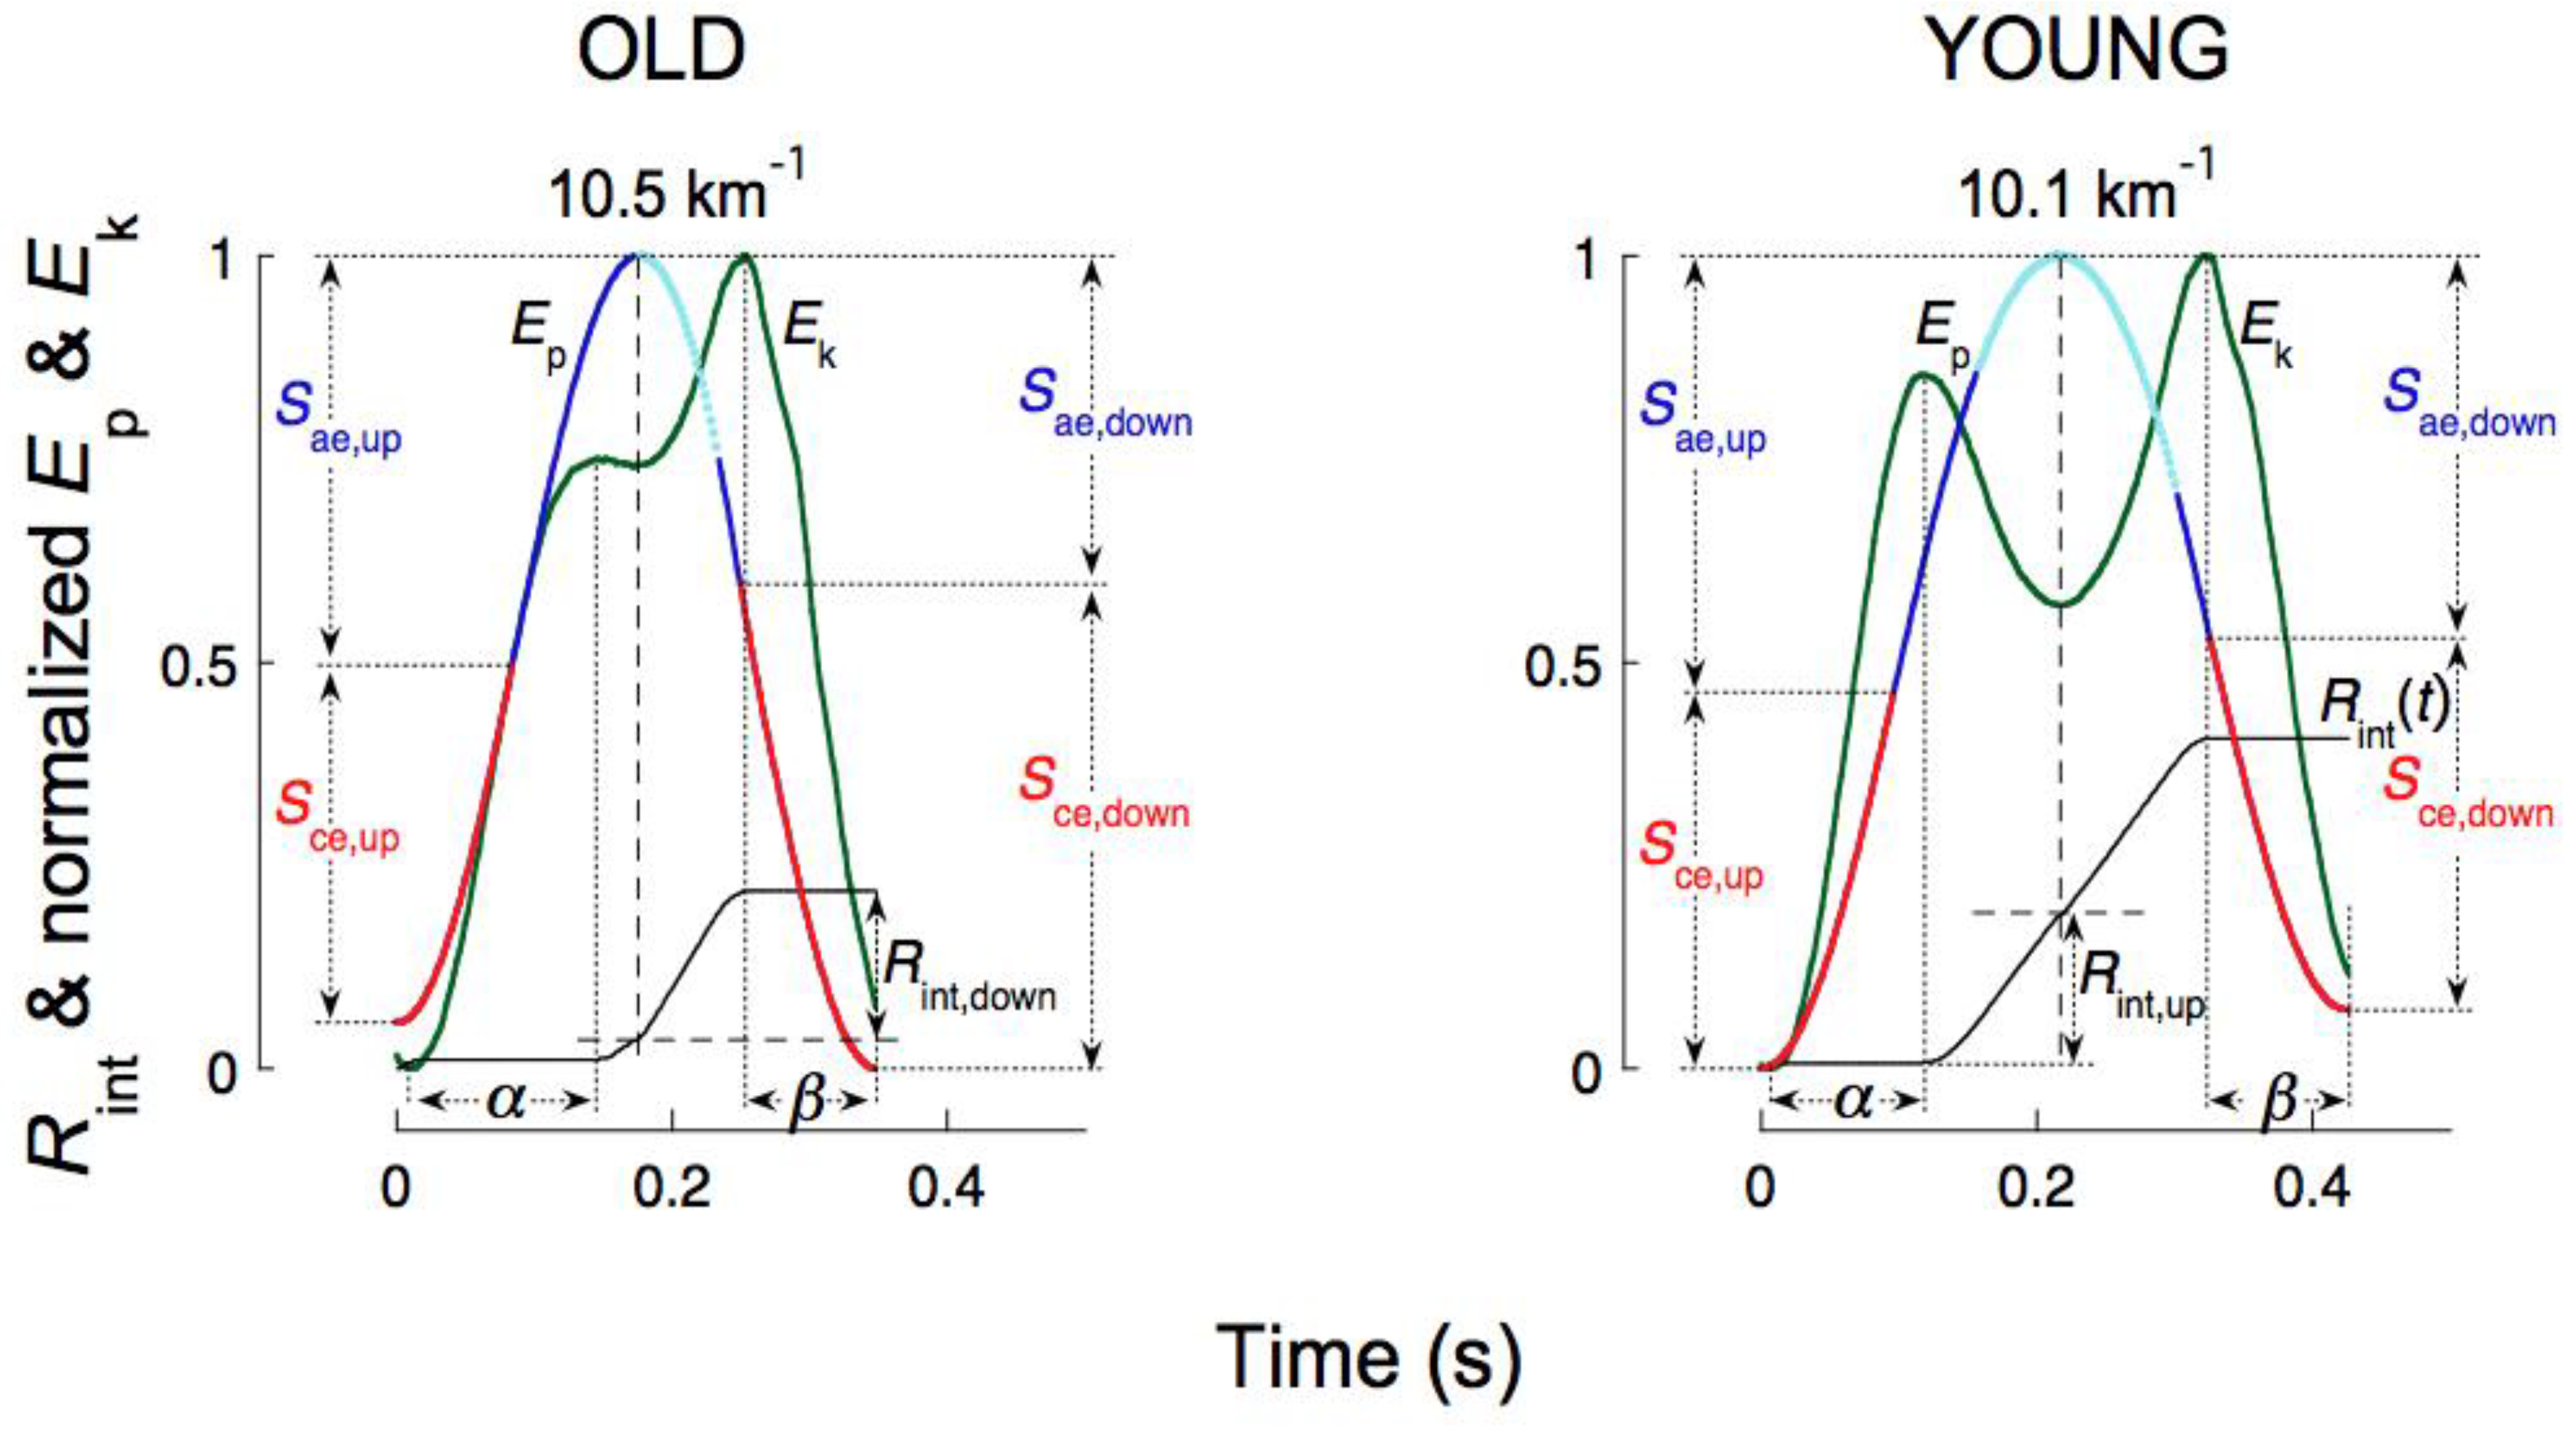
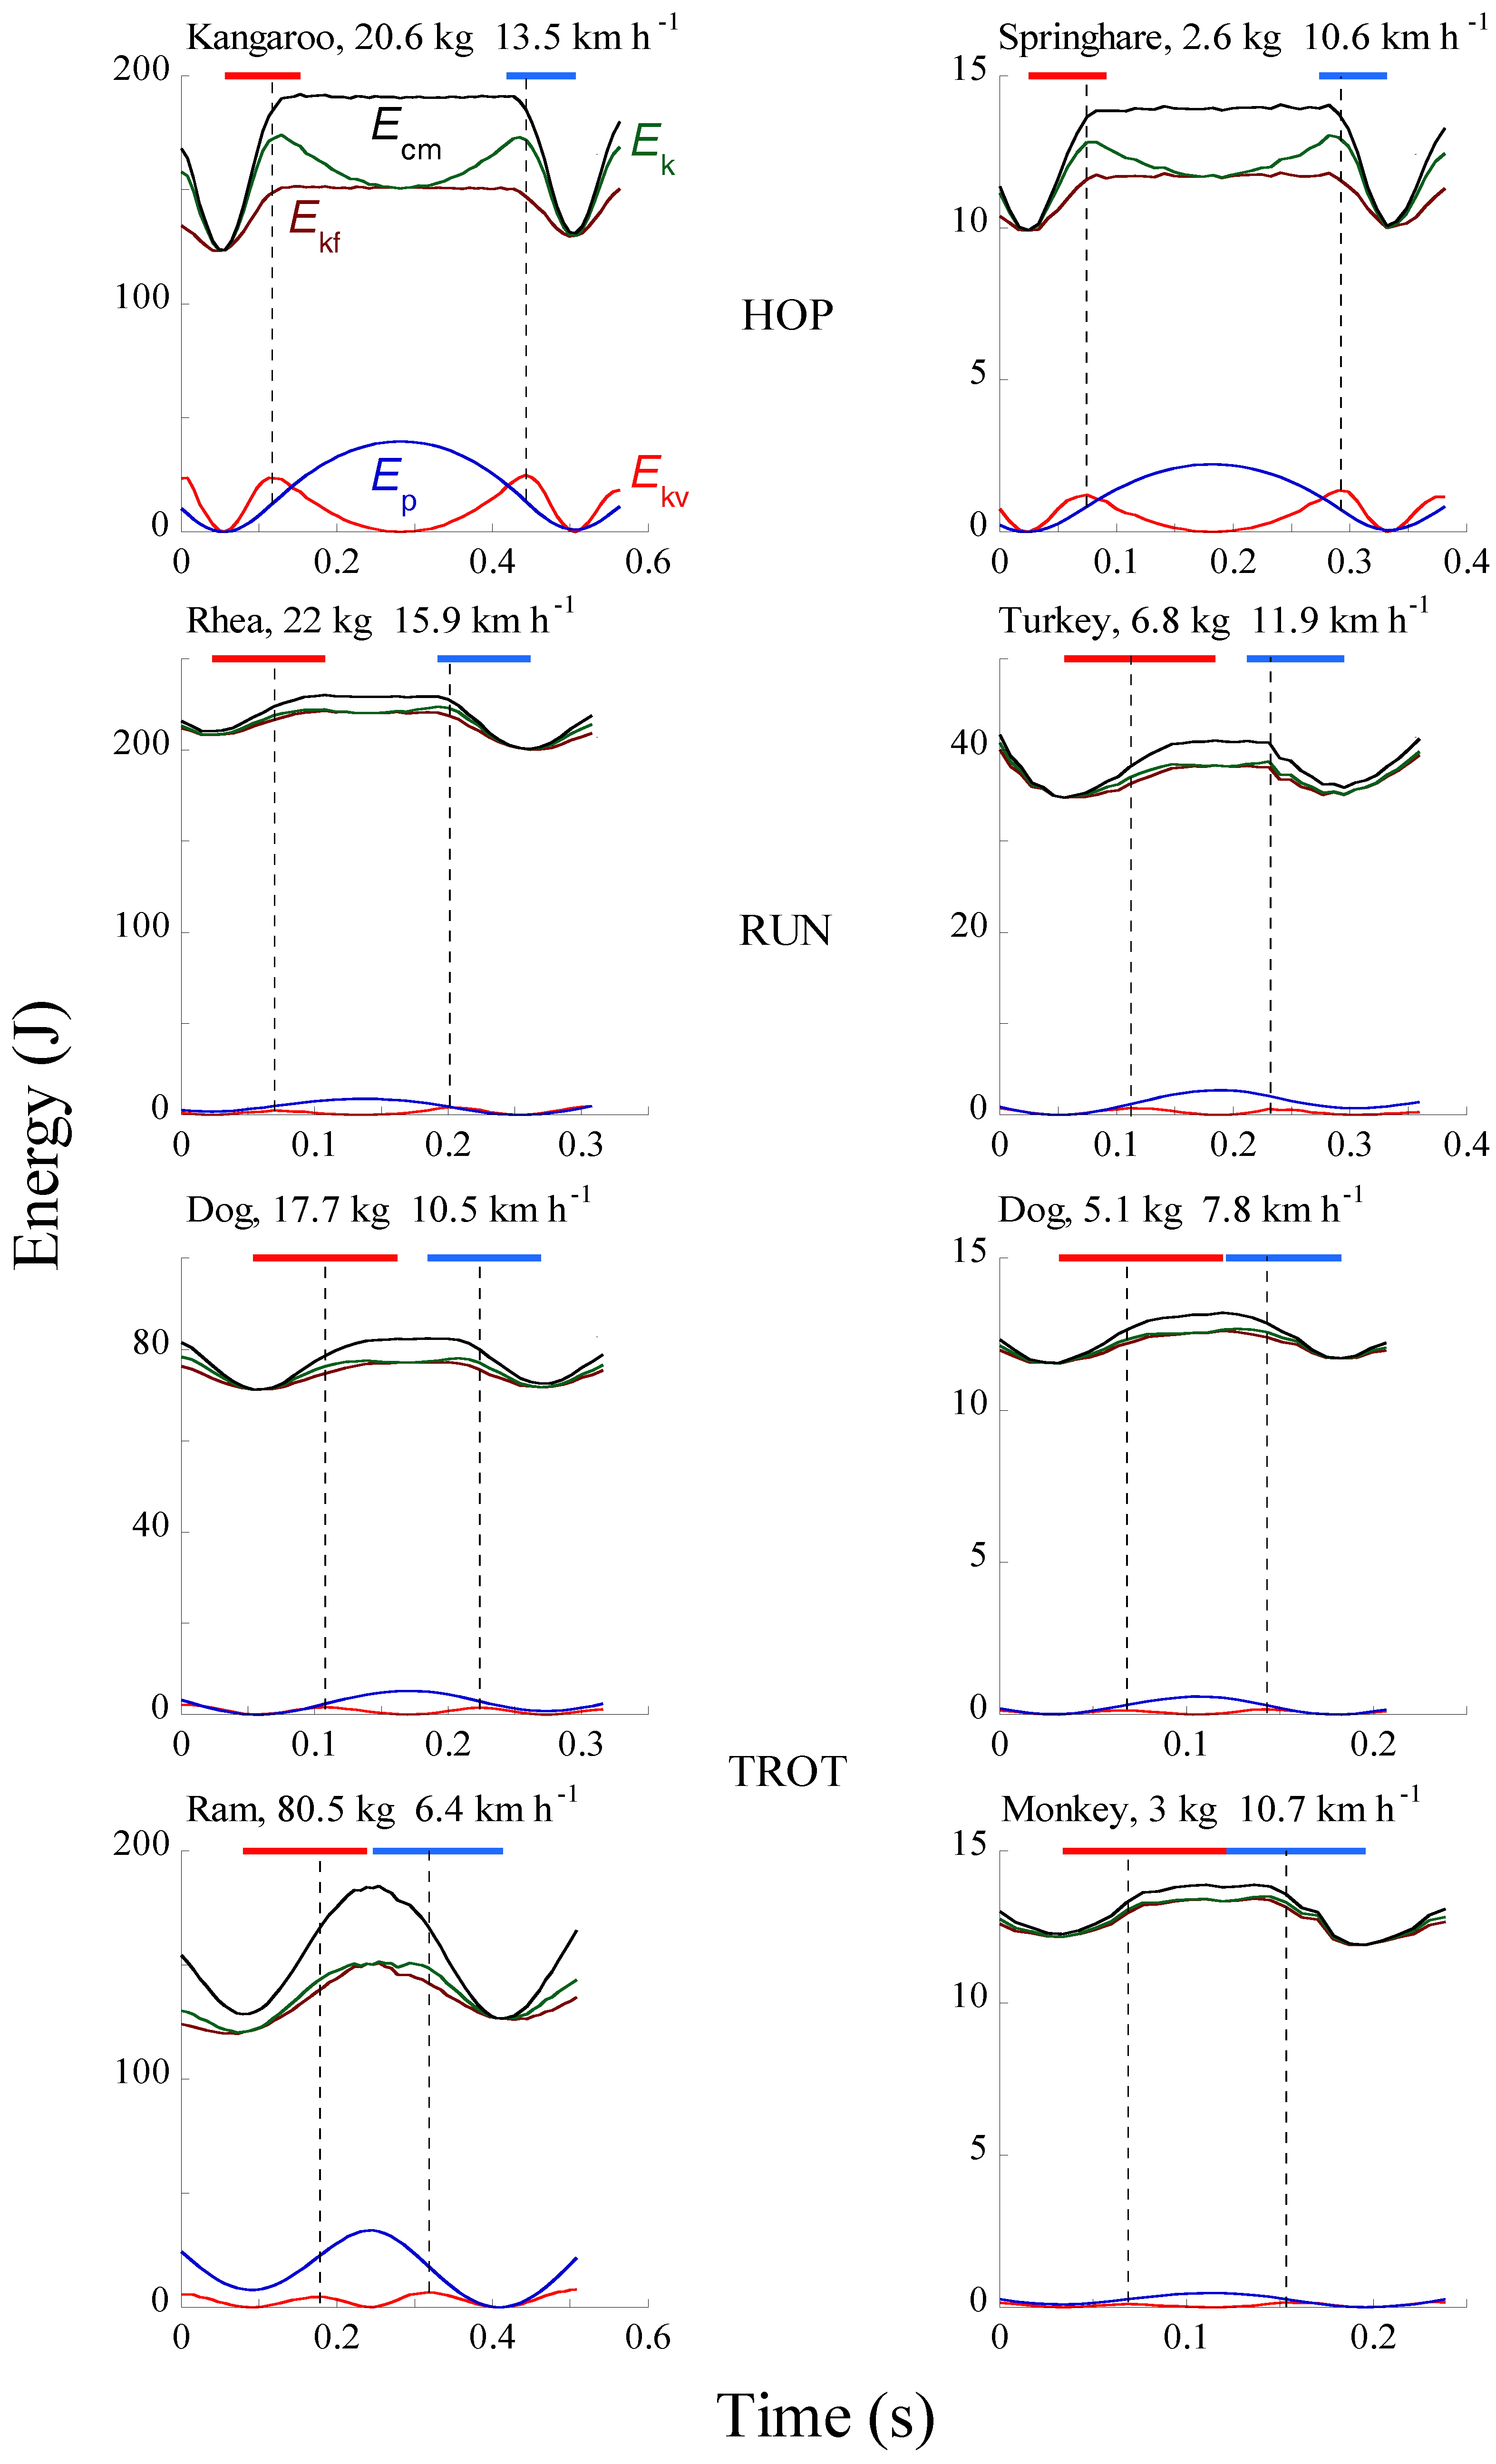
Table 1.
Values are mean ± s.d. of measurements made in all the runs of Figure 27. The number of items (n) in the mean is given below the name of each animal. From top to bottom: the mass of the animal, the positive work duration, tpush, the negative work duration tbrake, the landing-takeoff asymmetry, tpush/tbrake (mean of the ratios made at each speed), the mass specific vertical stiffness, k/Mb, the resonant frequency of the bouncing system, fs=(1/2π)√k/Mb, the step frequency, fstep, the maximal upward acceleration, Av,mx, up, and the efficiency of doing external work, Wext/Wmetab. Note that: i) tpush is greater than tbrake (p < 0.05 in all animals except rams where p = 0.13), ii) tpush/tbrake is greater in small animals than in large animals (p < 0.05 in all animals except rams vs. monkey where p = 0.09), and iii) k/Mb is greater in small animals than in large animals (p < 0.05) [89].
| a | ||||
| HOP | RUN | |||
| Kangaroos n = 31 | Springhare n = 26 | Rhea n = 13 | Turkeys n = 12 | |
| Mass (kg) | 20.4 ± 0.5 | 2.5 ± 0.1 | 22.4 ± 0.4 | 7.2 ± 0.3 |
| tpush (s) | 0.095 ± 0.010 | 0.069 ± 0.012 | 0.118 ± 0.019 | 0.102 ± 0.017 |
| tbrake (s) | 0.088 ± 0.013 | 0.059 ± 0.012 | 0.094 ± 0.014 | 0.071 ± 0.014 |
| tpush/tbrake | 1.091 ± 0.151 | 1.190 ± 0.196 | 1.272 ± 0.189 | 1.443 ± 0.140 |
| k/Mb (s−2) | 644.9 ± 170.5 | 1411.3 ± 492.0 | 596.7 ± 270.0 | 886.7 ± 252.7 |
| fs (Hz) | 4.01 ± 0.52 | 5.90 ± 1.02 | 3.82 ± 0.77 | 4.70 ± 0.65 |
| fstep (Hz) | 2.19 ± 0.19 | 3.04 ± 0.20 | 3.63 ± 0.43 | 4.44 ± 0.43 |
| Av,mx,up (ms−2) | 39.45 ± 4.72 | 42.30 ± 10.85 | 12.53 ± 2.64 | 13.40 ± 2.58 |
| W ext/Wmetab | 0.501 | 0.207 | 0.147 | 0.124 |
| b | ||||
| TROT | ||||
| Large dog n = 12 | Small dog n = 16 | Rams n = 12 | Monkey n = 14 | |
| Mass (kg) | 17.6 ± 0.2 | 5.0 ± 0.2 | 76.2 ± 11.4 | 3.1 ± 0.2 |
| tpush (s) | 0.128 ± 0.014 | 0.093 ± 0.012 | 0.158 ± 0.033 | 0.103 ± 0.017 |
| tbrake (s) | 0.105 ± 0.014 | 0.071 ± 0.011 | 0.149 ± 0.025 | 0.091 ± 0.023 |
| tpush/tbrake | 1.217 ± 0.099 | 1.334 ± 0.145 | 1.062 ± 0.119 | 1.166 ± 0.182 |
| k/Mb (s−2) | 762.1 ± 182.0 | 1547.4 ± 378.2 | 397.2 ± 183.3 | 1193.0 ± 444.4 |
| fs (Hz) | 4.36 ± 0.55 | 6.21 ± 0.80 | 3.10 ± 0.68 | 5.41 ± 1.00 |
| fstep (Hz) | 4.31 ± 0.41 | 6.18 ± 0.69 | 3.31 ± 0.64 | 5.21 ± 0.87 |
| Av,mx,up (ms-2) | 10.44 ± 1.61 | 8.99 ± 1.10 | 6.19 ± 2.41 | 9.66 ± 2.59 |
| Wext/ Wmetab | 0.262 | — | — | 0.153 |
© 2010 by the author. Licensee MDPI, Basel, Switzerland. This article is an open access article distributed under the terms and conditions of the Creative Commons Attribution (CC BY) license (http://creativecommons.org/licenses/by/4.0/).
Share and Cite
MDPI and ACS Style
Cavagna, G.A. Symmetry and Asymmetry in Bouncing Gaits. Symmetry 2010, 2, 1270-1321. https://0-doi-org.brum.beds.ac.uk/10.3390/sym2031270
AMA Style
Cavagna GA. Symmetry and Asymmetry in Bouncing Gaits. Symmetry. 2010; 2(3):1270-1321. https://0-doi-org.brum.beds.ac.uk/10.3390/sym2031270
Chicago/Turabian StyleCavagna, Giovanni A. 2010. "Symmetry and Asymmetry in Bouncing Gaits" Symmetry 2, no. 3: 1270-1321. https://0-doi-org.brum.beds.ac.uk/10.3390/sym2031270