Diamonds Certify Themselves: Multivariate Statistical Provenance Analysis


1
Materialytics, Killeen, TX 76542, USA
2
Department of Geological Sciences, New Mexico State University, Las Cruces, NW 88003, USA
*
Author to whom correspondence should be addressed.
Minerals 2020, 10(10), 916; https://0-doi-org.brum.beds.ac.uk/10.3390/min10100916
Submission received: 15 September 2020
/
Revised: 13 October 2020
/
Accepted: 13 October 2020
/
Published: 16 October 2020
(This article belongs to the Special Issue Analytical Tools to Constrain the Origin of Minerals)
Abstract
:The country or mine of origin is an important economic and societal issue inherent in the diamond industry. Consumers increasingly want to know the provenance of their diamonds to ensure their purchase does not support inhumane working conditions. Governments around the world reduce the flow of conflict diamonds via paper certificates through the Kimberley Process, a United Nations mandate. However, certificates can be subject to fraud and do not provide a failsafe solution to stopping the flow of illicit diamonds. A solution tied to the diamonds themselves that can withstand the cutting and manufacturing process is required. Here, we show that multivariate analysis of LIBS (laser-induced breakdown spectroscopy) diamond spectra predicts the mine of origin at greater than 95% accuracy, distinguishes between natural and synthetic stones, and distinguishes between synthetic stones manufactured in different laboratories by different methods. Two types of spectral features, elemental emission peaks and emission clusters from C-N and C-C molecules, are significant in the analysis, indicating that the provenance signal is contained in the carbon structure itself rather than in inclusions.

1. Introduction
Diamonds have played a significant role in human history. As major gemstones, an efficient method for transporting great value, and a component in many industrial applications, diamonds have long been useful, and their uses have evolved with human society. Diamond mining in countries with unstable governments motivated the use of diamonds to fund terrorist activities. Since 2003, international diamond trade has been led by the Kimberley Process, which defines conflict diamonds as those that “can be directly linked to the fueling of armed conflict, the activities of rebel movements aimed at undermining or overthrowing legitimate governments, and the illicit traffic in, and proliferation of, armaments, especially small arms and light weapons” [1]. Furthermore, diamond mining in some countries involves significant human civil rights violations, such as indentured servitude, child labor, and inhumane working conditions [2,3,4]. The Kimberley Process attempts to certify that all rough stones exported from participating nations are conflict-free. All rough diamonds are exported in tamper-resistant packaging with a Kimberley Process Certificate authorized by the country of origin; import and export of rough diamonds is allowed only between Kimberley Process countries [1].
Kimberley Process Certificates accompany rough diamonds to the cutter, but not to the customer. Once a diamond is cut, it is deemed conflict-free, prompting the smuggling of conflict diamonds into cutting facilities. No monitoring by independent observers exists, largely because there has not been an accurate monitoring method. The Kimberley Process requires a sophisticated infrastructure capable of certifying, monitoring, and verifying the origin of exported diamonds. Some countries lack the ability to maintain such systems, and the immense value of the diamonds encourages corruption [2,5].
Several mineralogical methods have been applied to diamond provenance. Geochemical compositions of mineral and fluid inclusions have constrained models of diamond formation and the history of the Earth’s mantle [6,7,8,9,10,11,12,13,14,15,16]. However, only 1% of diamonds contain inclusions [13], assuming a study of greater than one million South African and Botswanan diamonds is representative, making inclusion-based methods inviable for provenance determination. Carbon and nitrogen isotopic analysis of diamonds [17,18,19,20] has been useful for tracking the mantle’s volatile history; however, isotopic values from different mines have overlapping ranges. N-defect aggregation, measured by Fourier transform infrared analysis (FTIR), tracks the transformation of single nitrogen atoms (Type Ib diamonds) to nitrogen pairs (Type IaA) to aggregates of four nitrogen atoms with a vacancy (Type IaB) [21,22,23] as diamonds age at high temperature. These changes are related to color and elucidate the history of diamond formation; however, they do not correlate to provenance [24]. Finally, some diamonds have unique morphological characteristics. These features are not ubiquitous in each mine, and the information is lost upon cutting. Coney et al. [24] conclude, “It is immediately evident…that gem-quality diamonds cannot be discriminated by only morphology or FTIR or LA-ICP-MS alone, and that attempts at fingerprinting such diamonds (in particular) is highly problematic owing to the fundamental nature of gem-quality diamonds”.
The elements N, B, O, and H are well-known impurities in natural diamonds; whether other elements reside in the diamond structure or exist in mineral or fluid inclusions has been debated. Inclusion-free natural diamonds analyzed by instrumental neutron activation analysis (INAA) [8] contain measurable concentrations at the ppb/ppm level of La, Ce, Sm, Yb, Na, Ca, Cr, Sc, Fe, Ni, Co, Au, and Ir. These elements were interpreted to exist as sub-microscopic inclusions. More recently, Rb, Ba, Th, U, Nb, La, Ce, Pr, Sr, Pb, Zr, Hf, Eu, Dy, Yb, and Lu were determined at ppm levels in natural diamonds by LA-ICP-MS in a study of trace element partitioning in mixed-habit diamonds free of fluid or mineral inclusions other than graphitized disc-crack-like defects [25].
The presence of trace elements in synthetic diamond is an important facet of the material engineering of diamonds for specific performance characteristics. The presence of Ni, Co, Fe, P, Ti, W, Si, and Ge has been measured by electron spin resonance (ESR) [26,27], photoluminescence [28,29,30,31], and electron paramagnetic resonance (EPR) [32,33,34,35]. While only N, B, Si, Ni, H, and Co are bonded in the diamond lattice, almost all elements can be found in diamonds [32]. The diamond structure is a cubic unit cell with a lattice parameter of 0.3567 nm. This structure can be thought of as consisting of eight octants, four of which are filled with carbon tetrahedra and four empty octants [36]. The interatomic diameter of the empty octants is 0.154 nm [36], which could accommodate large ions as single-atom inclusions. In natural diamonds, these atoms were present in the host rock and incorporated during diamond growth. Inductively coupled plasma–mass spectrometry analysis of 26 trace elements in >100 diamonds from the Central African Republic and the Democratic Republic of Congo demonstrated that the trace element compositions of diamonds can be used to distinguish provenance from these two locations [37].
Laser-induced breakdown spectroscopy (LIBS) is an analytical technique that records photons emitted by the relaxation of excited electrons in a cooling plasma caused by laser ablation. LIBS plasmas record information about every element, some isotopic ratios, and the structure of the material [38,39,40]. This paper applies an innovative multivariate method to laser-induced breakdown spectroscopy (LIBS) spectra and suggests that diamond provenance can be quantitatively determined with high accuracy.
2. Materials and Methods
Sets of 30 diamonds from 12 different natural localities and two synthetic laboratories were used in this study (Table 1). Natural diamonds were provided by an industry partner under the condition that the locations of the diamond mines not be disclosed in any publications. Our experience in multivariate analysis of LIBS spectra leads us to believe that 30 samples is the minimum required to encompass the heterogeneity in natural sample sets. All stones were visibly inclusion-free, except the Brazilian carbonado diamonds, which are polycrystalline aggregate diamonds with numerous inclusions of amorphous carbon, graphite, metals, metal alloys, and minerals [41]. Acquired from industry partners, the diamonds are from a variety of geologic sources (Table 1), including placer deposits, lamproites, and kimberlites, two of which are within 100 km of each other. The synthetic diamonds were produced by different manufacturers, one by the HPHT (high-pressure high-temperature) method and the other by CVD (chemical vapor deposition) followed by HPHT (Table 1).
The synthetic stones were cut and polished prior to analysis; natural stones were analyzed in rough form. All stones were cleaned by industry-standard methods prior to use in this study and again with isopropyl alcohol and a lint-free wipe immediately prior to analysis. LIBS spectra were acquired from each stone in four 4 × 4 grids, each of which covered 0.25 mm; grids were located on suitable flat surfaces for analysis. Total analysis time, from the beginning of analysis of one sample to the beginning of analysis of another, is approximately three minutes in this nonautomated system.
Samples were analyzed by laser-induced breakdown spectroscopy (LIBS) using a ChemReveal LIBS system (Model 3996, TSI Incorporated, Shoreview, MN, USA). Laser ablation removes atoms from the surface of the sample, creating a plasma that contains atoms from the sample, as well as from the environment of analysis [38]. Samples were analyzed in Ar rather than air, resulting in higher peak intensities and smaller ablation craters at the same laser energy. In the plasma (at temperature > 10,000 K), electrons are excited to upper orbitals. Energy is emitted as photons as the plasma cools and electrons decay to lower-energy orbitals. Photons are collected by a lens into fiber optic cables and diffracted by an Echelle spectrometer (SE 200, Catalina Scientific Instruments, LLC, Tucson, AZ, USA). Peak intensity is proportional to the number of photons emitted by specific orbital transitions [38].
This study used an Nd:YAG laser operating at wavelength 266 nm. Pulse energy was 30 mJ. Collection of light was delayed behind the laser pulse by 0.75 ns to prevent the collection of light emitted from nonquantum interactions of electrons, ions, and atoms. The gate width, or length of time for photon collection, was 10 µs. Spectra were acquired in four 4 × 4 grids, resulting in 64 spectra per sample, which were accumulated into eight spectra per stone. Some spectra (3.8%) were lost due to the inability of the computer processor to store the data at the rate it was being produced by the instrument. A total of 3161 spectra were used for multivariate analysis.
Samples were analyzed in an Ar environment rather than ambient air. As Ar is inert with high ionization energy compared to N, more laser energy is expended in exciting atoms from the sample than from those from the atmosphere when analyzing in Ar. The samples were analyzed at 1 atm (0.0001 GPa) with a stream of ultra-high-purity Ar gas flowing over the sample surface at a rate of 2 L/min. Average N intensities are measurably different for most of the localities, suggesting that the N originates from the samples rather than from the atmosphere. In addition, N-free materials analyzed with this method in other studies lack N peaks in the spectrum. Thus, it is likely that the Ar flow removed the atmospheric N from the analyzed area.
Multivariate data analysis employs the idea that the LIBS spectra of every material contain information on the origin, composition, and history of the material [42]. LIBS spectra were modeled using two multivariate techniques. In the Quantagenetics® technique, data analysis was performed using MATLAB programming language (Mathworks, Natick, MA, USA) [42]. Single-shot spectra were pre-processed to minimize the shot-to-shot variation in a three-step process: (1) Set all intensities less than 1.0 to 1.0, (2) normalize each spectrum to its mean, and (3) convert to log10. The first step avoids taking log10 of negative numbers and results in a minimum normalized intensity of zero. Unsupervised cluster analysis [43] of all 3161 spectra in the model was used to define spectral clusters, which corresponded to the known geographic/laboratory groups of diamonds. The probability distance function for each cluster was used as the tool to classify the spectra using a leave-one-out process, in which each spectrum was sequentially left out of the calibration and used to validate the model. Probability distance functions were calculated by first determining the Euclidian distance between each sample and the cluster mean in n-dimensional space, where n is the number of channels in the LIBS spectrum. The distance between a sample and the cluster mean is the square root of the sum of the squares of the residuals for each channel. The probability function, which describes the variation in spectra relative to the mean, was then calculated as the distribution of distances.
The Quantagenetics® method determines the probability that a spectrum from a sample of unknown origin belongs to one of several clusters of spectra by calculating the Euclidian distance between the unknown spectrum and each of the cluster means [42,44,45]. The probability of a spectrum belonging to a cluster is determined by comparing the distance to the probability distance function for the cluster. The cluster with the highest probability is accepted as the provenance of the unknown. An accurate model depends on predicting which samples are from a given locality, as well as those that are not from the locality. Thus, success rates are calculated as the percent of true positives and true negatives of the total number of spectra. Principal component analysis (PCA) was used to understand the spectral features that represent significant relationships in the dataset. PCA loading plots indicate the spectral features that are highly correlated in each principal component (PC).
The second method was to train and validate a decision tree that consists of a series of partial least squares regression (PLSR) models [46,47]. PLSR is a multivariate method that is used to predict the value of an independent variable from a spectroscopic data set. Spectra were averaged for each specimen for all groups, yielding a total of 320 spectra for 29–30 specimens in each of the 11 location groups (the Brazilian carbonado diamonds were not included in this model). The PLSR decision tree consists of a series of binary models, each of which predict whether a spectrum belonged to the group being modeled or to the group of all other samples. For each model, the independent variable is set to 1 for spectra in the group being modeled and to 0 for spectra in all other groups. The majority of spectra (83%) were used to calibrate the models; the remaining 17% were used to validate the models. During calibration, PLSR calculates the value of the independent variable for each calibration spectrum. Spectra in the group being modeled should have calculated values close to 1; those in the group of all other spectra should have calculated values close to 0 value of the independent variable, called the Value of Apparent Distinction (VAD) [47], is chosen to discriminate between the two groups. Spectra with a calculated independent variable value greater than or equal to the VAD are classified as being in the group being modeled; those with calculated independent variable values less than the VAD fall into the group of all other spectra. Success rate is calculated as the percent of spectra in the validation set that were correctly classified.
The group with the most distinct composition, as observed in a PCA score plot, is the first group to be modeled. After successful calibration and validation, all spectra in that group are removed from all subsequent models. The process of defining the next group, calibrating and validating a model that classifies spectra as belonging to that group or to the group of all others, and the removal of spectra of that group from subsequent models continues until all groups have been modeled. Success rates are calculated as the percent of correctly classified spectra for each model and for the overall decision tree.
3. Results
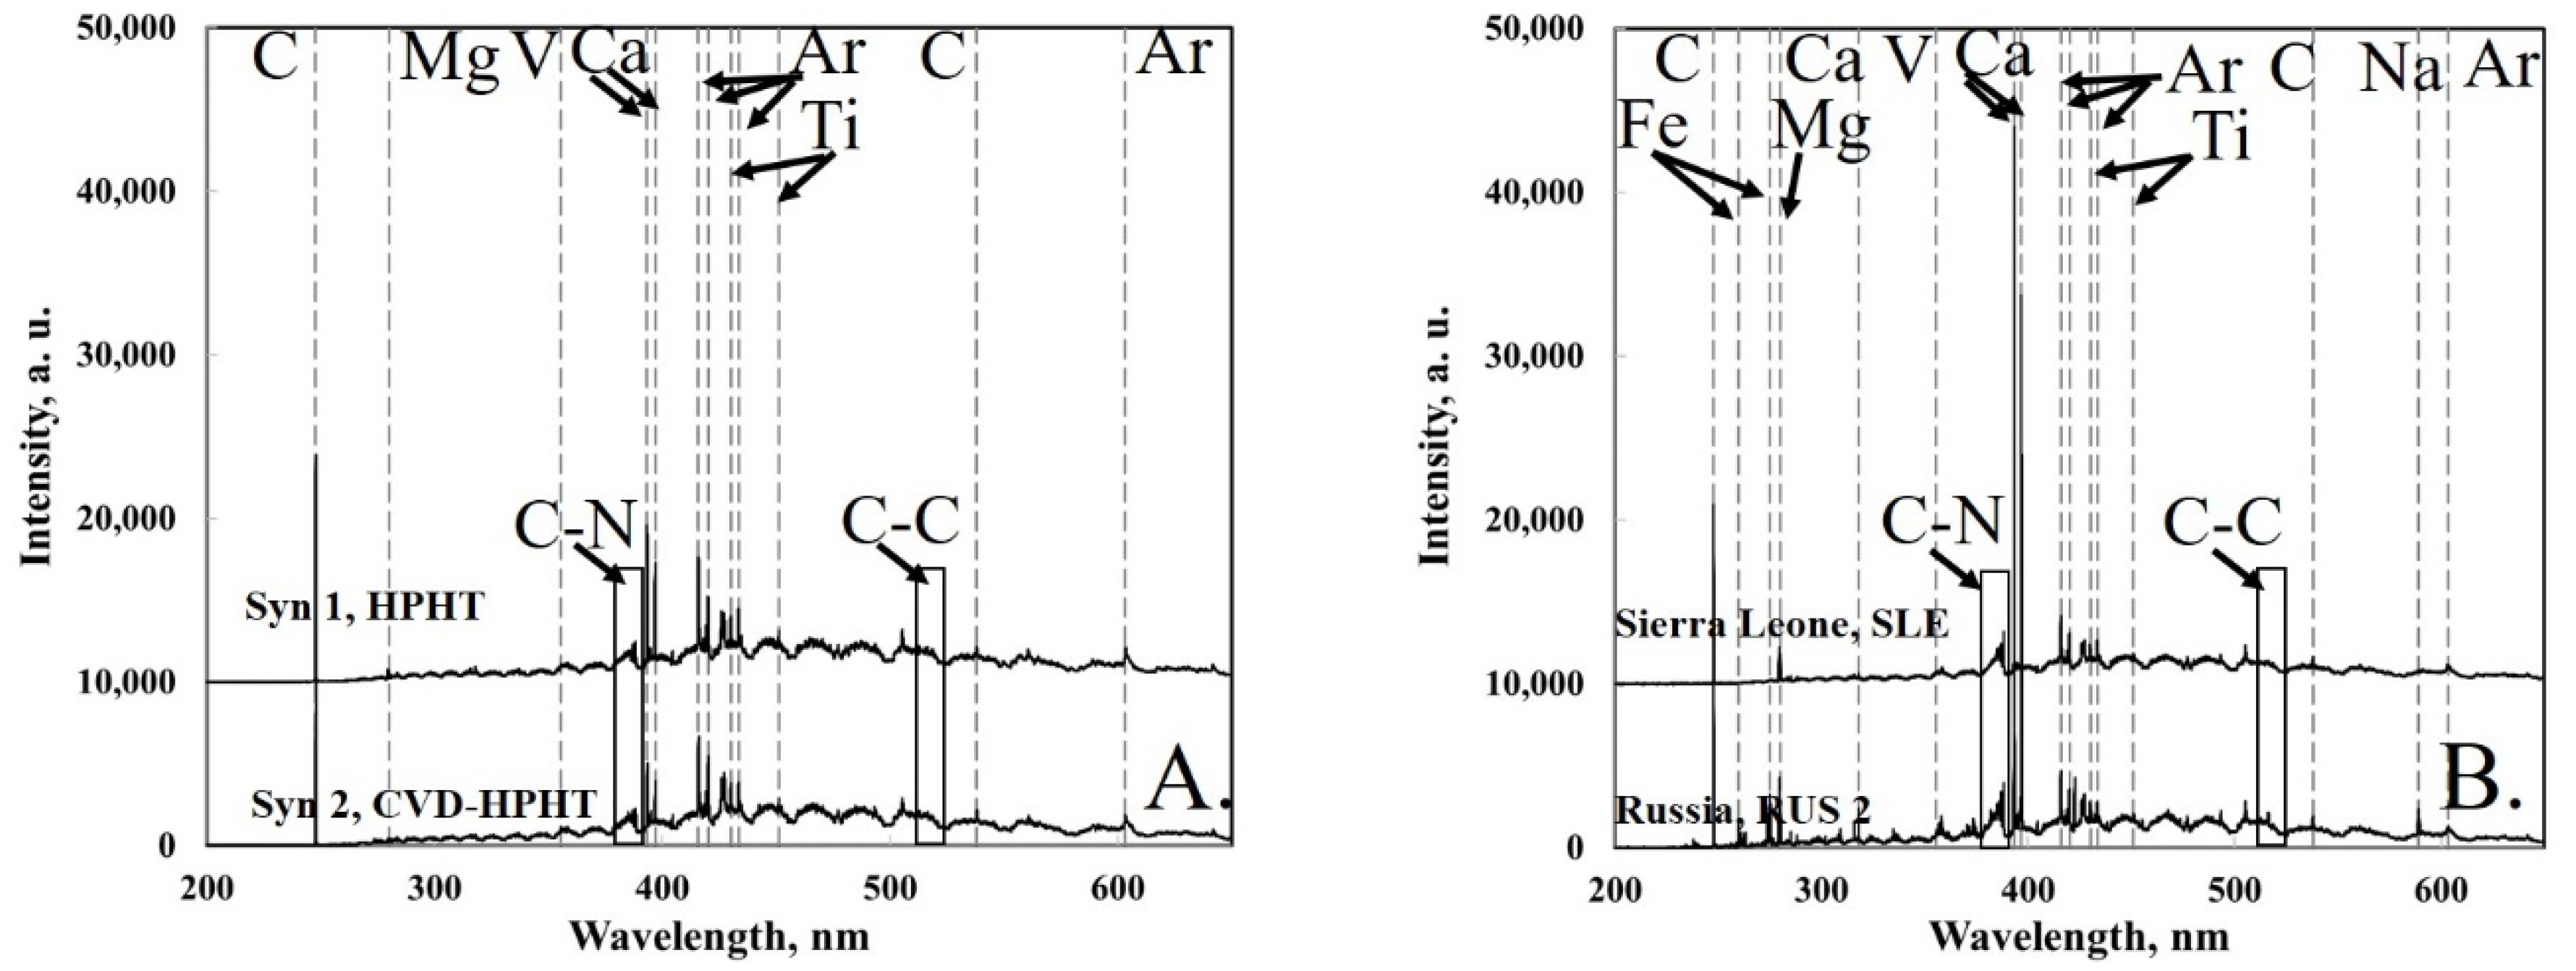
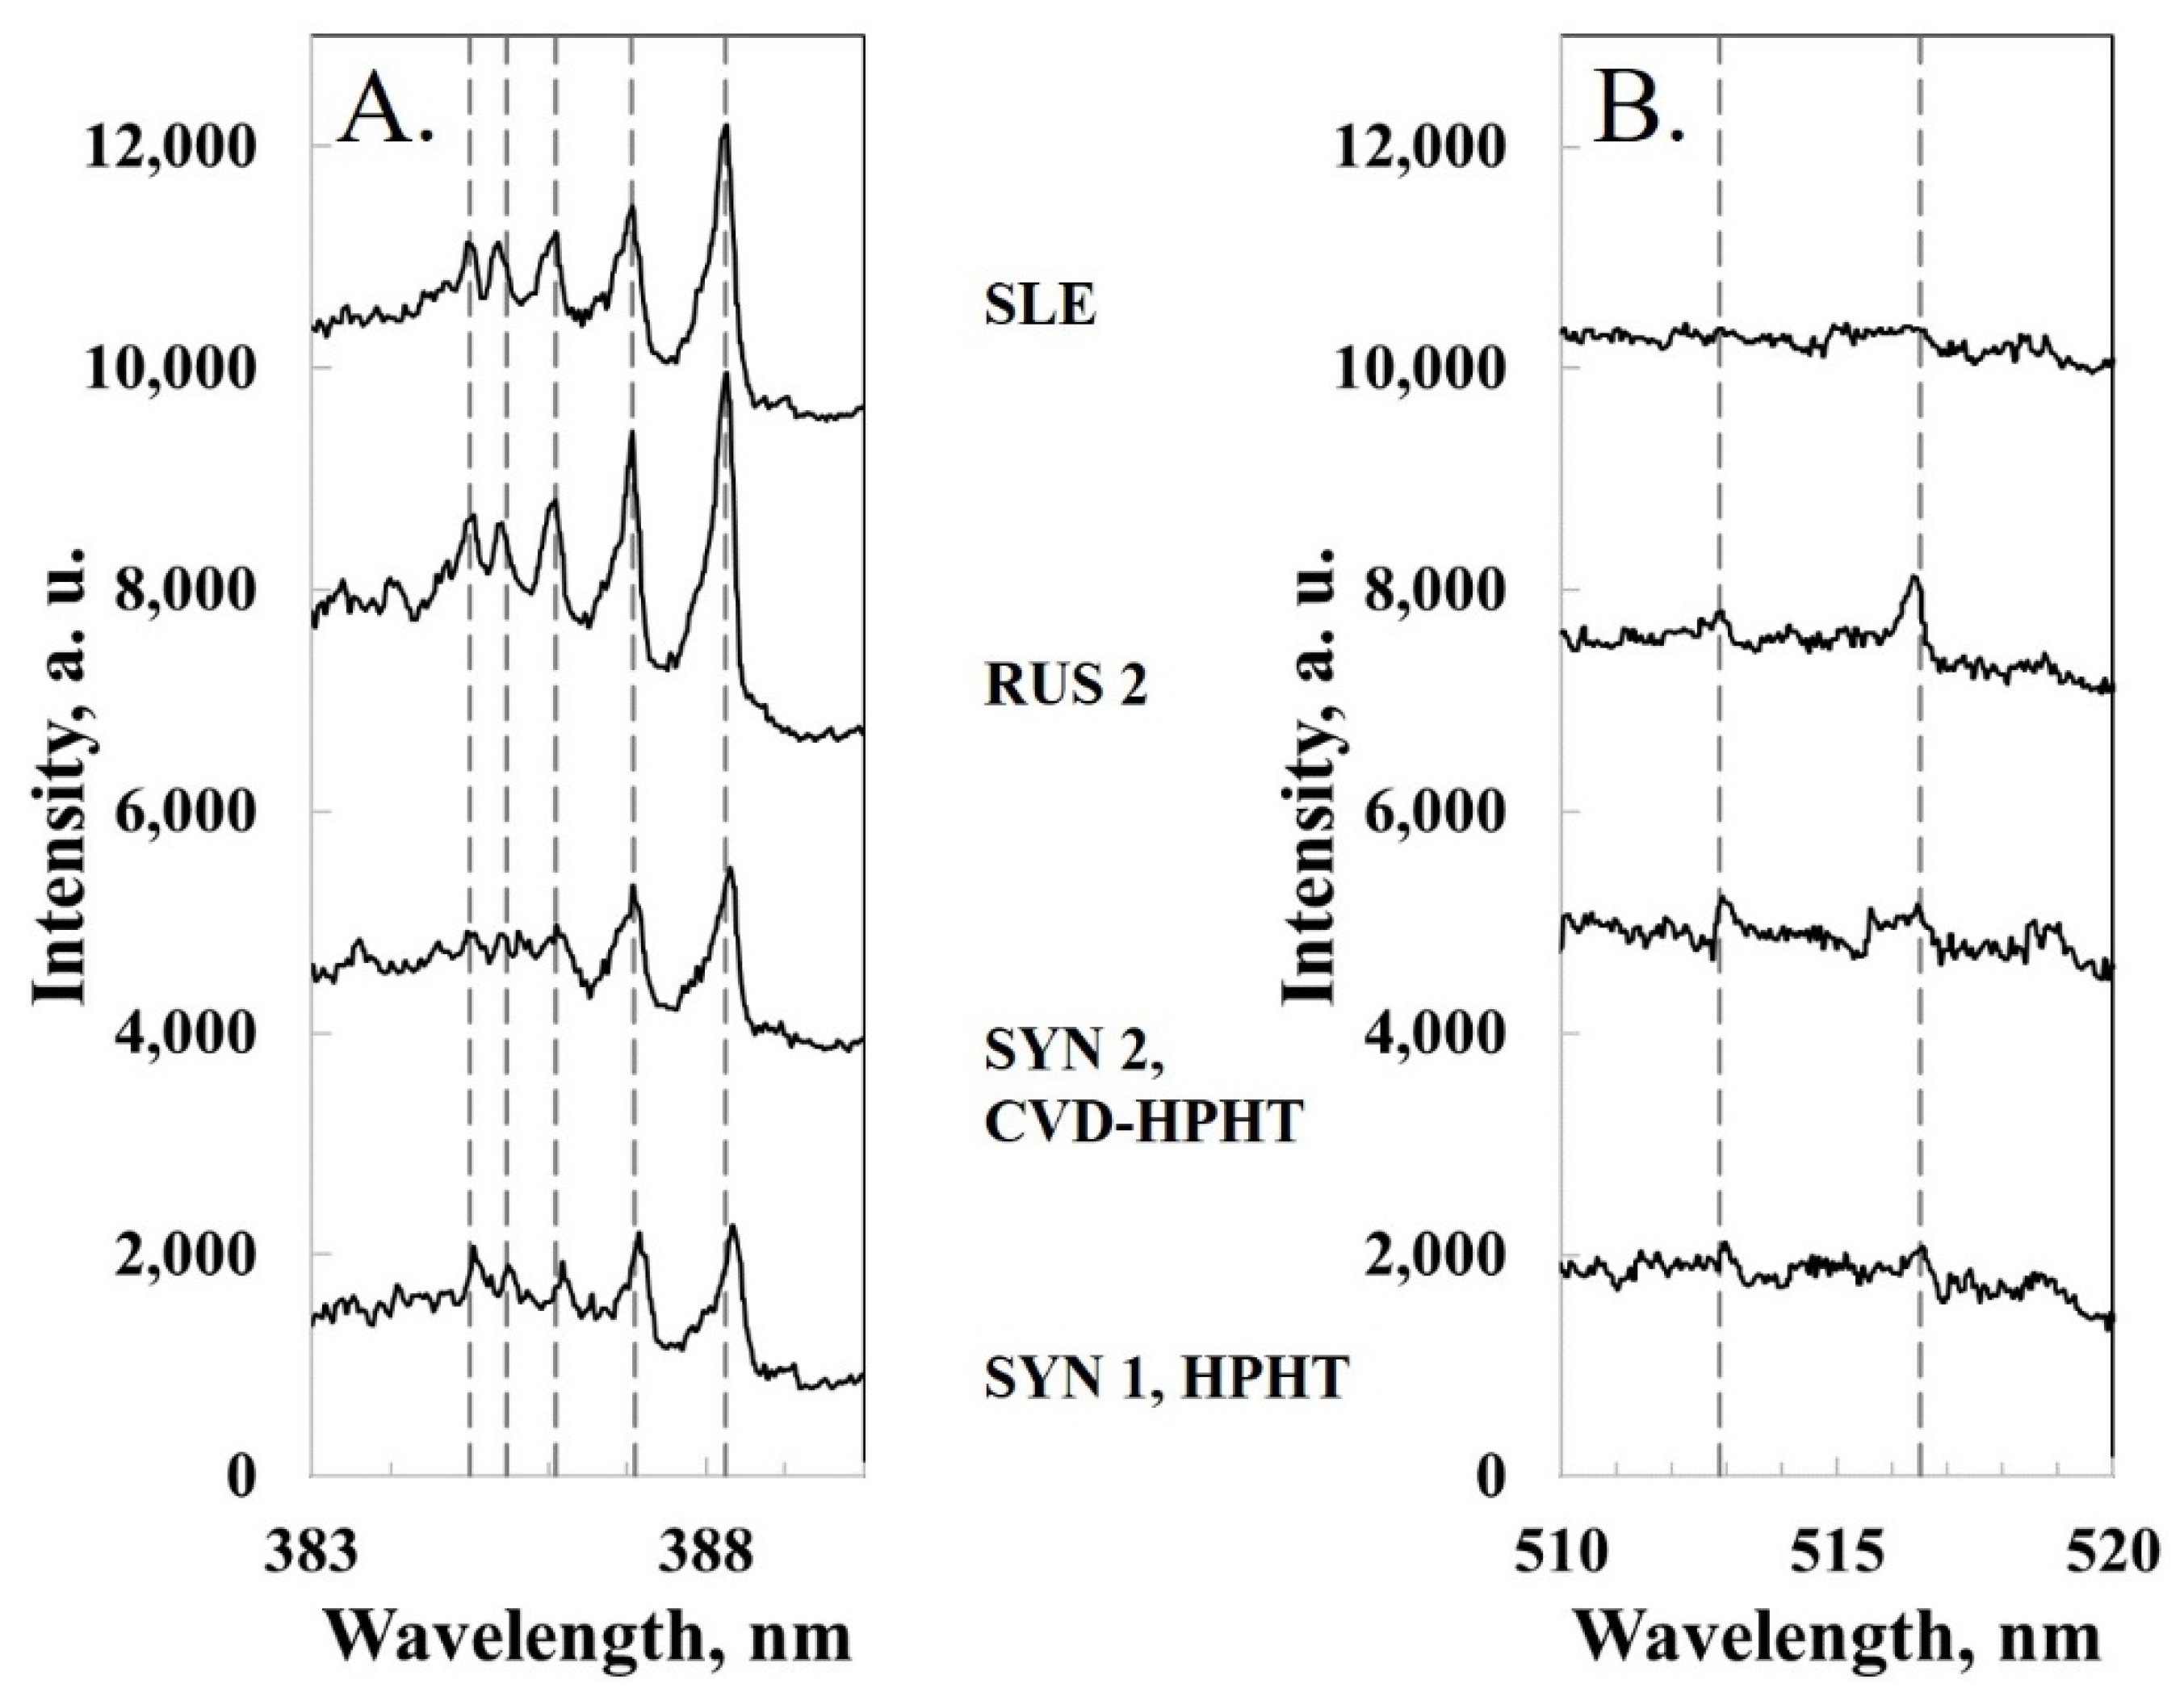
Cut and polished synthetic diamonds represent the interior of the synthetic mass; thus, elemental impurities must reside in the diamond structure rather than in surficial impurities. Peaks for C, Mg, Fe, Si, Ti, Ca, Na, Ba, H, Ne, O, N, and Ar were observed in LIBS spectra of synthetic diamonds (Figure 1A). As analysis was performed in an Ar environment, it is impossible to know whether Ar is present in the diamonds; however, H, Ne, O, and N are not atmospheric. In addition, strong emission peaks for the C–N molecules and weak C–C molecular emissions [48] are present in the spectra (Figure 2A,B).
The natural diamonds analyzed in this study exhibit LIBS peaks for all the elements observed in synthetic stones, as well as Cu, Ni, Al, V, Co, Cr, Sr, and K (Figure 1B). The Brazilian carbonado diamonds carry the highest trace element load due to their inclusion-rich character; however, inclusion-free natural diamonds also exhibit peaks of these elements, as well as molecular C–N emissions (Figure 2). C–C molecular emissions are highly variable (Figure 2).
The success rate for the Quantagenetics© method, calculated as the percent of true positives and true negatives in a leave-one-out cross-validation, ranges from 95.8% to 100% for different sets (Table 2); the average success rate is 98.5%. The synthetic sets are easily identified from natural stones and from each other. A loading plot for a PCA model of all diamond spectra (Figure 3) shows that the peaks of many elements, including Mg, Si, Ti, Mn, Al, Ca, Na, H, N, K, and O, and the C–N and C–C molecular emissions all exert influence on the principal component and are likely significant in predictions in the Quantagenetics© analysis.
The PLSR decision tree is depicted in Figure 4. Spectra from RUS 4 diamonds were modeled first with a success rate of 96.9%. After the RUS 4 spectra were removed, no single group of spectra stood out as compositionally unique; however, the AUS 1 and BRZ groups together formed a unique cluster. Thus, Model 2 classifies spectra as belonging either to the group of AUS 1 and BRZ or to the group of all other spectra. The AUS 1 and BRZ spectra are separated from each other in Model 3, with a success rate of 86.7%. Model 4 is similar to Model 2 and classifies spectra from the two synthetic sets of samples as separate from all others. Model 5 then separates spectra from the two synthetic groups from each other with a success rate of 100%. Models 6–11 continue to differentiate between one group of spectra and the group of all others, defining a single group in each model. The final groups are RUS 2 and CAN 2. Their placement at the end of the decision tree indicates that they are similar in composition to each other. They can be differentiated from each other with 100% success in this binary model, but the subtle differences between them are lost when they are modeled with all the other diamond spectra. The decision tree correctly classifies 316 of 320 spectra, yielding an overall success rate of 95.8%.
4. Discussion
Variations in two types of spectral features are significant in the multivariate analysis: Elemental peaks and emissions from C–N and C–C molecules. These molecular emissions are thought to be related to the pre-ablation structure of organic molecules [40]. C–N molecules form in the plasma from ablated C and N atoms; thus, the intensity of the C–N molecular emission peaks will be related to the N concentration of the diamond. By contrast, C–C molecules are thought to be fragments of the original structure [40]. The concentration of C–C molecules in the plasma is controlled by ablation efficacy, which in turn, is inversely related to the bond strength between neighboring C atoms relative to the bond strength between C atoms and other elements. In organic molecules, the stronger F–C bond strength in polytetrafluoroethylene is correlated to lower intensities of C–C molecular emissions compared to the weaker H–C bond of polyethylene, which exhibits more intense C–C molecular emission peaks [40]. Applying these findings to diamonds, C–C molecular intensities will vary depending on the strength of bonds, or lack of bonding, between C atoms and elemental impurities such as N, B, Si, Ti, Ni, Fe, and the other elements observed. Thus, intensities of molecular and elemental emissions are related, resulting in a unique LIBS signature for diamonds crystallized in the same host rock.
Two sets of synthetic diamonds, produced in different laboratories by different processes, were used in this study (Table 1). Our analysis correctly predicted the provenance of all synthetic stones, indicating that this method distinguishes between natural and synthetic diamonds. The success rates for both synthetic sets are essentially 100%, indicating that it is also possible to distinguish between sets of synthetic diamonds. The major spectral features in a PCA loading plot for the two sets of synthetic stones are the elemental emissions for Ca, Mg, Fe, O, and Ne. With only two sets, it is impossible to determine whether these variations are controlled by the manufacturer’s specific recipes and contaminants or a process-related factor.
The sets of placer diamonds, RUS 2 and RUS 3, have the lowest success rates (97.0% and 95.8%, respectively). This is not unexpected, because placer deposits potentially contain a mixture of stones from different sources in a drainage basin. RUS 2 and RUS 3 have high occurrences of both false negatives (placer stones predicted to belong to another group) and false positives (stones from other groups predicted to belong to the placer); this is caused by the compositional heterogeneity of multiple diamond sources in placer deposits. Success rates would increase if each placer subgroup were represented by 30 or more samples; with a sufficiently large sample set, it would be possible to model each subgroup independently.
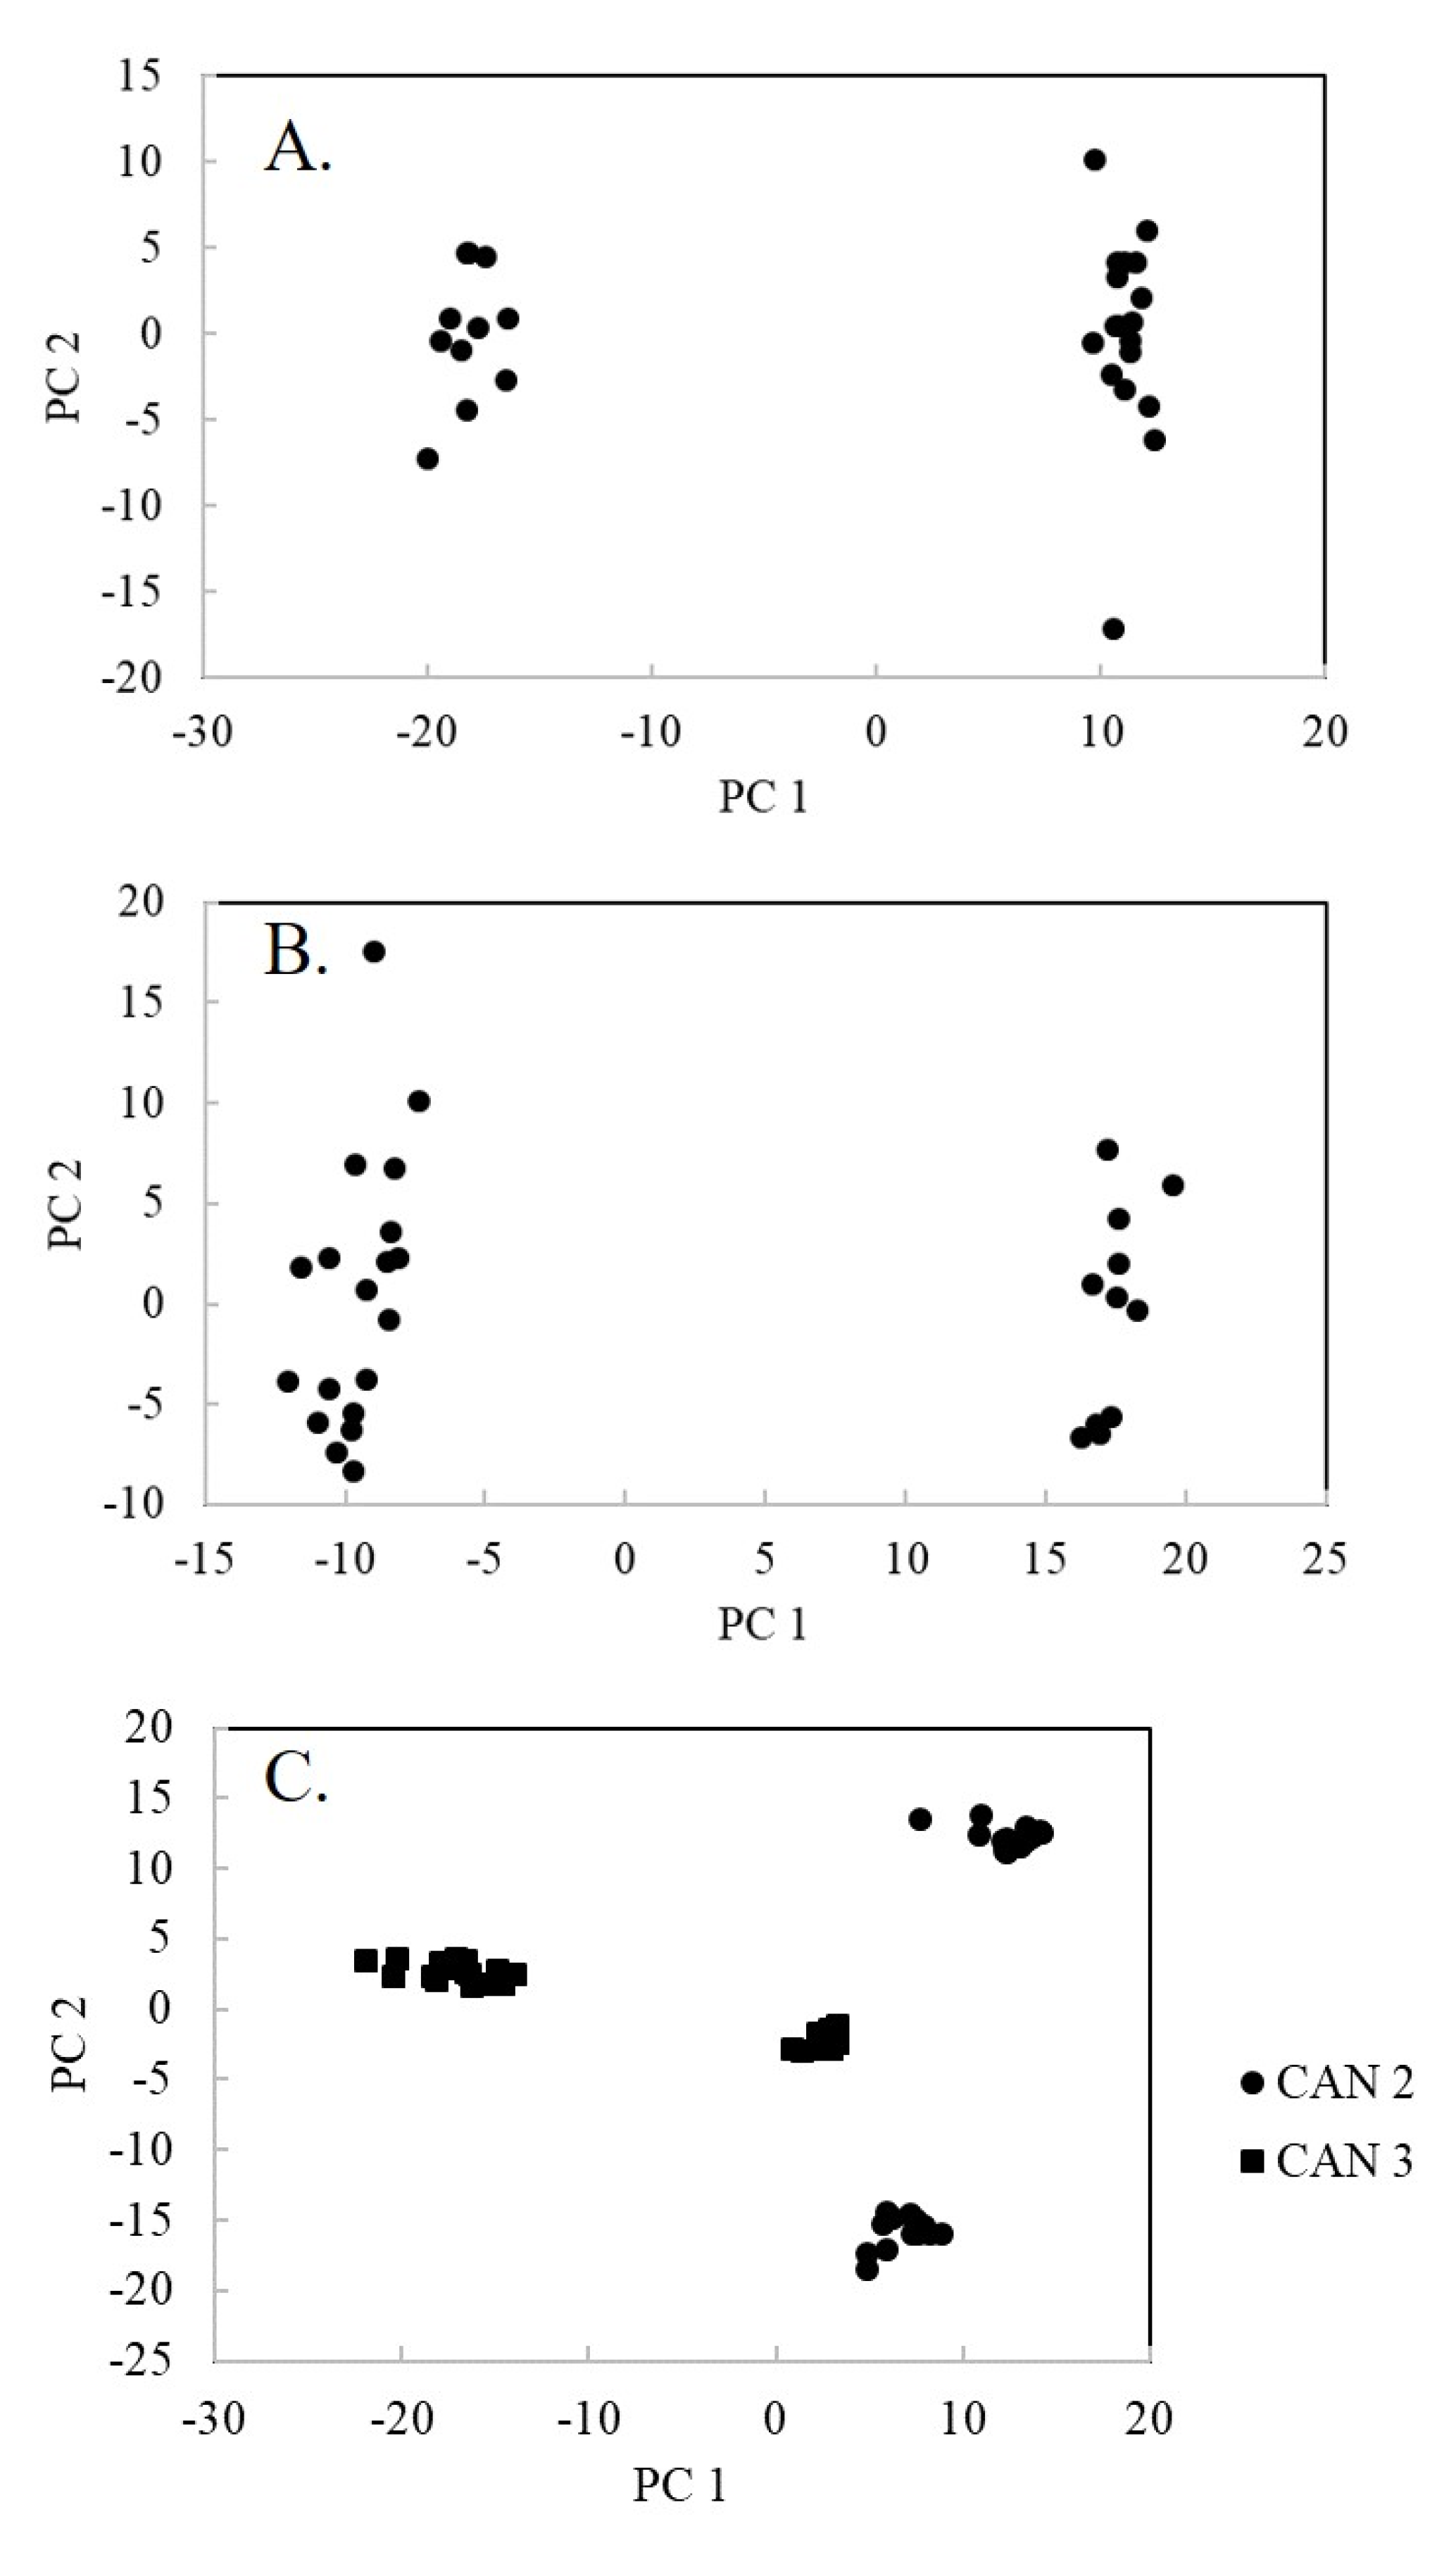
Heterogeneity within sets of diamonds can be assessed using PCA. Diamonds in the RUS 2 and RUS 3 placer deposits fall into two distinct groups in PCA score plots (Figure 5A,B). Multiple groups of diamonds from different sources are expected in placer deposits. However, the success rate for classification of diamonds from these deposits are still >90% using both methods (Table 1, Figure 4). Using the Quantagenetics® method, 97% of RUS 3 spectra were correctly classified, as were 95.8% of RUS 3 spectra. Similarly, success rates for the PLSR decision tree were 100% for RUS 2 and 91.4% for RUS 3. This suggests that: (1) The location of diamonds from placer deposits can be determined because there is a consistent regional compositional signature; and (2) compositional subgroups within a placer deposit can be identified. This technique may be useful in exploring for the host rock that supplies diamonds to placer deposits.
The existence of multiple diamond sources in a single kimberlite has been documented. For example, kimberlite mines such as Diavik in Canada comprise several individual pipes [49]. Heterogeneity in diamond characteristics such as N aggregation and isotopic composition from single mines has been observed [24]. Features such as growth zones and {100} platelets, thought to be extremely thin plate-like segregations of impurities such as C or N [50], may also differ in diamonds from a single source. This heterogeneity is observed as multiple subgroups are seen in the LIBS data from two Canadian kimberlites, CAN 2 and CAN 3 (Figure 5C). Both CAN 2 and CAN 3 exhibit two clear subgroups, although the CAN 3 subgroups show a larger difference in composition by the larger separation between them in the PCA plot. In addition, the CAN 2 diamonds and CAN 3 diamonds plot in separate areas on this plot, despite the close proximity of the two kimberlites. Although one subgroup of CAN 3 diamonds plots near the CAN 2 diamonds, both the Quantagenetics® and decision tree methods were successful in predicting the origin of the spectra (Table 1, Figure 4). The Quantagenetics® method yielded success rates of 99.6% for CAN 2 and 97.7% for CAN 3; the decision tree had success rates of 100% for CAN 2 and 92% for CAN 3. The analyses in this study were acquired without regard to crystallographic direction and likely encountered various growth zones and platelets. Multivariate analysis of LIBS spectra appears to be able to predict provenance correctly despite these compositional complexities.
The ability to determine the geographic origin of diamond accurately and rapidly is a requisite for controlling the influence of conflict stones in the diamond industry; the work reported in this pilot study suggests that automated Quantagenetics® analysis of LIBS data could be utilized for this purpose in the gem industry. Previous technology focused on features that were not ubiquitous in stones from each deposit, such as inclusion chemistry or crystal morphology. Studies of nitrogen aggregation, while useful in estimating the age and thermal history of a diamond, have not proven effective in provenance determination. Spectroscopic studies that determine the concentrations of a suite of elements in diamonds have not proven efficacious in the determination of provenance, because the chemical relationships are too complex to be discerned in a data set with ~20 trace elements. By contrast, Quantagenetics® analysis of LIBS spectra simultaneously uses information from every element in the samples in addition to structural information, providing a set of variables that is sufficiently large to unravel inherent complex geochemical relationships. Diamond provenance, like that of rubies and sapphires, depends not on the concentrations of a few elements but on the subtle and consistent proportions of all the trace elements [47]; these relationships are too complex to display on the traditional triangular diagram. This study indicates that multivariate analysis of LIBS spectra has promise in the accurate prediction of diamond provenance using a signal that is contained in the carbon structure itself, providing a robust and unique Quantagenetics® [42] signature of each deposit. Two of the localities in this study are within 100 km of each other; we are able to determine provenance at least on that spatial scale. In addition, this method easily distinguishes between natural and synthetic diamonds, as well as between synthetic stones from different laboratories.
Author Contributions
Conceptualization, C.E.M., J.D. and N.J.M.; methodology, C.E.M. and J.D.; software, J.D.; writing—original draft preparation, N.J.M.; writing—review and editing, N.J.M., C.E.M. and J.D.; project administration, J.B.; analysis, J.B. All authors have read and agreed to the published version of the manuscript.
Funding
This research received no external funding.
Acknowledgments
Thanks are given to our industry partners, whose identities are proprietary, for providing samples. Thanks are also given to reviewers whose comments improved the quality of the paper.
Conflicts of Interest
The authors declare no conflict of interest.
References
- KPCS-Core-Document. Available online: www.kimberleyprocess.com/en/kpcs-core-document (accessed on 4 September 2020).
- Tripathi, S. The influence of the Kimberly Process on conflict and natural resource trade in Africa—What can the UN do? In International Law, Conflict and Development: The Emergence of a Holistic Approach in International Affairs; Kälin, W., Voyame, J., Eds.; EBSCO Publishing: Birmingham, AL, USA, 2010; pp. 611–626. [Google Scholar]
- Farah, D. Blood from Stones: The Secret Financial Network of Terror; Broadway Books: Portland, OR, USA, 2004; p. 240. [Google Scholar]
- Campbell, G. Blood Diamonds: Tracing the Deadly Path of the World’s Most Precious Stone; Basic Books: New York, NY, USA, 2012; p. 338. [Google Scholar]
- Selby, S. Why the Kimberly Process Does Not Work and What the Coming Fight Over Man-Made Diamonds Means for the Future of Blood Diamonds. Master’s Thesis, Lund University, Lund, Sweden, 2006. [Google Scholar]
- Ireland, T.R.; Rudnick, R.L.; Spetsius, Z. Trace elements in diamond inclusions from eclogites reveal link to Archean granites. Earth Planet. Sci. Lett. 1994, 128, 199–213. [Google Scholar] [CrossRef]
- Phillips, D.; Harris, J.W. Diamond provenance studies from 40Ar/39Ar dating of clinopyroxene inclusions: An example from the west coast of Namibia. Lithos 2009, 1125, 793–805. [Google Scholar] [CrossRef]
- Damarupurshad, A.; Hart, R.J.; Sellscop, J.P.F.; Meyer, H.O. The application of INAA to the geochemical analysis of single diamonds. J. Rad. Nucl. Chem. 1997, 219, 33–39. [Google Scholar] [CrossRef]
- Harte, B.; Richardson, S. Mineral inclusion in diamonds trace the evolution of a Mesozoic subducted slab beneath West Gondwanaland. Gondwana Res. 2012, 21, 236–245. [Google Scholar] [CrossRef]
- Harte, B. Diamond formation in the deep mantle: The record of mineral inclusions and their distribution in relation to mantle dehydration zones. Min. Mag. 2010, 74, 189–215. [Google Scholar] [CrossRef] [Green Version]
- Phillips, D.; Harris, J.W.; Kiviets, G.B. 40Ar/39Ar analyses of clinopyroxene inclusions in African diamonds: Implications for source ages of detrital diamonds. Geoch. Cosmoch. Acta 2004, 68, 151–165. [Google Scholar] [CrossRef]
- Pearson, D.G.; Shirey, S.B.; Harris, J.W.; Carlson, R.W. Sulphide inclusions in diamonds from the Koffiefontein kimberlite, S Africa: Constraints on diamond ages and mantle Re-Os systematics. Earth Plan. Sci. Lett. 1998, 160, 311–326. [Google Scholar] [CrossRef]
- Stachel, T.; Harris, J.W. The origin of cratonic diamonds—Constraints from mineral inclusions. Ore Geol. Rev. 2008, 34, 5–32. [Google Scholar] [CrossRef]
- Shirey, S.B.; Harris, J.W.; Richardson, S.H.; Fouch, M.; James, D.E.; Cartigny, P.; Deines, P.; Viljoen, F. Regional patterns in the paragenesis and age of inclusions in diamond, diamond composition, and the lithospheric seismic structure of Southern Africa. Lithos 2003, 71, 243–258. [Google Scholar] [CrossRef]
- Svisero, D.P. Distribution and origin of diamonds in Brazil: An overview. J. Geodyn. 1995, 20, 493–514. [Google Scholar] [CrossRef]
- Weiss, Y.; Griffin, W.L.; Navon, O. Diamond-forming fluids in fibrous diamonds: The trace-element perspective. Earth Planet. Sci. Lett. 2013, 376, 110–125. [Google Scholar] [CrossRef]
- Craven, J.A.; Harte, B.; Fisher, D.; Schulze, D.J. Diffusion in diamond. I. Carbon isotope mapping of natural diamond. Min. Mag. 2009, 73, 193–200. [Google Scholar] [CrossRef] [Green Version]
- Howell, D.; Stern, R.A.; Griffin, W.L.; Southworth, R.; Mikhail, S.; Stachel, T. Nitrogen isotope systematics and origins of mixed-habit diamonds. Geoch. Cosmoch. Acta 2015, 157, 1–12. [Google Scholar] [CrossRef]
- Deines, P. The carbon isotopic composition of diamonds: Relationship to diamond shape, color, occurrence and vapor composition. Geoch. Cosmoch. Acta 1980, 44, 943–961. [Google Scholar] [CrossRef]
- Cartigny, P.; Marty, B. Nitrogen isotopes and mantle geodynamics: The emergence of life and the atmosphere-crust-mantle connection. Elements 2013, 9, 359–366. [Google Scholar] [CrossRef]
- Taylor, W.R.; Jaques, A.L.; Ridd, M. Nitrogen-defect aggregation characteristics of some Australasian diamonds: Time-temperature constraints on the source regions of pipe and alluvial diamonds. Am. Min. 1990, 75, 1290–1310. [Google Scholar]
- Mendelssohn, M.J.; Milledge, H.J. Geologically significant information from routine analysis of the mid-infrared spectra of diamonds. Internat. Geol. Rev. 1995, 37, 95–110. [Google Scholar] [CrossRef]
- Hutchinson, M.T.; Frei, D. Kimberlite and related rocks from Garnet Lake, West Greenland, including their mantle constituents, diamond occurrence, age and provenance. Lithos 2009, 1125, 318–333. [Google Scholar] [CrossRef]
- Coney, L.; Moila, A.V.; Quadline, A.G. Gem-quality diamonds: Source discrimination. S. Afr. J. Geol. 2012, 115, 33–46. [Google Scholar] [CrossRef]
- Howell, D.; Griffin, W.L.; Pearson, N.J.; Powell, W.; Wieland, P.; O’Reilly, S.Y. Trace element partitioning in mixed-habit diamonds. Chem. Geol. 2013, 355, 134–143. [Google Scholar] [CrossRef]
- Nadolinny, V.; Yelisseyev, A. New paramagnetic centres containing nickel ions in diamond. Diam. Relat. Mater. 1993, 3, 17–21. [Google Scholar] [CrossRef]
- Nadolinny, V.; Yelisseyev, A. Structure and creation conditions of complex nitrogen-nickel defects in synthetic diamonds. Diam. Relat. Mater. 1994, 3, 1196–1200. [Google Scholar] [CrossRef]
- Lal, S.; Dallas, T.; Yi, S.; Gangopadhyay, S.; Holtz, M. Defect photoluminescence in polycrystalline diamond films grown by arc-jet chemical-vapor deposition. Phys. Rev. B 1996, 54, 13428–13431. [Google Scholar] [CrossRef] [PubMed]
- Lawson, S.C.; Kanda, H.; Watanabe, K.; Kiflawi, I.; Sato, Y. Spectroscopic study of cobalt-related optical centers in synthetic diamond. J. Appl. Phys. 1995, 79, 4348–4357. [Google Scholar] [CrossRef]
- Kupriyanov, I.N.; Gusev, V.A.; Borozdov, Y.M.; Kalinin, A.A.; Palyanov, Y.N. Photoluminescence study of annealed nickel and nitrogen-containing synthetic diamond. Diam. Relat. Mater. 1999, 8, 1301–1309. [Google Scholar] [CrossRef]
- Komarovskikh, A.; Nadolinny, V.; Plyusisn, V.; Palyanov, Y. Photoluminescence of HPHT diamonds synthesized in the Mg-Ge-C system. Diam. Relat. Mater. 2017, 79, 145–149. [Google Scholar] [CrossRef]
- Nadolinny, V.A.; Yelisseyev, A.P.; Baker, J.M.; Newton, M.E.; Twitchen, D.J.; Lawson, S.C.; Yuryeva, O.P.; Feigelson, B.N. A study of 13C hyperfine structure in the EPR of nickel-nitrogen-containing centres in diamond and correlation with their optical properties. J. Phys. Condens. Matter 1999, 11, 7357–7376. [Google Scholar] [CrossRef]
- Nadolinny, V.A.; Yelisseyev, A.P.; Baker, J.M.; Twitchen, D.J.; Newton, M.E.; Lawson, S.C.; Feigelson, B.N.; Yuryeva, O.P. Mechanisms of nitrogen aggregation in nickel- and cobalt-containing synthetic diamonds. Diam. Relat. Mater. 2000, 9, 883–886. [Google Scholar] [CrossRef]
- Nadolinny, V.; Komarovskikh, A.; Palyanov, Y. Incorporation of large impurity atoms into the diamond crystal lattice: EPR of split-vacancy defects in diamond. Crystals 2017, 7, 237. [Google Scholar] [CrossRef]
- Iakoubovskii, K.; Stesmans, A. Characterization of defects in as-grown CVD diamond films and HPHT diamond powders by electron paramagnetic resonance. Phys. Stat. Sol. 2001, 186, 199–206. [Google Scholar] [CrossRef]
- Gildenblat, G.S.; Grot, S.A.; Badzian, A. The electrical properties and device applications of homoepitaxial and polycrystalline diamond films. Proc. IEEE 1999, 79, 647–667. [Google Scholar] [CrossRef]
- Foulkes, S.E.; Carelse, C.B. Physical and chemical characteristics of nine diamond parcels from the Central African Republic—Is source discrimination possible? In Proceedings of the 35th International Geologic Conference, 27 August–4 September 2016; p. 554. [Google Scholar]
- Cremers, D.; Radzeimski, L. Handbook of Laser-Induced Breakdown Spectroscopy; John Wiley and Sons, Ltd.: Hoboken, NJ, USA, 2006. [Google Scholar]
- Bolskakov, A.A.; Mao, X.; Jain, J.; McIntyre Russo, R.E. Laser ablation molecular isotopic spectrometry of carbon isotopes. Spectroch. Acta B 2015, 113, 106–112. [Google Scholar] [CrossRef] [Green Version]
- Serrano, J.; Moros, J.; Laserna, J.J. Sensing signatures mediated by chemical structure of molecular solids in laser-induced plasmas. Anal. Chem. 2015, 87, 2794–2801. [Google Scholar] [CrossRef] [PubMed]
- Haggerty, S.E. Carbonado: Physical and chemical properties, a critical evaluation of proposed origins, and a revised genetic model. Earth Sci. Rev. 2014, 130, 49–72. [Google Scholar] [CrossRef]
- McManus, C.E.; Dowe, J.; McMillan, N.J. Quantagenetics® analysis of laser-induced breakdown spectroscopic data: Rapid and Accurate authentication of materials. Spectrochim. Acta Part B 2018, 145, 79–85. [Google Scholar] [CrossRef]
- Everitt, B. Cluster Analysis, 5th ed.; Wiley InterScience: Hoboken, NJ, USA, 2011; p. 330. [Google Scholar]
- McManus, C.E.; Dowe, J.W., III; Likes, T.M.; Dowe, J.W., IV. Methods and Systems for Analyzing Samples. U.S. Patent 8,699,022, 15 April 2014. [Google Scholar]
- McManus, C.E.; Dowe, J.W., III; Likes, T.M.; Dowe, J.W., IV. Methods and Systems for Analyzing Samples. US Patent 9,063,085, 23 June 2015. [Google Scholar]
- Multari, R.A.; Cremers, D.A.; Dupre, J.M.; Gustafson, J.E. The use of laser-induced breakdown spectroscopy (LIBS) for distinguishing between bacterial pathogen species and strains. Appl. Spectrosc. 2010, 64, 750–759. [Google Scholar] [CrossRef] [Green Version]
- Kochelek, K.A.; McMillan, N.J.; McManus, C.E.; Daniel, D.L. Provenance determination of sapphires and rubies using Laser-Induced Breakdown Spectroscopy and multivariate analysis. Am. Min. 2015, 100, 1921–1931. [Google Scholar] [CrossRef]
- Pearse, R.W.B.; Gaydon, A.G. The Identification of Molecular Spectra, 4th ed.; John Wiley & Sons, Inc.: Hoboken, NJ, USA, 1976; p. 407. [Google Scholar]
- Shigley, J.E.; Shor, R.; Padua, P.; Breeding, C.M.; Shirey, S.B.; Ashbury, D. Mining diamonds in the Canadian arctic: The Diavik Mine. Gems Gemol. 2016, 52, 104–131. [Google Scholar] [CrossRef]
- Berger, S.D.; Pennycook, S.J. Detection of nitrogen at {100} platelets in diamond. Nature 1982, 298, 635–637. [Google Scholar] [CrossRef]
Figure 1.
Representative laser-induced breakdown spectroscopy (LIBS) spectra for synthetic diamonds (A) and natural diamonds (B) used in this study. The positions of major elemental and molecular peaks are marked with dashed lines. Boxes outline C–N and C–C molecular peak groups. Spectra are plotted with arbitrarily raised baselines to enhance visibility.

Figure 2.
C–N emission peaks (A) and C–C emission peaks (B) for natural and synthetic representative LIBS diamond spectra illustrated in Figure 1. Spectra are plotted with arbitrarily raised baselines to enhance visibility.
Figure 2.
C–N emission peaks (A) and C–C emission peaks (B) for natural and synthetic representative LIBS diamond spectra illustrated in Figure 1. Spectra are plotted with arbitrarily raised baselines to enhance visibility.

Figure 3.
Principal component (PC) 1 loading plot of PCA of diamond LIBS spectra with elemental and molecular peaks labeled.
Figure 3.
Principal component (PC) 1 loading plot of PCA of diamond LIBS spectra with elemental and molecular peaks labeled.

Figure 4.
Partial least squares regression (PLSR) decision tree for multivariate model of diamond provenance. Numbers in italics indicate the success rate for each model.
Figure 4.
Partial least squares regression (PLSR) decision tree for multivariate model of diamond provenance. Numbers in italics indicate the success rate for each model.

Figure 5.
PCA score plots of groups of diamond spectra, assessing heterogeneity. (A) RUS 2 placer deposit. (B) RUS 3 placer deposit. (C) CAN 2 and CAN 3 are kimberlites within 100 km of each other.
Figure 5.
PCA score plots of groups of diamond spectra, assessing heterogeneity. (A) RUS 2 placer deposit. (B) RUS 3 placer deposit. (C) CAN 2 and CAN 3 are kimberlites within 100 km of each other.


Table 1.
Samples used in this study and provenance prediction results.
| Mine | Country | Lithology or Method |
|---|---|---|
| AUS 1 | Australia | Lamproite |
| RUS 1 | Russia | Unknown |
| RUS 2 | Russia | Placer |
| BRZ | Brazil | Carbonado |
| CAN 1 | Canada | Unknown |
| SYN 1 | Synthetic | HPHT |
| DRC | Democratic Republic of Congo | Unknown |
| CAN 2 | Canada | Kimberlite |
| CAN 3 | Canada | Kimberlite |
| AUS 2 | Australia | Lamproite |
| SYN 2 | Synthetic | CVD-HPHT |
| SLE | Sierra Leone | Kimberlite |
| RUS 3 | Russia | Placer |
| RUS 4 | Russia | Kimberlite |
AUS = Australia, BRZ = Brazil, CAN = Canada, DRC = Democratic Republic of Congo, RUS = Russia, SLE = Sierra Leone, SYN = Synthetic. HPHT = High-Pressure High-Temperature Method. CVD-HPHT = Chemical Vapor Deposition followed by HPHT. Accuracy is the percent of true positive plus true negative predictions of the total number of predictions.
Table 2.
Provenance prediction results.
| Mine | Lithology or Method | True Positive | False Positive | False Negative | True Negative | Accuracy (%) |
|---|---|---|---|---|---|---|
| AUS 1 | Lamproite | 218 | 12 | 9 | 2922 | 99.3 |
| RUS 1 | Unknown | 208 | 25 | 26 | 2902 | 98.4 |
| RUS 2 | Placer | 172 | 54 | 41 | 2894 | 97.0 |
| BRZ | Carbonado | 206 | 26 | 20 | 2909 | 98.5 |
| CAN 1 | Unknown | 223 | 8 | 25 | 2905 | 99.0 |
| SYN 1 | HPHT | 231 | 0 | 0 | 2930 | 100.0 |
| DRC | Unknown | 152 | 3 | 5 | 3001 | 99.7 |
| CAN 2 | Kimberlite | 230 | 4 | 8 | 2919 | 99.6 |
| CAN 3 | Kimberlite | 196 | 35 | 37 | 2893 | 97.7 |
| AUS 2 | Lamproite | 184 | 48 | 44 | 2885 | 97.1 |
| SYN 2 | CVD-HPHT | 226 | 1 | 0 | 2934 | 100.0 |
| SLE | Kimberlite | 189 | 42 | 17 | 2913 | 98.1 |
| RUS 3 | Placer | 176 | 56 | 77 | 2852 | 95.8 |
| RUS 4 | Kimberlite | 220 | 16 | 21 | 2904 | 98.8 |
AUS = Australia, BRZ = Brazil, CAN = Canada, DRC = Democratic Republic of Congo, RUS = Russia, SLE = Sierra Leone, SYN = Synthetic. HPHT = High-Pressure High-Temperature Method. CVD-HPHT = Chemical Vapor Deposition followed by HPHT. Accuracy is the percent of true positive plus true negative predictions of the total number of predictions.
Publisher’s Note: MDPI stays neutral with regard to jurisdictional claims in published maps and institutional affiliations. |
© 2020 by the authors. Licensee MDPI, Basel, Switzerland. This article is an open access article distributed under the terms and conditions of the Creative Commons Attribution (CC BY) license (http://creativecommons.org/licenses/by/4.0/).
Share and Cite
MDPI and ACS Style
McManus, C.E.; McMillan, N.J.; Dowe, J.; Bell, J. Diamonds Certify Themselves: Multivariate Statistical Provenance Analysis. Minerals 2020, 10, 916. https://0-doi-org.brum.beds.ac.uk/10.3390/min10100916
AMA Style
McManus CE, McMillan NJ, Dowe J, Bell J. Diamonds Certify Themselves: Multivariate Statistical Provenance Analysis. Minerals. 2020; 10(10):916. https://0-doi-org.brum.beds.ac.uk/10.3390/min10100916
Chicago/Turabian StyleMcManus, Catherine E., Nancy J. McMillan, James Dowe, and Julie Bell. 2020. "Diamonds Certify Themselves: Multivariate Statistical Provenance Analysis" Minerals 10, no. 10: 916. https://0-doi-org.brum.beds.ac.uk/10.3390/min10100916
Note that from the first issue of 2016, this journal uses article numbers instead of page numbers. See further details here.