Mineralogical and Thermal Characterization of Kaolinitic Clays from Terra Alta (Catalonia, Spain)


1
Departament de Mineralogia, Petrologia i Geologia Aplicada, Universitat de Barcelona, Carrer Martí i Franquès s/n, 08028 Barcelona, Spain
2
Departament d’Enginyeria Minera, Industrial i TIC, Universitat Politècnica de Catalunya Barcelona Tech, Av. Bases de Manresa 61-63, 08242 Manresa, Spain
3
Departament de Biologia Evolutiva, Ecologia i Ciències Ambientals, Universitat de Barcelona, Av. Diagonal 643, 08028 Barcelona, Spain
*
Author to whom correspondence should be addressed.
Minerals 2020, 10(2), 142; https://0-doi-org.brum.beds.ac.uk/10.3390/min10020142
Submission received: 30 December 2019
/
Revised: 29 January 2020
/
Accepted: 31 January 2020
/
Published: 7 February 2020
(This article belongs to the Special Issue Industrial Minerals)
Abstract
:This research characterizes the kaolinitic clays from Cretaceous–Paleocene lateritic deposits of Terra Alta (south Catalonia) to evaluate their possible applications. The outcrops and quarries belong to the Horta de Sant Joan and Pinell de Brai areas. The chemical composition, mineralogy, rheological behavior, particle size distribution and plasticity are determined. The Fe and Ti4+ contents prevent them from being directly used as raw material for white ceramics. The mineralogy consists of kaolinite with quartz, illite, hematite, and minor K-feldspar and calcite. Most of the area comprises medium plastic clays that are classified as fired clays and can be used as ceramic and construction materials. In Horta de Sant Joan, a kaolinitic-rich level, up to 75 wt % of kaolinite, is highly crystalline with low plasticity and can be classified as flint clay, useful as a refractory clay. The evaluated kaolinitic clays can also be used to obtain a triaxial ceramic when they are mixed with feldspar to act as a fluxing agent and chamotte.
1. Introduction
Kaolin is highly important for industry, especially due to its specific properties that benefit a large number of applications [1,2,3]. Kaolin mining started in the Neolithic, when people discovered its suitability for painting; previously, the miners had transformed this raw material into a form that could be more readily applied to surfaces [4]. Nowadays, most of this raw material is employed for papermaking [5], but also another common application is in the manufacture of whiteware ceramics, because of its excellent firing properties and relatively high melting point. Kaolin has many other specific applications depending on its properties, such as for pharmaceutical and medical applications, due to its fine grain size, adsorptive properties and whiteness [6].
Industrially, kaolin is a clay composed mainly of kaolinite or other related clay minerals. A technological classification of kaolinitic clays according to their possible applications distinguishes between ball clays, brick clays, fire or refractory clays, flint clays, bloating clays and underclays [7]. Other classifications include more classes, such as light-firing clays, low-grade kaolins, high-grade kaolins, raw kaolins, kaolinitic loams, ball clays and dark-firing clays [8].
To determine the optimal usability of clays, it is necessary to know their chemical and mineralogical composition [9], because they are responsible for the characteristics and properties of the final product. Industrial ceramic processes use different raw materials (triaxial ceramics composition), each component contributing to the properties of the final product.
Formerly, a source of income for the inhabitants of the region of Terra Alta (south Catalonia, Spain) was pottery and the exploitation of refractory clays. This is because, in this area, several deposits of lateritic clays could be found. In some cases they were exploited by underground mining, but today only some quarries are still active. The aim of this work is to determine the chemical and mineralogical composition, and technological properties, of the kaolinitic clays found in the region of study to find their optimal applications. These deposits of lateritic clays have been described as bauxitic [10,11], but despite their economic importance, they have not yet been studied in detail.
2. Materials and Methods
2.1. Study Area
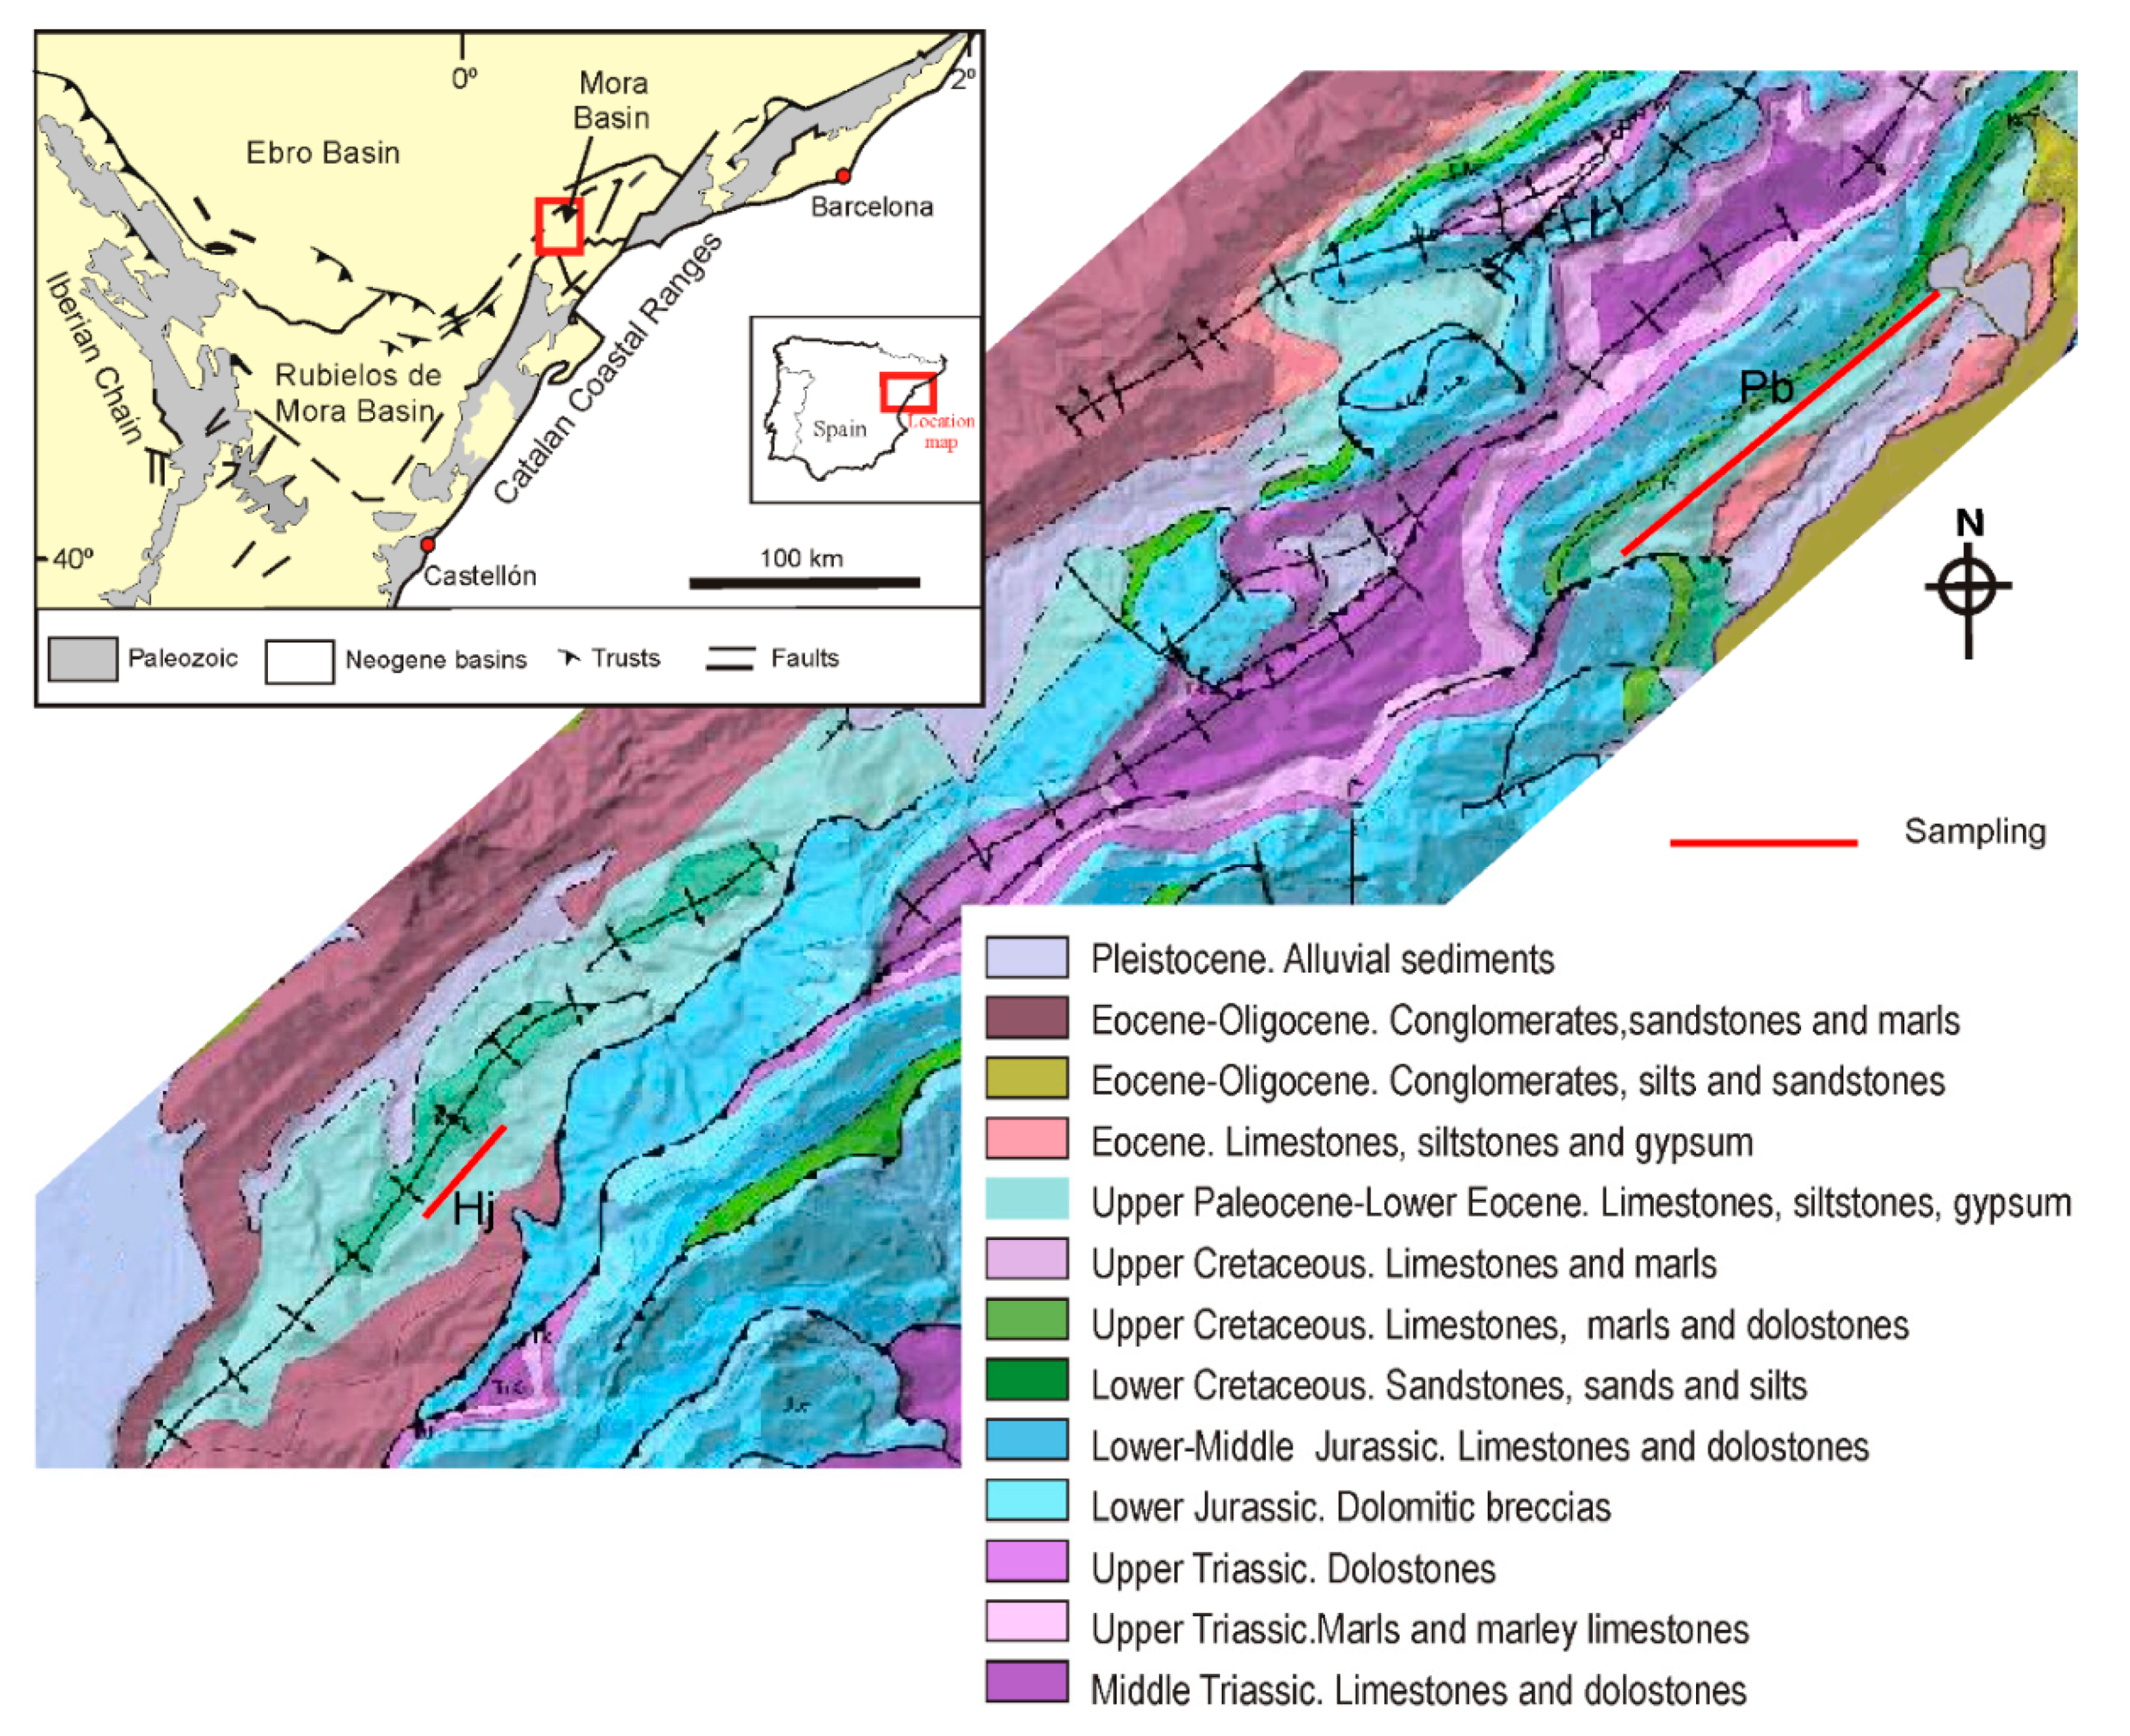
The northeast of the Iberian Peninsula comprises three chains formed in the Alpine orogeny, Pyrenees, Iberian range and Catalan Coastal Ranges. Among them, the Ebro basin was formed and also minor basins were also developed close to these units, such as the Rubielos de Mora and Mora Basins. The Mora Basin is separated from the Ebro Basin by the Cavalls–Pàndols anticline system and runs for 30 km in a northeast-southwest direction, limited by the southernmost mountains of the Catalan Coastal Ranges (Figure 1) [12,13].
In the study area, materials from Mesozoic to Cenozoic ages occur. The Cavalls–Pàndols anticlinorium has the oldest materials, comprising limestones, dolostones and marls of Middle and Upper Triassic age [16]. The Mora Basin is filled by Jurassic carbonated rocks, whereas in the Cretaceous, detrital sediments are also abundant, with sandstones and silts. The Upper Cretaceous is characterized by limestones and marls with the development of lateritic clays.
These materials are discordantly overlain by Paleogene limestones followed by silts and gypsum. This unit is followed by conglomerates and breccias that extensively outcrop in Pinell de Brai, where they are thrusted by Upper Triassic and Lower Jurassic materials. Finally, it is locally covered by another unit of conglomerates, silts and sandstones.
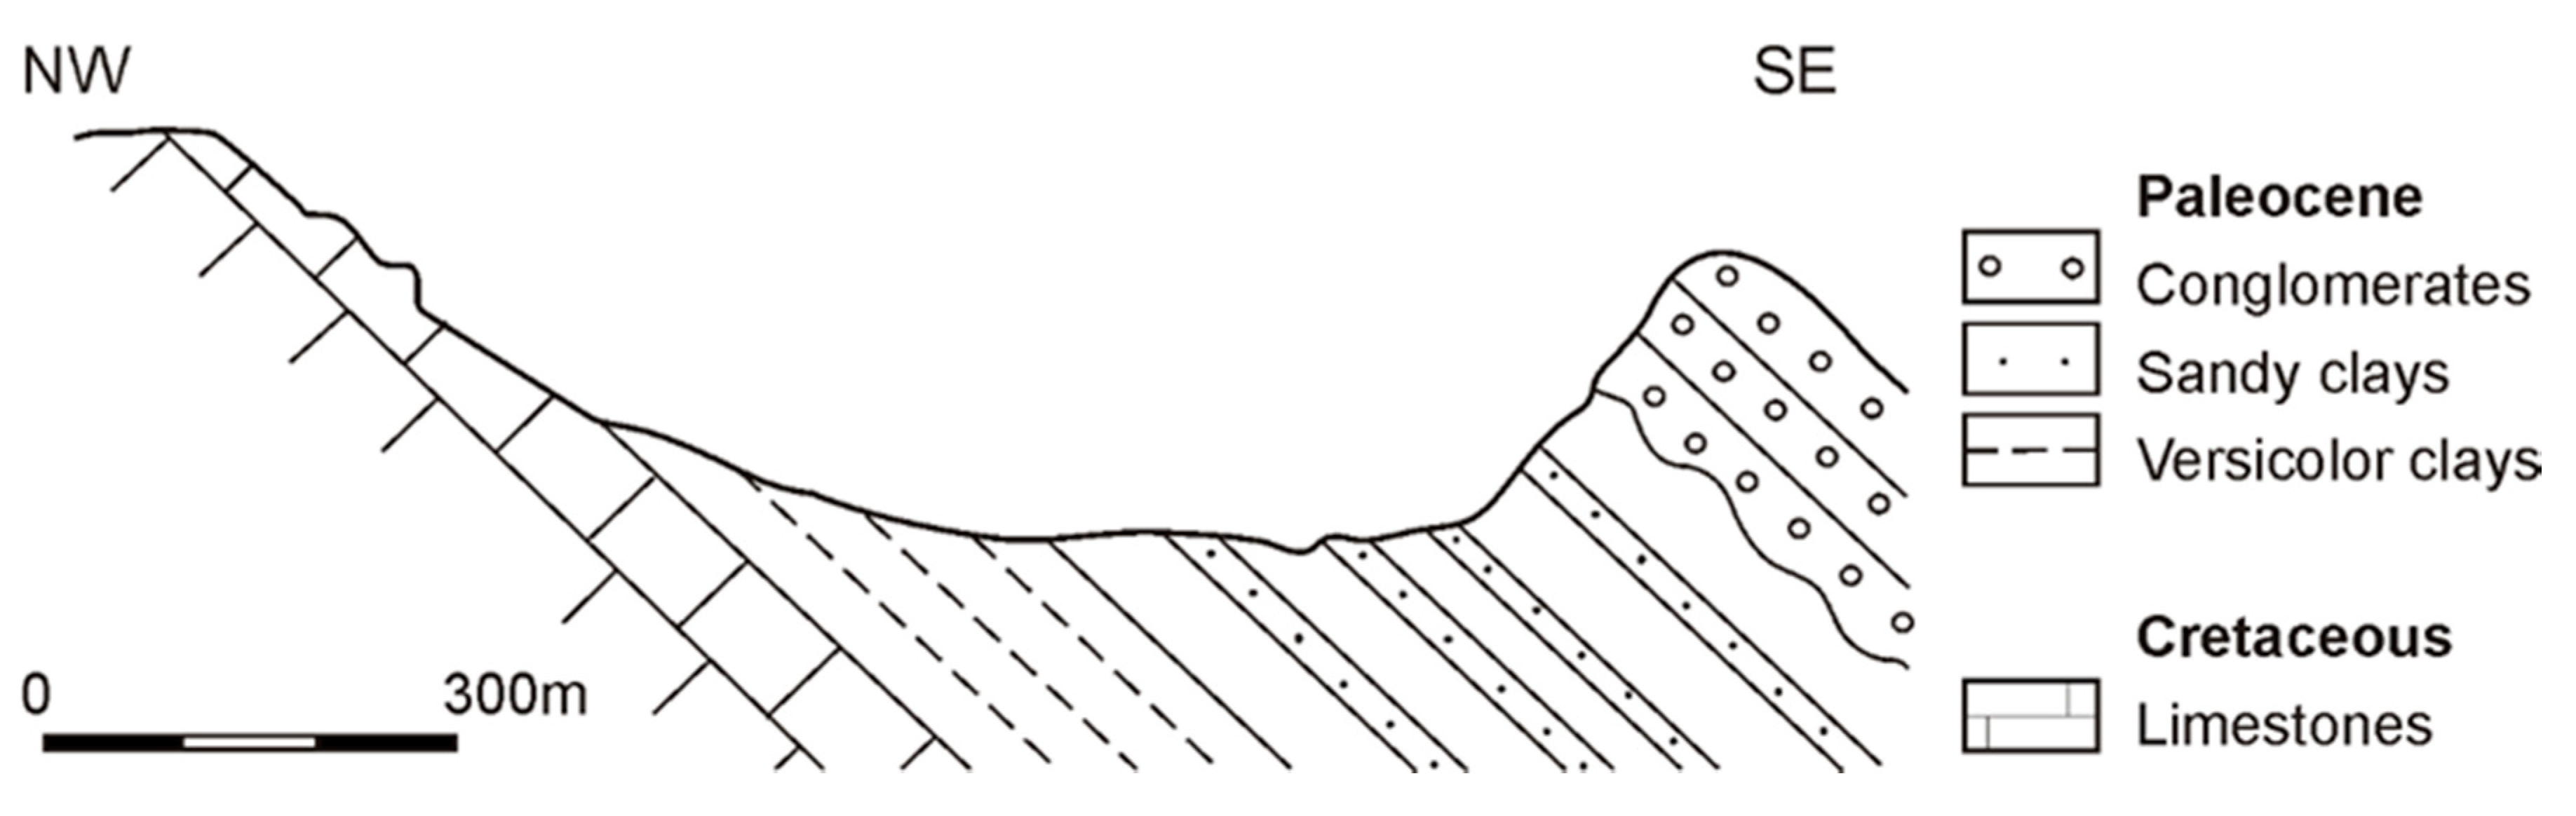
Several deposits of bauxitic and kaolinitic materials occur in the contact between the Cretaceous and Paleocene rocks in the basins located close to the Ebro Basin, such as in the Priorat region [17,18,19]. This is the case of the Terra Alta kaolinite deposits, which are located in a NE–SW fringe of 20 km between Horta de Sant Joan and Pinell de Brai towns, along the Mora Basin. The lower part of this unit consists of versicolor clays and upwards sporadic levels of sandstones are interbedded with them. The ensemble is up to 120 m thick, and contains abundant ferruginous nodules, and is followed by a thick sequence of conglomerates (Figure 2).
2.2. Samples
Eighteen samples from the Horta de Sant Joan and Pinell de Brai areas were obtained. Each sample was taken as representative of the unit where it was located. In Horta de Sant Joan there are different exploitation fronts, currently abandoned, and the most important is the Purisima mine, from which 5 kaolinitic layers have been sampled (Hj-1 to Hj-3 in the white kaolinite levels interbedded in the versicolor clays and the Hj-4 and Hj-5 samples from the sandy clay levels).
In the smaller exploitation fronts, kaolinite levels occur within the versicolor clays, and a representative sample of each one was collected (Hj6 to Hj-9). In Pinell de Brai, kaolinitic clays were exploited along a 5-km-long front, the selected samples corresponding to 3 different locations of that front separated by distances of 1 km (Figure 1).
The samples were dried at 50 °C and crushed in a jaw crusher followed by a grinding step in a laboratory mill, up to a maximum size of 800 μm. Subsequently, they were sieved, sorted, and quartered in several fractions to be used for the different tests and analyses.
2.3. Analytical Methods
The chemical composition was obtained by X-ray fluorescence (XRF) using a sequential X-ray PW2400 spectrophotometer (Philips, Amsterdam, The Netherlands) located at the Centres Científics i Tecnològics de la Universitat de Barcelona (CCiT-UB).
Mineralogy was determined by X-ray powder diffraction (XRPD). Measurements were taken using an automatic X’Pert diffractometer (PANalytical, Almelo, The Netherlands) graphite monochromator, automatic gap, Kα-radiation of Cu at λ = 1.54061 Å, powered at 45 kV and 40 mA, scanning range 4–100° with a 0.017° 2θ step scan and a 50 s measuring time. Identification and semi-quantitative evaluation of phases were made on PANanalytical X’Pert HighScore software, Version 2.0.1 (PANanalytical, Almelo, The Netherlands). Calculation of the Hinckley crystallinity index was obtained according to the instructions of Hinkley [20].
The crystallite size of kaolinite was estimated using the Scherrer equation [21]: dhkl = k × λ/(B × cosθ), where dhkl is the crystallite size and corresponds to d[001], k = 0.90, λ = wavelength = 0.15406 nm, B = full width at half maximum, and θ = diffraction angle.
Fourier transform infrared (FTIR) spectra were obtained using a 2000 FTIR spectrometer (Perkin–Elmer System, Waltham, MA, USA). Vibrational spectra were obtained in the 400–4000 cm−1 range.
Back-scattered electron images and qualitative chemical analyses of the kaolin samples were obtained using a Hitachi TM-1000 table-top scanning electron microscope (SEM) (Hitachi, Tokyo, Japan) equipped with an energy dispersive X-ray spectrometer (EDS).
The particle size distribution of the raw materials has been determined by means of an LS 13 320 Coulter particle size analyzer (Beckman, Brea, CA, USA). Before being measured, the samples were treated with sodium pyrophosphate and agitated mechanically for 24 h in order to achieve a total disaggregation.
Plasticity was determinate by the Atterberg limits: liquid limit (LL), plastic limit (PL) and plasticity index (PI), using the Casagrande method [22], following the UNE 7-377-75 [23] and UNE 103-104-93 [24] standards.
Thermal analyses of samples were obtained by simultaneous differential thermal analysis and thermogravimetry (DTA–TG), using a TASCH 414/3 model (Netzsch, Selb, Germany). Analyses were carried out in the temperature range 25–1300 °C under air atmosphere, at a constant flow rate of 80 mL/min, in an alumina (Al2O3) crucible and at a heating rate of 10 °C/min. The amount of sample analyzed was ~85 mg.
The dilatometric curves of the raw samples were measured using a L76/1550 dilatometer (Linseis, Selb, Germany). The experiment was carried out from room temperature to 1300 °C, at a heating rate of 10 °C/min and cooling was registered in a static-air atmosphere.
3. Results and Discussion
3.1. Chemical Composition
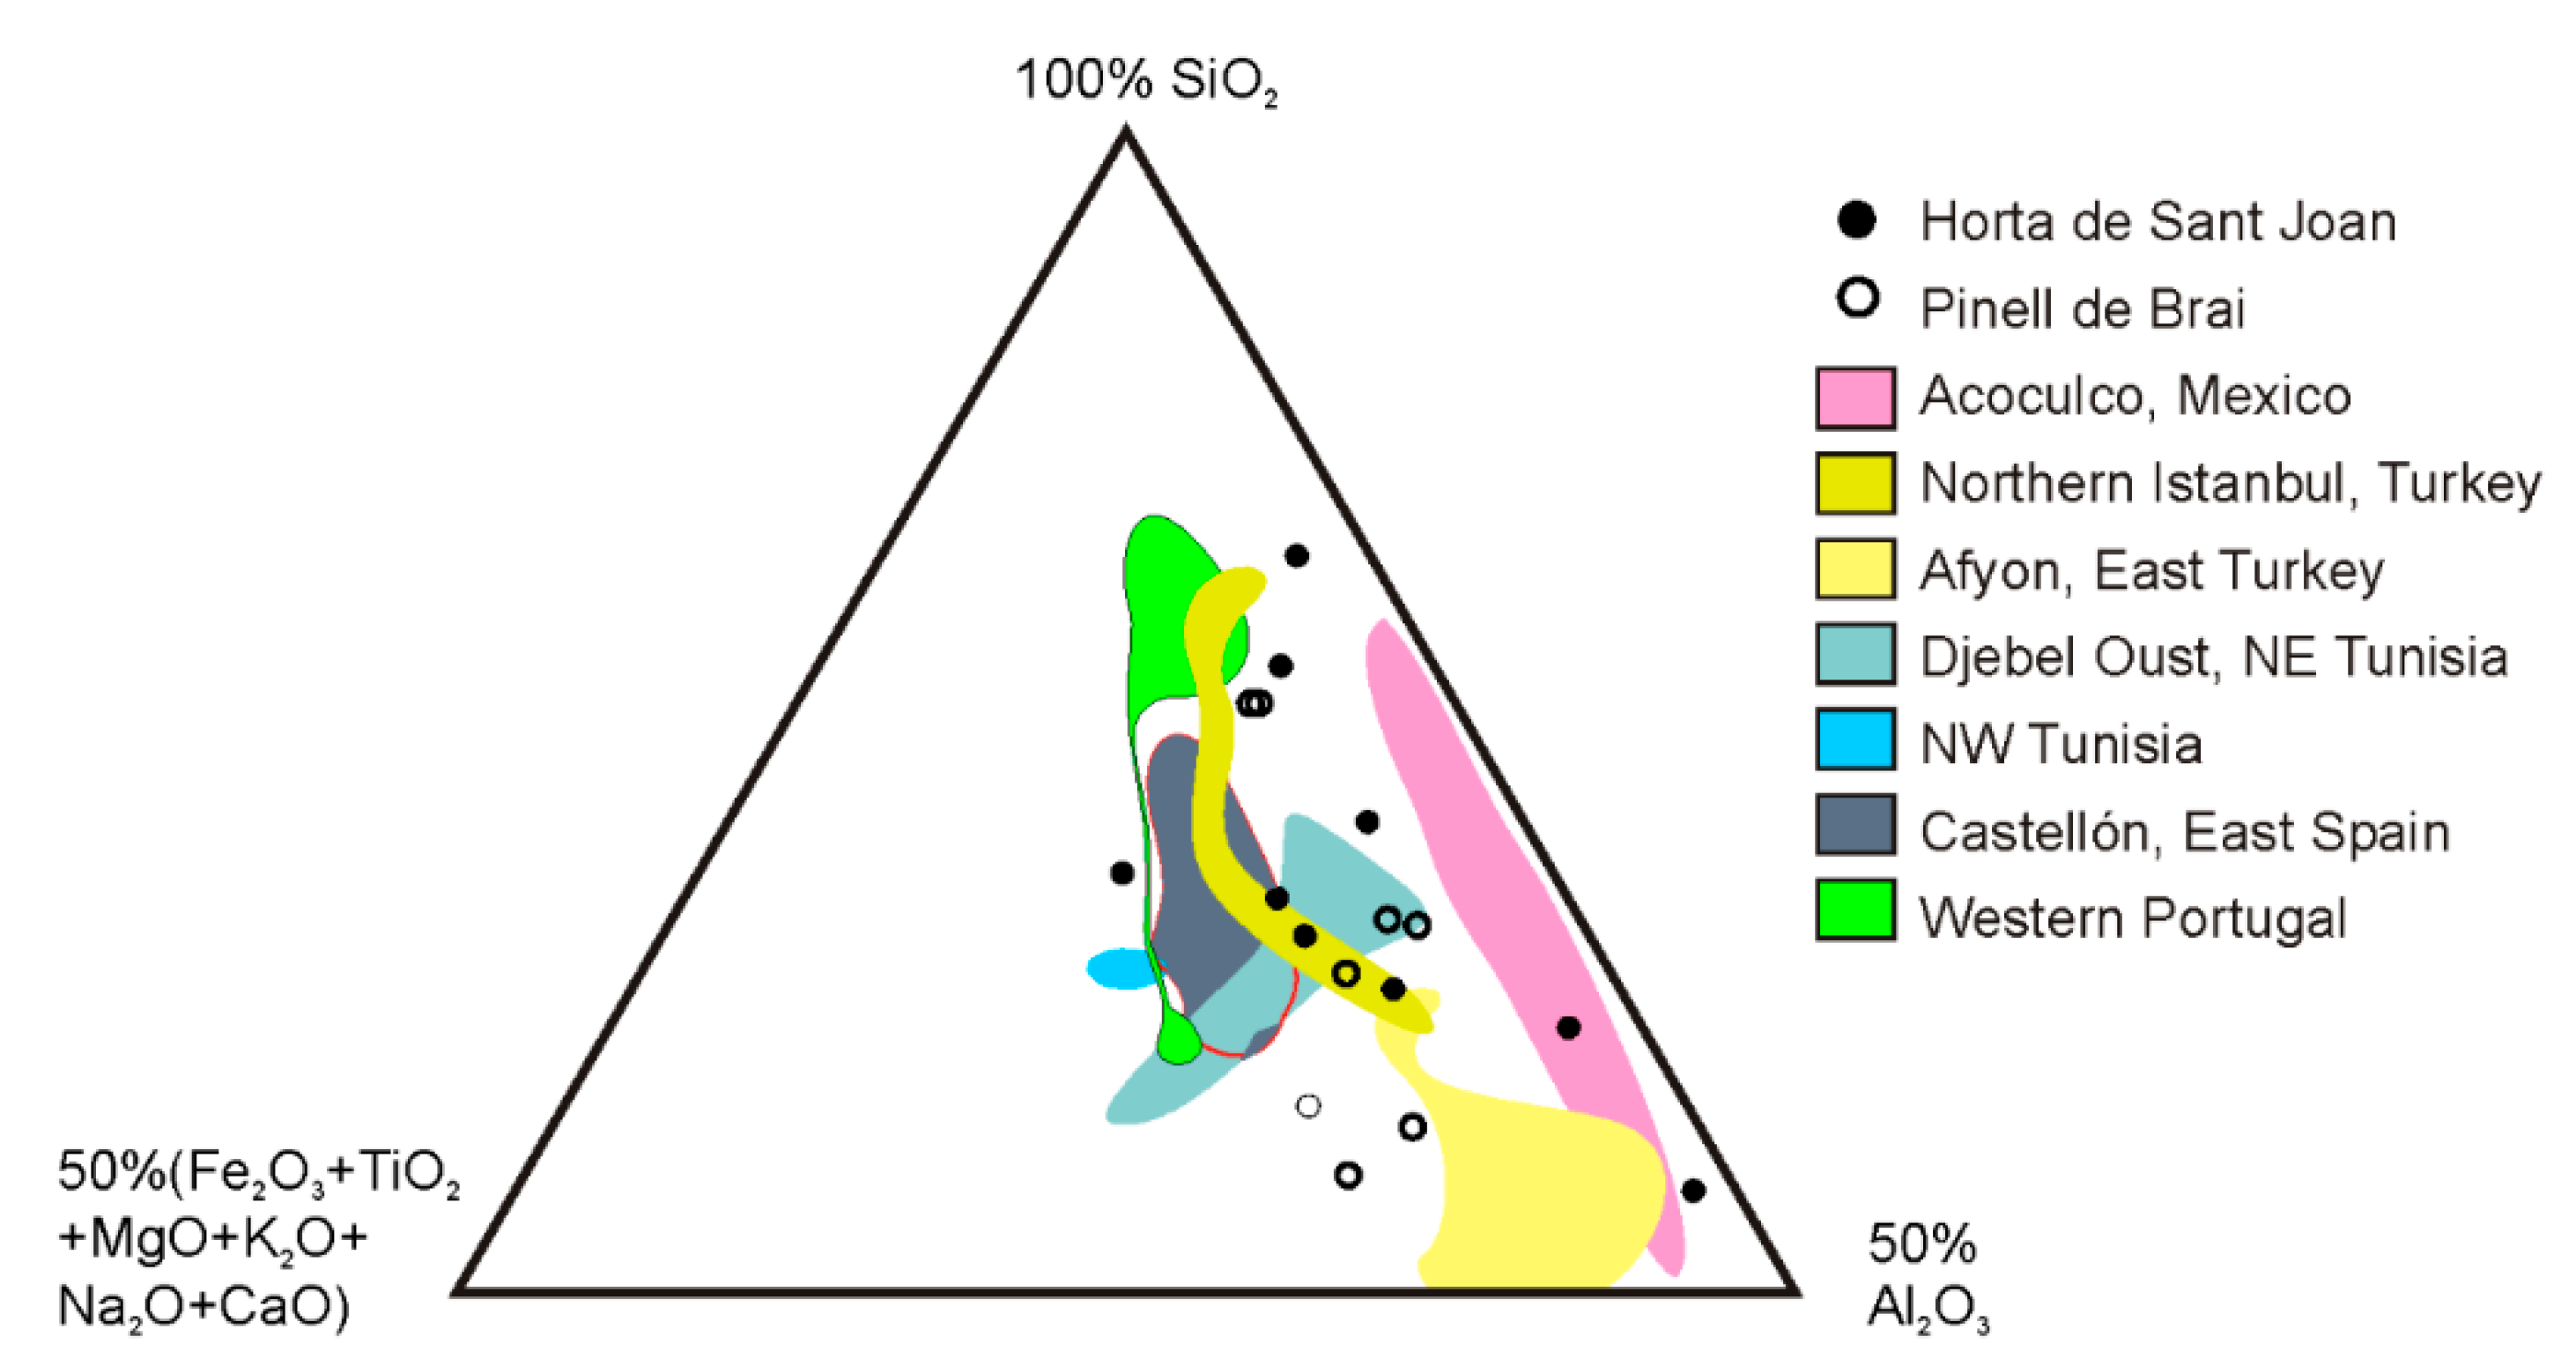
The chemical composition of the studied raw materials is shown in Table 1. The main components are SiO2 and Al2O3, followed by Fe2O3. The amount of CaO and MgO is low, due to the absence of carbonates. In the Horta de Sant Joan zone, the SiO2 content ranges from 46.79 to 75.02 wt %, Al2O3 varies from 14.39 to 38.11 wt %, in addition to minor amounts of Fe2O3 (0.91 to 12.12 wt %) and TiO2 (0.25 and 1.18 wt %) and lower amounts of Na2O, CaO, MgO, P2O5 and K2O. In the clay levels from the Pinell de Brai area, SiO2 ranges from 48.25 to 69.80 wt %, Al2O3 content ranges from 15.87 to 27.99 wt % and Fe2O3 from 3.47 to 10.39 wt %. Minor components are TiO2, K2O, CaO, P2O5 and MgO, with values below 1 wt %. Most of the analyzed samples from the outcrops can be classified as silico–aluminous clays. This chemical composition is similar to other kaolins with applications in the ceramics industry [25,26,27,28,29,30,31] (Figure 3).
From an industrial point of view, the Al2O3/Fe2O3 ratio could be used to define the possible end uses of the clays in the ceramic paste formulation. If Al2O3/Fe2O3 > 5.5 clays are alumina-rich, with a certain whitish color, so they are useful for manufacturing refractory ceramics. If Al2O3/Fe2O3 < 5.5, they are iron-rich and can be used in the manufacture of building materials (bricks, tiles, etc.) and, occasionally, for yellow-gray tableware.
The color of kaolin is related to mineral inclusions and/or presence of some chromophore elements in the kaolinite crystalline framework [32]. The Fe2O3 and TiO2 contents and the gaseous atmosphere kilns present during firing cause the end color of a ceramic piece. Usually, Fe3+ is present in the octahedral sheet as an isomorphic substitution of octahedral Al3+ [33], and Fe3+ and Ti4+ contents decrease the value of kaolinitic raw materials and their practical applications [34]. Usually, high quality kaolin has low Fe, Ti, and alkaline earths contents. If the Fe3+ and Ti4+ contents are high, in the firing processes ilmenite is formed, which contains these chromophore elements and, thus, produces a dark color. The Terra Alta kaolinitic clays cannot be used as raw materials to formulate white ceramics due their high Fe and Ti contents.
Other oxides (MgO, MnO) also play a role in the color of fired clays [27,35]. Then, it is necessary to upgrade its quality in order to meet the specifications required for whiteware ceramics. Subari and Wahyudi [36] suggest employing a treatment that consists of washing, wet sieving in magnetic ferro-filter equipment and then dissolving with a H2SO4 10% solution to revalue the kaolin by increasing its whiteness. The low contents in Na+, K+, Ca2+ and Mg2+ in the Terra Alta clays made necessary the addition of fluxes to increase vitrification in the ceramic production [37].
The SiO2/Al2O3 mass ratio (Table 1) ranges from 1.23 to 5.21, the lowest values corresponding to the white kaolinite levels interbedded in the versicolor clays of Horta de Sant Joan. The low K2O and Na2O contents involve high-temperature treatments in the paste firing process. Thus, for a triaxial paste formulation, additives rich in these elements are necessary.
3.2. Mineralogical Composition
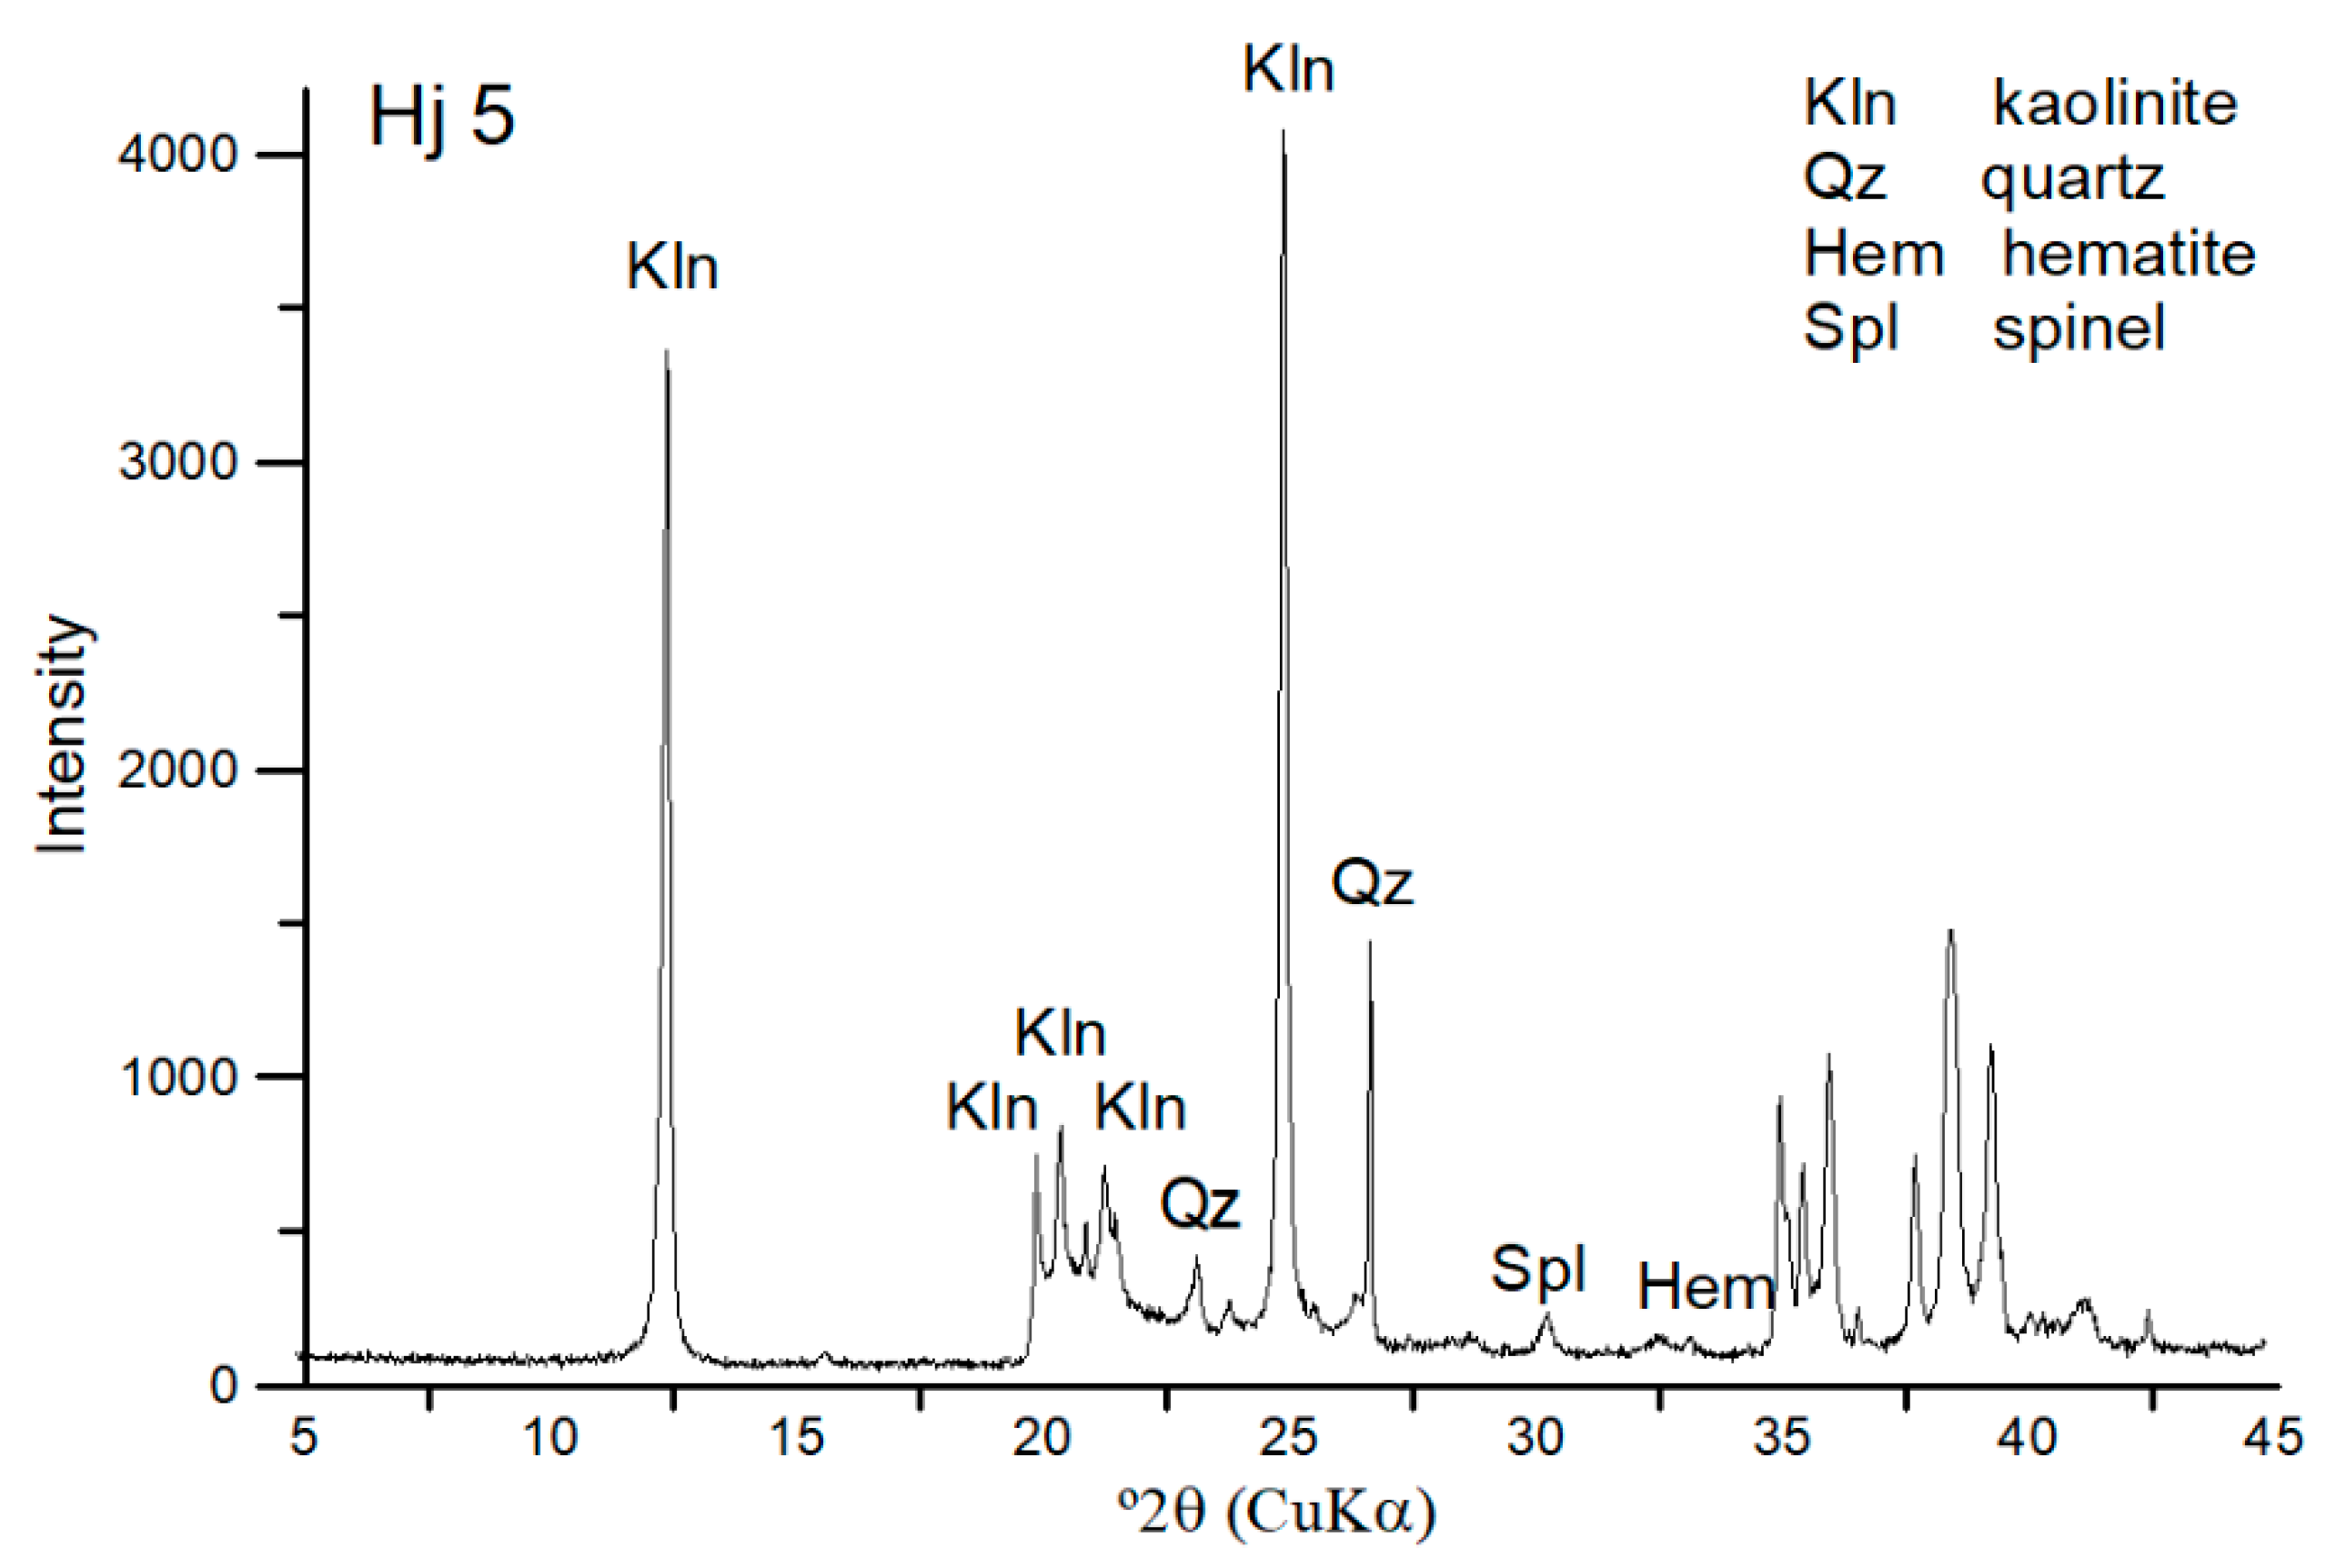
The mineralogical composition of representative samples of the study area is presented in Table 2. Kaolinite and quartz are the most abundant minerals (Figure 4). Other accessory minerals are hematite, K-feldspar, illite and calcite. The crystallite size of kaolinite calculated from the Scherrer equation is about 20–25 nm. In two cases, the size reaches 73 and 100 nm, and the calculated Hinckley index (HI) 1.26 and 1.19, respectively. These high values are typical of a higher crystallinity degree or well-ordered kaolinite [38].
The high SiO2 content correlates with quartz, which plays a role in ceramic production as a degreaser to reduce the plasticity, facilitating the workability. The kaolinite contents in Horta de Sant Joan is highly variable. The highest content, up to 76 wt %, corresponds to the hard and white beds and the low contents to the versicolor clays, which are richer in quartz. Generally, Pinell de Brai clays are more kaolinitic (15–50 wt %). Hematite content varies between 1 and 8 wt % and feldspars around 2–4 wt %, which are admissible values for the formulation of a ceramic paste. Samples with lower content of kaolinite tend to have lower amounts of aluminum and are classified as silicoaluminous clays.
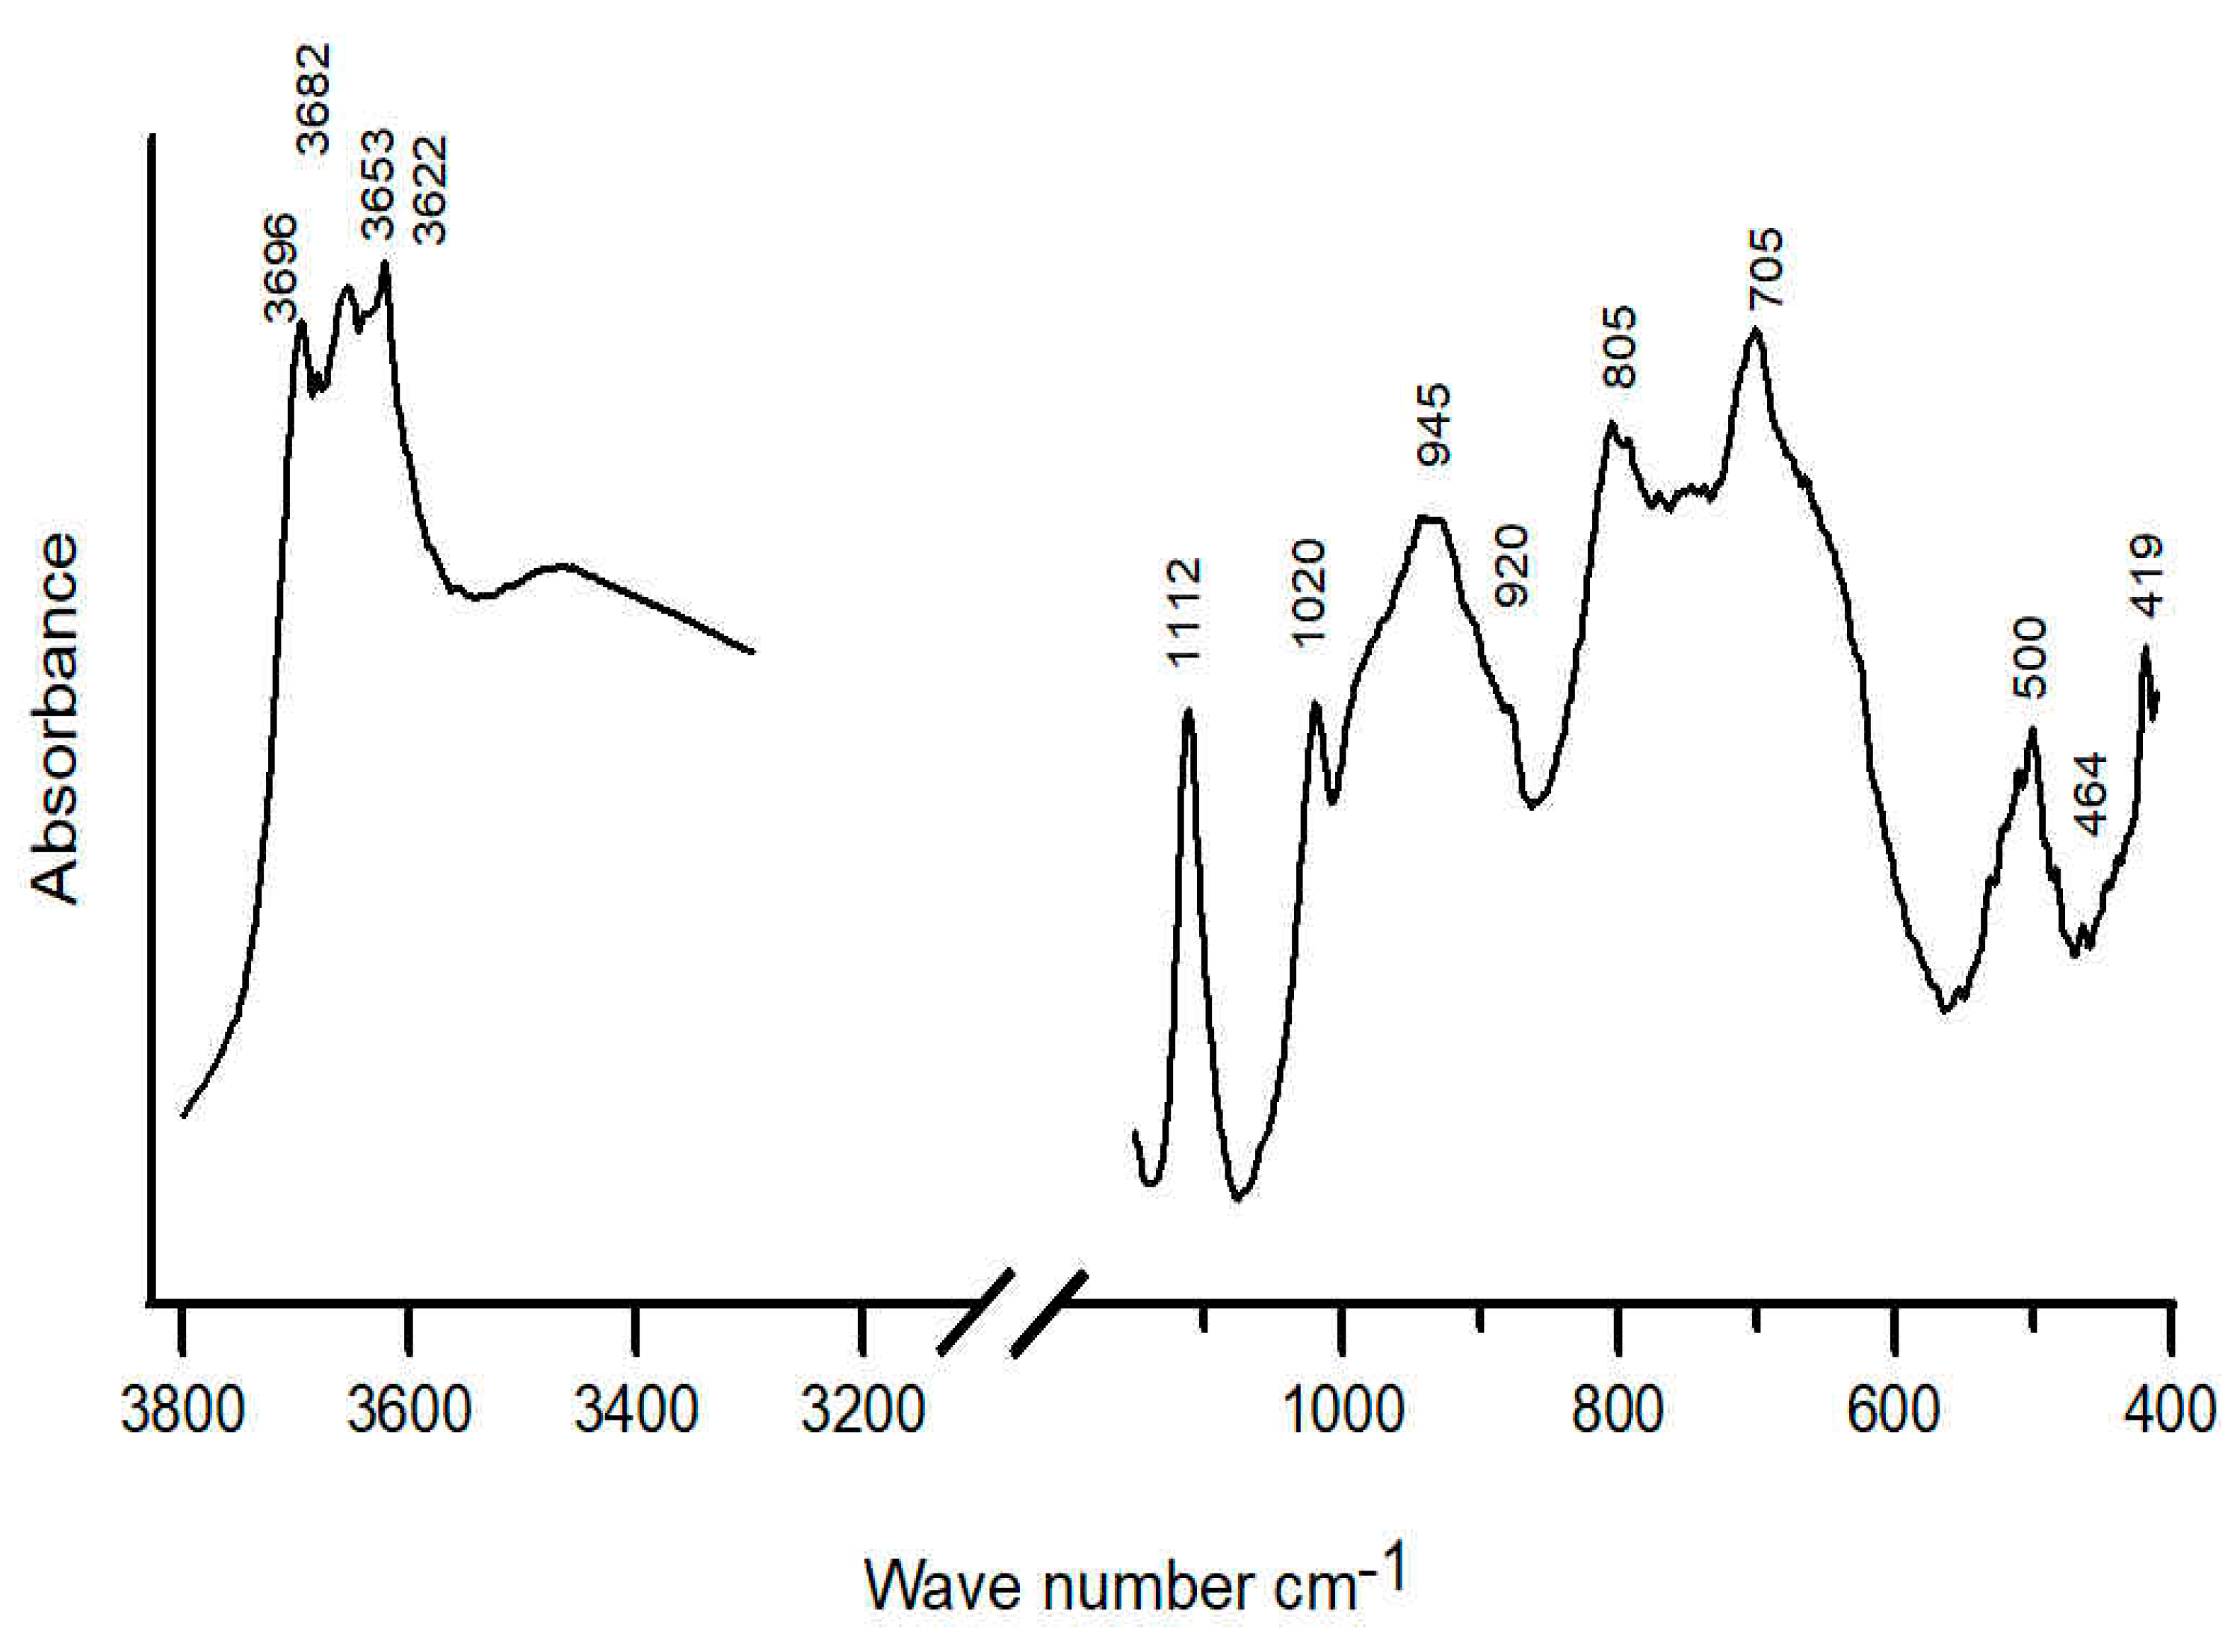
The FTIR spectrum of the uppermost layer of Horta de Sant Joan (Figure 5) presents the typical bands of kaolinite, corresponding to structural bonds: tetrahedral silica (Si–O), octahedral aluminum (Al–O and Al–OH) and SiO4–Al2O3 bonds (Si–O–Al). The positions and assignments of the absorbance bands from the Terra Alta clays has been compared with those from theoretical kaolinite [39] (Table 3).
In the region between 3800 and 3600 cm−1 the most characteristic absorption bands of kaolinite appear, corresponding to structural water and Al–OH stretching vibrations [40,41,42]. These characteristic bands appear at 3696, 3682, 3653 and 3622 cm−1 in sample Hj-5. The first strong band at 3697 cm−1 arises from surface hydroxyls and produces an in-phase vibration perpendicular to the 1:1 layers [40]. The bands 3670 and 3652 cm−1 originated from stretching vibrations that are sub-parallel to the 1:1 layers. The lowest frequency band at 3620 cm−1 corresponds to the fourth inner OH group [43]. The theoretical doublet between 3694 and 3619 cm−1, which appear at 3696 and 3622 cm−1 in these samples, reveals a well-ordered kaolinite structure [44]. Moreover, in the region corresponding to Si–O stretching, located between 945 and 1120 cm−1, the bands at 1112, 1020 and 945 cm−1 occur.
Finally, the absorption bands between 918 and 1200 cm−1 are assigned to Si–O, Al–O stretching modes and OH deformation. The peak at 800 cm−1 is controversial; several authors attributed this vibration to OH deformation [39,45,46,47] or to Si–O [48,49]. In addition, bands around 700 cm−1 were also attributed to Si–O vibrations. The band at 500 cm−1 is related to Si–O–Al stretching and at 464 and 419 cm−1 to Si–O-Si bending vibrations [40].
3.3. Particle Size Distribution
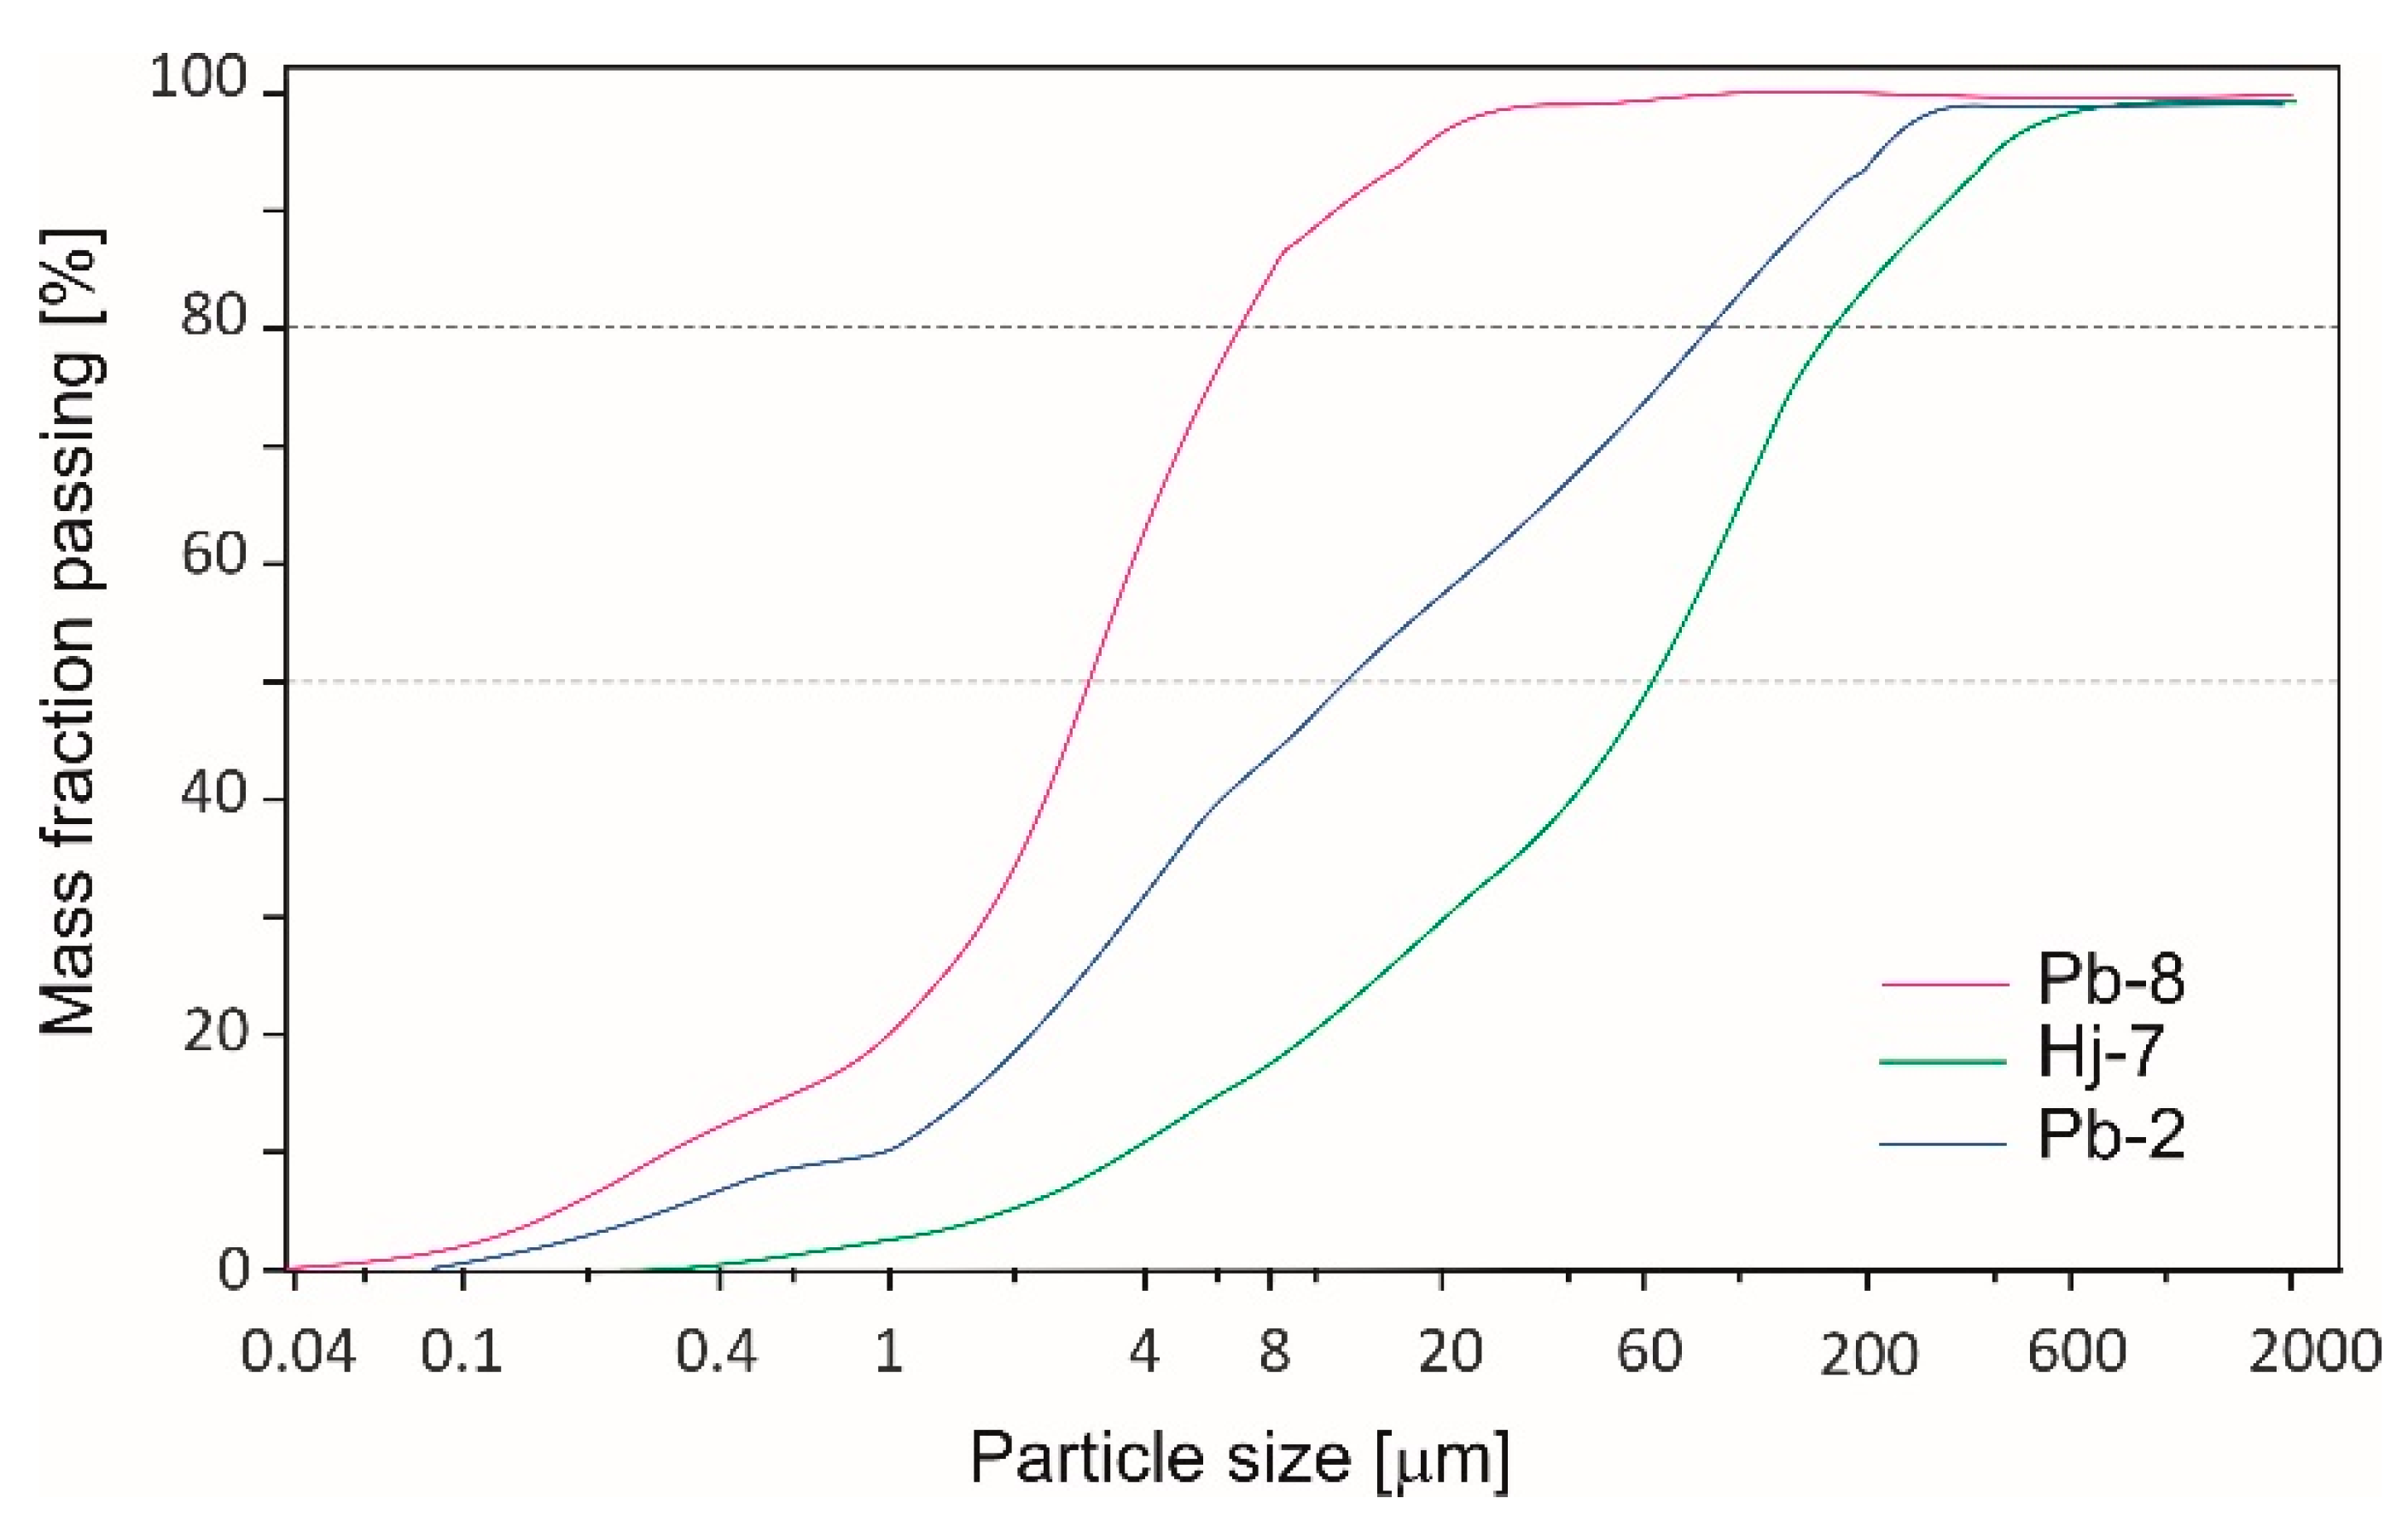
The particle shape and size distribution of kaolin has an important role in controlling other properties such as brightness, viscosity, opacity, ceramic strength and shrinkage [51]. The particle size distribution of clays determines its suitability for different applications, and particular attention should be given to the fraction below 2 μm for ceramic products [28].
This study confirms that most of the investigated materials have particles with a size smaller than 100 μm, especially those of Pinell de Brai, which are characterized by an abundance of particles of size between 2 and 6 μm. The richest level in kaolinite of Pinell de Brai, which contains 50% of kaolinite, has about 50% of particles below 2 μm (Figure 7).
3.4. Rheological Properties
3.4.1. Plasticity
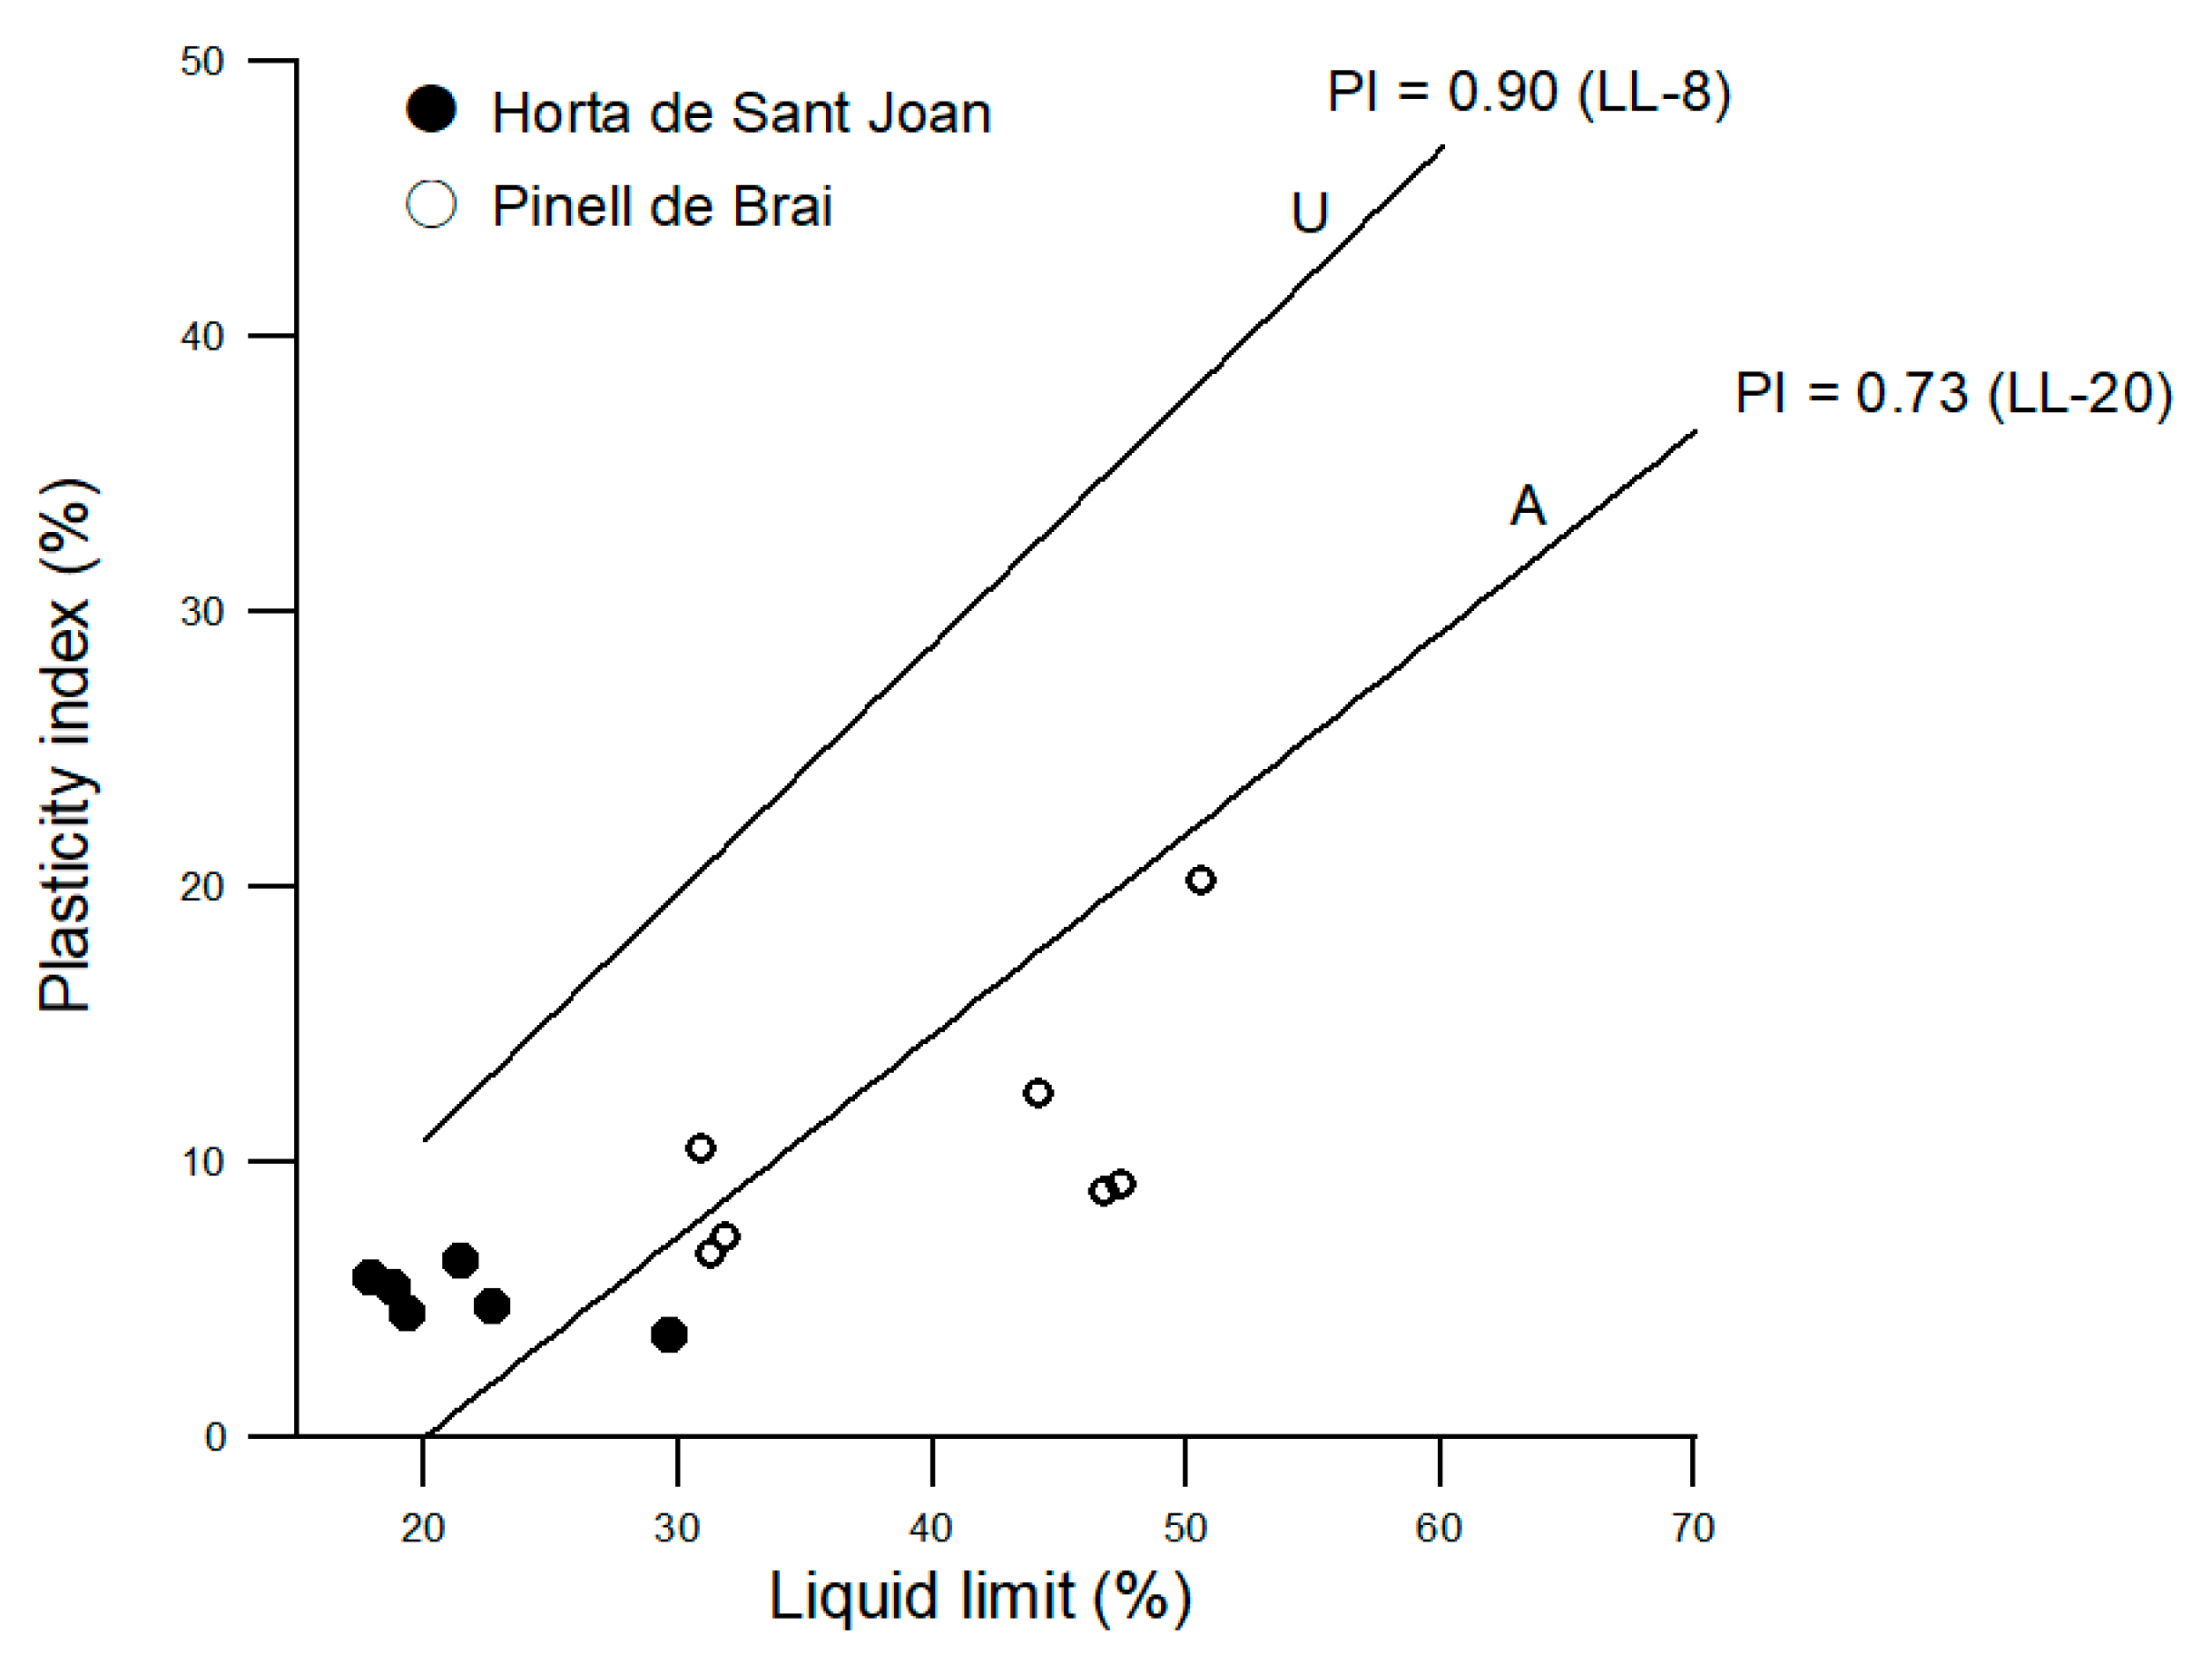
The PI, LL, and PL of the Terra Alta clays are shown in Table 4 and the Casagrande plasticity chart in Figure 8.
Figure 8 displays a wide range of the Atterberg limits. Kaolinitic clays are characterized by a PI ranging from 5% to 30%, and a liquid limit between 30% and 70% [52]. The Pinell de Brai clays fall into this range (PI = 6.7–0.2; LL = 30.84–47.37). However, kaolinitic materials from Horta de Sant Joan display LL values below 30% and a PI under 5 in half the samples studied, being the lowest value in the area richest in kaolinite (Hj-5). This low PI can be justified by the highest Hinckley index of these clays. This low PI is typical of flint clays, which are described as refractory clays mainly constituted of highly ordered kaolinite with small particle sizes [53]. The main application of these clays is as refractory raw materials. To be moulded, the paste needs a moisture content above the plastic limit and below the liquid limit to minimize problems that result from shrinkage of ceramic pieces during drying. The optimum content of moisture is between 16% and 18%. Higher proportions of water generate cracking in the pieces during drying.
3.4.2. Thermal Evolution
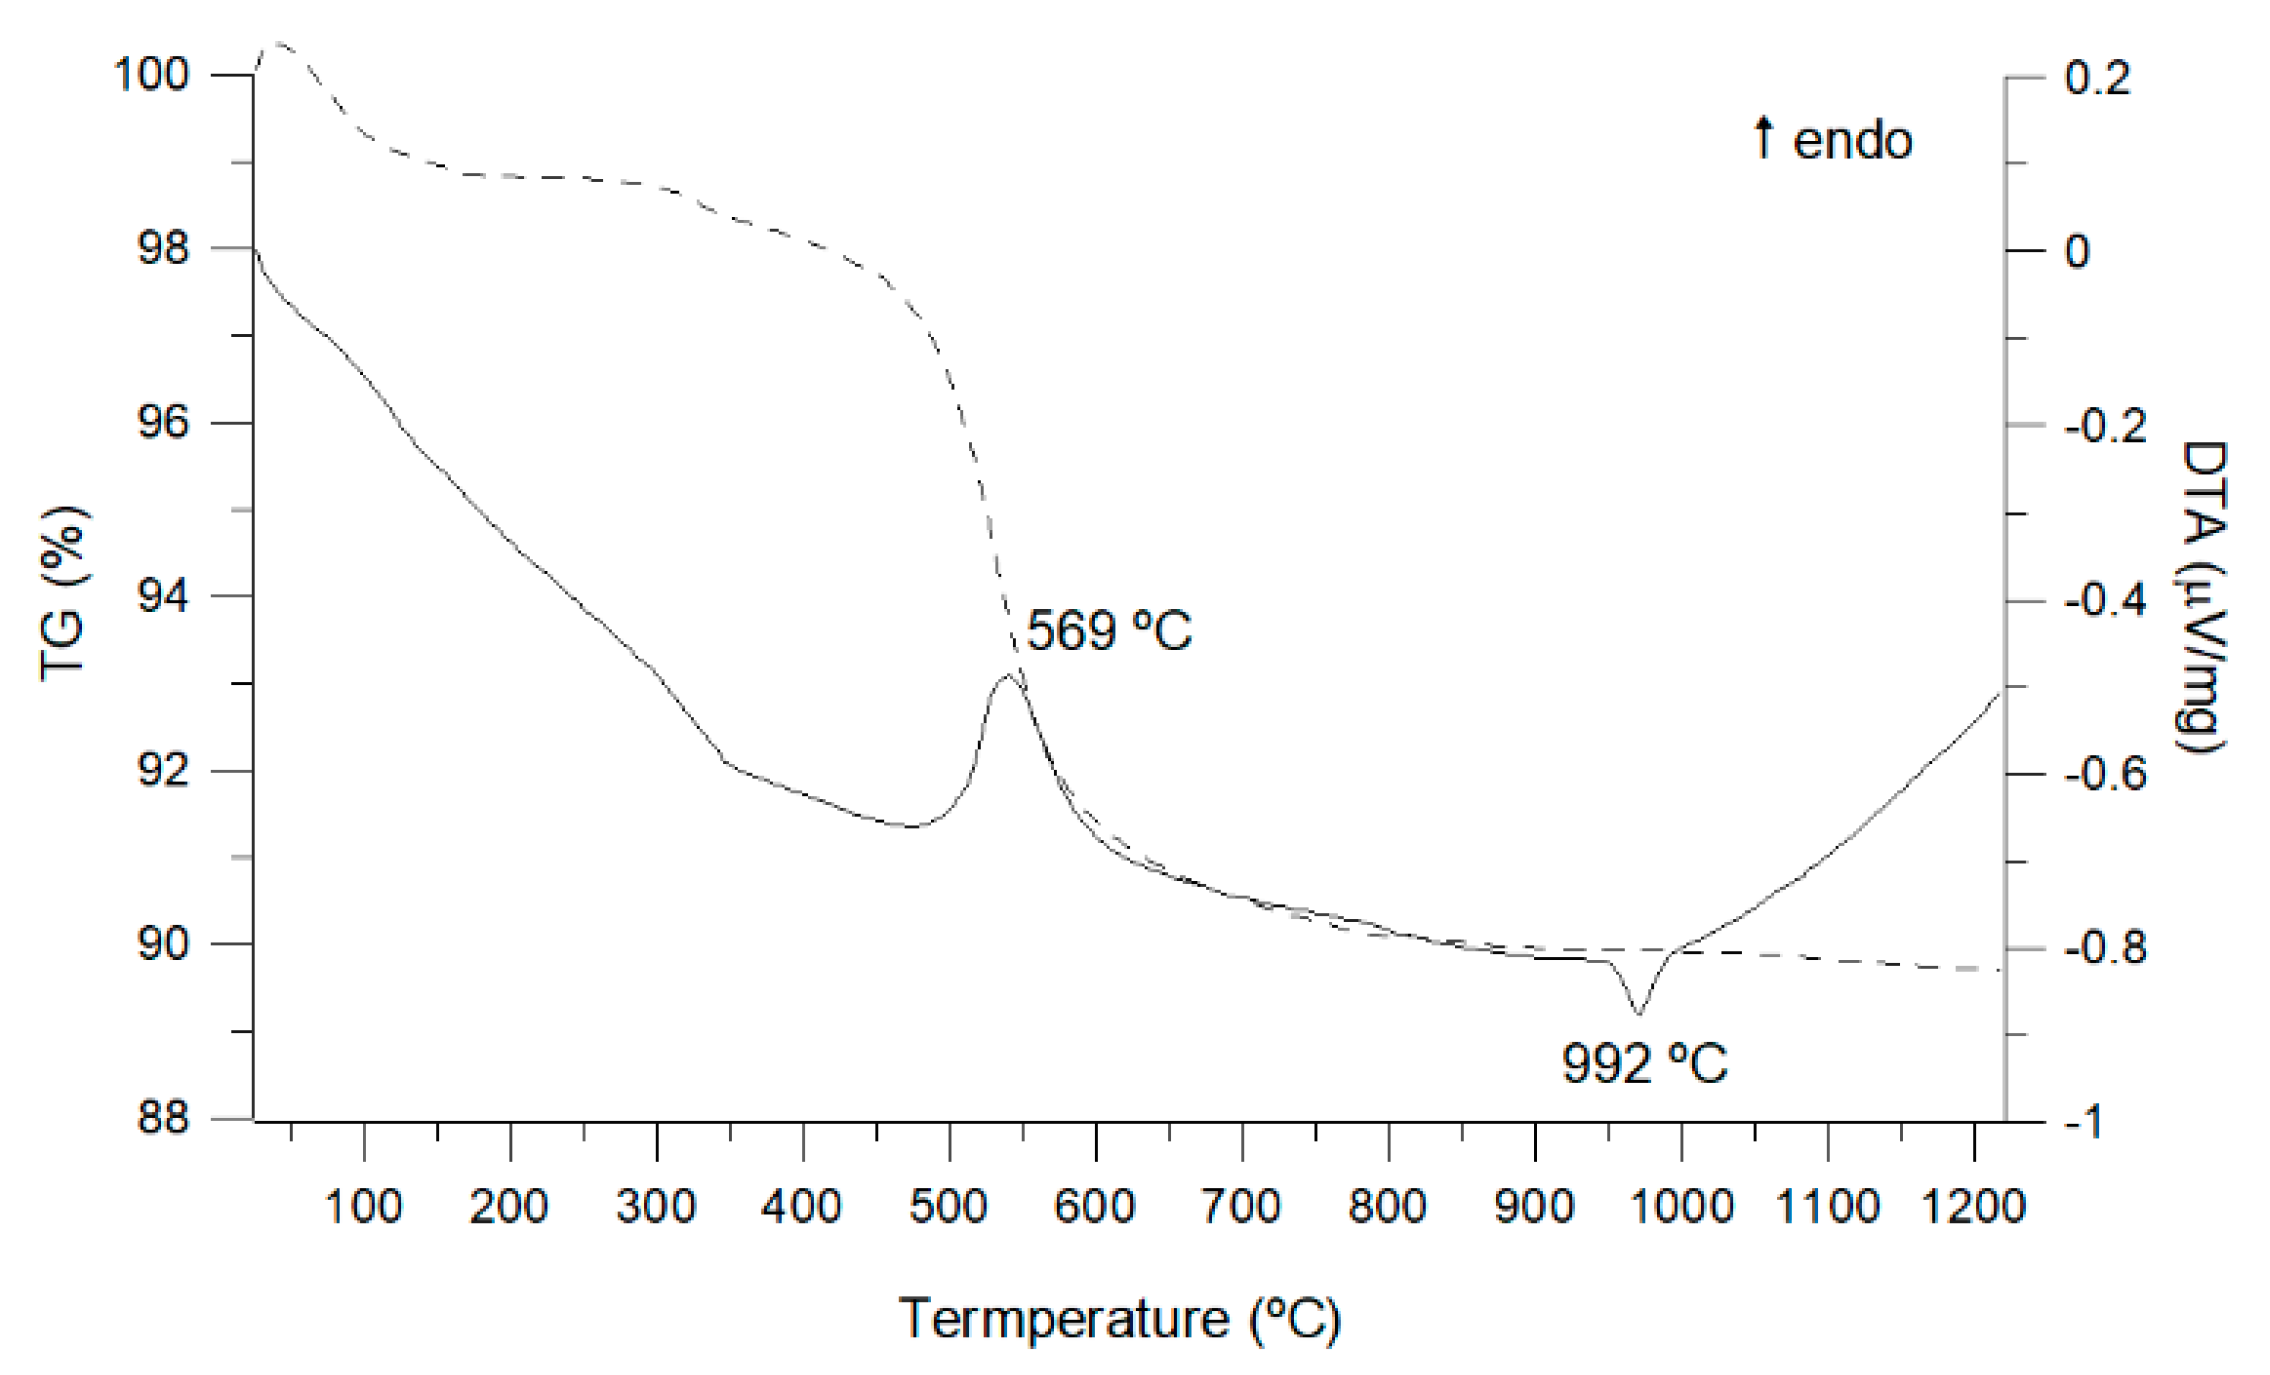
The differential thermal analysis (DTA) indicates the steps of weight loss produced by exo- and endothermic events (Table 5). Figure 9 corresponds to DTA–TG curves typical of kaolinite thermal evolution.
The first unmarked peak corresponds to an endothermic event before 190 °C, correlated with a small weight loss (about 1.0 wt %) in the TG curve, attributed to the decomposition of poorly crystalized fine-grained aluminum hydroxide [25,54,55]. The second endothermic peak is at ~569 °C, associated with the main weight loss in the TG (about 9 wt %). This is related to kaolinite dihydroxylation, loss of OH groups and to a transition phase from α-quartz to β-quartz, which implies a change in volume. Finally, an exothermic effect associated with the processes of mullitization appears at about 992 °C, related to the formation of the γ-Al2O3 spinel-type phase at the kaolinite–metakaolinite mullite transformation [56]. At this temperature, the loss of weight is insignificant. Usually, the total mass loss at 1300 °C ranges from 5 to 11 wt %, depending on the clay minerals content.
The maximum endothermic peak corresponds to the samples with more crystalline kaolinite (HI > 1). Hu and Yang [57] attributed the temperature changes to variation in crystallinity, with the poorly crystallized kaolinite easier to remove than the more crystalline kaolinite.
3.4.3. Dilatometry
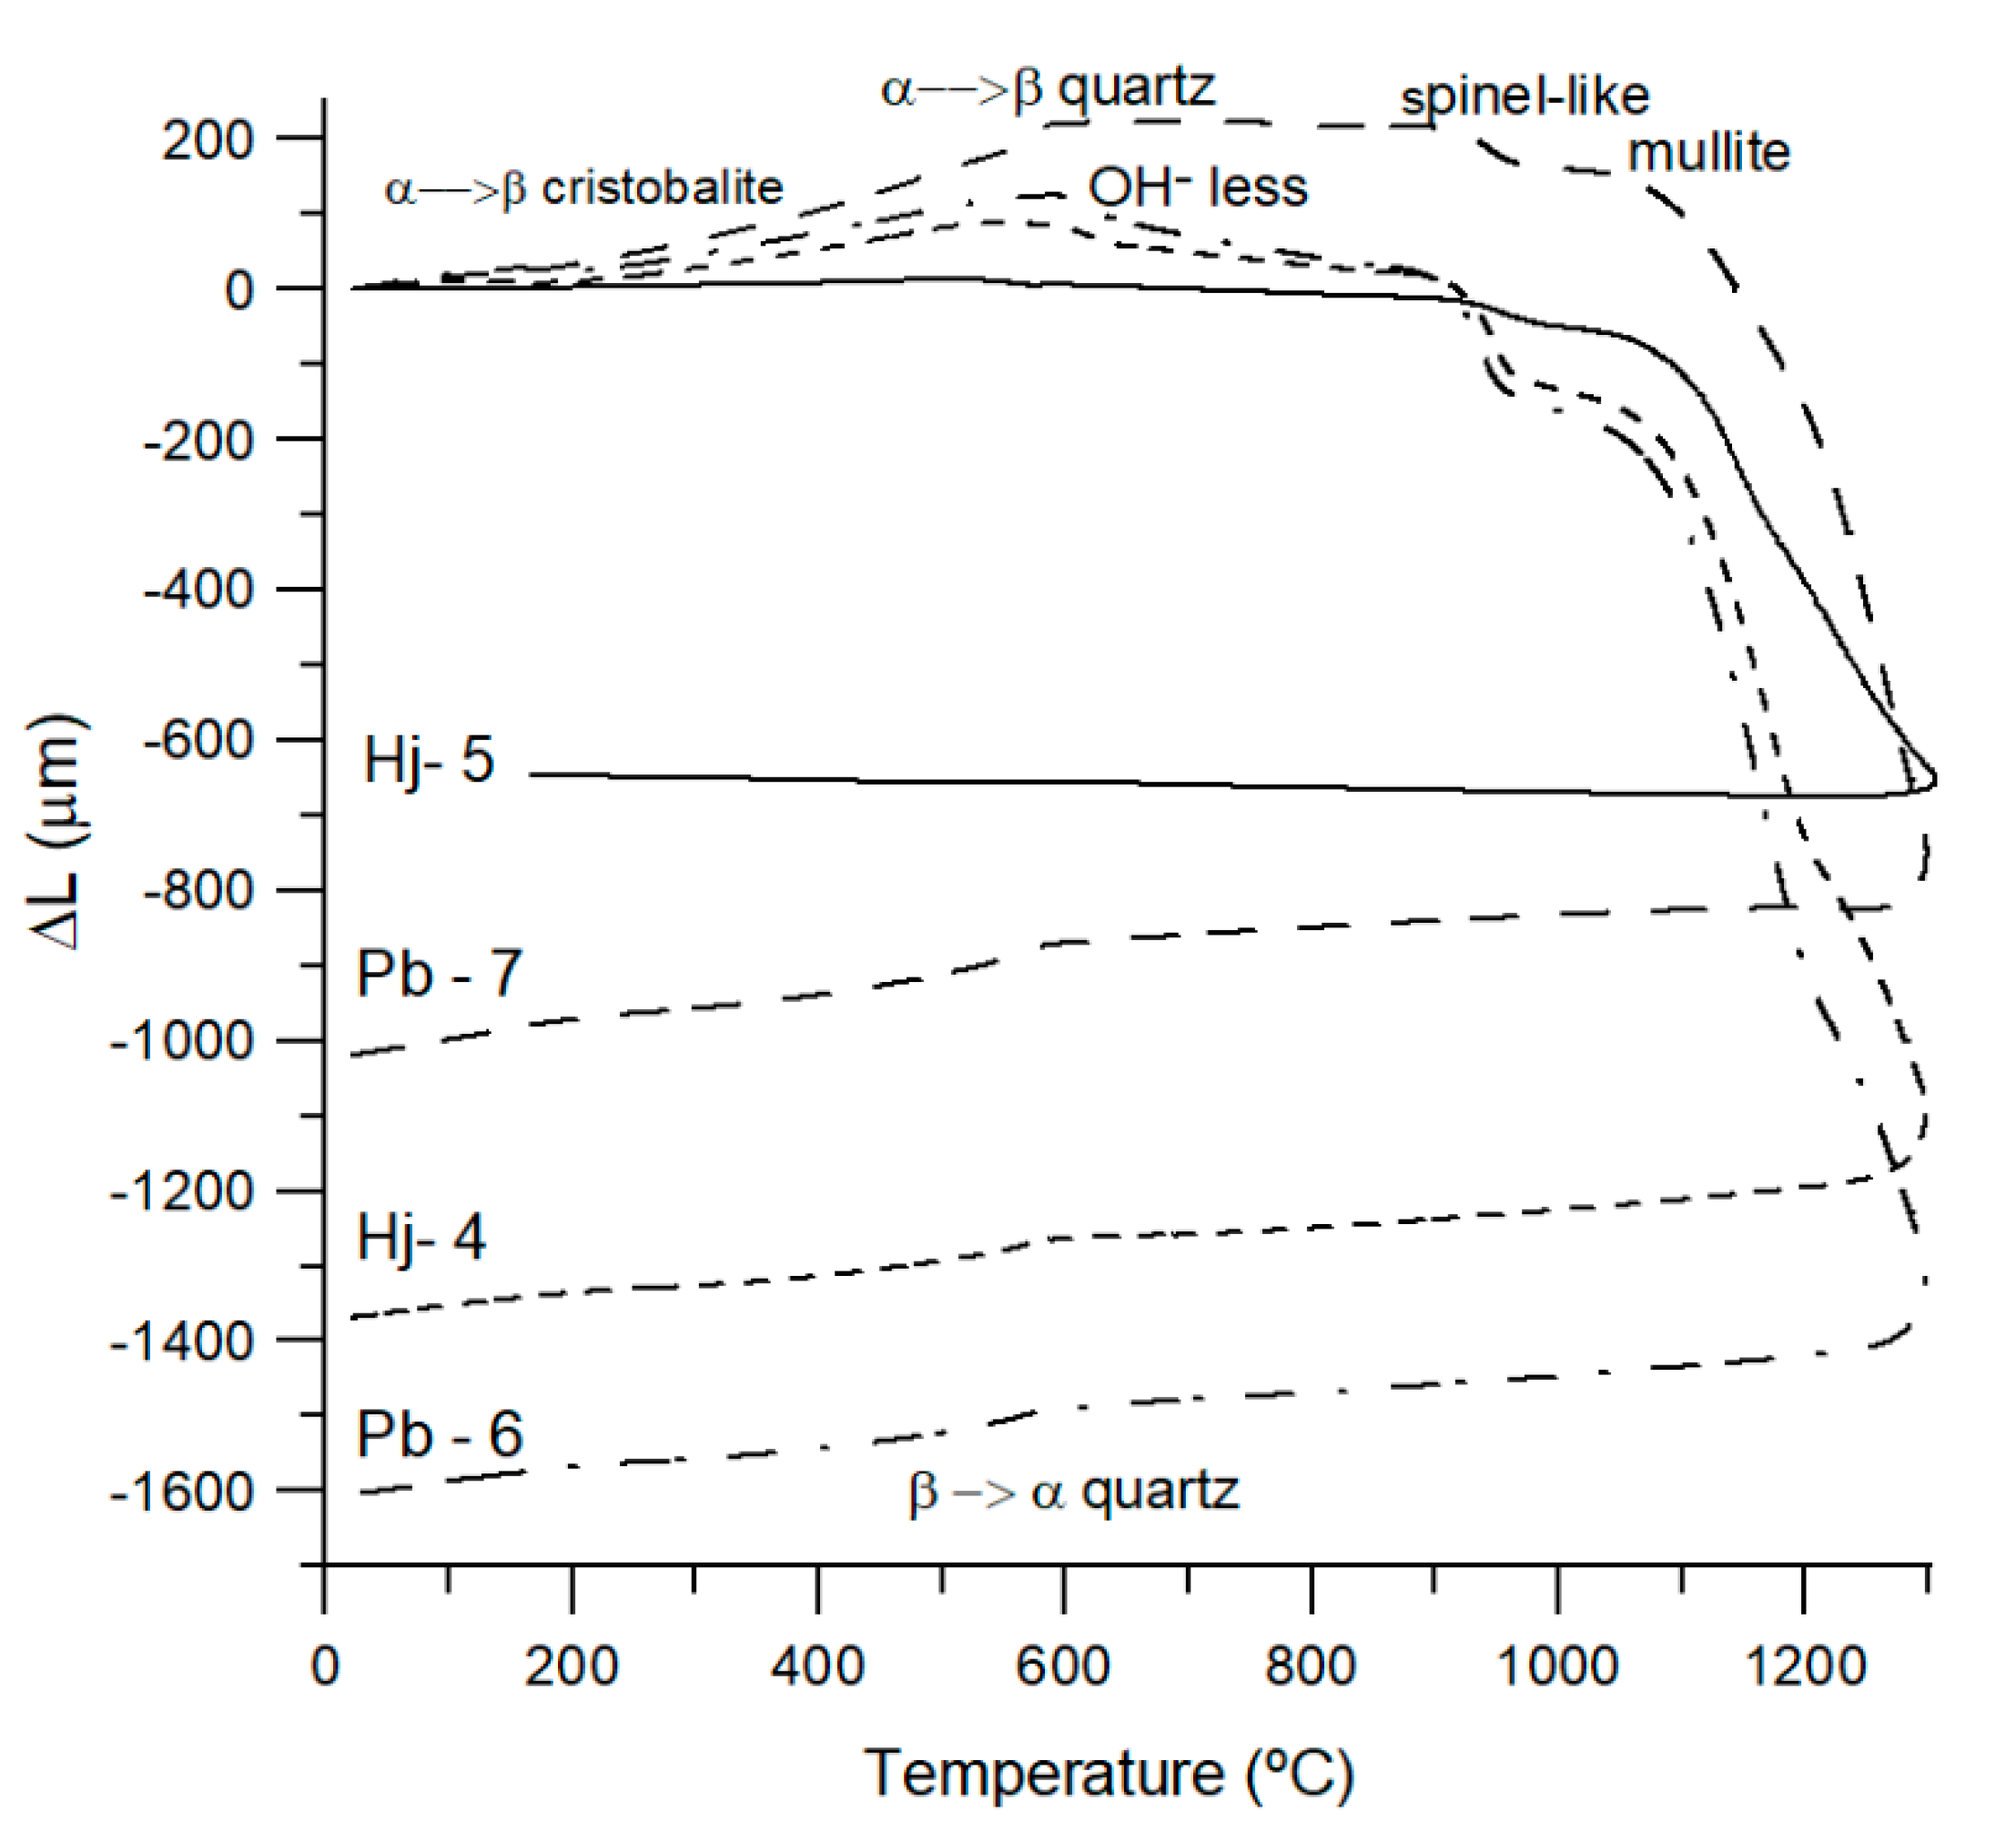
Dilatometric curves obtained during heating and cooling processes of kaolin show the dimensional changes. This evolution is essential to determine the correct development of an adjusted firing conditions curve and ultimately to reduce the energy consumption. Dilatometric curves of the Terra Alta clays display a classic behavior corresponding to kaolinite (Figure 10).
In the heating process, there is a small expansion, up to 500 °C, due to the high Al3+ content [58]. The samples richest in quartz show a higher expansion produced by both effects (kaolinite and quartz). It is followed by a slight shrinkage increase between 500 and 950 °C with sequential events, attributed to polymorphic α-β quartz transformation, kaolinite dihydroxylation and spinel-like structure formation. A sharp contraction starts at 1050 °C due to a sintering process, with a new mineral formed (mullite and amorphous SiO2) [59,60,61].
Two polymorphic phenomena, β-α quartz and β-α cristobalite, are observed in the cooling curve segment, approximately at 550 °C and 170 °C, respectively. Polymorphic transformations (heat and cold) of quartz are present in the samples richer in this mineral phase, the dilatometric curve shows a step corresponding to a volumetric change. These changes are very important when clays are used in ceramic production, being necessary to decrease the kiln heating to avoid possible fissures. Finally, Mg2+ and Fe3+ contribute to mullite formation, Ca2+ has a less significant role, and Na+, K+ and Ti4+ delay these processes [62].
4. Conclusions
In general, kaolinitic clays from Terra Alta have a moderate plasticity and can be classified as fire clays. These fire clays can be used for stoneware and construction, due to their high aluminum and iron content, their particle size characteristics, plasticity, and their moderate contraction. The level with the highest kaolinite content, with Fe2O3 < 1.5 wt %, is located in Horta de Sant Joan. Its high contraction and white color after firing allows its classification as a flint clay, making it usable as high-quality refractory material or as an additive. The narrow thickness of this level and the slight dipping angle make it difficult to exploit as an isolated bed.
The Pinell de Brai clays are suitable for obtaining a triaxial ceramic paste. These clays should be mixed with other raw materials depending on the type of ceramics to be manufactured. Usually, their low content in fluxes causes a high porosity during firing; so in the formulation of a possible ceramic paste, feldspar should be included to act as a fluxing agent. Another possible additive is chamotte, which gives stability and reduces the proportion of iron in the paste. The characterization of the kaolinite levels of Terra Alta carried out in this research is the basis for establishing the formulation of a triaxial paste and determining its rheology.
Author Contributions
M.G.-V. and P.A. wrote the paper; M.G.-V. and S.M. did the field and laboratory work; N.R. assisted with the interpretation of the rheological properties. All authors contributed to data interpretation and discussion. All authors have read and agreed to the published version of the manuscript.
Funding
This research was funded by a transference project FBG 307466. The research is supported by the SGR-2017SGR1687 and 2017SGR0707 of the Generalitat de Catalunya.
Acknowledgments
The authors thank the staff of the Scientific-Technical Service Unit of the University of Barcelona (CCiTUB) for their technical support.
Conflicts of Interest
The authors declare no conflict of interest.
References
- Murray, H.H. Traditional and new applications for kaolin, smectite, and palygorskite: A general overview. Appl. Clay Sci. 2000, 17, 207–221. [Google Scholar] [CrossRef]
- Murray, H.H. Applied Clay Mineralogy: Occurrences, Processing and Applications of Kaolins, Bentonites, Palygorskitesepiolite, and Common Clays; Elsevier: Amsterdam, The Netherlands, 2006; Volume 2, p. 188. [Google Scholar]
- Schroeder, P.A.; Erickson, G. Kaolin: From ancient porcelains to nanocomposites. Elements 2014, 10, 177–182. [Google Scholar] [CrossRef]
- Kogel, J.E. Mining and Processing Kaolin. Elements 2014, 10, 189–193. [Google Scholar] [CrossRef]
- Silva, F.A.N.G.; Luz, A.B.; Sampaio, J.A.; Bertolino, L.C.; Scorzelli, R.B.; Duttine, M.; da Silva, F.T. Technological characterization of kaolin: Study of the case of the Borborema–Seridó region (Brazil). Appl. Clay Sci. 2009, 44, 189–193. [Google Scholar] [CrossRef]
- Hernández, A.C.; Sánchez-Espejo, R.; Meléndez, W.; González, G.; López-Galindo, A.; Viseras, C. Characterization of Venezuelan kaolins as health care ingredients. Appl. Clay Sci. 2019, 175, 30–39. [Google Scholar] [CrossRef]
- Dill, H.G. Kaolin: Soil, rock and ore: From the mineral to the magmatic, sedimentary and metamorphic environments. Earth Sci. Rev. 2016, 161, 16–129. [Google Scholar] [CrossRef]
- Dondi, M.; Raimondo, M.; Zanelli, C. Clays and bodies for ceramic tiles: Reappraisal and technological classification. Appl. Clay Sci. 2014, 96, 91–109. [Google Scholar] [CrossRef]
- Pruett, R.J. Kaolin deposits and their uses: Northern Brazil and Georgia, USA. Appl. Clay Sci. 2016, 131, 3–13. [Google Scholar] [CrossRef]
- Miralles, J.C. Les bauxitas del NE de Espana. Congr. Geol. Int. 1954, 12, 199–223. [Google Scholar]
- San Miguel de la Cámara, M. Geología de las bauxitas españolas. R. Soc. Esp. Hist. Nat. 1954, 579–607, Spec. issue honoring Prof. E. Hernández-Pacheco. [Google Scholar]
- Anadón, P.; Cabrera, L.; Guimerà, J.; Santanach, P. Paleogene strike-slip deformation and sedimentation along the southeastern margin of the Ebro Basin. In Strike-Slip Deformation, Basin Formation and Sedimentation; Biddle, K.T., Christie-Blick, N., Eds.; SEPM: Broken Arrow, OK, USA, 1985; Volume 37, pp. 303–318. [Google Scholar]
- Jones, M.A.; Heller, P.L.; Roca, E.; Garcés, M.; Cabrera, L. Time lag of syntectonic sedimentation across an alluvial basin: Theory and example from the Ebro Basin, Spain. Basin Res. 2004, 16, 467–488. [Google Scholar] [CrossRef]
- Jiménez-Moreno, G.; Aziz, H.A.; Rodríguez-Tovar, F.J.; Pardo-Igúzquiza, E.; Suc, J.P. Palynological evidence for astronomical forcing in Early Miocene lacustrine deposits from Rubielos de Mora Basin (NE Spain). Palaeogeogr. Palaeoclimatol. Palaeoecol. 2007, 252, 601–616. [Google Scholar] [CrossRef]
- ICGC. ICGC-Vissir3. Available online: http://www.icc.cat/vissir3/ (accessed on 20 January 2020).
- Teixell, A. Desarrollo de un anticlinorio por transpresión, aislando una cuenca sedimentaria marginal (borde oriental de la cuenca del Ebro, Tarragona). Rev. Soc. Geol. España 1988, 1, 229–238. [Google Scholar]
- Molina, J.M. A review of karst bauxites and related paleokarsts in Spain. Acta Geologica Hispanica 1991, 34, 179–194. [Google Scholar]
- Yuste, A.; Bauluz, B.; Mayayo, M.J. Origin and geochemical evolution from ferrallitized clays to karst bauxite: An example from the Lower Cretaceous of NE Spain. Ore Geol. Rev. 2017, 84, 67–79. [Google Scholar] [CrossRef] [Green Version]
- Reinhardt, N.; Proenza, J.A.; Villanova-de-Benavent, C.; Aiglsperger, T.; Bover-Arnal, T.; Torró, L.; Salas, R.; Dziggel, A. Geochemistry and Mineralogy of Rare Earth Elements (REE) in Bauxitic Ores of the Catalan Coastal Range, NE Spain. Minerals 2018, 8, 562. [Google Scholar] [CrossRef] [Green Version]
- Hinckley, D. Variability in “crystallinity” values among the kaolin deposits of the Coastal Plain of Georgia and South Carolina. Clays Clay Miner. 1965, 11, 229–235. [Google Scholar] [CrossRef]
- Monshi, A.; Foroughi, M.R.; Monshi, M.R. Modified Scherrer Equation to Estimate More Accurately Nano-Crystallite Size Using XRD. World J. Nano Sci. Eng. 2012, 2, 154–160. [Google Scholar] [CrossRef] [Green Version]
- Casagrande, A. Plasticity chart for the classification of cohesive soils. Trans. Am. Soc. Civ. Eng. 1948, 113, 783–811. [Google Scholar]
- UNE 103104: 1993. Determinación del Limite Plástico de un Suelo; AENOR: Madrid, Spain, 1993.
- UNE 7-377-75. Determinación del Límite Líquido de un Suelo por el Método de la Cuchara. Instituto Nacional de Racionalización y Normalización (Espanya); AENOR: Madrid, Spain, 1976.
- Garcia-Valles, M.; Pi, T.; Alfonso, P.; Canet, C.; Martinez, S.; Jimenez-Franco, A.; Tarrago, M.; Hernández-Cruz, B. Kaolin from Acoculco (Puebla, Mexico) as raw material: Mineralogical and thermal characterization. Clay Miner. 2015, 50, 405–416. [Google Scholar] [CrossRef] [Green Version]
- Ece, O.I.; Nakagawa, Z.; Schroed, P. Alteration of volcanic rocks and genesis of kaolin deposits in the Sile region, Northern Istanbul, Turkey. Clay Mineralogy. Clays Clay Miner. 2003, 51, 675–688. [Google Scholar] [CrossRef]
- Celik, H. Technological characterization and industrial application of to Turkish clays for the ceramic industry. Appl. Clay Sci. 2010, 50, 245–254. [Google Scholar] [CrossRef]
- Mahmoudi, S.; Srasra, E.; Zargouni, F. The use of Tunisian Barremian clay in the tradicional ceramic industry: Optimization of ceramic properties. Appl. Clay Sci. 2008, 42, 125–129. [Google Scholar] [CrossRef]
- Bennour, A.; Mahmoudi, S.; Srasra, E.; Boussen, S.; Htira, N. Composition, firing behavior and ceramic properties of the Sejnène clays (Northwest Tunisia). Appl. Clay Sci. 2015, 115, 30–38. [Google Scholar] [CrossRef]
- Barrachina, E.; Calvet, I.; Fraga, D.; Carda, J.B. Ceramic porcelain stoneware production with Spanish clays purified by means of the removal of iron compounds and organic matter using physical methods. Appl. Clay Sci. 2017, 143, 258–264. [Google Scholar] [CrossRef]
- Marques, R.; Dias, I.; Prudècio, M.I.; Rocha, F. Upper Cretaceous clayey levels from western Portugal (Aveiro and Taveiro regions): Clay mineral and trace-element distribution. Clays Clay Miner. 2011, 59, 315–327. [Google Scholar] [CrossRef]
- Raghavan, P.; Chandrasekhar, S.; Damodaran, A.D. Value addition of paper coating grade kaolins by the removal of ultrafine coloring impurities. Int. J. Miner. Process. 1997, 50, 307–316. [Google Scholar] [CrossRef]
- Jepson, W.B. Structural iron in kaolinites and in associated ancillary minerals. In Iron in Soils and Clay Minerals; Stucki, J.W., Goodman, B.A., Schwertmann, U., Eds.; Springer: Dordrecht, The Netherlands, 1988; pp. 467–536. [Google Scholar]
- Gougazeh, M.; Buhl, J.C.H. Geochemical and mineralogical characterization of the Jabal Al-Harad kaolin deposit, southern Jordan, for its possible utilization. Clay Miner. 2010, 45, 301–314. [Google Scholar] [CrossRef]
- Kreimeyer, R. Some notes on the firing color of clay bricks. Appl. Clay Sci. 1987, 2, 175–183. [Google Scholar] [CrossRef]
- Subari, S.; Wahyudi, T. Improving tapin kaolin quality for white ware ceramic. Indones. Min. J. 2014, 17, 87–97. [Google Scholar]
- Worrall, W.E. Clays and Ceramic Raw Materials; Applied Science Publishers, Elselvier: London, UK, 1986; p. 239. [Google Scholar]
- Aparicio, P.; Galán, E. Mineralogical interference on kaolinite crystallinity index measurements. Clays Clay Miner. 1999, 47, 12–27. [Google Scholar] [CrossRef]
- Vaculíková, L.; Plevová, E.; Vallová, S.; Koutník, I. Characterization and differentiation of kaolinites from selected Czech deposits using infrared spectroscopy and differential thermal analysis. Acta Geodyn. Geomater. 2011, 8, 59–67. [Google Scholar]
- Farmer, V.C. The Infrared Spectra of Minerals; Monograph 4; Mineralogical Society: London, UK, 1974; p. 539. [Google Scholar]
- Liu, H.; Shang, J.; Chen, X.; Kamke, F.A.; Guo, K. The influence of thermal-hydro-mechanical processing on chemical characterization of Tsuga heterophylla. Wood Sci. Technol. 2014, 48, 373–392. [Google Scholar] [CrossRef]
- Cheng, S.; Huang, A.; Wang, S.; Zhang, Q. Effect of different heat treatment temperatures on the chemical composition and structure of Chinese fir wood. BioResources 2016, 11, 4006–4016. [Google Scholar] [CrossRef] [Green Version]
- Giese, R.F. Kaolin minerals: Structures and stabilities. In Hydrous Phyllosilicates; Bailey, S.W., Ed.; Reviews in Mineralogy 19; Mineralogical Society of America: Washington, DC, USA, 1988; pp. 29–66. [Google Scholar]
- Farmer, V.C. Infrared spectroscopy. In Data Handbook for Clay Materials and Other Non-Metallic Minerals; van Olphen, H., Fripiat, J.J., Eds.; Pergamon Press: Oxford, UK, 1979. [Google Scholar]
- Schroeder, P.A. Infrared Spectroscopy in clay science. In CMS Workshop Lectures; Rule, A., Guggenheim, S., Eds.; Teaching Clay Science; The Clay Mineral Society: Aurora, CO, USA, 2002; Volume 11, pp. 181–206. [Google Scholar]
- Aroke, U.O.; Abdulkarim, A.; Ogubunka, R.O. Fourier-transform infrared characterization of kaolin, granite, bentonite and barite. ATBU J. Environ. Technol. 2013, 6, 42–53. [Google Scholar]
- Diko, M.; Ekosse, G.; Ogola, J. Fourier transform infrared spectroscopy and thermal analyses of kaolinitic clays from South Africa and Cameroon. Acta Geodyn. Geomater. 2016, 13, 149–158. [Google Scholar] [CrossRef] [Green Version]
- Madejová, J. FTIR techniques in clay mineral studies. Vib. Spectrosc. 2003, 31, 1–10. [Google Scholar] [CrossRef]
- Bukalo, N.N.; Ekosse, G.I.E.; Odiyo, J.O.; Ogola, J.S. Fourier Transform Infrared Spectroscopy of Clay Size Fraction of Cretaceous-Tertiary Kaolins in the Douala Sub-Basin, Cameroon. Open Geosci. 2017, 9, 407–418. [Google Scholar] [CrossRef] [Green Version]
- Worasith, N.; Goodman, B.A.; Neampan, J.; Jeyachoke, N.; Thiravetyan, P. Characterization of modified kaolin from the Ranong deposit Thailand by XRD, XRF, SEM, FTIR and EPR techniques. Clay Miner. 2011, 46, 539–559. [Google Scholar] [CrossRef]
- Prasad, M.S.; Reid, K.J.; Murray, H.H. Kaolin: Processing, properties and application. Appl. Clay Sci. 1991, 6, 87–119. [Google Scholar] [CrossRef]
- Day, R.W. Geotechnical and Foundation Engineering; McGraw-Hill: New York, NY, USA, 1999. [Google Scholar]
- Bartolomé, J.F. El Caolín: Composición, estructura, génesis y aplicaciones. Bol. Soc. Esp. Ceram. Vidr. 1997, 36, 7–20. [Google Scholar]
- Smykatz, K. Differential Thermal Analysis, Application and Results in Mineralogy; Springer: New York, NY, USA, 1974; p. 185. [Google Scholar]
- Todor, D. Thermal Analysis of Minerals; Traduc, S.M., Ed.; Abacus Press: Tunbridge Wells, UK, 1976; p. 256. [Google Scholar]
- Brindley, G.W.; Nakahira, M. The kaolinite–mullite reaction series: II. Metakolin. J. Am. Ceram. Soc. 1959, 42, 314–318. [Google Scholar] [CrossRef]
- Hu, P.; Yang, H. Insight into the physicochemical aspects of kaolins with different morphologies. Appl. Clay Sci. 2013, 74, 58–65. [Google Scholar] [CrossRef]
- SACMI. Asociación Española de Técnicos Cerámicos. In Tecnología Cerámica Aplicada; Faenza Editrice Iberica: Castellón de la Plana, Spain, 2004. [Google Scholar]
- Chakraborty, A.K.; Ghosh, D.K. Kaolinite–Mullite reaction series: The development and significance of a binary aluminosilicate phase. J. Am. Ceram. Soc. 1991, 74, 1401–1406. [Google Scholar] [CrossRef]
- Abou-Sekkina, M.M.; Abd-El-Aziz, M.A.; Khalil, N.M.; Shalma, O.A. Phase constitution of kaolin-based refractory castables containing spinel or mullite (preformed and in situ) additives. Elixir Appl. Chem. 2011, 34, 2398–2403. [Google Scholar]
- Guatame-Garcia, A.; Buxton, M. Prediction of Soluble Al2O3 in Calcined Kaolin Using Infrared Spectroscopy and Multivariate Calibration. Minerals 2018, 8, 136. [Google Scholar] [CrossRef] [Green Version]
- Parmelee, C.W.; Rodríguez, A.R. Catalytic Mullitization of Kaolinite by Metallic Oxide. J. Am. Ceram. Soc. 1942, 25, 1–10. [Google Scholar] [CrossRef]
Figure 1.
Location of the study area in the Mora Basin (The upper map is modified from reference [14] and the geological map from reference [15]).

Figure 2.
Geologic section from the Pinell de Brai exploitation area.

Figure 3.
Comparison of chemical composition between the Terra Alta kaolinitic clays and ceramic clays from other locations: Acoculco (Mexico) [25], Turkey I [26], Turkey II [27], Tunisia I [28], Tunisia II [29], Castellón (Spain) [30], Western Portugal [31].

Figure 4.
X-ray powder diffraction (XRPD) pattern of the richest kaolinitic level.

Figure 5.
Fourier transform infrared (FTIR) spectrum corresponding to the materials located in the uppermost layer of Horta de Sant Joan, where kaolinite is the dominant mineral.
Figure 5.
Fourier transform infrared (FTIR) spectrum corresponding to the materials located in the uppermost layer of Horta de Sant Joan, where kaolinite is the dominant mineral.

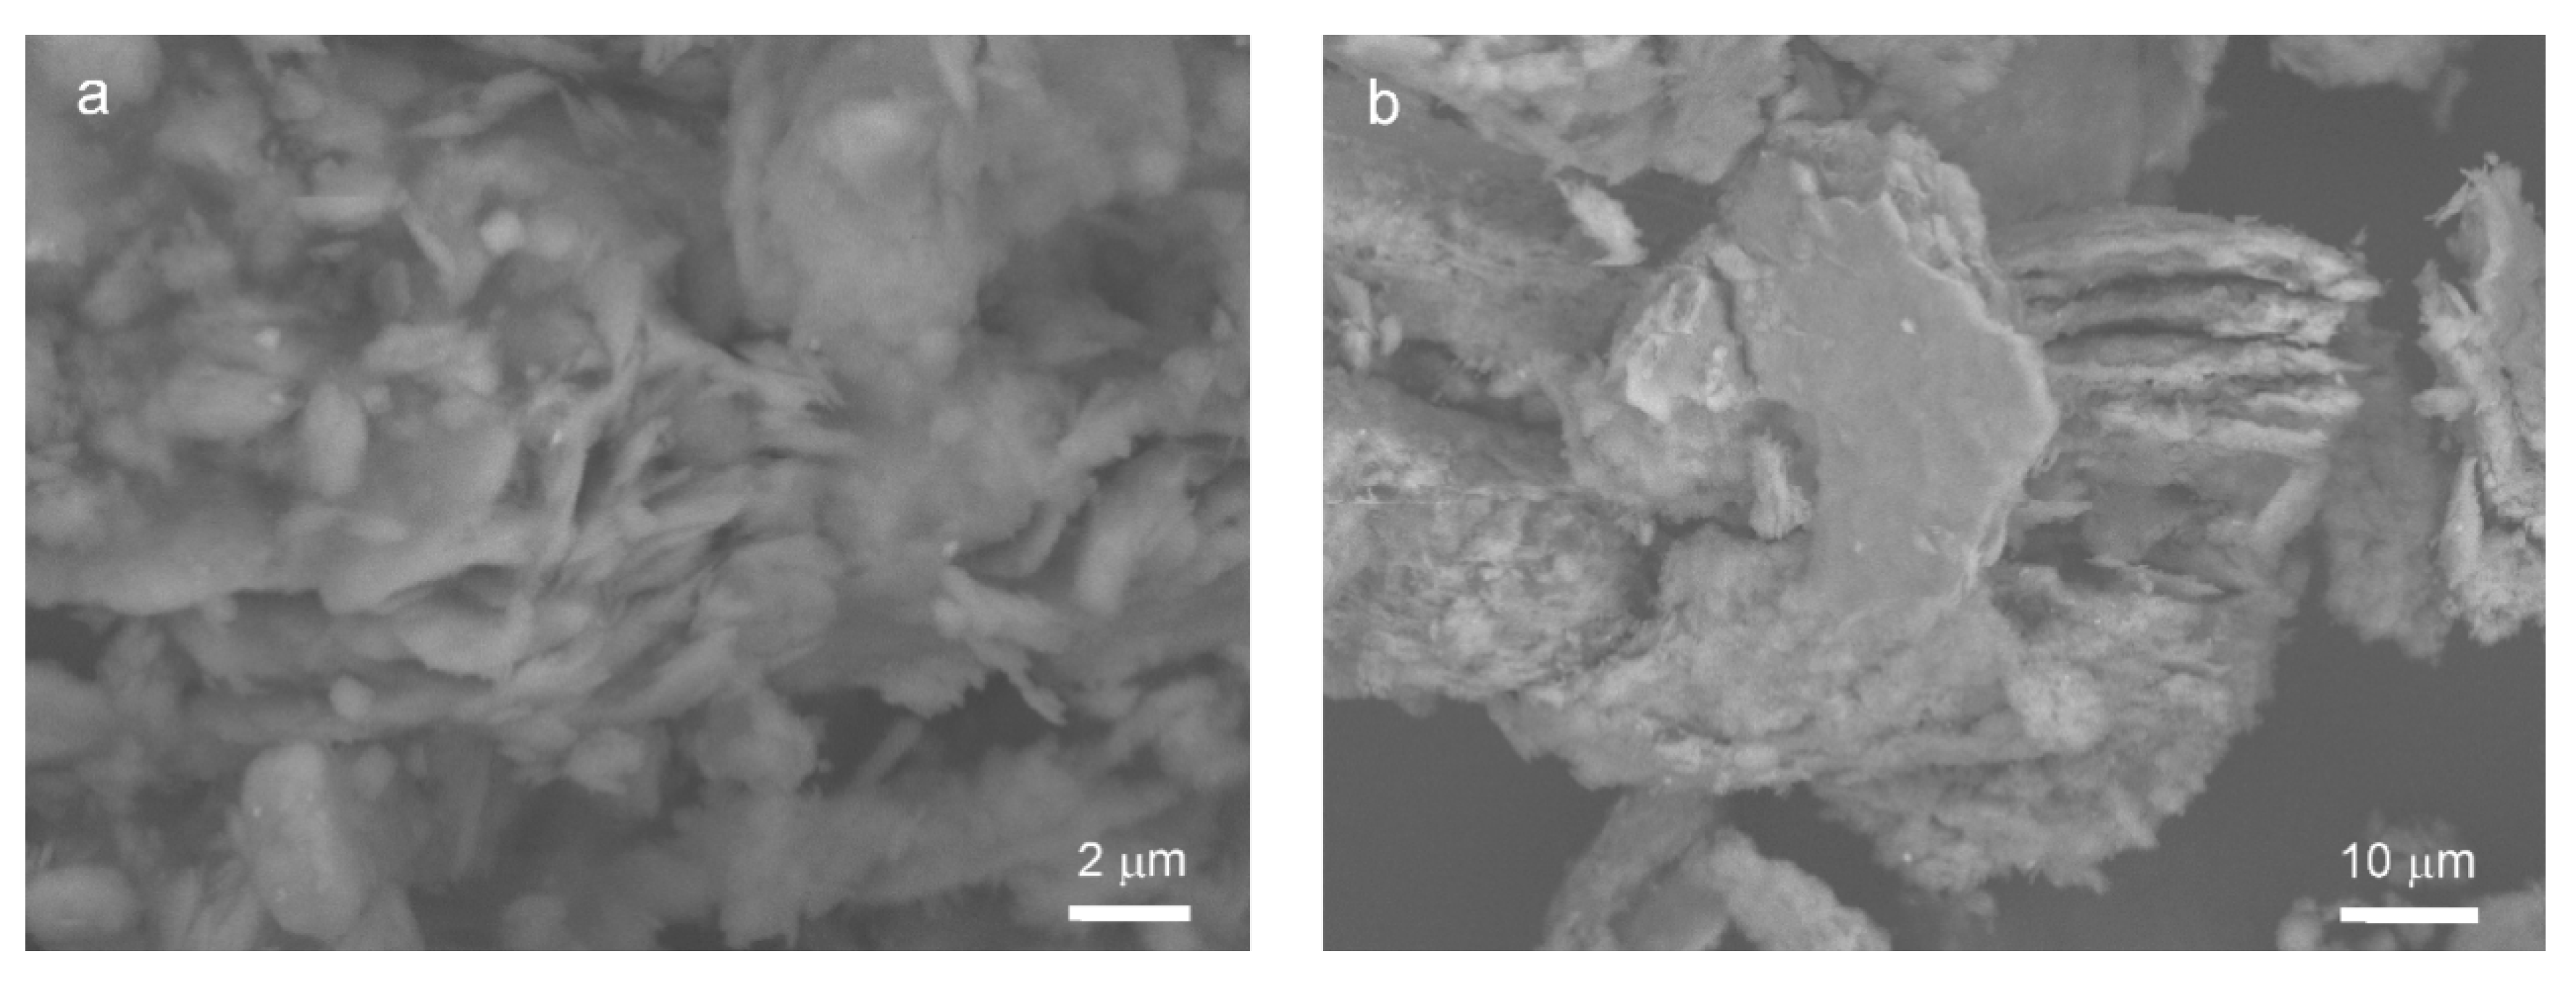
Figure 6.
SEM images of the Pinell de Brai kaolinitic clays from Terra Alta: (a) kaolinite platelets; (b) kaolinite booklets.
Figure 6.
SEM images of the Pinell de Brai kaolinitic clays from Terra Alta: (a) kaolinite platelets; (b) kaolinite booklets.

Figure 7.
Particle size distribution curves of representative samples from the Hj and Pb areas.

Figure 8.
Casagrande plasticity chart from the Terra Alta kaolinitic clays. The A Line represents an empirical boundary between inorganic clays and plastic inorganic silts; the U line is the upper bound to any data potted in the plasticity chart [22].
Figure 8.
Casagrande plasticity chart from the Terra Alta kaolinitic clays. The A Line represents an empirical boundary between inorganic clays and plastic inorganic silts; the U line is the upper bound to any data potted in the plasticity chart [22].

Figure 9.
DTA–TG curves of the most kaolinitic level of Horta de Sant Joan.

Figure 10.
Dilatometric curves of representative samples from Terra Alta. The most kaolinitic layer (Hj-5) shows a minor shrinkage and major dimensional stability.
Figure 10.
Dilatometric curves of representative samples from Terra Alta. The most kaolinitic layer (Hj-5) shows a minor shrinkage and major dimensional stability.


Table 1.
Chemical composition (wt %) of the Horta de Sant Joan (Hj) and Pinell de Brai (Pb) clays.
| Samples | Oxides | |||||||||||
|---|---|---|---|---|---|---|---|---|---|---|---|---|
| SiO2 | Al2O3 | Fe2O3 | TiO2 | K2O | CaO | MgO | Na2O | P2O5 | LOI | SiO2/Al2O3 | Al2O3/Fe2O3 | |
| Hj-1 | 60.83 | 20.30 | 8.03 | 1.01 | 0.59 | 0.28 | 0.09 | 0.00 | 0.08 | 8.79 | 3.00 | 2.53 |
| Hj-2 | 59.03 | 21.85 | 7.90 | 1.18 | 0.27 | 0.32 | 0.12 | 0.00 | 0.02 | 9.31 | 2.70 | 2.77 |
| Hj-3 | 61.88 | 14.56 | 12.12 | 1.04 | 0.22 | 1.33 | 0.23 | 0.01 | 0.12 | 8.49 | 4.25 | 1.20 |
| Hj-4 | 53.71 | 31.56 | 1.30 | 0.53 | 0.23 | 0.39 | 0.05 | 0.00 | 0.26 | 11.97 | 1.70 | 24.28 |
| Hj-5 | 46.79 | 38.11 | 0.91 | 0.25 | 0.14 | 0.11 | 0.00 | 0.00 | 0.23 | 13.49 | 1.23 | 41.88 |
| Hj-6 | 56.08 | 25.50 | 4.83 | 1.12 | 1.02 | 0.61 | 0.19 | 0.05 | 0.05 | 10.55 | 2.20 | 5.28 |
| Hj-7 | 75.02 | 14.39 | 1.17 | 0.98 | 0.23 | 0.16 | 0.12 | 0.00 | 0.02 | 7.91 | 5.21 | 12.30 |
| Hj-8 | 71.18 | 16.13 | 3.36 | 1.07 | 0.2 | 0.7 | 0.08 | 0.00 | 0.11 | 7.17 | 4.41 | 4.80 |
| Hj-9 | 63.78 | 21.86 | 3.79 | 1.18 | 0.15 | 0.21 | 0.14 | 0.00 | 0.03 | 8.86 | 2.92 | 5.77 |
| Pb-1 | 57.19 | 23.83 | 6.91 | 1.15 | 0.68 | 0.2 | 0.21 | 0.07 | 0.03 | 9.73 | 2.40 | 3.45 |
| Pb-2 | 69.8 | 15.87 | 5.17 | 1.01 | 0.71 | 0.25 | 0.22 | 0.02 | 0.03 | 6.92 | 4.40 | 3.07 |
| Pb-3 | 48.25 | 27.20 | 9.99 | 1.00 | 1.12 | 0.38 | 0.33 | 0.07 | 0.04 | 11.62 | 1.77 | 2.72 |
| Pb-4 | 58.13 | 24.90 | 3.48 | 1.21 | 0.53 | 0.30 | 0.22 | 0.05 | 0.03 | 11.15 | 2.33 | 7.16 |
| Pb-5 | 51.53 | 24.89 | 9.76 | 1.03 | 1.34 | 0.51 | 0.48 | 0.33 | 0.05 | 10.08 | 2.07 | 2.55 |
| Pb-6 | 57.83 | 23.59 | 3.62 | 1.09 | 0.83 | 0.79 | 0.33 | 0.17 | 0.05 | 11.73 | 2.45 | 6.52 |
| Pb-7 | 68.88 | 15.95 | 3.47 | 1.34 | 0.80 | 1.13 | 0.40 | 0.09 | 0.03 | 7.92 | 4.32 | 4.60 |
| Pb-8 | 49.36 | 27.99 | 7.05 | 1.06 | 0.79 | 0.42 | 0.41 | 0.06 | 0.05 | 12.81 | 1.76 | 3.97 |
| Pb-9 | 56.53 | 23.32 | 10.39 | 0.00 | 0.64 | 0.40 | 0.31 | 0.00 | 0.00 | 8.40 | 2.42 | 2.24 |
Table 2.
Semiquantitative mineralogical composition of the Hj and Pb clays, in wt % and crystallite size, in nm.
Table 2.
Semiquantitative mineralogical composition of the Hj and Pb clays, in wt % and crystallite size, in nm.
| Sample | Quartz | Kaolinite | K-Feldspar | Illite | Hematite | Calcite | Crystallite Size |
|---|---|---|---|---|---|---|---|
| Hj-1 | 73 | 20 | - | - | 7 | - | 25 |
| Hj-2 | 72 | 22 | - | - | 6 | - | 25 |
| Hj-3 | 68 | 15 | 2 | - | 13 | 2 | 4 |
| Hj-4 | 48 | 47 | 2 | - | 2 | 1 | 100 |
| Hj-5 | 21 | 76 | - | - | 3 | - | 73 |
| Hj-6 | 57 | 37 | 3 | - | 2 | 1 | 23 |
| Hj-7 | 84 | 14 | 2 | - | - | - | 22 |
| Hj-8 | 79 | 16 | 1 | - | 3 | 1 | 27 |
| Hj-9 | 72 | 24 | 2 | - | 2 | - | 17 |
| Pb-1 | 60 | 32 | 3 | - | 5 | - | 24 |
| Pb-2 | 84 | 15 | - | - | 1 | - | 19 |
| Pb-3 | 43 | 45 | 4 | - | 8 | - | 22 |
| Pb-4 | 61 | 34 | 3 | - | 2 | - | 23 |
| Pb-5 | 53 | 32 | 4 | 6 | 5 | - | 23 |
| Pb-6 | 59 | 32 | 2 | 7 | - | - | 23 |
| Pb-7 | 58 | 26 | 4 | 11 | 1 | - | 22 |
| Pb-8 | 46 | 50 | - | - | 4 | - | 24 |
| Pb-9 | 43 | 49 | 2 | - | 6 | - | 24 |
Table 3.
Summary of infrared bands of some kaolin samples compared with theoretical kaolinite from Vaculíková et al. [39].
Table 3.
Summary of infrared bands of some kaolin samples compared with theoretical kaolinite from Vaculíková et al. [39].
| Wave Number (cm−1) | |||||
|---|---|---|---|---|---|
| Theoretical Kaolinite | Hj-4 | Hj-5 | Pb-6 | Pb-7 | Assignment |
| 3670-56 | 3694 | 3696 | 3694 | 3696 | Al–OH stretching |
| 3685 | 3682 | ||||
| 3645 | 3651 | 3653 | 3651 | 3655 | Al–OH stretching |
| 3620 | 3622 | 3622 | 3622 | 3623 | Al–OH stretching |
| 1638 | 1637 | 1638 | 1616 | H–O–H stretching | |
| 1117-05 | 1112 | 1112 | 1112 | 1113 | Si–O stretching |
| 1035-30 | 1018 | 1020 | 1016 | 1018 | Si–O stretching |
| 1019-05 | 995 | 945 | 939 | 995 | Si–O quartz |
| 918-09 | 916 | 920 | 919 | 916 | OH deformation |
| 800-784 | 805 | 805 | 800 | 810 | OH deformation |
| 700-686 | 701 | 705 | 705 | 698 | Si–O quartz |
| 524-35 | 500 | 500 | 501 | 524 | Si–O–Al stretching |
| 475-68 | 464 | Si–O−Si bending | |||
| 430 | 419 | Si–O bending | |||
Table 4.
Plasticity parameters of the Terra Alta clays.
| Sample | Liquid Limit (%) | Plastic Limit (%) | Plastic Index (%) |
|---|---|---|---|
| Hj-1 | 19.30 | 14.80 | 4.5 |
| Hj-2 | 18.75 | 13.25 | 5.5 |
| Hj-3 | 22.62 | 17.82 | 4.8 |
| Hj-5 | 29.67 | 25.96 | 3.7 |
| Hj-7 | 17.90 | 12.10 | 5.8 |
| Hj-9 | 21.40 | 15.02 | 6.4 |
| Pb-1 | 31.22 | 24.52 | 6.7 |
| Pb-2 | 30.84 | 20.31 | 10.5 |
| Pb-3 | 47.37 | 38.18 | 9.2 |
| Pb-4 | 31.86 | 24.57 | 7.3 |
| Pb-5 | 44.15 | 31.60 | 12.5 |
| Pb-6 | 50.58 | 30.40 | 20.2 |
| Pb-7 | 46.74 | 37.8 | 8.94 |
| Pb-8 | 31.86 | 24.57 | 7.29 |
| Pb-9 | 34.00 | 17.20 | 16.8 |
Table 5.
Thermal events measured by differential thermal analysis and thermogravimetry (DTA-TG) in the temperature range 25–1300 °C.
Table 5.
Thermal events measured by differential thermal analysis and thermogravimetry (DTA-TG) in the temperature range 25–1300 °C.
| Sample | Weight Loss (%) | Temperature (°C) | ||
|---|---|---|---|---|
| 1st | 2nd | Endothermic | Exothermic | |
| Hj-1 | 0.26 | 6.16 | 531 | 985 |
| Hj-2 | 0.86 | 7.01 | 533 | 971 |
| Hj-4 | 1.98 | 7.45 | 566 | 989 |
| Hj-5 | 1.33 | 9.32 | 569 | 992 |
| Hj-6 | 1.14 | 7.97 | 534 | 970 |
| Hj-7 | 0.51 | 4.37 | 520 | 968 |
| Hj-8 | 0.36 | 5.60 | 528 | 977 |
| Hj-9 | 0.99 | 6.89 | 530 | 964 |
| Pb-1 | 0.96 | 7.14 | 530 | 964 |
| Pb-2 | 0.98 | 4.45 | 520 | 967 |
| Pb-3 | 2.43 | 7.90 | 536 | 963 |
| Pb-4 | 1.86 | 7.49 | 530 | 965 |
| Pb-5 | 1.92 | 7.65 | 534 | 965 |
| Pb-6 | 2.42 | 8.54 | 537 | 965 |
| Pb-7 | 1.47 | 6.30 | 529 | 966 |
| Pb-8 | 3.09 | 8.51 | 531 | 953 |
© 2020 by the authors. Licensee MDPI, Basel, Switzerland. This article is an open access article distributed under the terms and conditions of the Creative Commons Attribution (CC BY) license (http://creativecommons.org/licenses/by/4.0/).
Share and Cite
MDPI and ACS Style
Garcia-Valles, M.; Alfonso, P.; Martínez, S.; Roca, N. Mineralogical and Thermal Characterization of Kaolinitic Clays from Terra Alta (Catalonia, Spain). Minerals 2020, 10, 142. https://0-doi-org.brum.beds.ac.uk/10.3390/min10020142
AMA Style
Garcia-Valles M, Alfonso P, Martínez S, Roca N. Mineralogical and Thermal Characterization of Kaolinitic Clays from Terra Alta (Catalonia, Spain). Minerals. 2020; 10(2):142. https://0-doi-org.brum.beds.ac.uk/10.3390/min10020142
Chicago/Turabian StyleGarcia-Valles, Maite, Pura Alfonso, Salvador Martínez, and Núria Roca. 2020. "Mineralogical and Thermal Characterization of Kaolinitic Clays from Terra Alta (Catalonia, Spain)" Minerals 10, no. 2: 142. https://0-doi-org.brum.beds.ac.uk/10.3390/min10020142
Note that from the first issue of 2016, this journal uses article numbers instead of page numbers. See further details here.