Geochemical Modeling of Iron and Aluminum Precipitation during Mixing and Neutralization of Acid Mine Drainage

U.S. Geological Survey, Boulder, CO 80303, USA
Minerals 2020, 10(6), 547; https://0-doi-org.brum.beds.ac.uk/10.3390/min10060547
Submission received: 21 May 2020
/
Revised: 9 June 2020
/
Accepted: 14 June 2020
/
Published: 17 June 2020
(This article belongs to the Special Issue Pollutants in Acid Mine Drainage)
Abstract
:Geochemical modeling of precipitation reactions in the complex matrix of acid mine drainage is fundamental to understanding natural attenuation, lime treatment, and treatment procedures that separate constituents for potential reuse or recycling. The three main dissolved constituents in acid mine drainage are iron, aluminum, and sulfate. During the neutralization of acid mine drainage (AMD) by mixing with clean tributaries or by titration with a base such as sodium hydroxide or slaked lime, Ca(OH)2, iron precipitates at pH values of 2–3 if oxidized and aluminum precipitates at pH values of 4–5 and both processes buffer the pH during precipitation. Mixing processes were simulated using the ion-association model in the PHREEQC code. The results are sensitive to the solubility product constant (Ksp) used for the precipitating phases. A field example with data on discharge and water composition of AMD before and after mixing along with massive precipitation of an aluminum phase is simulated and shows that there is an optimal Ksp to give the best fit to the measured data. Best fit is defined when the predicted water composition after mixing and precipitation matches most closely the measured water chemistry. Slight adjustment to the proportion of stream discharges does not give a better fit.
1. Introduction
Geochemical modeling is often limited by lack of sufficient mineralogic and hydrologic data, lack of sufficient temporal and spatial data, and lack of sufficient understanding of complex processes that dictate water compositions [1]. Substantial progress has been made over the last century and sophisticated codes use models to simulate mineral precipitation/dissolution, sorption, gas exchange, ionic strength effects, thermal effects, and transport [2]. Even with these advances, numerous assumptions must be made when applying these simulations to field conditions. Continual testing of models against field data is needed to build confidence that models are reasonable for a variety of water-rock interactions.
This paper applies a geochemical model to the process of neutralization of acid mine drainage (AMD) with particular reference to the effects of the precipitation of insoluble Fe and Al phases during mixing. Certain assumptions are examined such as the specific phase of the precipitate, its thermodynamic properties, and the sensitivity to mixing parameters. For example, schwertmannite commonly precipitates from acid mine drainage over the pH range of 2–4 [1], at slightly higher pH values ferrihydrite dominates precipitation, and at pH values near or below 2.0, jarosite precipitates (e.g., [3]). Of course, the presence or absence of specific anions play a role in determining which phases precipitate [4]. Ferrihydrite, akagenéite, lepidocrocite, and goethite may also co-precipitate during oxidation of dissolved ferrous iron. Indeed, mixtures of these minerals have been found associated with AMD and their identification is complicated by their fine-grained particle size and poor crystallinity (e.g., [3,5,6]). Another complication is that the first phase to precipitate is typically the least stable and it tends to age to a more stable phase of lower solubility. Schwertmannite converts to microcrystalline goethite and/or jarosite [7]. The transformation rate is pH dependent [8]. Basaluminite converts to alunite [9]. Techniques such as differential X-ray diffraction, electron diffraction, transmission and scanning electron photomicroscopy, synchrotron-based X-ray absorption spectroscopy, and X-ray diffraction using advanced light sources have all been important in the identification of these phases and understanding their transformations [10,11].
Similar concerns are found with the precipitation of aluminum hydroxide and hydroxysulfate phases. Basaluminite, hydrobasaluminite, aluminite, meta-aluminite, zaherite, gibbsite, microcrystalline gibbsite, boehmite, diaspore, and alunite have all been found to precipitate in lab solutions and as mixtures of phases (e.g., [12]). A summary review of these aluminous phases is also given in [1].
This paper begins with simulations of acid-base titrations with two examples using actual acid mine water analyses and using Ca(OH)2 as the titrant. Both NaOH and Ca(OH)2 have been used to neutralize AMD in treatment plants although Ca(OH)2 is less expensive and easier to handle. These simulations are important because they demonstrate how geochemical modeling is helpful in determining the minimum amount of base necessary to run a treatment plant, the inflection points that reflect buffering mechanisms, and the change in concentration of constituents during the titration. The final simulation is a field example where a near neutral tributary mixes with AMD to bring the pH up from 3.25 to 4.90 and precipitates large quantities of an aluminum phase at the mixing point. Data for discharges as well as full chemistry of the waters above and below mixing are available so that the simulated chemistry with mass fluxes after mixing can be compared with the actual measured values to evaluate the assumed thermodynamic properties of the precipitating phases. A close match between simulated vs. measured properties depends on the solubility product constants for Fe and Al precipitates as well as the relative proportions of stream discharges in the mixing zone.
2. Materials and Methods
Simulations were obtained using the PHREEQCI code v.3.4.0 [13] using the graphical user interface and the wateq4f.dat database [14]. Of the several available databases in PHREEQC, only the wateq4f.dat database has the thermodynamic properties for colloidal minerals that typically precipitate from AMD.
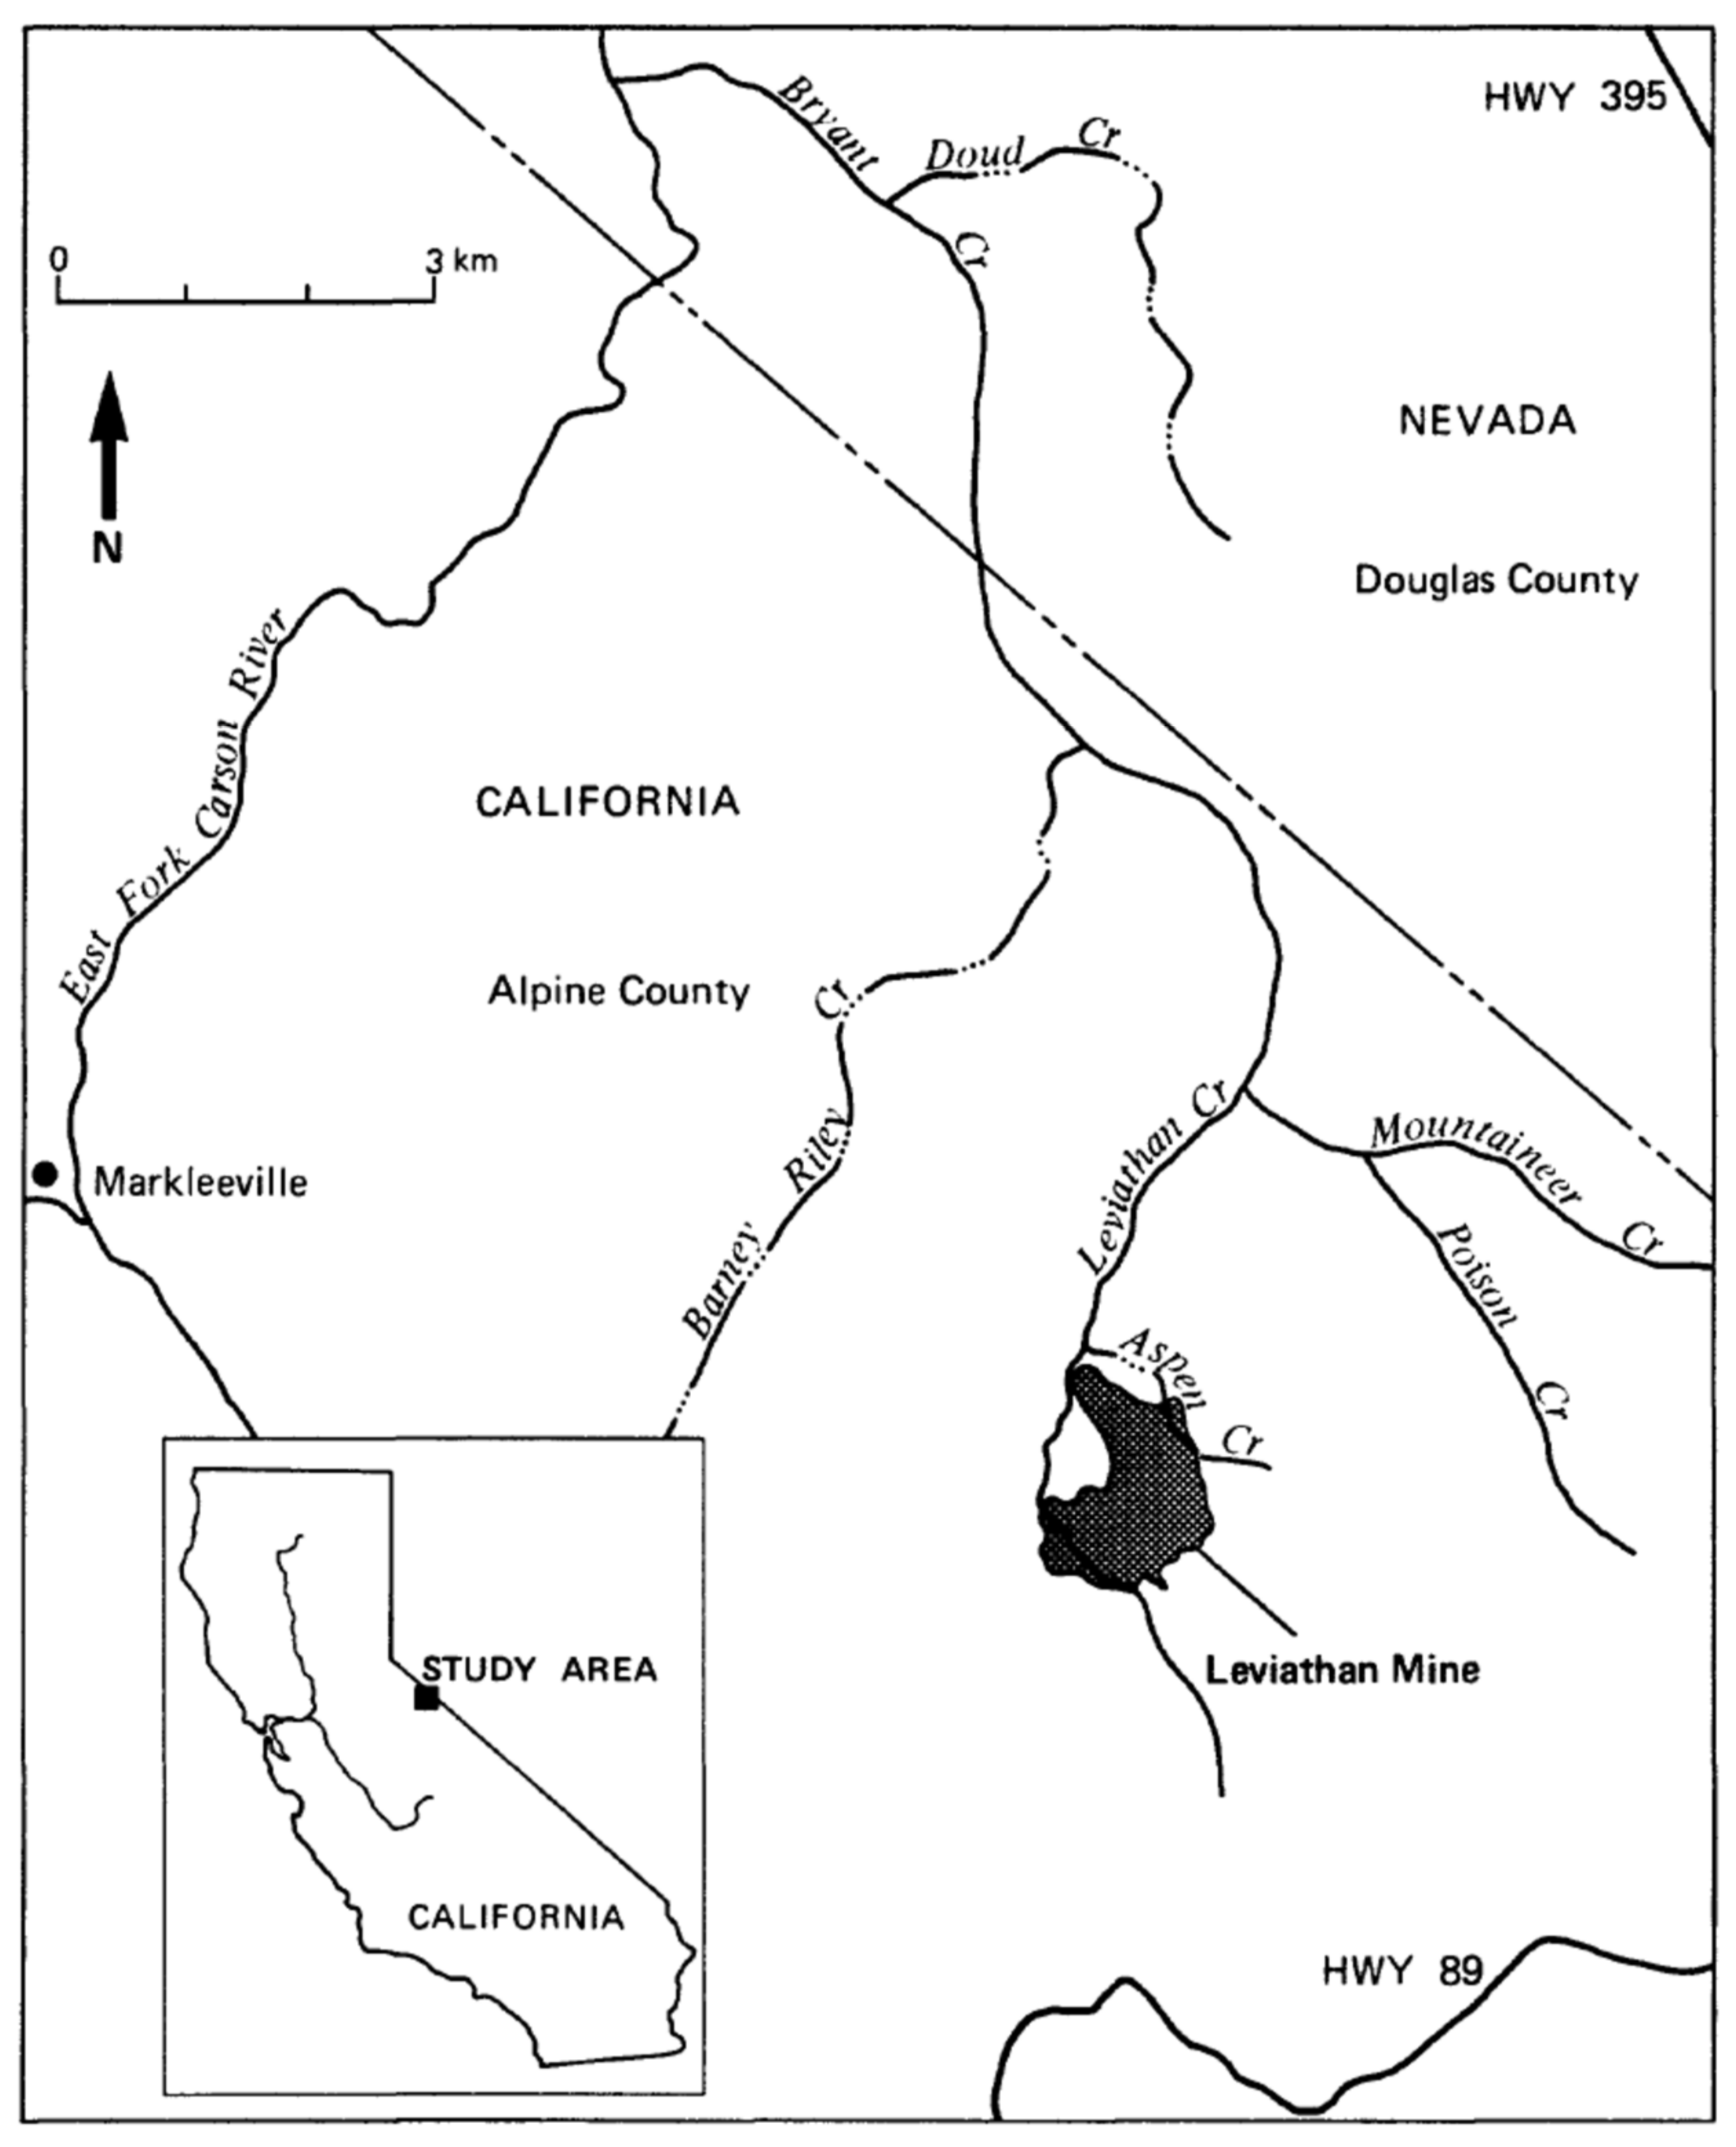
In the results that follow, two different acid mine water samples were chosen for titration simulations and a field site where full chemistry and discharge measurements were obtained for the confluence of a clean carbonate-buffered stream mixing with AMD. The two AMD sample compositions were obtained from the Leviathan Mine data set [15] and the Berkeley Pit data set [16], and a spreadsheet provided by the Montana Bureau of Mines and Geology. Leviathan Mine is a USEPA Superfund site in eastern California (Figure 1). The Berkeley Pit is a large open pit filled with AMD and is a USEPA Superfund site near Butte, Montana. The Leviathan sample was identified as 82WA118 collected on 6 June 1982 near the portal of the main tunnel. The Berkeley Pit sample was collected on 4 June 2012 from a depth of 15.2 m. The field samples used for simulation of the mixing of streams were AMD sample 82WA110 from Leviathan Creek, clean tributary Mountaineer Creek sample 82WA108, and the confluent water sample 82WA109, all collected on 15 June 1982 [15].
The Leviathan Mine primarily mined sulfur. The native sulfur was used to make sulfuric acid to leach metals from rock excavated at the Yerington Pit in Nevada. Although it was a sulfur deposit, there was considerable cryptocrystalline pyrite [17] that produced AMD. Oxidation of the native sulfur did not contribute much to the AMD because the isotopic composition and trace element content clearly indicated that the pyrite was the main source of the AMD [18]; marcasite and chalcopyrite were also present but are thought to be less important than pyrite in the generation of AMD [18].
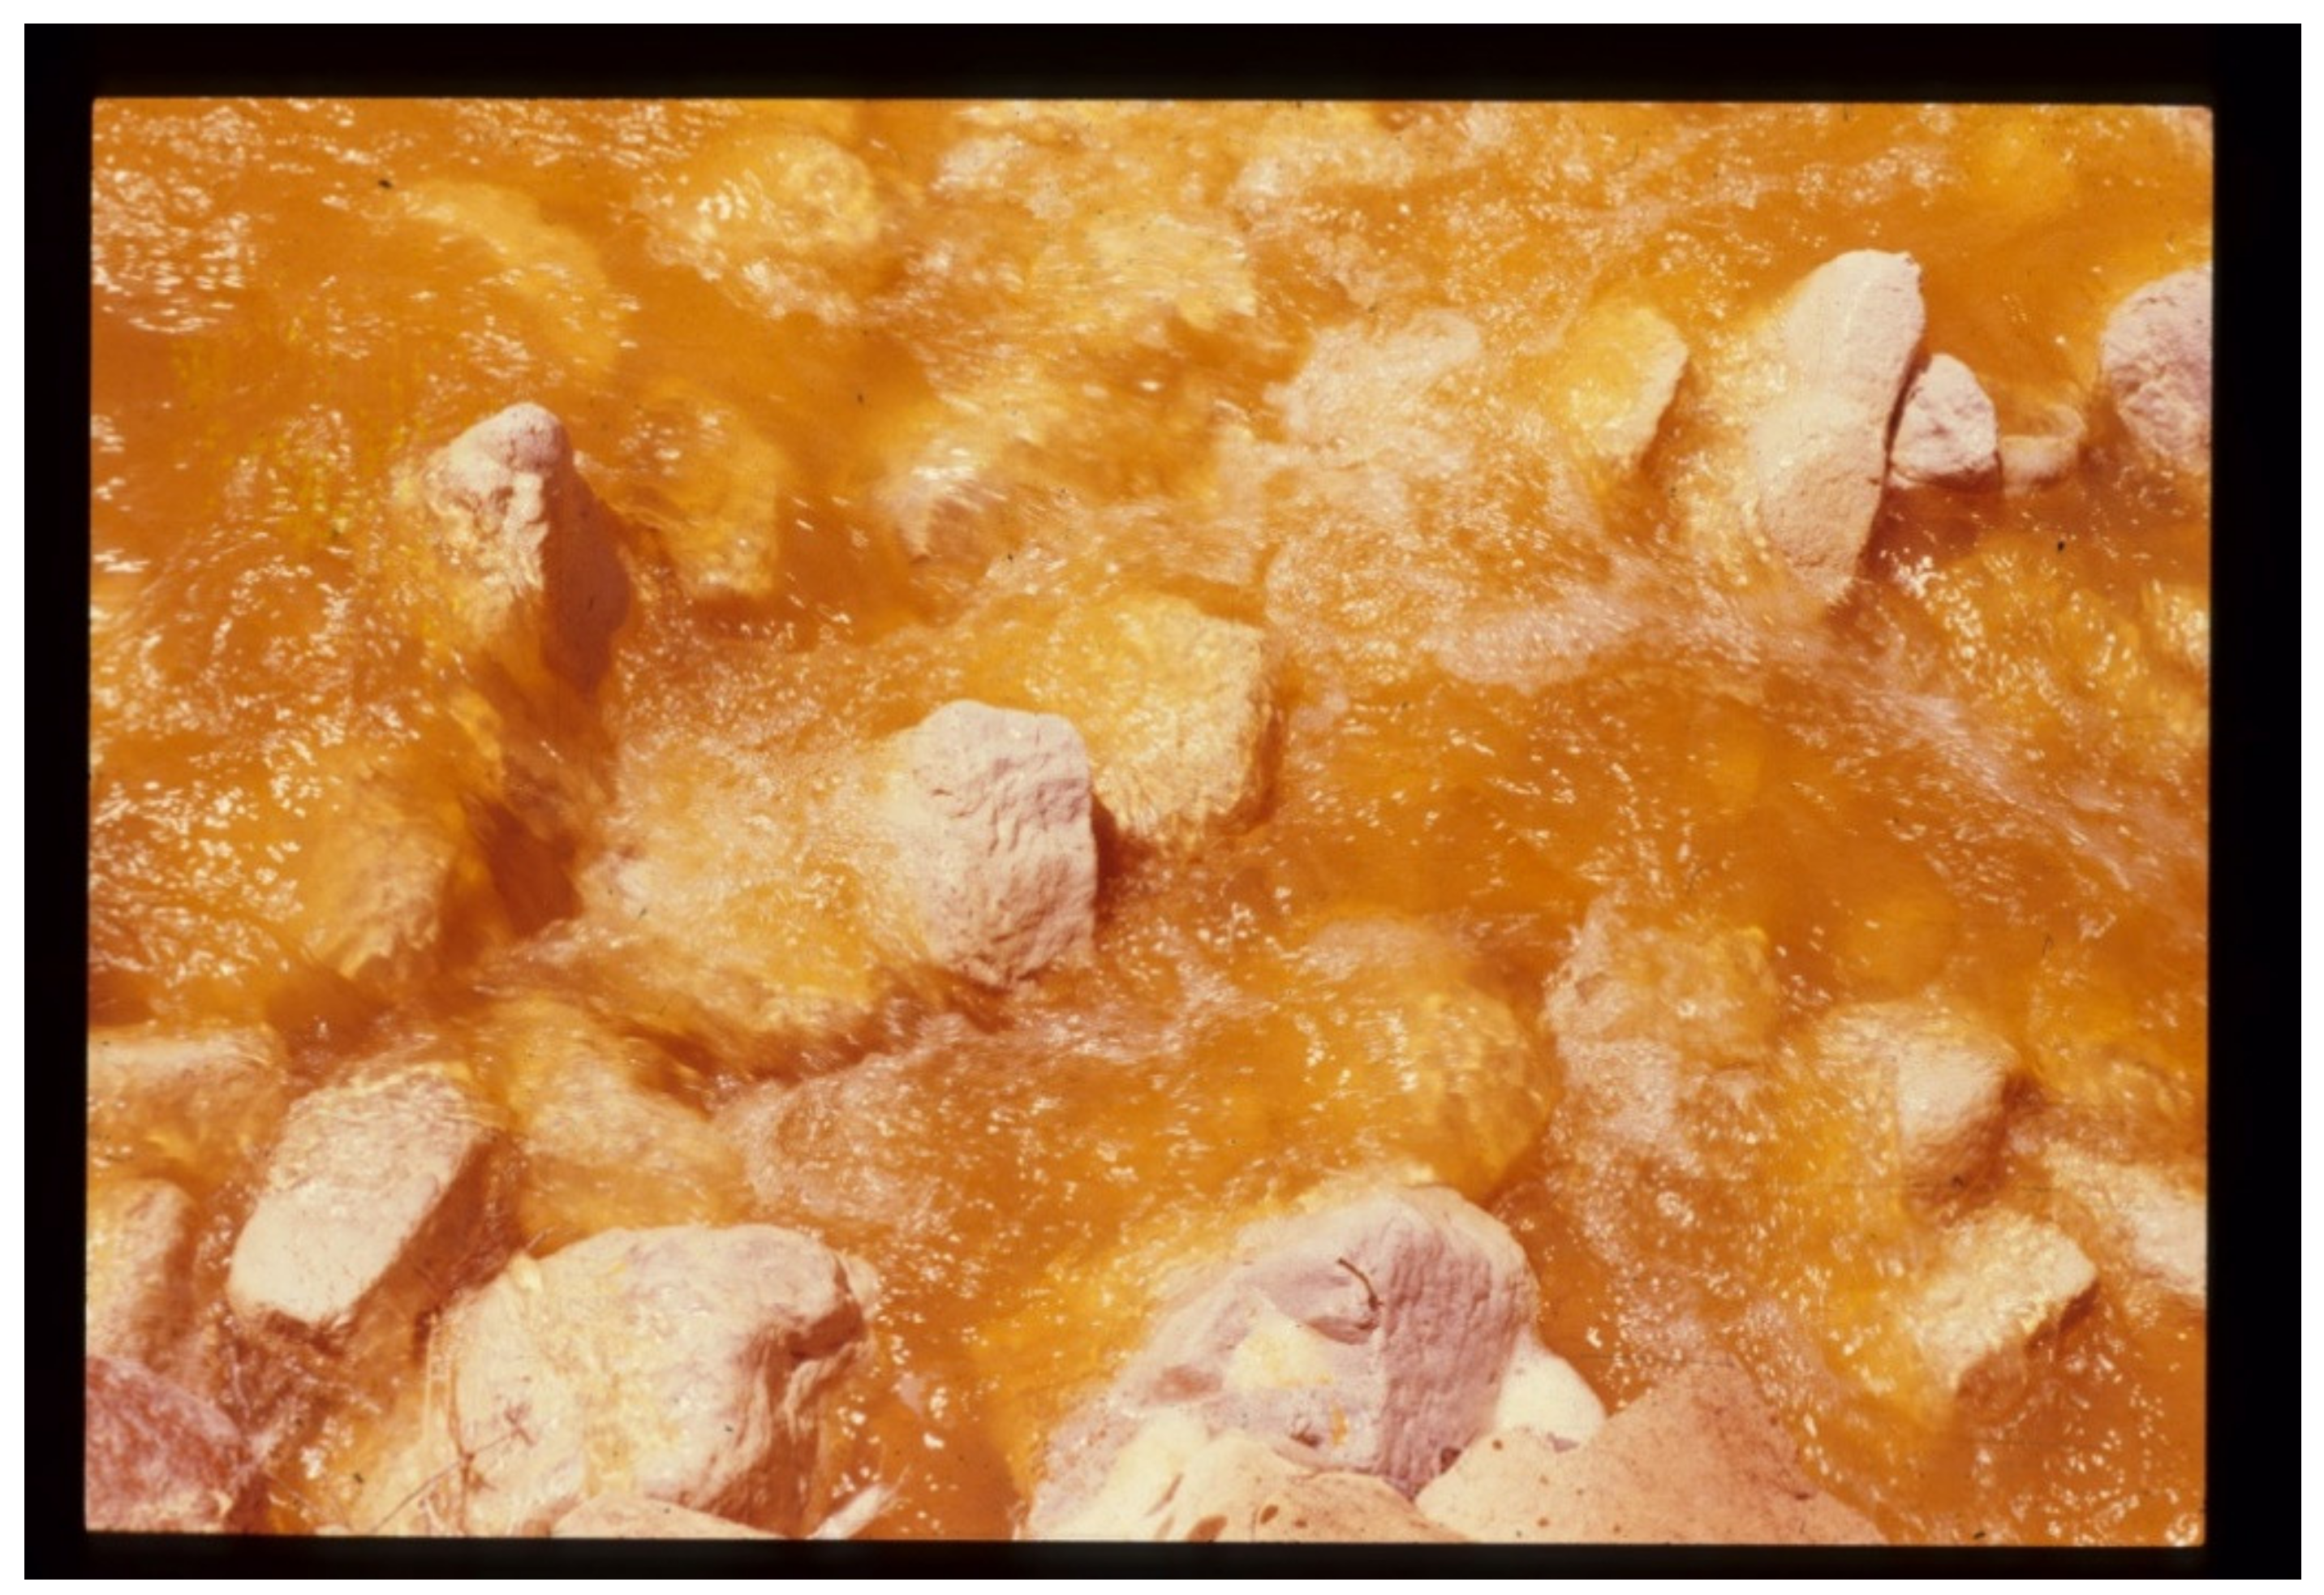
A white aluminous mineral that was observed to precipitate below the confluence of Leviathan and Mountaineer Creeks in 1981 and 1982 can be seen in Figure 2. Remediation on site since this time has eliminated these precipitates. No water with pH < 5 now leaves the mine site.
Details of sampling and analytical procedures and site locations can be found in the respective references cited above and in [19] for Leviathan data. Bottles for cations were acid washed and rinsed in distilled water. Anion bottles were thoroughly rinsed with distilled water only. The Leviathan samples were all filtered on site through 0.1 µm pore size Millipore™ membranes. Field measurements included pH, temperature, specific conductance, electromotive force (EMF, for calculation of Eh), and discharge. Cation samples were acidified with ultrapure concentrated nitric acid (2 mL per 250 mL sample). A separate bottle for Fe(II/III) and As(III/V) was collected and acidified with ultrapure (redistilled) concentrated hydrochloric acid (4 mL per 500 mL sample). All cation samples had a pH ≤ 1.5 after acidification. Anion samples were filtered and kept chilled.
Analytical results were of high quality because three different techniques were used to confirm the metal and metalloid concentrations: direct-current plasma spectrometry, inductively coupled plasma spectrometry, and Zeeman-corrected graphite furnace atomic absorption spectrometry in a comprehensive analytical evaluation [20]. Charge balances were between −5% and +6% and mostly <±3%. Dissolved iron redox species were determined by FerroZine colorimetry and arsenic redox species by hydride generation atomic absorption spectrometry. Six U.S. Geological Survey (USGS) standard reference water samples were analyzed to check the accuracy and precision including two samples that were typical of acid mine water compositions.
Discharge data were collected using a Pygmy current meter or standard size current meter to record velocity and cross-sectional area was measured from the width and depth of the streams with tape measurements at appropriate intervals.
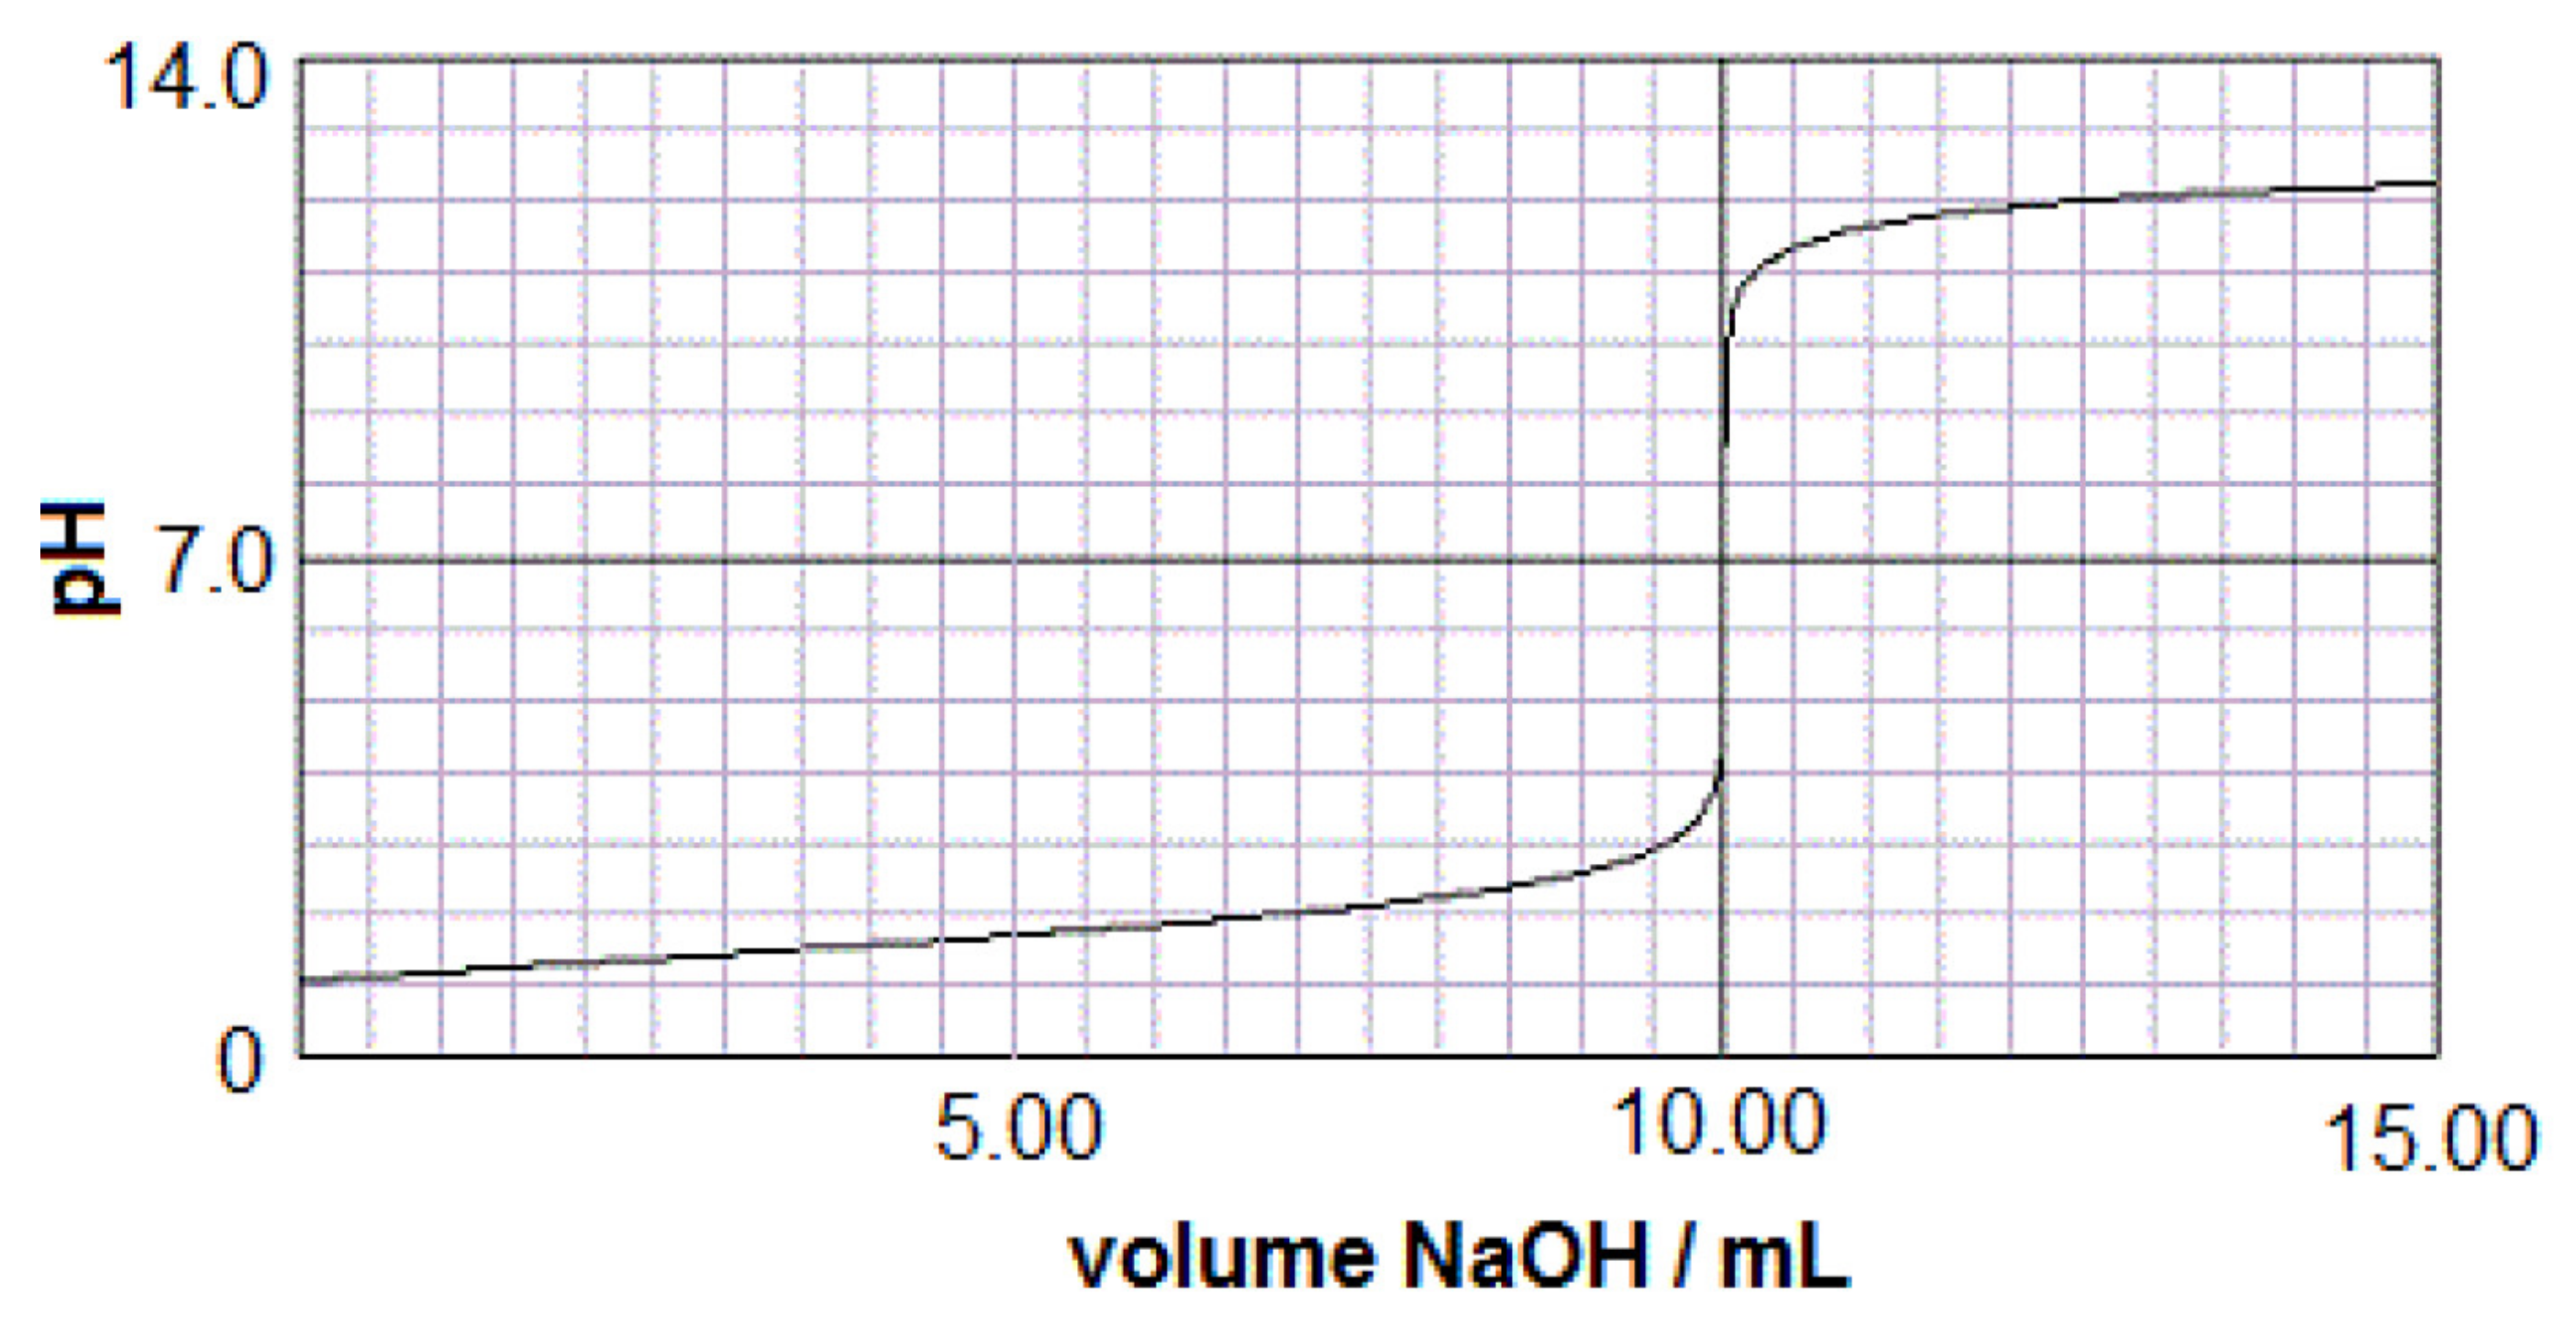
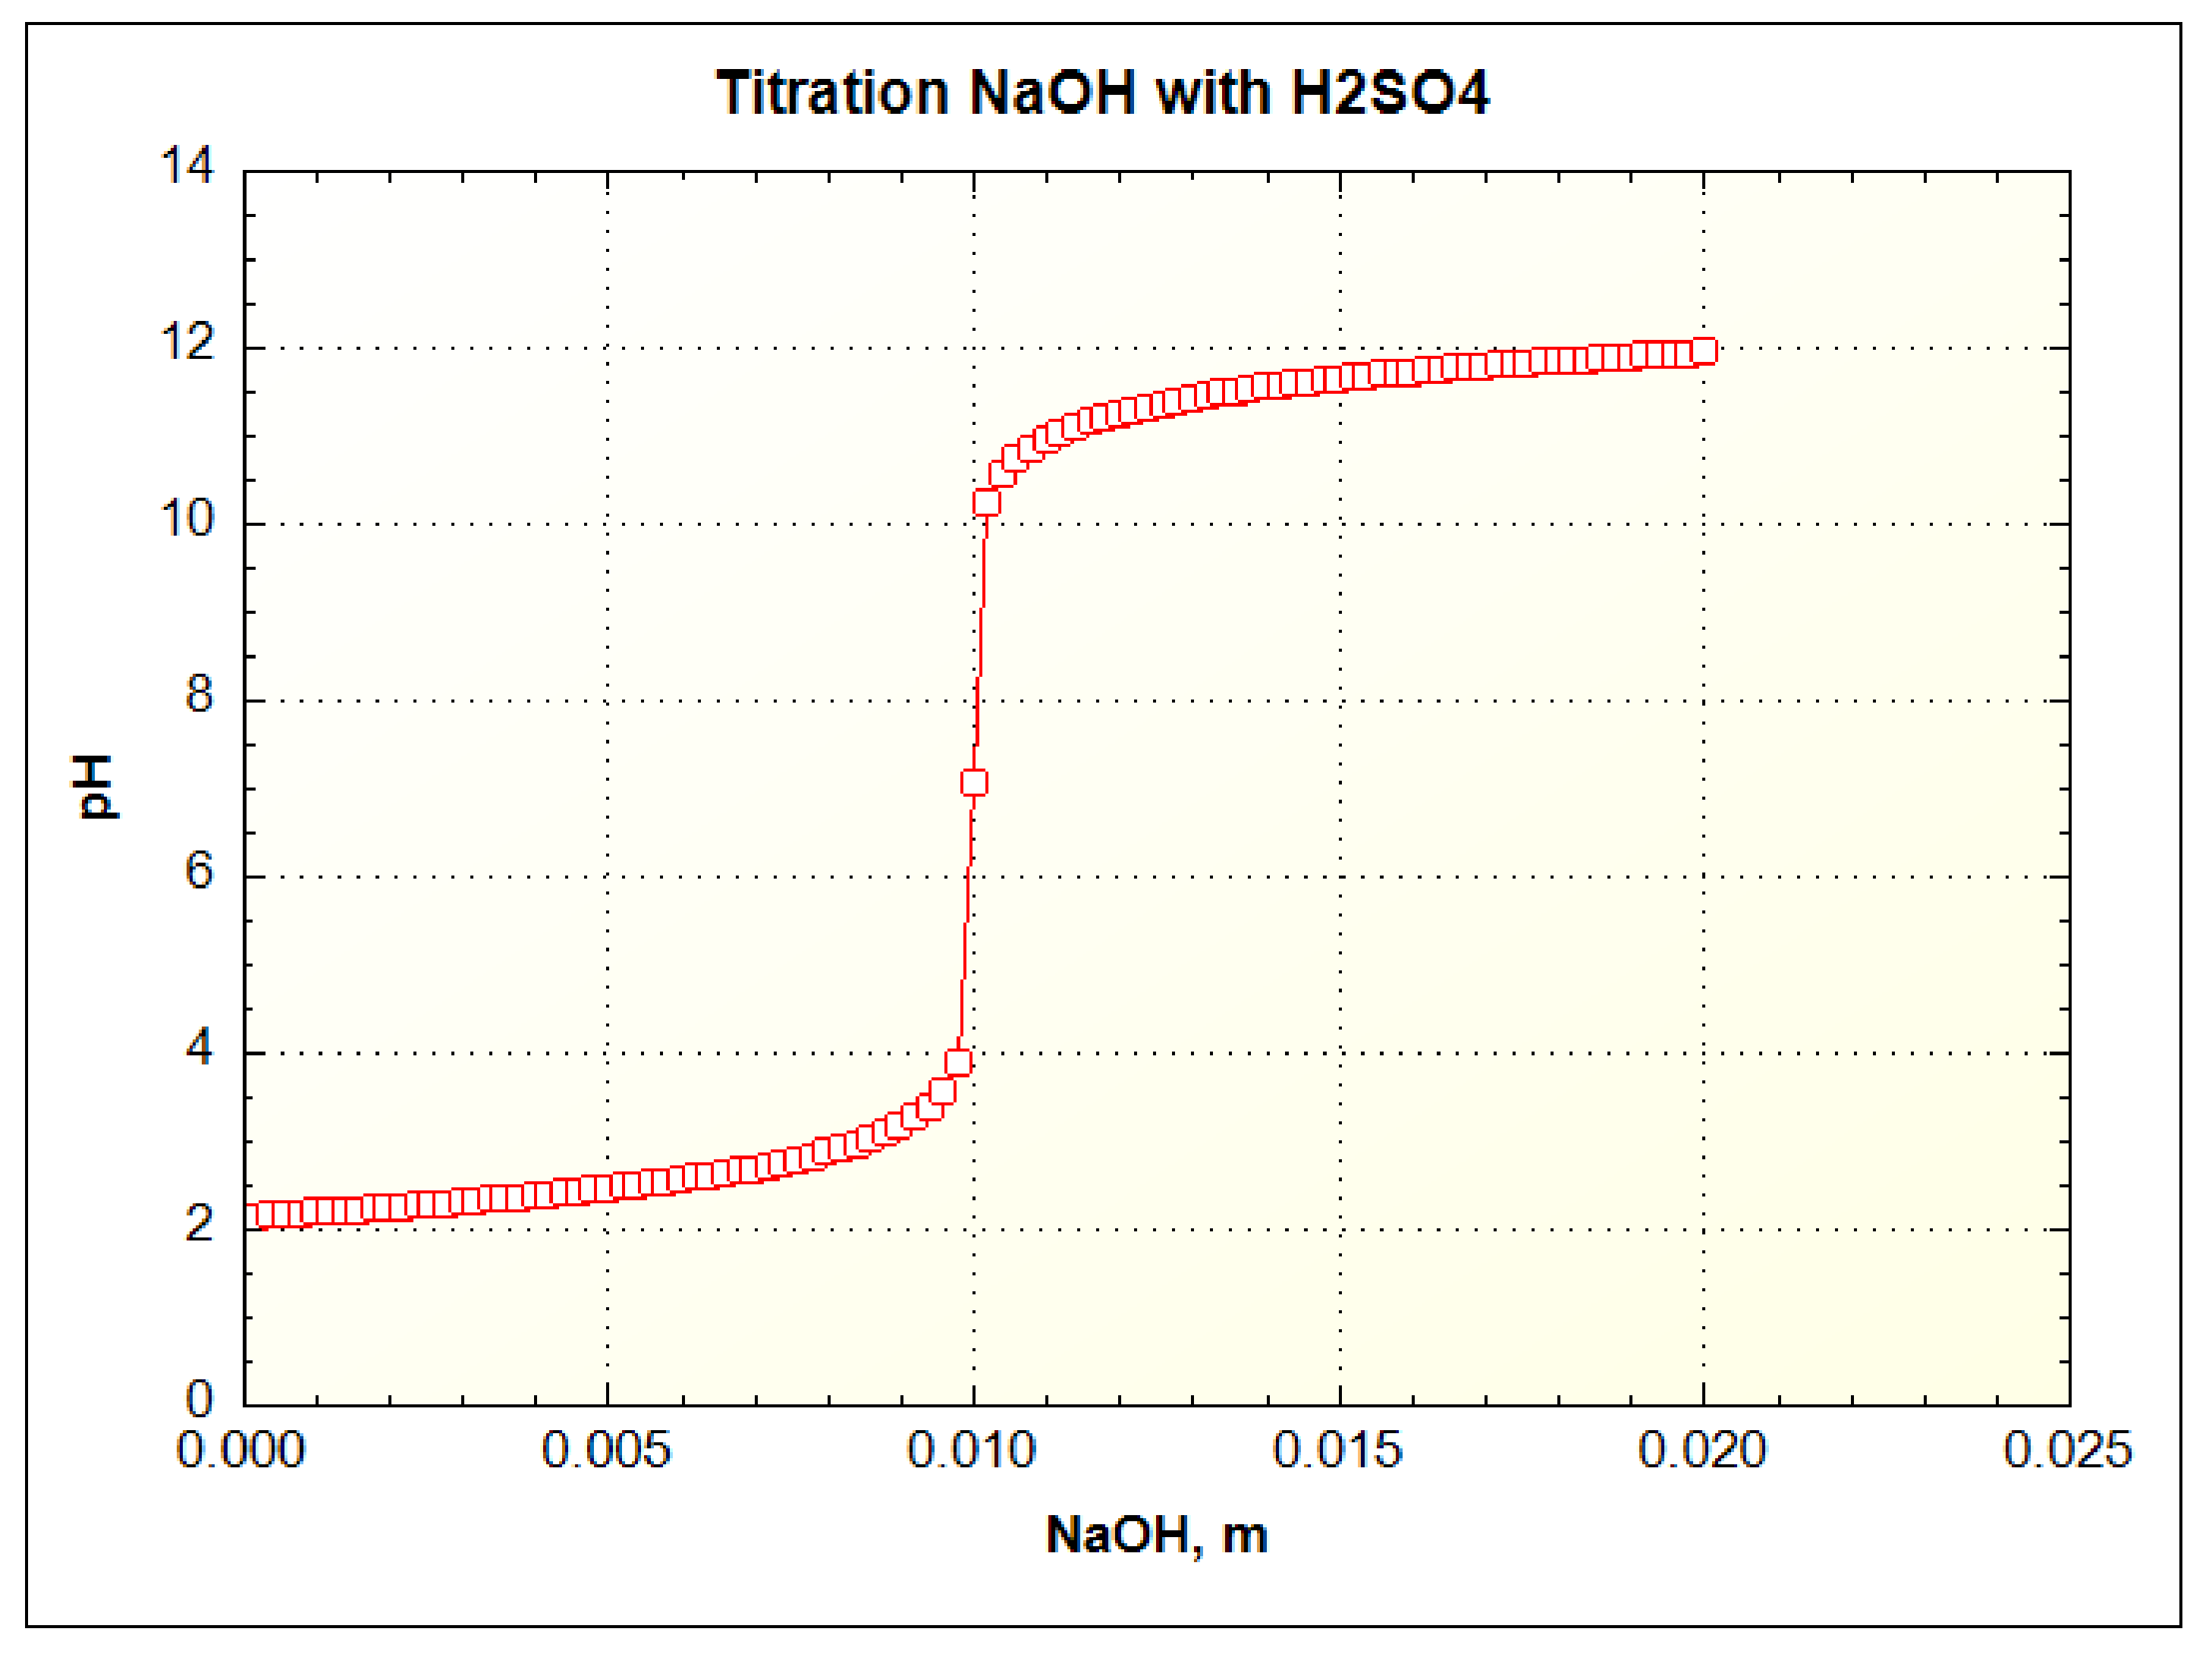
As a test of a titration simulation with PHREEQC, a sulfuric acid solution was titrated with sodium hydroxide. A typical strong acid–strong base titration of this type is shown in Figure 3 for 5 mL of 0.1 m H2SO4 with 0.1 m NaOH. Using the REACT command in PHREEQC only the proportion of the two solutions is needed and the graphical titration results should be the same with the same moles of base per mole of acid. As can be seen by the results in Figure 4, the titration curve is the same with the same inflection point at a pH = 7 and the same number of milliequivalents.
Choices must be made about what minerals should be allowed to precipitate during the simulation of AMD titrations and what solubility product constants should be used. For these simulations “amorphous” Fe(OH)3 with a log Ksp = 3.0 [21,22], and “amorphous” basaluminite with log Ksp = 24.0 [23,24] were used. The effect of changing these solubility product constants to other phases such as goethite and schwertmannite for the iron precipitate and gibbsite for the aluminum precipitate was tested to determine that effect on the results for the field data. Because of the possibility of gypsum, calcite, and portlandite precipitating in the base titrations, these phases were forced to precipitate if they reached saturation.
The presence or absence of CO2(g) also makes a difference to the titration curve at pH values above 7 so the log PCO2 was set at −3.5 (near atmospheric value). Today’s atmospheric log PCO2 is actually closer to −3.38 and is increasing over time but this small difference has negligible effect on the results.
3. Results and Discussion
3.1. Titration Results of Leviathan Mine Water with Ca(OH)2
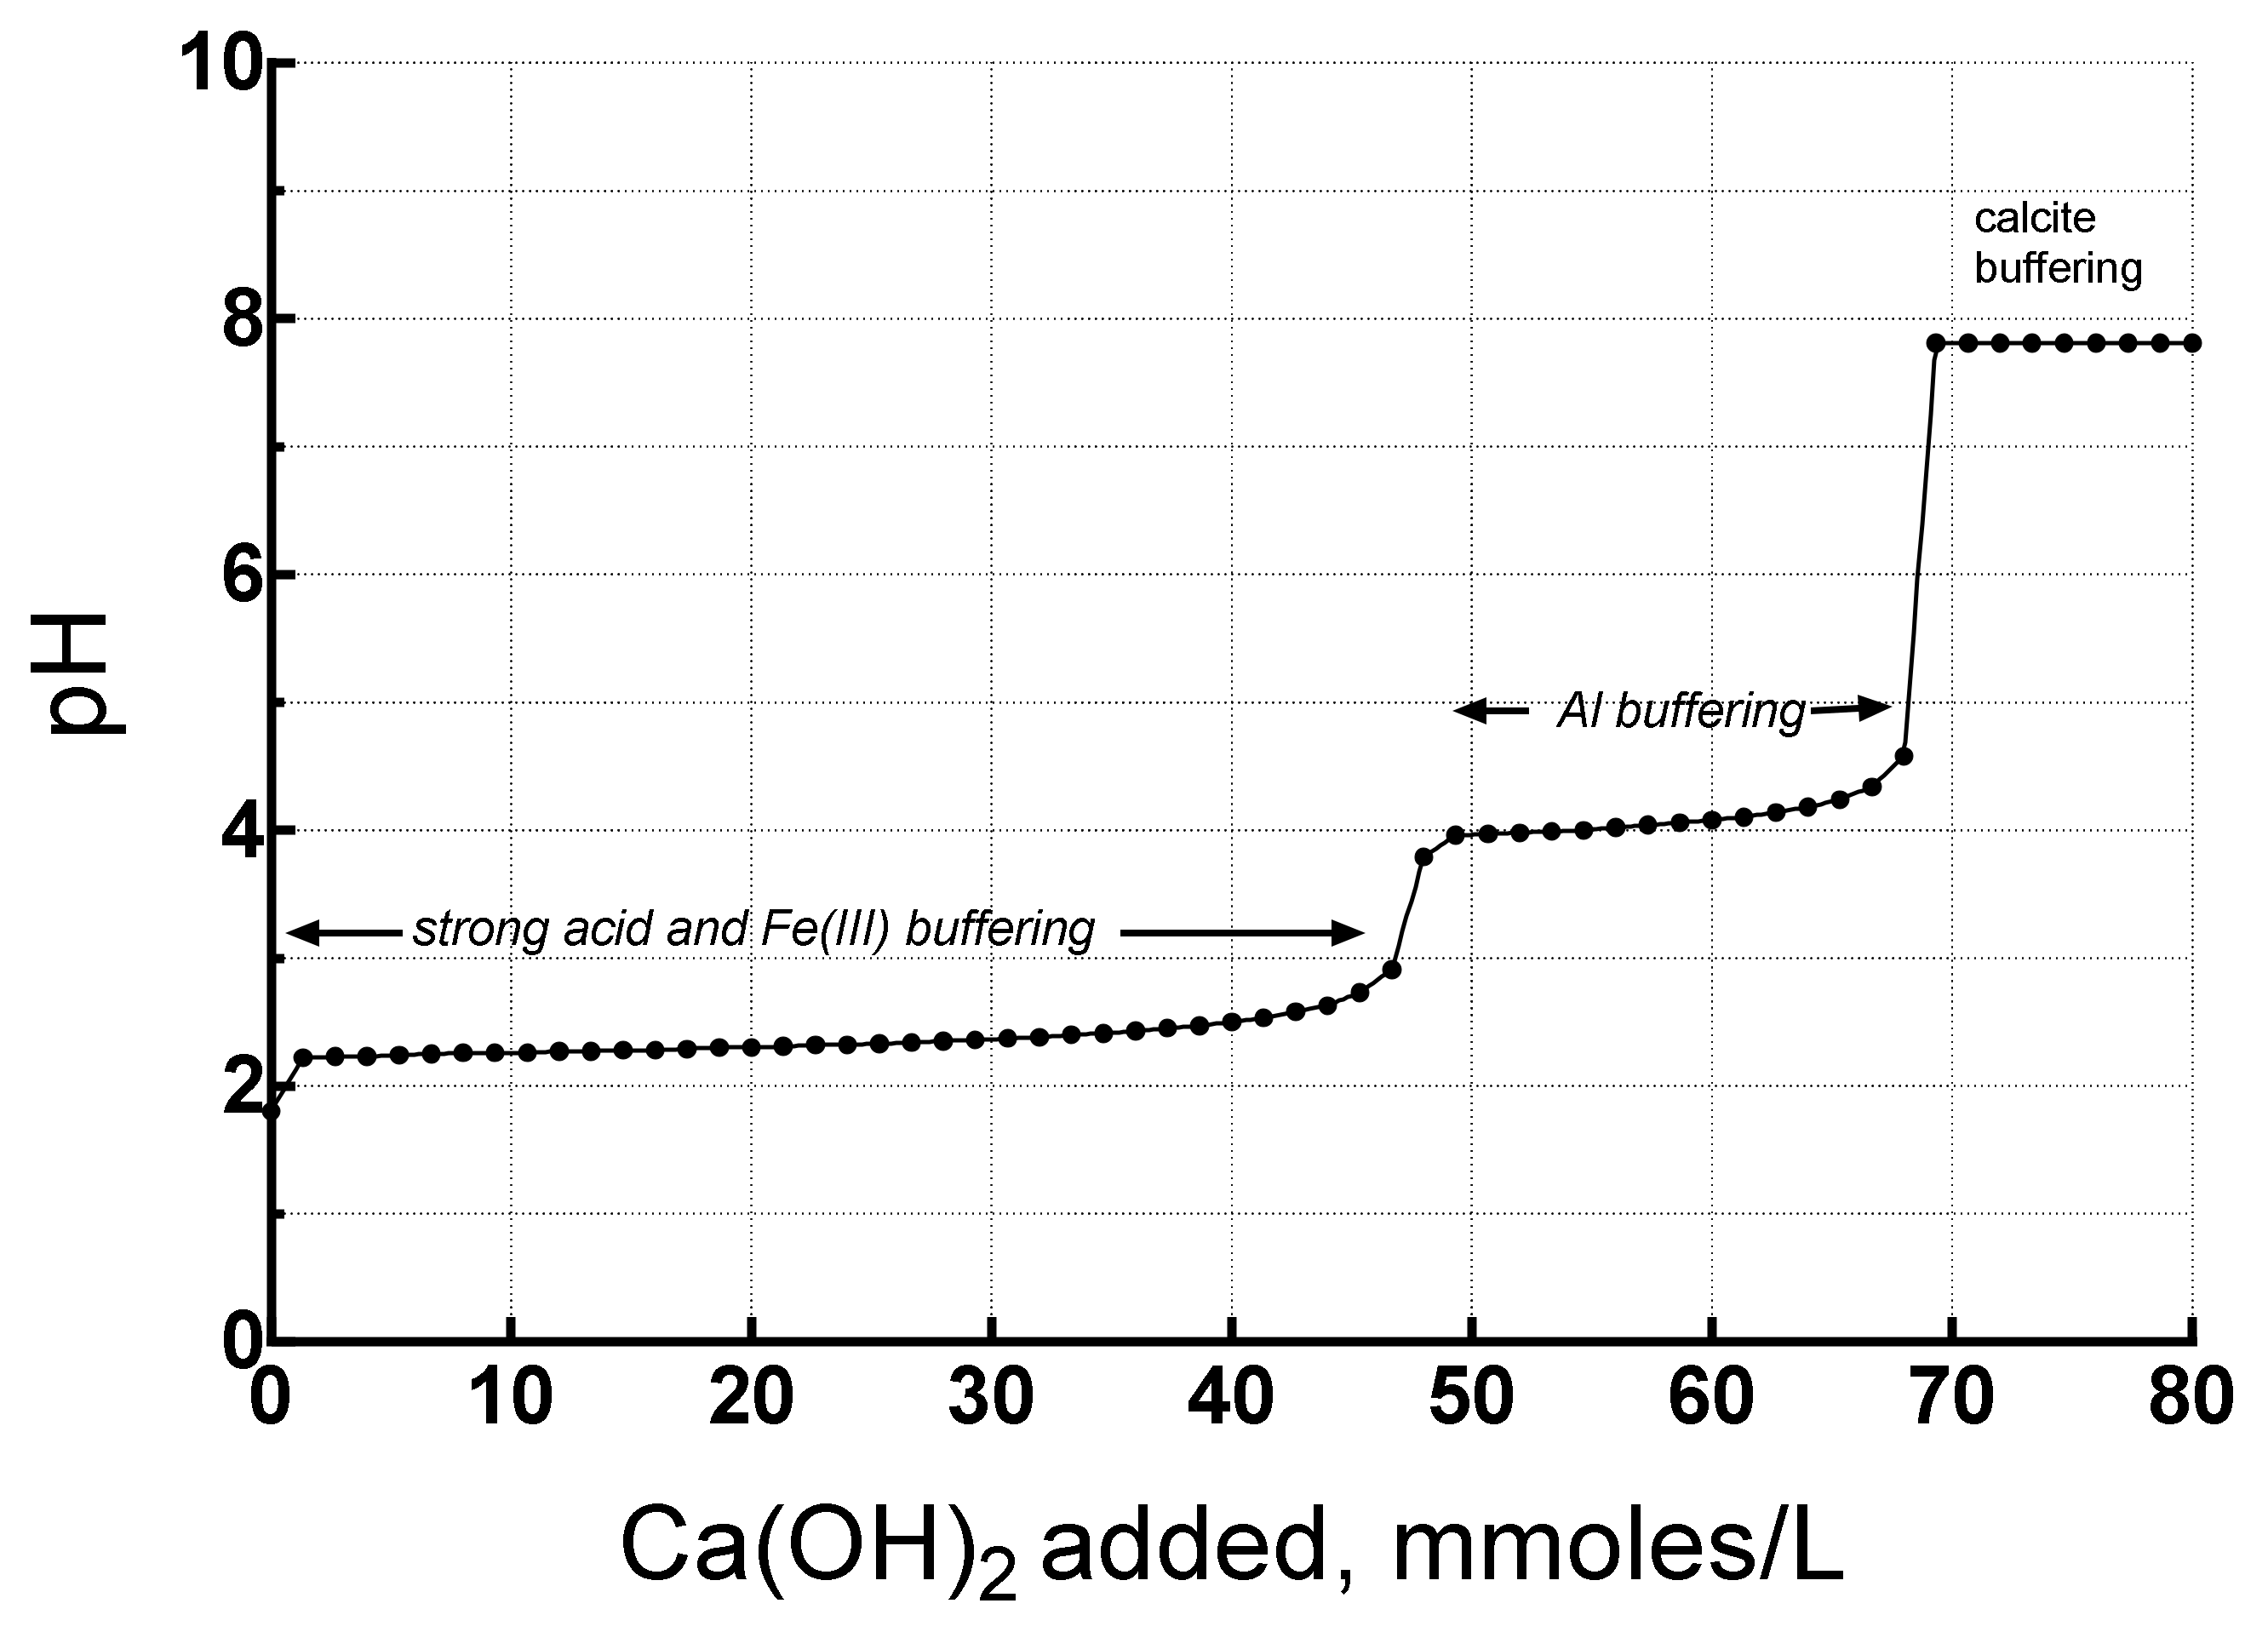
The first titration simulated using actual AMD compositions is the Leviathan Mine water with initial pH of 1.80, 1570 mg Fe/L, 438 mg Al/L and 7,540 mg SO4/L. Nearly 92% of the Fe was present as Fe(II) in the immediate portal drainage water, but during an oxygenated titration it would become Fe(III) so it was assumed to be Fe(III) for the whole simulation. To set this constraint, the solution was kept in equilibrium with atmospheric oxygen. To begin with the actual redox speciation, oxidation kinetics would have had to be built into the simulation. To simulate the kinetics would require a large amount of data and information that would vary from site to site and not easily definable beforehand. Furthermore, the rate of oxidation will depend on the experimental conditions of the titration for which several different methods exist. More importantly, dissolved Fe(II) oxidizes rather quickly from microbial activity so that the assumption of the Fe(III) = FeT is a reasonable approximation if the sample is not filtered. A graph of the titration is shown in Figure 5.
Three pH plateaus are visible at 2.2–2.6, 4, and 7.8. These plateaus indicate buffering. The plateau below pH 3 is buffering by strong acid and Fe(III) hydrolysis and precipitation. The buffering by the second hydrolysis of H2SO4 has a pK2 = 1.98, very close to the pK1 = 2.19 for Fe(III) so that their buffering reactions overlap substantially. The 45 mmoles of base required to neutralize this acidity is about 66% of the total acidity. The plateau at pH 4 reflects buffering by Al hydrolysis and precipitation which has been elucidated by [25,26,27] for mine tailings. Once the acidity from Al has been neutralized, the pH increases until buffering by calcite predominates at pH 7.8. Note that about 68 mmoles of portlandite were required to neutralize this AMD to a pH of 7. Next, we compare these results with those of a Berkeley Pit water titration.
3.2. Titration Results of Berkeley Pit Water with Ca(OH)2
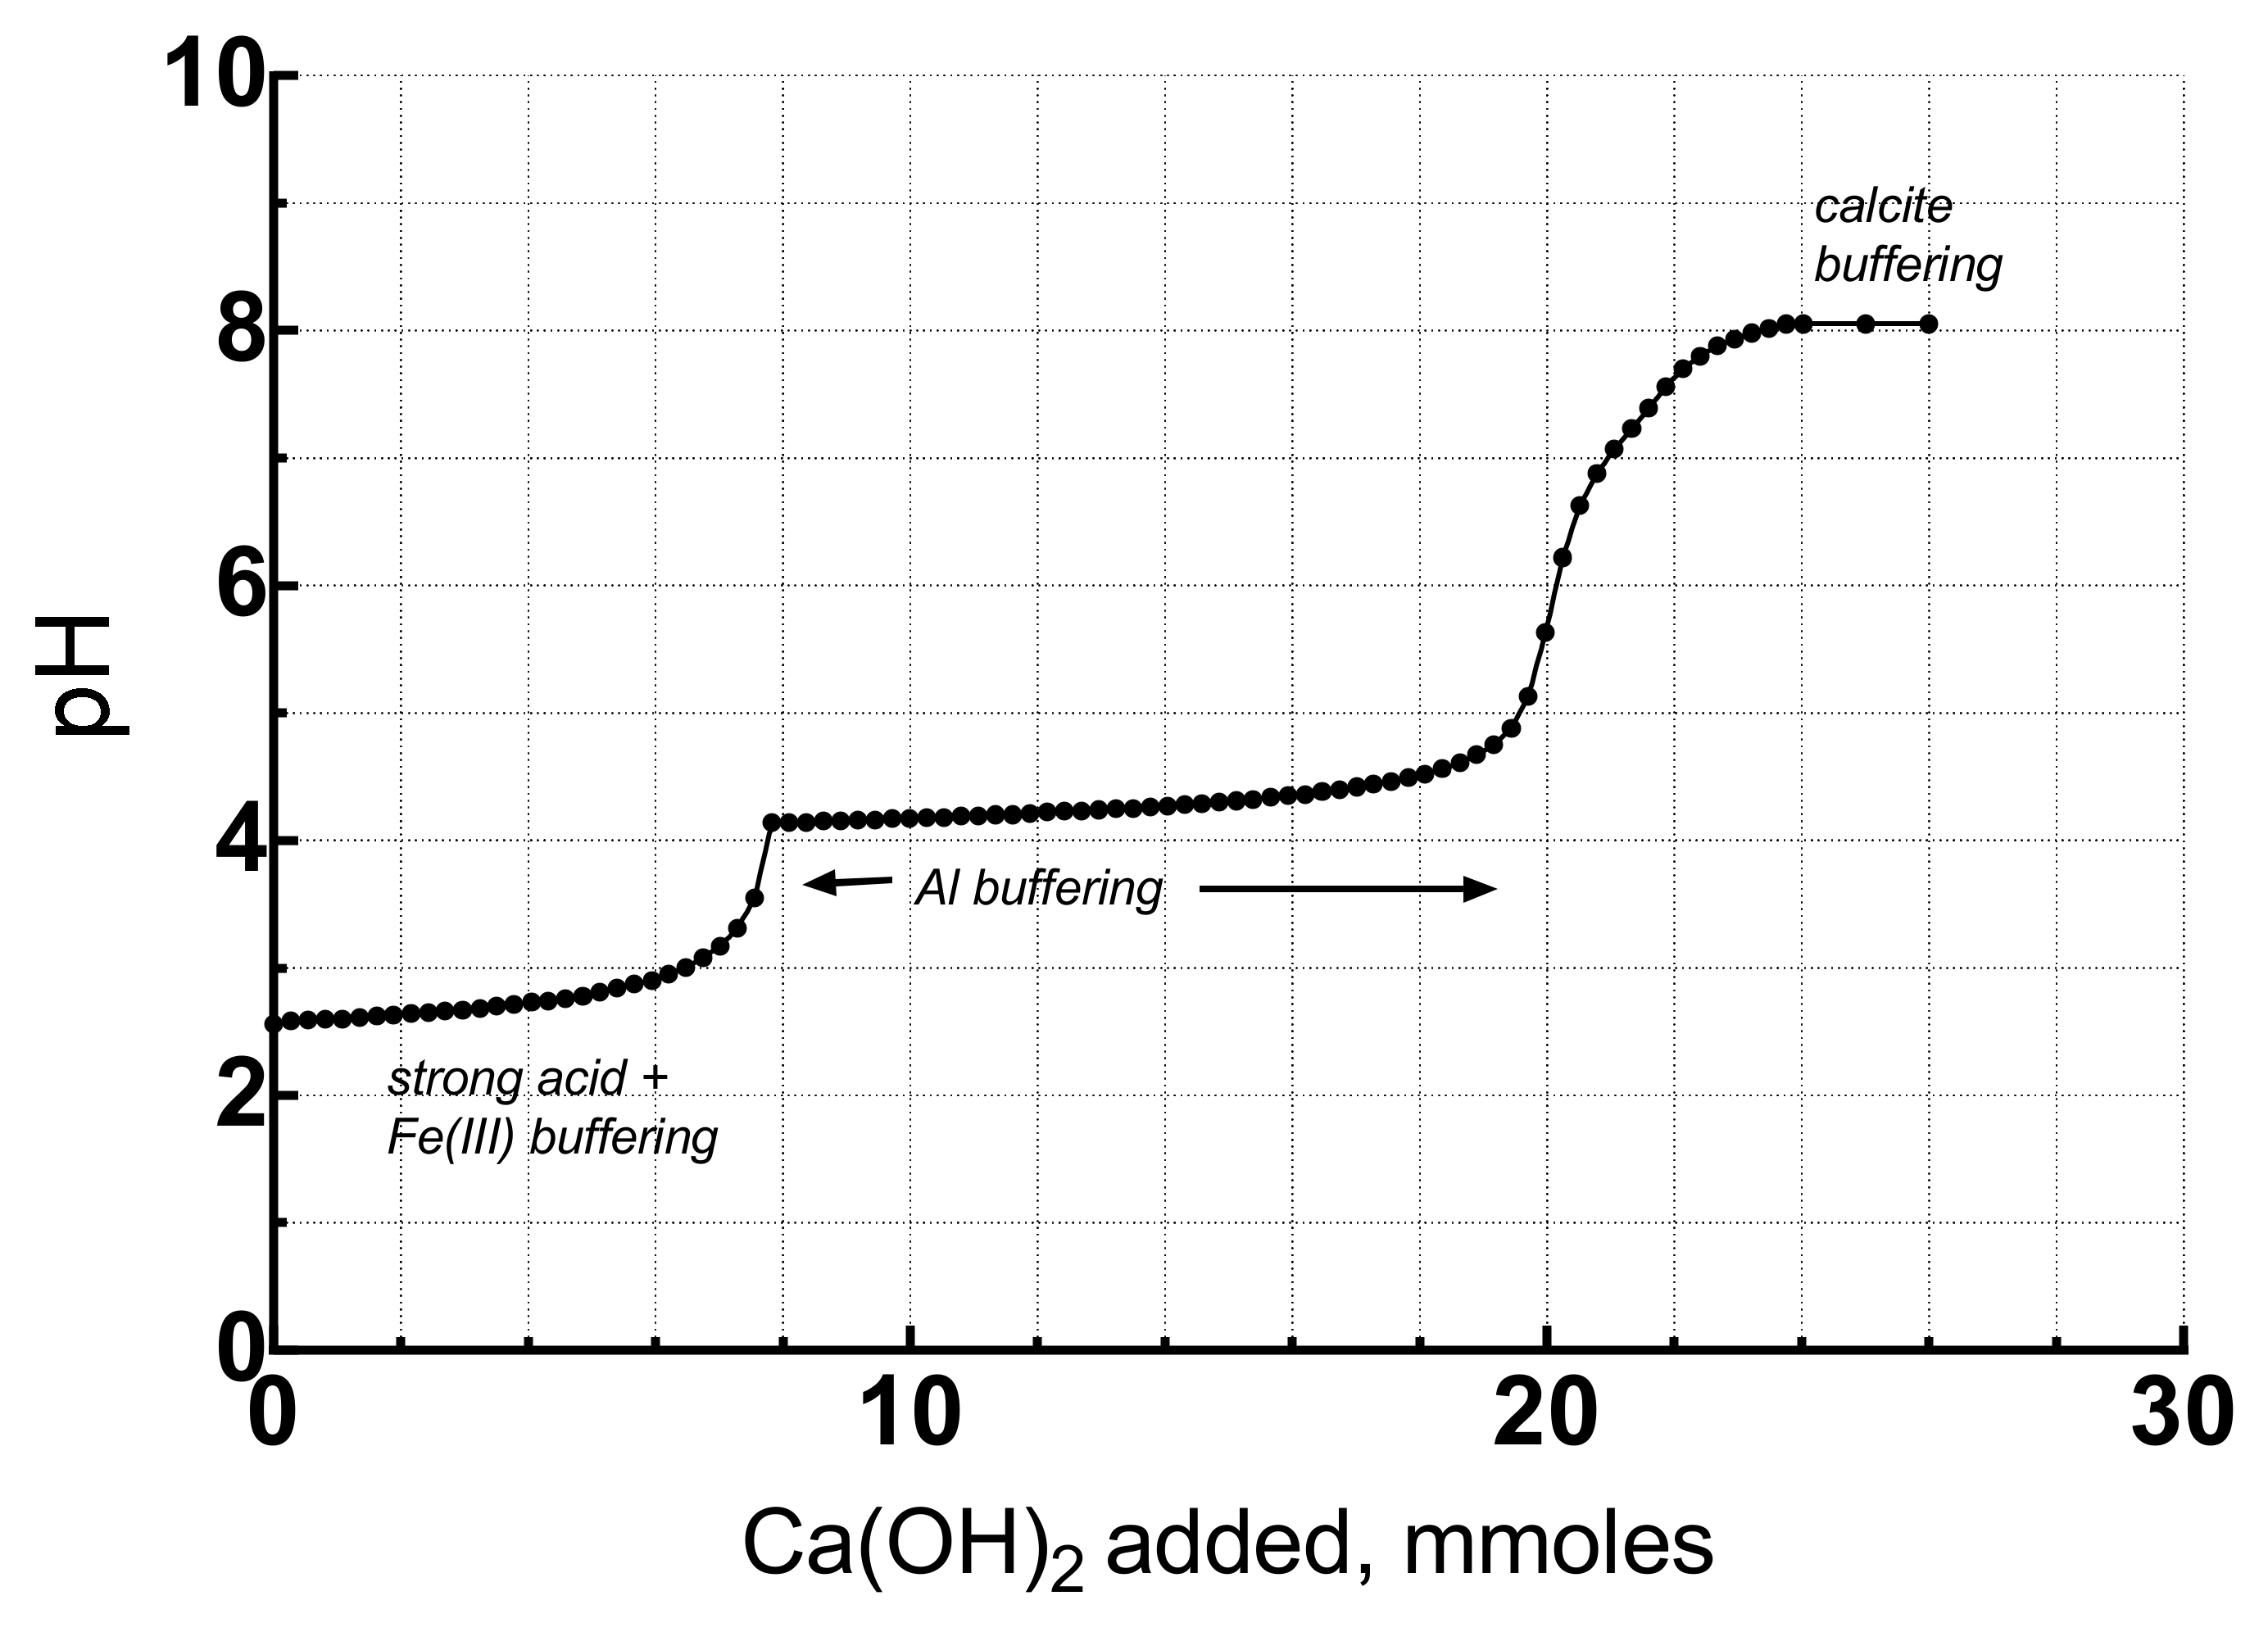
Figure 6 shows the Berkeley Pit titrated with portlandite and a few important differences with the Leviathan AMD titration are worth noting. The Berkeley Pit water had a pH of 2.56, 277 mg Al/L, 246 mg Fe/L, and 8005 mg SO4/L. The SO4 concentrations were nearly the same but the Fe and Al concentrations were notably lower than those for the Leviathan Mine water, and the pH was higher. The dissolved Fe concentration is only 16% of the Fe concentration in the Leviathan Mine water. The first important result is that the amount of portlandite needed to neutralize this water to a pH near 7 is about 21 mmoles, which is substantially less than the 68 mmoles of base needed to neutralize the Leviathan Mine water. The reason is the amount of strong acid in the Leviathan water was greater and the amount of hydrolyzable Fe and Al was greater for the Leviathan water. The amount of base to neutralize Al at pH 4 took only about 10 mmoles of base for the Berkeley Pit water whereas the Leviathan water took about 20 mmoles, which is consistent with the Berkeley Pit having 50% of the Al concentration of the Leviathan sample.
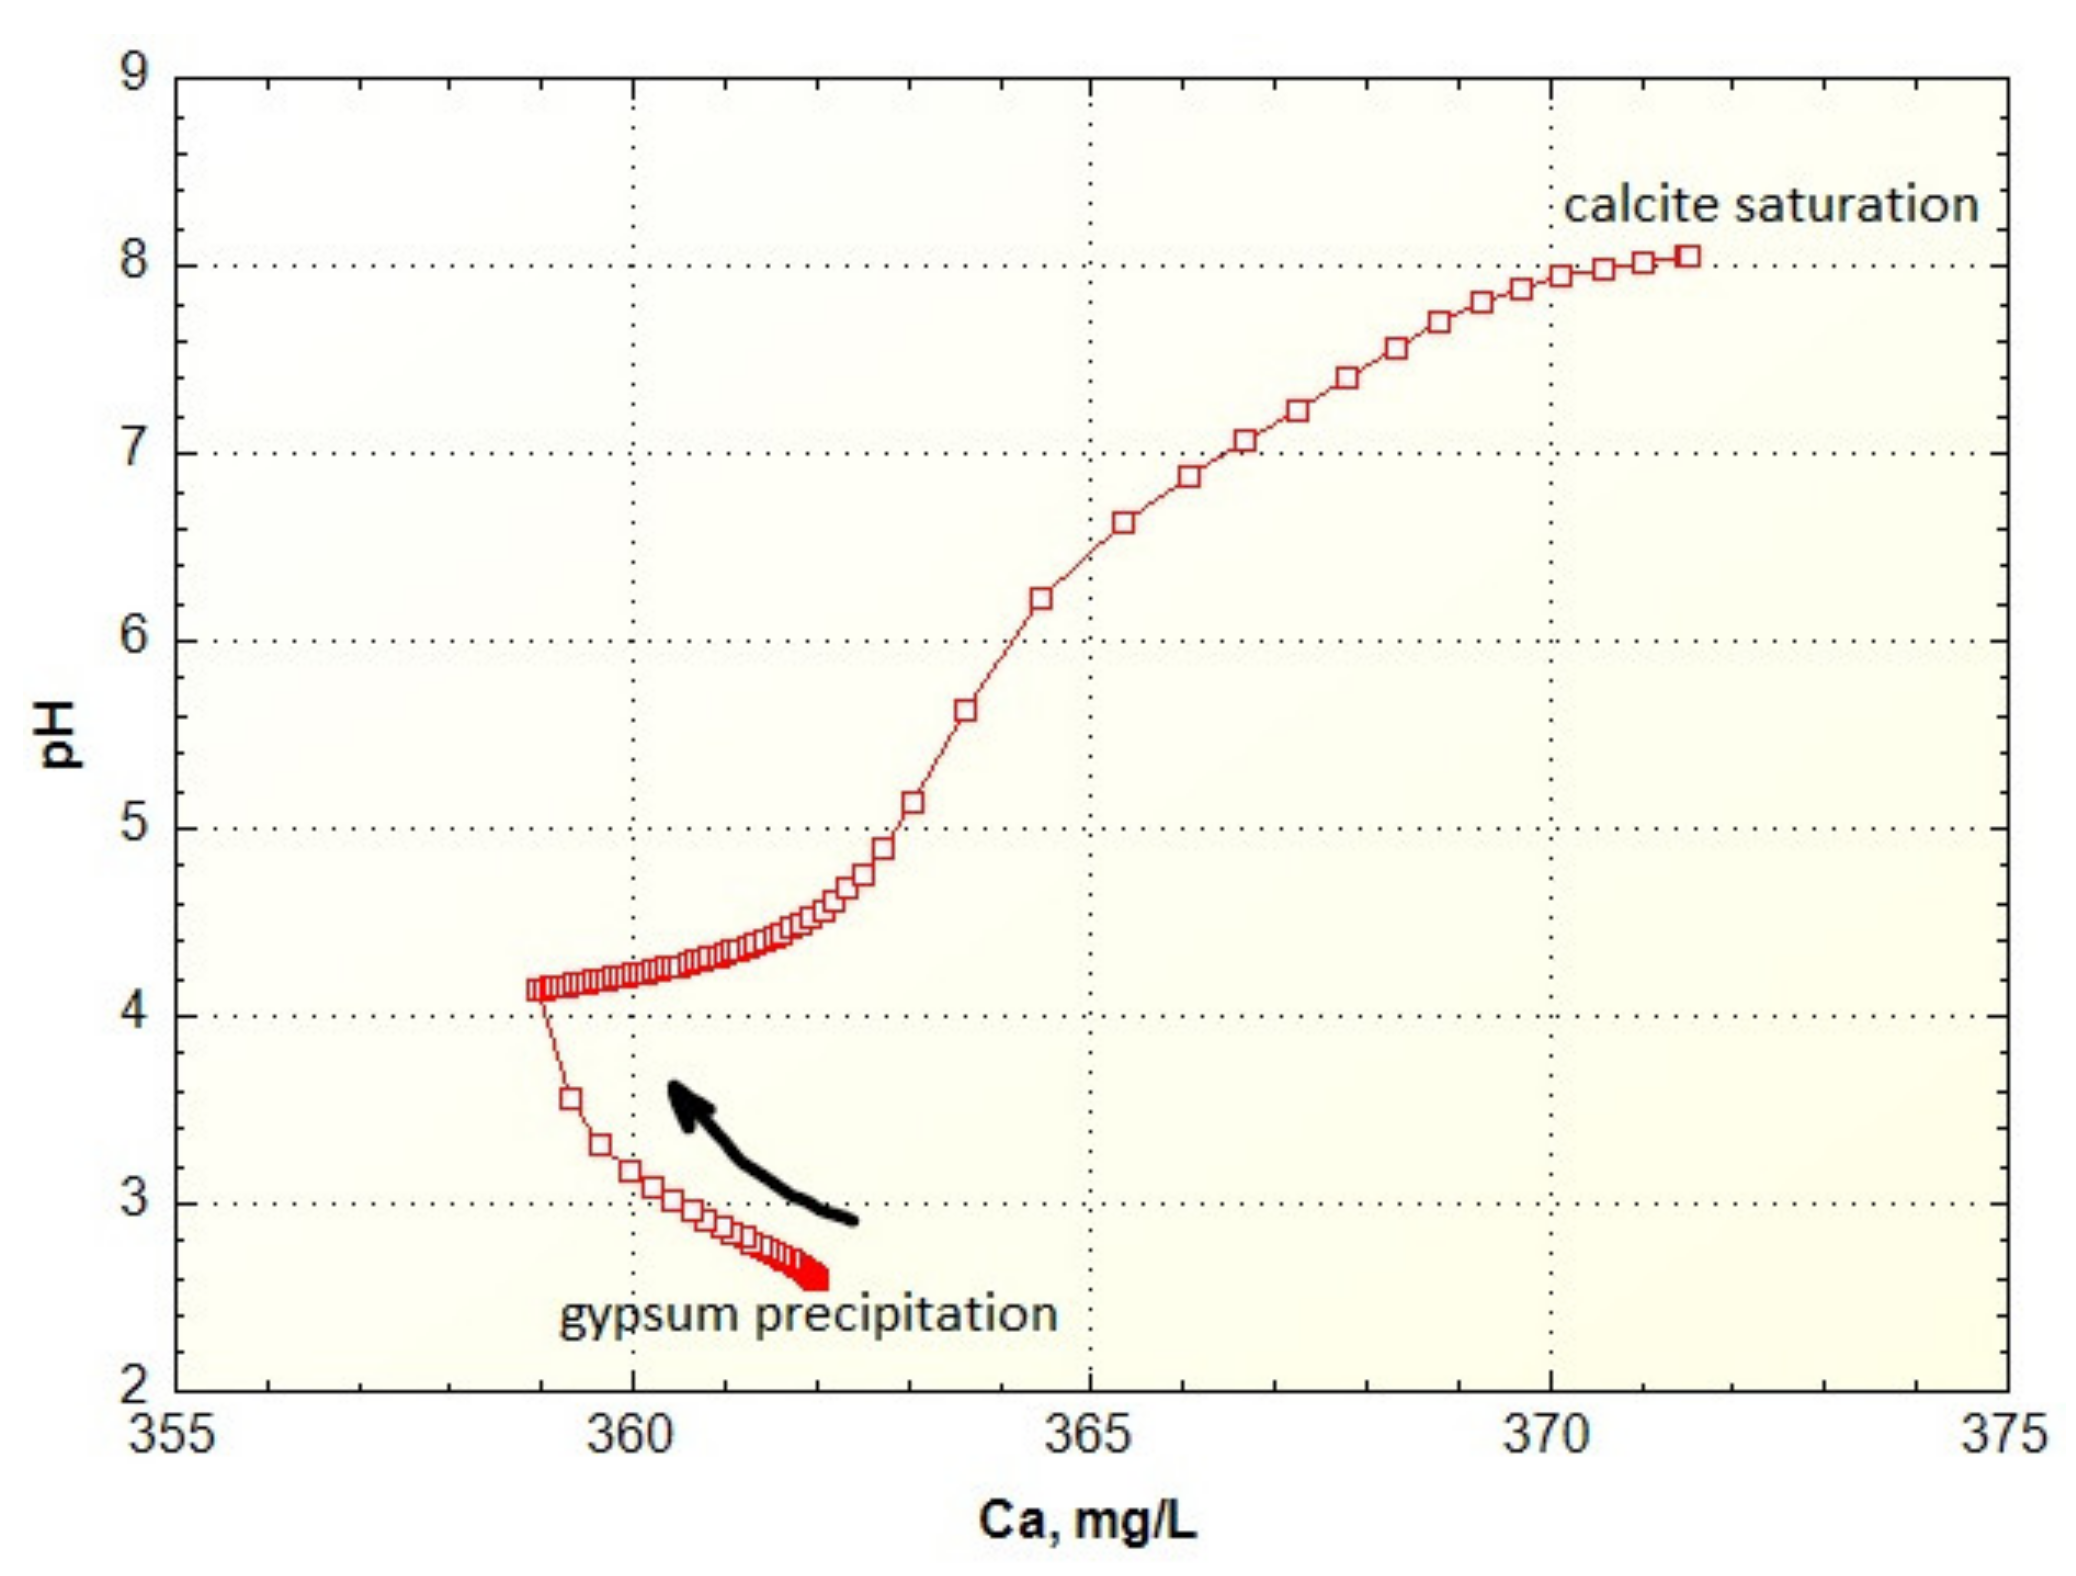
The Ca concentrations (or any other solute concentration) can be followed with the USER GRAPH routine in PHREEQC as shown in Figure 7 for the Berkeley Pit titration. The water is at saturation with respect to gypsum initially so that as portlandite is added, more gypsum precipitates and the Ca concentration decreases until all the SO4 that can react with the portlandite is used up. After that the Ca concentration increases until it reaches calcite solubility equilibrium at about pH 8.
3.3. Mixing of Leviathan AMD with a Clean Tributary
The AMD from the Leviathan mine flowed into Leviathan Creek which was diluted by some clean tributaries before it reached its confluence with Mountaineer Creek. Just before the confluence, the pH was 3.25 on 15 June 1982 and the water composition is shown in Table 1 along with the composition of Mountaineer Creek just upstream of the confluence.
A sequence of simulations or scenarios was chosen, beginning with simple mixing with no reaction—the conservative mixing scenario. With increasing complexity and sophistication of each reaction modeling scenario, the results from each model simulation were compared to the actual field data. The conservative model is scenario A; scenario B is mixing with crystalline goethite and crystalline gibbsite as precipitates for Fe and Al; scenario C is mixing with precipitation of amorphous Fe(OH)3 and amorphous Al(OH)3 as precipitates; scenario D is mixing with log Ksp = 3.0 for amorphous Fe(OH)3 [21,22] and amorphous basaluminite with log Ksp = 24.0 [23,28]; scenario E is the same as scenario D but substituting a schwertmannite log Ksp = 18.5 which agrees generally with the results of [1,24,29,30] and the formula would be Fe8O8(OH)5.48(SO4)1.26 (See Supplementary Materials for an example of PHREEQCI input for this calculation). Results for these simulations are shown in Table 2, where “Measured” indicates the composition of Leviathan Creek below the confluence with Mountaineer Creek.
Any difference in concentration between the mixed water in scenario A and the “Measured” data set is an indication of the amount of reaction that must have occurred from precipitation or sorption. Several constituents are close enough in concentration (within analytical error) between scenario A and “Measured” that they can be considered “conservative,” in that they are not entering into detectable reaction: Ba, Ca, Cd, F, Mg, and Sr. Those constituents that are clearly “non-conservative” are pH, Al, HCO3 (not alkalinity), and Fe. Then there are a few constituents that are borderline: Cu, K, Mn, Na, SiO2, and SO4; these shall be addressed later. The other important aspect to note about scenario A is that there is much more acidity stored in reacting constituents than results from simple mixing and this acidity comes from Fe and Al hydrolysis as seen by the titration plots shown previously.
Scenario B computes a pH that is too low because crystalline goethite and gibbsite were chosen to precipitate, requiring more base to neutralize these phases because they are less soluble than the phases normally found precipitating in AMD. With more Fe and Al hydrolysis, more acidity is produced, and the resultant pH is lower than the actual measured value. The calculated Fe concentration is also much too low compared to the measured value.
Scenario C is the other extremum where the chosen precipitating phases are the more soluble amorphous Fe(OH)3 and amorphous Al(OH)3 phases. Now the pH is too high because a much smaller quantity of Al precipitated and the dissolved Al is too high, although the Fe is still too low.
Scenario D uses an adjusted log Ksp for amorphous Fe(OH)3 which is consistent with the field data reported by [21,22] as previously mentioned. It also uses amorphous basaluminite instead of a gibbsite-type phase. Now the pH is more reasonable and the SO4 concentration does decrease slightly because of basaluminite precipitation.
In scenario E, conditions were kept the same as in scenario D except that schwertmannite was substituted for amorphous Fe(OH)3. Schwertmannite has a somewhat variable stoichiometry which makes it difficult to designate a Ksp [31], so a commonly found value was used as mentioned above primarily to see what effect it had on the results. Indeed, the results were the same as scenario D except that the Fe concentration was a bit higher, the Al concentration was a bit lower, and the SO4 concentration a bit lower. The change in SO4 concentration, although small, is consistent with the precipitation of Fe and Al hydroxysulfate minerals. To show the effect of a small change in the mixing proportions, the discharge of Leviathan Creek was changed from 44% of the total to 42% of the total so that the pH might make a better match. These values are shown in parentheses in scenario E of Table 2. Changing the relative discharges does not really improve the overall mass balances. The important constituent to note is the SO4 concentration which is worse and would argue against any changes in relative discharges.
Recalling the “borderline” constituents Cu, K, Mn, Na, SiO2, and SO4 the following can be suggested. Copper may be exhibiting a real decrease through sorption and has been modeled for the overall drainage by [19]. The change in K concentration is considered to be within analytical error. The small change in Mn concentration is likely real and reflecting a precipitate or co-precipitate of some oxide or hydroxide of Mn. The small decrease in Na concentration could be real or could be analytical error. The small decrease in silica concentration is considered real because there is some association of silica with secondary Fe and Al precipitates [32]. Indeed, silica is required to precipitate from mass balance considerations [33] during the oxidation of pyrite and often reaches silica solubility limits. Caraballo et al. [34] have identified a silica coating on hydrobasaluminite precipitating from the Paradise Portal in Colorado. The form of the silica is not usually known. The match for the decrease in SO4 concentration is considered as corroboratory evidence that the proposed reaction model (E) is a reasonable interpretation of the reactive processes during mixing.
With regard to the higher concentrations of Al and Fe than simulated after precipitation, the mismatch is likely to be an artifact of field collection limitations rather than the simulation. First, fresh precipitation of Fe(III) forms colloids in the nanometer to tens of nanometer size range that can easily escape filtration (e.g., [31]). This problem is pronounced at pH values at or above 4 [33]. Second, of the measured dissolved total Fe 4.44 mg/L was Fe(II) leaving 0.28 mg/L measured Fe(III). If the Eh value of 0.692 volts is used to calculate the Fe(III) it would be about 2 orders of magnitude oversaturated with respect to amorphous Fe(OH)3. If the calculation is redone (because the EMF measurement was very weak and drifting) assuming equilibrium with amorphous Fe(OH)3 rather than trusting the EMF value, the dissolved Fe(III) would be about 0.006 mg/L. It is safe to say that the difference between 0.28 mg/L and 0.006 mg/L can be attributed to colloidal iron particles getting through the filter [33]. Similar nanometer size ranges have been documented for hydrobasaluminite [34].
4. Conclusions
Geochemical modeling of water-rock interactions has a substantial number of applications. However, the modeler has several assumptions to make for any given environmental setting. These assumptions include whether minerals reach equilibrium or not, which minerals should be considered, what redox conditions to choose and how to set them, and which database or thermodynamic properties should be used. Often, constraints from field studies are insufficient to avoid some of these assumptions and further work is needed to confirm or discredit the dominant reactions and processes.
Titration simulation of AMD with a commonly used base, portlandite or Ca(OH)2, is a useful application when planning a neutralization plant to treat acid waters. Simulations for two different acid mine waters show clearly that sulfuric acid, Fe(III), and Al not only play the main role in buffering, but quantify the amount needed to neutralize AMD. One example from Leviathan mine water data required more than twice the amount of base than the other mine water from the Berkeley Pit because of the substantial difference in acid, Fe, and Al concentrations. Strong acid and Fe(III) buffering occurs in the pH range of 2.2–2.8 and Al buffering occurs at a pH close to 4.
In this study, a well-constrained mixing phenomenon of two streams, one with AMD at a pH of 3.25 with a clean tributary increased the pH to 4.90 by dilution and carbonate buffering. This example is a field titration in a single mix. Immediate Al precipitation and some Fe precipitation occurred with mixing. Full chemistry and discharges measured above and below the mixing point provided the opportunity to simulate the results of mixing with a geochemical model and compare them to the field measurements. The effect of no reaction (conservative mixing), reaction with the least soluble and the most soluble Fe and Al hydroxide precipitates, and with colloidal Fe and Al hydroxysulfates, schwertmannite and basaluminite, were all tested and amorphous Fe(OH)3 (with logKsp = 3) and amorphous basaluminite (logKsp = 24) gave the best comparison to the water composition below the mixing point.
More testing of geochemical models like this field example will help to decrease the uncertainties and number of assumptions one has to make when applying models to environmental conditions.
Supplementary Materials
The following are available online at https://0-www-mdpi-com.brum.beds.ac.uk/2075-163X/10/6/547/s1. A supplement is available with an example of PHREEQC input data for the mixing calculation.
Funding
This research received no external funding.
Acknowledgments
This study would not have been possible without the support of the National Research Program of the U.S. Geological Survey and the USGS Nevada District Office (now the Nevada Water Science Center). The author is very grateful to Jim Ball (USGS, retired) for his excellent analytical expertise as well as assistance with field planning and sampling and his extraordinary patience and perseverance. The author thanks Terry Duaime of the Montana Bureau of Mines and Geology for the spreadsheet information used in this study. Some of the original funding for the field work was also provided by the Lahontan Regional Water Quality Control Board. The author is grateful to Charles N. Alpers for his careful review and to the three anonymous reviewers who helped in improving this manuscript. Any use of trade, firm, or product names is for descriptive purposes only and does not imply endorsement by the U.S. Government.
Conflicts of Interest
The author declares no conflict of interest.
References
- Bigham, J.M.; Nordstrom, D.K. Iron and aluminum hydroxysulfates from acid sulfate waters. In Sulfate Minerals—Crystallography, Geochemistry, and Environmental Significance; Reviews in Mineralogy and Geochemistry Series; Alpers, C.N., Jambor, J.L., Nordstrom, D.K., Eds.; Mineralogical Society of America and Geochemistry Society: Washington, DC, USA, 2000; Volume 40, pp. 351–403. [Google Scholar]
- Druhan, J.; Tournassat, C. (Eds.) Reactive Transport in Natural and Engineered Systems; Reviews in Mineralogy and Geochemistry Series; Mineralogical Society of America and Geochemistry Society: Washington, DC, USA, 2019; Volume 85. [Google Scholar]
- Bigham, J.M.; Schwertmann, U.; Carlson, L. Mineralogy of precipitates formed by the biogeochemical oxidation of Fe(II) in mine drainage. Catena Suppl. 1992, 21, 219–232. [Google Scholar]
- Flynn, C.M., Jr. Hydrolysis of inorganic iron(III) salts. Chem. Rev. 1984, 84, 31–41. [Google Scholar] [CrossRef]
- Valente, T.M.; Gomes, C. Occurrence, properties and pollution potential of environmental minerals in acid mine drainage. Sci. Total Environ. 2009, 407, 283–294. [Google Scholar] [CrossRef] [PubMed] [Green Version]
- Carbone, C.; Dinelli, E.; Marescotti, P.; Gasparotto, G.; Lucchetti, G. The role of AMD secondary minerals in controlling environmental pollution: Indications from bulk leaching tests. J. Geochem. Explor. 2013, 132, 188–200. [Google Scholar] [CrossRef]
- Acero, P.; Ayora, C.; Torrentó, C.; Nieto, J.-M. The behavior of trace elements during schwertmannite precipitation and subsequent transformation into goethite and jarosite. Geochim. Cosmochim. Acta 2006, 70, 4130–4139. [Google Scholar] [CrossRef]
- Schwertmann, U.; Carlson, L. The pH-dependent transformation of schwertmannite to goethite. Clay Mineral. 2005, 40, 63–66. [Google Scholar] [CrossRef]
- Sanchez-España, J. Crystallization in acidic media: From nanoparticles to macrocrystals. Seminar. Soc. Españ. Mineral. 2017, 13, 15–34. [Google Scholar]
- Henderson, G.S.; Neuville, D.R.; Downs, R.T. (Eds.) Spectroscopic Methods in Mineralogy and Materials Science; Reviews in Mineralogy and Geochemistry Series; Mineralogical Society of America Geochemistry Society: Washington, DC, USA, 2014; Volume 78. [Google Scholar]
- Beran, A.; Libowitzky, E. Spectroscopic Methods in Mineralogy; European Mineralogical Union Notes in Mineralogy; Eötvös University Press: Budapest, Hungary, 2004; Volume 6. [Google Scholar]
- Adams, F.; Hajek, B.F. Effects of solution sulfate, hydroxide, and potassium concentrations on the crystallization of alunite, basaluminite, and gibbsite from dilute aluminum solutions. Soil Sci. 1978, 126, 169–173. [Google Scholar] [CrossRef]
- Parkhurst, D.L.; Appelo, C.A.J. Description and Input and Examples for PHREEQC Version 3—A Computer Program for Speciation, Batch-Reaction, One-Dimensional Transport, and Inverse Geochemical Calculations. In USGS Techniques and Methods 6-A43; USGS: Denver, CO, USA, 2013. [Google Scholar]
- Ball, J.W.; Nordstrom, D.K. User’s Manual for WATEQ4F, with Revised Database and Test Cases for Calculating Speciation of Major, Trace, and Redox Elements in Natural Waters. In U.S. Geological Survey Open-File Report 91-183; USGS: Menlo Park, CA, USA, 1991. [Google Scholar]
- Ball, J.W.; Nordstrom, D.K. Final Revised Analyses of Major and Trace Elements from Acid Mine Waters in the Leviathan Mine Drainage Basin, California and Nevada—October 1981 to October 1982. In U.S. Geological Survey Water-Resources Investigation Report 89-4138; USGS: Menlo Park, CA, USA, 1989. [Google Scholar]
- Duaime, T.E.; McGrath, S.F. Butte, Montana: The Berkeley Pit, Changes in Water Quality and Water Sampling Methods, 1982–2017. In Montana Bureau of Mines and Geology Bulletin 138; Montana Bureau of Mines and Geology: Butte, MT, USA, 2019. [Google Scholar]
- Pabst, A. Cryptocrystalline pyrite from Alpine County, California. Am. Miner. 1940, 25, 425–431. [Google Scholar]
- Ball, J.W.; Nordstrom, D.K. Major and Trace Element Analyses of Acid Mine Waters in the Leviathan Mine Drainage Basin, California and Nevada—October 1981 to October 1982. In U.S. Geological Survey Water-Resources Investigations Report 85-4169; USGS: Menlo Park, CA, USA, 1985. [Google Scholar]
- Webster, J.G.; Nordstrom, D.K.; Smith, K.S. Transport and natural attenuation of Cu, Zn, As, and Fe in the acid mine drainage of Leviathan and Bryant Creeks. In Environmental Geochemistry of Sulfide Oxidation; Alpers, C.N., Blowes, D.W., Eds.; American Chemical Society Symposium Series 550; American Chemical Society: Washington, DC, USA, 1994; pp. 244–260. [Google Scholar]
- Ball, J.W.; Nordstrom, D.K. A Comparison of Simultaneous Plasma, Atomic Absorption, and Iron Colorimetric Techniques for the Determination of Major and Trace Constituents in Acid Mine Waters. In U.S. Geological Survey Water-Resources Investigations Report 93-4122; USGS: Menlo Park, CA, USA, 1994. [Google Scholar]
- Nordstrom, D.K. Advances in the hydrogeochemistry and microbiology of acid mine waters. Int. Geol. Rev. 2000, 42, 499–515. [Google Scholar] [CrossRef]
- Nordstrom, D.K.; Campbell, K.M. Modeling low-temperature geochemical processes. In Surface and Ground Water, Weathering, and Soils, 2nd ed.; Drever, J.I., Ed.; Treatise on Geochemistry Series; Elsevier: New York, NY, USA, 2014; Volume 7, pp. 27–68. [Google Scholar]
- Nordstrom, D.K. The effect of sulfate on aluminum concentrations in natural waters: Some stability relations in the system A12O3-SO3-H2O at 298 K. Geochim. Cosmochim. Acta 1982, 46, 681–692. [Google Scholar] [CrossRef]
- Sanchez-España, J.; Yusta, I.; Diez-Ercilla, M. Schwertmannite and hydrobasaluminite: A re-evaluation of their solubility and control on the iron and aluminum concentration in acidic pit lakes. Appl. Geochem. 2011, 26, 1752–1774. [Google Scholar] [CrossRef]
- Blowes, D.W.; Ptacek, C.J. Acid-neutralization mechanisms in inactive mine tailings. In The Environmental Geochemistry of Sulfide Mine-Wastes; Blowes, D.W., Jambor, J.L., Eds.; Mineralogical Association Canada: Toronto, ON, Canada, 1994; Volume 22, pp. 271–292. [Google Scholar]
- Jurjovec, J.; Ptacek, C.J.; Blowes, D.W. Acid neutralization mechanisms and metal release in mine tailings: A laboratory column experiment. Geochim. Cosmochim. Acta 2002, 66, 1511–1523. [Google Scholar] [CrossRef]
- Blowes, D.W.; Ptacek, C.J.; Jambor, J.L.; Weisener, C.G.; Paktunc, D.; Gould, W.D.; Johnson, D.B. The geochemistry of acid mine drainage. In Environmental Geochemistry, 2nd ed.; Sherwood Lollar, B., Ed.; Treatise on Geochemistry Series; Elsevier: New York, NY, USA, 2014; Volume 11, pp. 149–204. [Google Scholar]
- Adams, F.; Rawajfih, Z. Basaluminite and alunite: A possible cause of sulfate retention by acid soils. Soil Sci. Soc. Amer. J. 1977, 41, 686–692. [Google Scholar] [CrossRef]
- Bigham, J.M.; Schwertmann, U.; Traina, S.J.; Winland, R.L.; Wolf, M. Schwertmannite and the chemical modeling of iron in acid sulfate waters. Geochim. Cosmochim. Acta 1996, 60, 2111–2121. [Google Scholar] [CrossRef]
- Regenspurg, S.; Brand, A.; Peiffer, S. Formation and stability of schwertmannite in acidic mining lakes. Geochem. Cosmochim. Acta 2004, 68, 1185–1197. [Google Scholar] [CrossRef]
- Caraballo, M.A.; Rimstidt, J.D.; Macías, F.; Nieto, J.M.; Hochella, M.F., Jr. Metastability, nanocrystallinity and pseudo-solid solution effects on the understanding of schwertmannite solubility. Chem. Geol. 2013, 360–361, 22–31. [Google Scholar] [CrossRef]
- Carlson, L.; Schwertmann, U. Natural ferrihydrites in surface deposits from Finland and their association with silica. Geochim. Cosmochim. Acta 1981, 45, 421–425, 427–429. [Google Scholar] [CrossRef]
- Nordstrom, D.K. Hydrogeochemical processes governing the origin, transport and fate of major and trace elements from mine wastes and mineralized rock to surface waters. Appl. Geochem. 2011, 26, 1777–1791. [Google Scholar] [CrossRef]
- Caraballo, M.A.; Wanty, R.B.; Verplanck, P.L.; Navarro-Valdivia, L.; Ayora, C.; Hochella, M.F., Jr. Aluminum mobility in mildly acidic mine drainage: Interactions between hydrobasaluminite, silica and trace metals from the nano to the meso-scale. Chem. Geol. 2019, 519, 1–10. [Google Scholar] [CrossRef]
Figure 1.
Location of Leviathan mine in eastern California (insert) and the main tributaries receiving acid mine drainage [15]. In the early 1980s aluminum precipitates were found immediately below the confluence of Mountaineer Creek with Leviathan Creek.
Figure 1.
Location of Leviathan mine in eastern California (insert) and the main tributaries receiving acid mine drainage [15]. In the early 1980s aluminum precipitates were found immediately below the confluence of Mountaineer Creek with Leviathan Creek.

Figure 2.
White aluminum-rich precipitate found below the confluence of Leviathan and Mountaineer Creeks, near Markleeville, California. Photo: D. Kirk Nordstrom, U.S. Geological Survey, June 1982.
Figure 2.
White aluminum-rich precipitate found below the confluence of Leviathan and Mountaineer Creeks, near Markleeville, California. Photo: D. Kirk Nordstrom, U.S. Geological Survey, June 1982.

Figure 3.
Typical titration graph of 5 mL 100 millimolal H2SO4 with 100 millimolal NaOH.

Figure 4.
Simulation of pH titration of 5 millimolal H2SO4 with 20 millimolal NaOH added in small increments using REACT command and USER GRAPH to plot results and to check accuracy of computation. The titration is plotted in terms of total number of moles used in the titration.
Figure 4.
Simulation of pH titration of 5 millimolal H2SO4 with 20 millimolal NaOH added in small increments using REACT command and USER GRAPH to plot results and to check accuracy of computation. The titration is plotted in terms of total number of moles used in the titration.

Figure 5.
Titration simulation of acid mine drainage (AMD) from Leviathan Mine drainage by portlandite (slaked lime), showing the main buffering mechanisms (similar to the mine tailings model, [24,25,26]).

Figure 6.
Titration of slaked lime or portlandite with AMD from Berkeley Pit water, showing the main buffering mechanisms with lower overall acidity than the Leviathan Mine water.
Figure 6.
Titration of slaked lime or portlandite with AMD from Berkeley Pit water, showing the main buffering mechanisms with lower overall acidity than the Leviathan Mine water.

Figure 7.
Change in Ca concentration during titration of Berkeley Pit water with portlandite.


Table 1.
Analyses of Leviathan and Mountaineer Creeks collected on 15 June 1982.
| Parameters | Leviathan Creek | Mountaineer Creek |
|---|---|---|
| Temperature, °C | 19.5 | 12.5 |
| Discharge, m3/s | 0.071 (44%) | 0.091 (56%) |
| pH | 3.25 | 8.85 |
| Specific conductance, µS/cm | 1100 | 150 |
| Constituents (mg/L) | ||
| Alkalinity, as HCO3 | 0.0 | 94.3 |
| Al | 19.8 | 0.045 |
| Ba | 0.048 | 0.039 |
| Ca | 82.2 | 13.7 |
| Cd | 0.0079 | 0.0002 |
| Cl | 1.1 | 1 |
| Cu | 0.231 | 0.001 |
| F | 0.52 | 0.04 |
| Fe (II) | 9.01 | 0.0086 |
| Fe (total dissolved) | 18.4 | 0.0099 |
| Mg | 23.6 | 5.78 |
| Mn | 3.04 | 0.022 |
| K | 4.57 | 2.29 |
| SiO2 | 46.4 | 42.6 |
| Na | 11.8 | 6.83 |
| Sr | 0.708 | 0.237 |
| SO4 | 483 | 1.89 |
Table 2.
Results of simulations resulting from mixing and reaction (see text for explanation).
| Constituent (mg/L, Except pH) | A | B | C | D | E | Measured |
|---|---|---|---|---|---|---|
| pH | 6.13 | 4.41 | 5.36 | 4.55 | 4.57 (4.64) | 4.90 |
| Al | 8.75 | 4.80 | 5.90 | 4.16 | 3.67 (2.61) | 5.06 |
| Ba | 0.043 | 0.043 | 0.043 | 0.043 | 0.042 (0.043) | 0.042 |
| HCO3 | 37.5 | 0.87 | 0.87 | 0.88 | 0.88 (0.88) | 0.0 |
| Ca | 43.8 | 43.8 | 43.8 | 43.8 | 43.8 (42.4) | 44.7 |
| Cd | 0.0036 | 0.0036 | 0.0036 | 0.0036 | 0.0036 (0.0034) | 0.0040 |
| Cu | 0.102 | 0.102 | 0.102 | 0.102 | 0.102 (0.098) | 0.093 |
| F | 0.25 | 0.25 | 0.25 | 0.25 | 0.25 (0.24) | 0.30 |
| Fe (total) | 8.13 | 0.00000054 | 0.0181 | 0.00167 | 0.0254 (0.0223) | 4.72 |
| K | 3.30 | 3.29 | 3.30 | 3.29 | 3.29 (3.25) | 3.21 |
| Mg | 13.6 | 13.6 | 13.6 | 13.6 | 13.6 (13.3) | 13.5 |
| Mn | 1.35 | 1.35 | 1.35 | 1.35 | 1.35 (1.29) | 1.26 |
| Na | 9.03 | 9.02 | 9.03 | 9.02 | 9.02 (8.89) | 8.60 |
| SiO2 | 44.3 | 44.2 | 44.3 | 44.2 | 44.2 (44.1) | 42.6 |
| Sr | 0.44 | 0.44 | 0.44 | 0.44 | 0.44 (0.44) | 0.44 |
| SO4 | 214 | 214 | 214 | 209 | 207 (197) | 206 |
© 2020 by the USGS. Licensee MDPI, Basel, Switzerland. This article is an open access article distributed under the terms and conditions of the Creative Commons Attribution (CC BY) license (http://creativecommons.org/licenses/by/4.0/).
Share and Cite
MDPI and ACS Style
Kirk Nordstrom, D. Geochemical Modeling of Iron and Aluminum Precipitation during Mixing and Neutralization of Acid Mine Drainage. Minerals 2020, 10, 547. https://0-doi-org.brum.beds.ac.uk/10.3390/min10060547
AMA Style
Kirk Nordstrom D. Geochemical Modeling of Iron and Aluminum Precipitation during Mixing and Neutralization of Acid Mine Drainage. Minerals. 2020; 10(6):547. https://0-doi-org.brum.beds.ac.uk/10.3390/min10060547
Chicago/Turabian StyleKirk Nordstrom, Darrell. 2020. "Geochemical Modeling of Iron and Aluminum Precipitation during Mixing and Neutralization of Acid Mine Drainage" Minerals 10, no. 6: 547. https://0-doi-org.brum.beds.ac.uk/10.3390/min10060547
Note that from the first issue of 2016, this journal uses article numbers instead of page numbers. See further details here.