Relative Abundance and Compositional Variation of Silicates, Oxides and Phosphates in the W-Sn-Rich Lodes of the Panasqueira Mine (Portugal): Implications for the Ore-Forming Process

 , , and
Abstract
:
1. Introduction
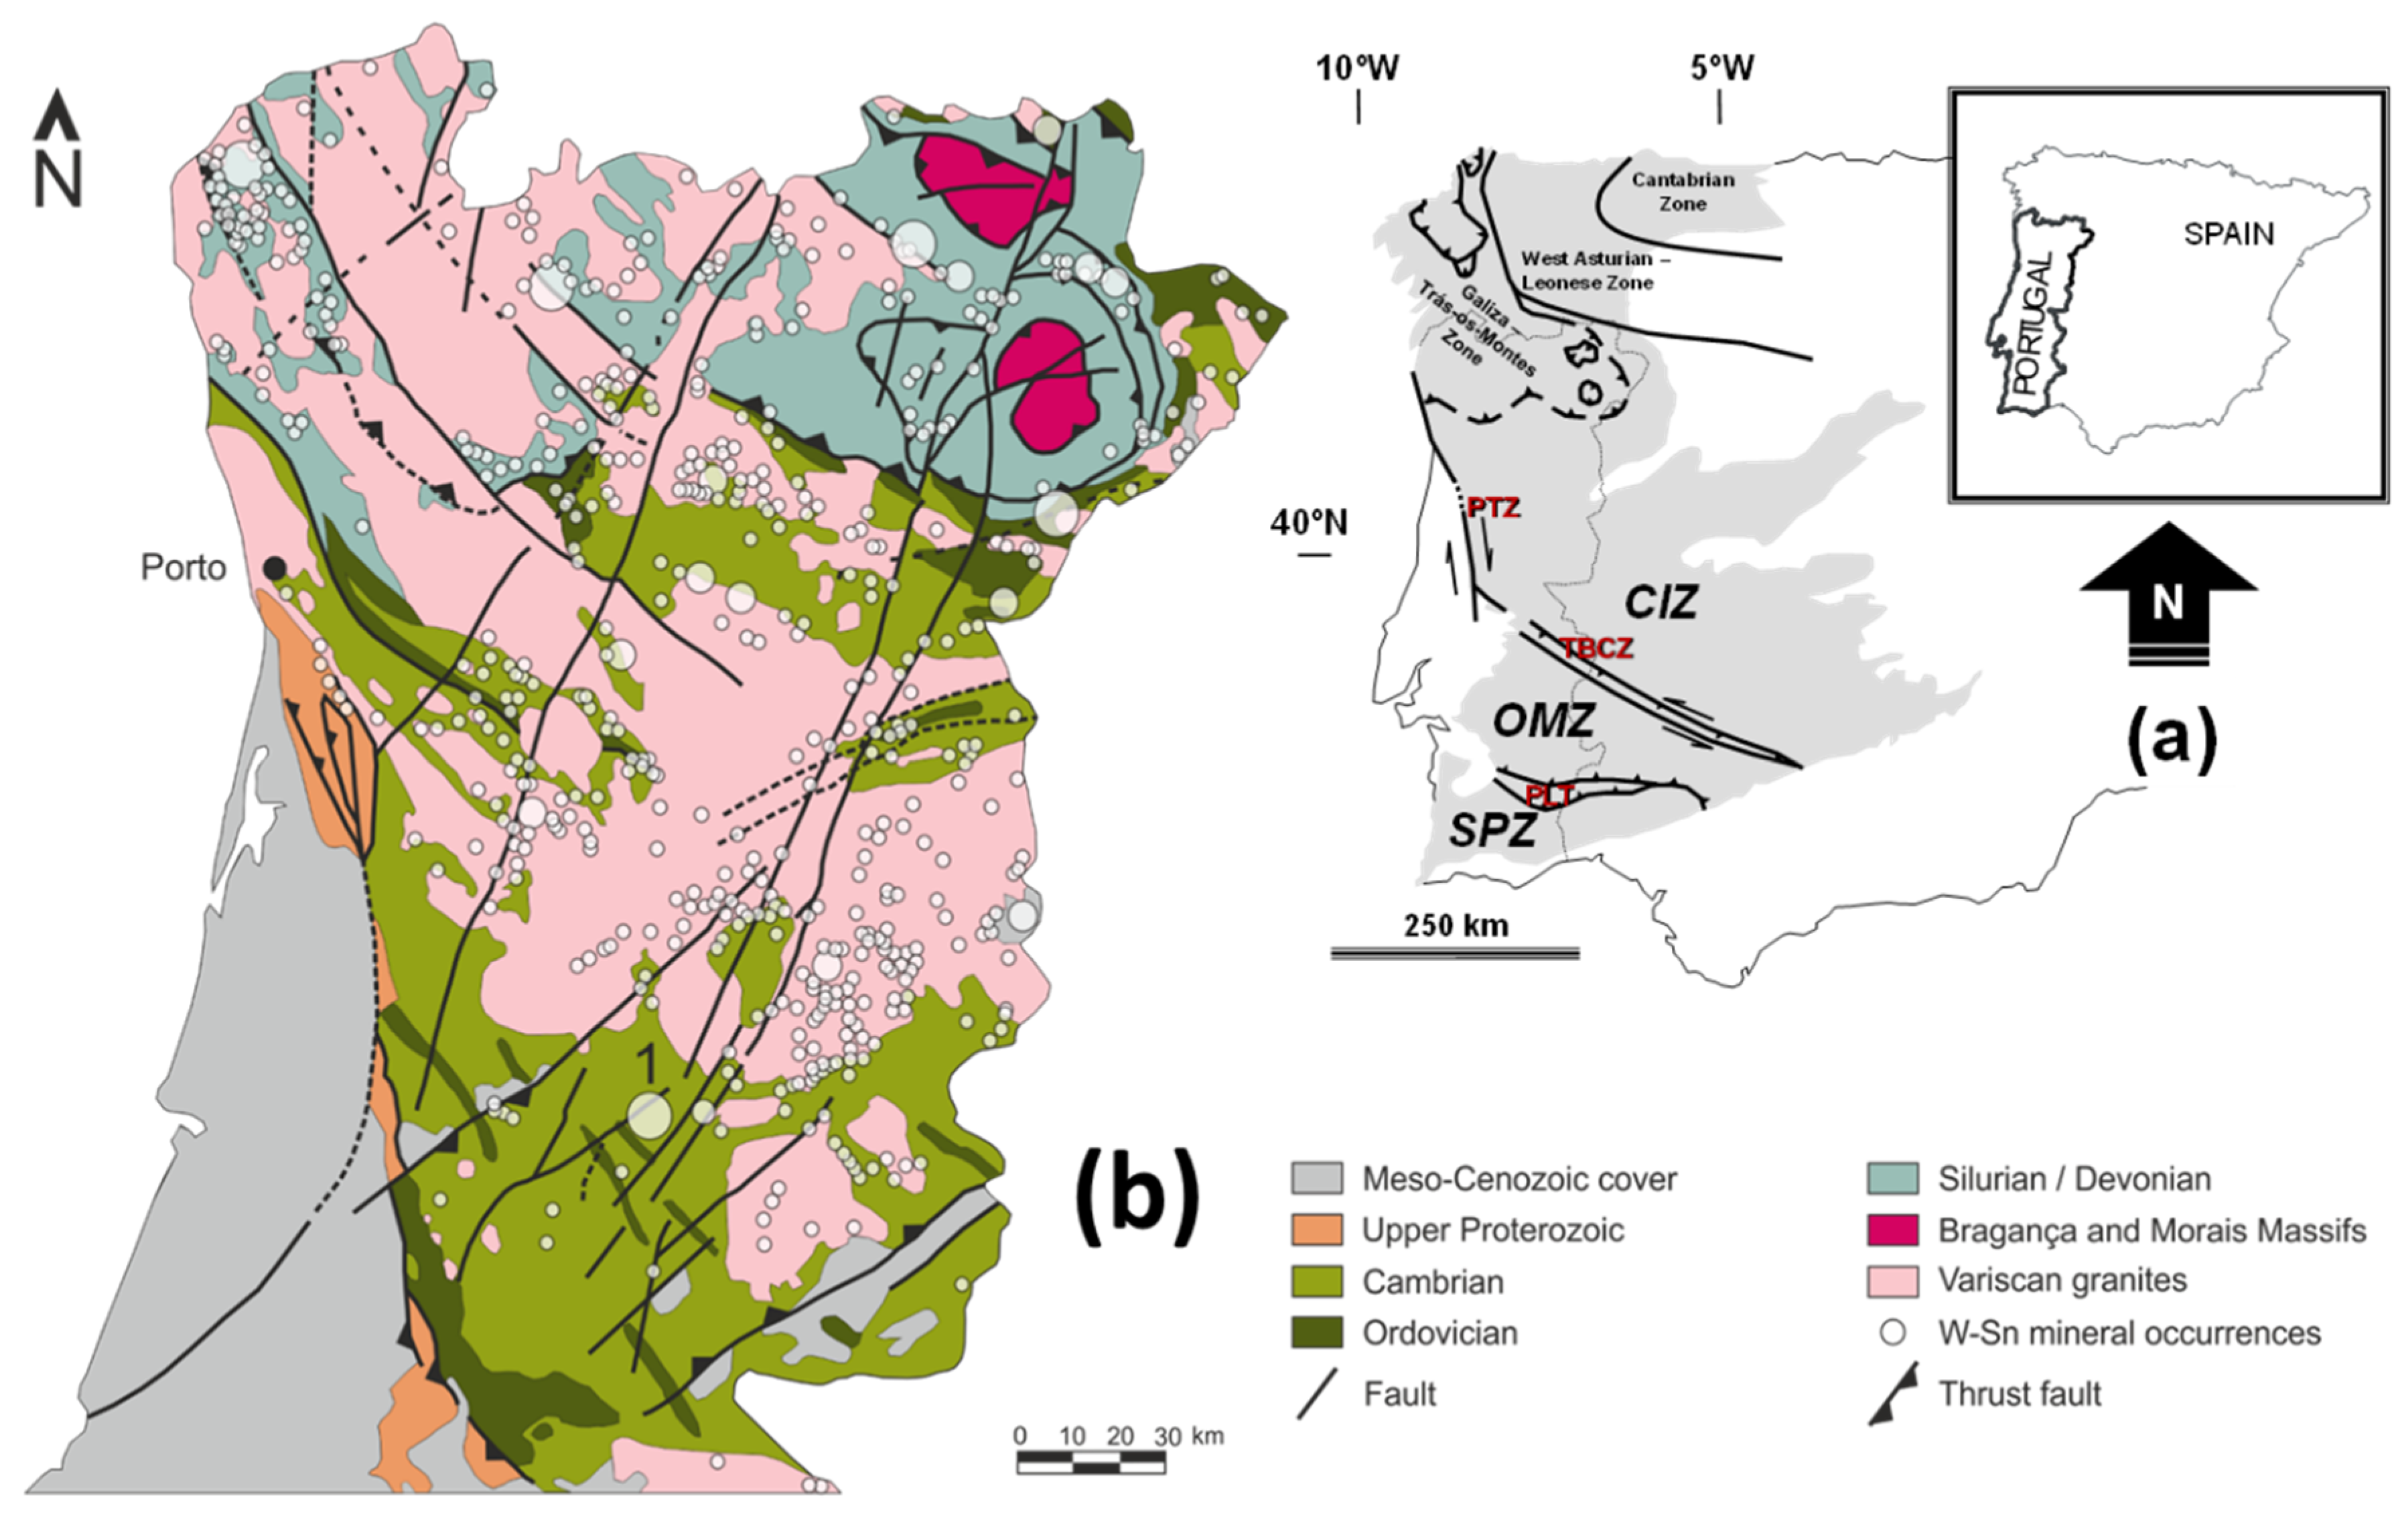
2. Geological Background
The Panasqueira Deposit
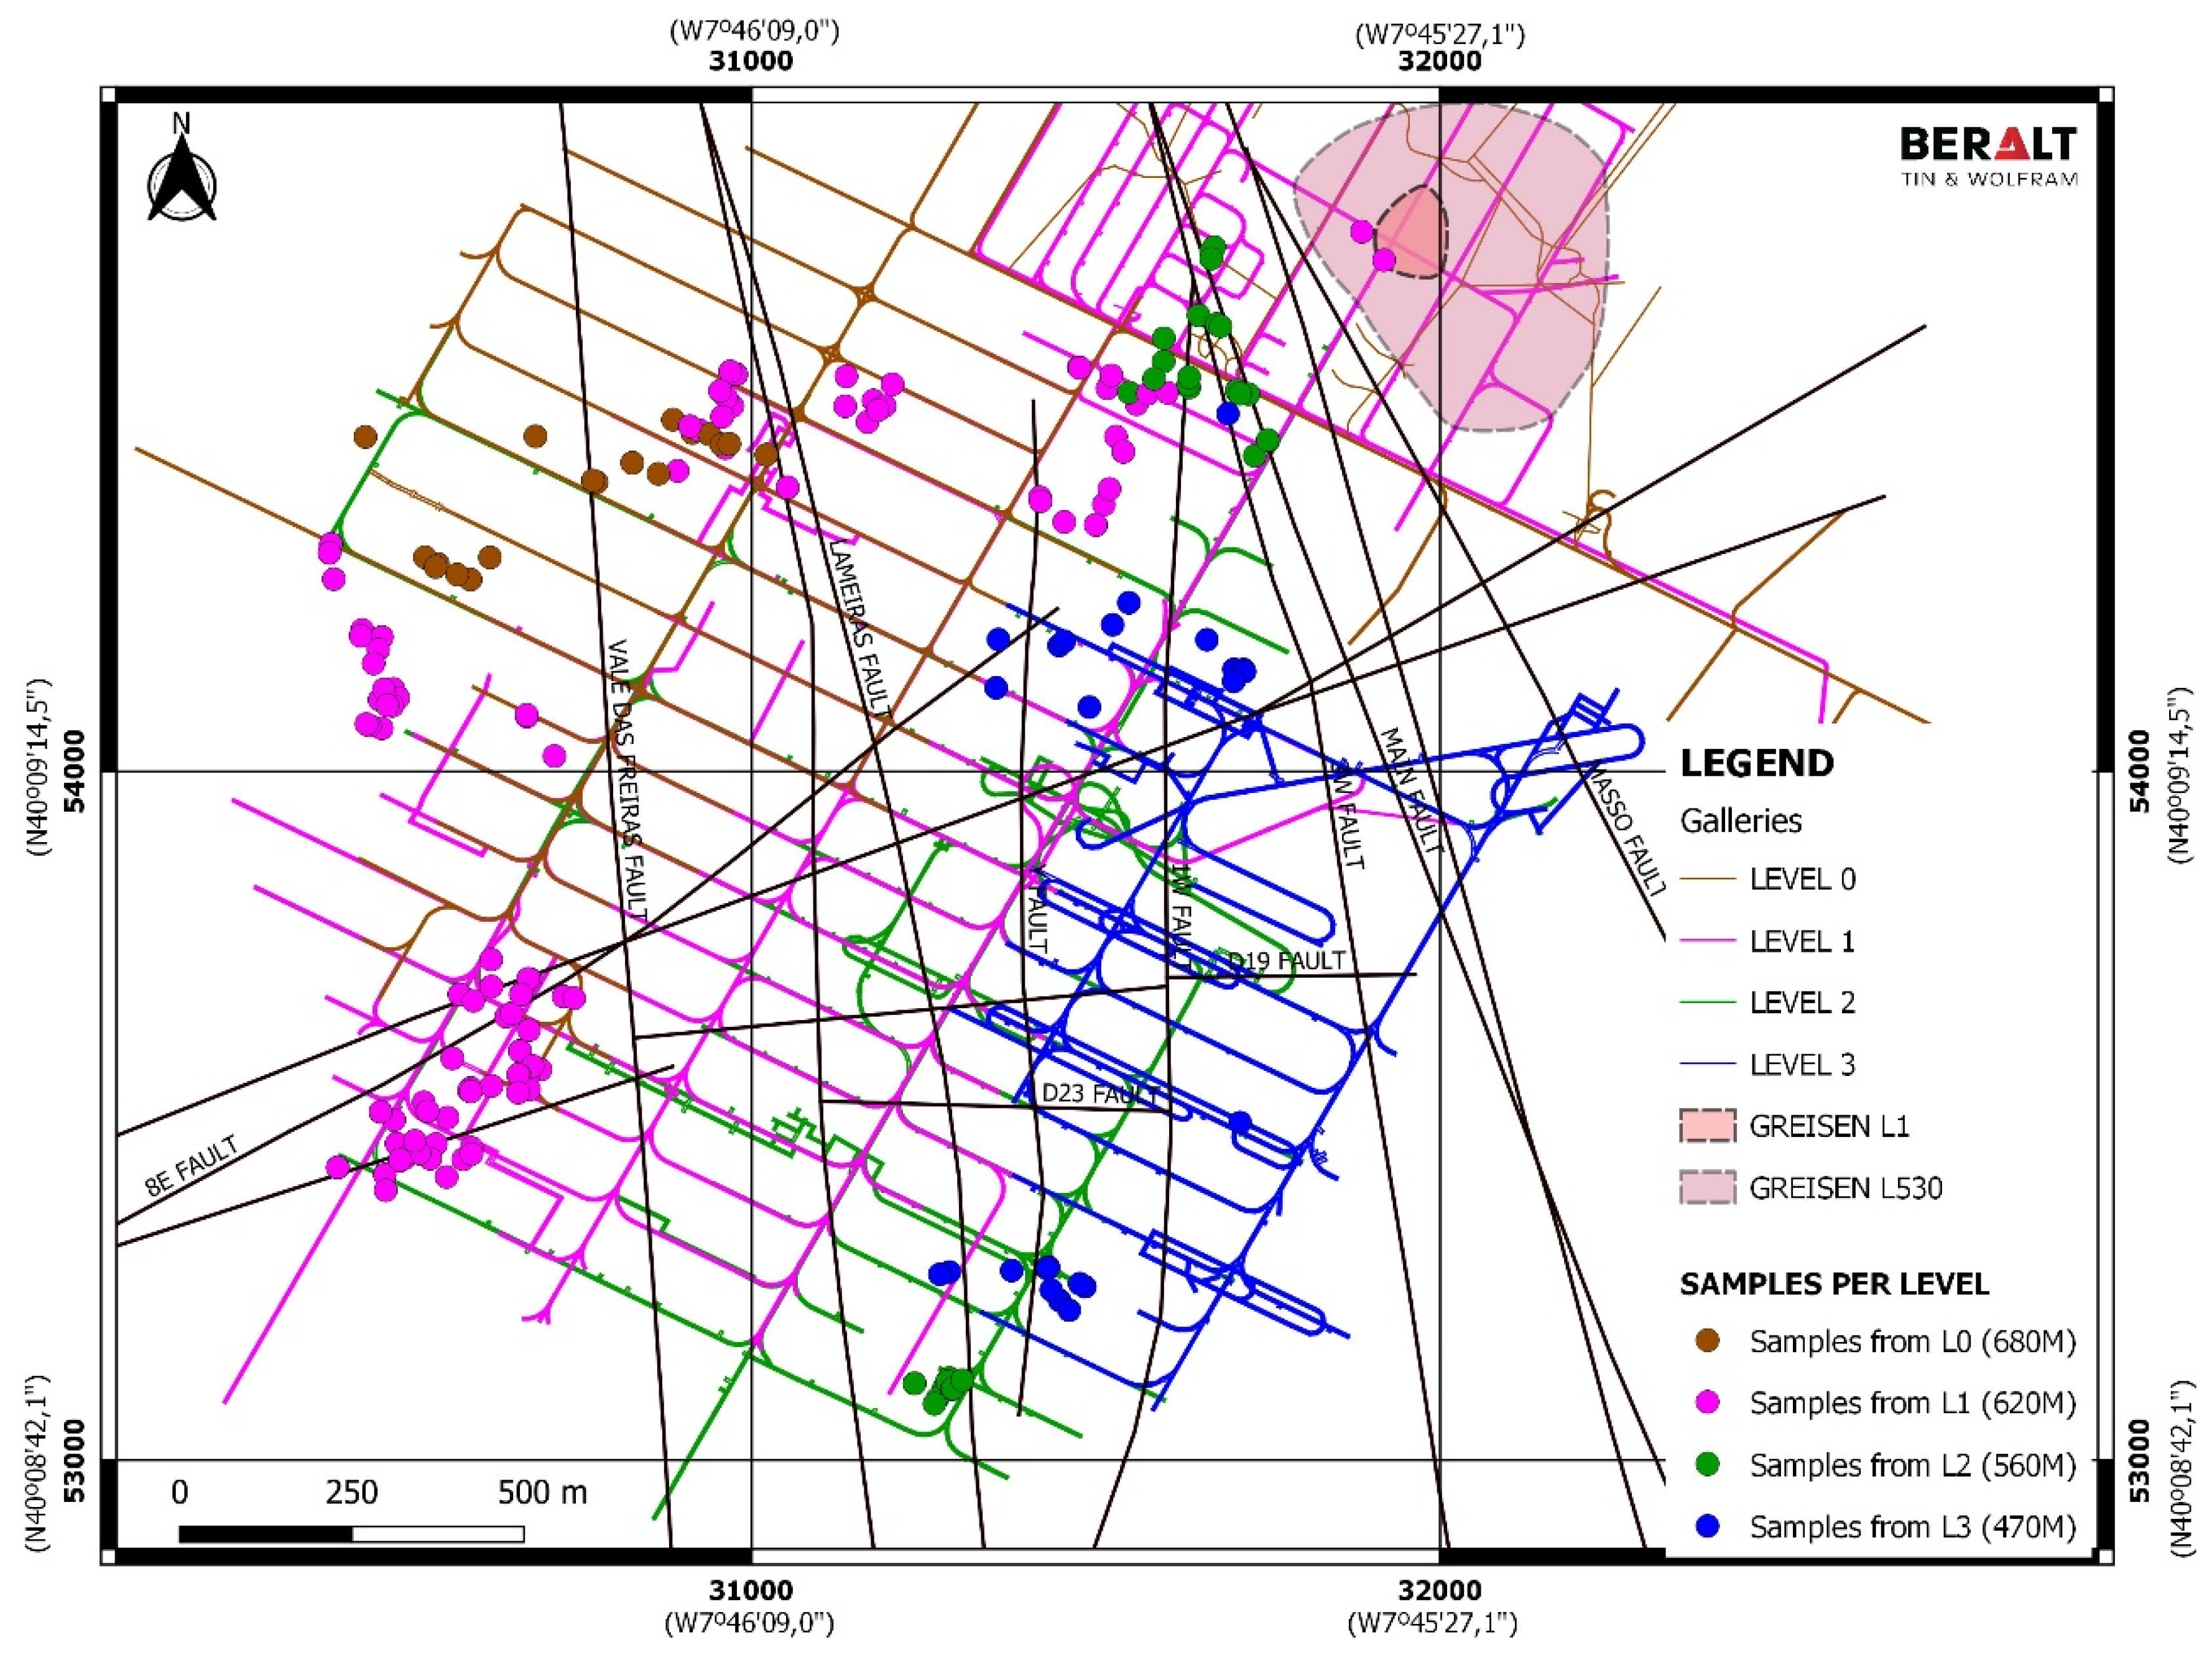
3. Sampling and Electron Probe Microanalyzer Analytical Conditions
4. Distribution of Silicates, Oxides and Phosphates in Lodes and Their Margins, and in Greisen
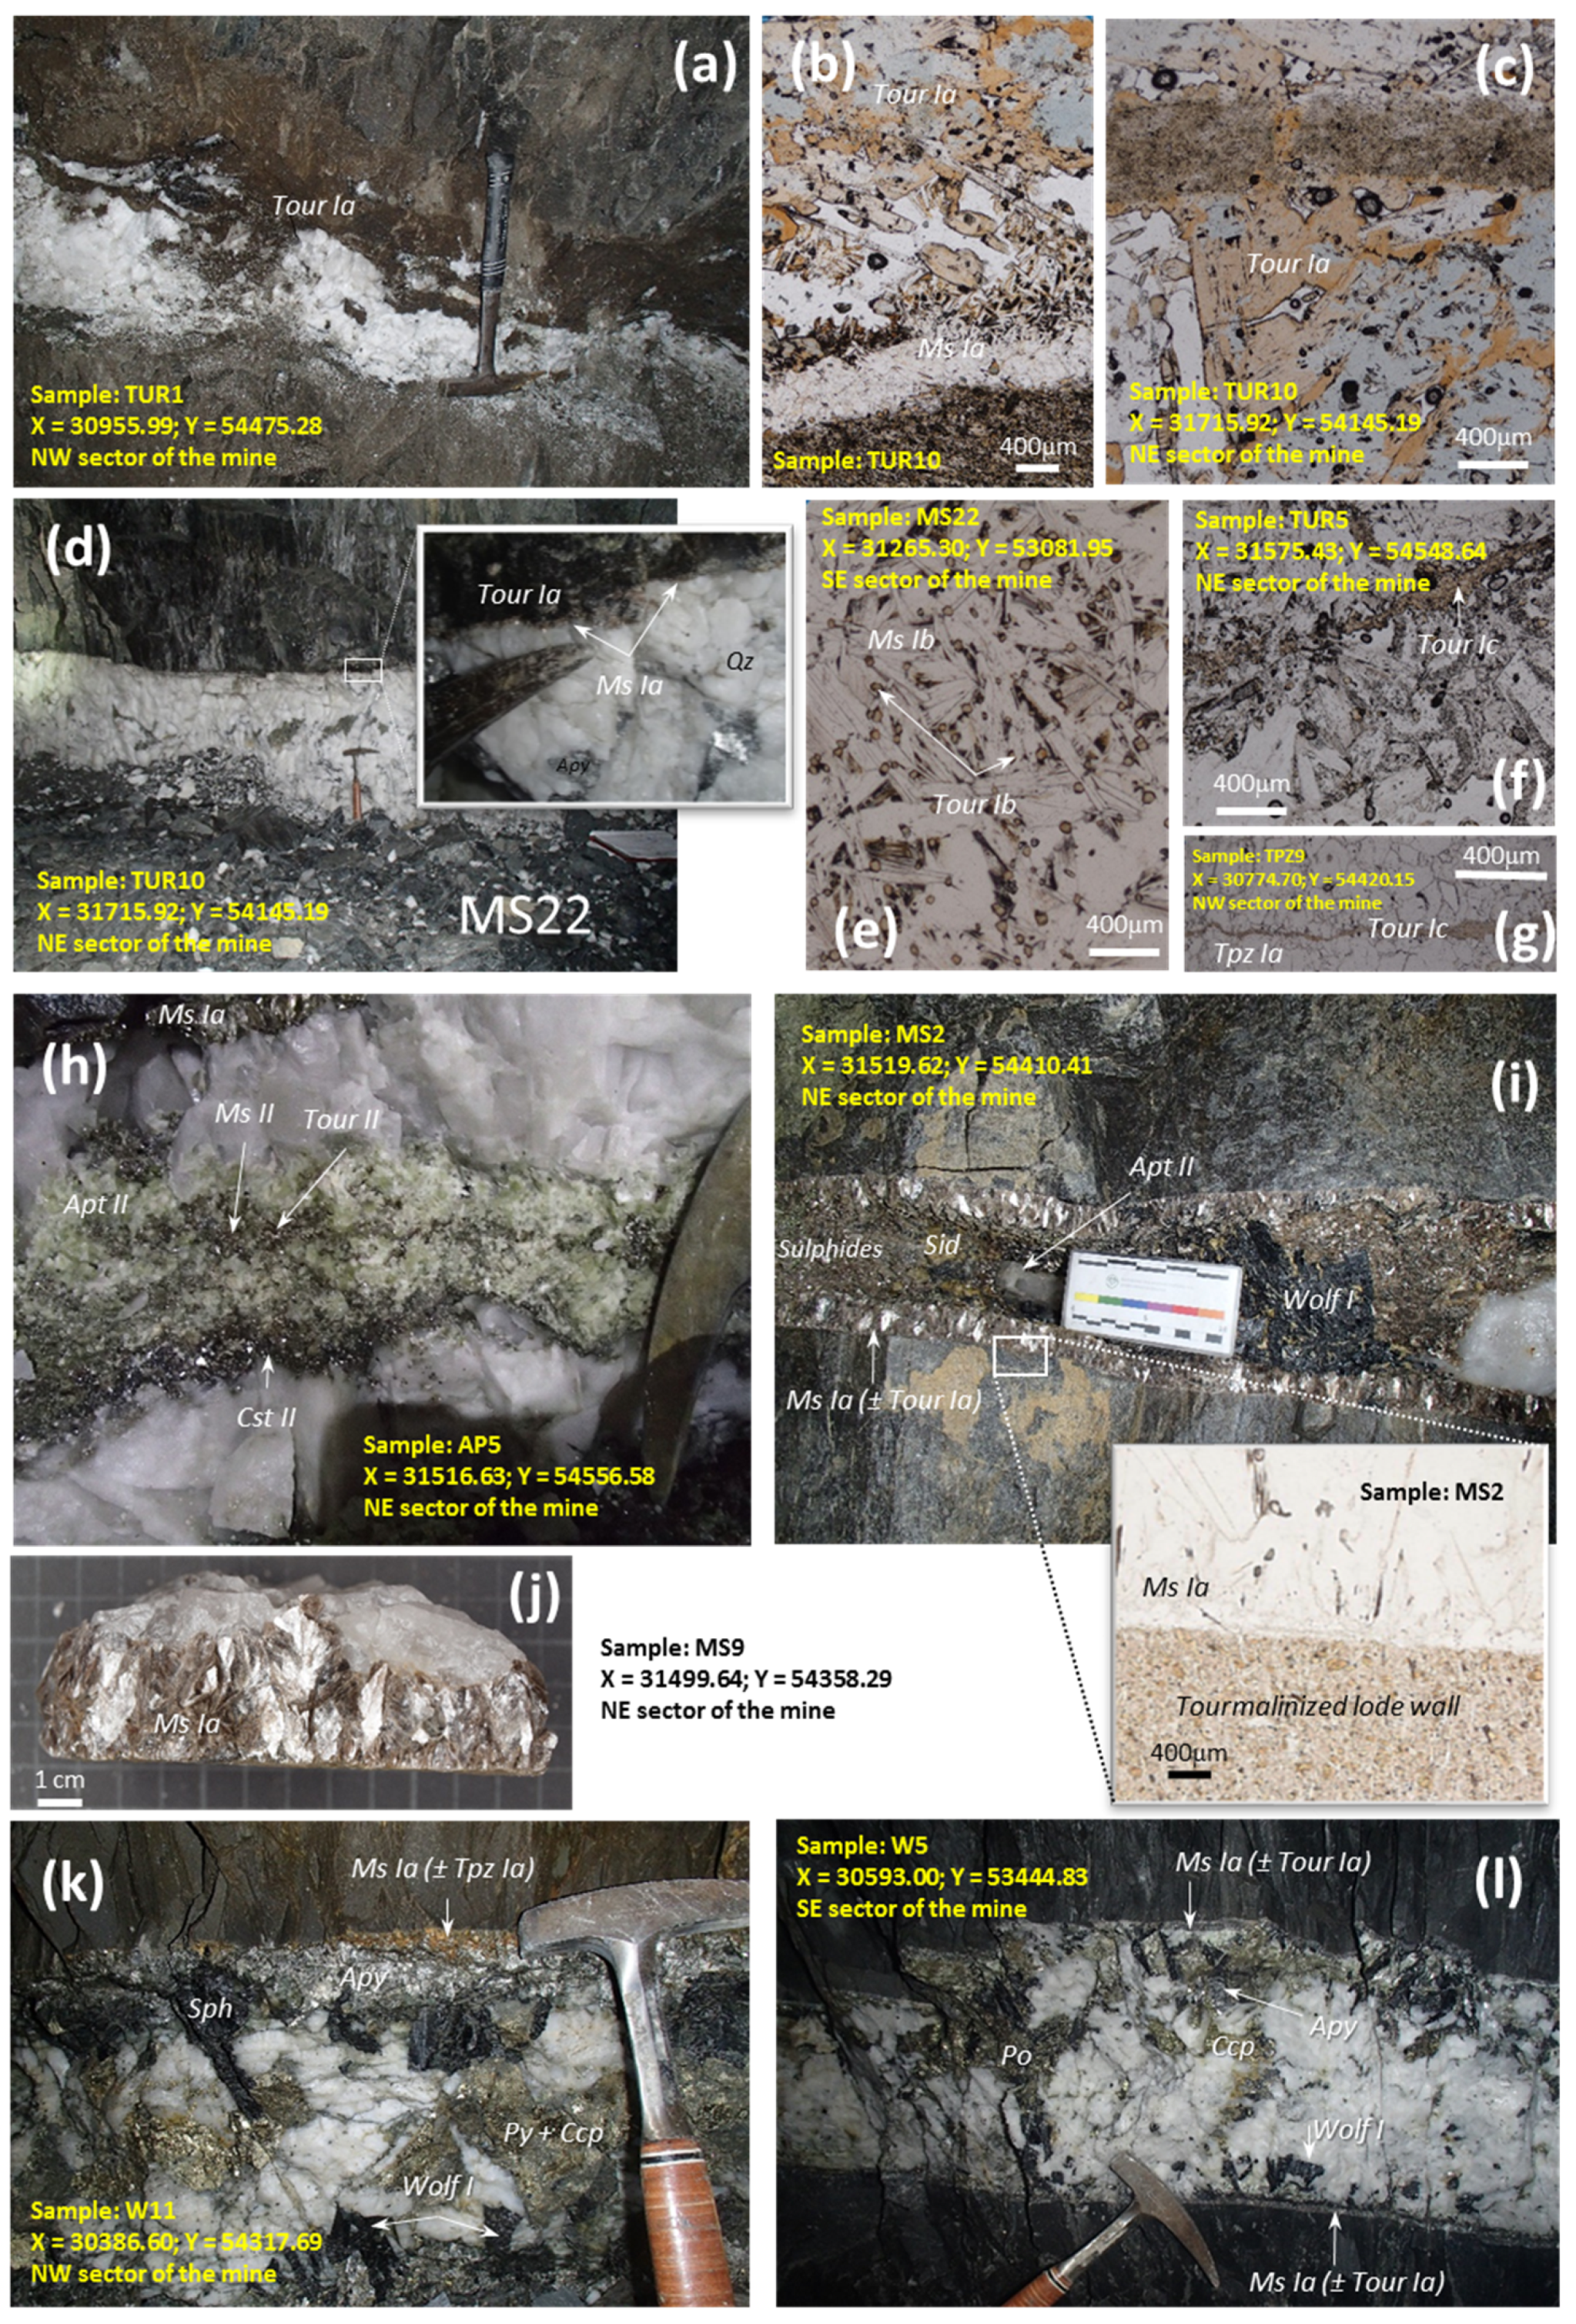
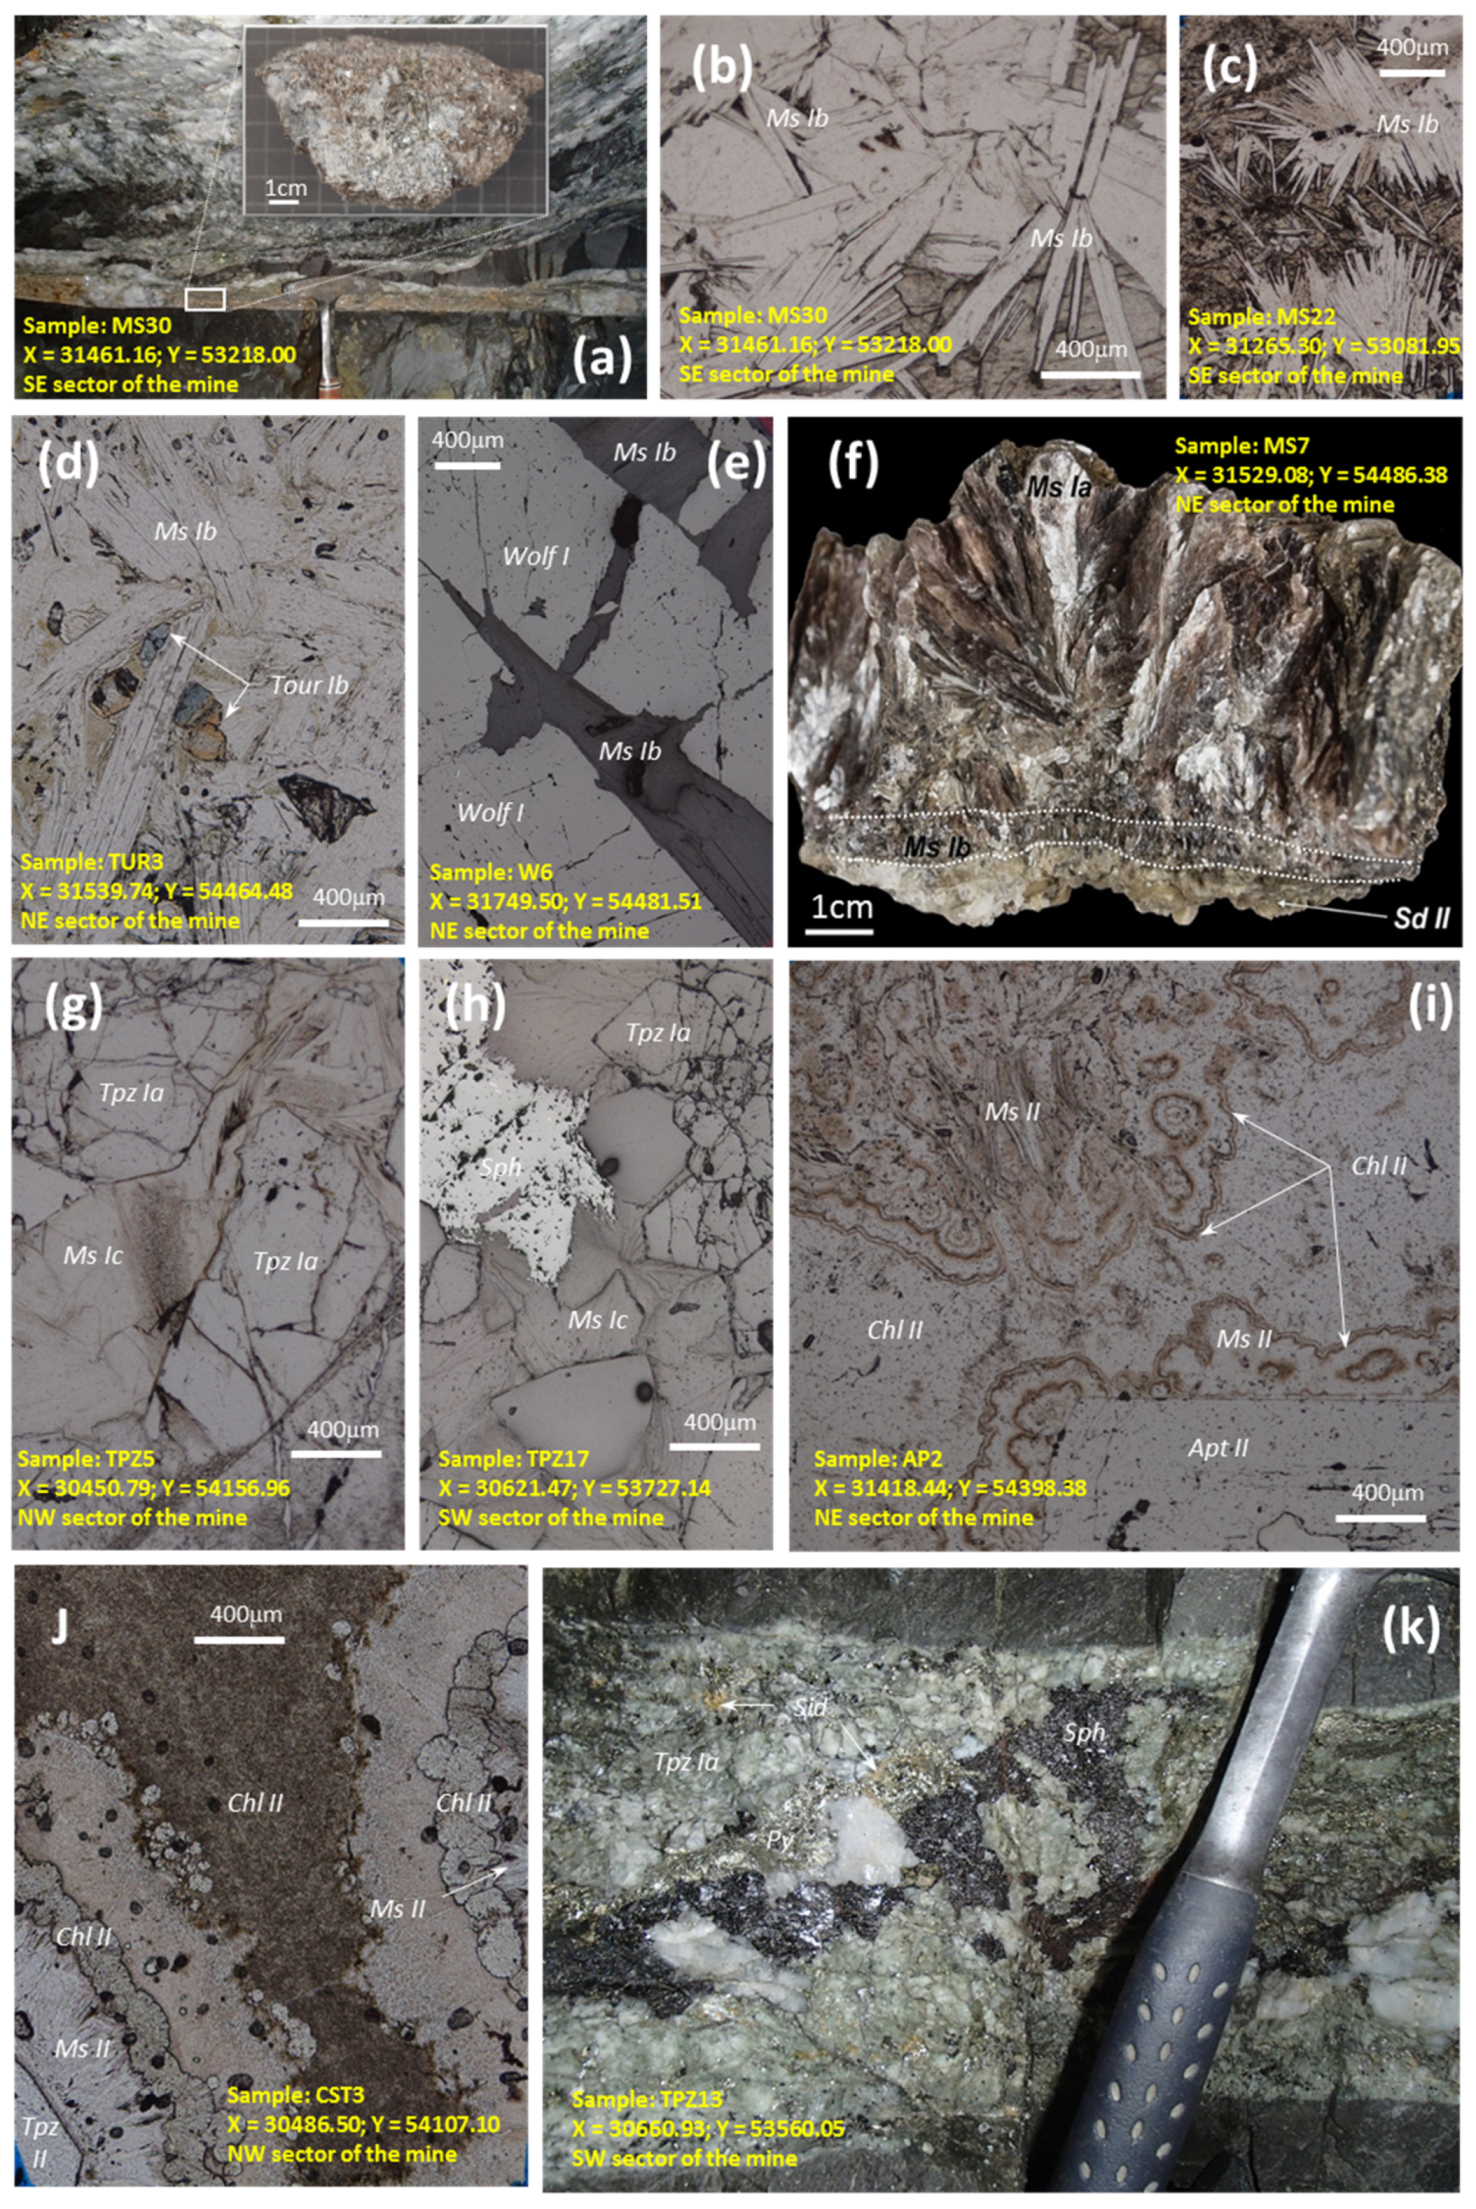
4.1. Tourmaline
4.2. White Mica
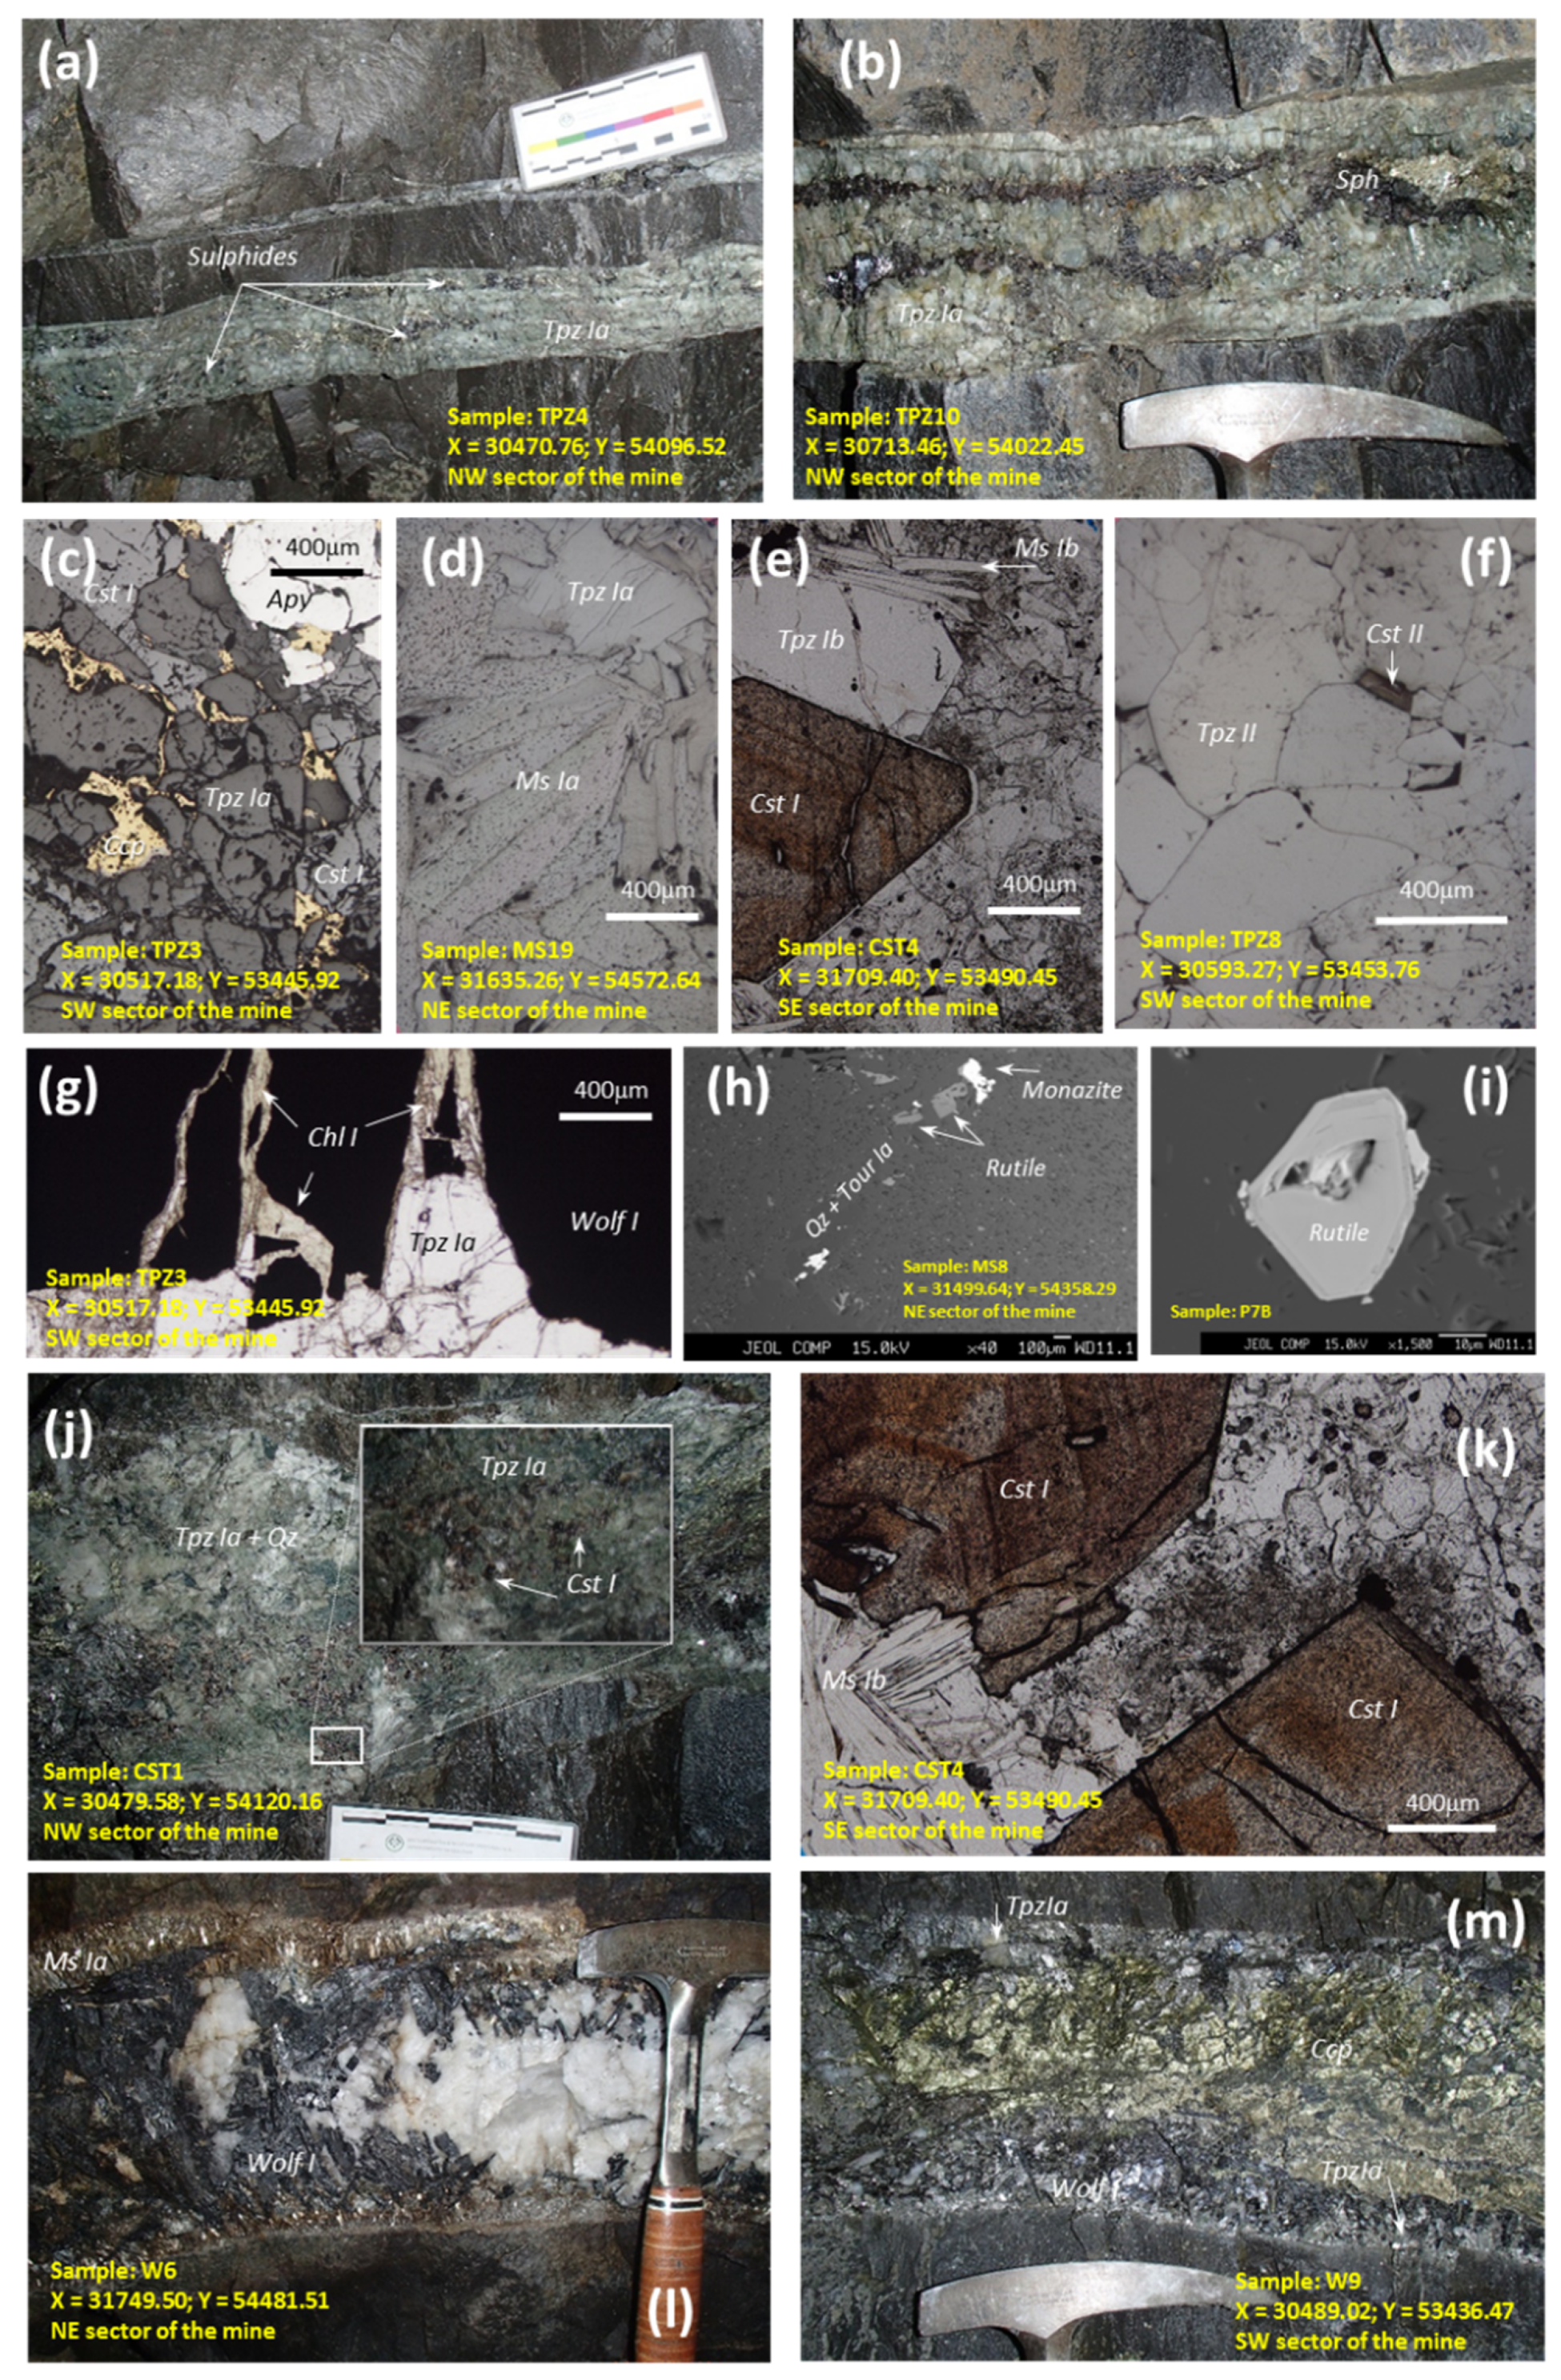
4.3. Topaz
4.4. Chlorite
4.5. Rutile
4.6. Cassiterite
4.7. Wolframite
4.8. Phosphates
4.9. Greisen-Forming Minerals
5. Compositional Variation of Silicates, Oxides and Phosphates
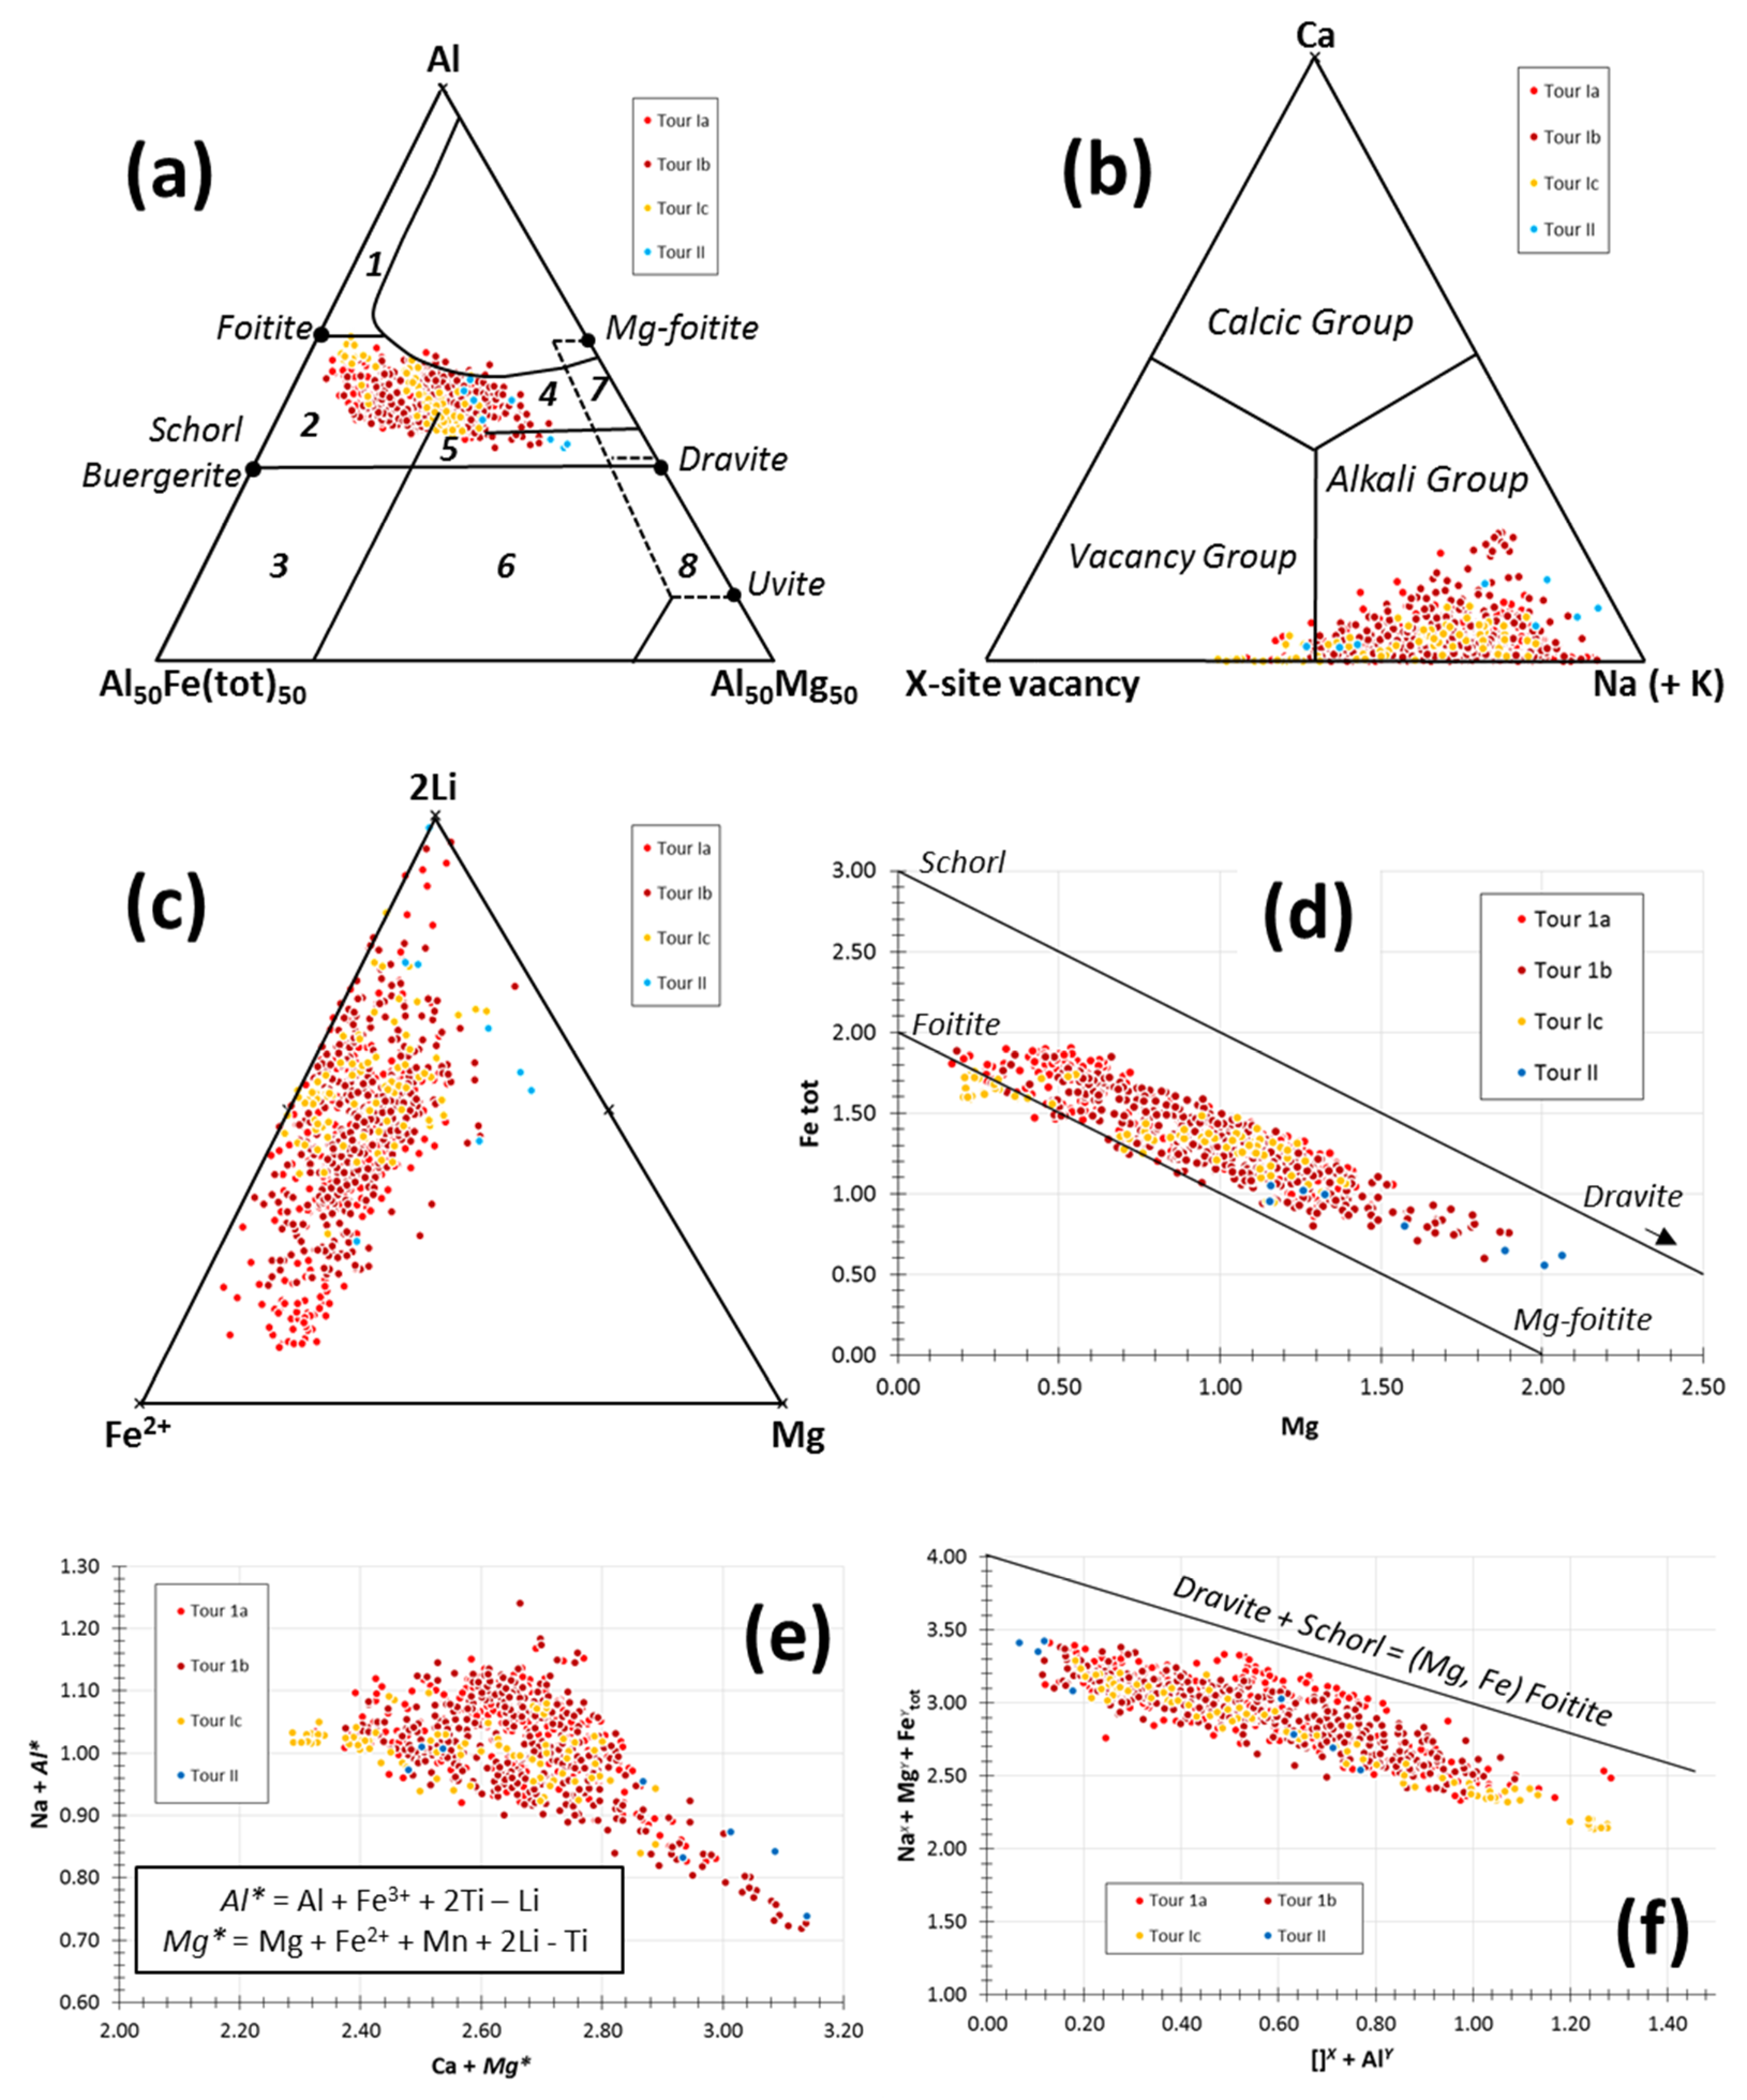
5.1. Tourmaline
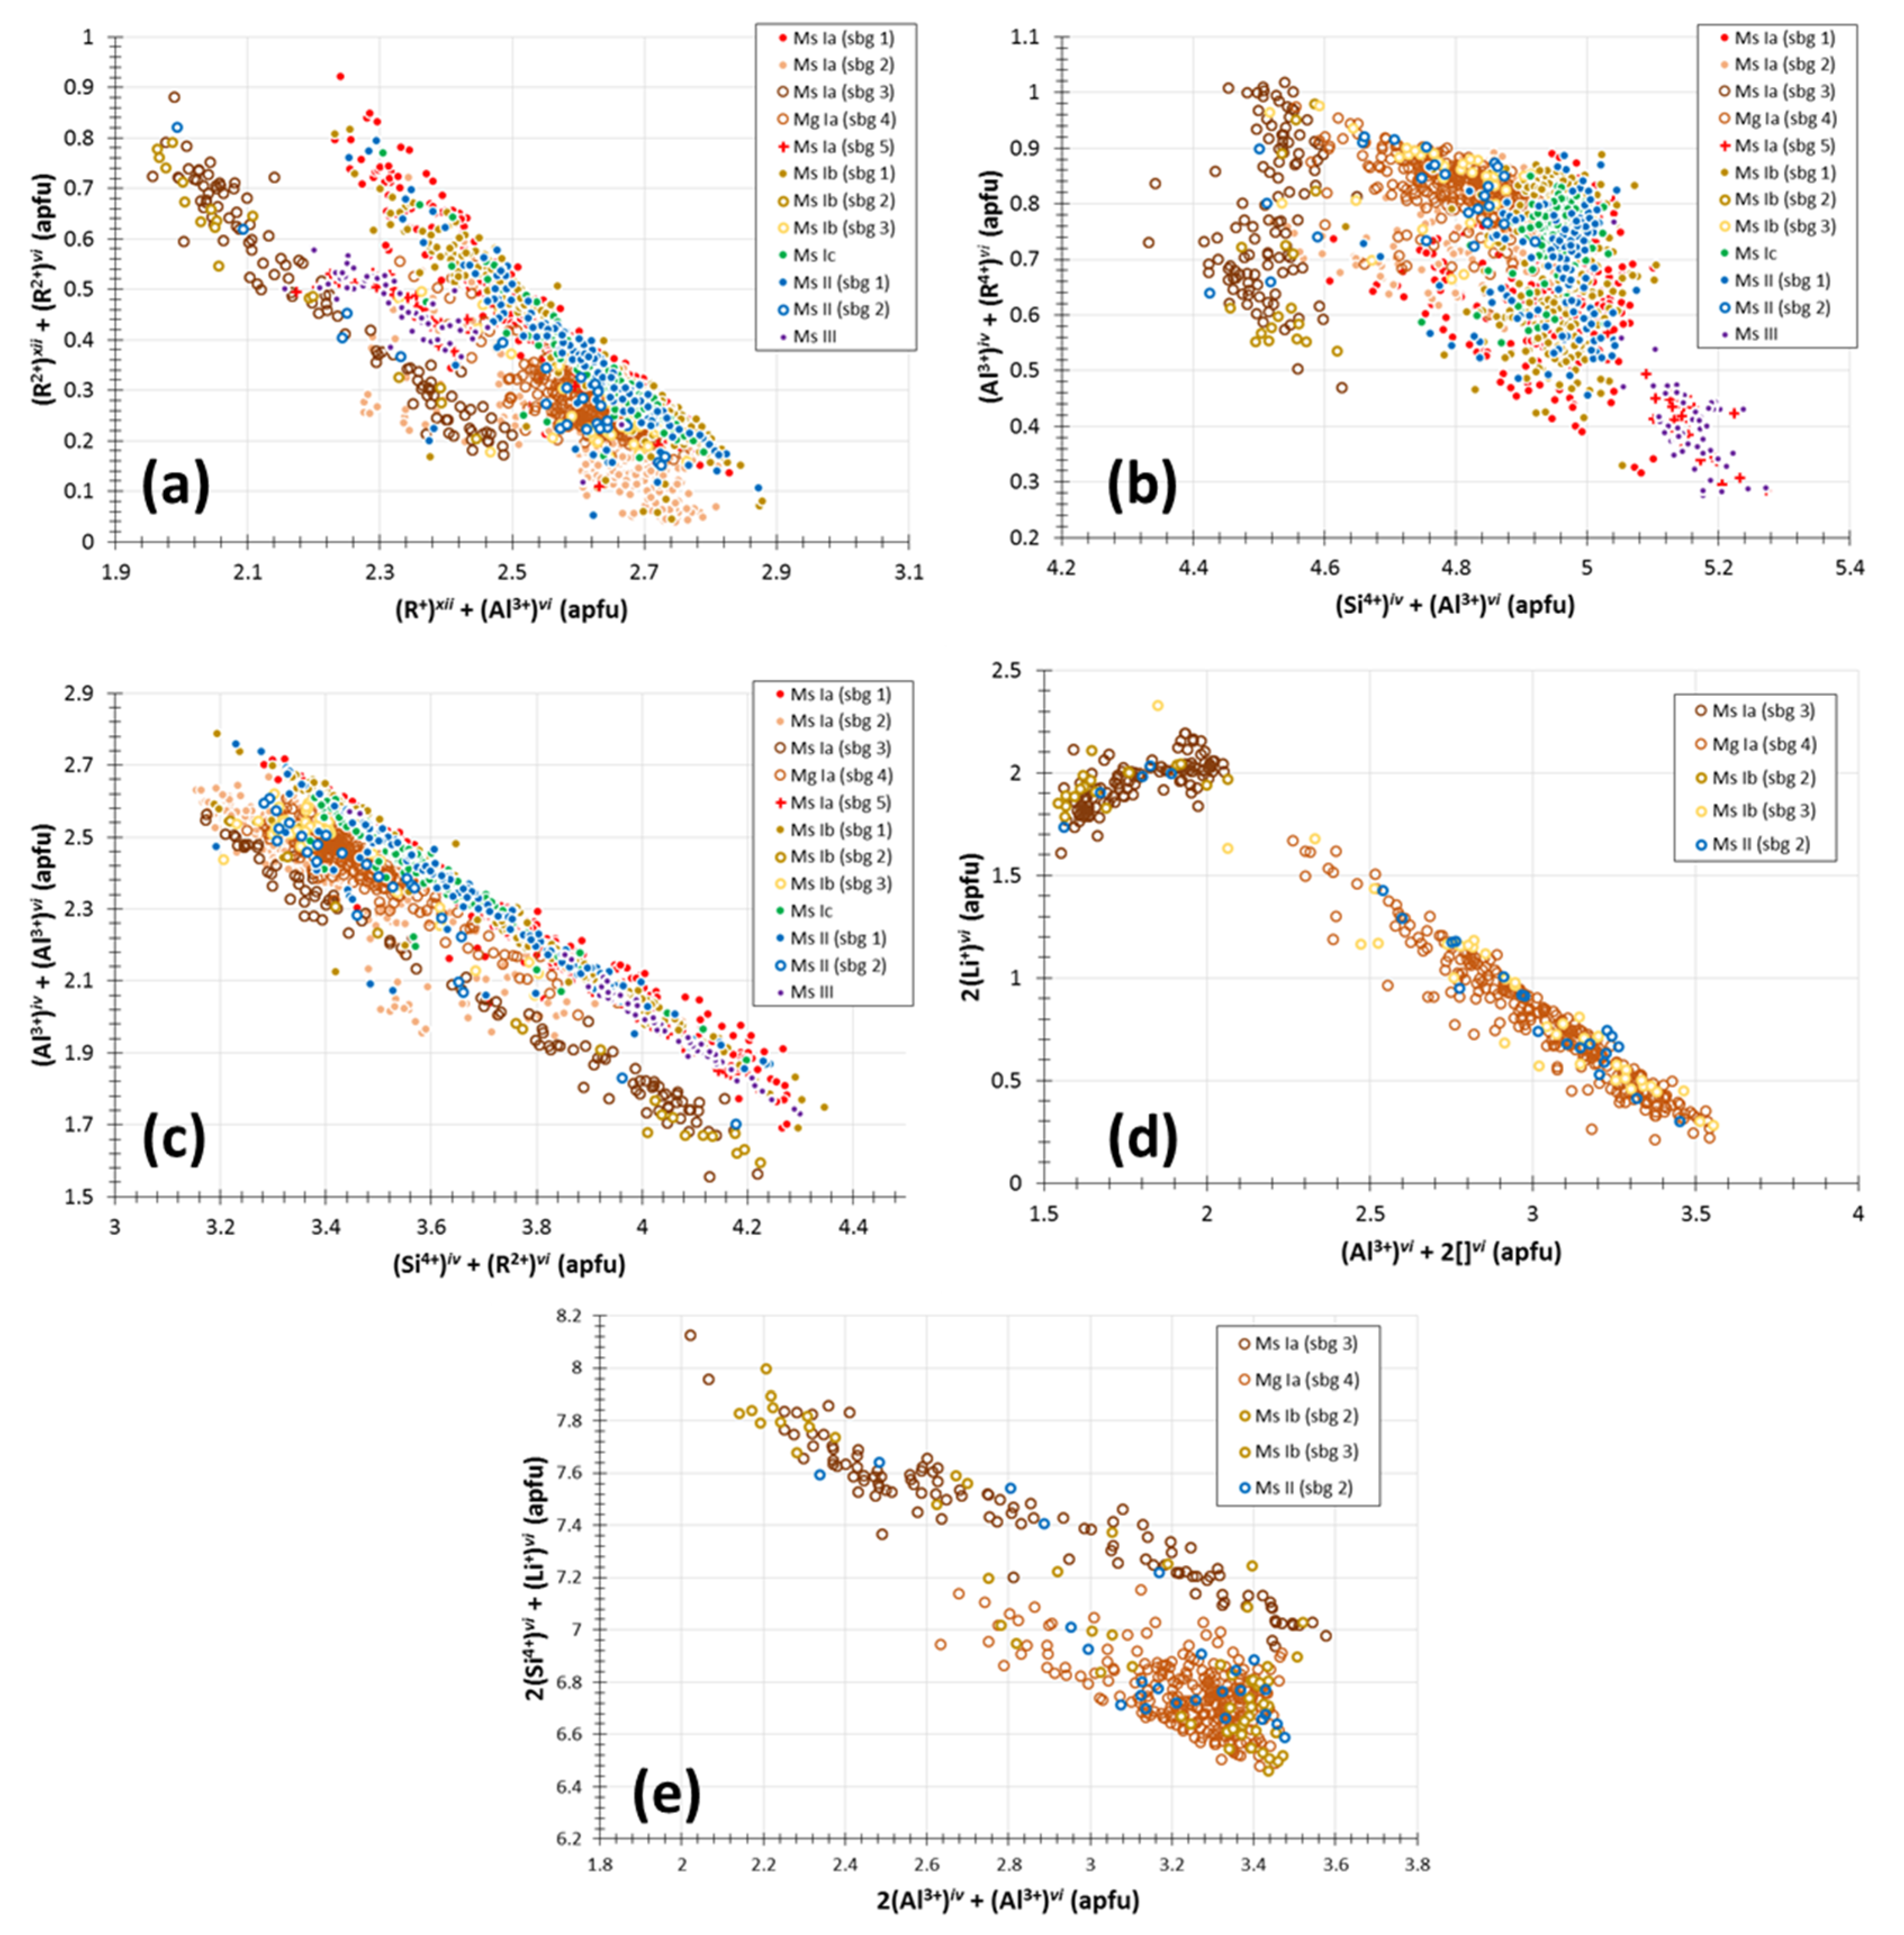
5.2. White Mica
5.3. Topaz
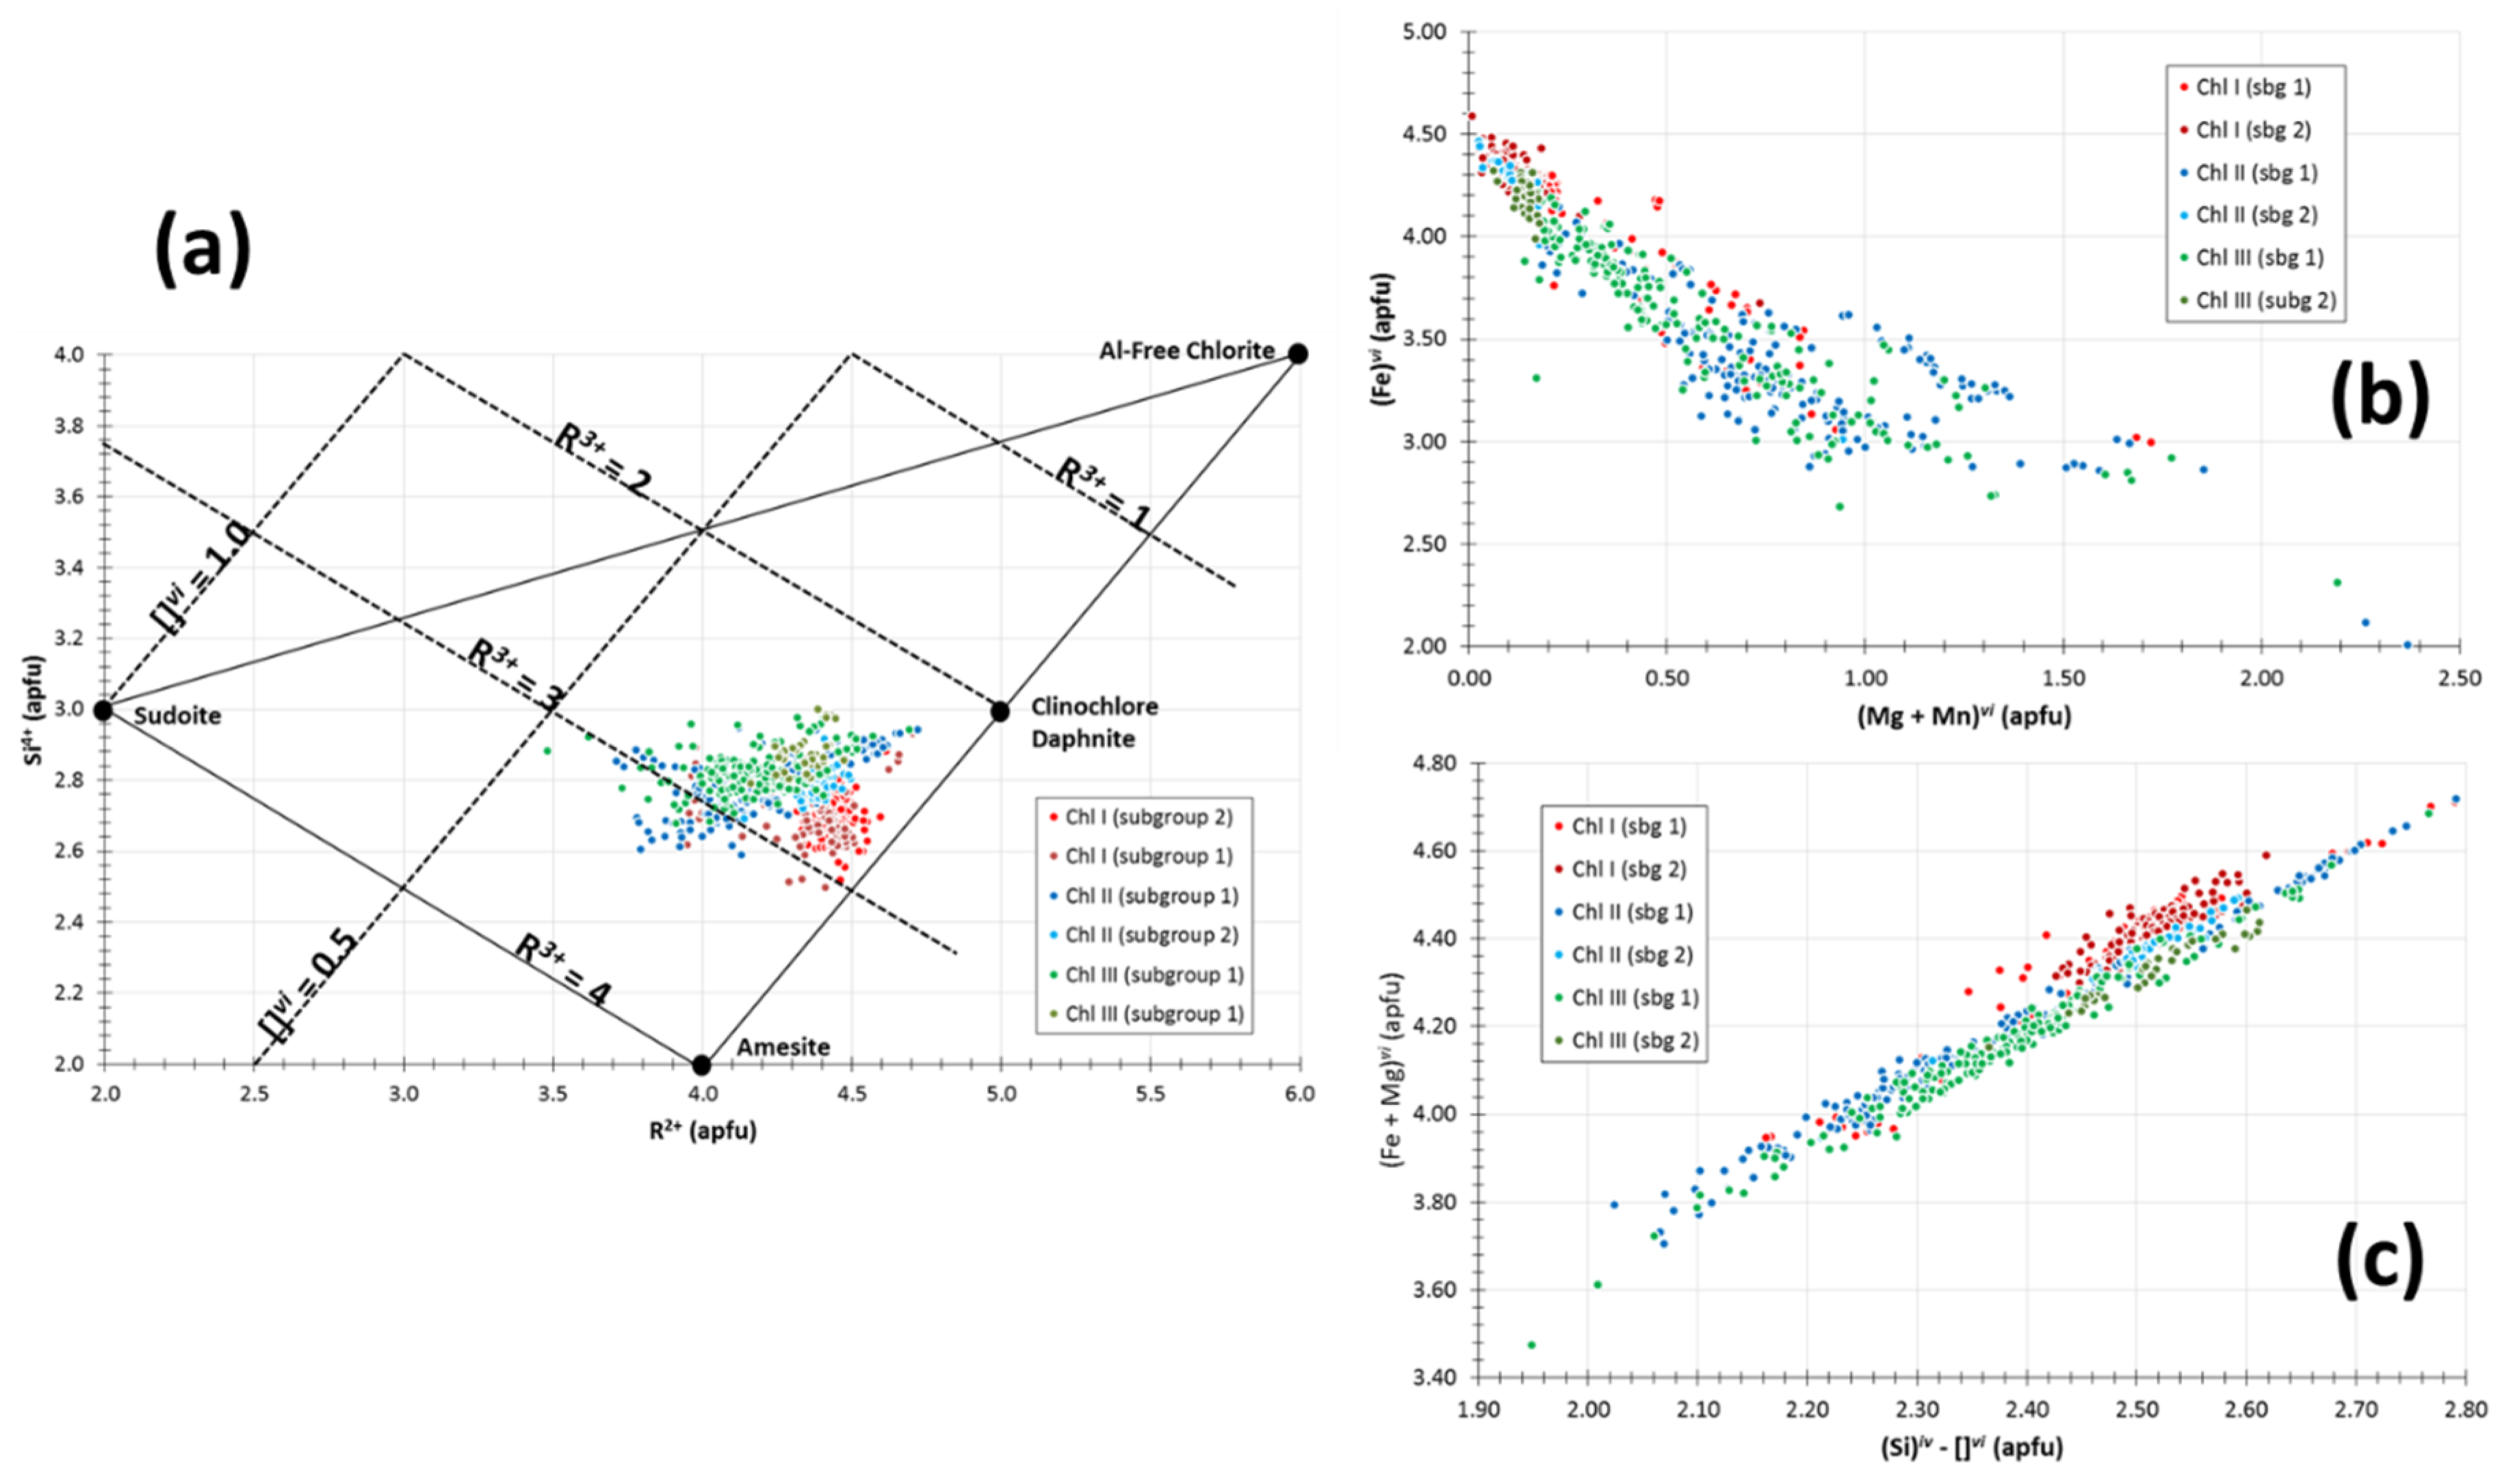
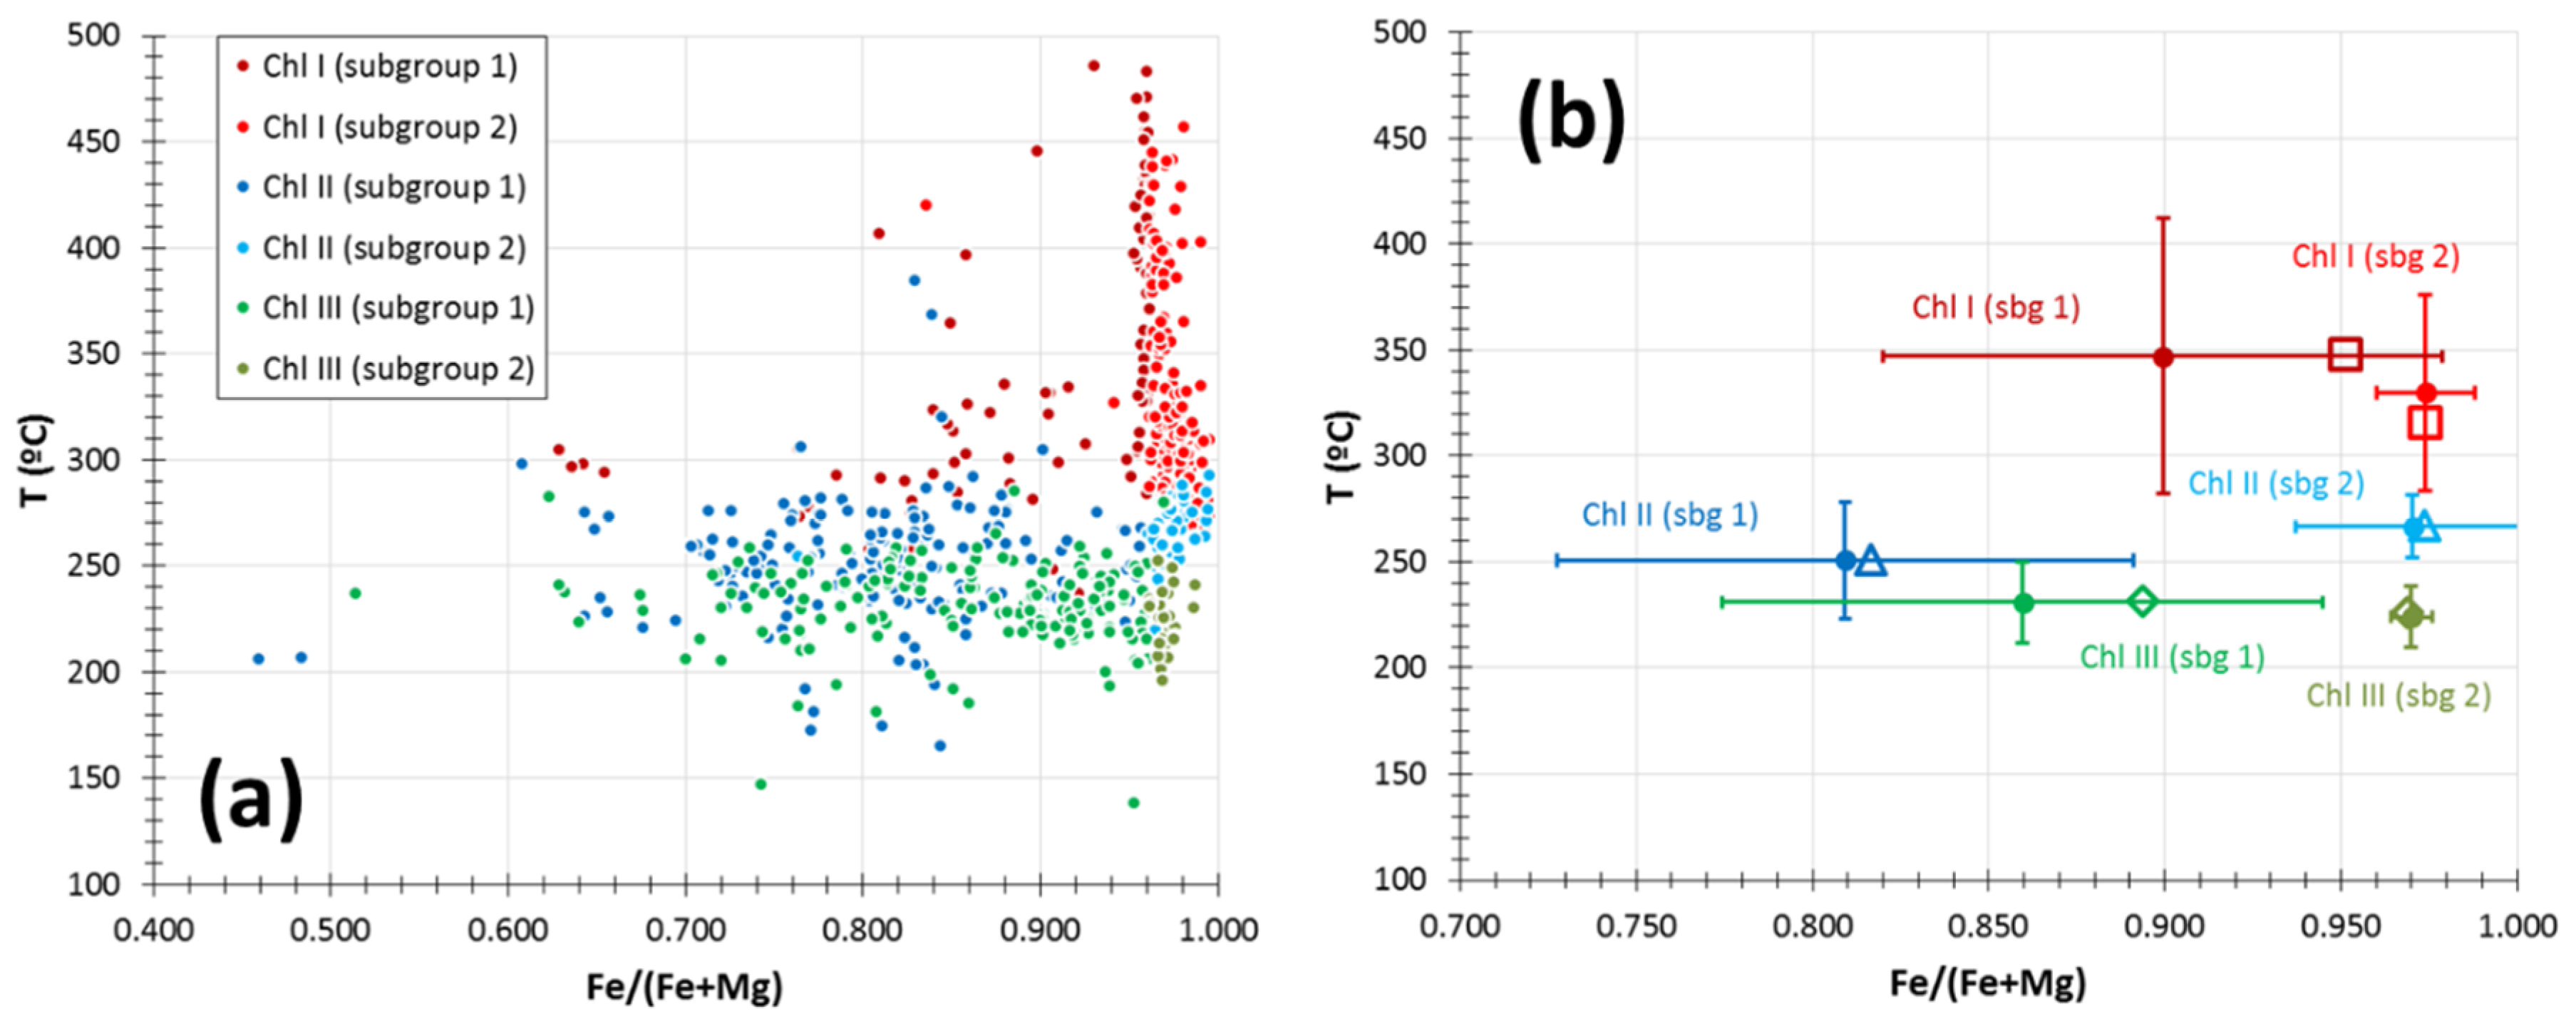
5.4. Chlorite
5.5. Rutile
5.6. Cassiterite
5.7. Wolframite
5.8. Uraninite
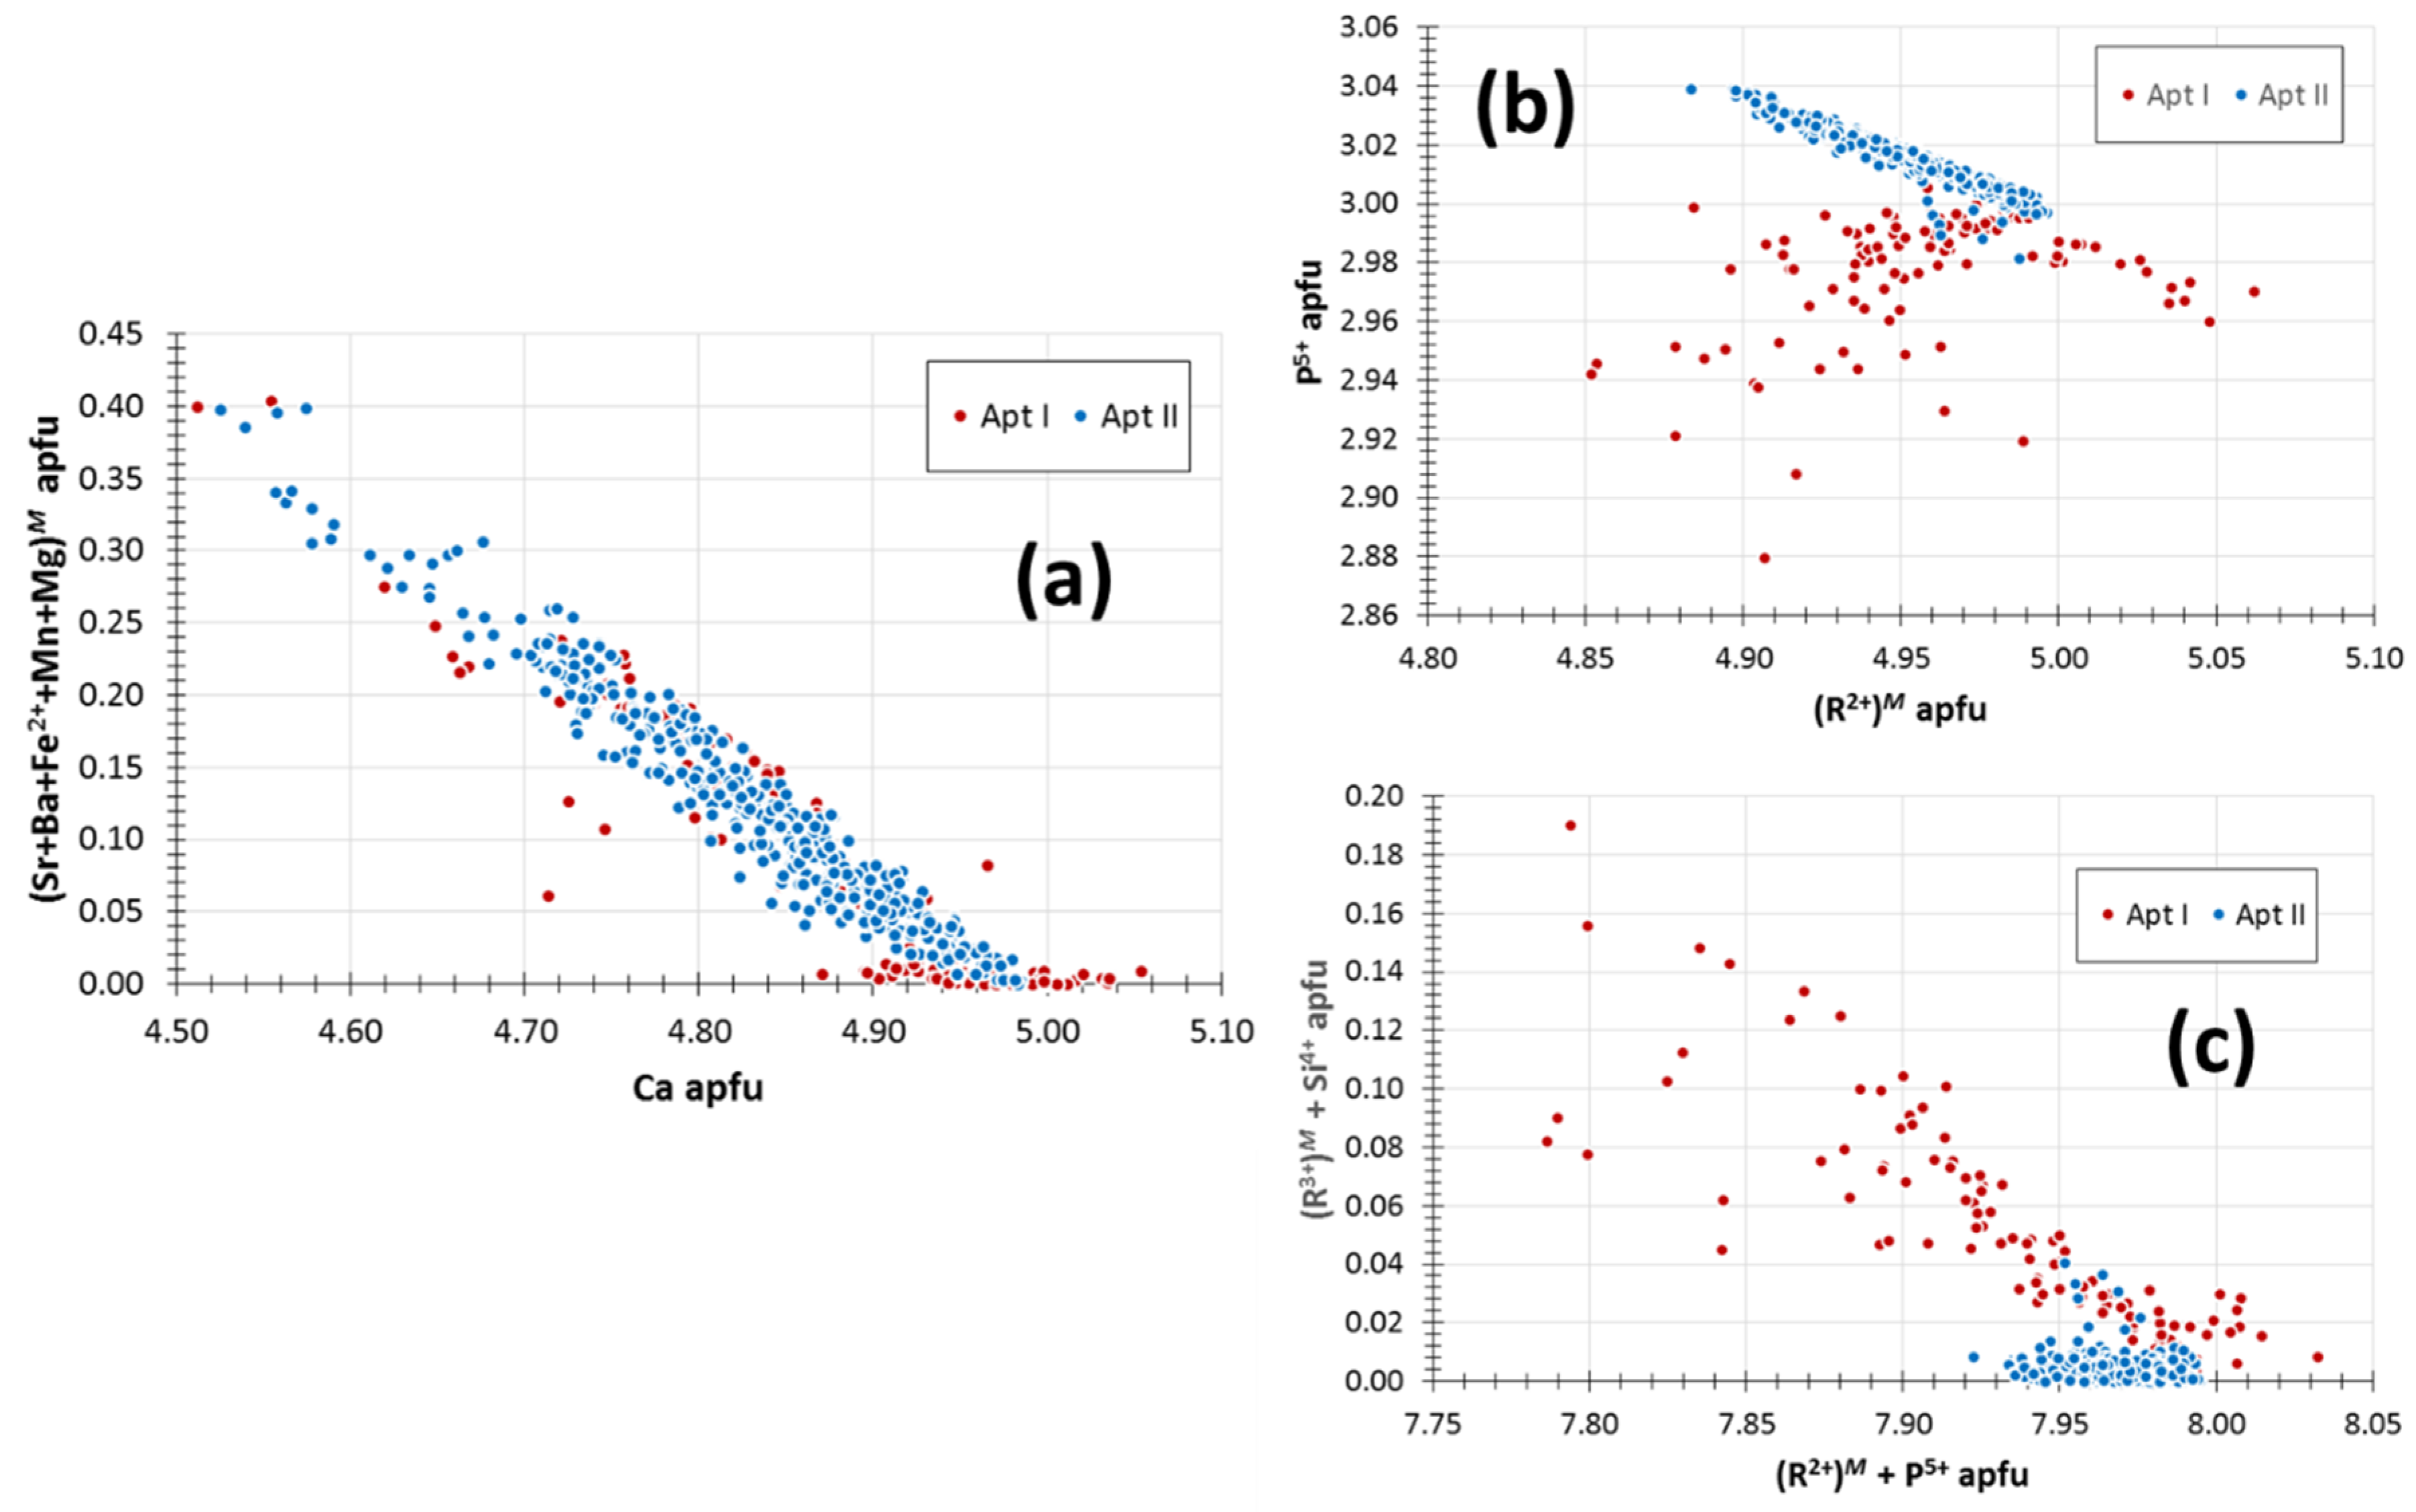
5.9. Apatite
6. Discussion
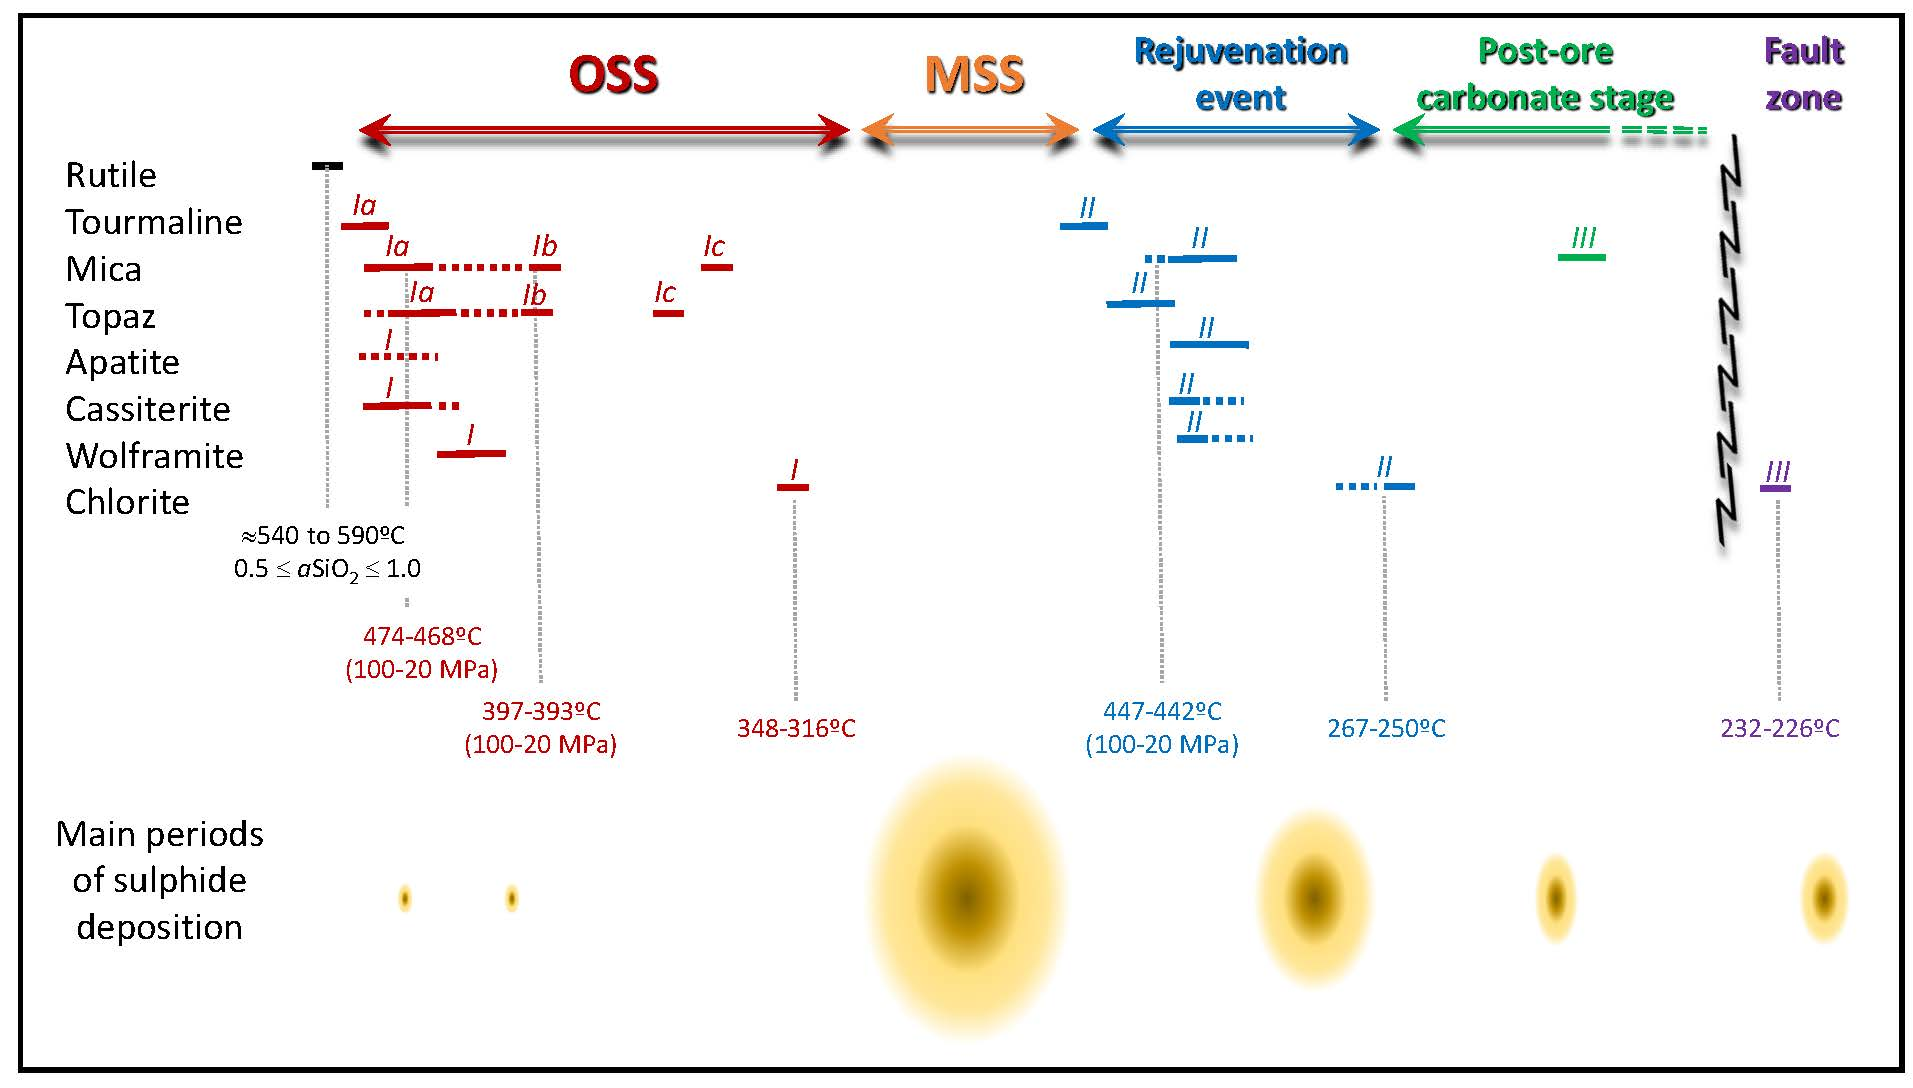
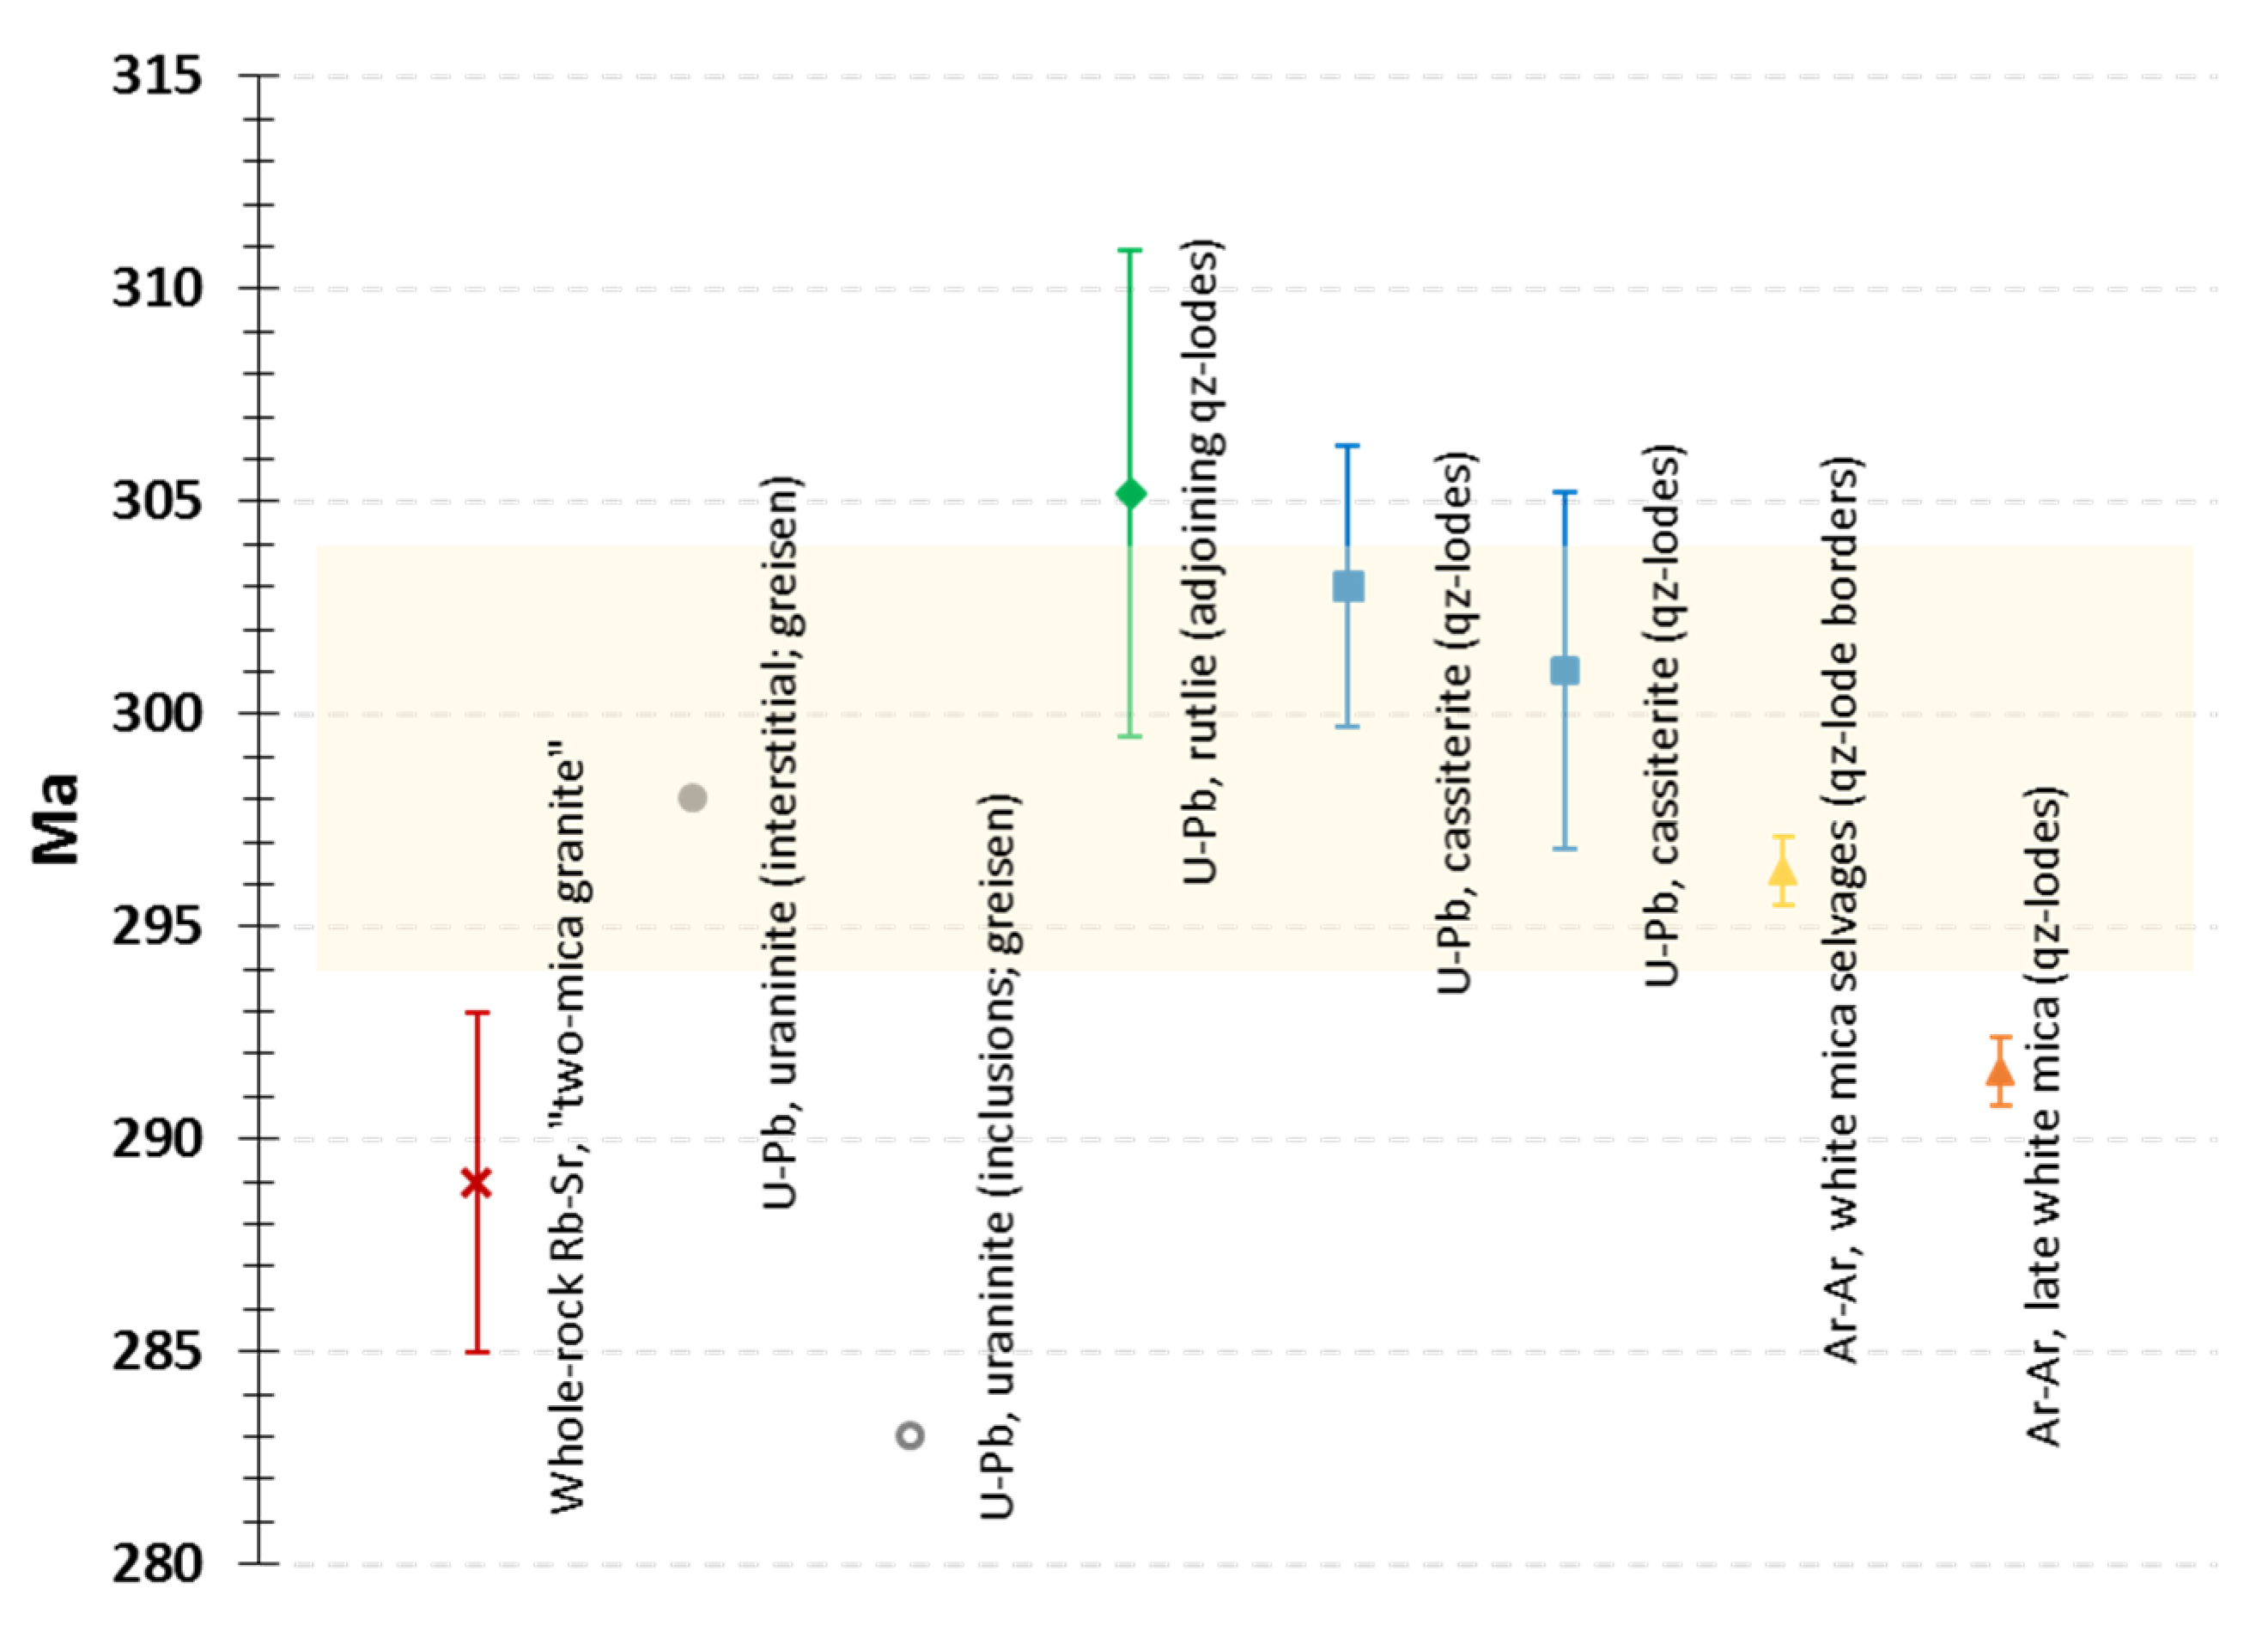
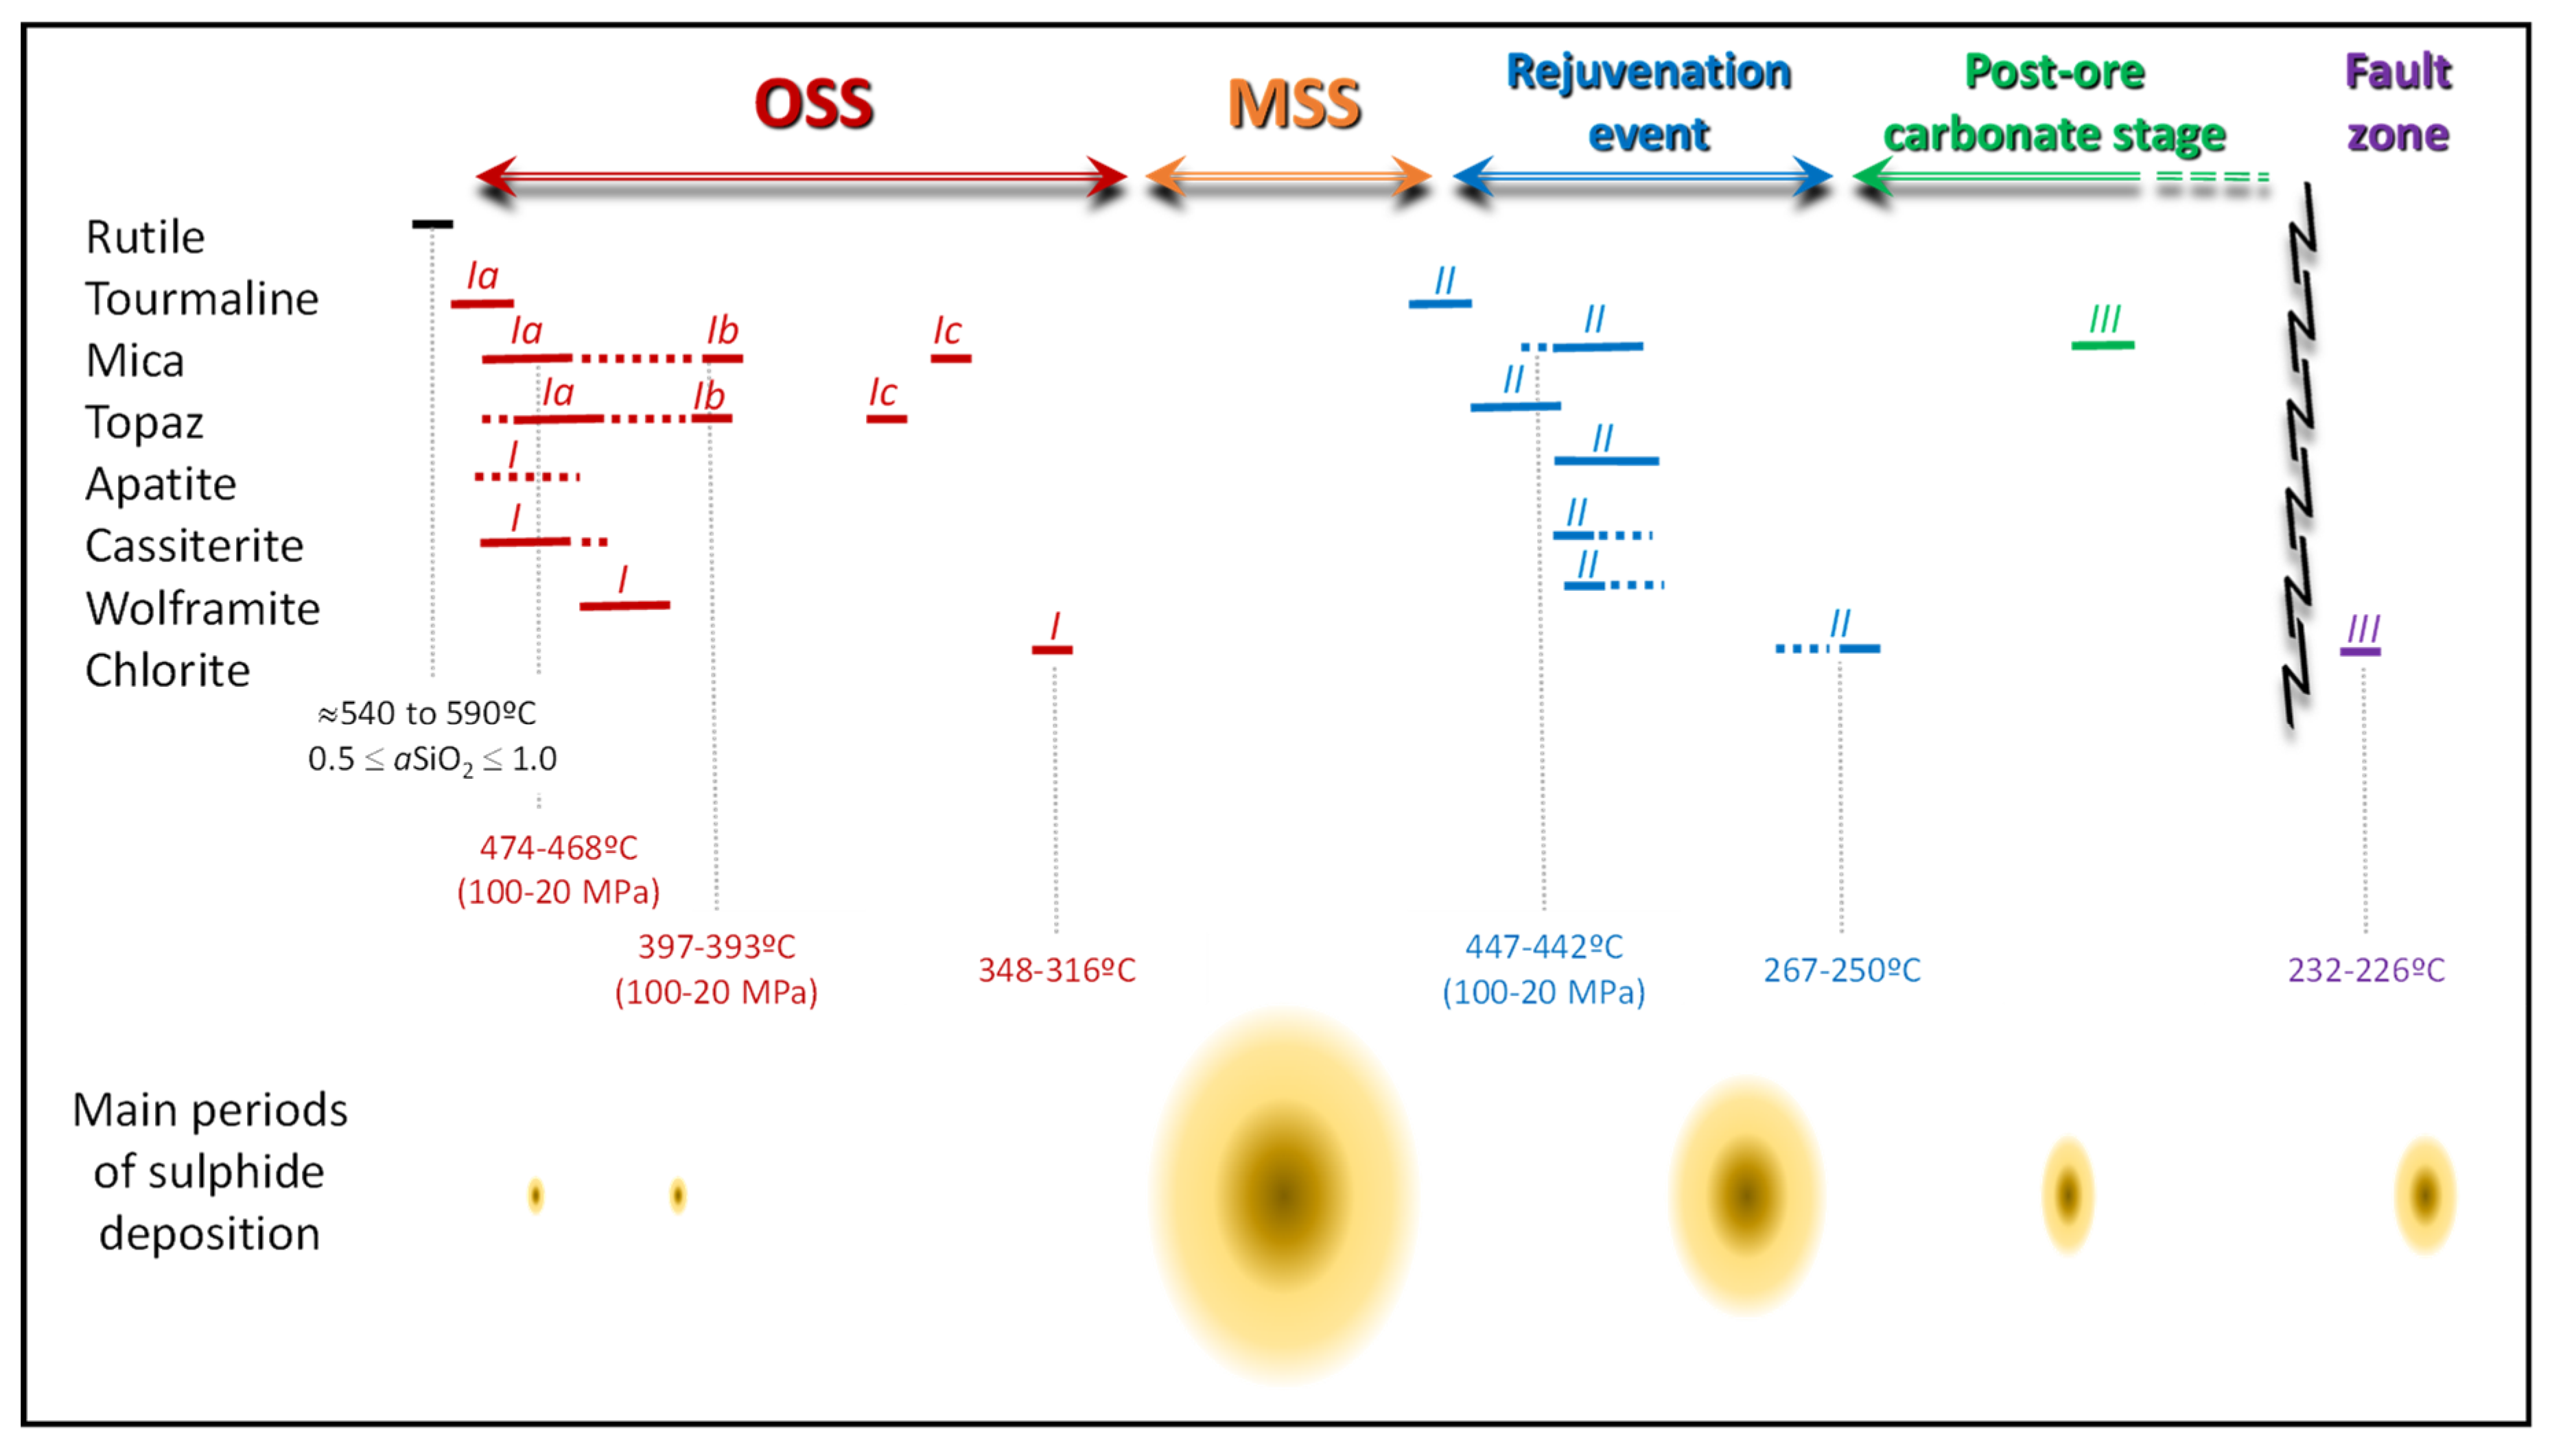
6.1. Time Constraints for the Mineralization Onset and Subsequent Ore Stages
6.2. Chemical Changes in Fluids Indicated by Silicate–Oxide–Phosphate Associations
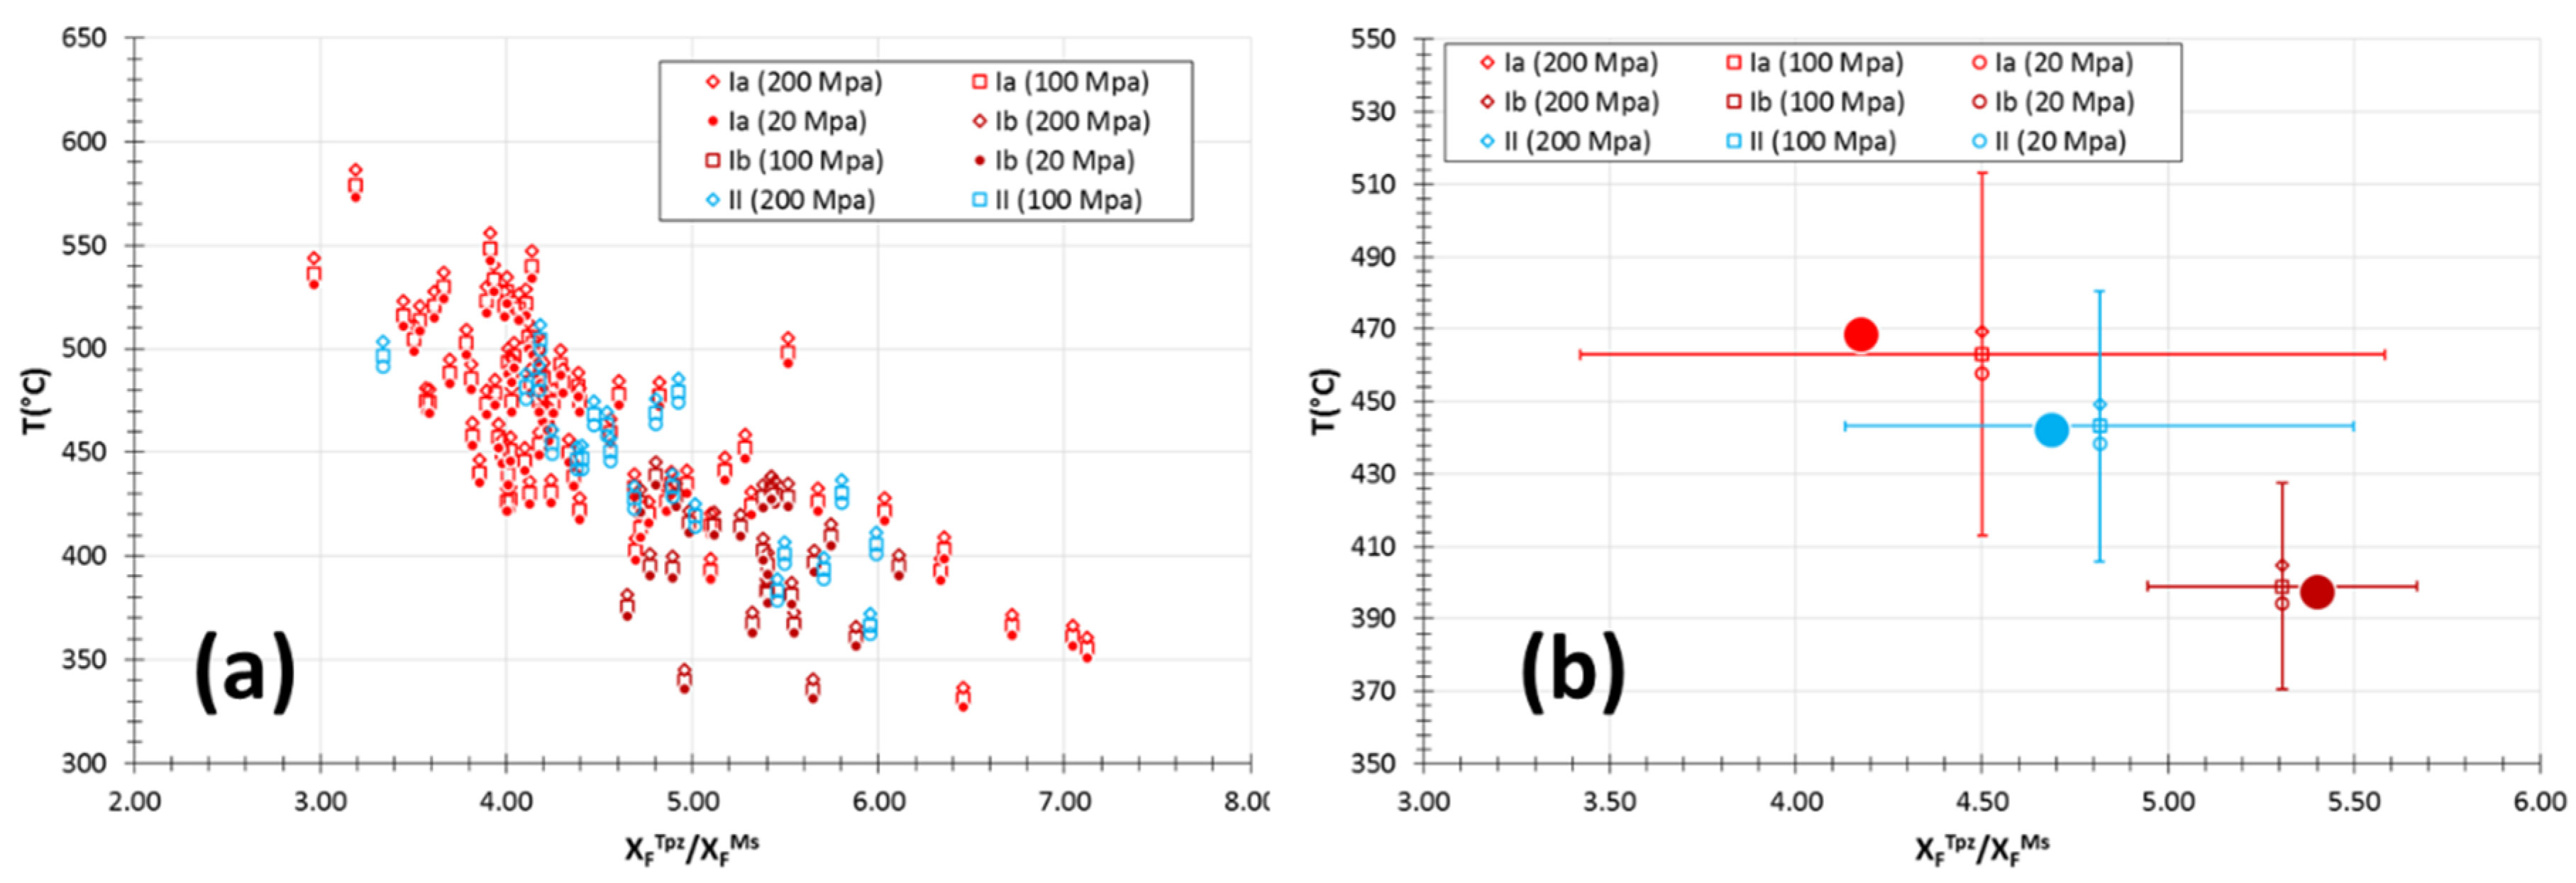
6.3. Evolution of Temperature Conditions
7. Conclusions
Supplementary Materials
Author Contributions
Funding
Acknowledgments
Conflicts of Interest
References
- Linnen, R.L.; Van Lichtervelde, M.; Černý, P. Granitic pegmatites as sources of strategic metals. Elements 2012, 8, 275–280. [Google Scholar] [CrossRef]
- Gunn, G. Critical Metals Handbook; John Wiley & Sons, Ltd.: Hoboken, NJ, USA, 2013. [Google Scholar]
- Dehainea, Q.; Filippova, L.O.; Glass, H.J.; Rollinson, G. Rare-metal granites as a potential source of critical metals: A geometallurgical case study. Ore Geol. Rev. 2019, 104, 384–402. [Google Scholar] [CrossRef] [Green Version]
- Cerný, P.; Blevin, P.L.; Cuney, M.; London, D. Granite-related ore deposits. In Economic Geology; Hedenquist, J.W., Thompson, J.F.H., Goldfarb, R.J., Richards, J.R., Eds.; Society of Economic Geologists, Inc.: Littleton, CO, USA, 2005; Volume 100th Anniversary, pp. 337–370. [Google Scholar]
- Duchoslav, M.; Marks, M.A.W.; Drost, K.; McCammon, C.; Marschall, H.R.; Wenzel, T.; Markl, G. Changes in tourmaline composition during magmatic and hydrothermal processes leading to tin-ore deposition: The Cornubian Batholith, SW England. Ore Geol. Rev. 2017, 83, 215–234. [Google Scholar] [CrossRef]
- Wang, R.C.; Xie, L.; Chen, J.; Yu, A.; Wang, L.; Lu, J.; Zhu, J. Tin-carrier minerals in metaluminous granites of the western Nanling Range (southern China): Constraints on processes of tin mineralization in oxidized granites. J. Asian Earth Sci. 2013, 74, 361–372. [Google Scholar] [CrossRef]
- Simons, B.; Andersen, J.C.Ø.; Shail, R.K.; Jenner, F.E. Fractionation of Li, Be, Ga, Nb, Ta, In, Sn, Sb, Wand Bi in the peraluminous Early Permian Variscan granites of the Cornubian Batholith: Precursor processes to magmatic-hydrothermal mineralization. Lithos 2017, 278, 491–512. [Google Scholar] [CrossRef]
- Harlaux, M.; Mercadier, J.; Marignac, C.; Peiffert, C.; Cloquet, C.; Cuney, M. Tracing metal sources in peribatholitic hydrothermal W deposits based on the chemical composition of wolframite: The example of the Variscan French Massif Central. Chem. Geol. 2018, 479, 58–85. [Google Scholar] [CrossRef]
- Schmidt, C. Formation of hydrothermal tin deposits: Raman spectroscopic evidence for an important role of aqueous Sn(IV) species. Geochim. Cosmochim. Acta 2018, 220, 499–511. [Google Scholar] [CrossRef]
- Schmidt, C.; Romer, R.L.; Wohlgemuth-Ueberwasser, C.C.; Appelt, O. Partitioning of Sn and W between granitic melt and aqueous fluid. Ore Geol. Rev. 2020, 117, 103263. [Google Scholar] [CrossRef]
- Liu, X.; Xiao, C. Wolframite solubility and precipitation in hydrothermal fluids: Insight from thermodynamic modeling. Ore Geol. Rev. 2020, 117, 103289. [Google Scholar] [CrossRef]
- Schuiling, R.D. Tin belts on the continents around the Atlantic Ocean. Econ. Geol. 1967, 62, 540–550. [Google Scholar] [CrossRef]
- Routhier, P. A new approach to metallogenic provinces; the example of Europe. Econ. Geol. 1976, 71, 803–811. [Google Scholar] [CrossRef]
- Derré, C. Caracteristiques de la distribution des gisements à etain et tungstene dans l’ouest de l’Europe. Miner. Deposita 1982, 17, 55–77. [Google Scholar] [CrossRef]
- Marignac, C.; Cuney, M. Ore deposits of the French Massif Central: Insight into the metallogenesis of the Variscan collision belt. Miner. Deposita 1999, 34, 472–504. [Google Scholar] [CrossRef]
- Blundell, D.; Arndt, N.; Cobbold, P.R.; Heinrich, C. Geodynamics and ore deposit evolution in Europe. Ore Geol. Rev. 2005, 27, 345. [Google Scholar] [CrossRef]
- De Vos, W.; Batista, M.J.; Demetriades, A.; Duris, M.; Lexa, J.; Lis, J.; Marsina, K.; O’Connor, P.J. Metallogenic mineral provinces and world class ore deposits in Europe. In IUSGS/IAGC Global Geochemical Baselines; EuroGeoSurveys: Brussels, Belgium, 2005. [Google Scholar]
- Kerrich, R.; Goldfarb, R.J.; Richards, J.P. Metallogenic provinces in an evolving geodynamic framework. In Economic Geology; Hedenquist, J.W., Thompson, J.F.H., Goldfarb, R.J., Richards, J.R., Eds.; Society of Economic Geologists, Inc.: Littleton, CO, USA, 2005; Volume 100th Anniversary, pp. 1097–1136. [Google Scholar]
- Bouchot, V.; Ledru, P.; Lerouge, C.; Lescuyer, J.-L.; Milesi, J.-P. Late Variscan mineralizing systems related to orogenic processes: The French Massif Central. Ore Geol. Rev. 2005, 27, 169–197. [Google Scholar] [CrossRef]
- Romer, R.L.; Thomas, R.; Stein, H.J.; Rhede, D. Dating multiply overprinted Sn-mineralized granites–examples from the Erzgebirge, Germany. Miner. Deposita 2007, 42, 337–359. [Google Scholar] [CrossRef]
- Harlaux, M.; Romer, R.L.; Mercadier, J.; Morloti, C.; Marignac, C.; Cuney, M. 40 Ma of hydrothermal W mineralization during the Variscan orogenic evolution of the French Massif Central revealed by U-Pb dating of wolframite. Miner. Deposita 2018, 53, 21–51. [Google Scholar] [CrossRef]
- Gourcerol, B.; Gloaguen, E.; Melleton, J.; Tudur, J.; Galiegue, X. Re-assessing the European lithium resource potential—A review of hard-rock resources and metallogeny. Ore Geol. Rev. 2019, 109, 494–519. [Google Scholar] [CrossRef] [Green Version]
- Priem, D.; Tex, T. Tracing crustal evolution in the NW Iberian Peninsula through the Rb-Sr and U-Pb systematics of Paleozoic granitoids: A review. Phys. Earth Planet. Interiors 1984, 35, 121–130. [Google Scholar] [CrossRef]
- Ferreira, N.; Iglesias, M.; Noronha, F.; Pereira, E.; Ribeiro, A.; Ribeiro, M.L. Granitóides da Zona Centro Ibérica e seu enquadramento geodinâmico. In Geologia de Los Granitoides y Rocas Associadas del Macizo Hespérico Libro Homenaje a LC Garcia de Figuerola; Bea, F., Carnicero, E., Gonzalo, J.C., Plaza, M.L., Rodríguez, M.D., Eds.; Rueda: Madrid, Spain, 1987; pp. 37–53. [Google Scholar]
- Reavy, R.J. Structural controls on metamorphism and syn-tectonic magmatism: The Portuguese hercynian collision belt. J. Geol. Soc. Lond. 1987, 146, 649–657. [Google Scholar] [CrossRef]
- Reavy, R.J.; Stephens, W.E.; Fallick, A.E.; Halliday, A.N.; Godinho, M.M. Geochemical and isotopic constraints on petrogenesis: The Serra da Freita pluton, a typical granite body from the Portuguese Hercynian collision belt. Geol. Soc. Am. Bull. 1991, 193, 392–401. [Google Scholar] [CrossRef]
- Vigneresse, J.L. Intrusion level of granitic massifs along the Hercynian belt: Balancing the eroded crust. Tectonophysics 1999, 307, 277–295. [Google Scholar] [CrossRef]
- Henk, A.; von Blackenburg, F.; Finger, F.; Schaltegger, U.; Zulauf, G. Syn-convergent high-temperature metamorphism and magmatism in the Variscides: A discussion of potential heat sources. In Orogenic Processes: Quantification and modelling, Variscan Belt (W. Frank, V. Haak, O. Oncken, D. Tanner, Eds.). Geol. Soc. Lond. Spec. Publ. 2000, 179, 387–399. [Google Scholar] [CrossRef]
- Fernandez-Suarez, J.; Dunning, G.R.; Jenner, G.A.; Gutierrez-Alonso, G. Variscan collisional magmatism and deformation in NW Iberia: Constraints from U-Pb geochronology of granitoids. J. Geol. Soc. Lond. 2000, 157, 565–576. [Google Scholar] [CrossRef]
- Dias, G.T. Fontes de granitóides hercínicos da Zona Centro-Ibérica (Norte de Portugal): Evidências isotópicas (Sr, Nd). In Geoquímica e Petrogénese de Rochas Granitóides; Neiva, A.M.R., Ed.; Mem. Acad. Ciên.; Academia das Ciências de Lisboa: Lisboa, Portugal, 2001; pp. 21–43. [Google Scholar]
- Ribeiro, M.L. Modelos de implantação dos granitos variscos portugueses. In Geoquímica e Petrogénese de Rochas Granitóides; Neiva, A.M.R., Ed.; Mem. Acad. Ciên.; Academia das Ciências de Lisboa: Lisboa, Portugal, 2001; pp. 33–52. [Google Scholar]
- Bea, F.; Montero, P.; Zinger, T. The nature, origin and thermal influence of the granite source layer of Central Iberia. J. Geol. 2003, 111, 579–595. [Google Scholar] [CrossRef] [Green Version]
- Valle Aguado, B.; Azevedo, M.R.; Schaltegger, U.; Martínez-Catalán, J.R.; Nolan, J. U/Pb zircon and monazite geochronology of Variscan magmatism related to synconvergence extension in Central Northern Portugal. Lithos 2005, 82, 169–184. [Google Scholar] [CrossRef] [Green Version]
- Fernández-Suarez, J.; Gutierrez-Alonso, G.; Johnston, S.T.; Jeffries, T.E.; Pastor-Galán, D.; Jenner, G.A.; Murphy, J.B. Iberian late-Variscan granitoids: Some considerations on crustal sources and the significance of “mantle extraction ages”. Lithos 2011, 123, 121–132. [Google Scholar] [CrossRef] [Green Version]
- Manning, D.A.C.; Pichavant, M. The role of fluorine and boron in the generation of granitic melts. In Migmatites, Melting and Metamorphism; Atherton, M.P., Gribble, C.D., Eds.; Shiva Publishing Unlimited: Nantwich, UK, 1983; pp. 94–109. [Google Scholar]
- Tischendorf, G.; Förster, H.-J. Acid magmatism and related metallogenesis in the Erzgebirge. Geol. J. 1990, 25, 443–454. [Google Scholar] [CrossRef]
- Bea, F.; Fershtater, G.; Corretgé, L.G. The geochemistry of phosphorus in granite rocks and the effect of aluminium. Lithos 1992, 29, 43–56. [Google Scholar] [CrossRef]
- Bea, F.; Pereira, M.D.; Stroh, A. Mineral/leucosome trace-element partitioning in a peraluminous migmatite (a laser ablation-ICP-MS study). Chem. Geol. 1994, 117, 291–312. [Google Scholar] [CrossRef]
- Brown, M.; Rushmer, T. Evolution and Differentiation of the Continental Crust; Cambridge University Press: Cambridge, UK, 2006. [Google Scholar]
- Romer, R.L.; Förster, H.-J.; Hahne, K. Strontium isotopes—A persistent tracer for the recycling of Gondwana crust in the Variscan orogen. Gondwana Res. 2012, 22, 262–278. [Google Scholar] [CrossRef]
- Romer, R.L.; Meixner, A.; Förster, H.-J. Lithium and boron in late-orogenic granites—Isotopic fingerprints for the source of crustal melts? Geochim. Cosmochim. Acta 2014, 131, 98–114. [Google Scholar] [CrossRef]
- Romer, R.L.; Meixner, A.; Hahne, K. Lithium and boron isotopic composition of sedimentary rocks—The role of source history and depositional environment: A 250 Ma record from the Cadomian orogeny to the Variscan orogeny. Gondwana Res. 2012, 26, 1093–1110. [Google Scholar] [CrossRef]
- Romer, R.L.; Kroner, U. Sediment and weathering control on the distribution of Paleozoic magmatic tin–tungsten mineralization. Miner. Deposita 2015, 50, 327–338. [Google Scholar] [CrossRef]
- Romer, R.L.; Kroner, U. Phanerozoic tin and tungsten mineralization—Tectonic controls on the distribution of enriched protoliths and heat sources for crustal melting. Gondwana Res. 2016, 31, 60–95. [Google Scholar] [CrossRef]
- Wolf, M.; Romer, R.L.; Franz, L.; López-Moro, F.J. Tin in granitic melts: The role of melting temperature and protolith composition. Lithos 2018, 310, 20–30. [Google Scholar] [CrossRef]
- Tichomirowa, M.; Gerdes, A.; Lapp, M.; Leonhardt, D.; Whitehouse, M. The chemical evolution from older (323–318 Ma) towards younger highly evolved tin granites (315–314 Ma)—Sources and metal enrichment in Variscan Granites of the Western Erzgebirge (Central European Variscides, Germany). Minerals 2019, 9, 769. [Google Scholar] [CrossRef] [Green Version]
- Štemprok, M. Intrusion sequences within ore-bearing granitoid plutons. Geol. J. 1990, 25, 413–417. [Google Scholar] [CrossRef]
- Candela, P.A. A review of shallow, ore-related granites: Textures, volatiles, and ore metals. J. Petrol. 1997, 38, 1619–1633. [Google Scholar] [CrossRef]
- Štemprok, M. The origin and mineralization of the tin-bearing granites of the Krušnéhory (Erzgebirge) province: A 3-dimensional approach with new data on ore deposit zoning around a granite batholith. Glob. Tect. Metal. 2003, 8, 215–226. [Google Scholar]
- Černý, P.; Ercite, T.S. The classification of granitic pegmatites revisited. Can. Mineral. 2005, 43, 2005–2026. [Google Scholar] [CrossRef] [Green Version]
- Štemprok, M.; Dolejš, D. Fluid focusing, mass transfer and origin of fracture-controlled greisens in the Western Krušné hory pluton, Central Europe. Zt. Geol. Wiss. 2010, 38, 207–234. [Google Scholar]
- Štemprok, M.; Dolejš, D.; Müller, A.; Seltmann, R. Textural evidence of magma decompression, devolatilization and disequilibrium quenching: An example from the Western Krušné hory/Erzgebirge granite pluton. Contrib. Mineral. Petrol. 2008, 155, 93–109. [Google Scholar] [CrossRef]
- Wheeler, A. Report NI 43-101: Technical Report on the Mineral Resources and Reserves of Panasqueira Mine. Portugal, 2016; 155p. [Google Scholar]
- Neftali da Costa, F. Notas sobre o Jazigo de volfrâmio da Panasqueira. Bol. Soc. Geológica Port. 1943, 3/1-2, 103–108. [Google Scholar]
- Bloot, C.; Wolf, L.C. Geological features of the Panasqueira tin-tungsten ore-occurrence (Portugal). Bol. Soc. Geológica Port. 1953, 11, 2–75. [Google Scholar]
- Thadeu, D. Geologia do Couto Mineiro da Panasqueira. Commun. Serv. Geol. Port. 1951, 32, 5–64. [Google Scholar]
- Thadeu, D. Le gisement stanno-wolframifère de Panasqueira (Portugal). Chron. Rech. Min. 1979, 450, 35–42. [Google Scholar]
- Kelly, W.C.; Reye, R.O. Geologic, fluid inclusion, and stable isotope studies of the tin-tungsten deposits of Panasqueira, Portugal. Econ. Geol. 1979, 74, 1721–1882. [Google Scholar] [CrossRef]
- Bussink, R.W. Geochemistry of the Panasqueira tungsten-tin deposit, Portugal. Geol. Ultraiect. 1984, 33, 1–159. [Google Scholar]
- Polya, D.A. Efficiency of hydrothermal ore formation and the Panasqueira W-Cu(Ag)-Sn vein deposit. Nature 1988, 333, 838–841. [Google Scholar] [CrossRef]
- Snee, L.W.; Sutter, F.; Kelly, W.C. Thermochronology of economic mineral deposits: Dating the stages of mineralization at Panasqueira, Portugal by high-precision 40Ar/39Ar age-spectrum techniques on muscovite. Econ. Geol. 1988, 83, 335–354. [Google Scholar] [CrossRef]
- Foxford, K.A.; Nicholson, R.; Polya, D.A. Textural evolution of W-Cu-Sn-bearing hydrothermal veins at Minas da Panasqueira, Portugal. Mineral. Mag. 1991, 55, 435–445. [Google Scholar] [CrossRef]
- Dallmeyer, R.D.; Martínez-Catalán, J.R.; Arenas, R.; Gil-Ibarguchi, J.I.; Gutiérrez-Alonso, G.; Farias, P.; Bastida, F. Diachronous Variscan tectonothermal activity in the NW Iberian Massif; evidence from 40Ar/39Ar dating of regional fabrics. Tectonophysics 1997, 277, 307–337. [Google Scholar] [CrossRef] [Green Version]
- Ribeiro, A.; Munhá, J.; Dias, R.; Mateus, A.; Pereira, E.; Ribeiro, M.L.; Fonseca, P.; Araújo, A.; Oliveira, J.T.; Romão, J.; et al. Geodynamic evolution of the SW Europe Variscides. Tectonics 2007, 26. [Google Scholar] [CrossRef]
- Albuquerque, C.R. Petrochemistry of a series of granitic rocks from northern Portugal. Geol. Soc. Am. Bull. 1971, 82, 2783–2798. [Google Scholar] [CrossRef]
- Capdevila, R.L.G.; Corretgé, L.G.; Floor, P. Les granitoïdes varisques de la Meseta Ibérique. Bull. Soc. Geol. Fr. 1973, 15, 209–228. [Google Scholar] [CrossRef]
- Neiva, A.M.R. The geochemistry of biotites from granites of northern Portugal with special reference to their tin content. Mineral. Mag. 1976, 40, 453–466. [Google Scholar] [CrossRef] [Green Version]
- Neiva, A.M.R. Geochemistry of hybrid granitoid rocks and their biotites from the central northern Portugal and their petrogenesis. Lithos 1981, 14, 149–163. [Google Scholar] [CrossRef]
- Pinto, M.S. Carboniferous granitoids of Portugal: Some geochemical and geochronological aspects. Anais Fac. Ciênc. Porto 1985, 64, 15–33. [Google Scholar]
- Neiva, A.M.R. Geochemistry of tin-bearing granitic rocks. Chem. Geol. 1984, 43, 241–256. [Google Scholar] [CrossRef]
- Neiva, A.M.R.; Neiva, J.M.C.; Parry, S.J. Geochemistry of the granitic rocks and their minerals from Serra da Estrela, central Portugal. Geochim. Cosmochim. Acta 1987, 51, 439–454. [Google Scholar] [CrossRef]
- Pinto, M.S.; Casquet, C.; Ibarrola, E.; Corretgé, L.S.; Ferreira, M.P. Síntese geocronológica dos granitóides do Maciço Hespérico. In Geologia de los Granitoides y Rocas Associadas del Macizo Hespérico Libro Homenaje a L. C. Garcia de Figuerola; Bea, F., Carnicero, E., Gonzalo, J.C., López Plaza, M., Rodríguez, M.D., Eds.; Rueda: Madrid, Spain, 1987; pp. 69–86. [Google Scholar]
- Bea, F.; Pereira, M.D.; Corretgé, L.G.; Fershtater, G.B. Differentiation of strongly peraluminous, perphosphorus granites: The Pedrobernardo pluton, central Spain. Geochim. Cosmochim. Acta 1994, 58, 2609–2627. [Google Scholar] [CrossRef]
- Neiva, A.M.R. Geochemistry of high peraluminous granites and their minerals between Douro and Tamega valleys, northern Portugal. Chem. Erde 1998, 58, 161–168. [Google Scholar]
- Michaud, J.A.S.; Gumiaux, C.; Pichavant, M.; Gloaguen, E.; Marcoux, E. From magmatic to hydrothermal Sn-Li-(Nb-Ta-W) mineralization: The Argemela area (central Portugal). Ore Geol. Rev. 2020, 116, 103215. [Google Scholar] [CrossRef]
- Valverde-Vaquero, P.; Díez Balda, M.A.; DíezMontes, A.; Dörr, W.; Escuder Viruete, J.; González Clavijo, E.; Maluski, H.; Rodríguez Fernández, L.R.; Rubio, F.; Villar, P. The “Hot Orogen”: Two Separate Variscan Low-Pressure Metamorphic Events in the Central Iberian Zone. In Mechanics of Variscan Orogeny: A Modern View on Orogenic Research, Géologie de La France; Faure, M., Lardeaux, J.M., Ledru, P., Peschler, A., Schulmann, K., Eds.; Societé Géologique de France and Bureau de Recherche Géologiques et Minières: Orléans, France, 2007; p. 168. [Google Scholar]
- Díez Montes, A.; Martínez Catalán, J.R.; Bellido Mulas, F. Role of the Ollo de Sapo massive felsic volcanism of NW Iberia in the Early Ordovician dynamics of northern Gondwana. Gondwana Res. 2010, 17, 363–376. [Google Scholar] [CrossRef]
- Gutiérrez-Alonso, G.; Collins, A.S.; Fernández-Suárez, J.; Pastor-Galán, D.; González-Clavijo, E.; Jourdan, F.; Weil, A.B.; Johnston, S.T. Dating of lithospheric buckling: 40Ar/39Ar ages of syn-orocline strike–slip shear zones in northwestern Iberia. Tectonophysics 2015, 643, 44–54. [Google Scholar] [CrossRef]
- Albuquerque, C.R. Rare earth elements in “younger granites”, northern Portugal. Lithos 1978, 11, 219–229. [Google Scholar] [CrossRef]
- Dias, G.T. Mineralogia e Petrologia de Granitos Hercínicos Associados a Mineralizações Filonianas de Sn-W (Minho, Portugal). Ph.D. Thesis, Universidade do Minho, Braga, Portugal, 1987; p. 304. [Google Scholar]
- Garcia, D. Behaviour of Fe, Mn and Mg during the differentiation of granites and W-Sn bearing hydrothermal activity in the Vila Real area (Northern Portugal). Bull. Minéral. 1987, 110, 613–622. [Google Scholar] [CrossRef]
- Dias, G.T.; Leterrier, J.; Mendes, A.; Simões, P.P.; Bertrand, J.M. U-Pb zircon and monazite geochronology of post-collisional Hercynian granitoids from the Central Iberian Zone (Northern Portugal). Lithos 1998, 45, 349–369. [Google Scholar] [CrossRef] [Green Version]
- Neiva, A.M.R.; Gomes, M.E.P. Diferentes tipos de granitos e seus processos petrogenéticos: Granitos hercínicos portugueses. In Geoquímica e Petrogénese de Rochas Granitóides; Neiva, A.M.R., Ed.; Mem. Acad. Ciênc.; Academia das Ciências de Lisboa: Lisboa, Portugal, 2001; pp. 53–96. [Google Scholar]
- Clauer, N. The post-Variscan tectonic-thermal activity in the southeastern metalliferous province of the French Massif Central revisited with K-Ar ages of illite. Ore Geol. Rev. 2020, 117, 103300. [Google Scholar] [CrossRef]
- Neiva, J.M.C. Jazigos portugueses de cassiterite e volframite. Commun. Serv. Geol. Port. 1944, XXV, 1–251. [Google Scholar]
- Thadeu, D. Les gisements stanno-wolframitiques du Portugal. Ann. Soc. Geól. Bel. 1973, 79, 5–30. [Google Scholar]
- Schermerhorn, L.J.G. Framework and evolution of hercynian mineralization in the Iberian Meseta. Leiden Geologische Mededelingen 1981, 52, 23–56. [Google Scholar]
- Derré, C.; Lécolle, M.; Noronha, F.; Roger, G. Minéralisations a Sn-W liées aux granitoides du nord du Portugal: Importance des processus magmatiques et métasomatiques hydrothermaux. Comun. Serv. Geol. Port. 1982, 68, 191–211. [Google Scholar]
- Neiva, A.M.R. On geochemistry and thermodynamic conditions of aplites, pegmatites and hydrothermal quartz veins with cassiterite and wolframite. Commun. Serv. Geol. Port. 1982, 68, 37–46. [Google Scholar]
- Noronha, F. Rochas graníticas do triângulo Gerês-Barroso-Cabreira. Suas relações com mineralizações em Sn e W-Mo. Pub. Mus. Lab. Min. Geol. Fac. Ciên. Univ. Porto 1982, 93, 1–39. [Google Scholar]
- Noronha, F. Estudo Metalogénico da Área Tunstífera da Borralha. Ph.D. Thesis, University Porto, Porto, Portugal, 1983; p. 413. [Google Scholar]
- Noronha, F. Caractéristiques physico-chimiques des fluides associés à la genèse du gisement de tungstène de Borralha (Nord du Portugal). Bull. Mineral. 1984, 107, 273–284. [Google Scholar] [CrossRef]
- Goínhas, J.; Viegas, L. Província metalogenética estanífera e tungsténica ibérica: Considerações sobre as ocorrências de tungsténio em Portugal, sua prospecção e potencialidades. Estudos, Notas e Trabalhos do Serviço de Fomento Mineiro 1984, XXV, 147–178. [Google Scholar]
- Derré, C.; Roger, G. Filons à étain—Tungstène dans la mointié nord du Portugal. Guides de recherche. Chron. Rech. Min. 1984, 475, 35–50. [Google Scholar]
- Derré, C.; Lécolle, M.; Roger, G.; Carvalho, J. Tectonics, magmatism, hydrothermalism and sets of flat joints locally filled by Sn-W aplite-pegmatite and quartz veins; southeastern border of the Serra da Estrela granitic massif (Beira Baixa, Portugal). Ore Geol. Rev. 1986, 1, 43–56. [Google Scholar] [CrossRef]
- Derré, C.; Lécolle, R.; Maurel-Palacin, D.; Noronha, F.; Roger, G. Évolution granitique et minéralisations filoniennes à Sn-W dans le Nord du Portugal. Chron. Rech. Min. 1987, 487, 63–74. [Google Scholar]
- Adam, D.; Gagny, C. Contrôle structural et magmatique de la formation de gisements d’étain-tungstène du Trás-os-Montes oriental (Portugal). Guides pour l’exploration minière. Chron. Rech. Min. 1989, 496, 57–74. [Google Scholar]
- Noronha, F.; Vindel, E.; López, J.A.; Dória, A.; Garcia, E.; Boiron, M.-C.; Cathelineau, M. Fluids related to tungsten ore deposits in Northern Portugal and Spanish Central System: A comparative study. Rev. Soc. Geol. España 1999, 12, 397–403. [Google Scholar]
- Tornos, F.; Delgado, A.; Casquet, C.; Galindo, C. 300 Million years of episodic hydrothermal activity: Stable isotope evidence from hydrothermal rocks of the eastern Iberian Central System. Miner. Deposita 2000, 35, 551–569. [Google Scholar] [CrossRef] [Green Version]
- Ruiz, C.; Fernández-Leyva, C.; Locutura, J. Geochemistry, geochronology and mineralisation potential of the granites in the Central Iberian Zone: The Jálama Batholith. Geochemistry 2008, 68, 413–429. [Google Scholar] [CrossRef] [Green Version]
- Arthaud, F.; Matte, P. Les décrochements Tardi-Hercyniens du Sud-ouest de l’Europe. Géometrie et essai de reconstitution des conditions de la déformation. Tectonophysics 1975, 25, 139–171. [Google Scholar] [CrossRef]
- Arthaud, F.; Matte, P. Late Paleozoic strike-slip faulting in Southern Europe and Northern Africa; result of a right lateral shear zone between the Appalachians and the Urals. Geol. Soc. Am. Bull. 1977, 88, 1305–1320. [Google Scholar] [CrossRef]
- Iglésias, M.; Choukroune, P. Shear zones in the Iberian Arc. J. Struct. Geol. 1980, 2, 63–68. [Google Scholar]
- Iglesias, M.; Ribeiro, A. Zones de cisaillement dans l’arc ibero-armoricain. Commun. Serv. Geol. Port. 1981, 67, 85–87. [Google Scholar]
- Pereira, E.; Ribeiro, A.; Meireles, C. Cisalhamentos hercínicos e controlo de mineralizações de Sn-W, Au e U na zona centro-Ibérica em Portugal. Cuad. Lab. Xeol. Laxe Coruña 1993, 18, 89–119. [Google Scholar]
- Mateus, A.; Noronha, F. Late-Variscan crustal uplift of the Iberian Terrane as a response to isostatic rebound; implications for the brittle-ductile transition, fluid circulation and metallogenesis. Mem. Mus. Lab. Mineral. Geol. Univ. Porto 2001, 7, 295–298. [Google Scholar]
- Marques, F.O.; Mateus, A.; Tassinari, C.C. The Late-Variscan fault network in central-northern Portugal (NW Iberia): A re-evaluation. Tectonophysics 2002, 359, 255–270. [Google Scholar] [CrossRef]
- Inverno, C.; Ribeiro, M.L. Fracturação e cortejo filoniano nas Minas da Argemela (Fundão). Commun. Serv. Geol. Port. 1980, 66, 185–193. [Google Scholar]
- Ribeiro, A.; Pereira, E. Controles paleogeográficos, petrológicos e estruturais na génese dos jazigos portugueses de estanho e volfrâmio. Geonovas 1982, 1, 23–31. [Google Scholar]
- Gaspar, L.M.; Inverno, C.M.C. Mineralogy and metasomatic evolution of distal strata-bound scheelite skarns in the Riba de Alva Mine, north-eastern Portugal. Econ. Geol. 2000, 95, 1259–1275. [Google Scholar]
- Noronha, F.; Cathelineau, M.; Boiron, M.-C.; Banks, D.A.; Dória, A.; Ribeiro, M.A.; Nogueira, P.; Guedes, A. A three stage fluid model for Variscan gold metallogenesis in northern Portugal. J. Geochem. Explor. 2000, 71, 209–224. [Google Scholar] [CrossRef]
- Mateus, A.; Noronha, F. Sistemas mineralizantes epigenéticos na Zona Centro-Ibérica; expressão da estruturação orogénica Meso-a Tardi-Varisca. In Ciências Geológicas: Ensino e Investigação e sua História; Cotelo Neiva, J.M., Ribeiro, A., Mendes Victor, L., Noronha, F., Ramalho, M., Eds.; Associação Portuguesa de Geólogos and Sociedade Geológica de Portugal, Lisboa: Lisbon, Portugal, 2010; Volume II, pp. 47–61. [Google Scholar]
- Lourenço, A. Paleofluidos e Mineralizações Associadas às Fases Tardias da Orogenia Hercínica. Ph.D. Thesis, Universidade do Porto, Porto, Portugal, 2002; p. 326. [Google Scholar]
- Póvoa, P. Magnetotelúrica Aplicada à Prospecção Mineira. Master’s Thesis, Faculdade de Ciências da Universidade de Lisboa, Lisboa, Portugal, 2011; p. 123. [Google Scholar]
- Gonçalves, M.; Mateus, A.; Pinto, F.; Vieira, R. Using multifractal modelling, singularity mapping, and geochemical indexes for targeting buried mineralization: Application to the W-Sn Panasqueira ore-system, Portugal. J. Geochem. Explor. 2018, 189, 42–53. [Google Scholar] [CrossRef]
- Marignac, C. Analyse estructurale de l’environment du gisement à tungsten-étain de Panasqueira (Beira Baixa, Portugal); Implications génétiques. C. R. Acad. Sci. Paris Ser. 1973, D277, 269–272. [Google Scholar]
- Foxford, K.A.; Nicholson, R.; Polya, D.A.; Hebbethwalte, R.P.B. Extensional failure and hydraulic valving at Minas da Panasqueira; evidence from vein spatial distributions, displacements and geometries. J. Struct. Geol. 2000, 22, 1065–1086. [Google Scholar] [CrossRef]
- Jacques, D.; Vieira, R.; Muchez, P.; Sintubin, M. A structural analysis of the Minas da Panasqueira vein network and related fracture generations. In Geophysical Research Abstracts; EGU2014-3537; EGU General Assembly: Lund, Sweden, 2014; Volume 16. [Google Scholar]
- Jacques, D.; Vieira, R.; Muchez, P.; Sintubin, M.A. Late- to post-orogenic, granite-related fracture reactivation and veining at the Minas da Panasqueira W-Sn-Cu ore deposit (Portugal). Geotecton. Res. 2015, 97, 53–55. [Google Scholar] [CrossRef]
- Jacques, L.; Pascal, C. Full paleostress tensor reconstruction using quartz veins of Panasqueira Mine, central Portugal; Part I: Paleopressure determination. J. Struct. Geol. 2017, 102, 58–74. [Google Scholar] [CrossRef]
- Jacques, D.; Vieira, R.; Muchez, P.; Sintubin, M.A. Transpressional folding and associated cross-fold jointing controlling the geometry of post-orogenic vein-type W-Sn mineralization: Examples from Minas da Panasqueira, Portugal. Miner. Deposita 2018, 53, 171–194. [Google Scholar] [CrossRef]
- Polya, D.A.J. Compositional variation in wolframites from the Barroca Grande mine, Portugal: Evidence for fault-controlled ore formation. Mineral. Mag 1988, 52, 497–503. [Google Scholar] [CrossRef]
- Lourenço, A.; Noronha, F. Actividade hidrotermal pós-Varisca. Exemplo da mineralização de chumbo em falhas do jazigo da Panasqueira. Cuad. Lab. Xeol. Laxe 2000, 25, 293–295. [Google Scholar]
- Pinto, F. Estudo da distribuição do Estanho na Mina da Panasqueira. Master’s Thesis, Faculdade de Ciências da Universidade do Porto, Porto, Portugal, 2014; p. 208. [Google Scholar]
- Pinto, F.; Vieira, R.; Noronha, F. Different cassiterite generations at the Panasqueira Deposit (Portugal): Implications for the metal zonation model. In Mineral Resources in a Sustainable World; André-Mayer, A.S., Cathelineau, M., Muchez, P., Pirard, E., Sindern, S., Eds.; Proceedings of the Society of Geology Applied to Mineral Deposits (SGA) Biennal Meeting; SGA: Nancy, France, 2015; Volume 2, pp. 827–830. [Google Scholar]
- Martins, I. Microanálise Elementar de Sulfuretos, Sulfossais e Carbonatos Constituintes das Associações Polifásicas que Preenchem os Sistemas Filonianos de W(-Sn) Suporte da Mina da Panasqueira (Portugal): Reconhecimento de Marcadores Metalogenéticos. Master’s Thesis, Faculdade de Ciências da Universidade de Lisboa, Lisboa, Portugal, 2017; 146p. [Google Scholar]
- Oosterm, M.G.; Bussink, R.W.; Vriend, S.P. Lithogeochemical studies of aureoles around the Panasqueira tin-tungsten deposit, Portugal. Miner. Deposita 1984, 19, 283–288. [Google Scholar] [CrossRef]
- Codeço, M.; Weis, P.; Trumbull, R.; Pinto, F.; Lecumberri-Sanchez, P.; Wilke, F. Chemical and boron isotopic composition of hydrothermal tourmaline from the Panasqueira W-Sn-Cu deposit, Portugal. Chem. Geol. 2017, 468, 1–16. [Google Scholar] [CrossRef]
- Clark, A.H. Preliminary of the temperatures and confining pressures of granite emplacement and mineralization, Panasqueira, Portugal. Trans. Inst. Min. Metall. 1964, 73, 813–824. [Google Scholar]
- Codeço, M.; Weis, P.; Trumbull, R.; Glodny, J.; Wiedenbeck, M.; Romer, R. Boron isotope muscovite-tourmaline geothermometry indicates fluid cooling during magmatic-hydrothermal W-Sn ore formation. Econ. Geol. 2019, 114, 153–163. [Google Scholar] [CrossRef]
- Launaya, G.; Sizaret, S.; Guillou-Frottiera, L.; Gloaguena, E.; Melletona, J.; Champallierb, R.; Pichavant, M. Hydrodynamic of ore deposits related to granitic intrusion: Application to the Panasqueira Sn-W-(Cu) deposit (Portugal). In International Workshop on “Recent Advances in W-Sn and Rare Metal Deposit Metallogenesis”; GeoRessources, University Lorraine: Nancy, France, 2016; Volume Abstract. [Google Scholar]
- Launaya, G.; Sizaret, S.; Guillou-Frottiera, L.; Gloaguena, E.; Pinto, F. Deciphering fluid flow at the magmatic-hydrothermal transition: A case study from the world-class Panasqueira W–Sn–(Cu) ore deposit (Portugal). Earth Planet. Sci. Lett. 2018, 499, 1–12. [Google Scholar] [CrossRef] [Green Version]
- Codeço, M. Constraining the Hydrology at Minas da Panasqueira W-Sn-Cu Deposit, Portugal. Ph.D. Thesis, Faculty of Science of the University of Potsdam, Potsdam, Germany, 2019; p. 232. [Google Scholar]
- D’Orey, F.C. Tungsten-tin mineralization and paragenesis in the Panasqueira and Vale de Ermida mining districts, Portugal. Commun. Serv. Geol. Port. 1967, 52, 117–167. [Google Scholar]
- Wimmers, D. Silver minerals of Panasqueira, Portugal: A new occurrence of Te-bearing canfieldite. Mineral. Mag. 1985, 49, 745–748. [Google Scholar] [CrossRef]
- Carocci, E.; Marignac, C.; Cathelineau, M.; Pinto, F. Tourmaline and W-rutile assemblage as an immediate precursor of wolframite deposition in Panasqueira mine. In International Workshop on “Recent Advances in W-Sn and Rare Metal Deposit Metallogenesis”; GeoRessources, University Lorraine: Nancy, France, 2016; Volume Abstract. [Google Scholar]
- Carocci, E.; Marignac, C.; Cathelineau, M.; Truche, L.; Lecomte, A.; Pinto, F. Rutile from Panasqueira (Central Portugal): An excellent pathfinder for wolframite deposition. Minerals 2019, 9, 9. [Google Scholar] [CrossRef] [Green Version]
- Kelly, W.C. The relative timing of metamorphism, granite emplacement and hydrothermal ore deposition in the Panasqueira district (Beira Baixa, Portugal). Commun. Serv. Geol. Port. 1977, 61, 239–244. [Google Scholar]
- Carocci, E.; Marignac, C.; Cathelineau, M.; Pinto, F.; Truche, L. Le stade initial du dépôt de la wolframite dans le gisement à W-Sn-Cu de Panasqueira (Portugal): Caractérisation indirecte des fluides par l’étude des tourmalines précoces. In Proceedings of the 24th Réunion des Sciences de la Terre, Lille, France, 22–26 October 2018; p. 439. [Google Scholar]
- Zhang, R.; Ramos, V.; Noronha, F.; Pinto, F. U-Pb geochronology of cassiterites from primary Sn mineralizations in Sn-W Variscan Metallogenic Province, Portugal. In Advances in Understanding Hydrothermal Processes, Life with Ore Deposits on Earth—15th SGA Biennial Meeting; SGA: Glasgow, Scotland, 2019; Volume 1, pp. 357–360. [Google Scholar]
- Turpin, L.; Ramboz, C.; Sheppard, S. Chemical and isotopic evolution of the fluids in the Sn-W deposit, Panasqueira, Portugal. Terra Cogn. Spec. Issue 1981, 42. [Google Scholar]
- Marignac, C. Geologic, fluid inclusions and stable isotope studies of the Panasqueira tungsten-tin deposit, Portugal—A discussion. Econ. Geol. 1982, 77, 1263–1266. [Google Scholar] [CrossRef]
- Bussink, R.W.; Kreulen, R.; Jong, F.M. Gas analyses, fluid inclusions and stable isotopes of Panasqueira, W-Sn deposit, Portugal. Bull. Minéral. 1984, 107, 703–713. [Google Scholar] [CrossRef]
- Polya, D.A.J. Chemical Behaviour of Tungsten in Hydrothermal Fluids and Genesis of the Panasqueira W-Cu-Sn Deposit, Portugal. An Experimental, Theoretical and Field Study. Ph.D. Thesis, University of Manchester, Manchester, UK, 1987; p. 243. [Google Scholar]
- Campbell, A.; Robinson-Cook, S.; Amindyas, C. Observation of fluid inclusions in wolframite from Panasqueira, Portugal. Bull. Minéral. 1988, 111, 331–342. [Google Scholar] [CrossRef]
- Polya, D.A.J. Chemistry of the main-stage ore-forming fluids of the Panasqueira W-Cu(Ag)-Sn deposit, Portugal: Implications for models of ore genesis. Econ. Geol. 1989, 84, 1134–1152. [Google Scholar] [CrossRef]
- Polya, D.A.J. Pressure-dependence of wolframite solubility for hydrothermal vein formation. Trans. Inst. Min. Metallurg. 1990, 99, 120–124. [Google Scholar]
- Noronha, F.; Dória, A.; Dubessy, J.; Charoy, B. Characterization and timing of the different types of fluids present in the barren and ore-veins of the W-Sn deposit of Panasqueira, Central Portugal. Miner. Deposita 1992, 27, 72–79. [Google Scholar] [CrossRef]
- Lüders, V. Contribution of infrared microscopy to fluid inclusion studies in some opaque minerals (wolframite, stibnite, bournonite): Metallogenic implications. Econ. Geol. 1996, 91, 1462–1468. [Google Scholar] [CrossRef]
- Polya, D.; Foxford, K.; Stuart, F.; Boyce, A.; Fallick, A. Evolution and paragenetic context of low D hydrothermal fluids from Panasqueira W-Sn deposit, Portugal: New evidence fom microthermometric, stable isotope, noble gas and halogen analyses of primary fluid inclusions. Geochim. Cosmochim. Acta 2000, 64, 3357–3371. [Google Scholar] [CrossRef]
- Burnard, P.G.; Polya, D.A. Importance of mantle derived fluids during granite associated hydrothermal circulation: He and Ar isotopes of ore minerals from Panasqueira. Geochim. Cosmochim. Acta 2004, 68, 1607–1615. [Google Scholar] [CrossRef]
- Lecumberri-Sanchez, P.; Vieira, R.; Heinrich, C.; Pinto, F.; Wälle, M. Fluid-rock interaction is decisive for the formation of tungsten deposits. Geology 2017, 45, 579–582. [Google Scholar] [CrossRef]
- Droop, G.A. general equation for estimating Fe3+ concentrations in ferromagnesian silicates and oxides from microprobe analyses, using stoichiometric criteria. Mineral. Mag. 1987, 51, 431–435. [Google Scholar] [CrossRef] [Green Version]
- Ketcham, R.A. Technical Note: Calculation of stoichiometry from EMP data for apatite and other phases with mixing on monovalent anion sites. Am. Mineral. 2015, 100, 1620–1623. [Google Scholar] [CrossRef]
- Lourenço, A. The Panasqueira granite (Barroca Grande cupola). Study of a granite system associated with tin lodes. VII Congr. Nac. Geol. 2006, 187–190. [Google Scholar]
- Henry, D.J.; Guidotti, C.V. Tourmaline as a petrogenetic indicator mineral: An example from the staurolite-grade metapelites of NW Maine. Am. Mineral. 1985, 70, 1–15. [Google Scholar]
- Monier, G.; Robert, J.L. Evolution of the miscibility gap between muscovite and biotite solid solutions with increasing lithium content: An experimental study in the system K2O-Li2O-MgO-FeO-Al2O3-SiO2-H2O-HF at 600 °C, 2 kbar PH2O: Comparison with natural lithium micas. Mineral. Mag. 1986, 50, 641–651. [Google Scholar] [CrossRef]
- Hawthorne, F.C.; Henry, D.J. Classification of the minerals of the tourmaline group. Eur. J. Mineral. 1999, 11, 201–215. [Google Scholar] [CrossRef]
- Henry, D.J.; Dutrow, B.L. Ca substitution in Li-poor aluminous tourmaline. Can. Mineral. 1990, 28, 111–124. [Google Scholar]
- Henry, D.J.; Novák, M.; Hawthorne, F.C.; Ertl, A.; Dutrow, B.L.; Uher, P.; Pezzotta, F. Nomenclature of the tourmaline-supergroup minerals. Am. Mineral. 2011, 96, 895–913. [Google Scholar] [CrossRef]
- Bailey, S.W. Classification and structures of micas. In Micas; Bailey, S.W., Ed.; Mineralogical Society of America: Washington, DC, USA, 1984; Volume 13, pp. 1–12. [Google Scholar]
- Neiva, A.M.R. Geochemistry of white micas from Portuguese tin and tungsten deposits. Chem. Geol. 1987, 63, 299–317. [Google Scholar] [CrossRef]
- Tischendorf, G.; Gottesmann, B.; Foerster, H.J.; Trumbull, R.B. On Li-bearing micas: Estimating Li from electron microprobe analyses and an improved diagram for graphical representation. Mineral. Mag. 1997, 61, 809–834. [Google Scholar] [CrossRef]
- Tischendorf, G.; Foerster, H.J.; Gottesmann, B. The correlation between lithium and magnesium in trioctahedral micas: Improved equations for Li2O estimation from MgO data. Mineral. Mag. 1999, 63, 57–74. [Google Scholar] [CrossRef]
- Yin, R.; Han, L.; Huang, X.-L.; Li, J.; Li, W.-X.; Chen, L.-L. Textural and chemical variations of micas as indicators for tungsten mineralization: Evidence from highly evolved granites in the Dahutang tungsten deposit, South China. Am. Mineral. 2019, 104, 949–965. [Google Scholar] [CrossRef]
- Gatta, G.D.; Nestola, F.; Bromiley, G.D.; Loose, A. New insight into crystal chemistry of topaz: A multi-methodological study. Am. Mineral. 2006, 91, 1839–1846. [Google Scholar] [CrossRef]
- Foster, M.D. Interpretation of the composition and a classification of the chlorites. USGS Prof. Paper 1962, 414, 33. [Google Scholar]
- Bailey, S.W. Chlorites: Structures and crystal chemistry. In Hydrous Phyllosilicates (Exclusive of Micas); Bailey, S.W., Ed.; Mineralogical Society of America: Washington, DC, USA, 1988; Volume 19, pp. 347–403. [Google Scholar]
- Wiewiora, A.; Weiss, Z. Crystallochemical classifications of phyllosilicates based on the unified system of projection of chemical composition: II The chlorite group. Clay Miner. 1990, 25, 83–92. [Google Scholar] [CrossRef]
- Hillier, S.; Velde, B. Octahedral occupancy and the chemical-composition of diagenetic (low-temperature) chlorites. Clay Miner. 1991, 26, 149–168. [Google Scholar] [CrossRef]
- Vidal, O.; Parra, T.; Vieillard, P. Thermodynamic properties of the Tschermak solid solution in Fe-chlorite: Application to natural examples and possible role of oxidation. Am. Mineral. 2005, 90, 347–358. [Google Scholar] [CrossRef]
- Clark, J.R.; Williams-Jones, A.E. Rutile as a potential indicator mineral for metamorphosed metallic ore minerals. Deposits. In Rapport Final de DIVEX, Sous-Projet SC2; Divex: Montréal, QC, Canada, 2004; 17p. [Google Scholar]
- Meinhold, G. Rutile and its applications in earth sciences. Earth Sci. Rev. 2010, 102, 1–28. [Google Scholar] [CrossRef]
- Möller, P.; Dulski, P.; Szacki, W.; Malow, G.; Riedel, E. Substitution of tin in cassiterite by tantalum, niobium, tungsten, iron and manganese. Geochim. Cosmoch. Acta 1988, 52, 1497–1503. [Google Scholar] [CrossRef]
- Neiva, A.M.R. Geochemistry of cassiterite and its inclusions and exsolution products from tin and tungsten deposits in Portugal. Can. Mineral. 1996, 34, 745–768. [Google Scholar]
- Neiva, A.M.R. Geochemistry of cassiterite and wolframite from tin and tungsten quartz veins in Portugal. Ore Geol. Rev. 2008, 33, 221–238. [Google Scholar] [CrossRef] [Green Version]
- Lerouge, C.; Gloaguen, E.; Wille, G.; Bailly, L. Distribution of In and other rare metals in cassiterite and associated minerals in Sn-W ore deposits of the western Variscan Belt. Eur. J. Mineral. 2017, 29, 739–753. [Google Scholar] [CrossRef] [Green Version]
- Goldmann, S.; Melcher, F.; Gäbler, H.-E.; Dewaele, S.; De Clercq, F.; Muchez, P. Mineralogy and trace element chemistry of ferberite/reinite from tungsten deposits in central Rwanda. Minerals 2013, 3, 121–144. [Google Scholar] [CrossRef] [Green Version]
- Bowles, J.F. Age dating of individual grains of uraninite in rocks from electron microprobe analyses. Chem. Geol. 1990, 83, 47–53. [Google Scholar] [CrossRef]
- Bowles, J.F. Age dating from electron microprobe analyses of U, Th, and Pb: Geological advantages and analytical difficulties. Microsc. Microanal. 2015, 21, 1114–1122. [Google Scholar] [CrossRef]
- Baikie, T.; Ng, G.M.H.; Madhavi, S.; Pramana, S.S.; Blake, K.; Elcombe, M.; White, T.J. The crystal chemistry of the alkaline-earth apatites A10(PO4)6CuxOy(H)z (A = Ca, Sr and Ba). Dalton Trans. 2009, 6722–6726. [Google Scholar] [CrossRef] [PubMed]
- Mao, M.; Rukhlov, A.S.; Rowins, S.M.; Spence, J.; Coogan, L.A. Apatite Trace Element compositions: A Robust New Tool for Mineral Exploration. Econ. Geol. 2016, 111, 1187–1222. [Google Scholar] [CrossRef]
- Harlov, D.E. Apatite: A fingerprint for metasomatic processes. Elements 2015, 11, 171–176. [Google Scholar] [CrossRef]
- Bruand, E.; Fowler, M.; Storey, C.; Darling, J. Apatite trace element and isotope applications to petrogenesis and provenance. Am. Mineral. 2017, 102, 75–84. [Google Scholar] [CrossRef]
- Antonakos, A.; Liarokapis, L.; Kyriacou, A.; Leventouri, T. Raman and IR studies of the effect of Fe substitution in hydroxyapatites and deuterated hydroxyapatite. Am. Mineral. 2017, 102, 85–91. [Google Scholar] [CrossRef]
- Cox, S.J. Coupling between deformation, fluid pressures, and fluid flow in ore-producing hydrothermal systems at depth in the crust. In Economic Geology; Hedenquist, J.W., Thompson, J.F.H., Goldfarb, R.J., Richards, J.R., Eds.; Society of Economic Geologists, Inc.: Littleton, CO, USA, 2005; Volume 100th Anniversary, pp. 39–75. [Google Scholar]
- London, D.; Morgan, G.B.; Wolf, M.B. Boron in granitic rocks and their contact aureoles. In Boron, Mineralogy, Petrology and Geochemistry in the Earth’s Crust; Grew, E., Anovitz, L., Eds.; Mineralogical Society of America: Washington, DC, USA, 1996; Volume 33, pp. 299–330. [Google Scholar]
- Heinrich, C.A. The chemistry of hydrothermal tin(-tungsten) ore deposition. Econ. Geol. 1990, 85, 457–481. [Google Scholar] [CrossRef]
- Linnen, R.L.; Cuney, M. Granite-related rare-element deposits and experimental constraints on Ta-Nb-W-Sn-Zr-Hf mineralization. In Rare Element Geochemistry and Mineral Deposits; Linnen, R.L., Samson, I.M., Eds.; Geological Association of Canada Short Course Notes; Geological Association of Canada: St. John’s, NL, Canada, 2005; Volume 17, pp. 45–68. [Google Scholar]
- Teiber, H.; Marks, M.A.W.; Wenzel, T.; Siebel, W.; Altherr, R.; Markl, G. The distribution of halogens (F, Cl, Br) in granitoid rocks. Chem. Geol. 2014, 374, 92–109. [Google Scholar] [CrossRef]
- Zack, T.; Moraes, R.; Kronz, A. Temperature dependence of Zr in rutile: Empirical calibration of a rutile thermometer. Contrib. Mineral. Petrol. 2004, 148, 471–488. [Google Scholar] [CrossRef]
- Watson, E.B.; Wark, D.A.; Thomas, J.B. Crystallization thermometers for zircon and rutile. Contrib. Mineral. Petrol. 2006, 151, 413–433. [Google Scholar] [CrossRef]
- Ferry, J.M.; Watson, E.B. New thermodynamic models and revised calibrations for the Ti-in-zircon and Zr-in-rutile thermometers. Contrib. Mineral. Petrol. 2007, 154, 429–437. [Google Scholar] [CrossRef]
- Van Hinsberg, V.J.; Schumacher, J.C. Intersector element partitioning in tourmaline: A potentially powerful single crystal thermometer. Contrib. Mineral. Petrol. 2007, 153, 289–301. [Google Scholar] [CrossRef]
- Barton, M.D. The thermodynamic properties of topaz solid solutions and some petrologic applications. Am. Mineral. 1982, 67, 956–974. [Google Scholar]
- Halter, W.E.; Williams-Jones, A. Application of topaz-muscovite F-OH exchange as a geothermometer. Econ. Geol. 1999, 94, 1249–1258. [Google Scholar] [CrossRef]
- Walshe, J.L. A six-component chlorite solid solution model and the conditions of chlorite formation in hydrothermal and geothermal systems. Econ. Geol. 1986, 81, 681–703. [Google Scholar] [CrossRef]
- Cathelineau, M. Cation site occupancy in chlorites and illites as a function of temperature. Clay Miner. 1988, 23, 471–485. [Google Scholar] [CrossRef]
- De Caritat, P.; Hutcheon, I.; Walshe, J.L. Chlorite geothermometry: A review. Clays Clay Miner. 1993, 41, 219–239. [Google Scholar] [CrossRef]
- Vidal, O.; Parra, T.; Trotet, F. A thermodynamic model for Fe-Mg aluminous chlorite using data from phase equilibrium experiments and natural pelitic assemblages in the 100 to 600 °C, 1 to 25 kb range. Am. J. Sci. 2001, 301, 557–592. [Google Scholar] [CrossRef] [Green Version]
- Inoue, A.; Meunier, A.; Patrier-Mas, P.; Rigault, C.; Beaufort, D.; Vieillard, P. Application of chemical geothermometry to low-temperature trioctahedral chlorites. Clays Clay Miner. 2009, 57, 371–382. [Google Scholar] [CrossRef]
- Bourdelle, F.; Parra, T.; Chopin, C.; Beyssac, O. A new chlorite geothermometer for diagenetic to low-grade metamorphic conditions. Contrib. Mineral. Petrol. 2013, 165, 723–735. [Google Scholar] [CrossRef]
- Lanari, P.; Wagner, T.; Vidal, O. A thermodynamic model for di-trioctahedral chlorite from experimental and natural data in the system MgO–FeO–Al2O3–SiO2–H2O: Applications to P–T sections and geothermometry. Contrib. Mineral. Petrol. 2014, 167, 968. [Google Scholar] [CrossRef] [Green Version]
- Martins, I.; Mateus, A.; Figueiras, J.; Rodrigues, P.; Pinto, F. Thermal evolution of the W-Sn(-Cu) Panasqueira ore system (Portugal): Insights from pyrite-pyrrhotite and arsenopyrite geothermometers. Comunicações Geológicas 2020, in press. [Google Scholar]


| SiO2 | TiO2 | Al2O3 | Fe2O3 | ZnO | FeO | MnO | CaO | MgO | Na2O | Li2O | F | |
|---|---|---|---|---|---|---|---|---|---|---|---|---|
| Tour Ia | 36.28 | 0.34 | 31.75 | 4.69 | 0.10 | 6.82 | 0.06 | 0.08 | 3.88 | 2.11 | 0.69 | 0.59 |
| Tour Ib | 36.51 | 0.29 | 31.92 | 4.76 | 0.09 | 5.56 | 0.06 | 0.13 | 4.17 | 2.00 | 0.70 | 0.51 |
| Tour Ic | 36.75 | 0.20 | 32.30 | 4.69 | 0.09 | 4.98 | 0.06 | 0.13 | 3.88 | 1.78 | 0.81 | 0.33 |
| Tour II | 37.12 | 0.09 | 31.51 | 6.16 | 0.08 | 1.70 | 0.04 | 0.38 | 5.93 | 2.20 | 0.75 | 0.75 |
| SiO2 | SnO2 | TiO2 | Al2O3 | Fe2O3 | Cr2O3 | FeO | MnO | ||
| Ms Ia | Subgroup 1 (n = 607) | 46.36 | 0.07 | 0.11 | 29.73 | - | 0.05 | 3.63 | 0.06 |
| Subgroup 2 (n = 178) | 47.54 | - | 0.16 | 30.91 | 2.59 | 0.06 | 0.74 | 0.04 | |
| Subgroup 3 (n = 109) | 48.13 | 0.02 | 0.12 | 25.81 | - | 0.06 | 4.59 | 0.04 | |
| Subgroup 4 (n = 284) | 47.46 | 0.03 | 0.14 | 31.24 | - | 0.06 | 3.23 | 0.06 | |
| Subgroup 5 (n = 37) | 54.44 | - | 0.02 | 25.35 | - | 0.06 | 2.18 | 0.03 | |
| Ms Ib | Subgroup 1 (n = 360) | 48.44 | - | 0.08 | 30.32 | - | 0.06 | 3.59 | 0.06 |
| Subgroup 2 (n = 19) | 49.78 | - | 0.04 | 21.26 | - | 0.07 | 8.45 | 0.05 | |
| Subgroup 3 (n = 40) | 47.00 | - | 0.06 | 32.04 | - | 0.06 | 3.04 | 0.06 | |
| Ms Ic | 48.30 | 0.05 | 0.20 | 30.11 | - | 0.06 | 2.77 | 0.06 | |
| Ms II | Subgroup 1 (n = 135) | 48.84 | - | 0.10 | 29.31 | - | 0.06 | 3.08 | 0.05 |
| Subgroup 2 (n = 25) | 47.76 | - | 0.11 | 30.64 | - | 0.06 | 3.12 | 0.06 | |
| Ms III | 54.92 | - | - | 25.12 | - | 0.05 | 2.07 | 0.02 | |
| BaO | CaO | MgO | Cs2O | K2O | Na2O | Li2O | F | ||
| Ms Ia | Subgroup 1 (n = 607) | 0.05 | 0.02 | 1.00 | - | 10.62 | 0.24 | - | 1.61 |
| Subgroup 2 (n = 178) | 0.05 | 0.02 | 1.07 | - | 11.99 | 0.40 | - | 1.42 | |
| Subgroup 3 (n = 109) | 0.04 | 0.03 | 1.50 | - | 10.54 | 0.10 | 3.68 | 2.30 | |
| Subgroup 4 (n = 284) | 0.05 | 0.01 | 0.66 | - | 11.03 | 0.42 | 1.39 | 1.39 | |
| Subgroup 5 (n = 37) | 0.02 | 0.32 | 2.18 | - | 9.26 | 0.03 | - | 1.51 | |
| Ms Ib | Subgroup 1 (n = 360) | 0.04 | 0.02 | 0.88 | - | 10.70 | 0.27 | - | 1.57 |
| Subgroup 2 (n = 19) | 0.04 | 0.02 | - | 0.01 | 10.38 | 0.05 | 3.53 | 4.10 | |
| Subgroup 3 (n = 40) | 0.03 | 0.01 | 0.43 | - | 11.00 | 0.50 | 1.38 | 1.23 | |
| Ms Ic | 0.18 | 0.02 | 1.36 | - | 10.78 | 0.28 | - | - | |
| Ms II | Subgroup 1 (n = 135) | 0.03 | 0.02 | 1.56 | - | 10.77 | 0.23 | - | 1.89 |
| Subgroup 2 (n = 25) | 0.07 | 0.01 | 0.78 | - | 11.15 | 0.35 | 1.70 | 1.17 | |
| Ms III | 0.02 | 0.32 | 3.35 | - | 9.12 | 0.03 | - | 1.50 |
| Ta2O5 | Nb2O5 | SiO2 | Sm2O3 | Nd2O3 | Pr2O3 | Ce2O3 | La2O3 | Fe2O3 | Al2O3 | ZnO | F | |
|---|---|---|---|---|---|---|---|---|---|---|---|---|
| Tpz Ia | 0.01 | - | 32.27 | 0.01 | 0.02 | 0.04 | 0.02 | - | 0.04 | 54.95 | 0.02 | 13.42 |
| Tpz Ib | 0.02 | - | 32.30 | - | - | 0.04 | - | - | 0.02 | 54.88 | 0.02 | 13.42 |
| Tpz II | 0.04 | 0.02 | 32.23 | - | - | 0.04 | 0.02 | 0.01 | 0.02 | 54.86 | - | 13.49 |
| SiO2 | Cr2O3 | Al2O3 | ZnO | FeO | MnO | MgO | F | ||
|---|---|---|---|---|---|---|---|---|---|
| Chl I | Subgroup 1 (n = 95) | 23.32 | 0.07 | 20.89 | 0.03 | 42.95 | 0.11 | 1.23 | 0.13 |
| Subgroup 2 (n = 178) | 23.42 | 0.07 | 20.25 | 0.02 | 44.55 | 0.10 | 0.67 | 0.12 | |
| Chl II | Subgroup 1 (n = 95) | 25.08 | 0.06 | 22.26 | - | 36.17 | 0.05 | 4.58 | 0.08 |
| Subgroup 2 (n = 44) | 24.01 | 0.07 | 19.79 | - | 44.08 | 0.13 | 0.66 | 0.10 | |
| Chl III | Subgroup 1 (n = 182) | 25.21 | 0.07 | 20.97 | 0.03 | 42.95 | 0.15 | 2.60 | 0.06 |
| Subgroup 2 (n = 34) | 24.92 | 0.07 | 21.18 | 0.03 | 43.73 | 0.10 | 0.79 | 0.05 |
| WO3 | Ta2O5 | Nb2O5 | SnO2 | ZrO2 | TiO2 | Fe2O3 | Cr2O3 | V2O3 |
|---|---|---|---|---|---|---|---|---|
| 1.57 | 0.04 | 0.26 | 1.69 | 0.02 | 93.87 | 1.01 | 0.04 | 0.30 |
| WO3 | SnO2 | TiO2 | Fe2O3 | Cr2O3 | V2O3 | ZnO | |
|---|---|---|---|---|---|---|---|
| Cst I | 0.02 | 98.95 | 0.51 | 0.03 | 0.02 | 0.01 | 0.03 |
| Cst II | - | 99.05 | 0.44 | 0.03 | 0.01 | 0.01 | 0.03 |
| WO3 | Nb2O5 | ZrO2 | Bi2O3 | Fe2O3 | ZnO | NiO | CoO | FeO | MnO | |
|---|---|---|---|---|---|---|---|---|---|---|
| Wolf I | 75.09 | 0.23 | 0.02 | 0.02 | 1.89 | 0.04 | 0.01 | 0.02 | 18.52 | 3.77 |
| Wolf II | 75.21 | 0.25 | 0.01 | 0.02 | 1.66 | 0.03 | 0.01 | 0.03 | 18.72 | 3.64 |
| REE2O3 | Fe2O3 | Mn2O3 | P2O5 | SrO | FeO | MnO | CaO | MgO | Na2O | Cl | F | |
|---|---|---|---|---|---|---|---|---|---|---|---|---|
| Apt I | 0.11 | 0.20 | 0.04 | 41.98 | 0.03 | - | - | 54.24 | 0.01 | 0.06 | 0.01 | 3.34 |
| Apt II | 0.08 | - | - | 42.75 | 0.14 | 0.21 | 1.03 | 54.25 | 0.01 | 0.03 | 0.01 | 3.33 |
© 2020 by the authors. Licensee MDPI, Basel, Switzerland. This article is an open access article distributed under the terms and conditions of the Creative Commons Attribution (CC BY) license (http://creativecommons.org/licenses/by/4.0/).
Share and Cite
Mateus, A.; Figueiras, J.; Martins, I.; Rodrigues, P.C.; Pinto, F. Relative Abundance and Compositional Variation of Silicates, Oxides and Phosphates in the W-Sn-Rich Lodes of the Panasqueira Mine (Portugal): Implications for the Ore-Forming Process. Minerals 2020, 10, 551. https://0-doi-org.brum.beds.ac.uk/10.3390/min10060551
Mateus A, Figueiras J, Martins I, Rodrigues PC, Pinto F. Relative Abundance and Compositional Variation of Silicates, Oxides and Phosphates in the W-Sn-Rich Lodes of the Panasqueira Mine (Portugal): Implications for the Ore-Forming Process. Minerals. 2020; 10(6):551. https://0-doi-org.brum.beds.ac.uk/10.3390/min10060551
Chicago/Turabian StyleMateus, António, Jorge Figueiras, Ivo Martins, Pedro C. Rodrigues, and Filipe Pinto. 2020. "Relative Abundance and Compositional Variation of Silicates, Oxides and Phosphates in the W-Sn-Rich Lodes of the Panasqueira Mine (Portugal): Implications for the Ore-Forming Process" Minerals 10, no. 6: 551. https://0-doi-org.brum.beds.ac.uk/10.3390/min10060551