The Evolution of Pollutant Concentrations in a River Severely Affected by Acid Mine Drainage: Río Tinto (SW Spain)

 , ,
, ,  and
and 
Abstract
:
1. Introduction
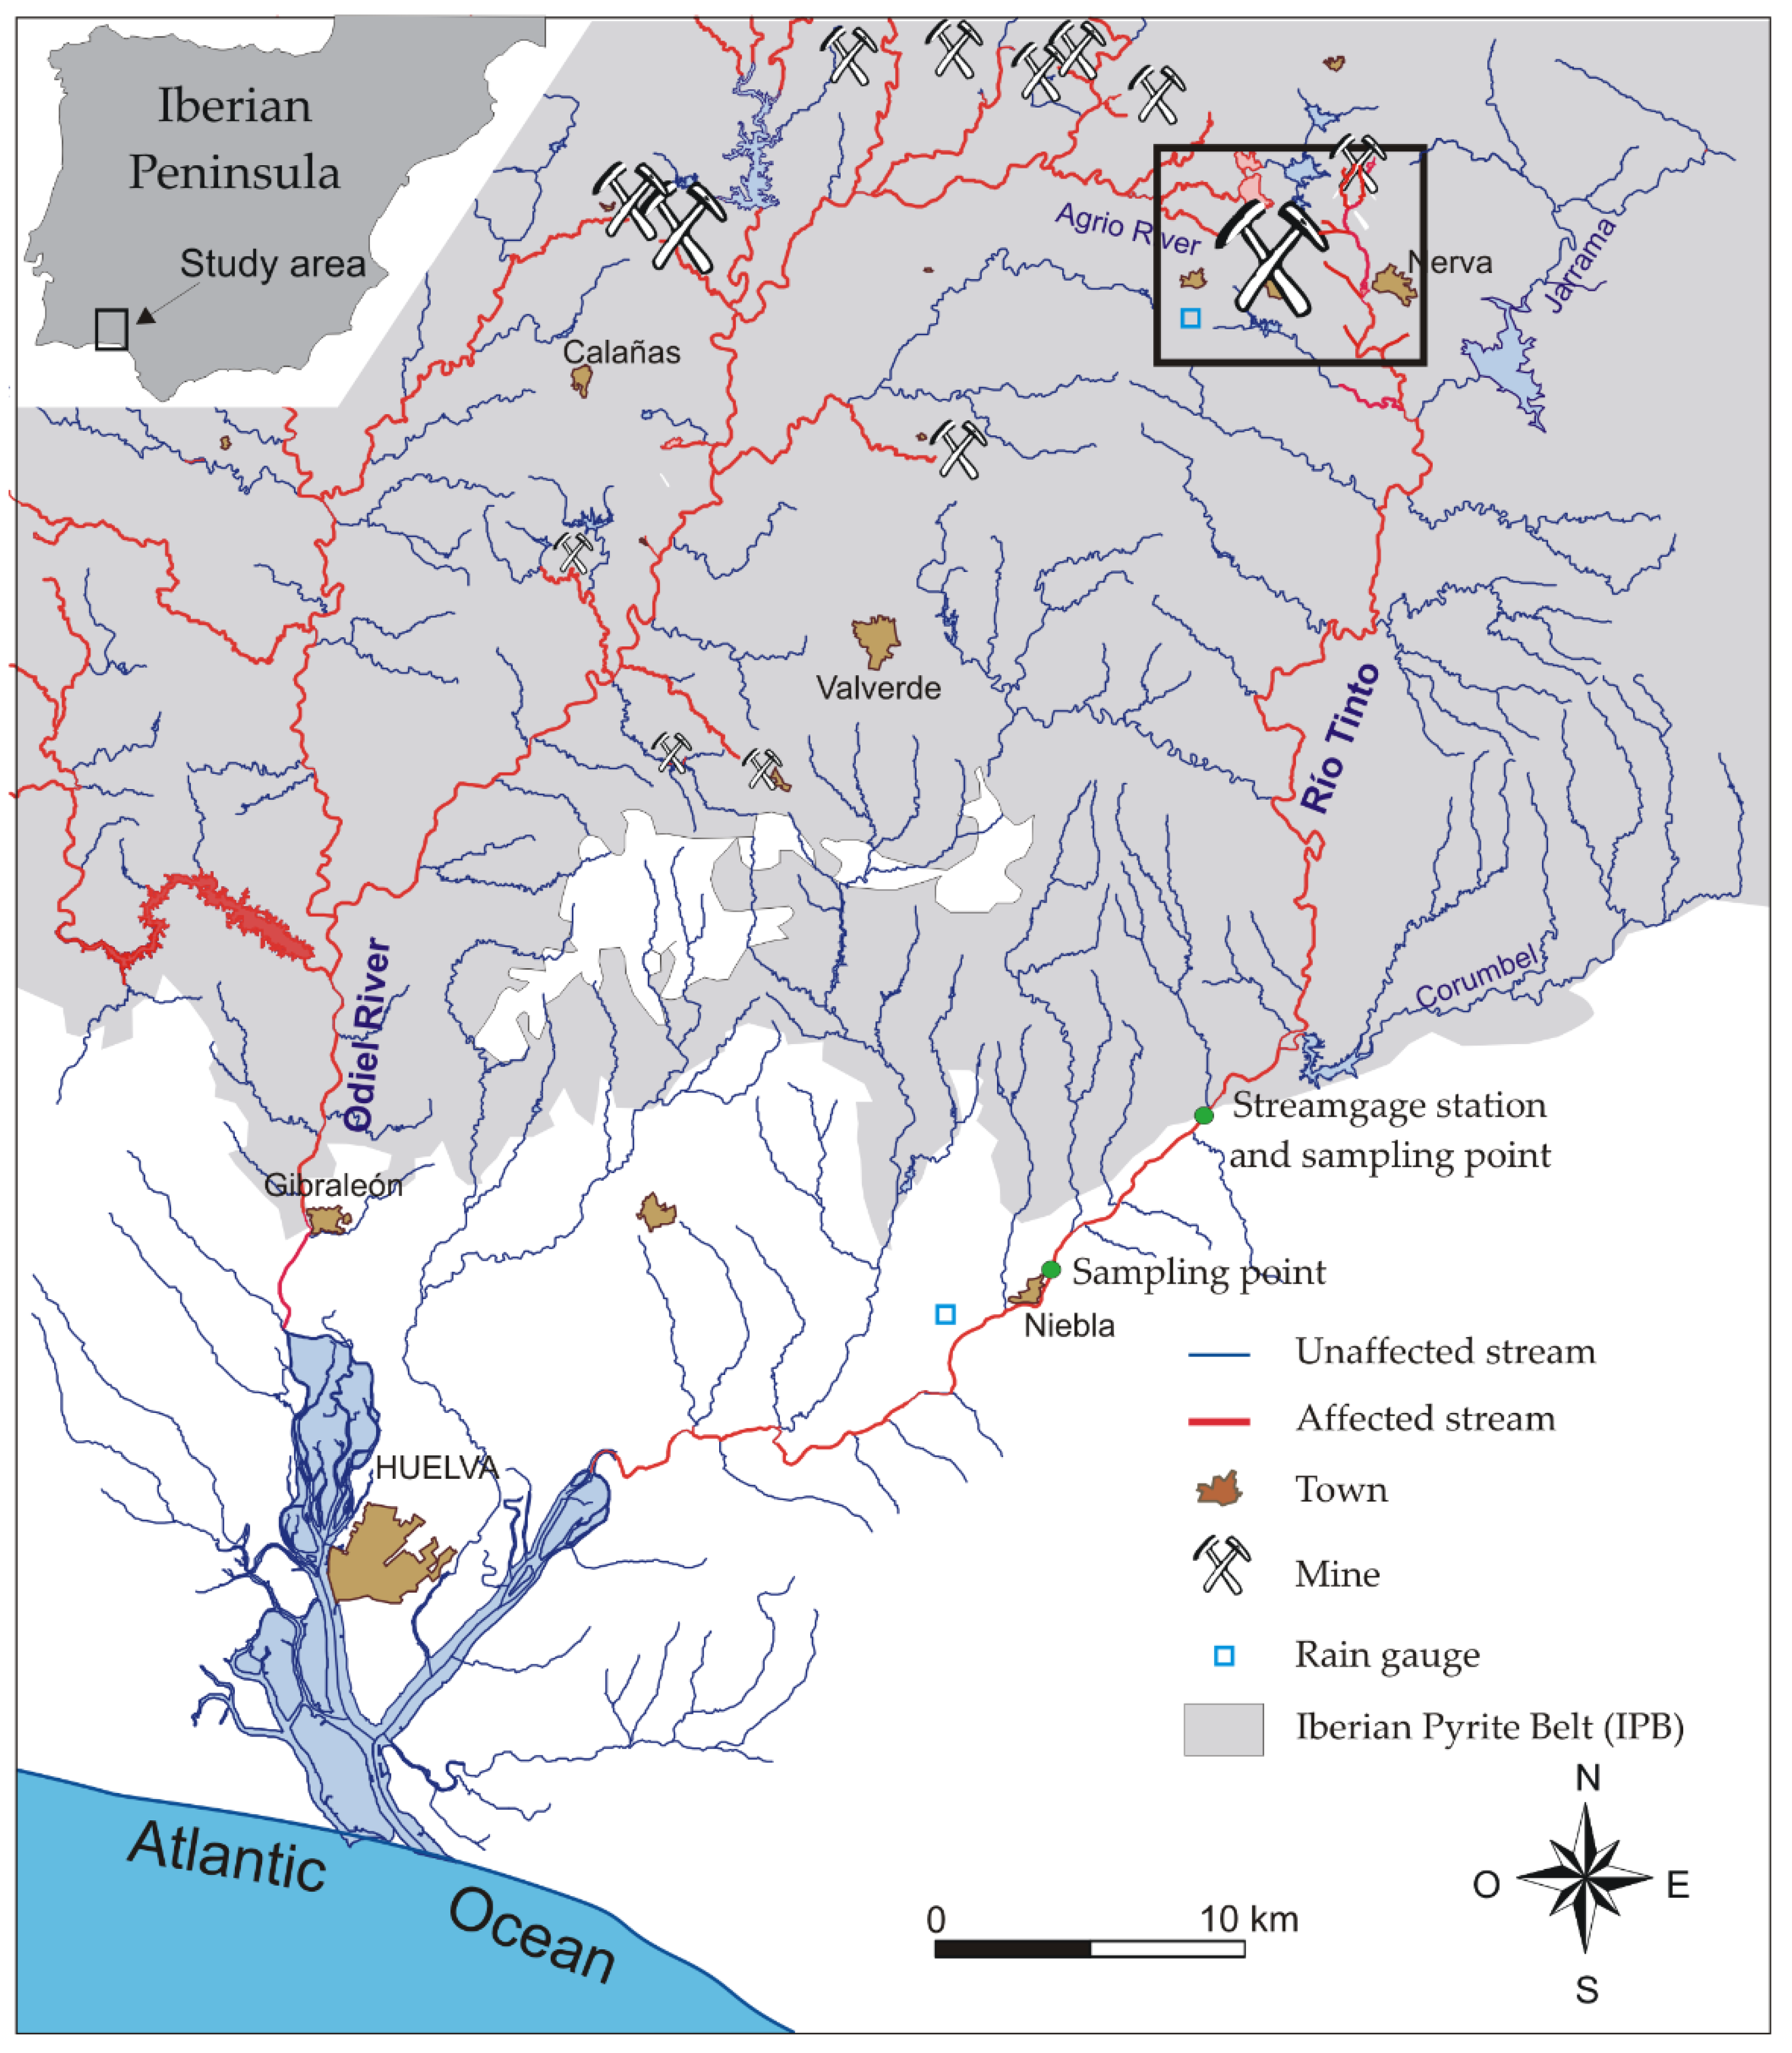
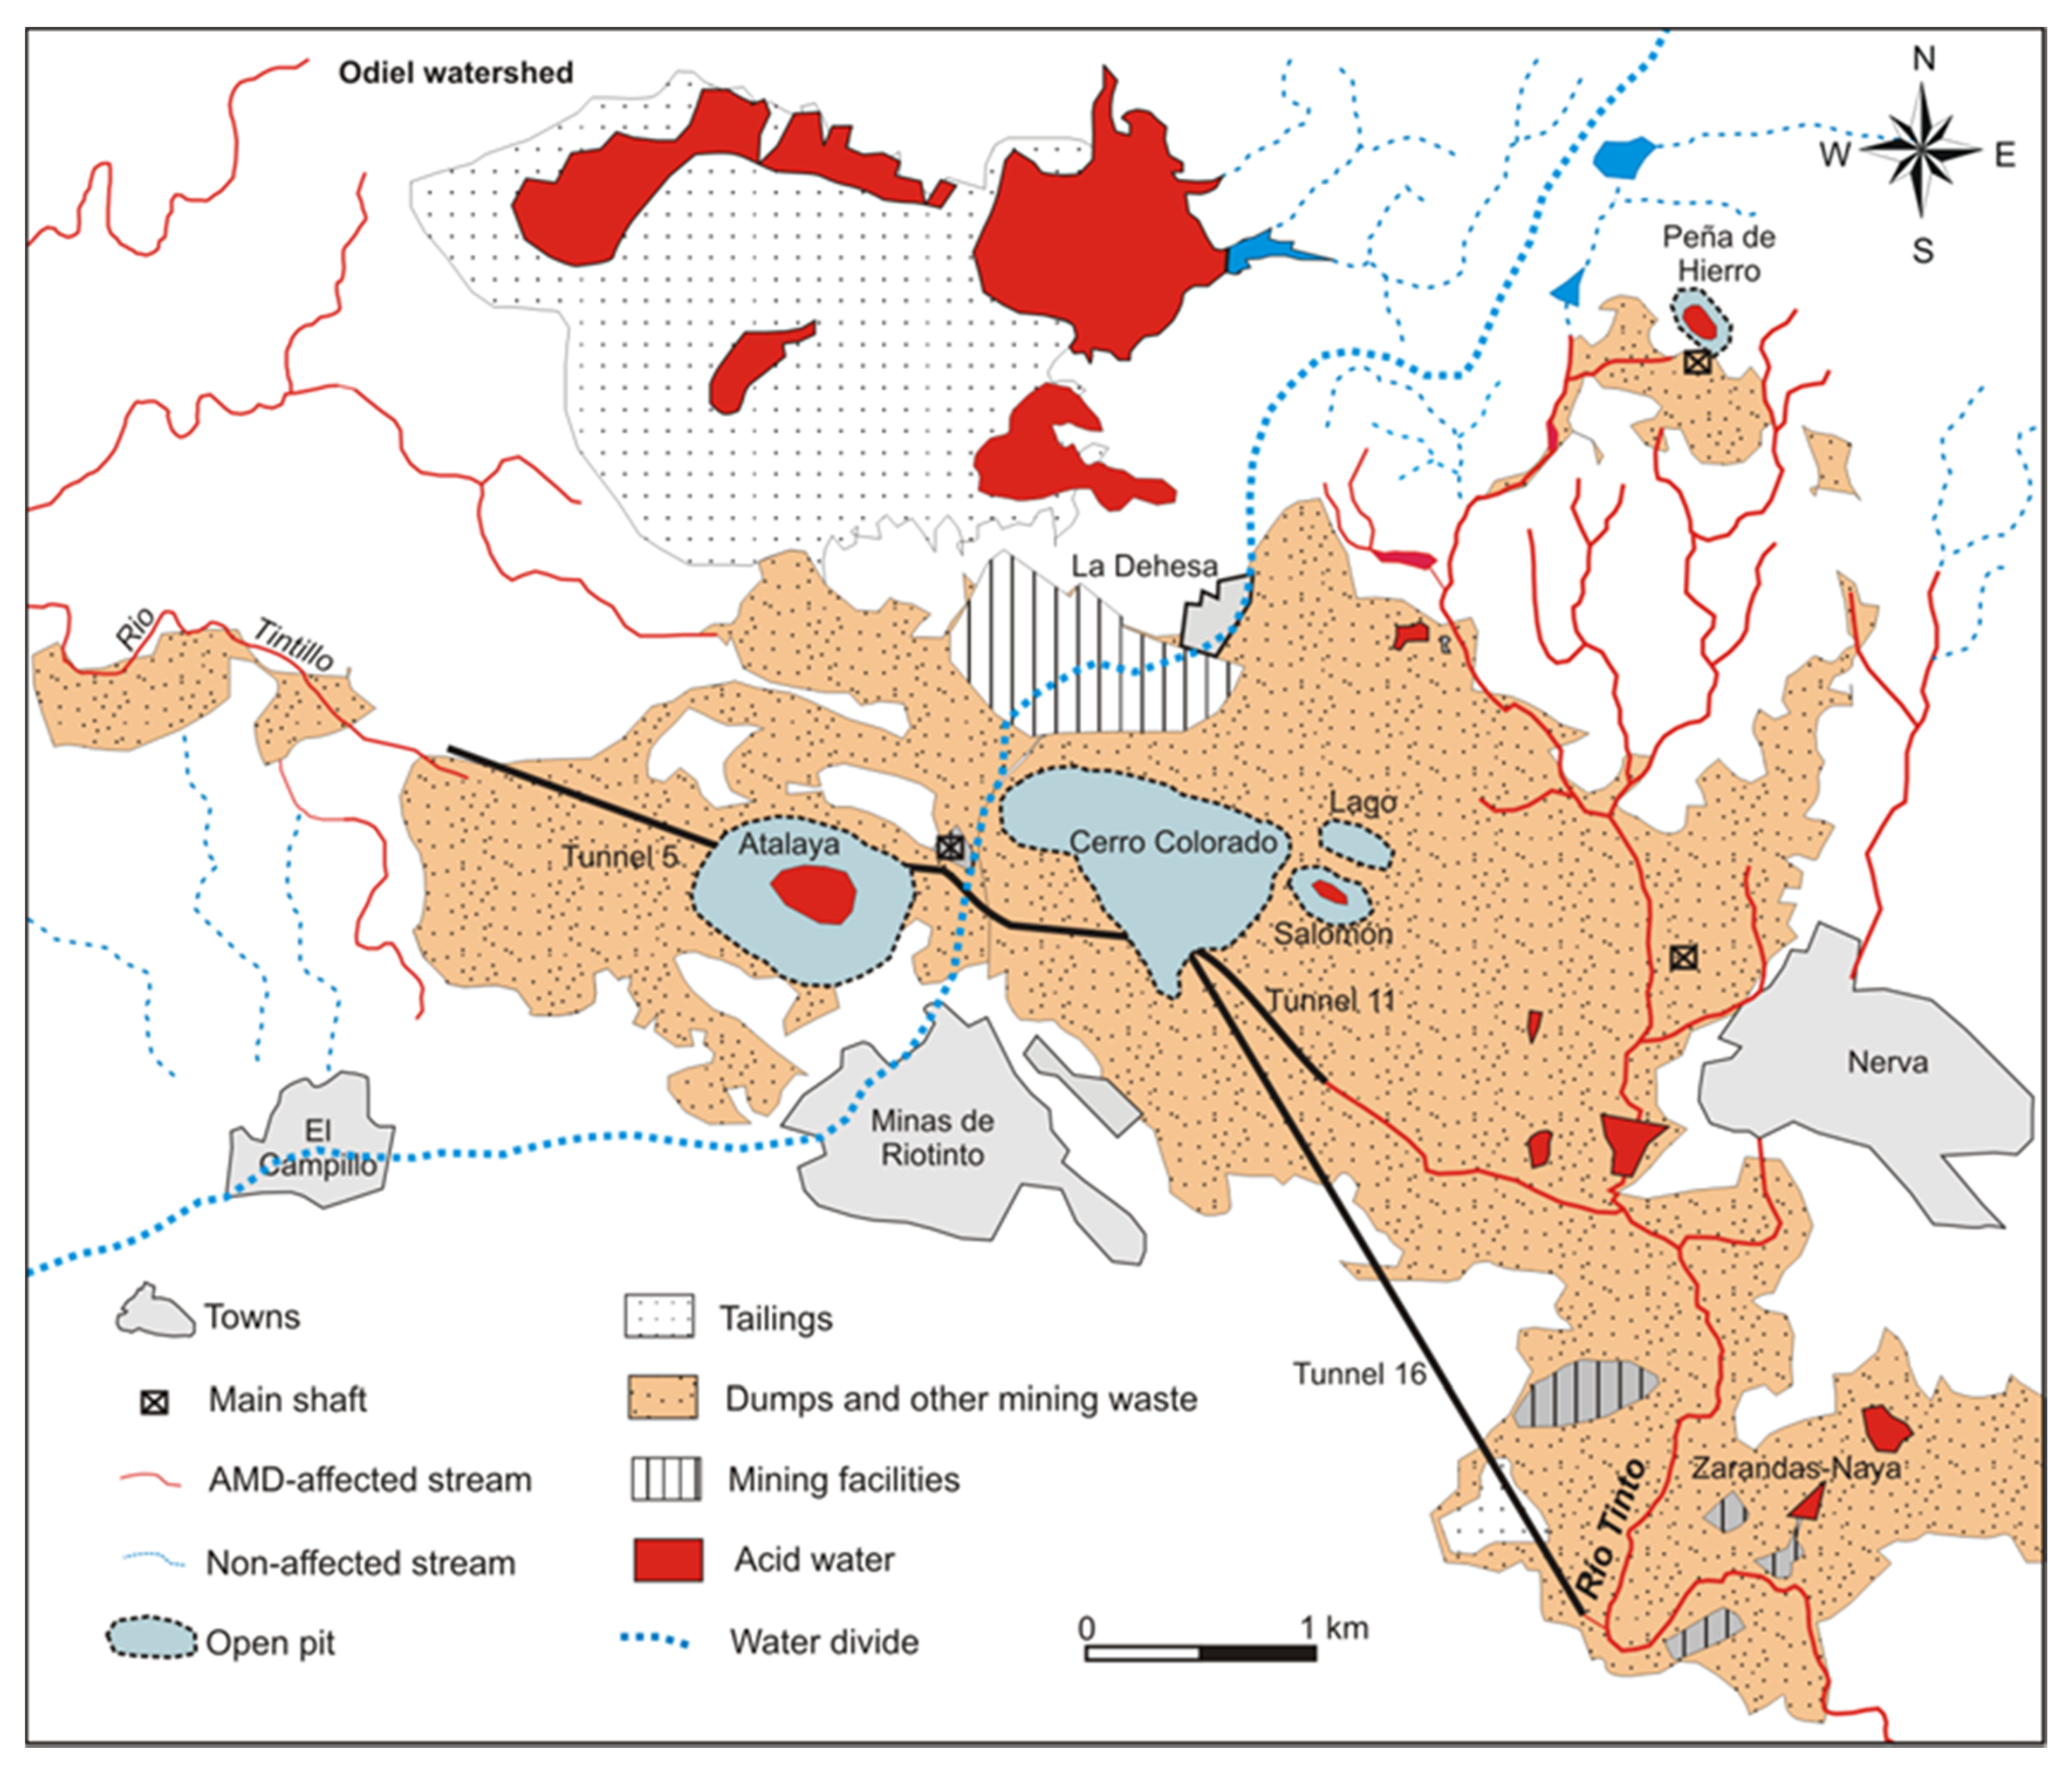
2. Site Description
3. Methods
3.1. Data Acquisition
3.2. Analysis
3.3. Pollutant Load
3.4. Saturation Indices and Multivariate Analysis
4. Results and Discussion
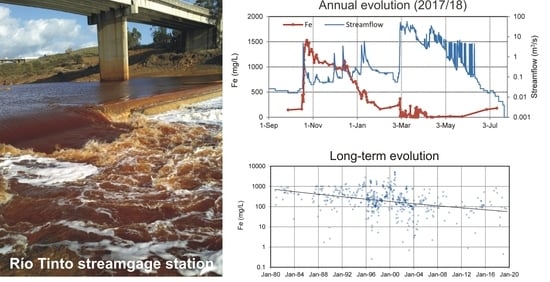
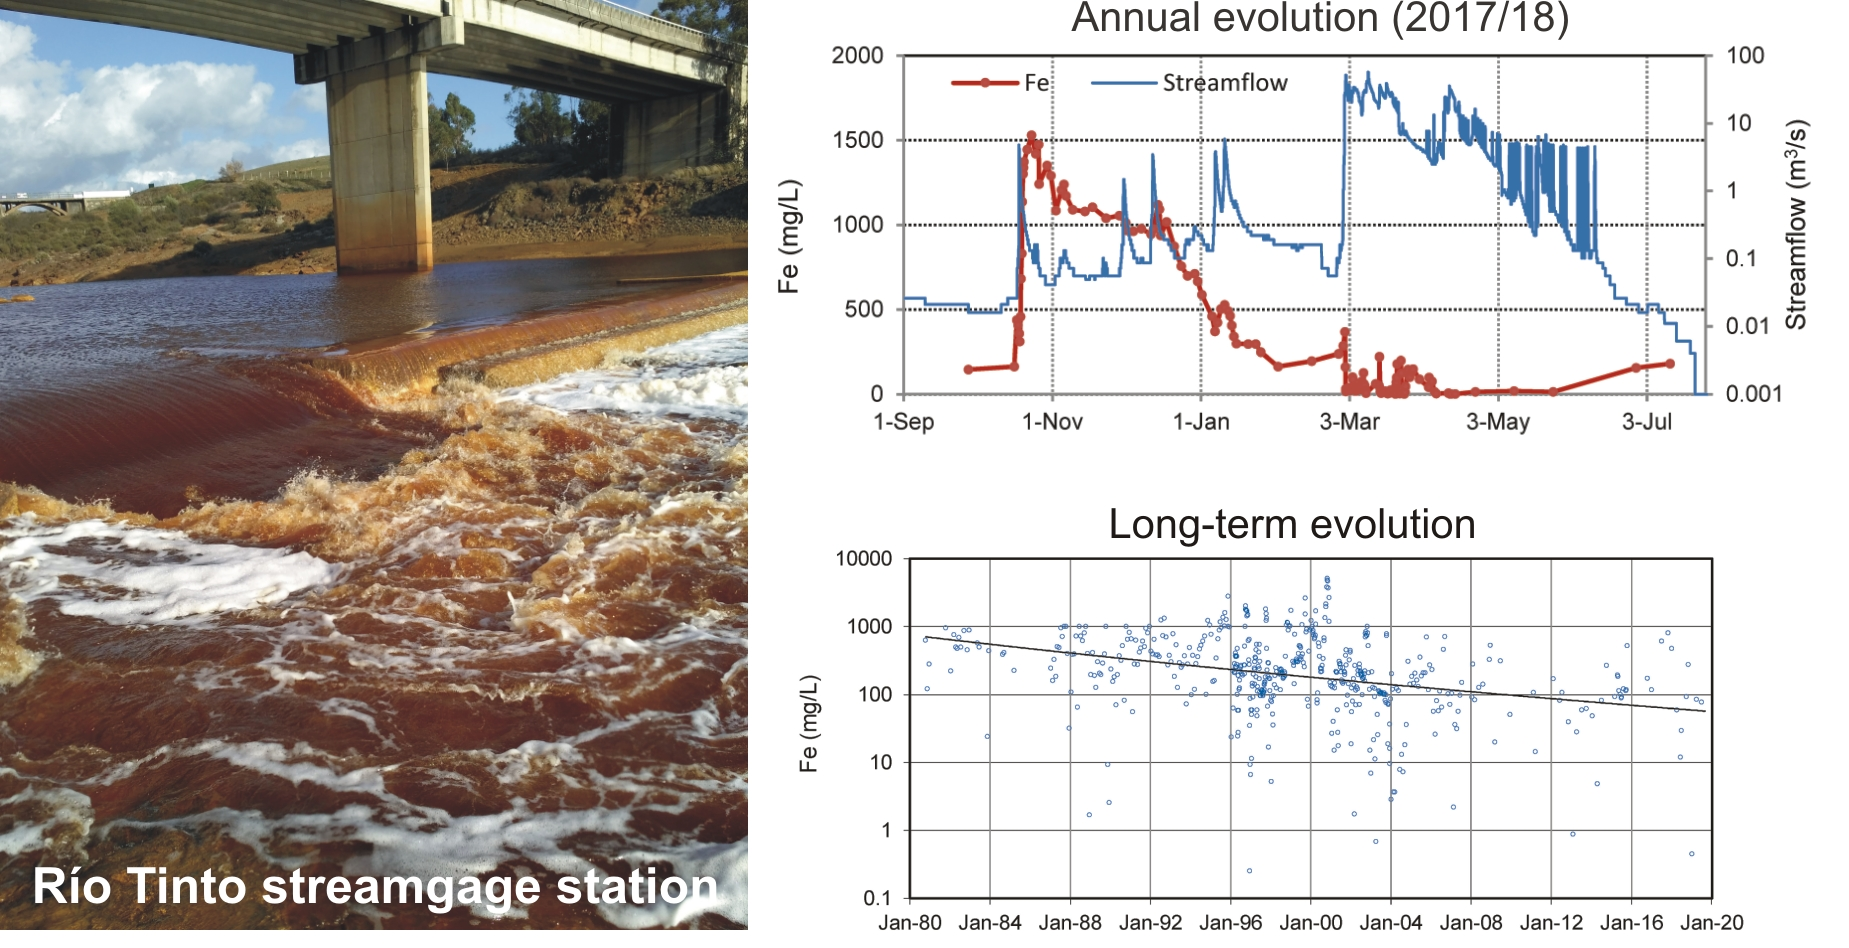
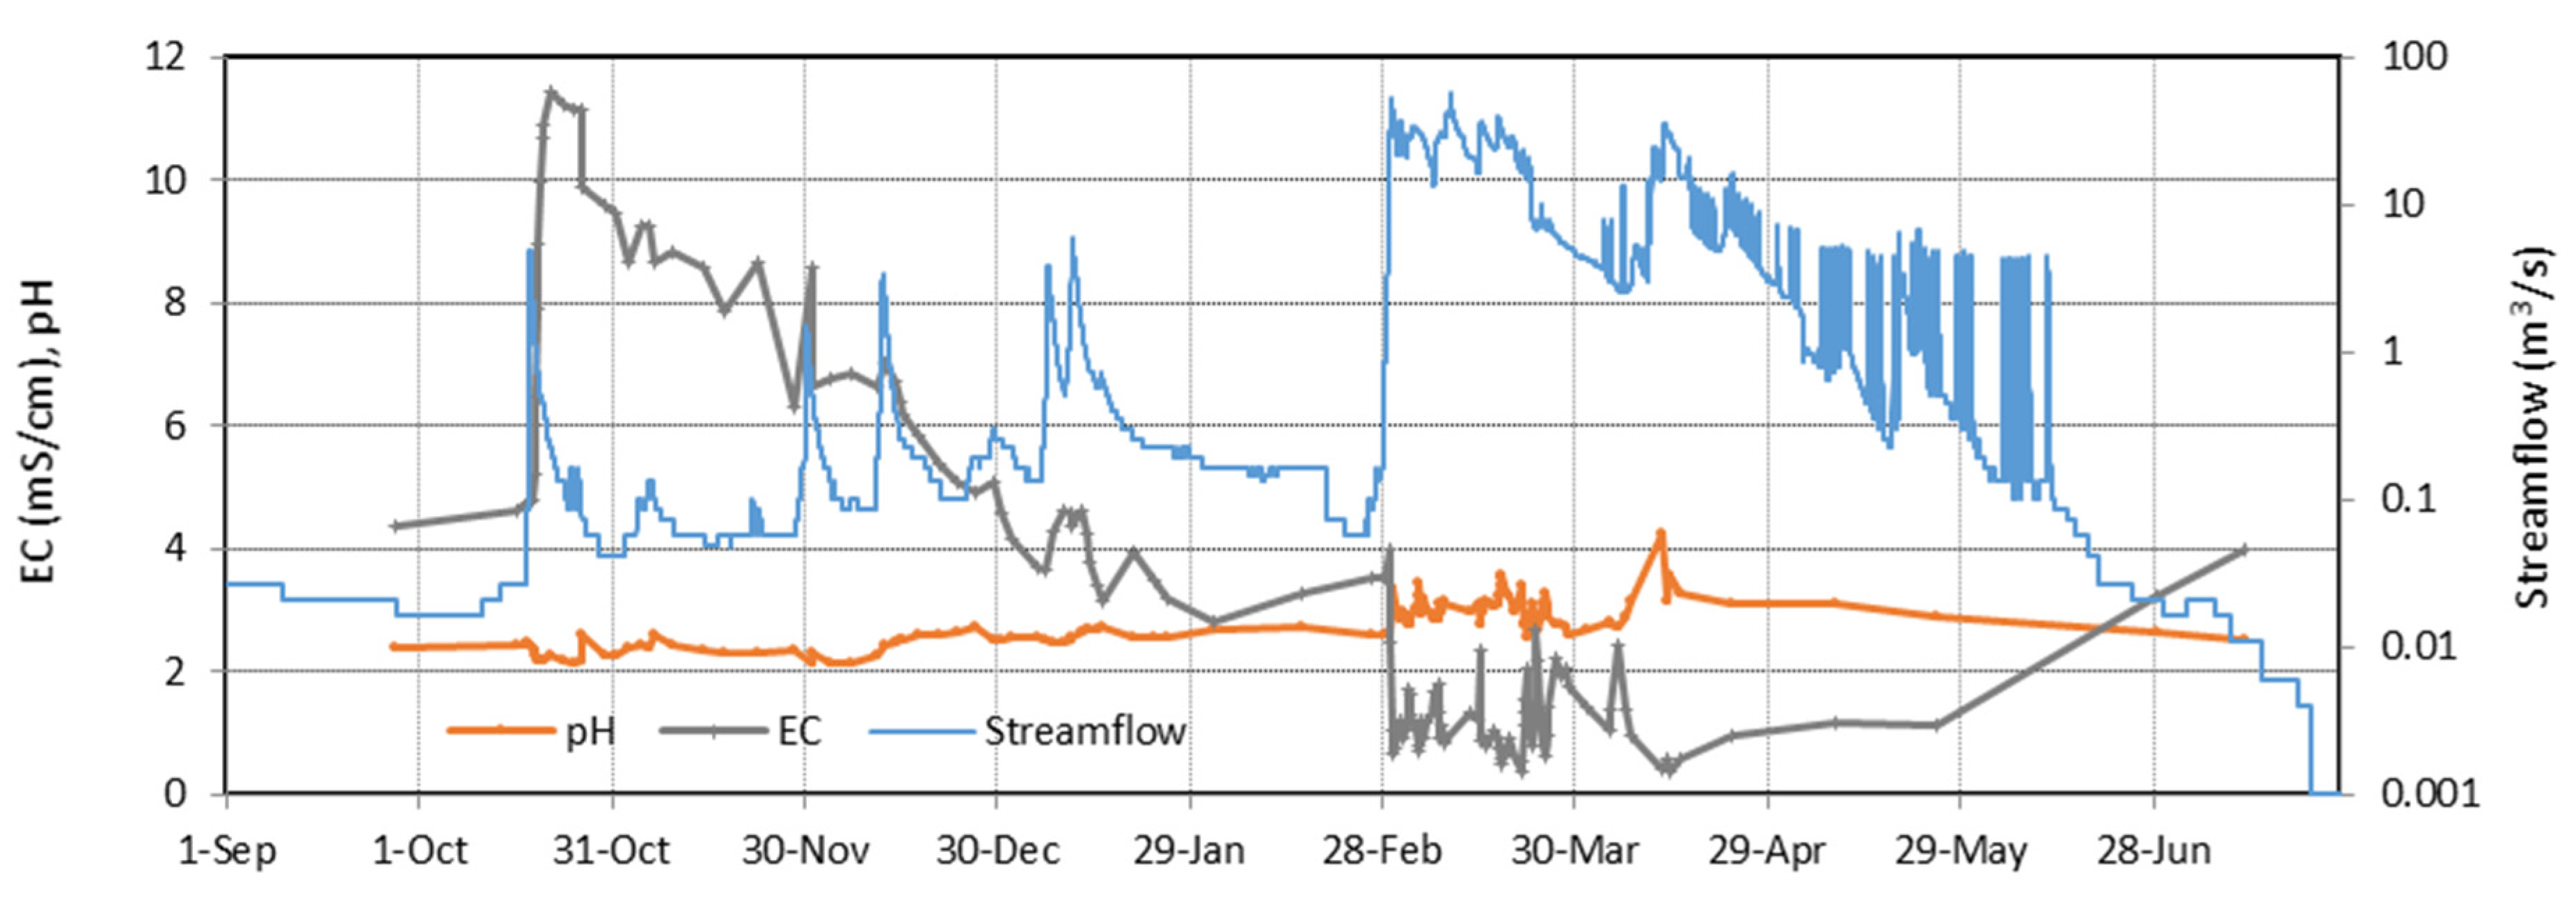
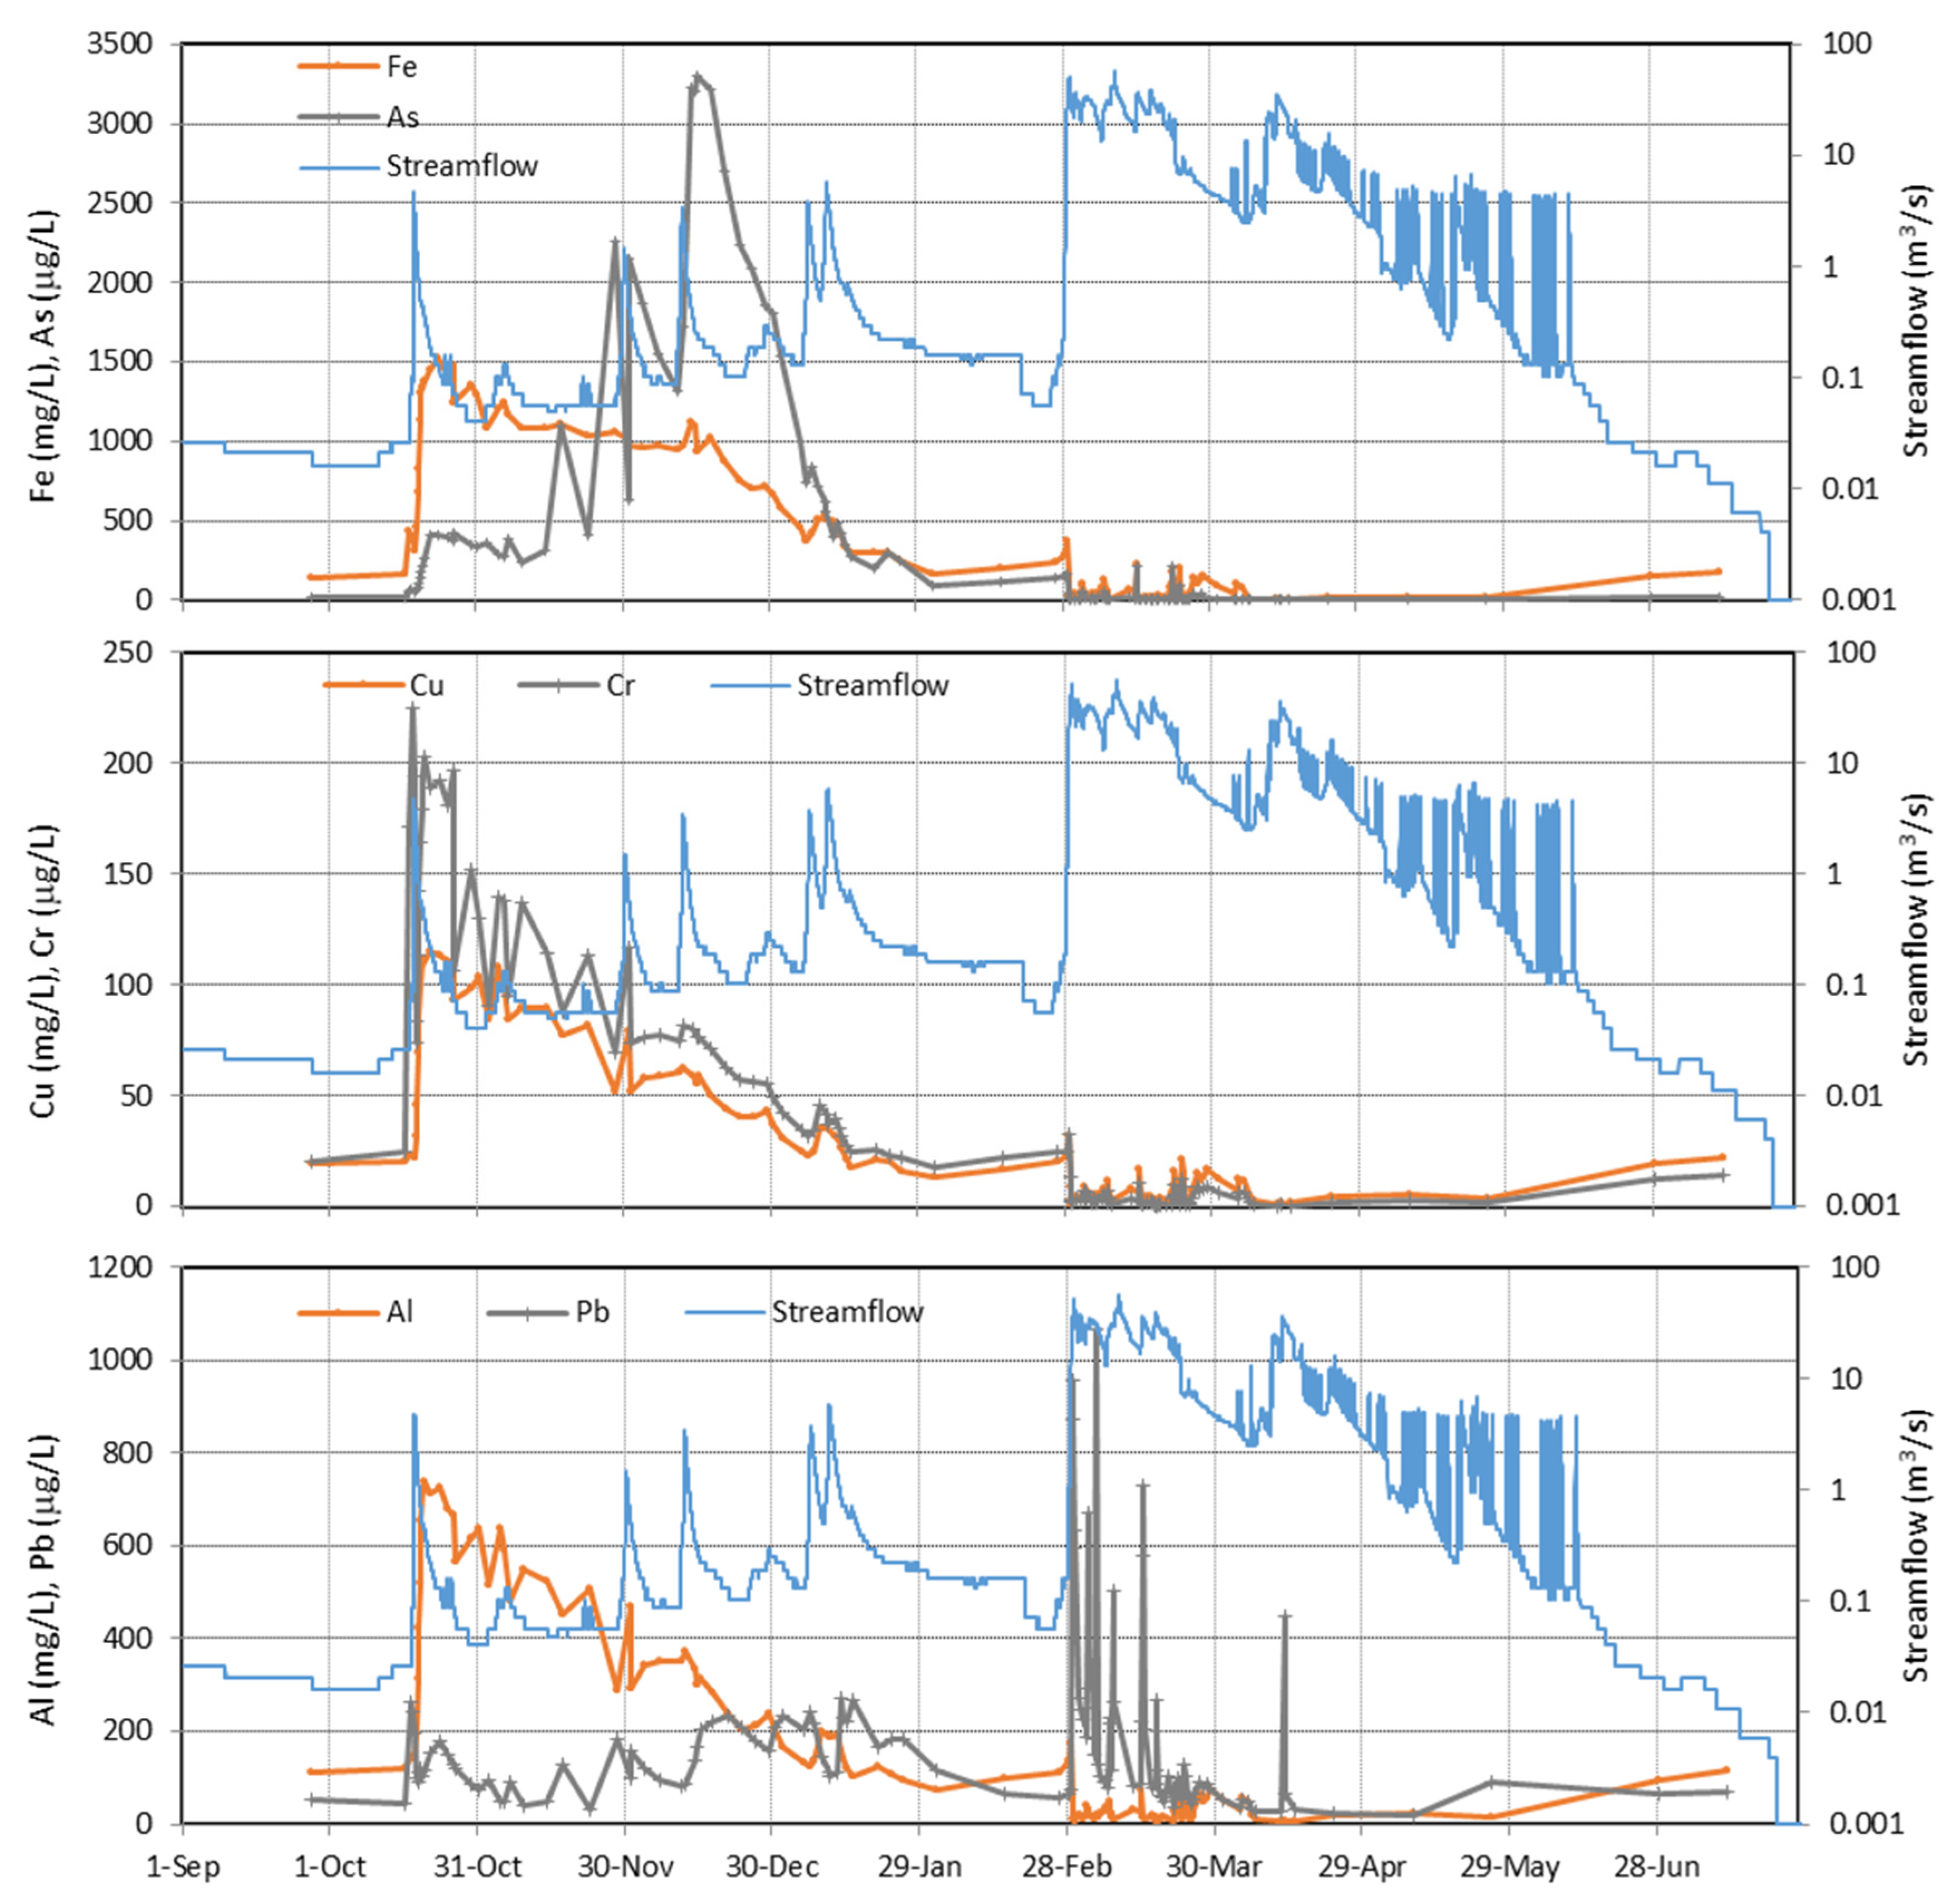
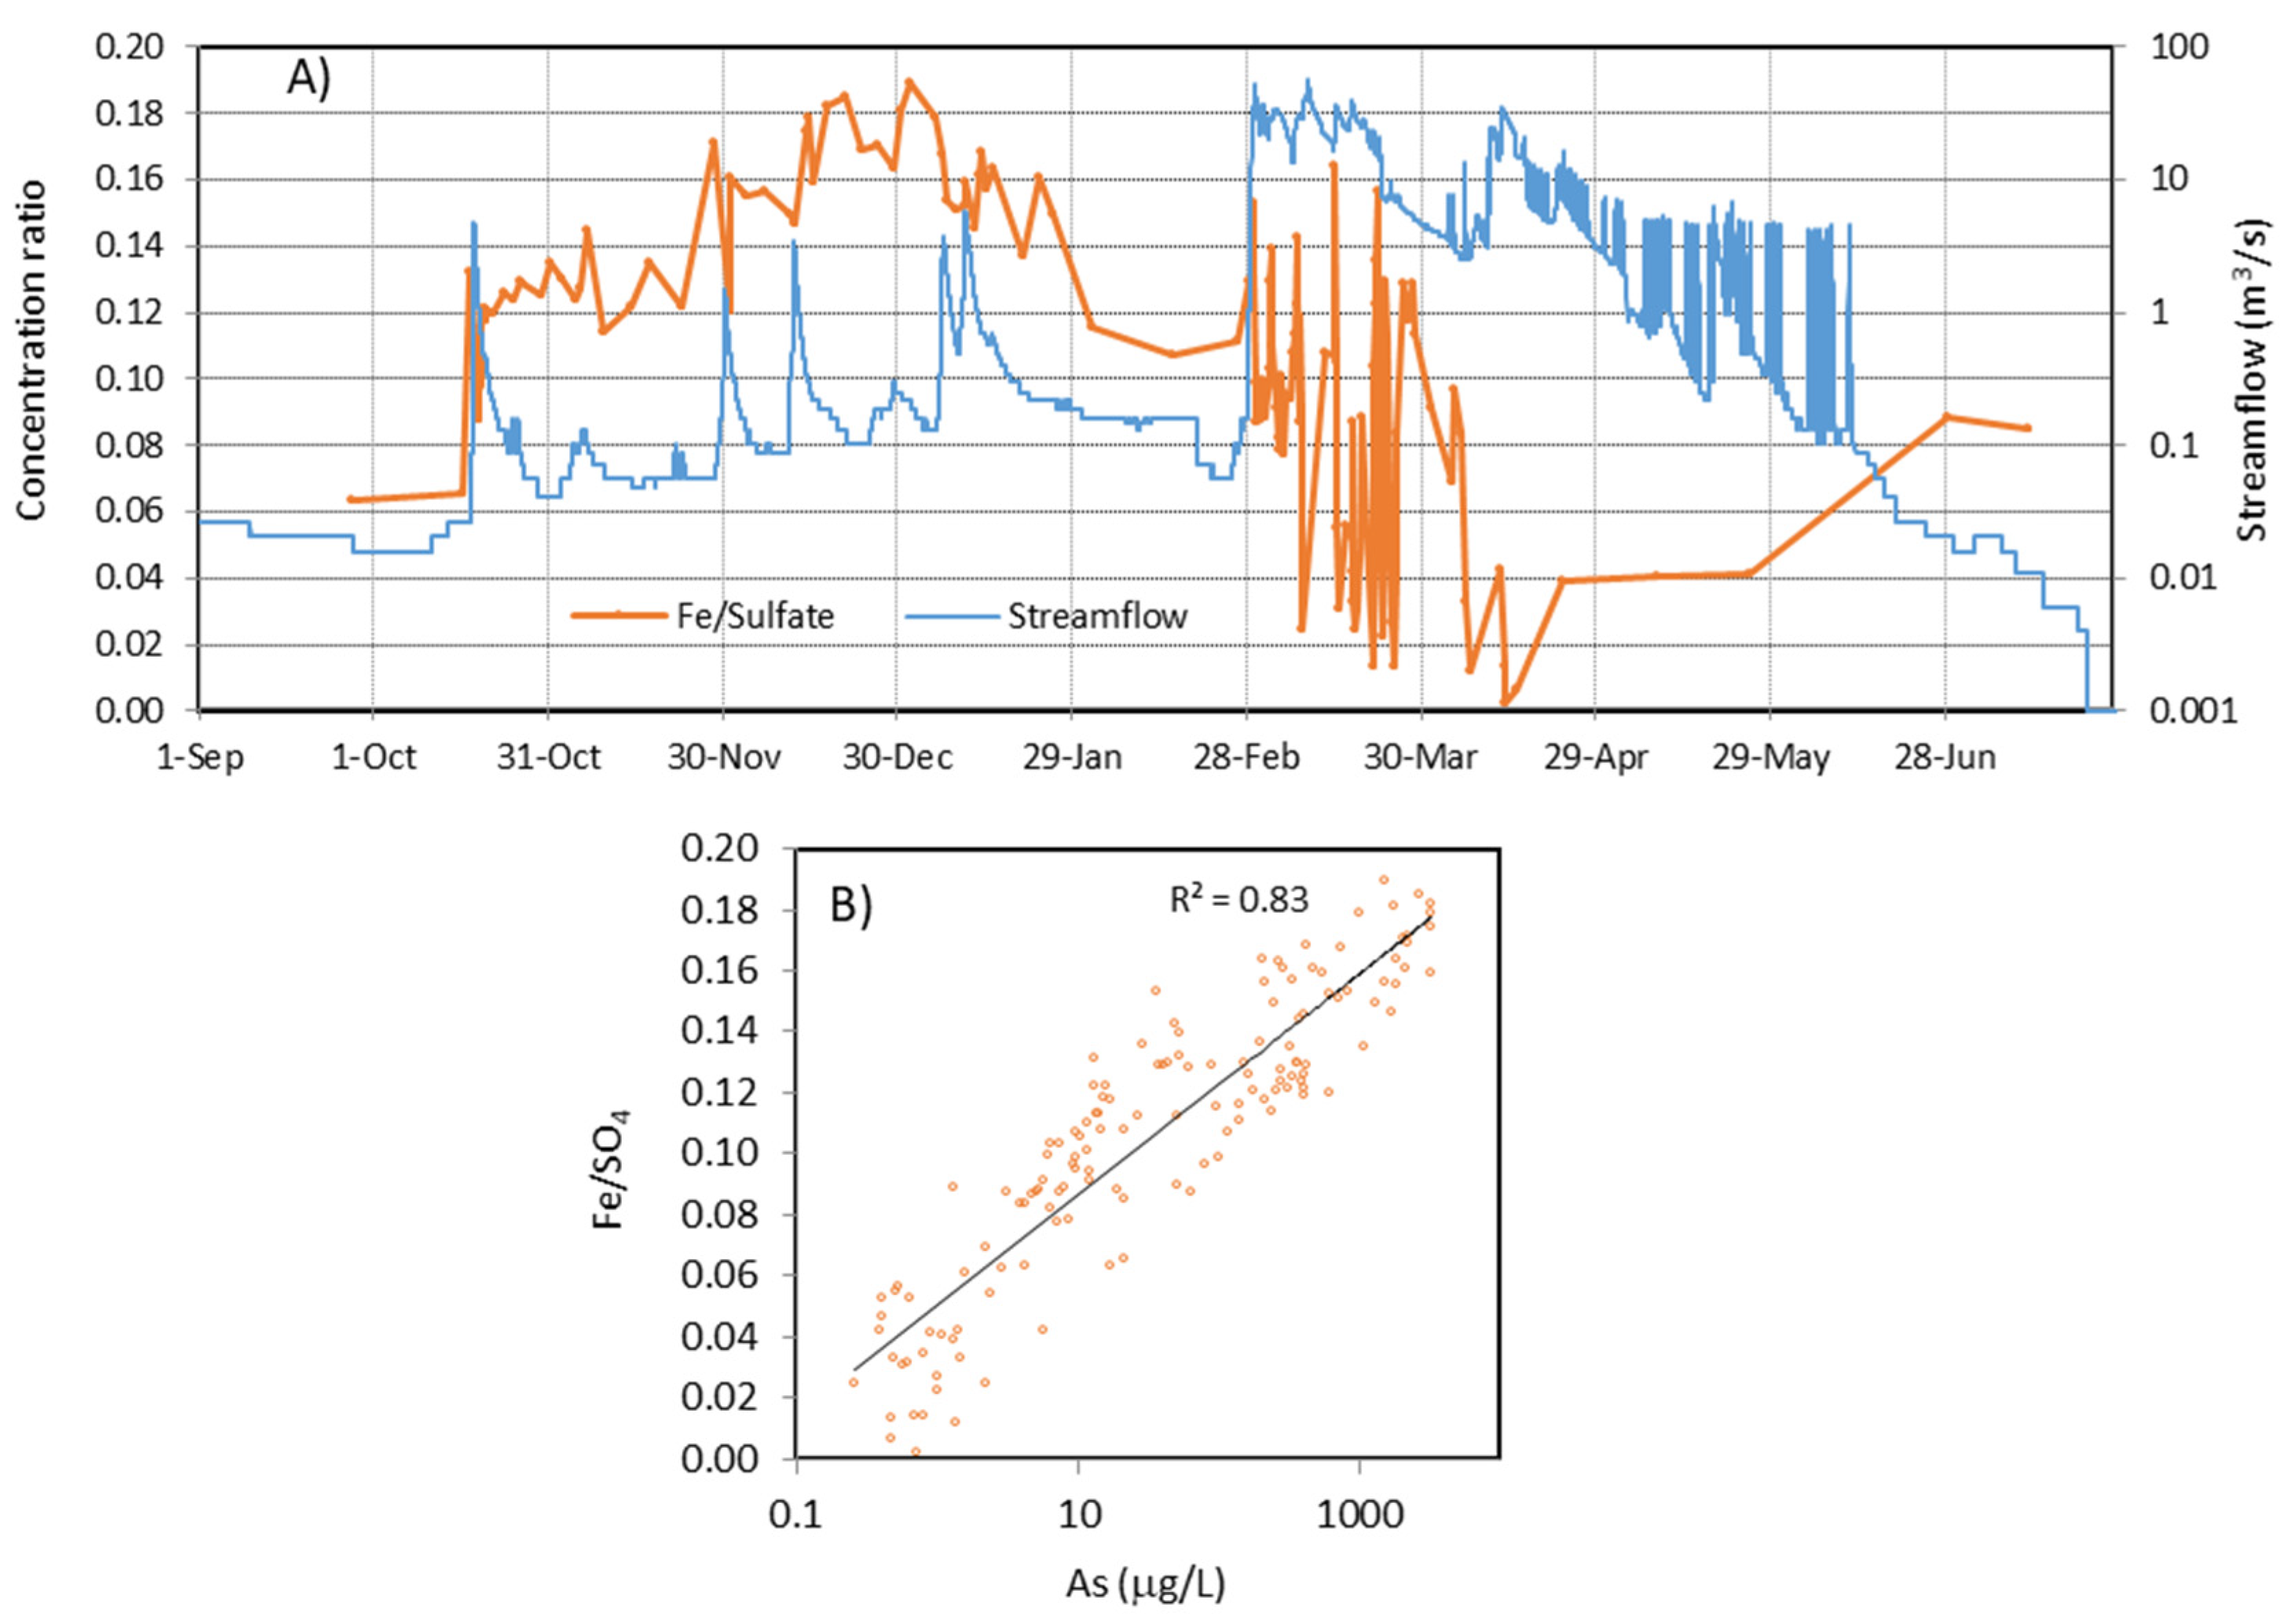
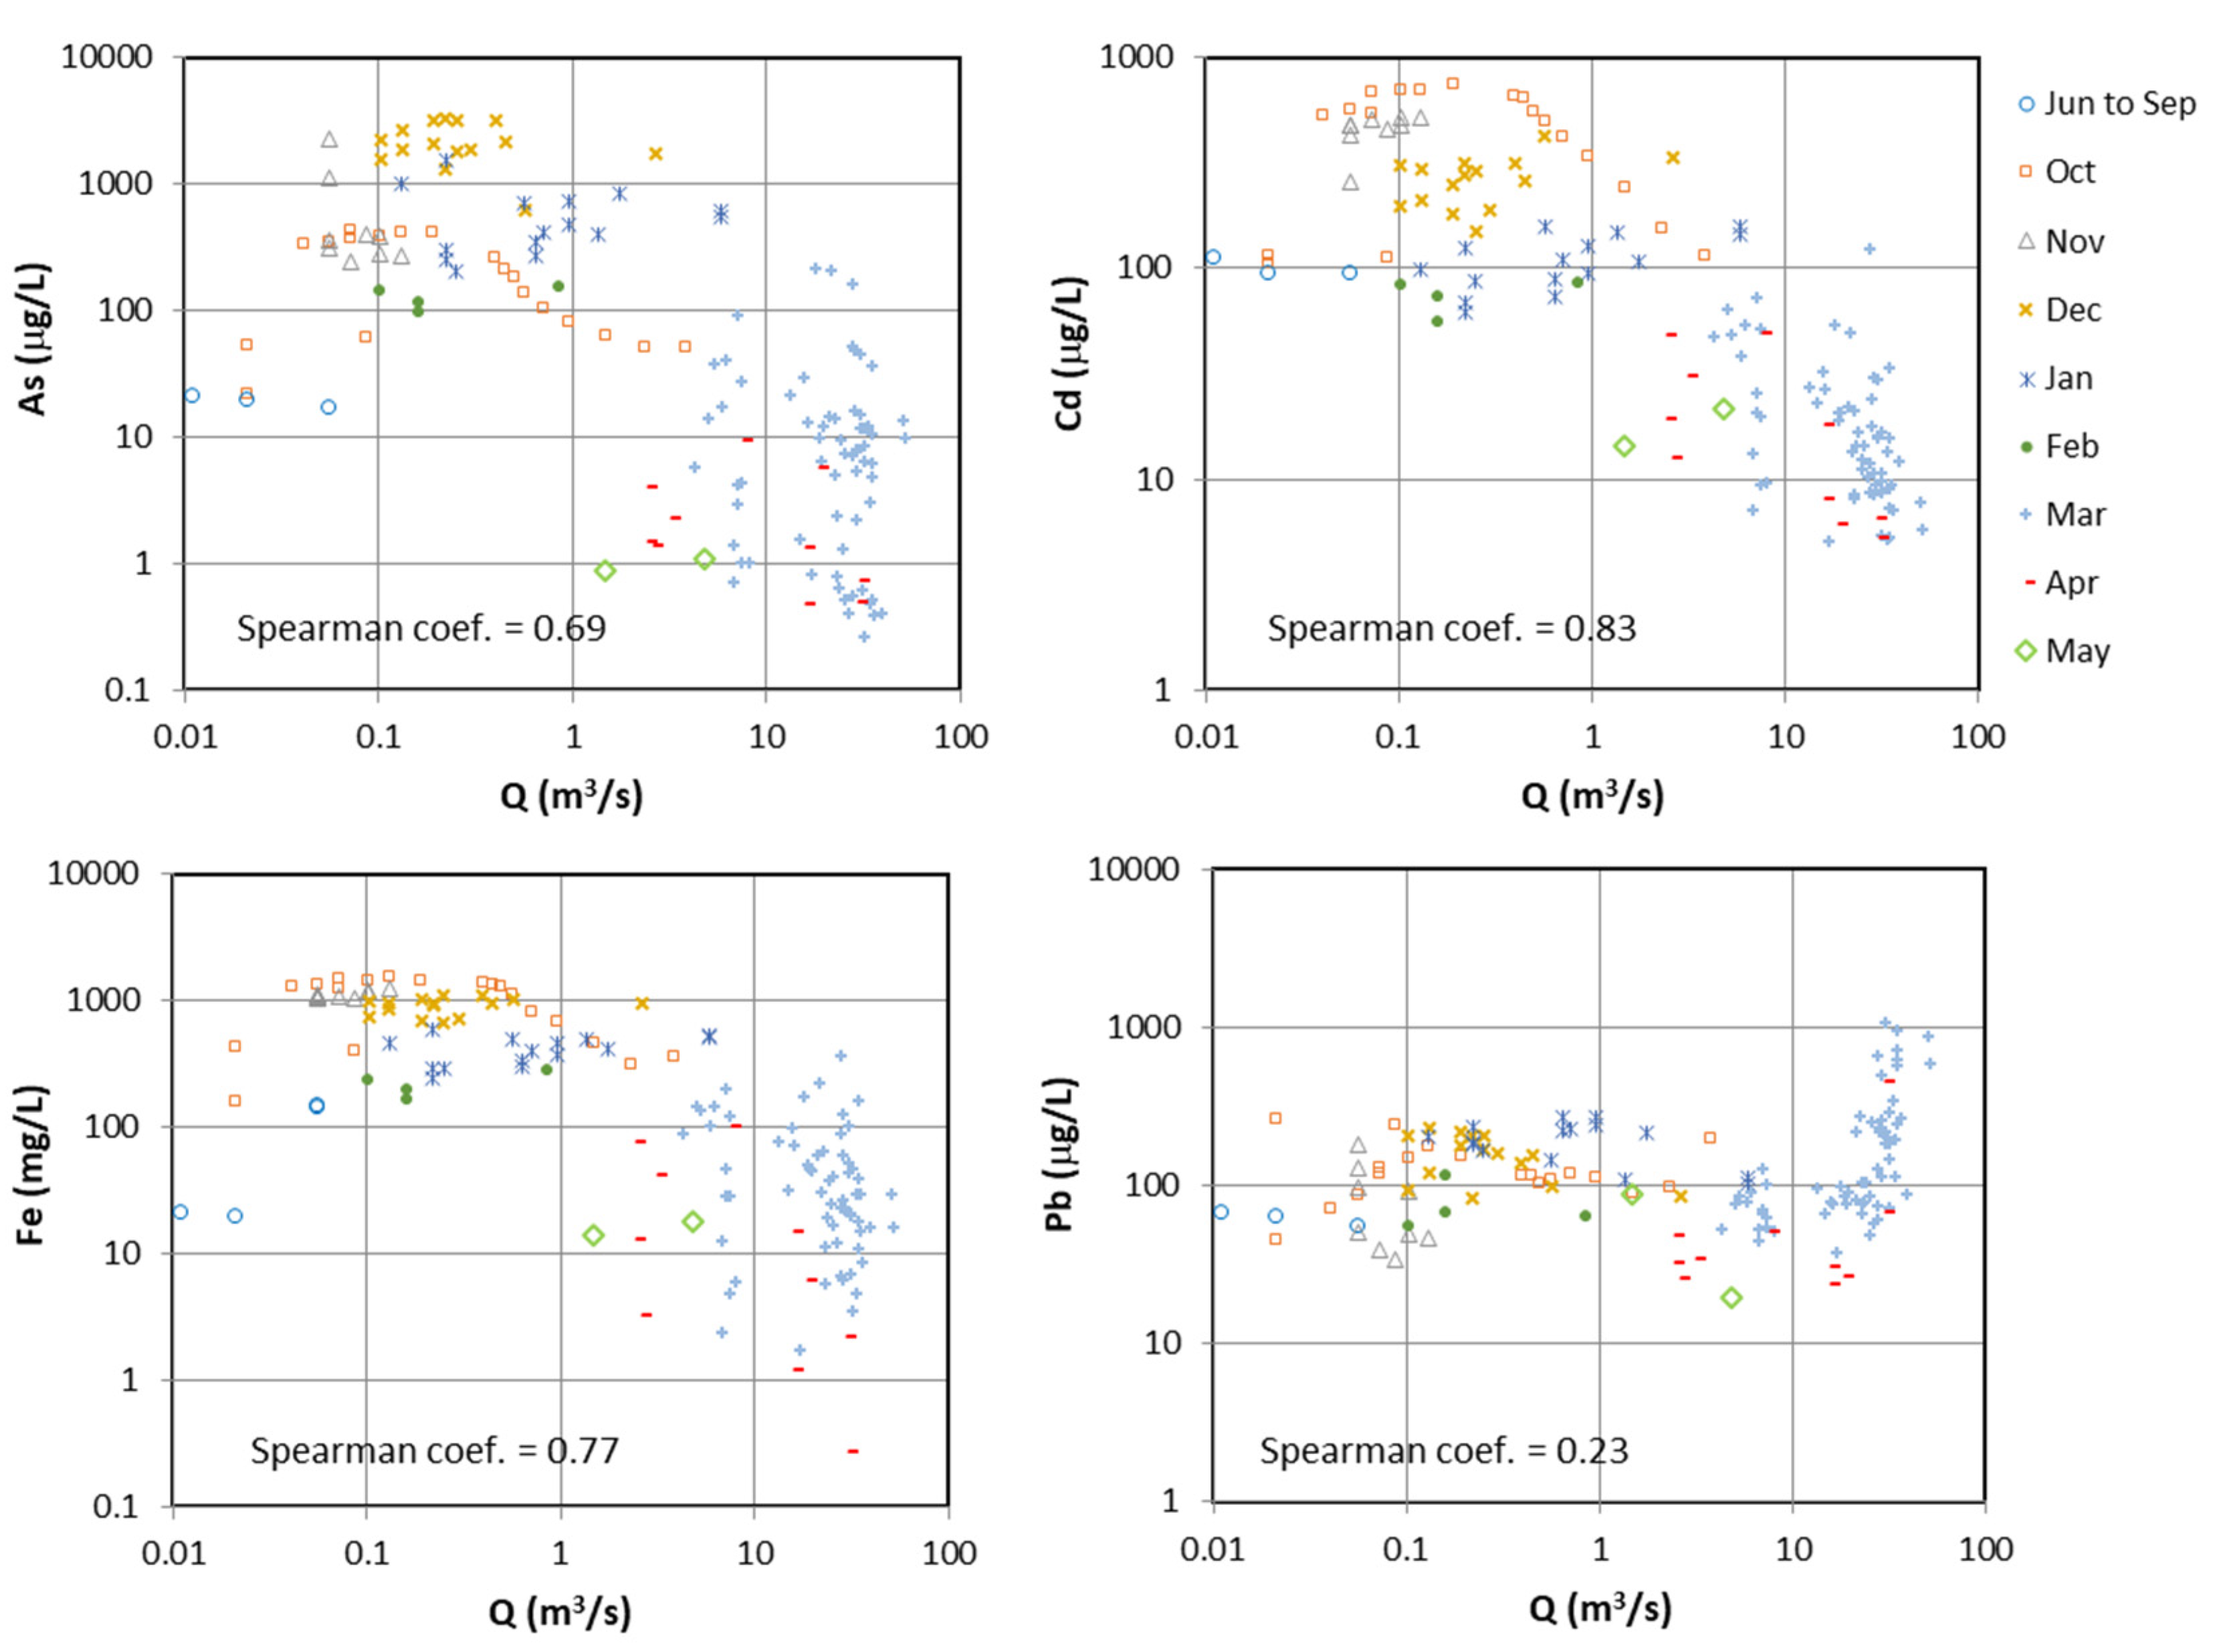
4.1. Evolution during the Hydrological Year 2017/18
4.2. Long-Term Evolution
5. Conclusions
Supplementary Materials
Author Contributions
Funding
Acknowledgments
Conflicts of Interest
References
- Sabater, S.; Buchaca, T.; Cambra, J.; Catalan, J.; Guasch, H.; Ivorra, N.; Muñoz, I.; Navarro, E.; Real, M.; Romaní, A. Structure and function of benthic algal communities in an extremely acid river 1. J. Phycol. 2003, 39, 481–489. [Google Scholar] [CrossRef] [Green Version]
- López-Archilla, A.I.; Marín, I.; Amils, R. Microbial community composition and ecology of an acidic aquatic environment: The Tinto River, Spain. Microb. Ecol. 2001, 41, 20–35. [Google Scholar] [CrossRef] [PubMed]
- Zettler, L.A.A.; Gómez, F.; Zettler, E.; Keenan, B.G.; Amils, R.; Sogin, M.L. Eukaryotic diversity in Spain’s River of Fire. Nature 2002, 417, 137. [Google Scholar] [CrossRef] [PubMed]
- Gomes, P.; Valente, T.; Geraldo, D.; Ribeiro, C. Photosynthetic pigments in acid mine drainage: Seasonal patterns and associations with stressful abiotic characteristics. Chemosphere 2020, 239, 124774. [Google Scholar] [CrossRef] [PubMed]
- Dold, B. Evolution of acid mine drainage formation in sulphidic mine tailings. Minerals 2014, 4, 621–641. [Google Scholar] [CrossRef] [Green Version]
- Chopard, A.; Marion, P.; Mermillod-Blondin, R.; Plante, B.; Benzaazoua, M. Environmental impact of mine exploitation: An early predictive methodology based on ore mineralogy and contaminant speciation. Minerals 2019, 9, 397. [Google Scholar] [CrossRef] [Green Version]
- Evangelou, V.P.; Zhang, Y. A review: Pyrite oxidation mechanisms and acid mine drainage prevention. Crit. Rev. Environ. Sci. Technol. 1995, 25, 141–199. [Google Scholar] [CrossRef]
- Blowes, D.W.; Jambor, J.L.; Hanton-Fong, C.J.; Lortie, L.; Gould, W.D. Geochemical, mineralogical and microbiological characterization of a sulphide-bearing carbonate-rich gold-mine tailings impoundment, Joutel, Québec. Appl. Geochem. 1998, 13, 687–705. [Google Scholar] [CrossRef]
- Nordstrom, D.K.; Blowes, D.W.; Ptacek, C.J. Hydrogeochemistry and microbiology of mine drainage: An update. Appl. Geochem. 2015, 57, 3–16. [Google Scholar] [CrossRef]
- Elghali, A.; Benzaazoua, M.; Bouzahzah, H.; Bussière, B.; Villarraga-Gómez, H. Determination of the available acid-generating potential of waste rock, part I: Mineralogical approach. Appl. Geochem. 2018, 99, 31–41. [Google Scholar] [CrossRef]
- Jarvis, A.P.; Davis, J.E.; Orme, P.H.; Potter, H.A.; Gandy, C.J. Predicting the benefits of mine water treatment under varying hydrological conditions using a synoptic mass balance approach. Environ. Sci. Technol. 2018, 53, 702–709. [Google Scholar] [CrossRef] [PubMed]
- Dore, E.; Fancello, D.; Rigonat, N.; Medas, D.; Cidu, R.; Da Pelo, S.; Frau, F.; Lattanzi, P.; Marras, P.A.; Meneghini, C. Natural attenuation can lead to environmental resilience in mine environment. Appl. Geochem. 2020, 104597. [Google Scholar] [CrossRef]
- Leistel, J.; Marcoux, E.; Thiéblemont, D.; Quesada, C.; Sánchez, A.; Almodóvar, G.; Pascual, E.; Sáez, R. The volcanic-hosted massive sulphide deposits of the Iberian Pyrite Belt Review and preface to the Thematic Issue. Miner. Depos. 1997, 33, 2–30. [Google Scholar] [CrossRef]
- Nocete, F.; Álex, E.; Nieto, J.M.; Sáez, R.; Bayona, M.R. An archaeological approach to regional environmental pollution in the south-western Iberian Peninsula related to Third millennium BC mining and metallurgy. J. Archaeol. Sci. 2005, 32, 1566–1576. [Google Scholar] [CrossRef]
- Olías, M.; Nieto, J.M. Background conditions and mining pollution throughout history in the Río Tinto (SW Spain). Environments 2015, 2, 295–316. [Google Scholar] [CrossRef] [Green Version]
- Olías, M.; Cánovas, C.R.; Nieto, J.; Sarmiento, A.M. Evaluation of the dissolved contaminant load transported by the Tinto and Odiel rivers (South West Spain). Appl. Geochem. 2006, 21, 1733–1749. [Google Scholar] [CrossRef]
- Cánovas, C.; Olías, M.; Nieto, J.; Sarmiento, A.; Cerón, J. Hydrogeochemical characteristics of the Tinto and Odiel Rivers (SW Spain). Factors controlling metal contents. Sci. Total Environ. 2007, 373, 363–382. [Google Scholar] [CrossRef]
- Cánovas, C.R.; Basallote, M.D.; Borrego, P.; Millán-Becerro, R.; Pérez-López, R. Metal partitioning and speciation in a mining-impacted estuary by traditional and passive sampling methods. Sci. Total Environ. 2020, 137905. [Google Scholar] [CrossRef]
- López-González, N.; Borrego, J.; Morales, J.; Carro, B.; Lozano-Soria, O. Metal fractionation in oxic sediments of an estuary affected by acid mine drainage (south-western Spain). Estuar. Coast. Shelf Sci. 2006, 68, 297–304. [Google Scholar] [CrossRef]
- Usero, J.; Izquierdo, C.; Morillo, J.; Gracia, I. Heavy metals in fish (Solea vulgaris, Anguilla anguilla and Liza aurata) from salt marshes on the southern Atlantic coast of Spain. Environ. Int. 2004, 29, 949–956. [Google Scholar] [CrossRef]
- Vicente-Martorell, J.J.; Galindo-Riaño, M.D.; García-Vargas, M.; Granado-Castro, M.D. Bioavailability of heavy metals monitoring water, sediments and fish species from a polluted estuary. J. Hazard. Mater. 2009, 162, 823–836. [Google Scholar] [CrossRef] [PubMed]
- Van Geen, A.; Adkins, J.; Boyle, E.; Nelson, C.; Palanques, A. A 120-yr record of widespread contamination from mining of the Iberian pyrite belt. Geology 1997, 25, 291–294. [Google Scholar] [CrossRef]
- Baconnais, I.; Rouxel, O.; Dulaquais, G.; Boye, M. Determination of the copper isotope composition of seawater revisited: A case study from the Mediterranean Sea. Chem. Geol. 2019, 511, 465–480. [Google Scholar] [CrossRef] [Green Version]
- Koehnken, L. Mount Lyell remediation research and demonstration program-final report. Superv. Sci. Rep. 1997, 126, 104. [Google Scholar]
- Fergusson, L. A 12-month field trial to remediate an exposed “Tailings Beach” in Tasmania. Resour. Environ. 2014, 4, 238–245. [Google Scholar] [CrossRef]
- Tornos, F. Environment of formation and styles of volcanogenic massive sulfides: The Iberian pyrite belt. Ore Geol. Rev. 2006, 28, 259–307. [Google Scholar] [CrossRef]
- Essalhi, M.; Sizaret, S.; Barbanson, L.; Chen, Y.; Lagroix, F.; Demory, F.; Nieto, J.M.; Saez, R.; Capitan, M.A. A case study of the internal structures of gossans and weathering processes in the Iberian Pyrite Belt using magnetic fabrics and paleomagnetic dating. Miner. Depos. 2011, 46, 981–999. [Google Scholar] [CrossRef] [Green Version]
- Amils, R. Lessons learned from thirty years of geomicrobiological studies of Río Tinto. Res. Microbiol. 2016, 167, 539–545. [Google Scholar] [CrossRef]
- Sánchez España, J.; Pamo, E.L.; Santofimia, E.; Aduvire, O.; Reyes, J.; Barettino, D. Acid mine drainage in the Iberian Pyrite Belt (Odiel river watershed, Huelva, SW Spain): Geochemistry, mineralogy and environmental implications. Appl. Geochem. 2005, 20, 1320–1356. [Google Scholar] [CrossRef]
- Sarmiento, A.M.; Nieto, J.M.; Olías, M.; Cánovas, C.R. Hydrochemical characteristics and seasonal influence on the pollution by acid mine drainage in the Odiel river Basin (SW Spain). Appl. Geochem. 2009, 24, 697–714. [Google Scholar] [CrossRef]
- Olías, M.; Nieto, J.M.; Sarmiento, A.M.; Cánovas, C.R.; Galván, L. Water quality in the future Alcolea reservoir (Odiel River, SW Spain): A clear example of the inappropriate management of water resources in Spain. Water Resour. Manag. 2011, 25, 201–215. [Google Scholar] [CrossRef]
- Cánovas, C.R.; Olías, M.; Nieto, J.M. Metal (loid) attenuation processes in an extremely acidic river: The Rio Tinto (SW Spain). Water Air Soil Pollut. 2014, 225, 1795. [Google Scholar] [CrossRef]
- Ferris, F.; Hallbeck, L.; Kennedy, C.; Pedersen, K. Geochemistry of acidic Rio Tinto headwaters and role of bacteria in solid phase metal partitioning. Chem. Geol. 2004, 212, 291–300. [Google Scholar] [CrossRef]
- Cánovas, C.; Hubbard, C.; Olías, M.; Nieto, J.; Black, S.; Coleman, M.L. Hydrochemical variations and contaminant load in the Río Tinto (Spain) during flood events. J. Hydrol. 2008, 350, 25–40. [Google Scholar] [CrossRef]
- Nordstrom, D.; Wilde, F. Reduction–oxidation potential (electrode method). In National Field Manual for the Collection of Water Quality Data; Book 9, Chapter 6.5; US Geological Survey Techniques of Water-Resources Investigations; US Geological Survey: Reston, VA, USA, 1998; 20p. [Google Scholar]
- Walling, D.; Webb, B. Estimating the discharge of contaminants to coastal waters by rivers: Some cautionary comments. Mar. Pollut. Bull. 1985, 16, 488–492. [Google Scholar] [CrossRef]
- Quilbé, R.; Rousseau, A.N.; Duchemin, M.; Poulin, A.; Gangbazo, G.; Villeneuve, J.-P. Selecting a calculation method to estimate sediment and nutrient loads in streams: Application to the Beaurivage River (Québec, Canada). J. Hydrol. 2006, 326, 295–310. [Google Scholar] [CrossRef]
- Parkhurst, D.L.; Appelo, C. Description of Input and Examples for PHREEQC Version 3: A Computer Program for Speciation, Batch-Reaction, One-Dimensional Transport, and Inverse Geochemical Calculations; US Geological Survey: Reston, VA, USA, 2013; pp. 2328–7055.
- Allison, J.D.; Brown, D.S.; Novo-Gradac, K.J. MINTEQA2/PRODEFA2, A Geochemical Assessment Model for Environmental Systems: Version 3.0 User’s Manual; Environmental Research Laboratory Office of Research and Development; U.S. Environmental Protection Agency: Athens, GA, USA, 1991.
- Bigham, J.; Schwertmann, U.; Traina, S.; Winland, R.; Wolf, M. Schwertmannite and the chemical modeling of iron in acid sulfate waters. Geochim. Cosmochim. Acta 1996, 60, 2111–2121. [Google Scholar] [CrossRef]
- Yu, J.-Y.; Heo, B.; Choi, I.-K.; Cho, J.-P.; Chang, H.-W. Apparent solubilities of schwertmannite and ferrihydrite in natural stream waters polluted by mine drainage. Geochim. Cosmochim. Acta 1999, 63, 3407–3416. [Google Scholar] [CrossRef]
- Elghali, A.; Benzaazoua, M.; Bussière, B.; Genty, T. Spatial mapping of acidity and geochemical properties of oxidized tailings within the former Eagle/Telbel mine site. Minerals 2019, 9, 180. [Google Scholar] [CrossRef] [Green Version]
- Dmitrijeva, M.; Cook, N.J.; Ehrig, K.; Ciobanu, C.L.; Metcalfe, A.V.; Kamenetsky, M.; Kamenetsky, V.S.; Gilbert, S. Multivariate statistical analysis of trace elements in pyrite: Prediction, bias and artefacts in defining mineral signatures. Minerals 2020, 10, 61. [Google Scholar] [CrossRef] [Green Version]
- Cánovas, C.; Olías, M.; Nieto, J.; Galván, L. Wash-out processes of evaporitic sulfate salts in the Tinto river: Hydrogeochemical evolution and environmental impact. Appl. Geochem. 2010, 25, 288–301. [Google Scholar] [CrossRef]
- Valente, T.M.; Gomes, C.L. Occurrence, properties and pollution potential of environmental minerals in acid mine drainage. Sci. Total Environ. 2009, 407, 1135–1152. [Google Scholar] [CrossRef] [Green Version]
- Carbone, C.; Dinelli, E.; Marescotti, P.; Gasparotto, G.; Lucchetti, G. The role of AMD secondary minerals in controlling environmental pollution: Indications from bulk leaching tests. J. Geochem. Explor. 2013, 132, 188–200. [Google Scholar] [CrossRef]
- Casiot, C.; Morin, G.; Juillot, F.; Bruneel, O.; Personné, J.C.; Leblanc, M.; Duquesne, K.; Bonnefoy, V.; Elbaz-Poulichet, F. Bacterial immobilization and oxidation of arsenic in acid mine drainage (Carnoulès creek, France). Water Res. 2003, 37, 2929–2936. [Google Scholar] [CrossRef]
- Fukushi, K.; Sasaki, M.; Sato, T.; Yanase, N.; Amano, H.; Ikeda, H. A natural attenuation of arsenic in drainage from an abandoned mine dump. Appl. Geochem. 2003, 18, 1267–1278. [Google Scholar] [CrossRef]
- Olías, M.; Riera, J.; Galván, L.; Cánovas, C.R.; Pérez-López, R.; Macías, F.; Sarmiento, A.M.; Cruz, P.; Carrero, S.; Bonnail, E.; et al. Obtención de los parámetros hidrodinámicos en un tramo del río Odiel (Huelva) mediante un ensayo de trazadores. In Proceedings of the IX Simposio sobre el Agua en Andalucía, Málaga, Spain, 4–6 November 2015; pp. 1123–1133. [Google Scholar]
- Hubbard, C.G.; Black, S.; Coleman, M.L. Aqueous geochemistry and oxygen isotope compositions of acid mine drainage from the Río Tinto, SW Spain, highlight inconsistencies in current models. Chem. Geol. 2009, 265, 321–334. [Google Scholar] [CrossRef]
- Byrne, P.; Reid, I.; Wood, P.J. Stormflow hydrochemistry of a river draining an abandoned metal mine: The Afon Twymyn, central Wales. Environ. Monit. Assess. 2013, 185, 2817–2832. [Google Scholar] [CrossRef]
- Alpers, C.N.; Nordstrom, D.K.; Thompson, J.M. Seasonal variations of Zn/Cu ratios in acid mine water from Iron Mountain, California. In Environmental Geochemistry of Sulfide Oxidation; Alpers, C.N., Blowes, D.W., Eds.; American Chemical Society: New York, NY, USA, 1994; pp. 324–344. [Google Scholar]
- Runkel, R.L.; Kimball, B.A.; Nimick, D.A.; Walton-Day, K. Effects of flow regime on metal concentrations and the attainment of water quality standards in a remediated stream reach, Butte, Montana. Environ. Sci. Technol. 2016, 50, 12641–12649. [Google Scholar] [CrossRef]
- Accornero, M.; Marini, L.; Ottonello, G.; Zuccolini, M.V. The fate of major constituents and chromium and other trace elements when acid waters from the derelict Libiola mine (Italy) are mixed with stream waters. Appl. Geochem. 2005, 20, 1368–1390. [Google Scholar] [CrossRef]
- Regenspurg, S.; Peiffer, S. Arsenate and chromate incorporation in schwertmannite. Appl. Geochem. 2005, 20, 1226–1239. [Google Scholar] [CrossRef]
- Choppala, G.; Burton, E.D. Chromium (III) substitution inhibits the Fe (II)-accelerated transformation of schwertmannite. PLoS ONE 2018, 13, e0208355. [Google Scholar] [CrossRef] [PubMed] [Green Version]
- Abramov, S.M.; Tejada, J.; Grimm, L.; Schädler, F.; Bulaev, A.; Tomaszewski, E.J.; Byrne, J.M.; Straub, D.; Thorwarth, H.; Amils, R. Role of biogenic Fe (III) minerals as a sink and carrier of heavy metals in the Rio Tinto, Spain. Sci. Total Environ. 2020, 718, 137294. [Google Scholar] [CrossRef] [PubMed]
- Cánovas, C.R.; Olias, M.; Vazquez-Suñé, E.; Ayora, C.; Nieto, J.M. Influence of releases from a fresh water reservoir on the hydrochemistry of the Tinto River (SW Spain). Sci. Total Environ. 2012, 416, 418–428. [Google Scholar] [CrossRef] [PubMed]
- Younger, P.L. The longevity of minewater pollution: A basis for decision-making. Sci. Total Environ. 1997, 194, 457–466. [Google Scholar] [CrossRef]


| Statistic | pH | EC | Eh | Al | Ca | Cu | Fe | K | Mg | Mn | Na |
| mS/cm | mV | mg/L | mg/L | mg/L | mg/L | mg/L | mg/L | mg/L | mg/L | ||
| Mean | 2.74 | 3.54 | 740 | 166 | 63 | 29 | 377 | 1.6 | 178 | 16 | 34 |
| Median | 2.70 | 2.21 | 730 | 65 | 25 | 15 | 145 | 1.3 | 67 | 5.3 | 18 |
| 25th percentile | 2.47 | 1.02 | 665 | 18 | 13 | 4.1 | 26 | 1.0 | 20 | 1.5 | 11 |
| 75th percentile | 3.02 | 4.98 | 794 | 209 | 100 | 40 | 674 | 1.9 | 250 | 22 | 50 |
| Min. | 2.12 | 0.38 | 536 | 4.6 | 8.8 | 1.3 | 0.3 | <0.5 | 9.2 | 0.6 | 7.4 |
| Max. | 4.22 | 11.42 | 892 | 740 | 219 | 115 | 1529 | 9.1 | 731 | 66 | 310 |
| Statistic | SO4 | Si | Zn | As | Ba | Cd | Co | Cr | Ni | Pb | Sr |
| mg/L | mg/L | mg/L | μg/L | μg/L | μg/L | μg/L | μg/L | μg/L | μg/L | μg/L | |
| Mean | 2888 | 19 | 45 | 374 | 15 | 144 | 890 | 42 | 218 | 166 | 159 |
| Median | 1123 | 7.2 | 16 | 33 | 13 | 51 | 412 | 9.3 | 65 | 110 | 63 |
| 25th percentile | 347 | 5.0 | 4.4 | 5.1 | 8.4 | 14 | 101 | 2.3 | 19 | 71 | 37 |
| 75th percentile | 4221 | 24 | 62 | 344 | 17 | 187 | 1294 | 72 | 340 | 205 | 223 |
| Min. | 124 | 2.9 | 1.2 | 0.3 | <1 | 5.1 | 34 | <0.2 | 6.8 | 19 | 25 |
| Max. | 12,156 | 96 | 205 | 3309 | 54 | 739 | 5332 | 225 | 1065 | 1068 | 708 |
| Median | Element/Compound |
|---|---|
| >98% | Al, Ca, Cd, Co, Cu, Mg, Mn, Na, Ni, SO4, Sr, Zn |
| 90‒98% | K, Si |
| 70‒90% | Cr, Pb |
| 50‒70% | Fe |
| 30‒50% | Ba |
| <10% | As |
| Element | Tons | Element | Tons |
|---|---|---|---|
| Al | 2593 | Fe | 4963 |
| As | 3.6 | Mn | 234 |
| Cd | 2.1 | Ni | 3.0 |
| Co | 15 | Pb | 15 |
| Cr | 0.44 | SO4 | 49,420 |
| Cu | 556 | Zn | 683 |
| Statistic | pH | EC | Cu | Fe | Mn | SO4 | Zn | As | Cd | Pb |
|---|---|---|---|---|---|---|---|---|---|---|
| mS/cm | mg/L | mg/L | mg/L | mg/L | mg/L | μg/L | μg/L | μg/L | ||
| Mean | 2.6 | 3.5 | 28 | 413 | 13 | 2801 | 63 | 1153 | 278 | 205 |
| Median | 2.5 | 3.0 | 20 | 219 | 9 | 1946 | 39 | 90 | 160 | 120 |
| 25th percentile | 2.4 | 2.0 | 12 | 107 | 5 | 1076 | 18 | 16 | 82 | 74 |
| 75th percentile | 2.7 | 4.6 | 31 | 491 | 15 | 3511 | 70 | 550 | 290 | 207 |
| Min. | 1.7 | 0.2 | 0.02 | 0.02 | 0.09 | 58 | 0.02 | <dl | <dl | <dl |
| Max. | 6.8 | 15 | 365 | 5080 | 113 | 25,256 | 730 | 50,000 | 5340 | 1630 |
© 2020 by the authors. Licensee MDPI, Basel, Switzerland. This article is an open access article distributed under the terms and conditions of the Creative Commons Attribution (CC BY) license (http://creativecommons.org/licenses/by/4.0/).
Share and Cite
Olías, M.; Cánovas, C.R.; Macías, F.; Basallote, M.D.; Nieto, J.M. The Evolution of Pollutant Concentrations in a River Severely Affected by Acid Mine Drainage: Río Tinto (SW Spain). Minerals 2020, 10, 598. https://0-doi-org.brum.beds.ac.uk/10.3390/min10070598
Olías M, Cánovas CR, Macías F, Basallote MD, Nieto JM. The Evolution of Pollutant Concentrations in a River Severely Affected by Acid Mine Drainage: Río Tinto (SW Spain). Minerals. 2020; 10(7):598. https://0-doi-org.brum.beds.ac.uk/10.3390/min10070598
Chicago/Turabian StyleOlías, Manuel, Carlos R. Cánovas, Francisco Macías, María Dolores Basallote, and José Miguel Nieto. 2020. "The Evolution of Pollutant Concentrations in a River Severely Affected by Acid Mine Drainage: Río Tinto (SW Spain)" Minerals 10, no. 7: 598. https://0-doi-org.brum.beds.ac.uk/10.3390/min10070598