Viscosity and Strength Properties of Cemented Tailings Backfill with Fly Ash and Its Strength Predicted


1
School of Civil and Resources Engineering, University of Science and Technology Beijing, Beijing 100083, China
2
State Key Laboratory of High-Efficient Mining and Safety of Metal Mines of Ministry of Education, University of Science and Technology Beijing, Beijing 100083, China
*
Authors to whom correspondence should be addressed.
Minerals 2021, 11(1), 78; https://0-doi-org.brum.beds.ac.uk/10.3390/min11010078
Submission received: 19 November 2020
/
Revised: 13 December 2020
/
Accepted: 20 December 2020
/
Published: 15 January 2021
(This article belongs to the Section Mineral Processing and Extractive Metallurgy)
Abstract
:It is of great significance to study the effect of solid contents (SC), binder-to-tailings (b/t) ratio, types and dosage of fly ash (FA) on the viscosity (V) and uniaxial compressive strength (UCS) of backfill. It can improve filling efficiency and reduce filling costs to understand the relationship between SC, b/t ratio, FA dosage and viscosity, and UCS of backfill. Consequently, this paper carried out uniaxial compression tests and rheological tests on five different types of backfill specimens. Experimental results indicate that, with the increase of SC, the viscosity and UCS of all backfill samples increases as a power function. With the decrease of b/t ratio, the viscosity and UCS of all backfill samples decreases as an exponential function. The coupling effect of SC and b/t ratio has a great influence on the viscosity and UCS of backfill samples. The relationship between SC, b/t ratio and viscosity, and UCS is a quadratic polynomial function. The order of the viscosity of the backfill slurry is: pure tailings < backfill slurry mixed with Ordinary Portland Cement (OPC) < backfill slurry mixed with FA1 < backfill slurry mixed with FA2. The higher the FA dosage, the greater the viscosity. The order of the UCS of backfill is: backfill with OPC > backfill with FA1 > backfill with FA2. The higher the FA dosage, the smaller the UCS. The UCS of all backfill samples increased with the increase of curing time (CT). The relations between the viscosity and UCS of backfill present the positively linear functions. It is feasible to use viscosity to predict the UCS of backfill, and the error between the UCS predicted value and the test value is mostly controlled within 10%. Ultimately, the findings of the experimental work will provide a scientific reference for the mine to design the strength of the backfill.
1. Introduction
At present, underground mining is the main way for humans to obtain metal mineral resources [1,2]. Usually, the ore is separated from the rock by blasting or mechanical cutting to form goaf [3]; after that, useful metal elements are extracted through crushing, grinding, flotation and other processes, and a large number of tailings wastes are formed, the special tailings ponds are needed to store the tailings [4]. If not treated in a timely manner, these tailings will cause serious land pollution, water pollution, and even lead to serious dam break accidents [5,6]. At the same time, if the goaf formed by underground mining is not backfilled, in time this may lead to the collapse of surrounding rocks, induce surface deformation, and seriously threaten the safety of underground workers and equipment [7,8]. In order to solve the above problems, a filling method arose at a historic moment [9,10]; the tailings are filled to the underground goaf after certain treatment in this method [11,12], and by the filling method, can eliminate the surface subsidence, improve mine safety, increase productivity, create a safe working environment, and provide a reasonable use of tailings, achieving the goal of recycling [13,14,15].
At present, cemented tailings backfill has become the main method for goaf filling [16,17,18]. First, the tailing slurry is dehydrated to achieve a concentration of 60%~75% [19], and then, according to the design ratio, it is mixed and stirred with a binder to form a cementing filling slurry. The formed cemented filling slurry is usually transported to the underground goaf by gravity or pump [20,21,22], when it enters the goaf, the filling slurry will gradually hydrate, solidify and produce strength to support the surrounding rock [23,24,25]. Therefore, the fluidity and strength after curing of filling slurry are the two key contents of the technology; viscosity is an important parameter to characterize the fluidity and workability of the slurry [26,27,28] and uniaxial compressive strength is one of the key parameters for filling slurry ratio design [29,30]. Many scholars have carried out a lot of research on slurry viscosity, strength characteristics and influencing factors. Studies mainly focus on the factors of tailings characteristics (type, grade, concentration, Ph, etc.) [31,32,33,34], curing conditions (curing humidity, temperature, time, stratification, etc.) [35,36,37,38], gelled material (type, particle size, composition, etc.) [39,40,41,42] and admixture (flocculating agent, water reducing agent, fiber, etc.) [43,44,45] on the influence law of the fluidity, the viscosity and the backfill uniaxial compressive strength. Studies have shown that the particle sizes of tailings and binder have significant influences on the fluidity and compressive strength, within a certain range of particle sizes, and cemented tailings backfill (CTB) with fine particle sizes shows higher yield stress but lower viscosity [46]. Generally, in practical engineering, in order to ensure the filling effect of goaf, a standard sample shall be prepared before filling, and a mechanical test shall be carried out after curing for 3, 7, and 28d, which requires a long time, complicated technology and many interference factors [47,48,49,50]. The viscosity test is more simple, timely and can get the results quickly. Previous studies have shown that the compressive strength and viscosity are closely related to the properties of tailings and binder [31,32,33,34,35,36,37,40,41,42,43,44,45] if the compressive strength can be predicted by viscosity, it is of great significance for practical engineering. However, the relationship between viscosity and compressive strength is still less studied.
The type and amount of binder not only affect the properties of backfill, but also have an important impact on the economy. At present, ordinary Portland cement is the most commonly used binder, although ordinary Portland cement has many advantages, its cost is high, accounting for 60–75% of the whole filling cost [51]. Therefore, the search for substitutes for Portland cement has become a research hotspot in recent years, among which fly ash is one of the most commonly used substitutes for ordinary Portland cement [52,53,54]. Many researchers around the world have studied the partial replacement of OPC by fly ash; however, due to the different physical and chemical properties of tailings in different mines, these properties directly affect the mechanical properties and strength development of filling materials. In particular, fly ash particle size plays a major role in the fluidity and strength development of filler slurry [55,56,57].
In this paper, the tailings of an iron mine in China are selected as the experimental objects, OPC and two types of FA replace part of OPC are used as the binder, the influence pattern of different factors on the viscosity and compressive strength is studied by using the control variable method, and the quantitative function formula is established. On this basis, the relationship between viscosity and compressive strength is studied, and then the strength prediction formula of backfill based on viscosity is proposed. The research results of this paper are of great significance for cementing backfill design, cost control, and strength prediction.
2. Materials and Methods
2.1. Experimental Materials and Characteristics
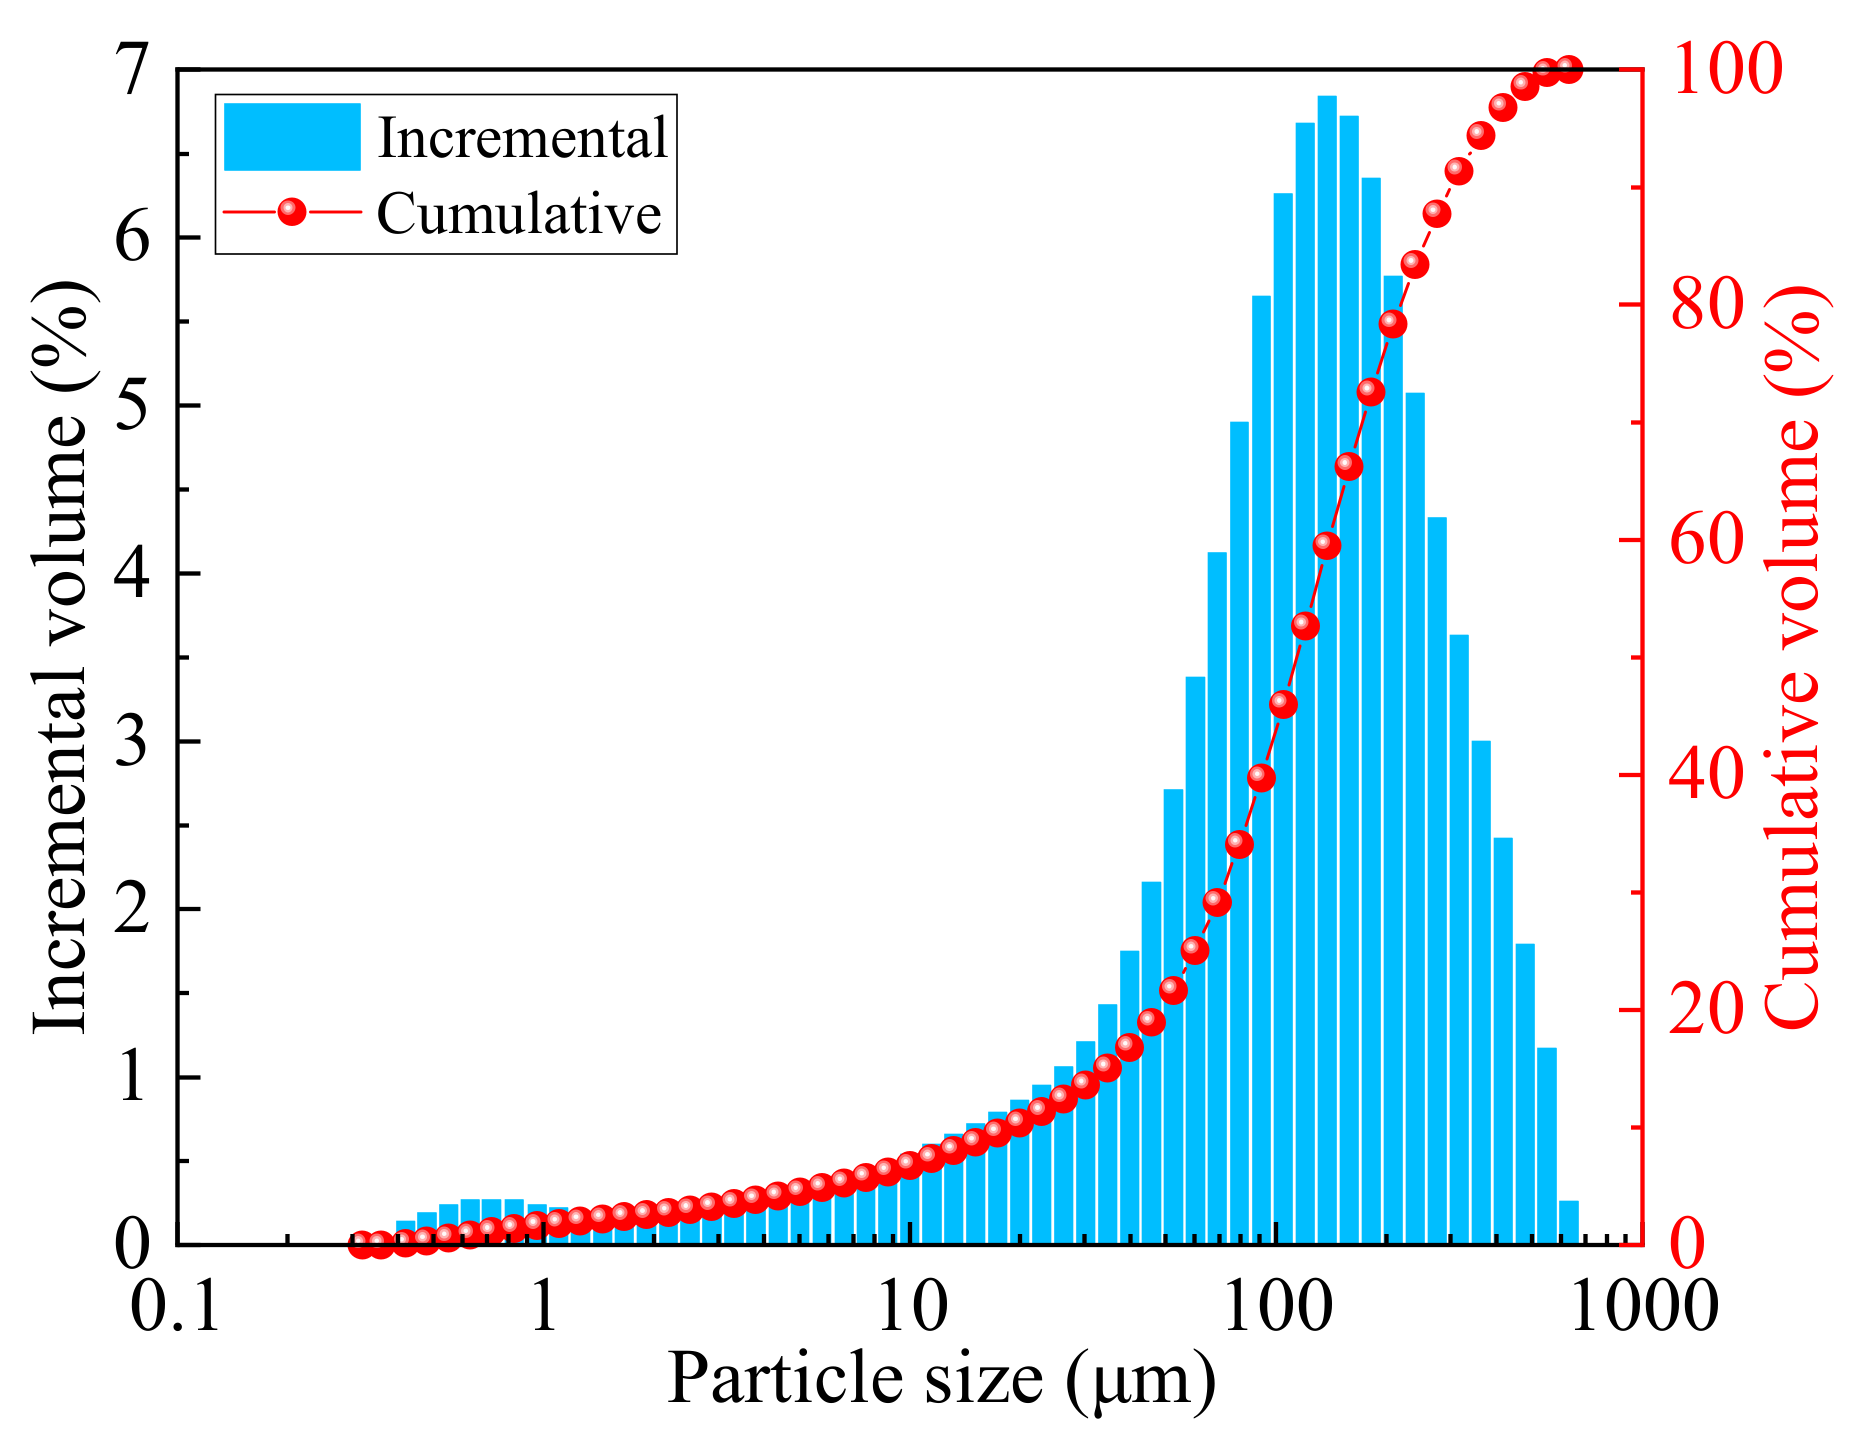
The tailings of this experiment come from an iron mine in China. SA-CP3 equipment was used to measure the particle size of tailings, and the particle size distribution curve of tailings is shown in Figure 1. The tailings of d10 = 25.07 μm, d50 = 122.08 μm, and d90 = 288.60 μm. The results of the particle size distribution of tailings show that the grading degree is good.
In China, the price of cement is 350–400 ¥/t, and the cost of cement accounts for 70–80% of the whole filling cost. Considering the high cost of cement, the mine adopts the fly ash with a lower price to replace part of the cement to reduce the filling cost. In order to be consistent with the actual filling of the mine, three kinds of cementitious agents were used in this test, which is OPC, fly ash 1 (FA1), and fly ash 2 (FA2). The physical and chemical properties of OPC are shown in the literature [26]. The main physical properties of tailings, FA1, and FA2 were measured according to the geotechnical test specification [54], and the results are shown in Table 1. The density and bulk density of FA1 is smaller than that of FA2, but the porosity of FA1 is larger than that of FA2.
The main chemical components of tailings, FA1, and FA2 are obtained by XRD diffraction phase analysis. The results are shown in Table 2. The main components of tailings are Ca and Mg, accounting for 24.99% and 10.30%, respectively. The main components of FA1 are Si, Fe, and Al, accounting for 16.19%, 15.7%, and 13.2%, respectively. The main components of FA2 are Ca and Si, accounting for 35.20% and 16.35%, respectively.
The mine uses tap water as the mixing water. The main components of tap water in different places are not much different. It is more convenient to use laboratory tap water to carry out the test and there will be no big error in the test result.
2.2. Experiment Scheme Design
Five types of backfill were designed in this experiment. CTB: Cemented tailings backfill, and all of the binder is OPC. CFTB1-1: Cemented fly ash tailings backfill, and the binder is OPC and FA1, in which OPC: FA1 = 0.8:0.2. CFTB1-2: Cemented fly ash tailings backfill, and the binder is OPC and FA1, in which OPC: FA1 = 0.5:0.5. CFTB2-1: Cemented fly ash tailings backfill, and the binder is OPC and FA2, in which OPC: FA2 = 0.8:0.2. CFTB2-2: Cemented fly ash tailings backfill, and the binder is OPC and FA2, in which OPC: FA2 = 0.5:0.5. All types of backfill samples have solid content (SC) of 66%, 68%, 70%, and 72% and b/t ratios of 1:4, 1:6, 1:8, 1:10, and 1:12. The test scheme is shown in Table 3.
2.3. Viscosity Testing
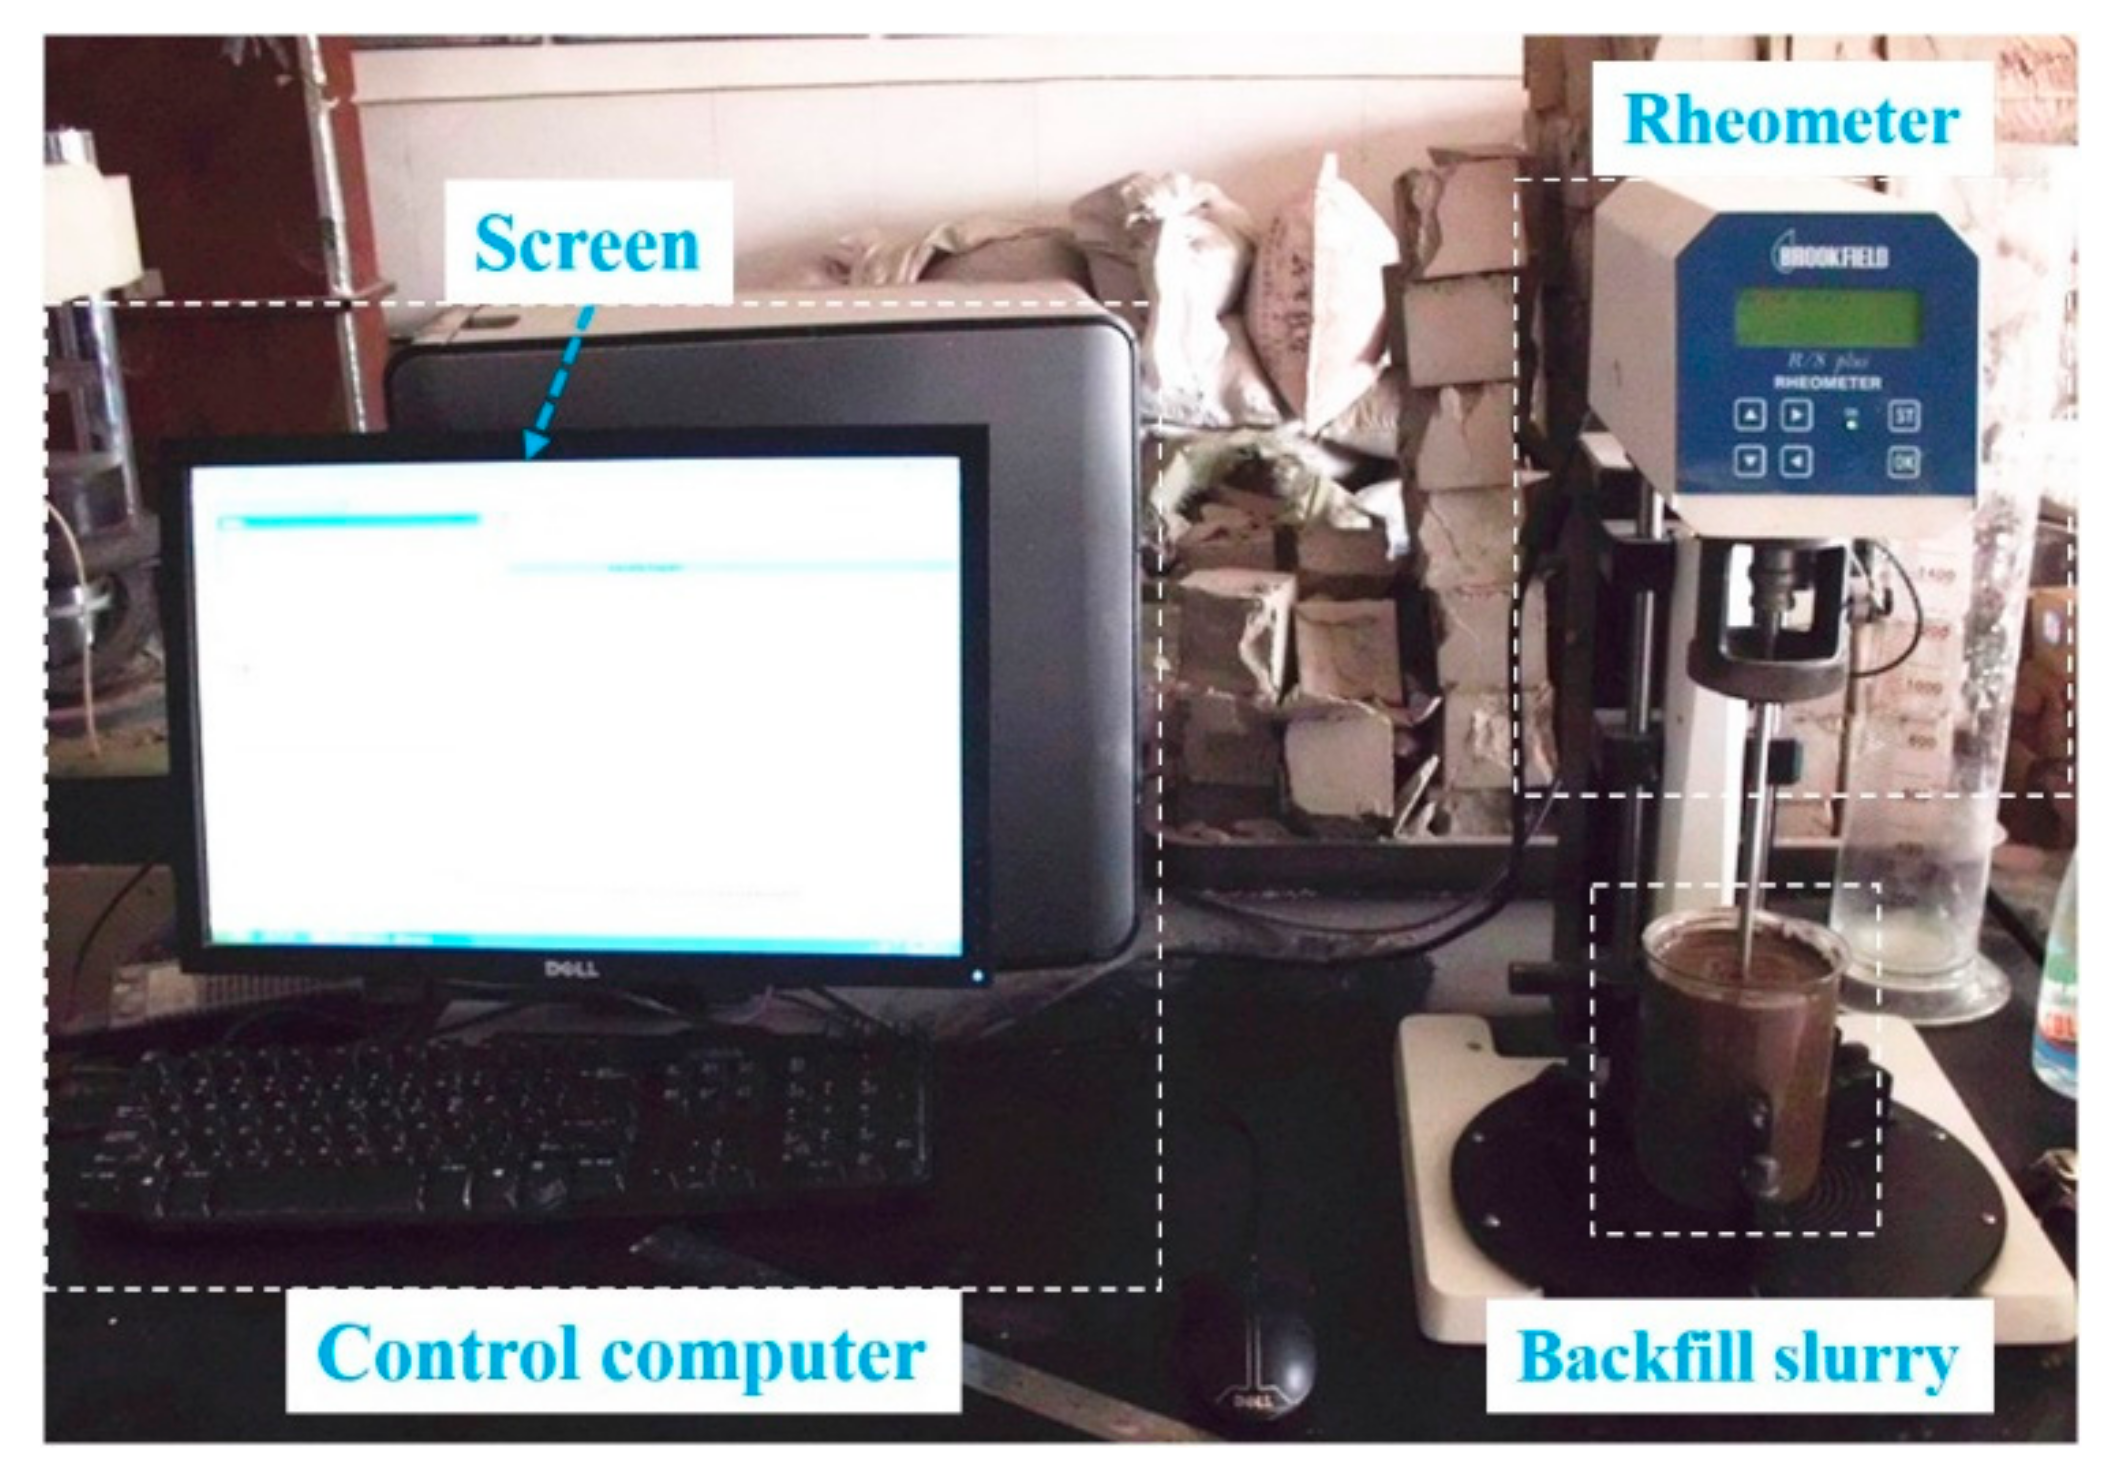
Viscosity is one of the important rheological parameters of backfill. To investigate the viscosity of backfill samples at different SC and b/t ratios, a Brookfield R/S + SST (soft solid tester) rotational rheometer with a vane geometry was used with optional Rheo3000 software (AMETEK Brookfield, Middleborough, MA, USA), as shown in Figure 2. The tailings, cement, fly ash, and water were weighed according to the requirements of the test ratio. First, the tailings and binder were poured into the glass and mixed well, then water was added to mix. The mixing time should not be less than 5 min. Finally, the well-stirred slurry was placed under the viscometer, and the computer program was started to carry out the viscosity test. After the test, the viscosity result is automatically displayed on the screen.
2.4. Uniaxial Compressive Testing
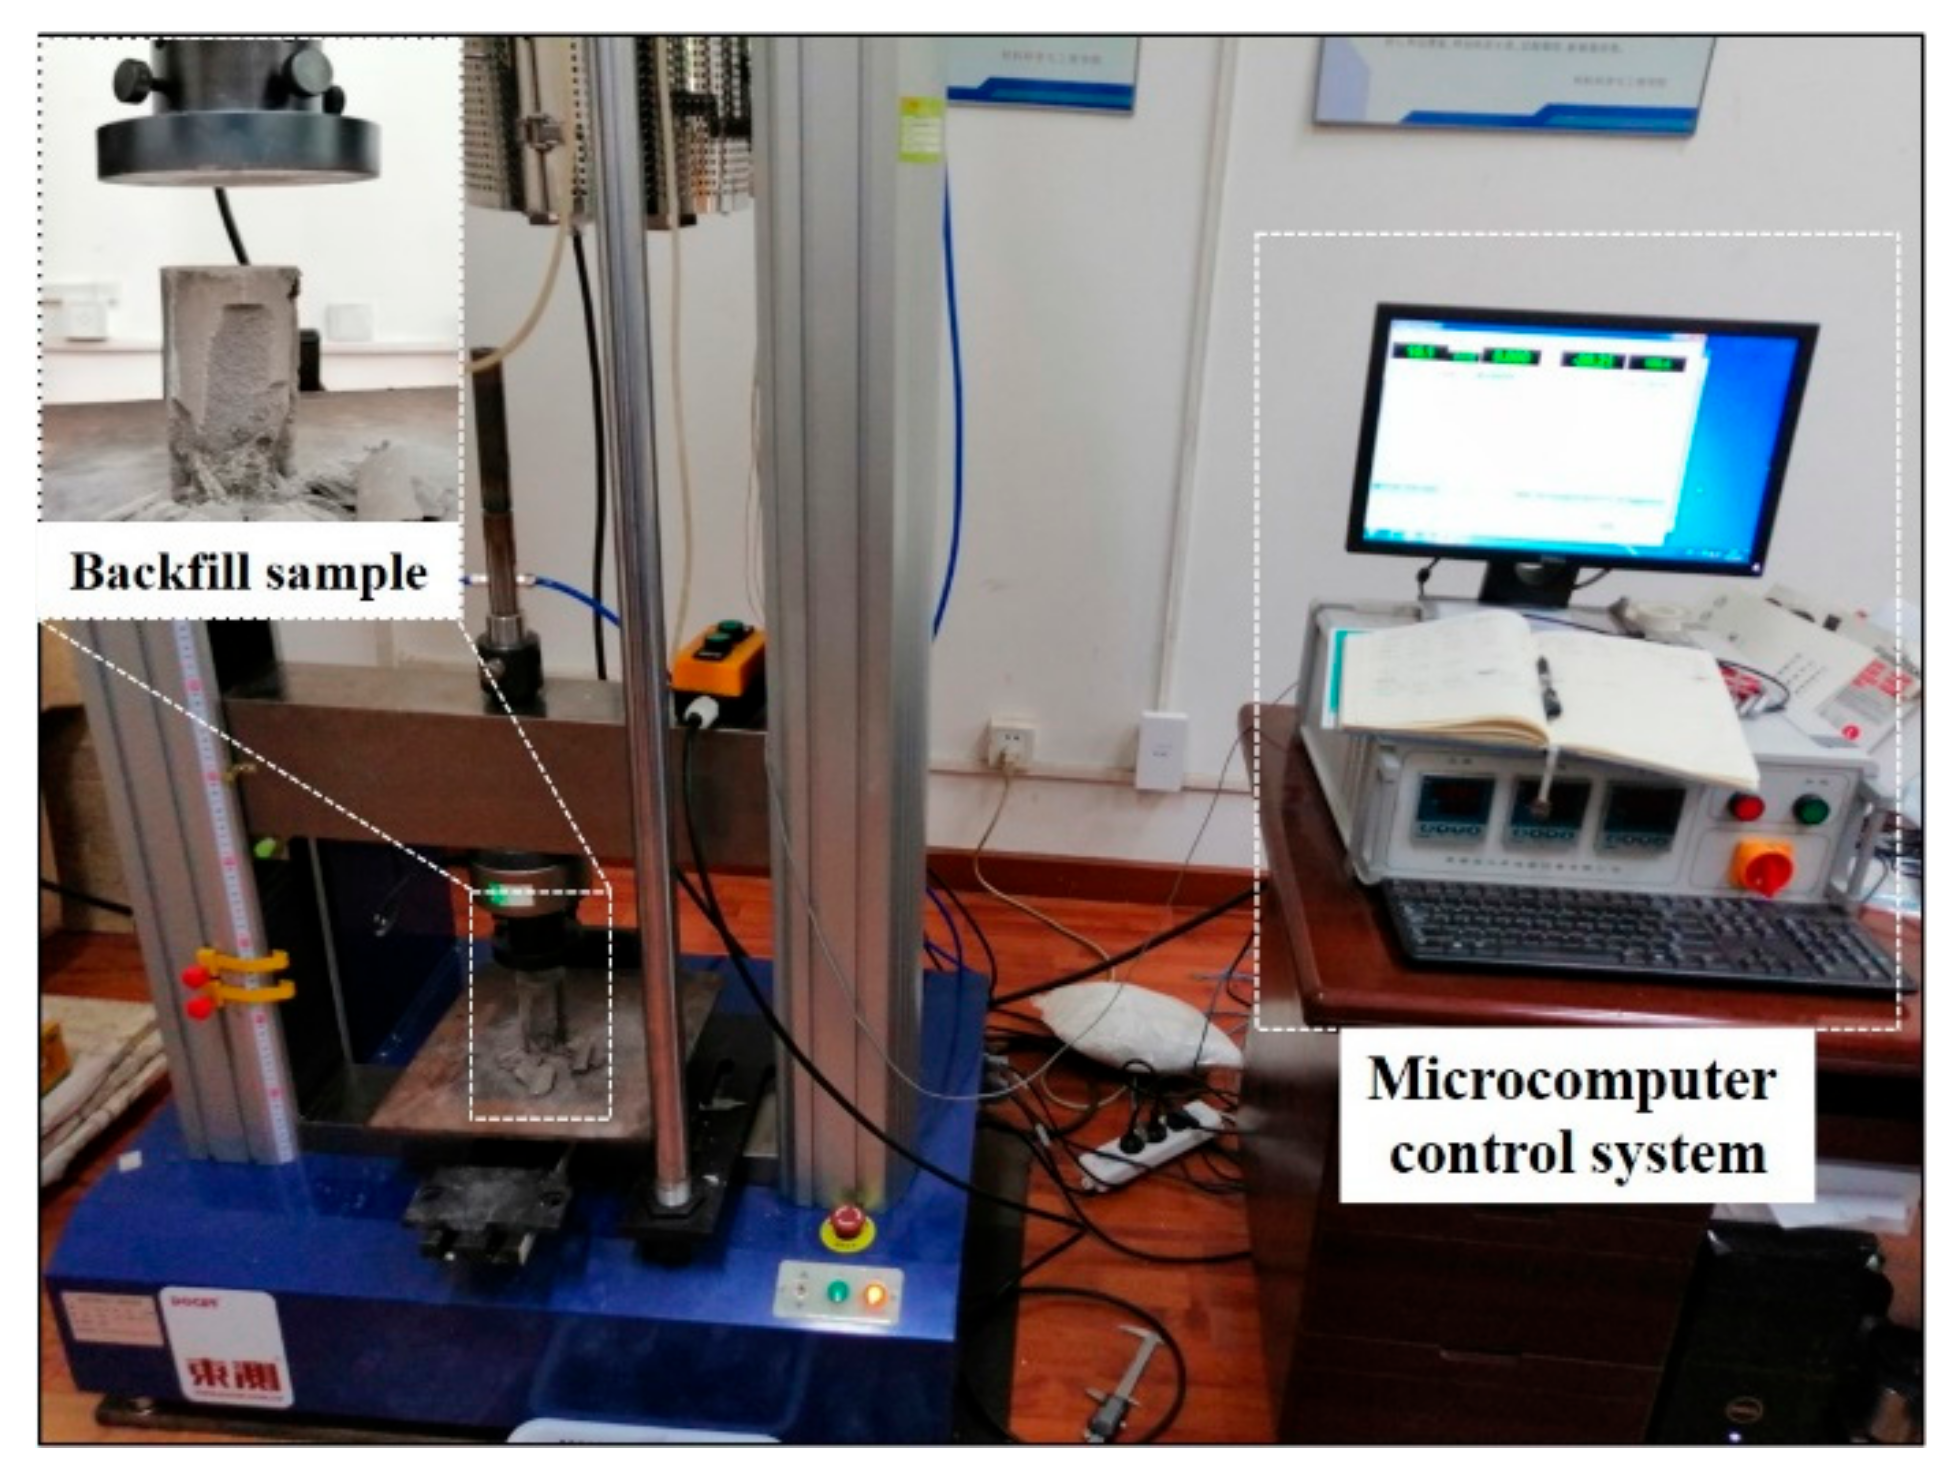
The uniaxial compressive strength of backfill is one of the most important mechanical parameters. In this study, the DONGCE microcomputer-controlled servo test system (Figure 3) was used to carry out the uniaxial compressive test on backfill with SC of 66%, 68%, 70%, and 72%, curing time (CT) of 7d, 14d, and 28d, and b/t ratio of 1:4, 1:6, 1:8, 1:10, and 1:12.
3. Results and Discussion
3.1. Viscosity Results of Different Types of Backfill Samples
Viscosity is one of the important rheological parameters of the backfill. Backfill viscosity is closely related to the b/t ratio, SC, and binder type. An in-depth understanding of the viscosity characteristics of the backfill is essential for the rational arrangement of the filling pipeline, the reasonable design of the pumping pressure, and the prediction of the settlement behavior of the backfill slurry. Table 4 shows the viscosity results of different types of backfill samples.
3.1.1. Viscosity Analysis of Different Type Backfill Samples
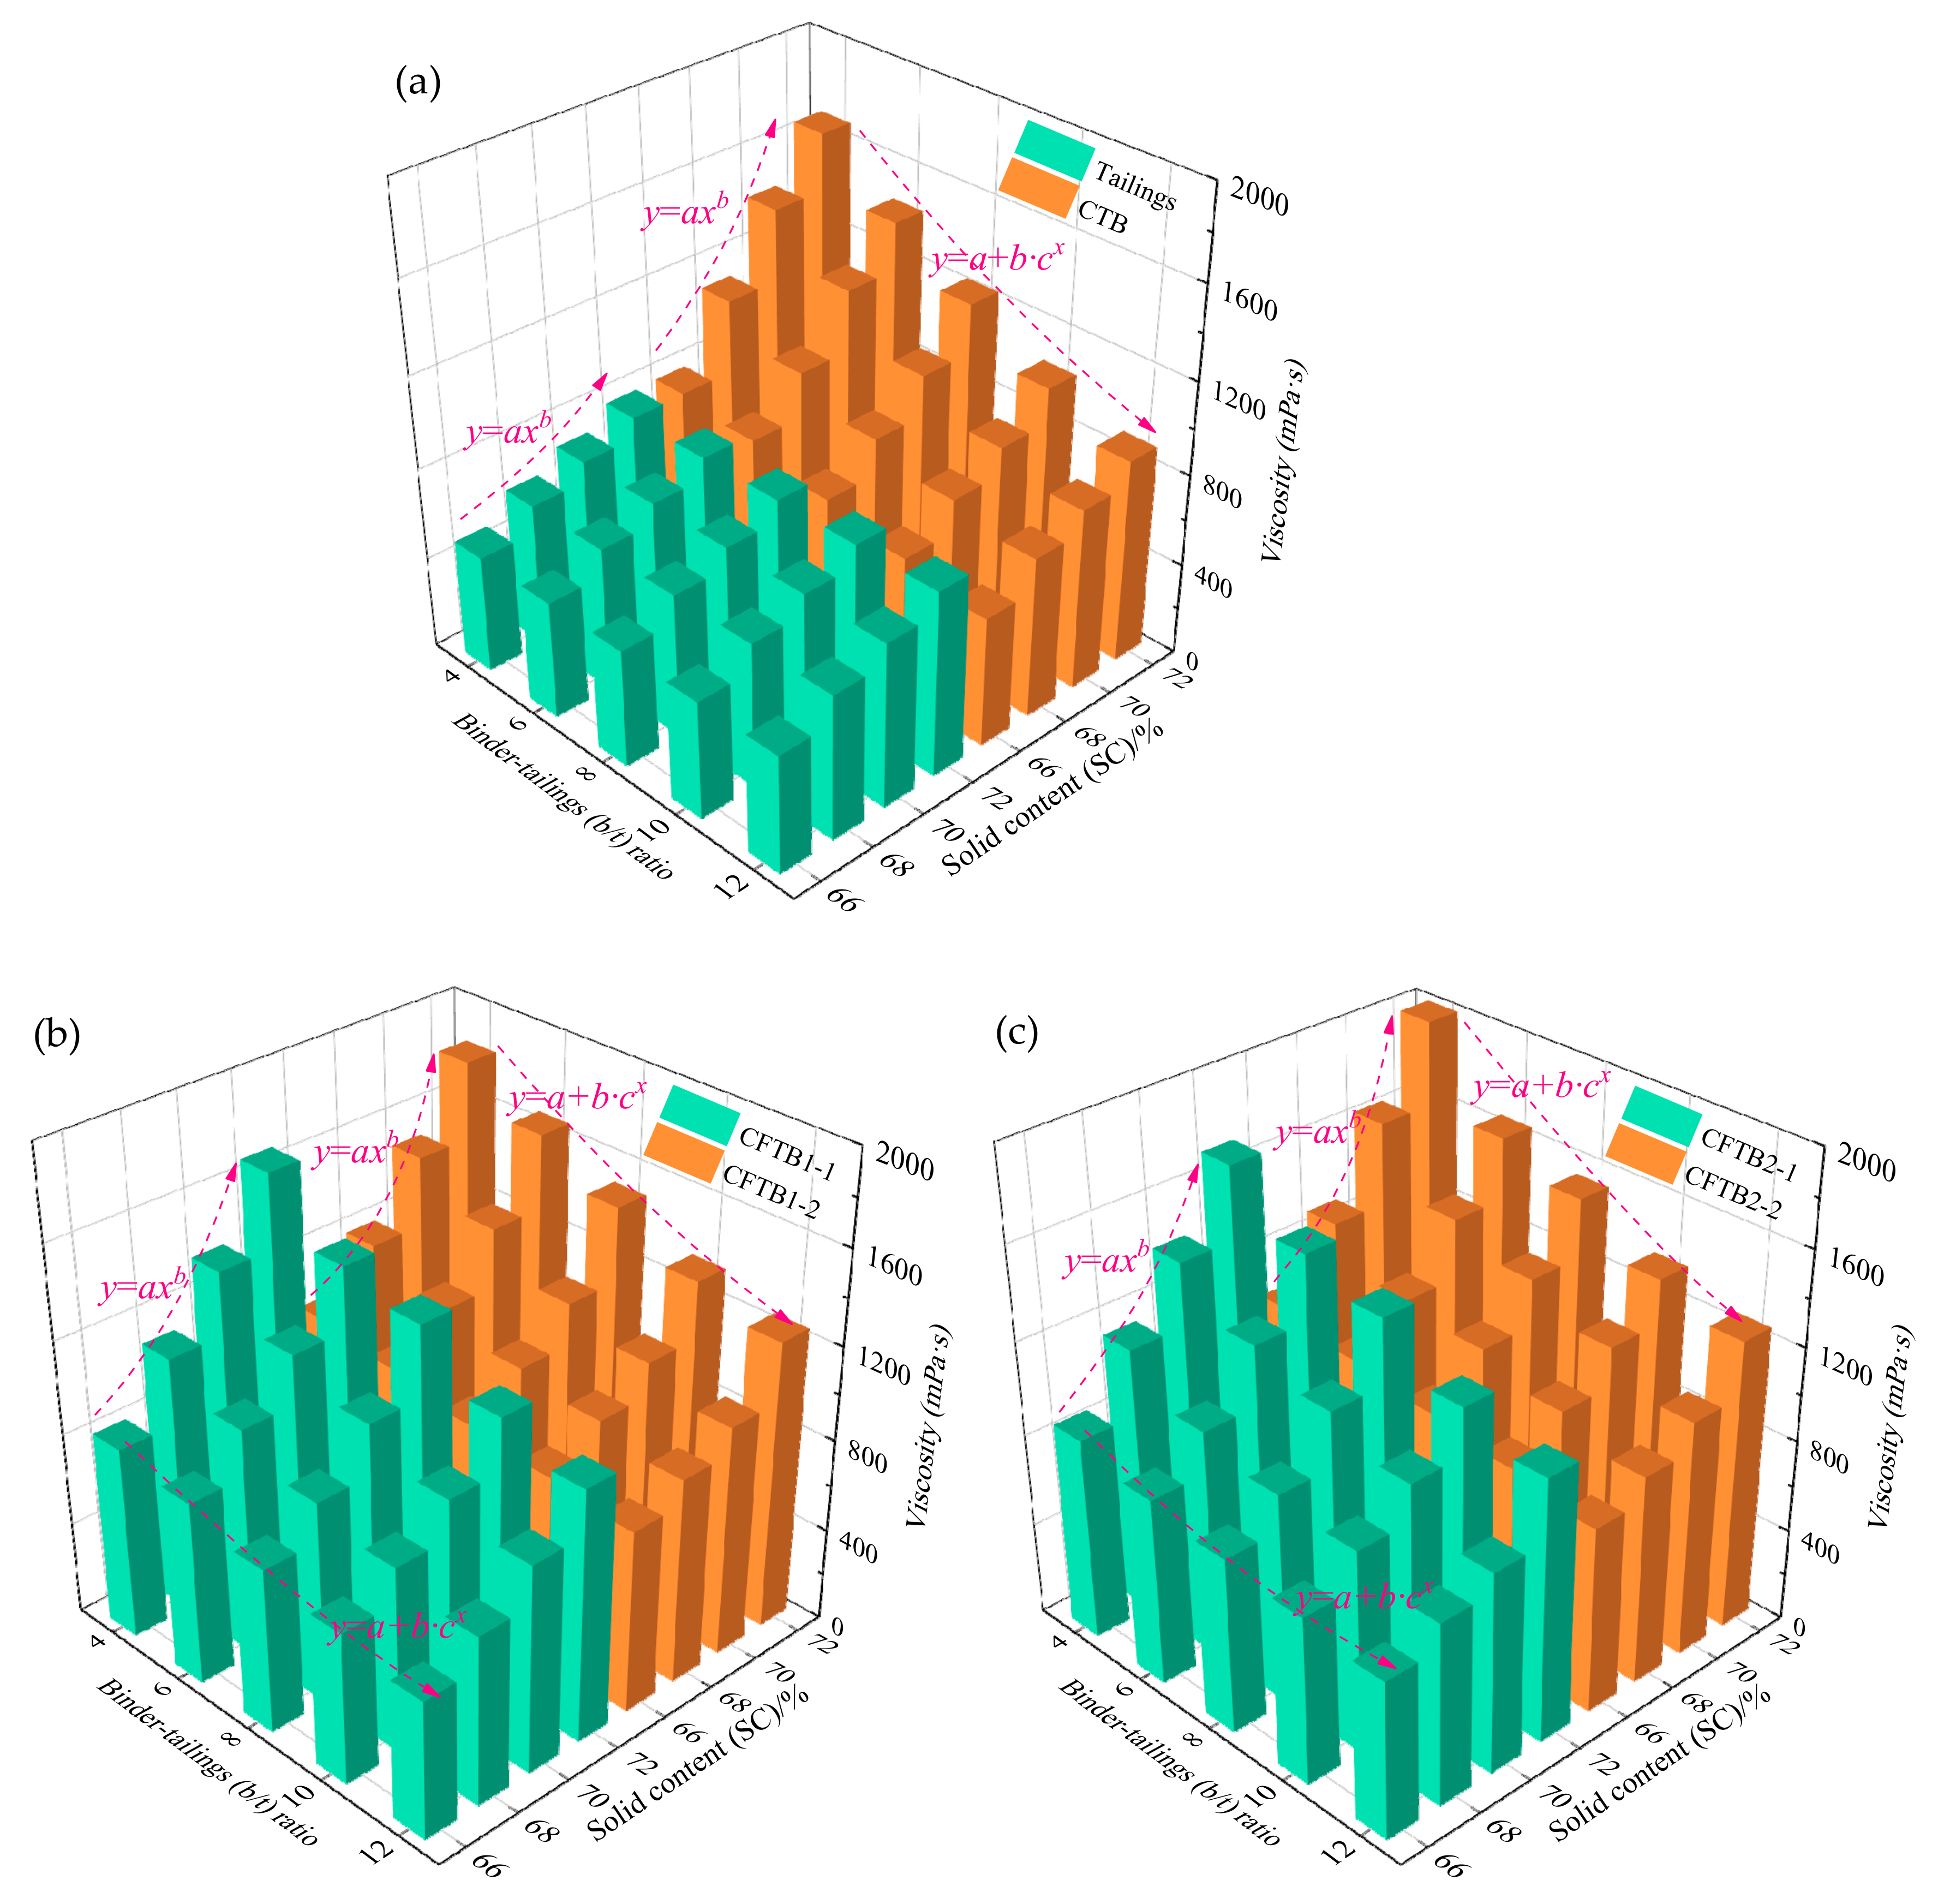
In order to accurately obtain the relationship between the backfill’s viscosity, SC, and b/t ratio, the control variable method is adopted, and only one variable is changed while other parameters are kept unchanged. Figure 4 shows the columnar relationship between the different types of backfills’ viscosity, SC, and b/t ratio.
Figure 4a shows the columnar relationship between the viscosity of pure tailings sample and SC, and the columnar relationship between the viscosity of CTB sample, SC, and b/t ratio. Observing the green cube column, the viscosity of pure tailings sample increases with the increase of SC as a power function. When SC is 66%, the viscosity is 512 mPa·s; when SC is increased to 68%, the viscosity increases to 629 mPa·s, the growth rate is 22.9%; when SC increases to 70% and 72%, respectively, the viscosity increased to 715 and 805 mPa·s, respectively, the growth rate was 39.6% and 57.2%. Observing the yellow cube column, the viscosity of the CTB sample increases as the SC increases with a power function, and decreases as the b/t ratio decreases with an exponential function. Taking a b/t ratio of 1:4 as an example, when the SC is 66%, the CTB viscosity is 810 mPa·s; when the SC is increased to 68%, 70%, and 72%, respectively, the CTB viscosity is increased to 1123, 1432, and 1675 mPa·s, respectively, with growth rates of 38.6%, 76.8%, and 106.8%, respectively. Taking SC of 68% as an example, when the b/t ratio is 1:4, the CTB viscosity is 1123 mPa·s; when the b/t ratio is reduced to 1:6, the CTB viscosity is reduced to 967 mPa·s, the reduction rate is 13.9%; when the b/t ratio is reduced to 1:8, 1:10, and 1:12, respectively, the CTB viscosity is reduced to 848, 765, and 701 mPa·s, respectively, the reduction rate is 24.5%, 31.9%, and 37.7%, respectively.
Figure 4b shows the columnar relationship between the viscosity of CFTB1-1and CFTB1-2, SC, and b/t ratio. Observing the green cube column, it can be seen that the viscosity of the CFTB1-1 increases as the SC increases with a power function, and as the b/t ratio decreases with an exponential function. Keeping the b/t ratio of 1:4 constant, when SC is 66%, CFTB1-1 viscosity is 836 mPa·s; with an increase in SC to 68%, 70%, and 72%, respectively, CFTB1-1 viscosity increases to 1117, 1383, and 1698 mPa·s, respectively, with growth rates of 30.4%, 65.4%, and 103.1%, respectively. Keeping the SC of 68% constant, when the b/t ratio is 1: 4, the CFTB1-1 viscosity is 1117 mPa·s; when the b/t ratio is reduced to 1: 6, 1: 8, 1:10, and 1: 12, respectively, the viscosity of CFTB1-1 is reduced to 994, 875, 803 and 729 mPa·s, respectively, and the reduction rate is 11.0%, 21.7%, 28.1%, and 34.7%, respectively. The yellow cube column shows that the viscosity of the CFTB1-2 increases with the increase of SC as a power function, and with the decrease of the b/t ratio, it decreases as an exponential function. When SC increases from 66% to 72% at a b/t ratio of 1:4, the CFTB1-2 viscosity growth rate is 86.6%; the CFTB1-2 viscosity growth rate is 78.8% at a b/t ratio of 1:6. When SC increases from 66% to 72% at a b/t ratio of 1:8, 1:10, and 1:12, respectively, the CFTB1-2 viscosity growth rate is 73.2%, 62.1%, and 58.4%, respectively. When the b/t ratio is reduced from 1: 4 to 1:12 at SC of 66%, the CFTB1-2 viscosity reduction is 19.5%; When the b/t ratio is reduced from 1: 4 to 1:12 at SC of 68%, 70%, and 72%, respectively, the viscosity reduction rate of CFTB1-2 is 26.7%, 33.7%, and 31.7%, respectively.
Figure 4c shows the columnar relationship between the viscosity of CFTB2-1 and CFTB2-2, SC, and the b/t ratio. The green cubes show the relationship between the viscosity of the CFTB2-1, SC, and b/t ratio. The viscosity of CFTB2-1 increases as the SC increases with a power function, and decreases as the b/t ratio decreases with an exponential function. When SC increased from 66% to 72% at b/t ratio of 1:4, CFTB2-1 viscosity growth rate is 97.4%. When SC increased from 66% to 72% at b/t ratio of 1:6, 1:8, 1:10, and 1:12, respectively, CFTB2-1 viscosity growth rate is 87.7%, 87.2%, 70.2% and 66.6%, respectively. When b/t ratio decreased from 1:4 to 1:12 at SC of 66%, 68%, 70%, and 72%, respectively, CFTB2-1 viscosity growth rate is 22.7%, 32.1%, 39.3%, and 34.7%, respectively. The yellow cubes show the relationship between the viscosity of the CFTB2-2, SC, and b/t ratio. The viscosity of CFTB2-2 increases as the SC increases with a power function, and decreases as the b/t ratio decreases with an exponential function. When SC increased from 66% to 72% at b/t ratio of 1:4, 1:6, 1:8, 1:10, and 1:12, respectively, CFTB2-2 viscosity growth rate is 48.3%, 70.2%, 67.4%, 56.0%, and 56.2%, respectively. When the b/t ratio decreased from 1:4 to 1:12 at SC of 66%, 68%, 70%, and 72%, respectively, CFTB2-2 viscosity growth rate is 22.2%, 31.0%, 38.1%, and 37.2%, respectively.
According to the above results, the viscosity of the backfill sample increases with the increase of SC, and decreases with the decrease of the b/t ratio. As the SC increases, the solid particle content in the backfill slurry increases, and the friction action between particle and particle, and particle and the tube wall increases, resulting in an increase in slurry viscosity. As the b/t ratio is reduced, the binder content in the backfill slurry is reduced, the C-S-H gel produced after the hydration reaction decreases, and the binding force and friction action between the particle and particle is reduced, resulting in a decrease in viscosity.
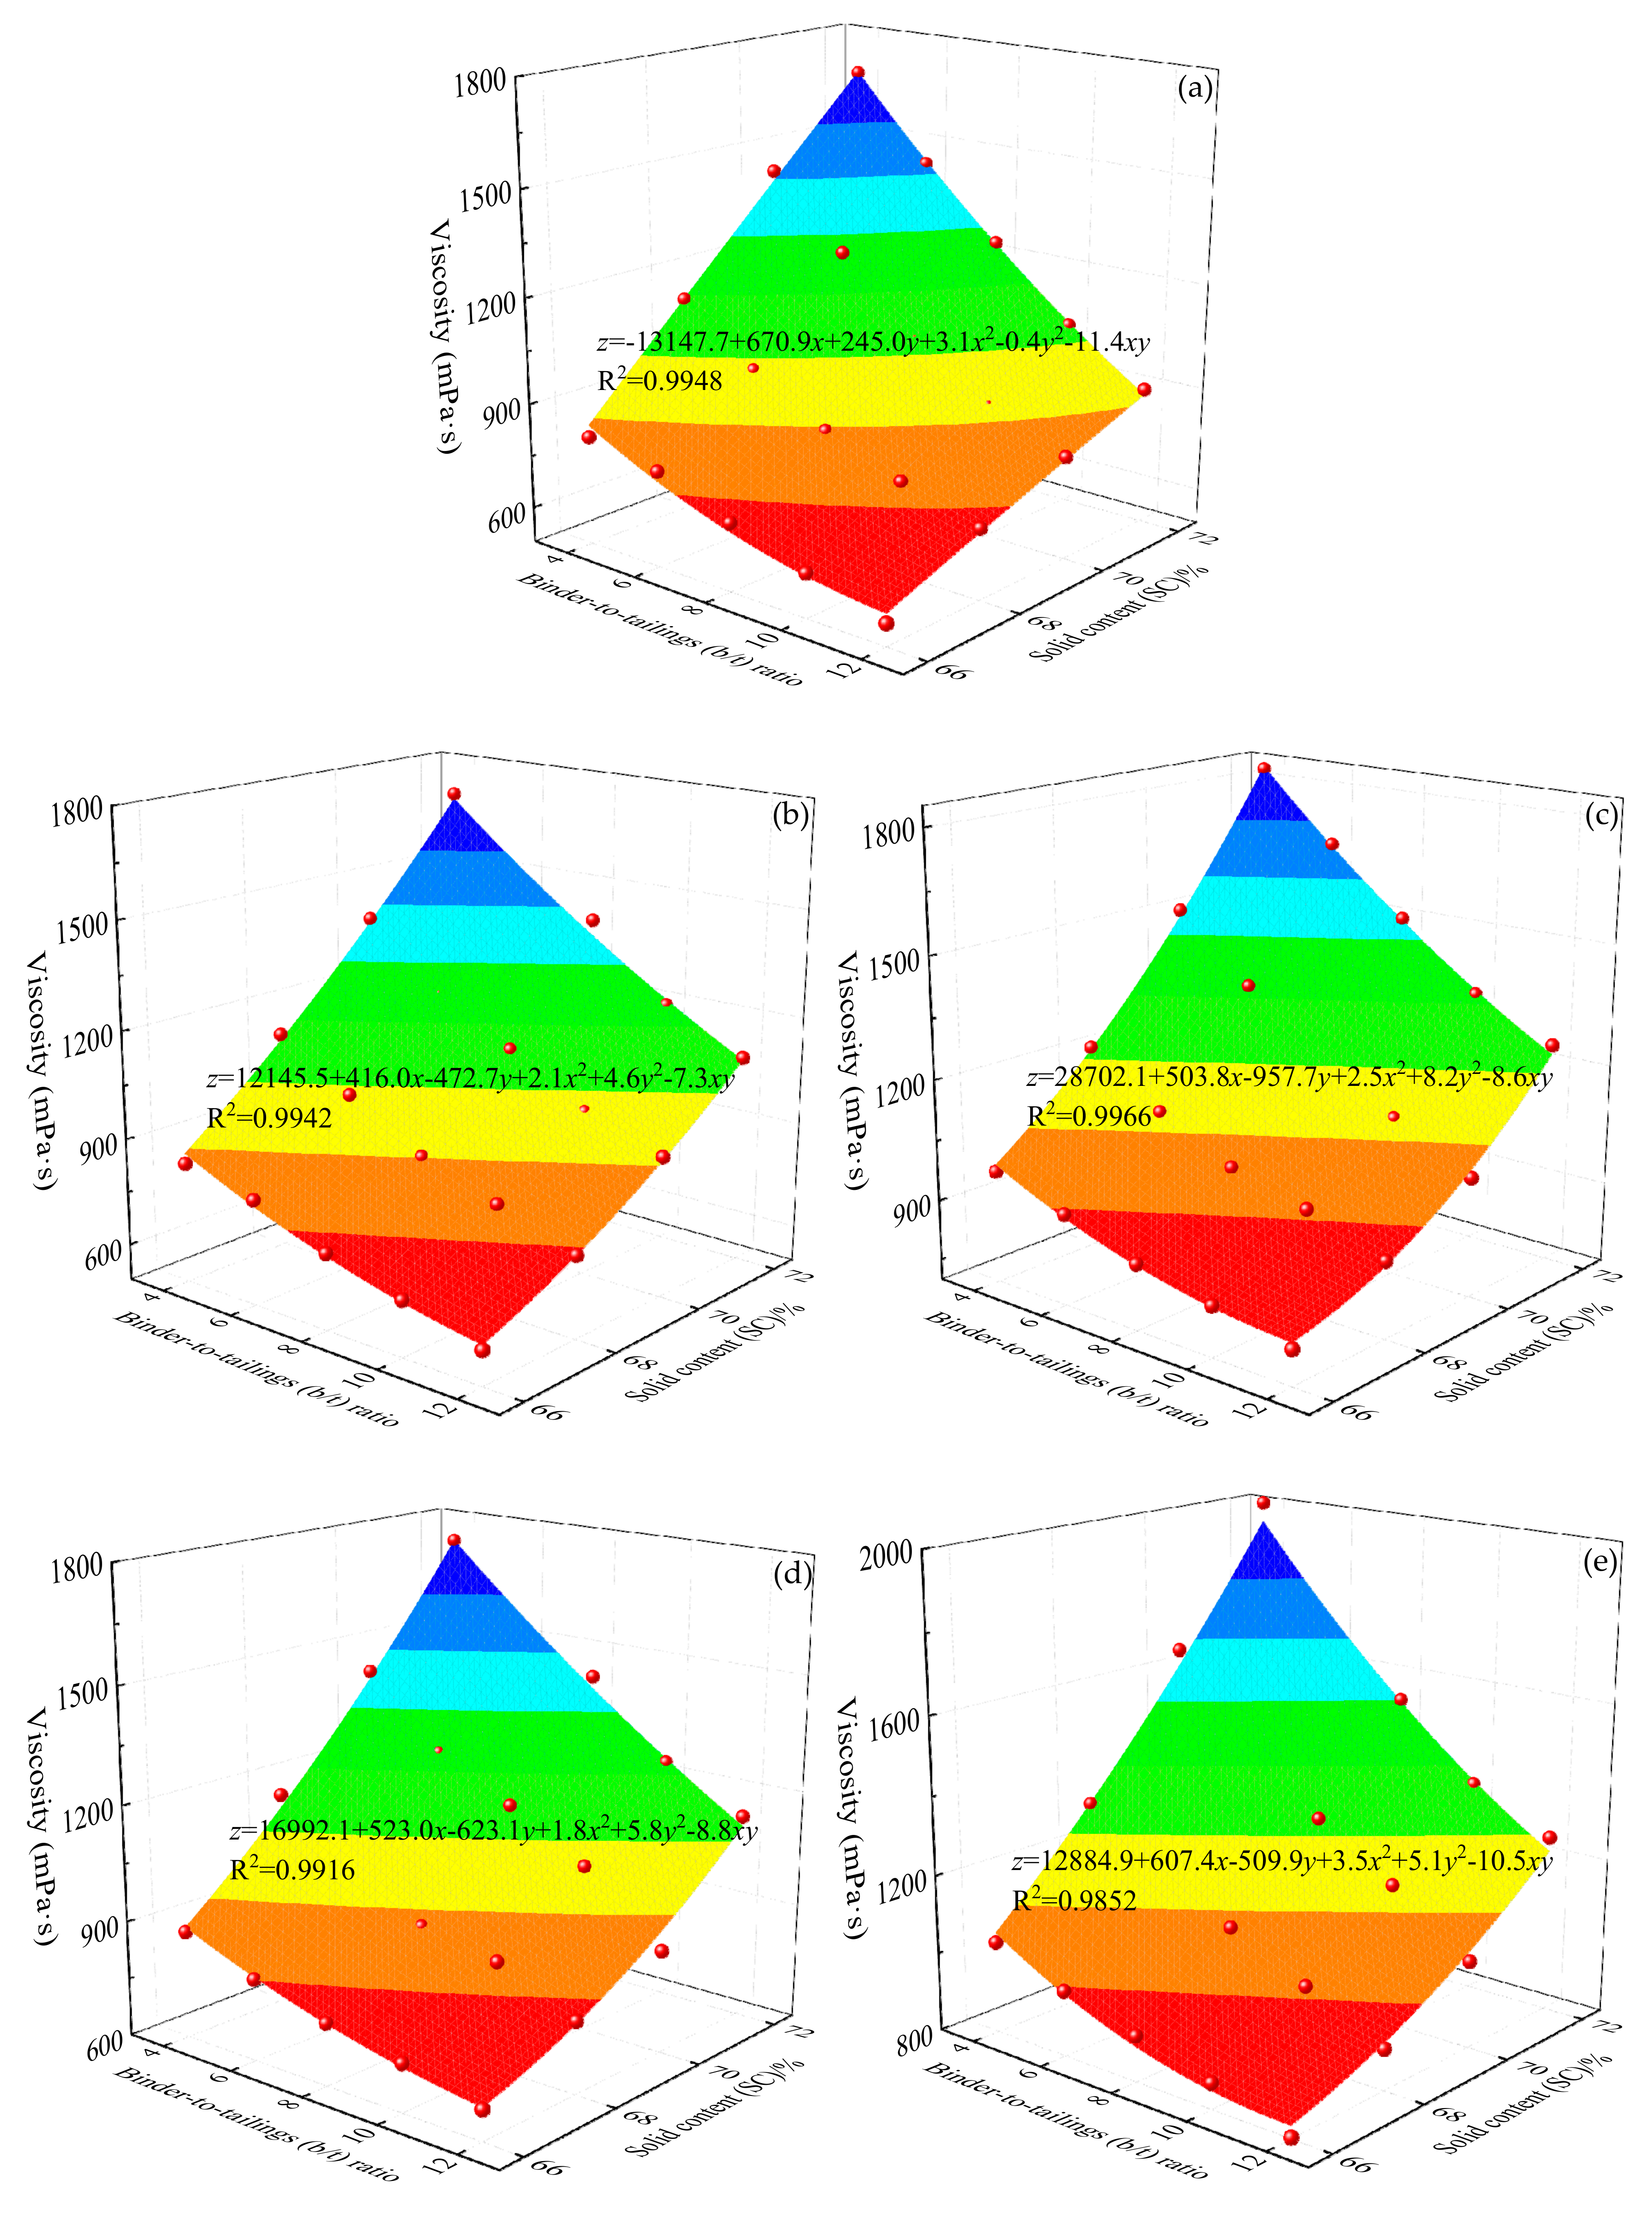
In order to analyze the effect of the coupling effect of SC and b/t ratio on the viscosity of the backfill, the SC and b/t ratio are used as the abscissa and viscosity as the ordinate to obtain a three-dimensional scatter diagram between the SC, b/t ratio, and viscosity, and the results are shown in Figure 5. It can be seen intuitively from Figure 5 that the viscosity of backfill has an important correlation with both the SC and b/t ratio. The viscosity increases as SC increases and decreases as the b/t ratio decreases. A quadratic polynomial is used to fit and analyze the viscosity results. It is found that the viscosity of the backfill had a good quadratic polynomial function relationship with SC and b/t ratio. The fitted multiple correlation coefficients R2 are all greater than 0.98, and the average fitted multiple correlation coefficient R2 is 0.9915, and the fitting results are shown in Table 5.
3.1.2. Comparative Analysis of Viscosity of Different Types of Backfill Samples
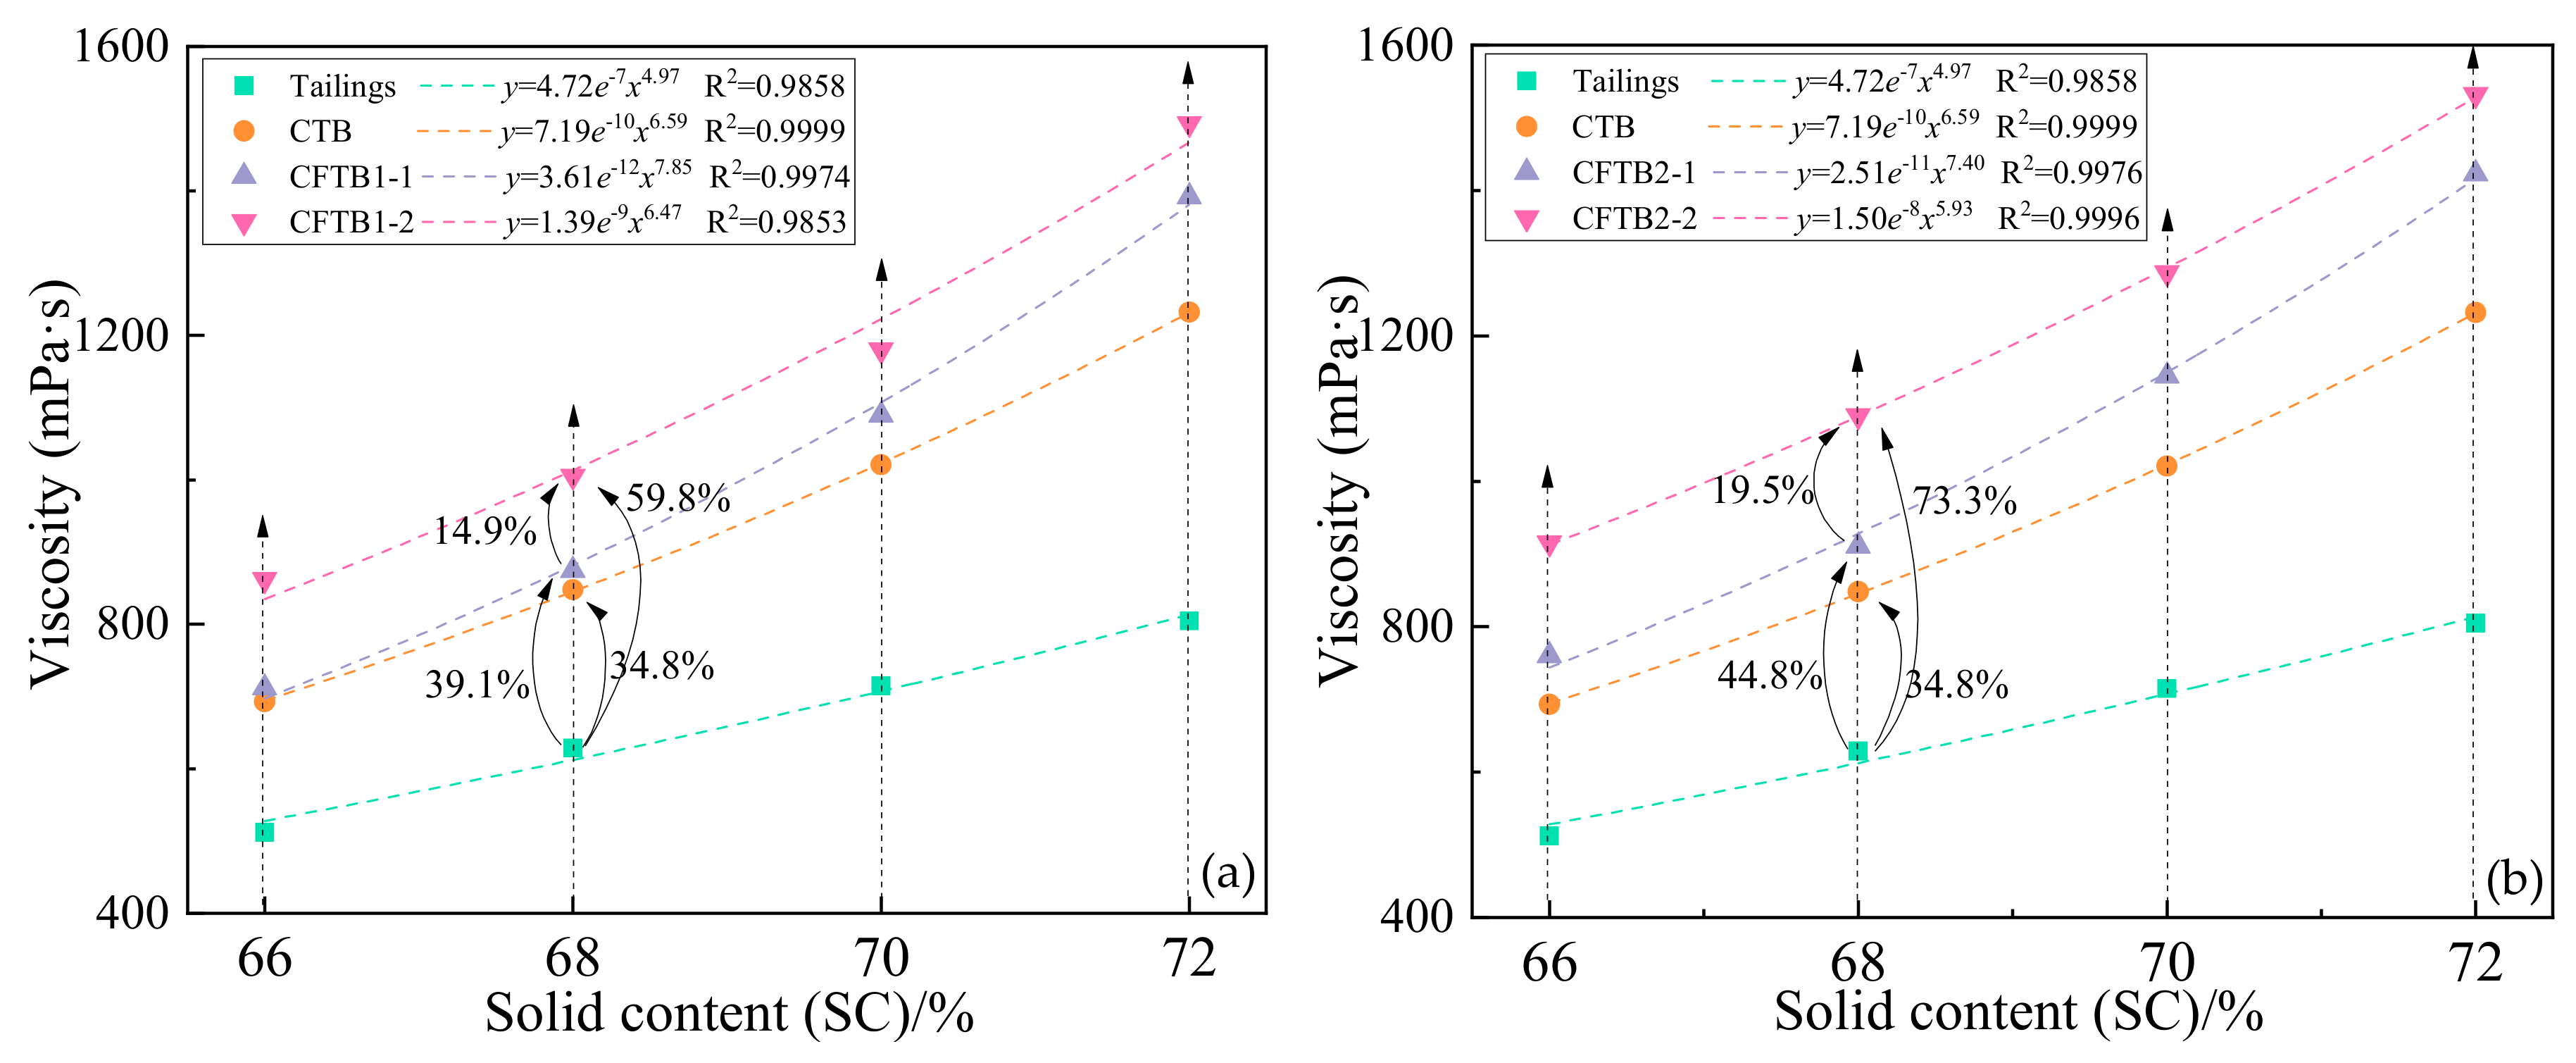
In order to analyze the effect of the content and type of binder on the viscosity of the backfill slurry, the viscosity results of different types of backfill slurry with a b/t ratio of 1:8 are selected for comparative analysis. The results are shown in Figure 6.
Figure 6a shows the comparison results of the viscosity of tailings, CTB, CFTB1-1, and CFTB1-2. It can be seen from the vertical direction, the viscosity of the backfill sample is: Tailing < CTB < CFTB1-1 < CFTB1-2. The viscosity of the all-backfill slurry containing binder is higher than that of the pure tailings slurry. When SC is 68%, compared with the pure tailings slurry, CTB viscosity increases by about 34.8%, CFTB1-1 viscosity increases by about 39.1%, and CFTB1-2 viscosity increases by about 59.8%. Comparing CTB and CFTB1, it can be seen that the viscosity of the backfill slurry increases with the addition of FA1, and the more FA1 is added, the greater the increase in viscosity. Also taking SC of 68% as an example, when the FA1 dosage is 20%, the viscosity increases by about 3.2%, and when the FA1 dosage is 50%, the viscosity increases by about 14.9%.
Figure 6b shows the comparison results of the viscosity of tailings, CTB, CFTB2-1 and CFTB2-2. It can be seen from Figure 6b that the viscosity of the backfill slurry is: Tailing < CTB < CFTB2-1 < CFTB2-2. This result shows that after the binder is added to the tailings slurry, the viscosity of the slurry increases significantly. Taking 68% as an example, compared with pure tailings slurry, CTB viscosity increased by approximately 34.8%, CFTB2-1 viscosity increased by approximately 44.8%, and CFTB2-2 viscosity increased by approximately 73.3%. Comparing CTB and CFTB2, it can be seen that the viscosity of the backfill slurry increases with the addition of FA2, and the more FA2 is added, the greater the viscosity increase. Also taking SC as 68% as an example, when the FA2 dosage is 20%, the viscosity increases by about 7.4%, and when the FA2 dosage is 50%, the viscosity increases by about 28.5%.
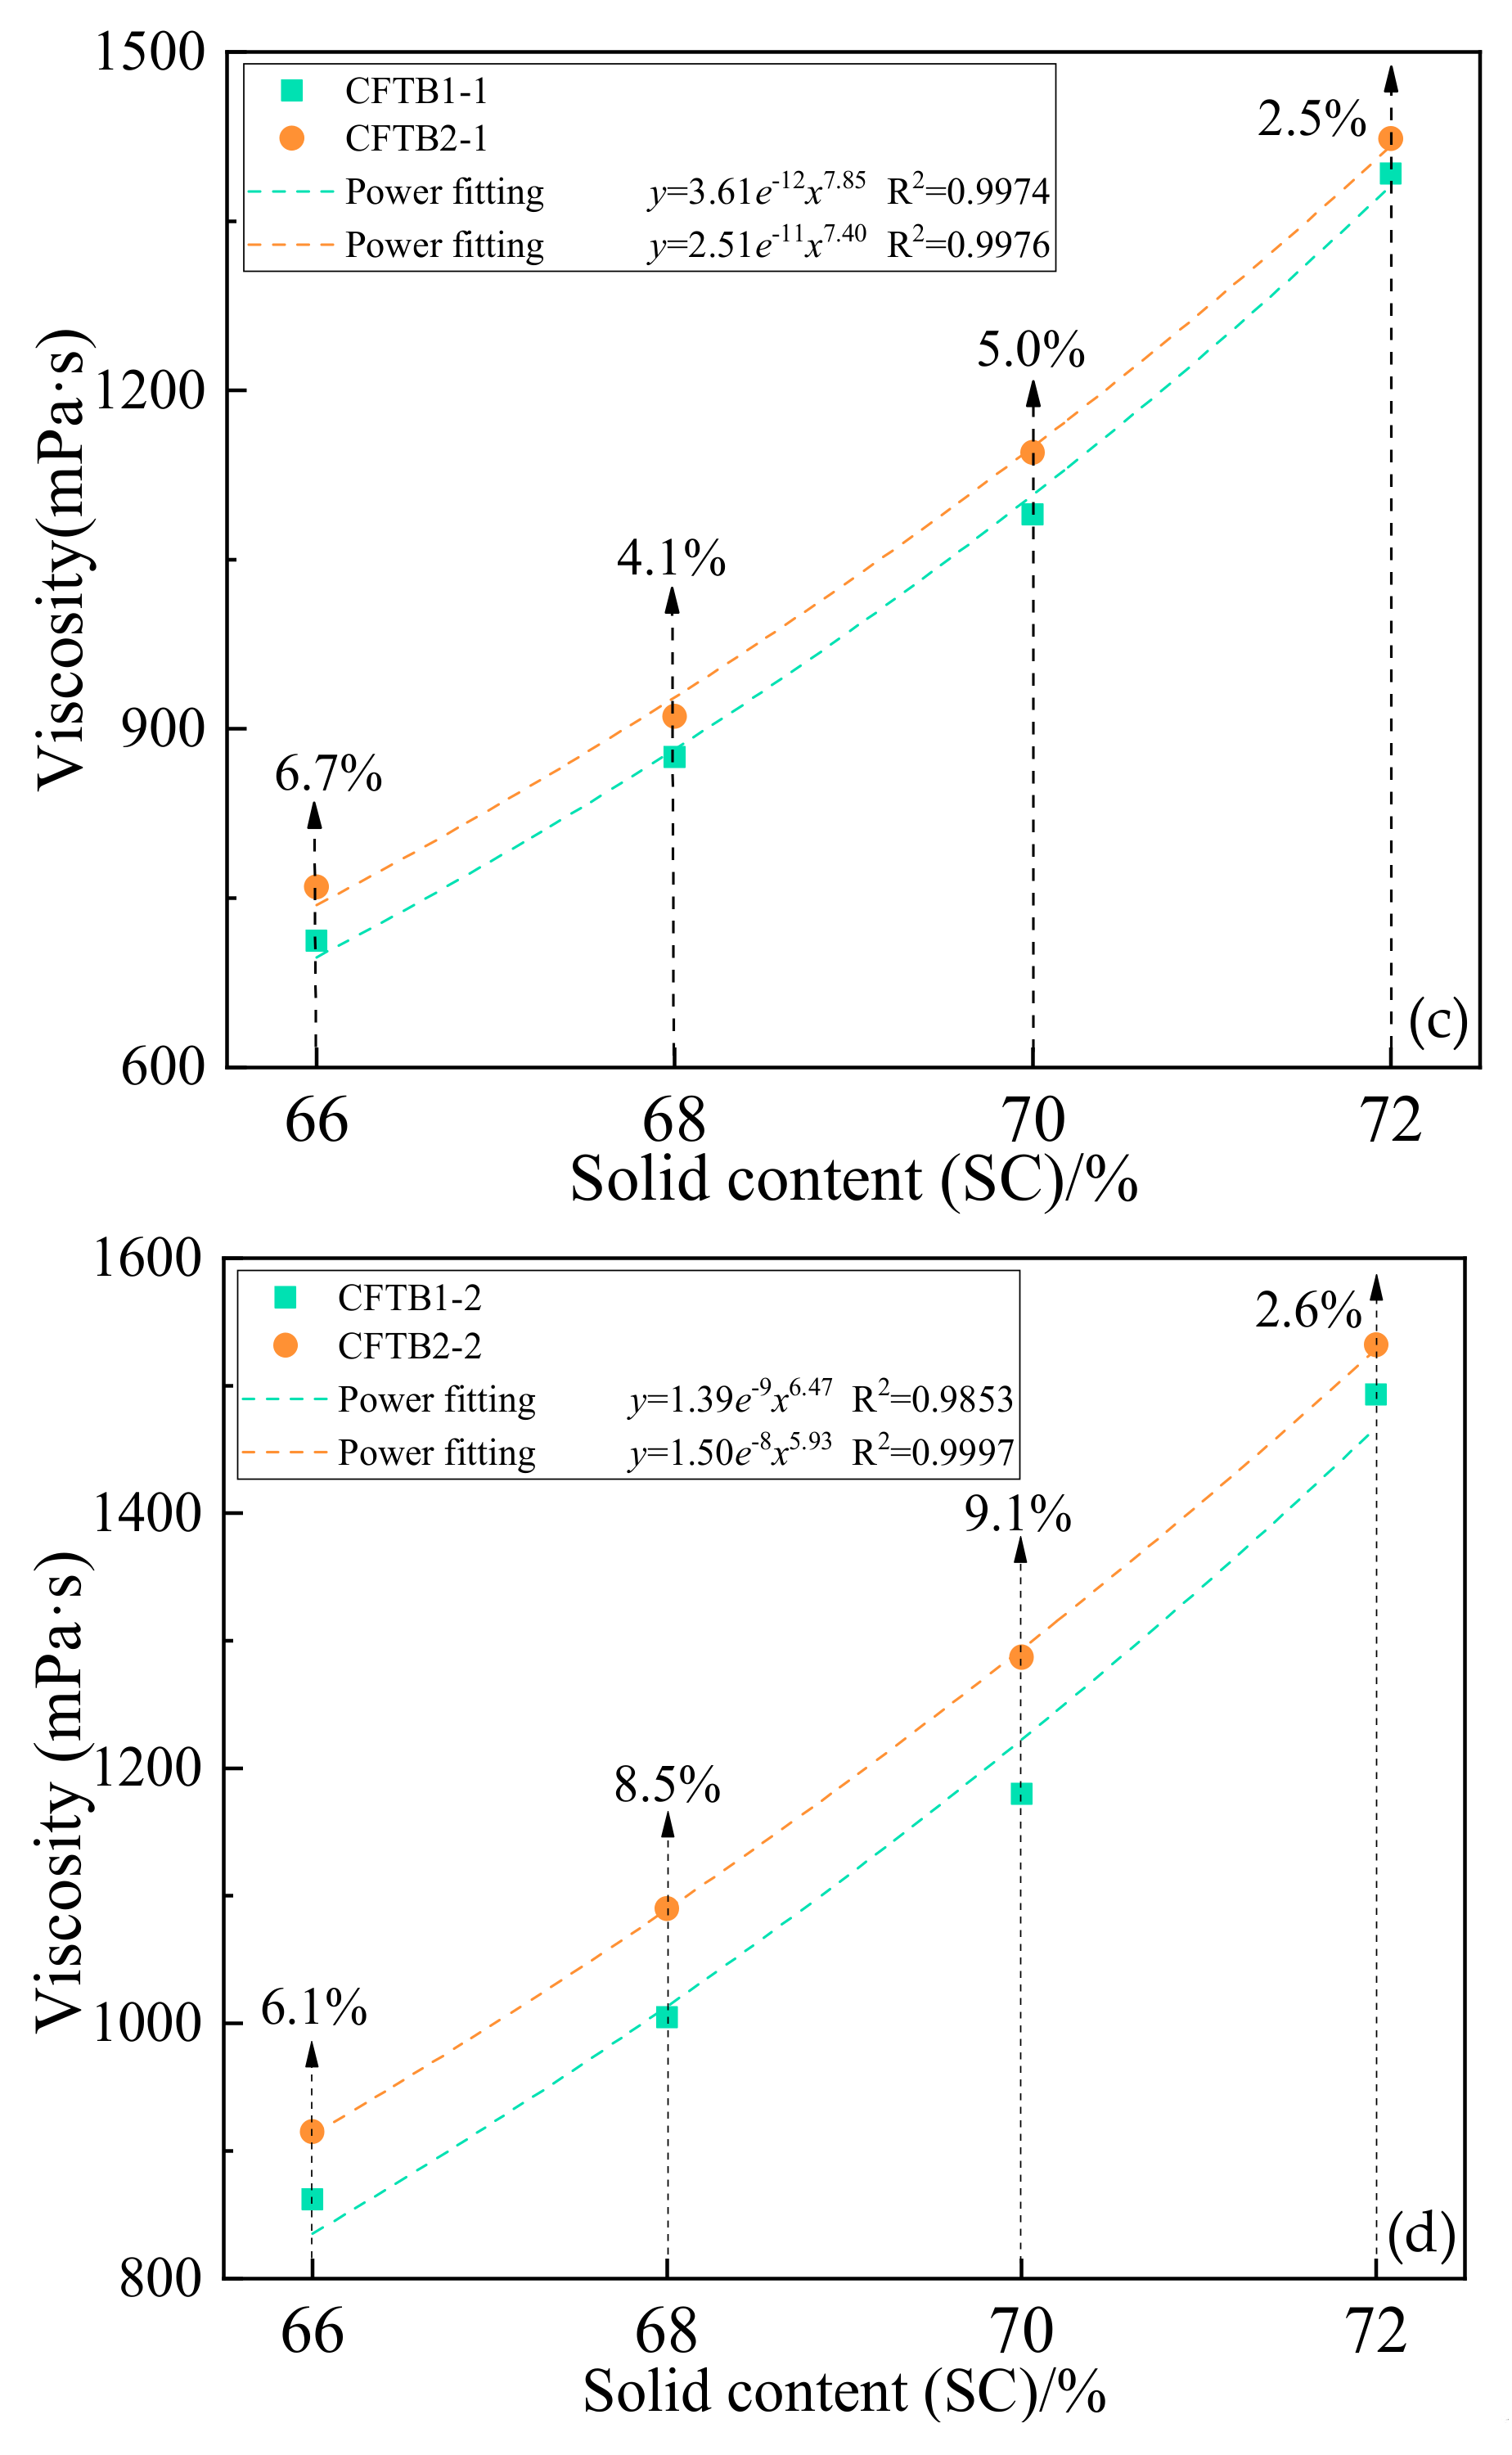
Figure 6c,d shows the comparison results of the viscosity of the backfill slurry with the same FA content and different FA types. When the FA dosage is the same, the viscosity of the backfill slurry mixed with FA2 is greater than that of FA1. When the FA dosage is 20% at SC of 66%, the viscosity of CFTB2-1 is increased by 6.7% compared to the viscosity of CFTB1-1; when the FA dosage is 20% at SC of 68%, 70%, and 72%, respectively, the viscosity increases by 4.1%, 5.0%, and 2.2%, respectively. When the FA dosage is 50% at SC of 66%, the viscosity of CFTB2-2 is increased by 6.1% compared to the viscosity of CFTB1-2; when the FA dosage is 50% at SC of 68%, 70%, and 72%, respectively, the viscosity increases by 8.5%, 9.1%, and 2.6%, respectively.
A comprehensive analysis of the above results shows that the backfill slurry with a binder has a higher viscosity than the slurry without the binder. The backfill slurry with the FA has a higher viscosity than the backfill slurry without the FA. For the same FA dosage, the backfill slurry with the FA2 has a higher viscosity than the backfill slurry with the FA1. For the same FA type, the higher the FA dosage, the higher the viscosity of the backfill slurry.
3.2. UCS Results of Different Types of Backfills Samples
3.2.1. UCS Analysis of Different Type Backfill Samples
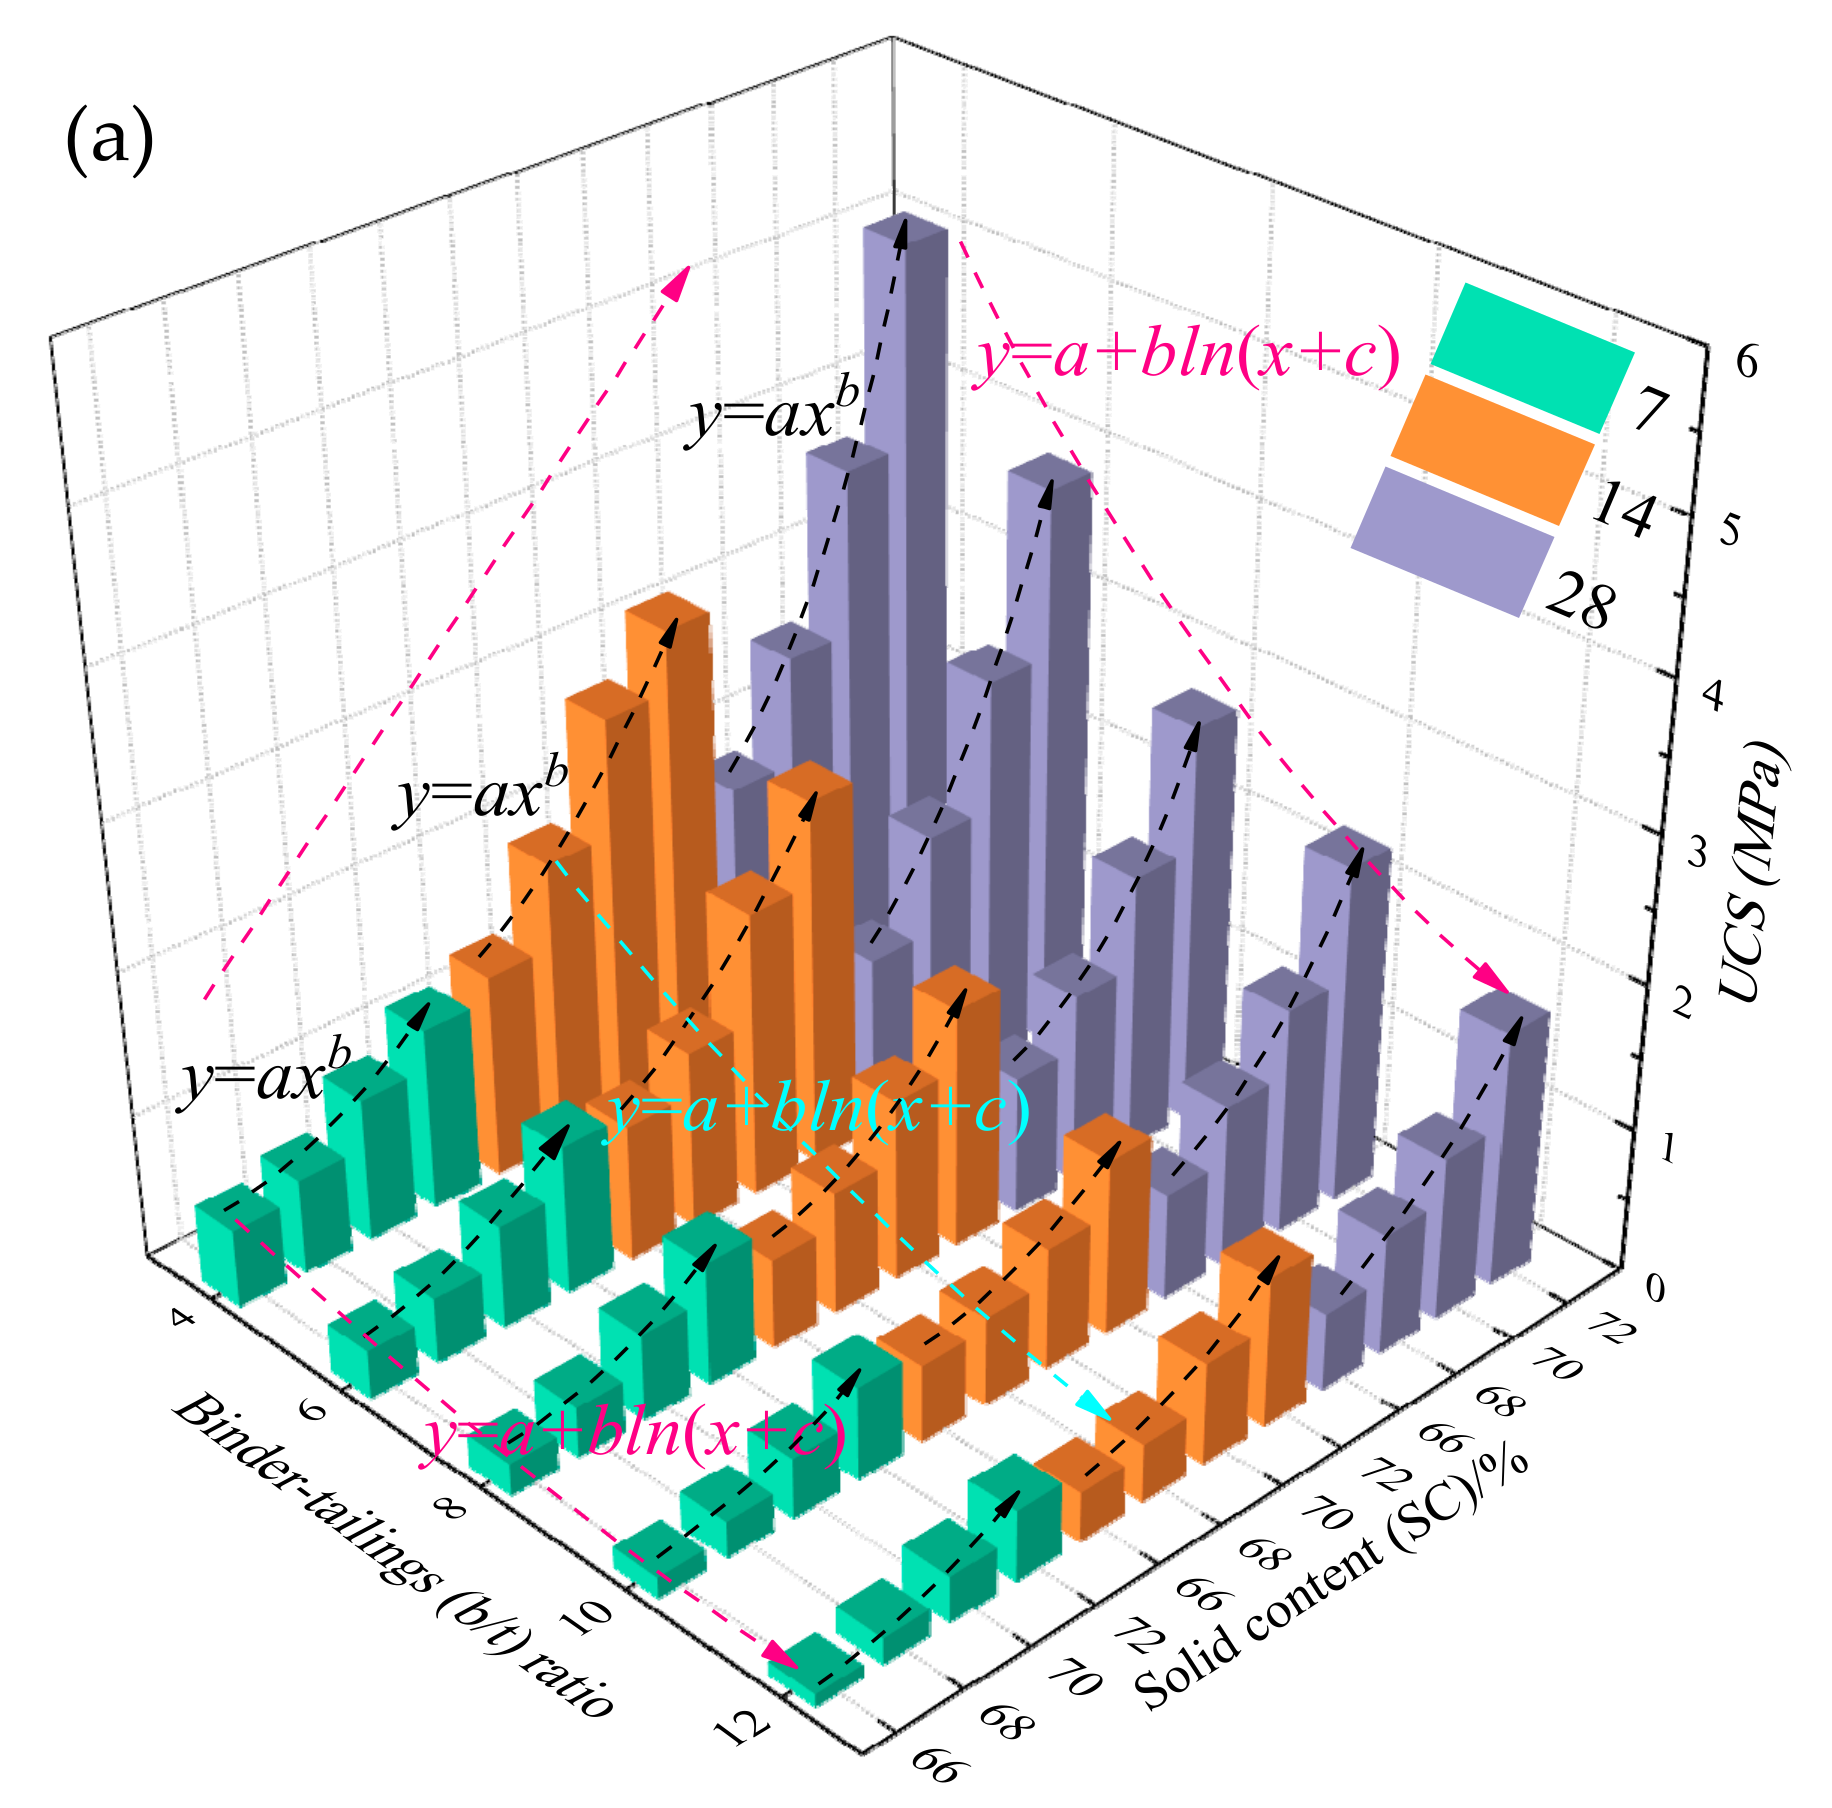
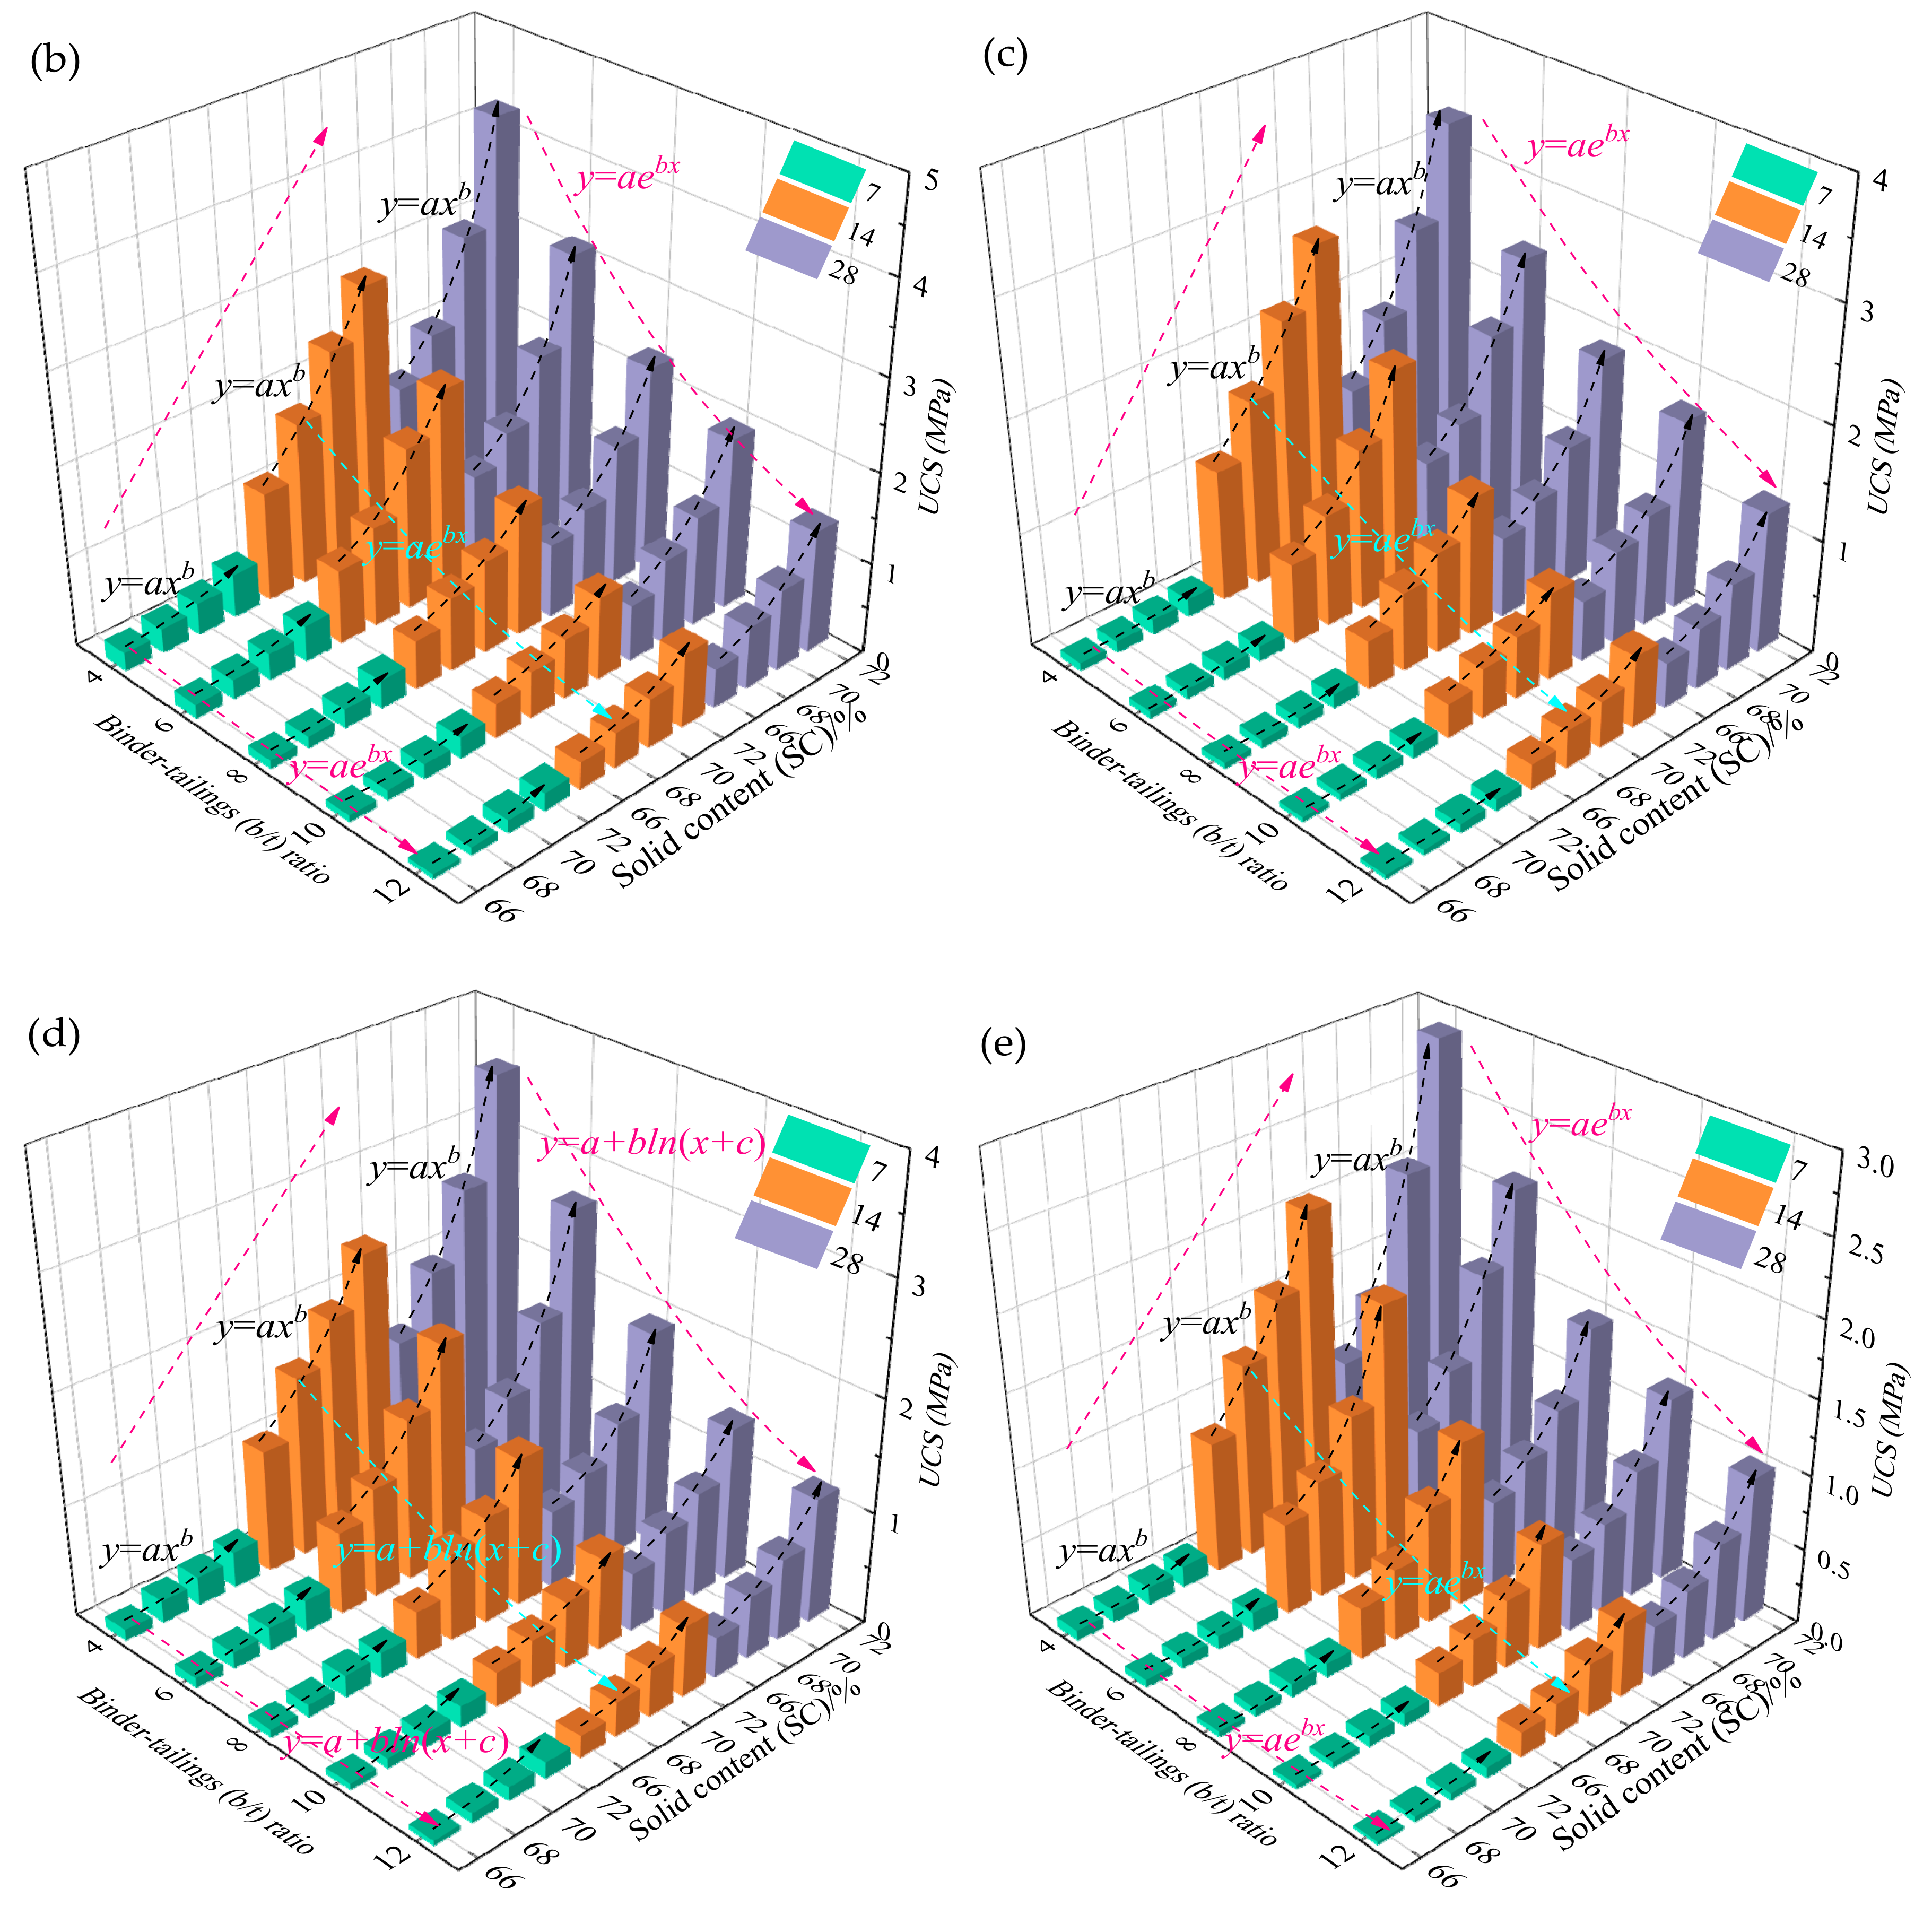
In order to deeply analyze the influence of SC, b/t ratio, and curing age on the uniaxial compressive strength (UCS) of backfill, the control variable method is adopted to change a single factor while keeping other factors unchanged. Figure 7 shows the UCS results of different types of backfill.
Figure 7a shows the UCS result of CTB with different SC, different b/t ratio, and different curing age. Keeping the curing age and the b/t ratio constant, the UCS of CTB increases as the SC increases with a power function. Taking the curing age of 14d and the b/t ratio of 1:4 as an example, when the SC is 66%, the UCS of CTB is 0.622 MPa; when the SC increased to 68%, the UCS of CTB is 0.851 MPa, the growth rate is 36.8%; when the SC increased to 70% and 72%, respectively, the UCS of CTB is 1.254 and 1.663 MPa, respectively, and the growth rates are 101.6% and 167.4%, respectively. Keeping the curing age and the SC constant, the UCS of CTB decreases as the b/t ratio decreases with an exponential function. Taking the curing age of 14d and the SC of 68% as an example, when the b/t ratio is 1:4, the UCS of CTB is 1.999 MPa; when the b/t ratio reduced to 1:6, 1:8, 1:10, and 1:12, respectively, the UCS of CTB reduced to 1.235, 0.851, 0.612, and 0.401 MPa, respectively, the reduction rates are 38.2%, 57.4%, 69.4%, and 79.9%, respectively. Keeping the SC and the b/t ratio constant, the UCS of CTB increases as the curing age increases. Taking the SC of 68% and the b/t ratio of 1:8 as an example, when the curing age is 7d, the UCS of CTB is 0.348 MPa; when the curing age increased to 14 and 28d, respectively, the UCS of CTB increased to 0.851 and 1.315 MPa, respectively, and the growth rates are 144.5% and 277.9%, respectively.
Figure 7b shows the columnar relationship between the UCS of CFTB1-1 and SC, b/t ratio, and curing age. Keeping the curing age and the b/t ratio constant, the UCS of CFTB1-1 increases as the SC increases with a power function. Taking the curing age of 14d and the b/t ratio of 1:8 as an example, when SC increased from 66% to 72%, the UCS of CFTB1-1 reduced from 0.541 to 1.421 MPa, the reduction rate is 162.7%. Keeping the curing age and the SC constant, the UCS of CFTB1-1 decreases as the b/t ratio decreases with an exponential function. Taking the curing age of 14d and the SC of 68% as an example, when the b/t ratio reduced from 1:4 to 1:12, the UCS of CFTB1-1 reduced from 1.813 MPa to 0.392 MPa, the reduction rate is 78.4%. Keep the SC and the b/t ratio constant, the UCS of CFTB1-1 increases as the curing age increases. Taking the SC of 68% and the b/t ratio of 1:8 as an example, when the curing age increased from 7d to 28d, the UCS of CFTB1-1 increased from 0.131 to 1.022 MPa, and the growth rate reached 680.2%.
Figure 7c shows the columnar relationship between the UCS of CFTB1-2 and SC, b/t ratio, and the curing age. Keeping the curing age and b/t ratio constant, the UCS of CFTB1-2 increases as the SC increases with a power function. Taking the curing age of 14d and b/t ratio of 1:8 as an example, when SC increased from 66% to 72%, the UCS of CFTB1-2 increased from 0.433 to 1.222 MPa, the growth rate is 182.2%. Keep the curing age and the SC constant, the UCS of CFTB1-2 reduced as the b/t ratio reduced with an exponential function. Taking the curing age of 14d and SC of 68% as an example, when the b/t ratio decreased from 1:4 to 1:12, the UCS of CFTB1-2 decreased from 1.647 to 0.333 MPa, the reduction rate is 79.8%. Keep the SC and the b/t ratio constant, the UCS of CFTB1-2 increases as the curing age increases. Taking SC of 68% and b/t ratio of 1:8 as an example, when the curing age increased from 7d to 28d, the UCS of CFTB1-2 increased from 0.074 to 0.894 MPa, increases by about 11 times.
Figure 7d,f shows the UCS results of CFTB2-1 and CFTB2-2, respectively. Keeping the curing age and the b/t ratio constant, the UCS of CFTB2-1 and CFTB2-2 increases as the SC increases with a power function. Keep the curing age and the SC constant, the UCS of CFTB2-1 decreases as the b/t ratio decreases with a logarithmic function, the UCS of CFTB2-2 decreases as the b/t ratio decreases with an exponential function. Keep the SC and the b/t ratio constant, the UCS of CFTB2-1 and CFTB2-2 both increases as the curing age increases.
The comprehensive analysis of the above results shows that the UCS of the backfill increases with the increase of SC, decreases with the decrease of the b/t ratio, and increases with the increase of the curing age. As the SC increases, the solid particle content in the backfill slurry increases, porosity inside the backfill decreases after the hydration reaction, and the overall strength of the backfill increases; as the b/t ratio is reduced, the binder particle content in the backfill slurry is reduced, the C-S-H gel produced after the hydration reaction decreases, the overall strength of backfill decreases; as the curing age increases, the hydration reaction between particle and particle inside backfill is sufficient, more C-S-H gel was produced, and the overall strength of the backfill increases.
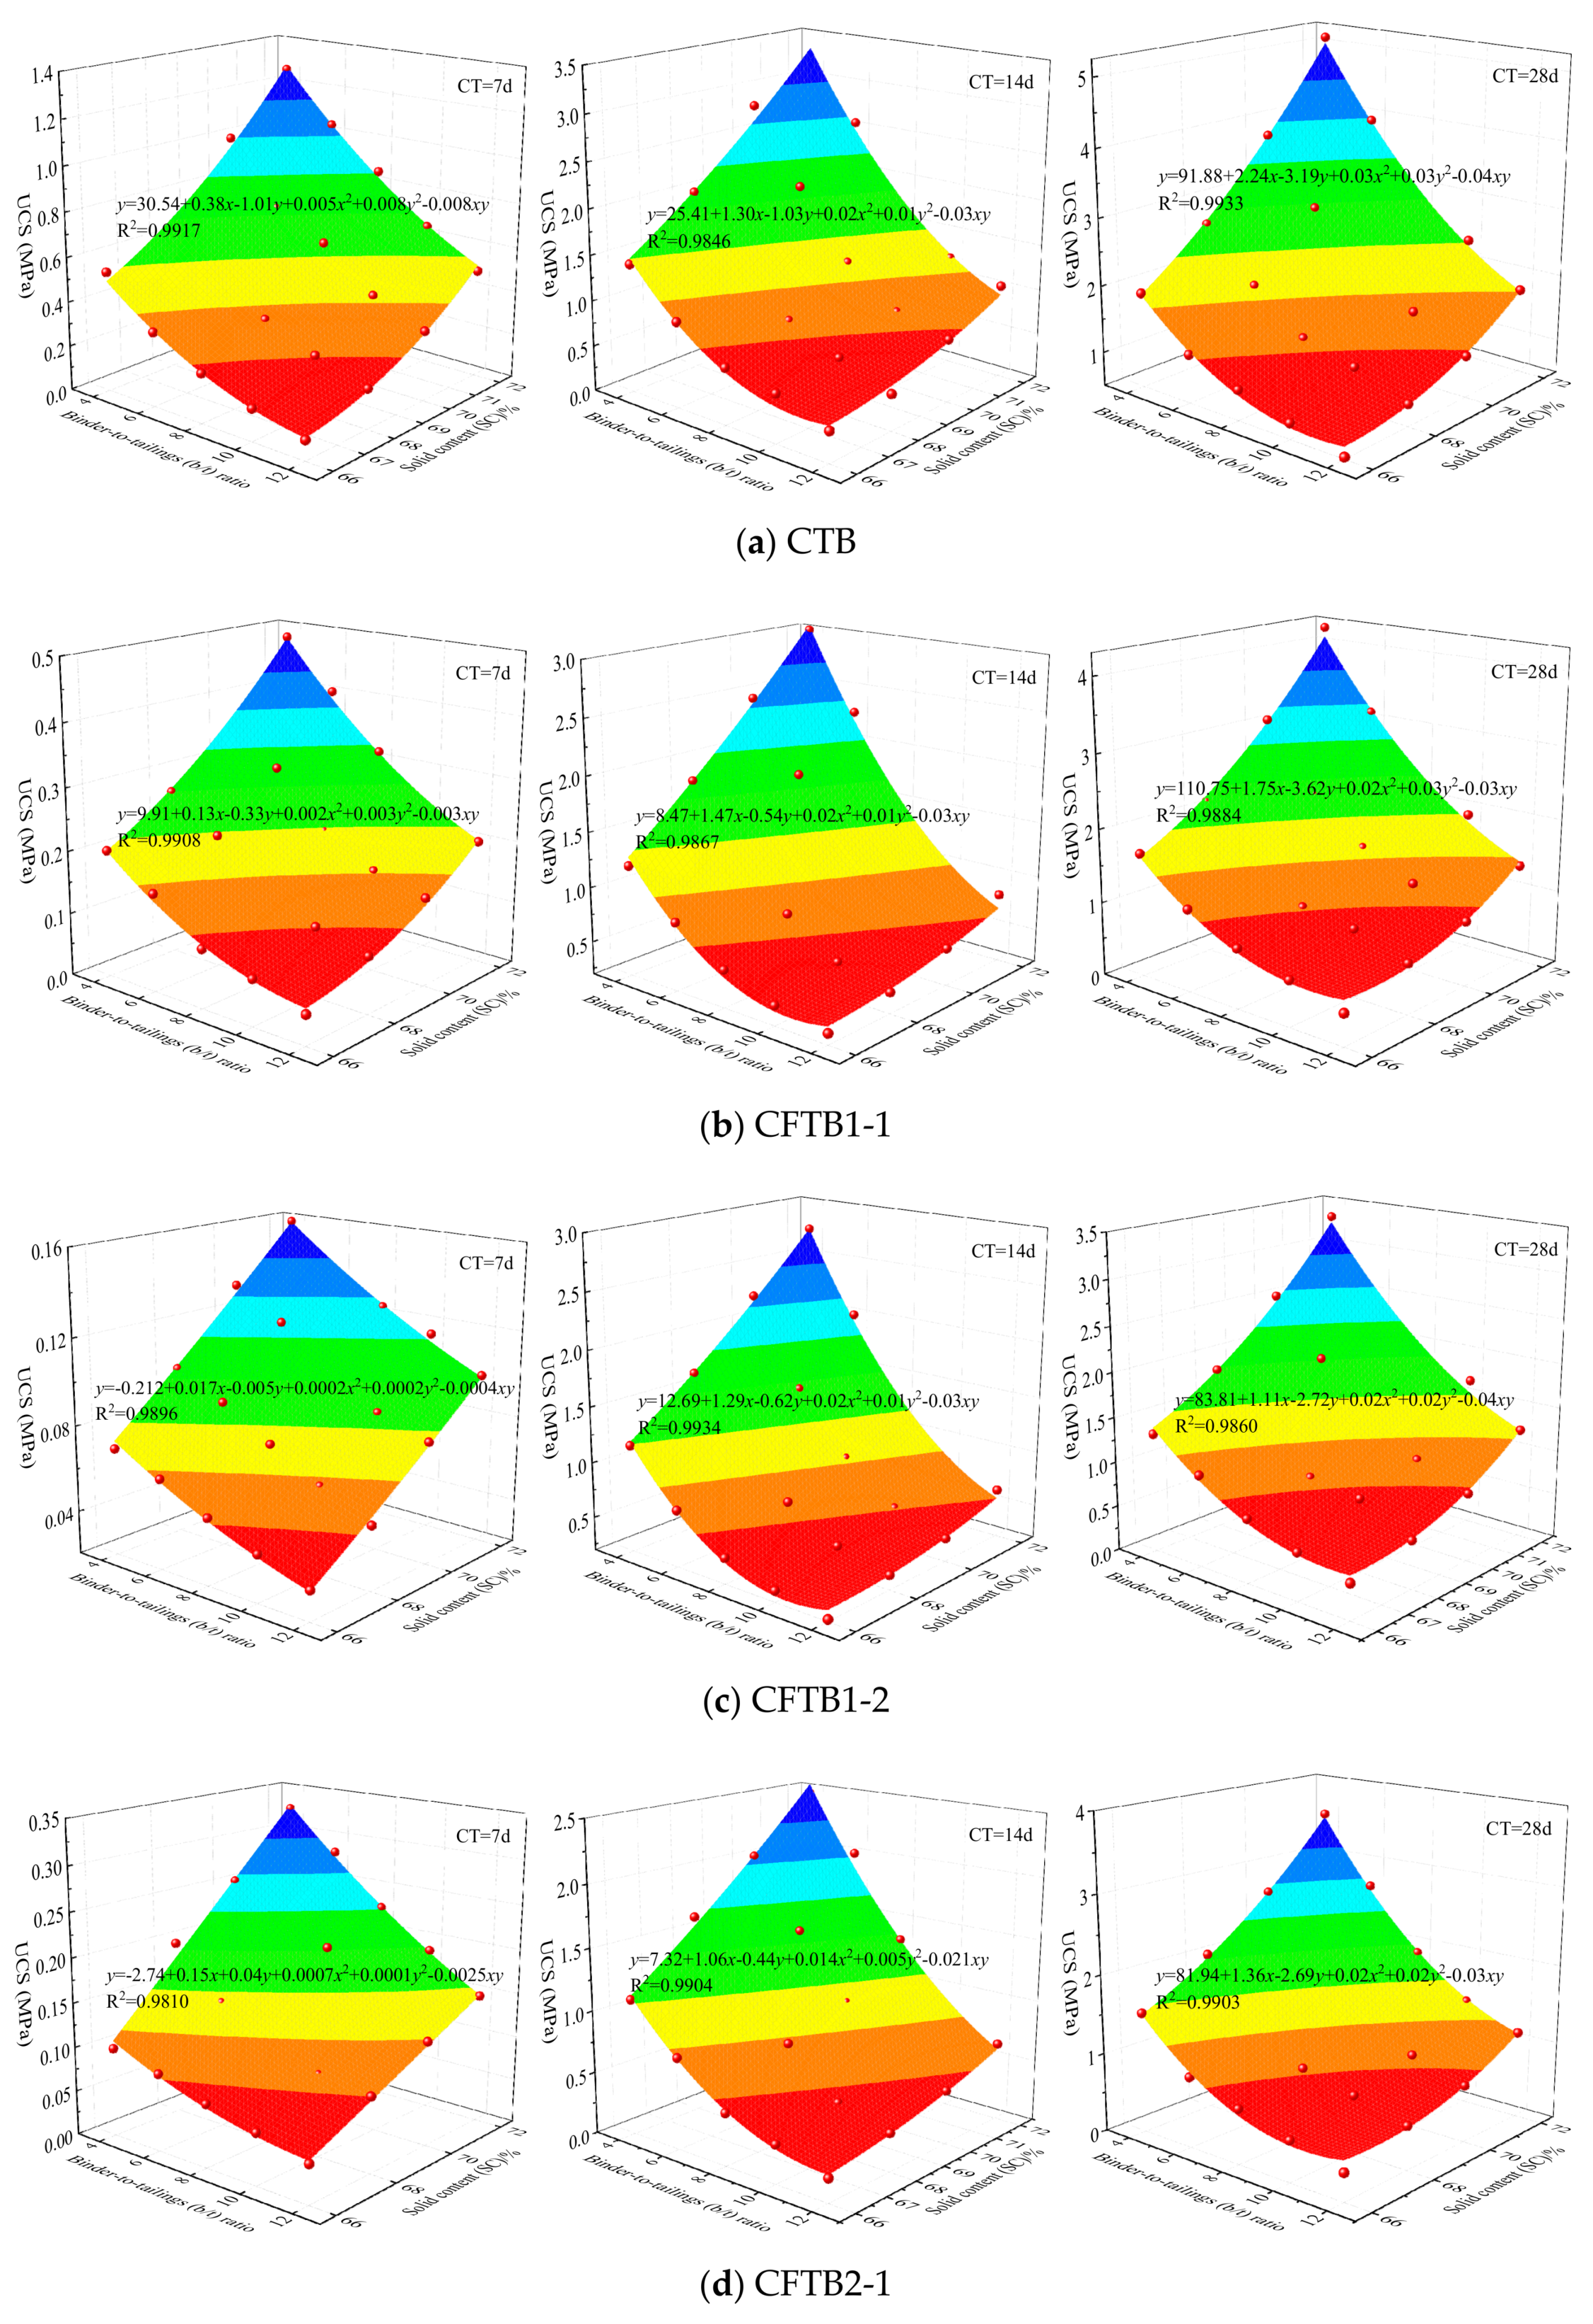
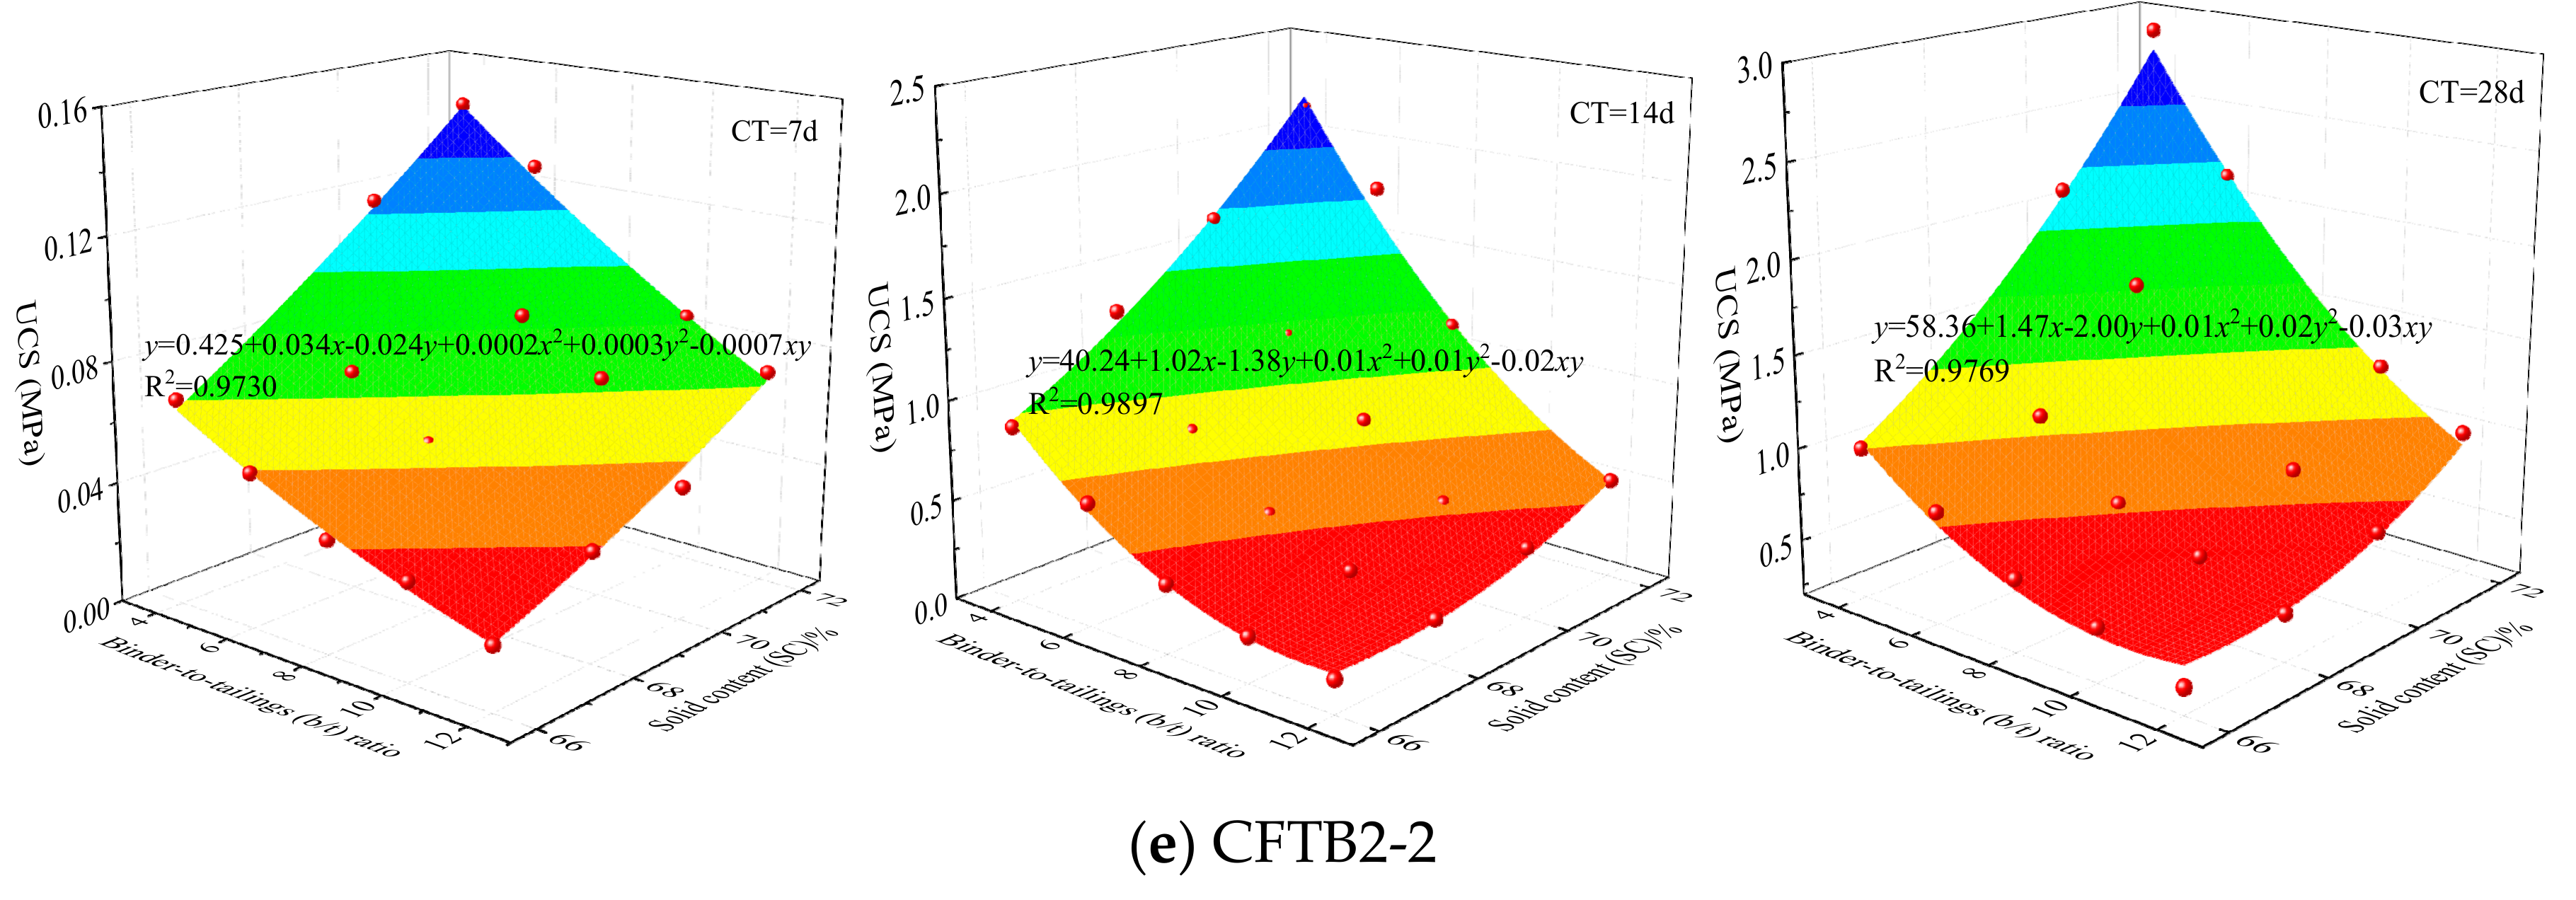
In order to understand the influence of the coupling factors of the SC and b/t ratio on the UCS of backfill, keep the curing age unchanged, and change the SC and b/t ratio to obtain the three-dimensional scattered diagram between the SC, b/t ratio, and UCS, as shown in Figure 8. It can be seen more intuitively from Figure 8 that the UCS of backfill increases with increasing SC and decreases with decreasing b/t ratio. A three-dimensional surface fitting is carried out for the three-dimensional scatter diagram, and the fitting results are shown in Table 6. It can be seen from Table 6 that there is a good quadratic polynomial function relationship between the SC, b/t ratio, and UCS of the backfill. The fitting multiple correlation coefficient R2 is greater than 0.97, and the average multiple correlation coefficient R2 is as high as 0.9871.
3.2.2. Comparative Analysis of UCS of Different Types of Backfill Samples
In order to further understand the influence of FA type and dosage on the UCS of backfill, the difference between the UCS of backfill without FA and the UCS of backfill with FA is obtained. The results are shown in Figure 9.
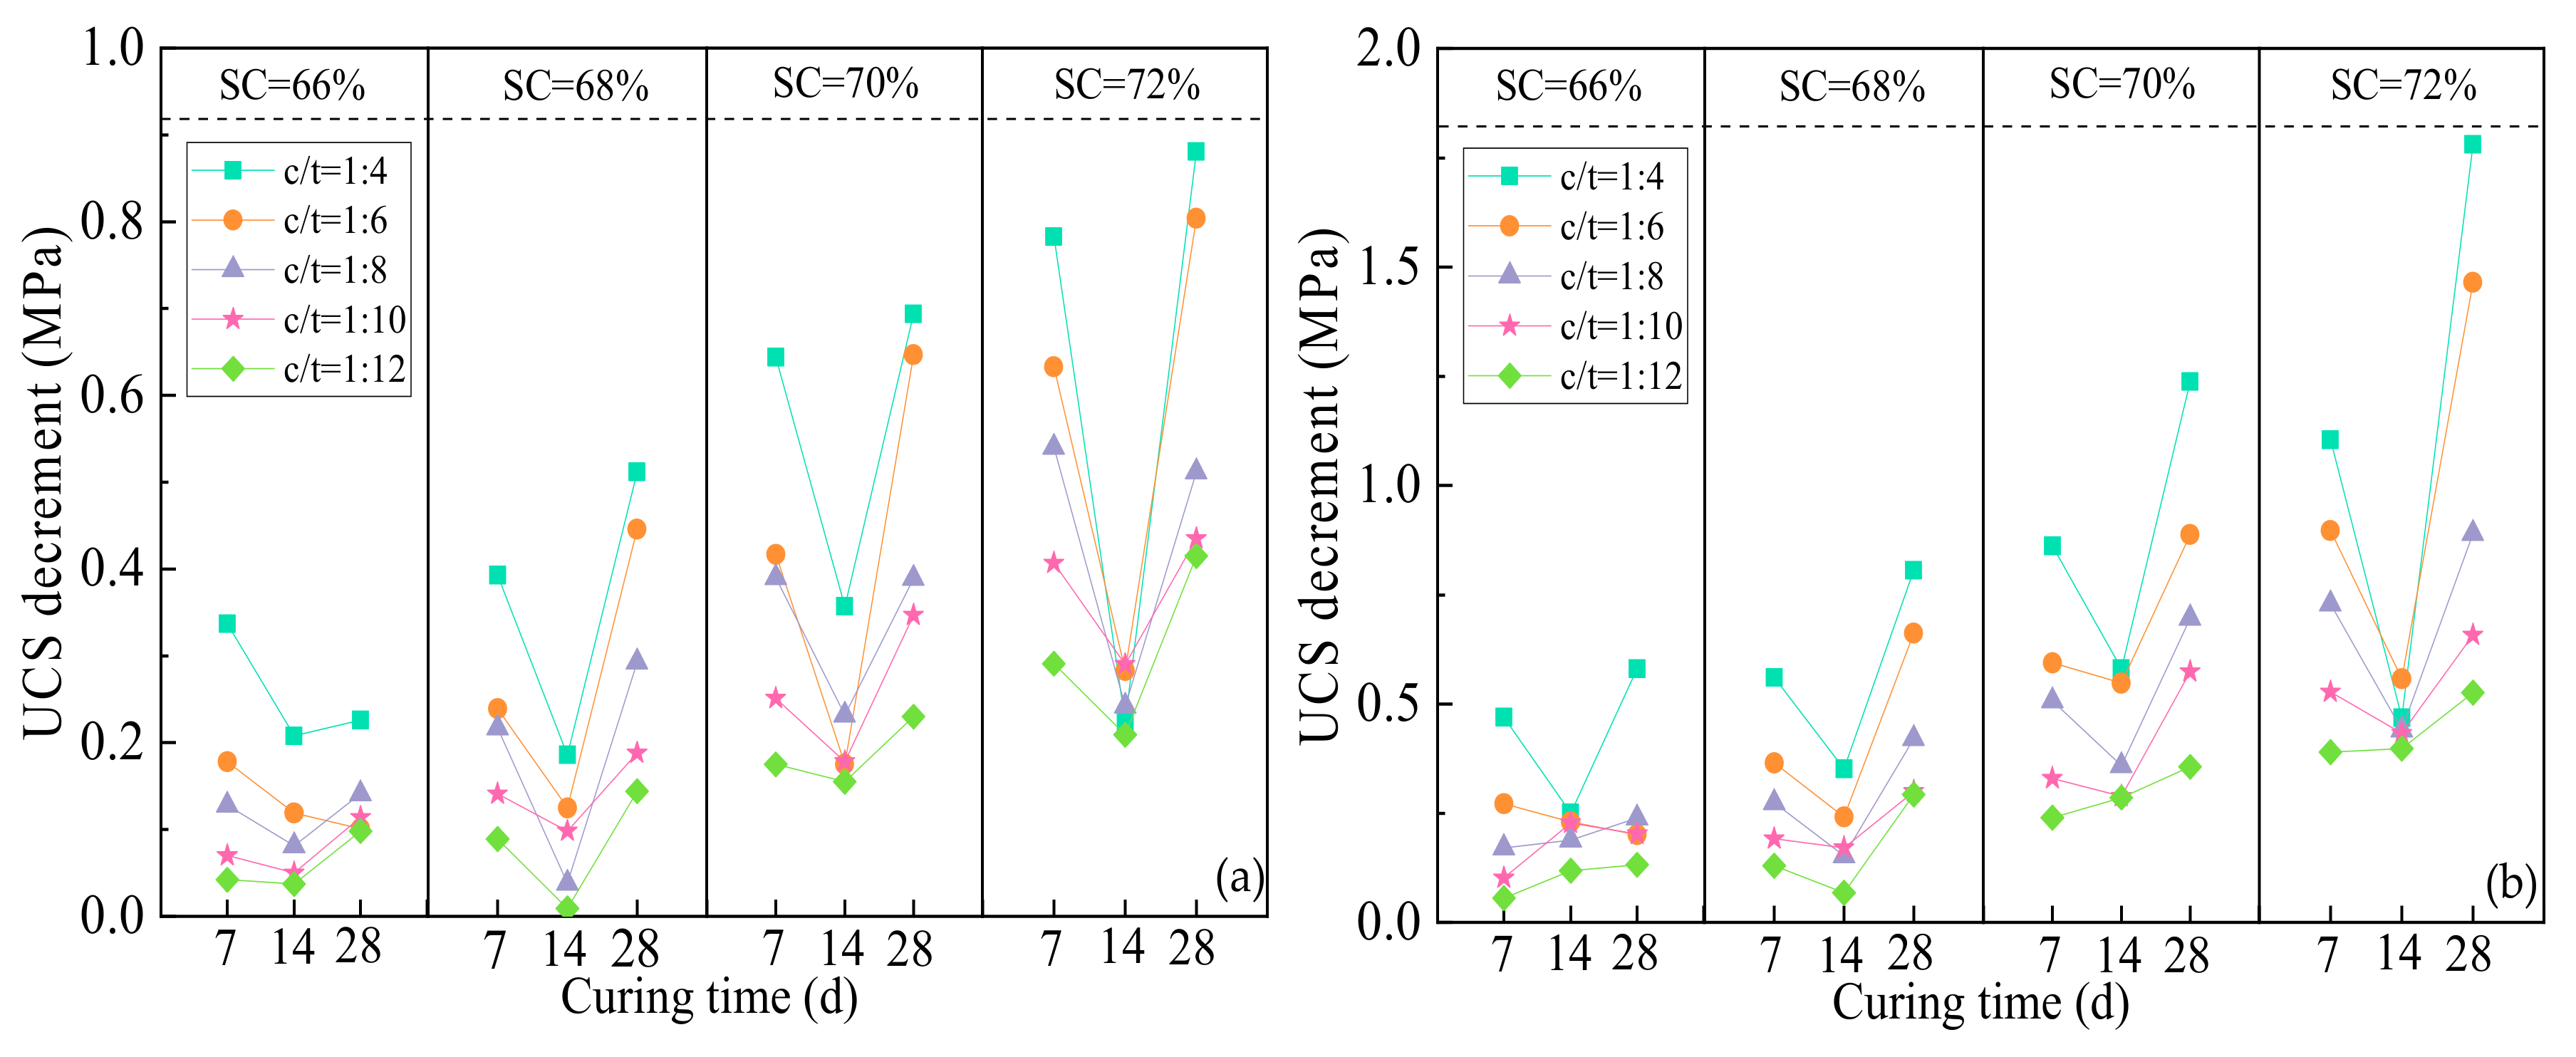
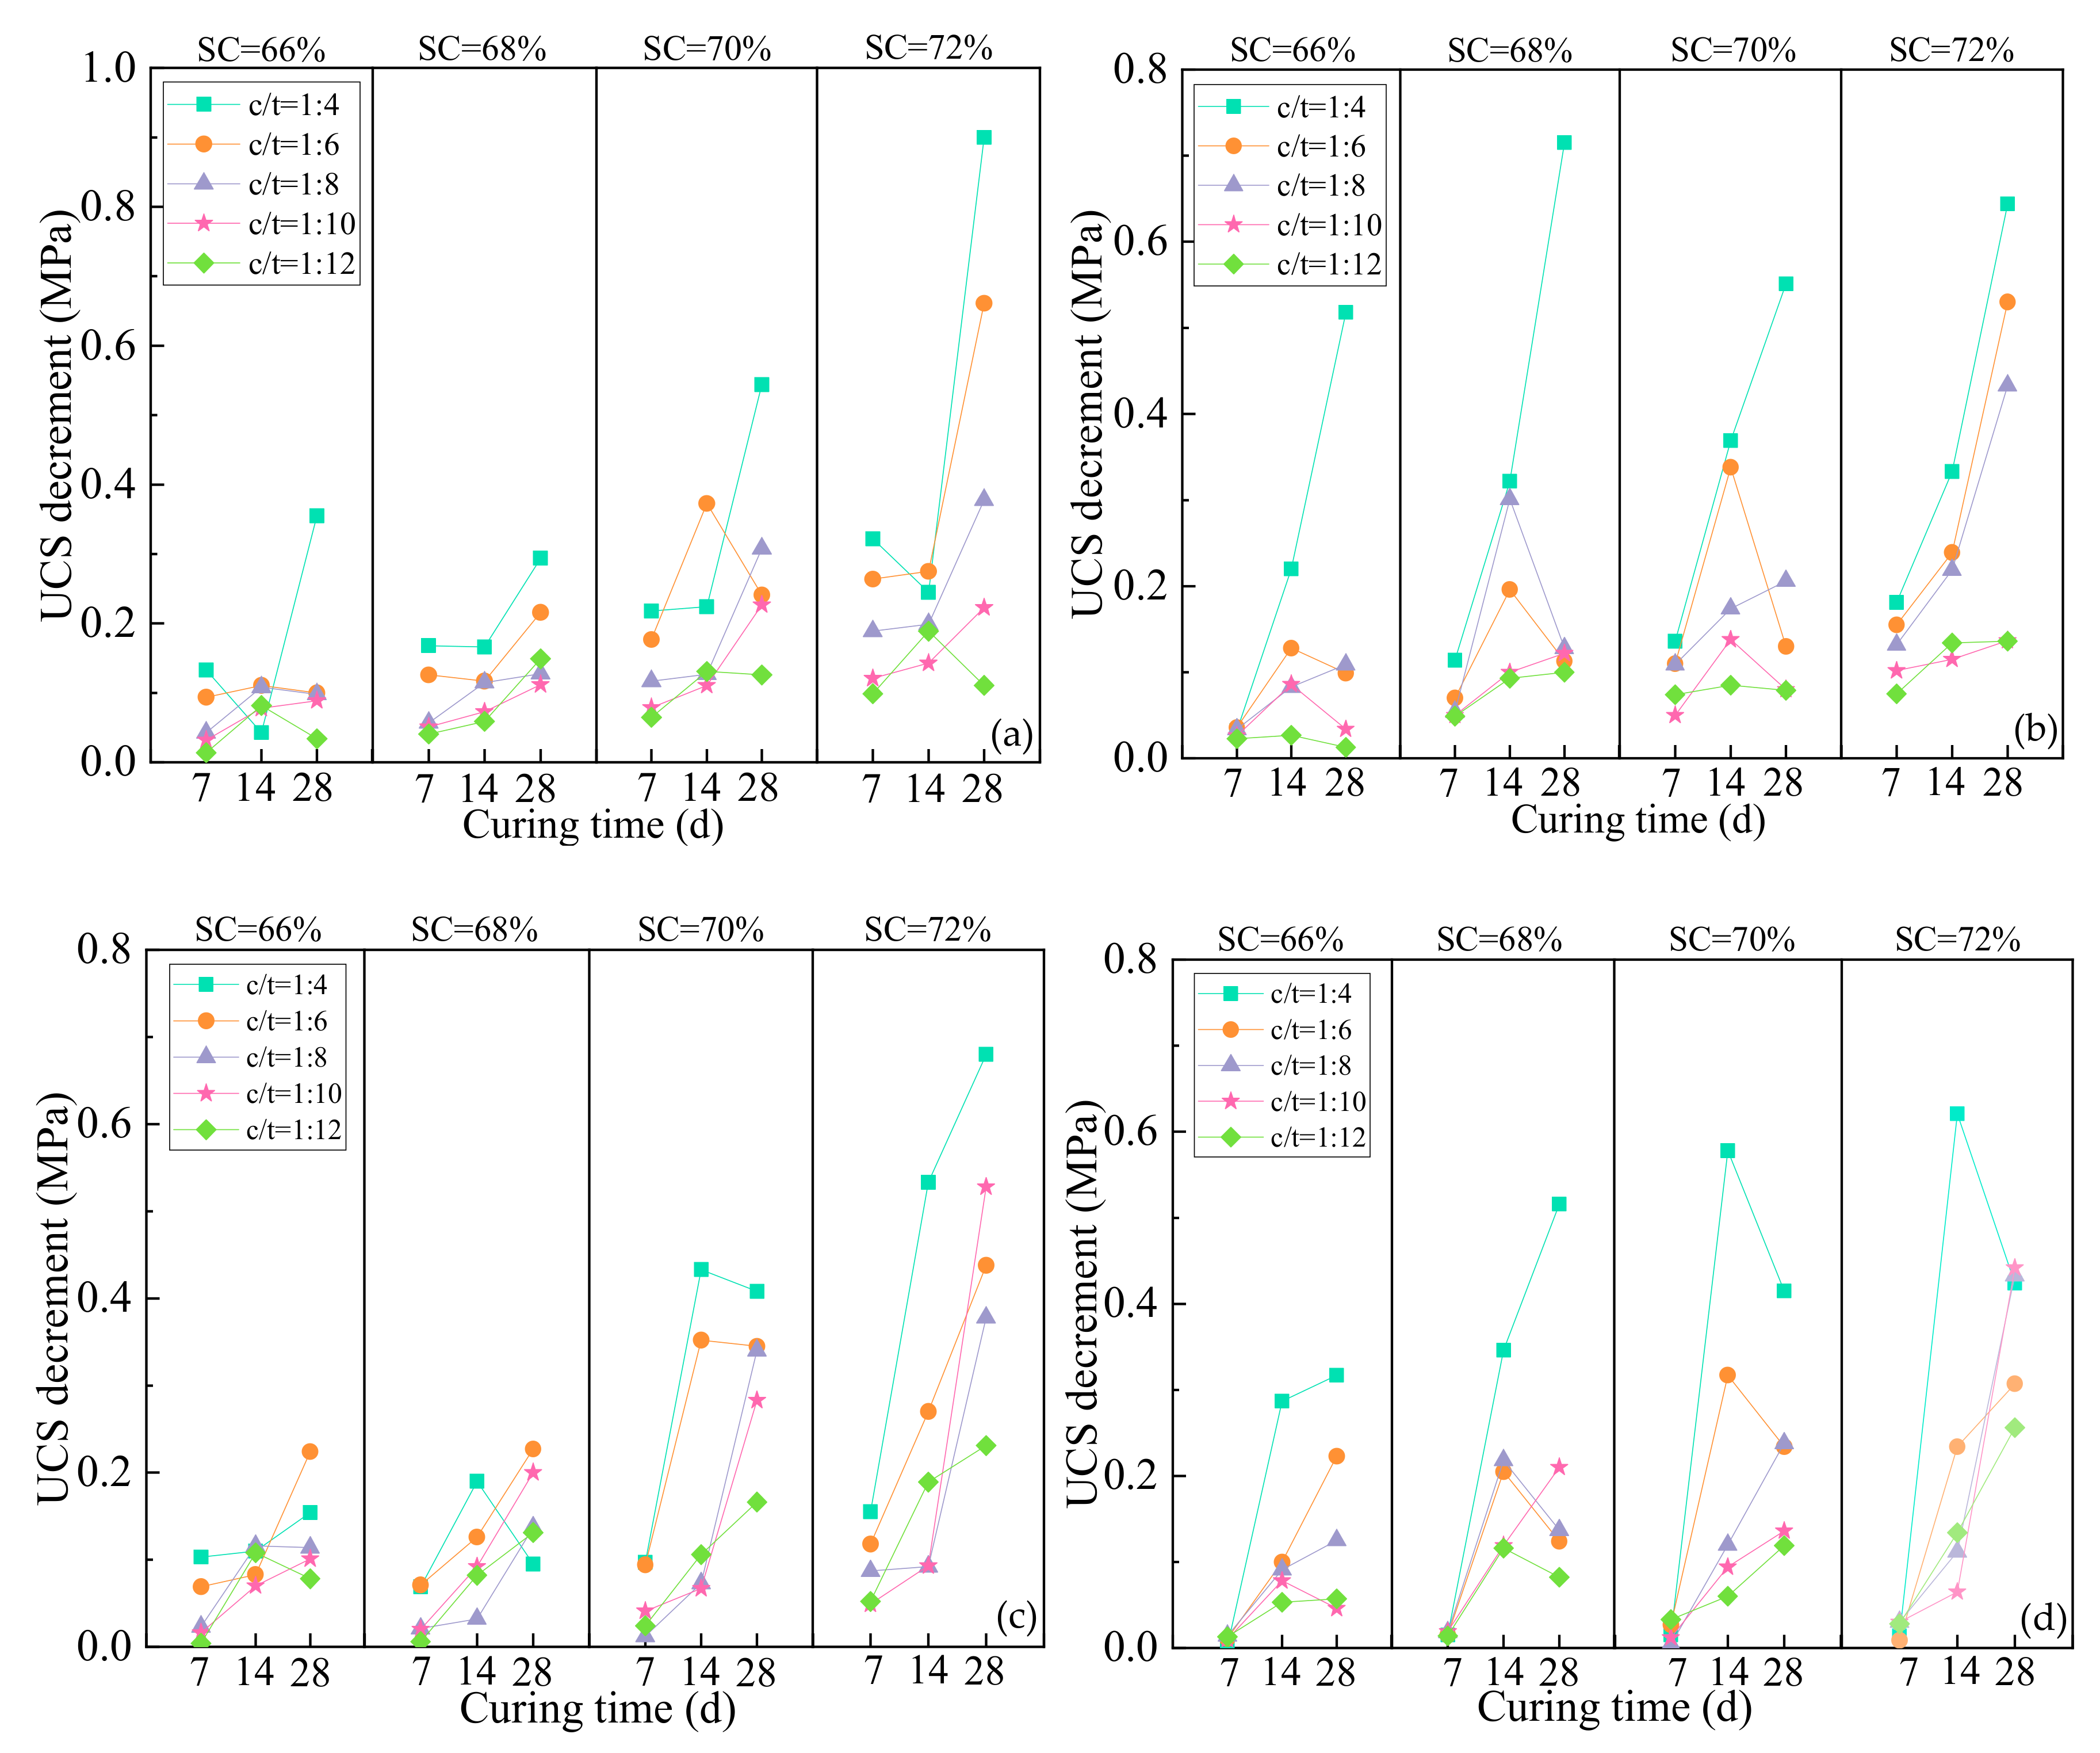
Figure 9a shows the decrement between the UCS of backfill without FA and the UCS of backfill with an FA1 dosage of 20%. As a whole, keeping the curing age and the b/t ratio constant, the UCS decrement increases as the SC increases. Taking the curing age of 14d and the b/t ratio of 1:8 as an example, when the SC is 66%, the UCS decrement is 0.081 MPa; when the SC increased to 68%, the UCS decrement increased to 0.038 MPa; when the SC increased to 70% and 72%, respectively, the UCS decrement increased to 0.232 and 0.242 MPa, respectively. Keeping the curing age and the SC constant, the UCS decrement decreases as the b/t ratio decreases. Taking the curing age of 14d and the SC of 68% as an example, when the b/t ratio is 1:4, the UCS decrement is 0.186 MPa; when the b/t ratio reduced to 1:6, 1:8, 1:10, and 1:12, respectively, the UCS decrement reduced to 0.125, 0.038, 0.098, and 0.009 MPa, respectively. Keeping the SC and the b/t ratio constant, as the curing age increases, the UCS decrement first decreases and then increases, and the general distribution pattern is the shape of a ‘V’. Taking the SC of 68% and the b/t ratio of 1:8 as an example, when the curing age is 7d, the UCS decrement is 0.217 MPa; when the curing age increased to 14d, the UCS decrement reduced to 0.038 MPa; when the curing age increased to 28d, the UCS decrement increased to 0.293 MPa.
Figure 9b shows the UCS decrement between the UCS of backfill without FA and the UCS of backfill with the FA1 dosage of 50%. As a whole, keep the curing age and the b/t ratio constant, the UCS decrement increases as the SC increases. Taking the curing age of 28d and the b/t ratio of 1:4 as an example, when the SC is 66%, the UCS decrement is 0.581 MPa; when the SC increased to 68%, 70%, and 72%, respectively, the UCS decrement increased to 0.806, 1.238, and 1.781 MPa, respectively. Keeping the curing age and the SC constant, the UCS decrement decreases as the b/t ratio decreases. Taking the curing age of 28d and the SC of 70% as an example, when the b/t ratio is 1:4, the UCS decrement is 1.781 MPa; when the b/t ratio reduced to 1:6, 1:8, 1:10, and 1:12, respectively, the UCS decrement reduced to 1.465, 0.890, 0.658, and 0.526 MPa, respectively. Keep the SC and the b/t ratio constant, as the curing age increases, the UCS decrement first decreases and then increases, the distribution pattern is the shape of a ‘V’. Taking the SC of 68% and the b/t ratio of 1:4 as an example, when the curing age is 7d, the UCS decrement is 0.561 MPa; when the curing age increased to 14d, the UCS decrement reduced to 0.352 MPa; when the curing age increased to 28d, the UCS decrement increased to 0.806 MPa.
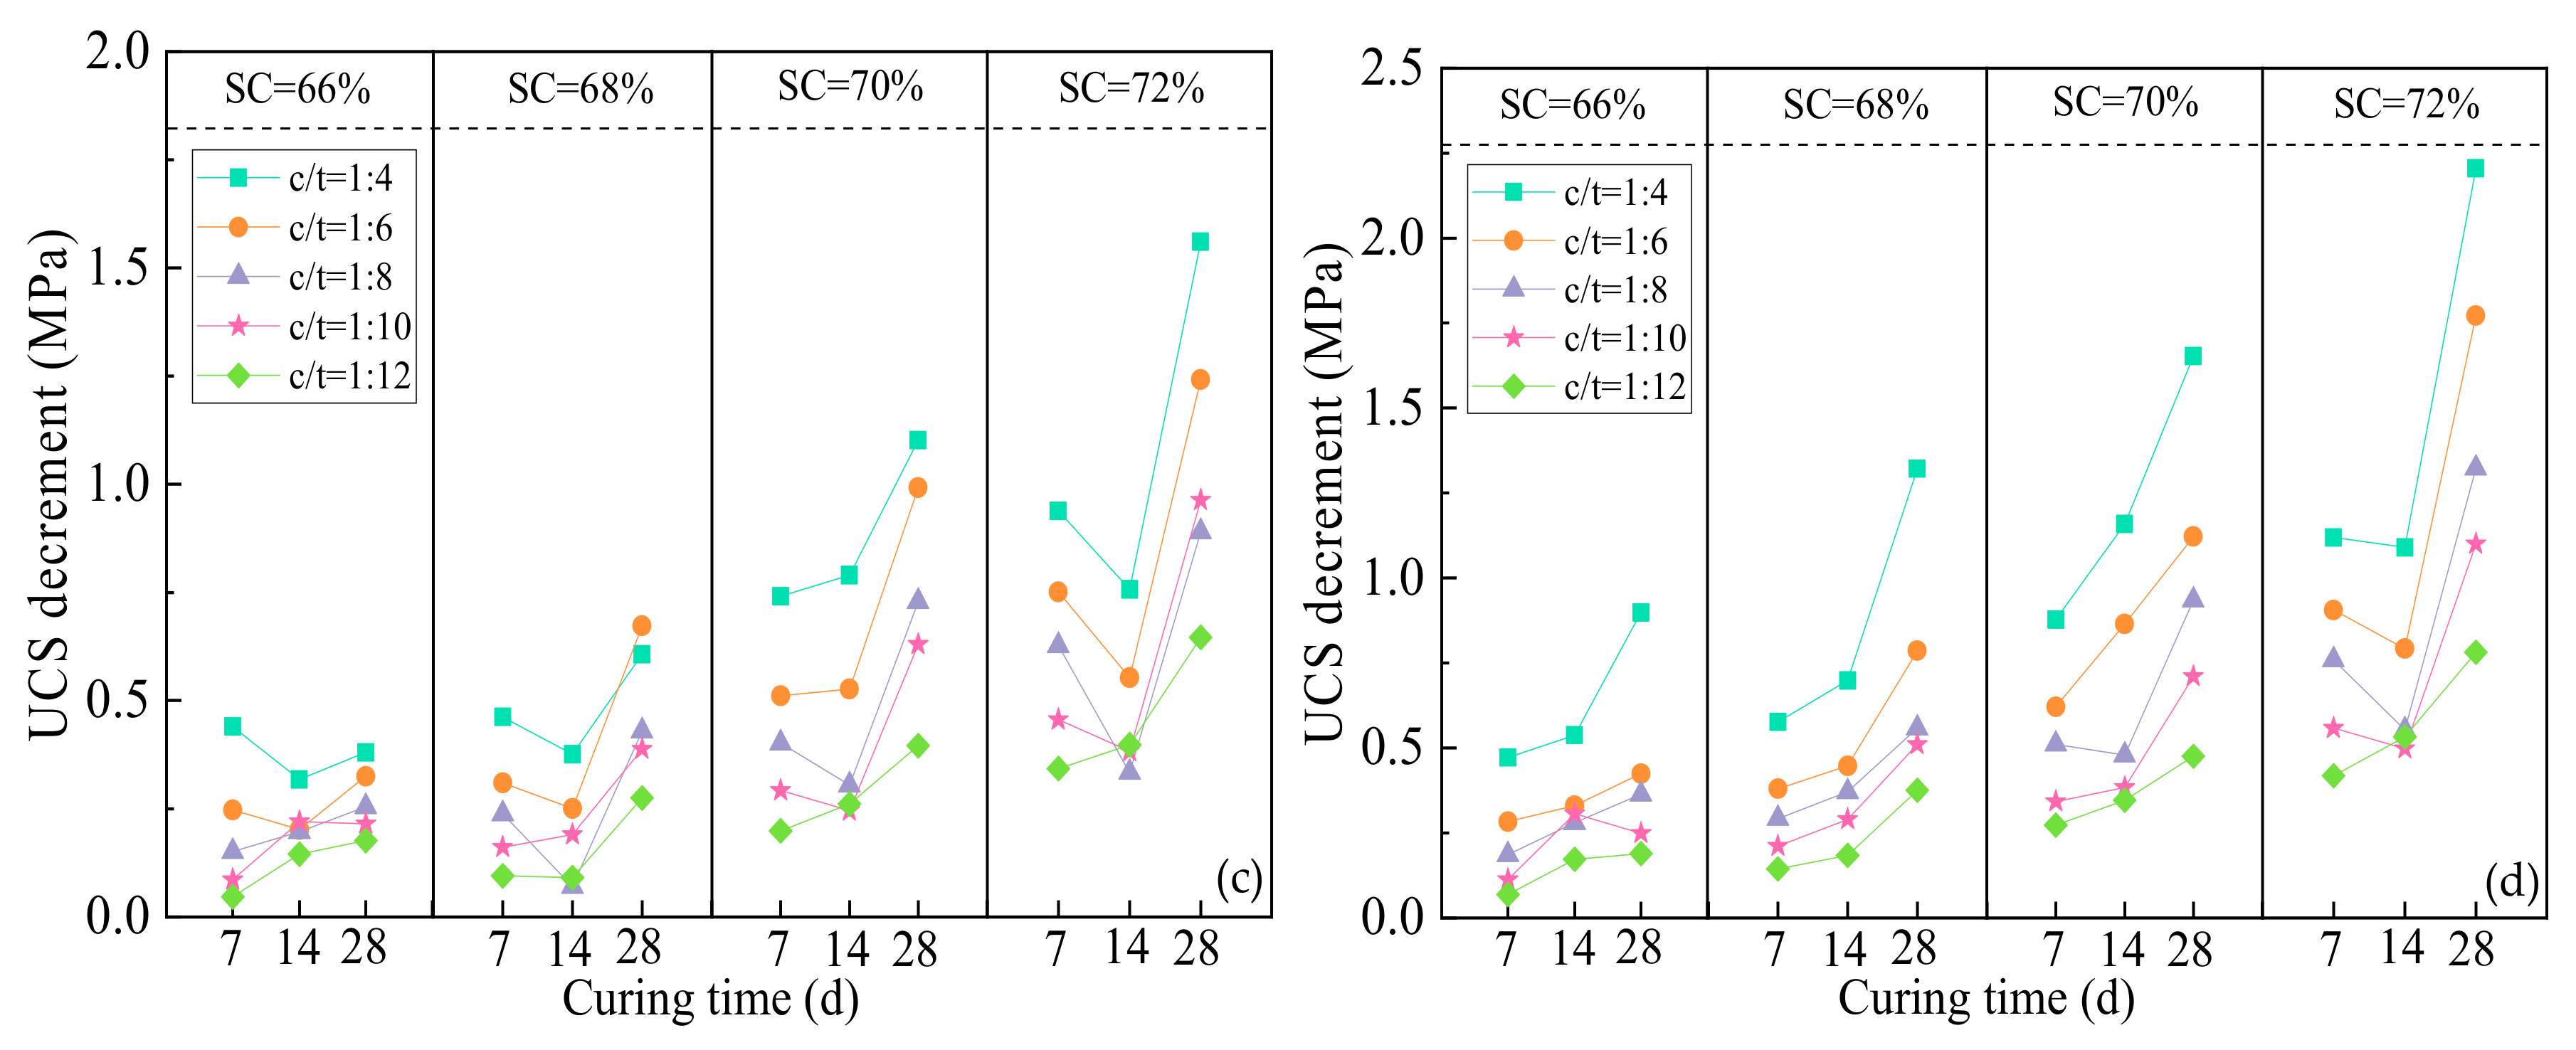
Figure 9c shows the UCS decrement between the UCS of backfill without FA and the UCS of backfill with FA2 dosage of 20%. As a whole, keep the curing age and the b/t ratio constant, the UCS decrement increases as the SC increases. Taking the curing age of 28d and the b/t ratio of 1:4 as an example, when the SC is 66%, the UCS decrement is 0.380 MPa; when the SC increased to 68%, 70%, and 72%, respectively, the UCS decrement increased to 0.607, 1.102, and 1.561 MPa, respectively. Keep the curing age and the SC constant, the UCS decrement decreases as the b/t ratio decreases. Taking the curing age of 7d and the SC of 70% as an example, when the b/t ratio is 1:4, 1:6, 1:8, 1:10, and 1:12, respectively, the corresponding UCS decrement is 0.938, 0.715, 0.627, 0.456, and 0.343 MPa, respectively. Keeping the SC and the b/t ratio constant, as the curing age increases, the UCS decrement first decreases and then increases, the distribution pattern is the shape of a ‘V’. Taking the SC of 72% and the b/t ratio of 1:4 as an example, when the curing age is 7, 14, and 28, respectively, corresponding UCS decrement is 0.938, 0.757, and 1.561, respectively.
Figure 9d shows the UCS decrement between the UCS of backfill without FA and the UCS of backfill with FA2 dosage of 50%. Keep the curing age and the b/t ratio constant, the UCS decrement increases as the SC increases. Keeping the curing age and the SC constant, the UCS decrement decreases as the b/t ratio decreases. Keeping the curing age and the b/t ratio constant, when the SC is 66%, 68%, and 70%, the UCS decrement increases as the curing age increases; when the SC is 72%, as the curing age increases, the UCS decrement first decreases and then increases.
A comprehensive analysis of Figure 9a–d shows that compared to the UCS of CTB, the UCS decrement of backfill with FA increases as the SC increases, decreases as the b/t ratio decreases, first increases and then decreases as the curing age increases. An analysis of the reasons shows that as the SC increases, the porosity inside the backfill decreases, the UCS of CTB and the UCS of backfill with FA both increase, then due to the addition of FA, the UCS increment of the backfill with FA decreases, and causes the UCS decrement to increase. As the b/t ratio decreases, the content of binder inside the backfill decreases, the C-S-H gel produced by the hydration reaction decreases, the UCS of CTB and the UCS of backfill with FA both decreases, the smaller the b/t ratio, the smaller the difference of the C-S-H gel produced by hydration reaction inside the backfill, so the UCS decrement decreases. In the initial curing phase (CT = 7d), the binder inside the backfill rapidly hydrates with water and tailings particles, which results in the strength increasing rapidly, the strength of the backfill varies greatly with different types; in the curing interim (CT = 14d), the hydration reaction process inside the backfill is almost complete, the strength of backfill reaches a high level with different types, and the strength difference decreases; in the curing later period (28d), the hydration reaction inside the backfill is basically over, the strength of the backfill no longer changes significantly with the curing age, and the strength of different types of backfill is close to its peak strength, leading to a strength difference increase again.
Figure 10 shows the strength difference results between the backfill sample with FA of different SC, different b/t ratio, and different curing ages. Figure 10a shows the strength difference results between the backfill with an FA1 dosage of 20% and the backfill with an FA1 dosage of 50%. It can be seen from Figure 10a that all of the results are positive, and it shows that the UCS of backfill decreases as the FA1 dosage increases. Keeping the curing age and the b/t ratio constant, the UCS decrement increases as the SC increases, taking the b/t ratio of 1:4 as an example, when the SC increased from 66% to 72% at the curing age of 7d, the UCS decrement increased from 0.133 to 0.322 MPa; when the SC increased from 66% to 72% at the curing age of 14d, the UCS decrement increased from 0.043 to 0.245 MPa; when the curing age was 28d, the corresponding UCS decrement increased from 0.355 to 0.900 MPa. Keeping the curing age and the SC constant, the UCS decrement decreases as the b/t ratio decreases, taking the SC of 68% as an example, when the b/t ratio decreased from 1:4 to 1:12 at the curing age of 7d, the UCS decrement decreased from 0.168 to 0.041 MPa; when the curing age was 14 and 28d, respectively, the corresponding UCS decrement decreased from 0.166 to 0.059 MPa and decreased from 0.294 to 0.149 MPa, respectively. Keeping the SC and the b/t ratio constant, as the curing age increases, the UCS decrement increases slowly first and then quickly. Taking the SC of 68% and the b/t ratio of 1:12 as an example, when the curing age is 7d, the UCS decrement is 0.041 MPa; when the curing age is 14d, the UCS decrement is increased to 0.059 MPa; when the curing age is 28d, the UCS decrement is increased to 0.149 MPa. Figure 10b shows the strength difference results between the backfill with an FA2 dosage of 20% and the backfill with an FA2 dosage of 50%. It can be seen from Figure 10b that all of the results are positive, and it shows the UCS of backfill decreases as the dosage of FA2 increases. When the SC is 66%, 68%, and 70%, as the curing age increases, the UCS decrement shows a trend of increase first and then a decrease; when the SC is 72%, as the curing age increases, the UCS decrement increases slowly first and then quickly. Under the same curing age and SC condition, the UCS decrement decreases as the b/t ratio decreases. Under the same curing age and b/t ratio condition, the UCS decrement increases as the SC increases. Figure 10c,d shows the strength difference results between the backfill with FA1 and the backfill with FA2 when the dosage of FA is 20% and 50%, respectively. All of the results in the figure are positive, and it shows under the same FA dosage condition that the strength of backfill with FA1 is bigger than backfill with FA2. The results shown in Figure 10c,d show no obvious pattern, but on the whole, under the same curing age and b/t ratio condition, the UCS decrement increases as the SC increases; under the same curing age and SC condition, the UCS decrement decreases as the b/t ratio decreases; under the same SC and b/t ratio condition, as the curing age increases, the UCS decrement first increases and then decreases.
3.3. Relation Between UCS of Backfill and Its Viscosity
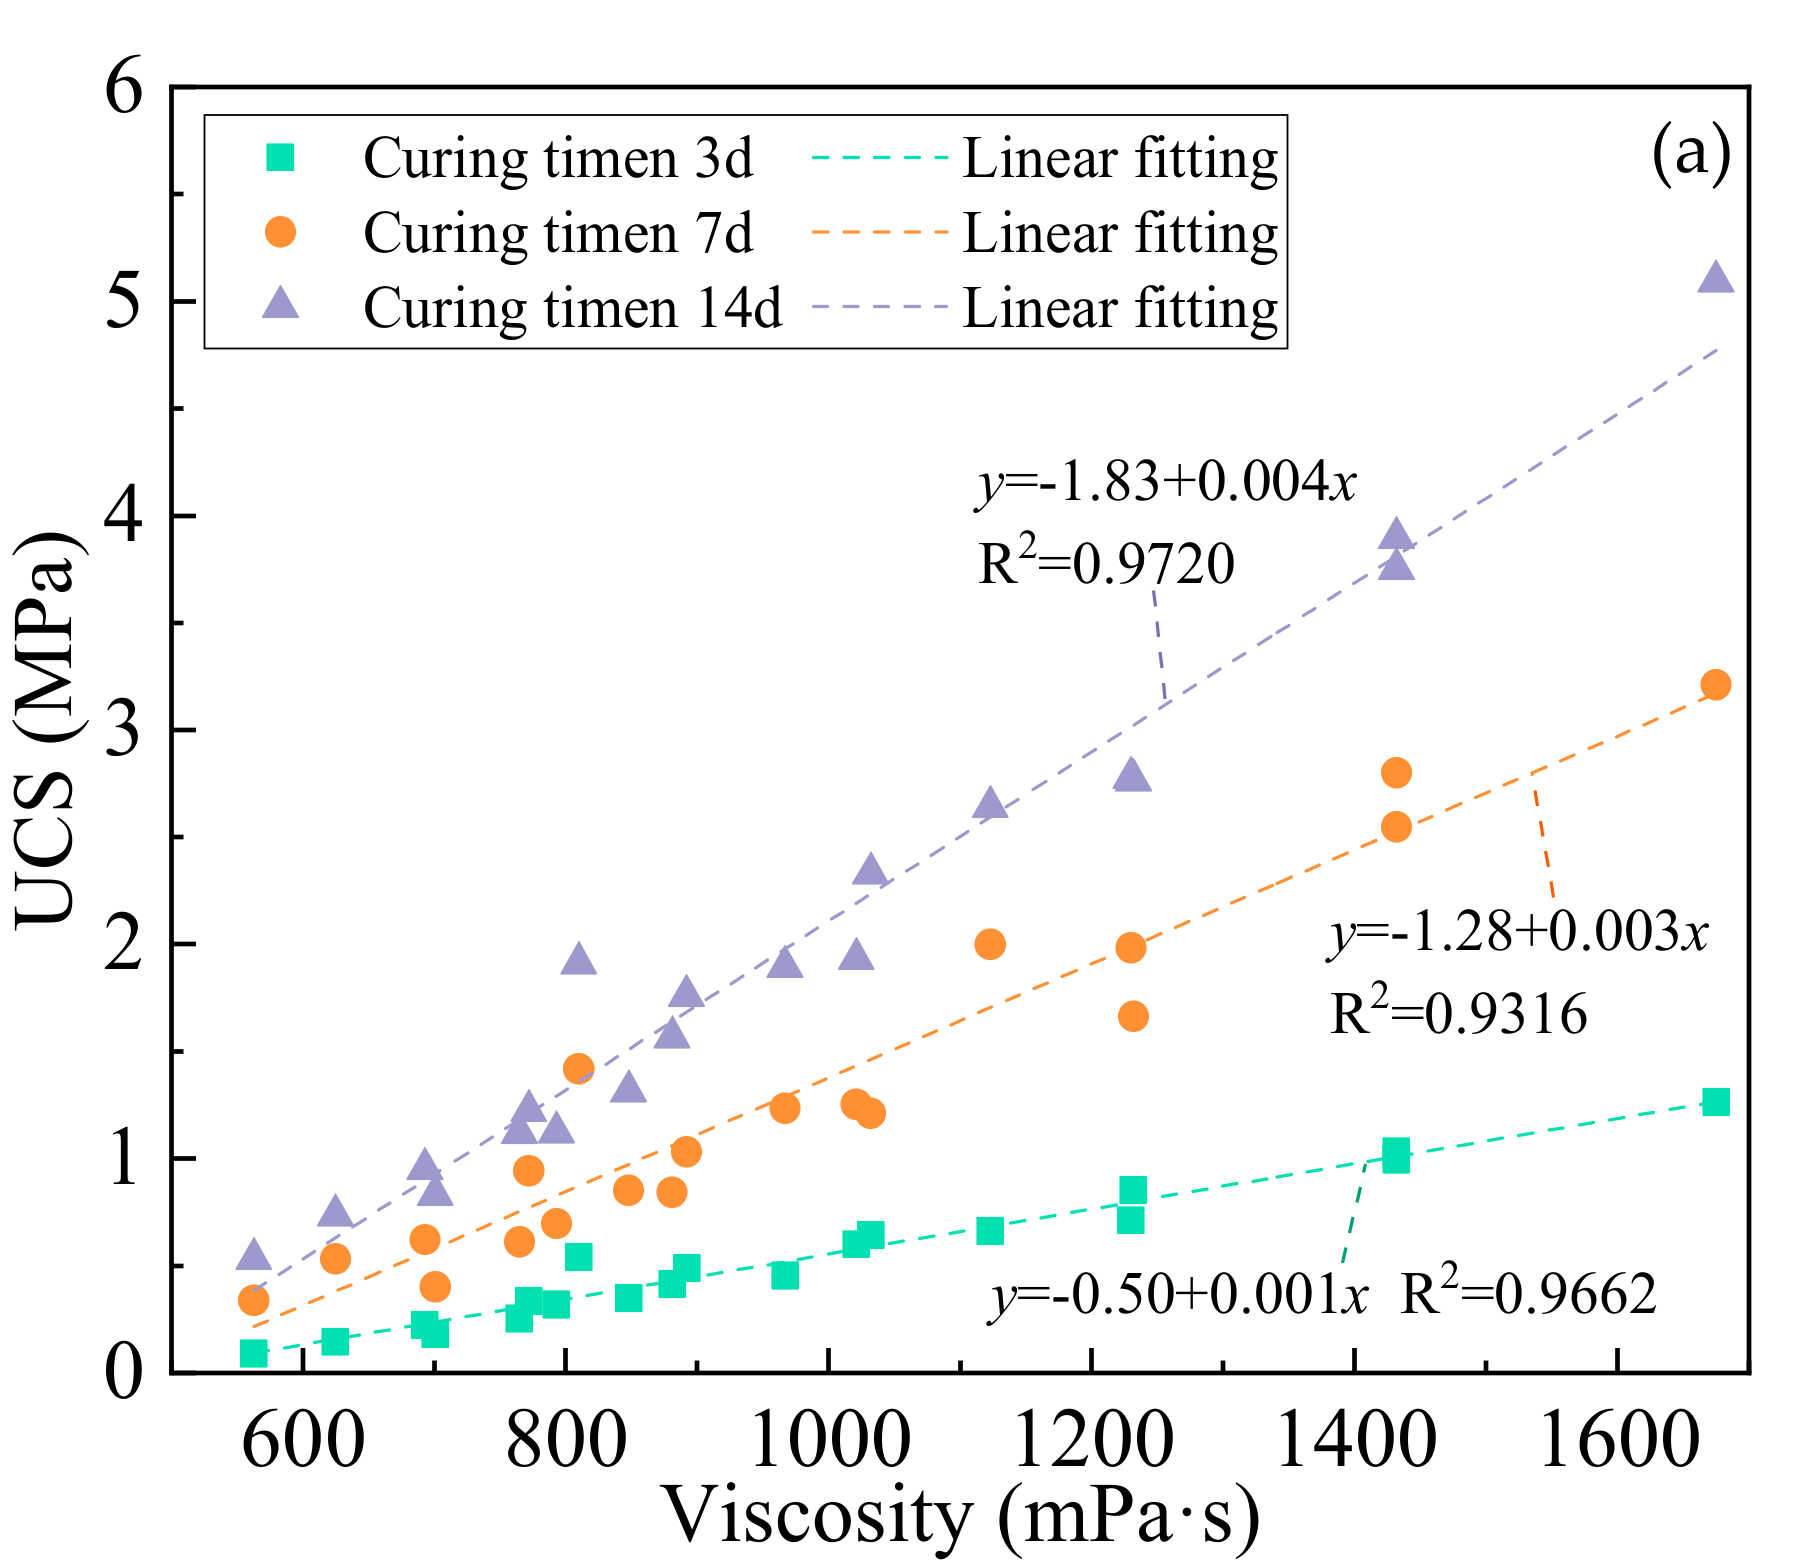
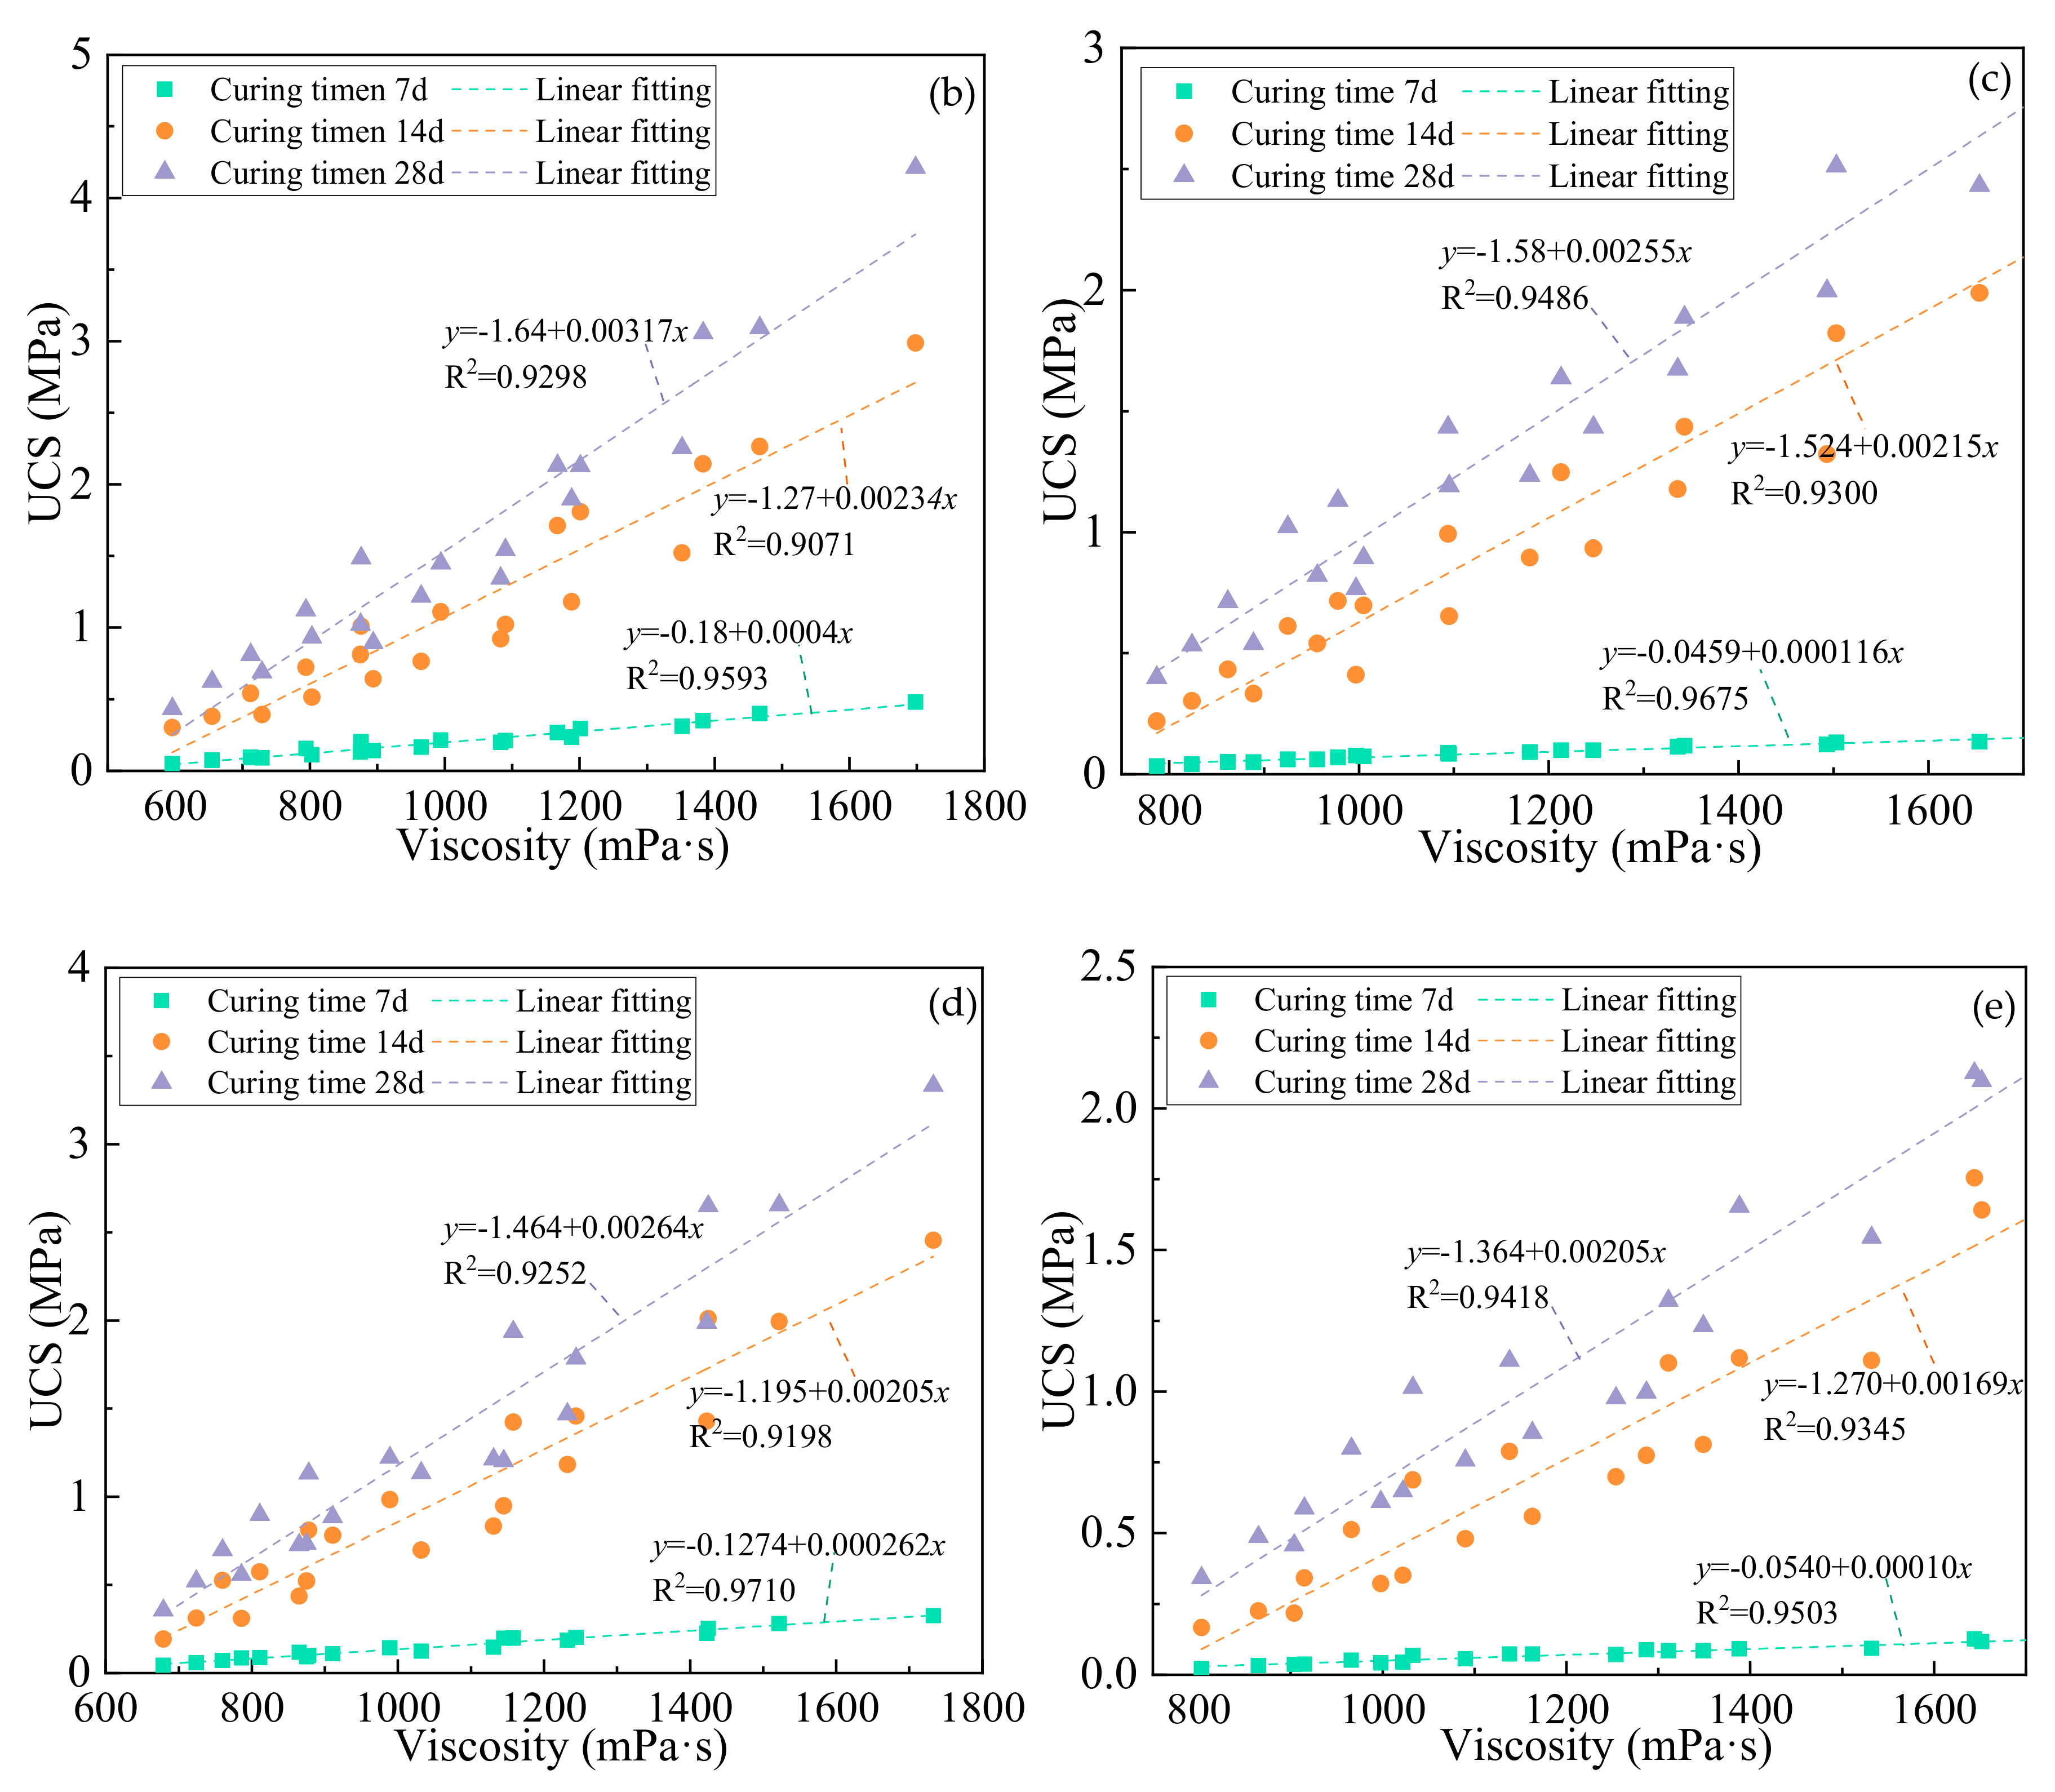
According to the previous research, we can see that the viscosity and the UCS of backfill show the same pattern of change, they both increases as the SC, the b/t ratio, and the curing age increase. The change mechanism of backfill viscosity and UCS is also very similar, as the SC increases, the solid particle content increases, internal pores decrease, the friction action between particle and particle increases, strength and viscosity increases; as the b/t ratio increases, the binder particle content inside the backfill increases, the amount of gels produced by hydration reaction also increases, strength and viscosity increases; as the curing age increases, the hydration reaction inside the backfill is sufficient, the amount of gels produced by the hydration reaction also increases, and strength and viscosity increases. Therefore, whether there is a certain internal relationship between the backfill viscosity and its strength, the viscosity results can be used to reasonably represent the strength results. Figure 11 shows the relationship diagram between the viscosity and the strength of the backfill of different types under the three curing age conditions. Figure 11a shows the relationship between the viscosity and strength of the CTB sample under the three curing ages, use linear fitting for the relationship between them, the fitting multiple correlation coefficient R2 is 0.9662, 0.9316, and 0.9720, respectively, and the fitting multiple correlation coefficients R2 are all greater than 0.9, so the CTB viscosity had a good linear functional relationship with its strength. Figure 11b–e is the relationship diagram between the viscosity and strength of CFTB1-1, CFTB1-2, CFTB2-1, and CFTB2-2, respectively. A linear function is also used for fitting analysis, under the three curing age conditions, the fitting degree of the viscosity and UCS of CFTB1-1 is 0.9593, 0.9071, and 0.9298, respectively; the fitting degree of the viscosity and UCS of CFTB1-2 is 0.9675, 0.9300, and 0.9486, respectively; the fitting degree of the viscosity and UCS of CFTB2-1 is 0.9710, 0.9198, and 0.9252, respectively; the fitting degree of the viscosity and UCS of CFTB2-2 is 0.9503, 0.9345, and 0.9418, respectively. The fitted multiple correlation coefficients R2 are all greater than 0.9; therefore, a comprehensive analysis shows that the linear function can better characterize the internal relationship between the viscosity and UCS of backfill.
3.4. Prediction of Backfill Strength
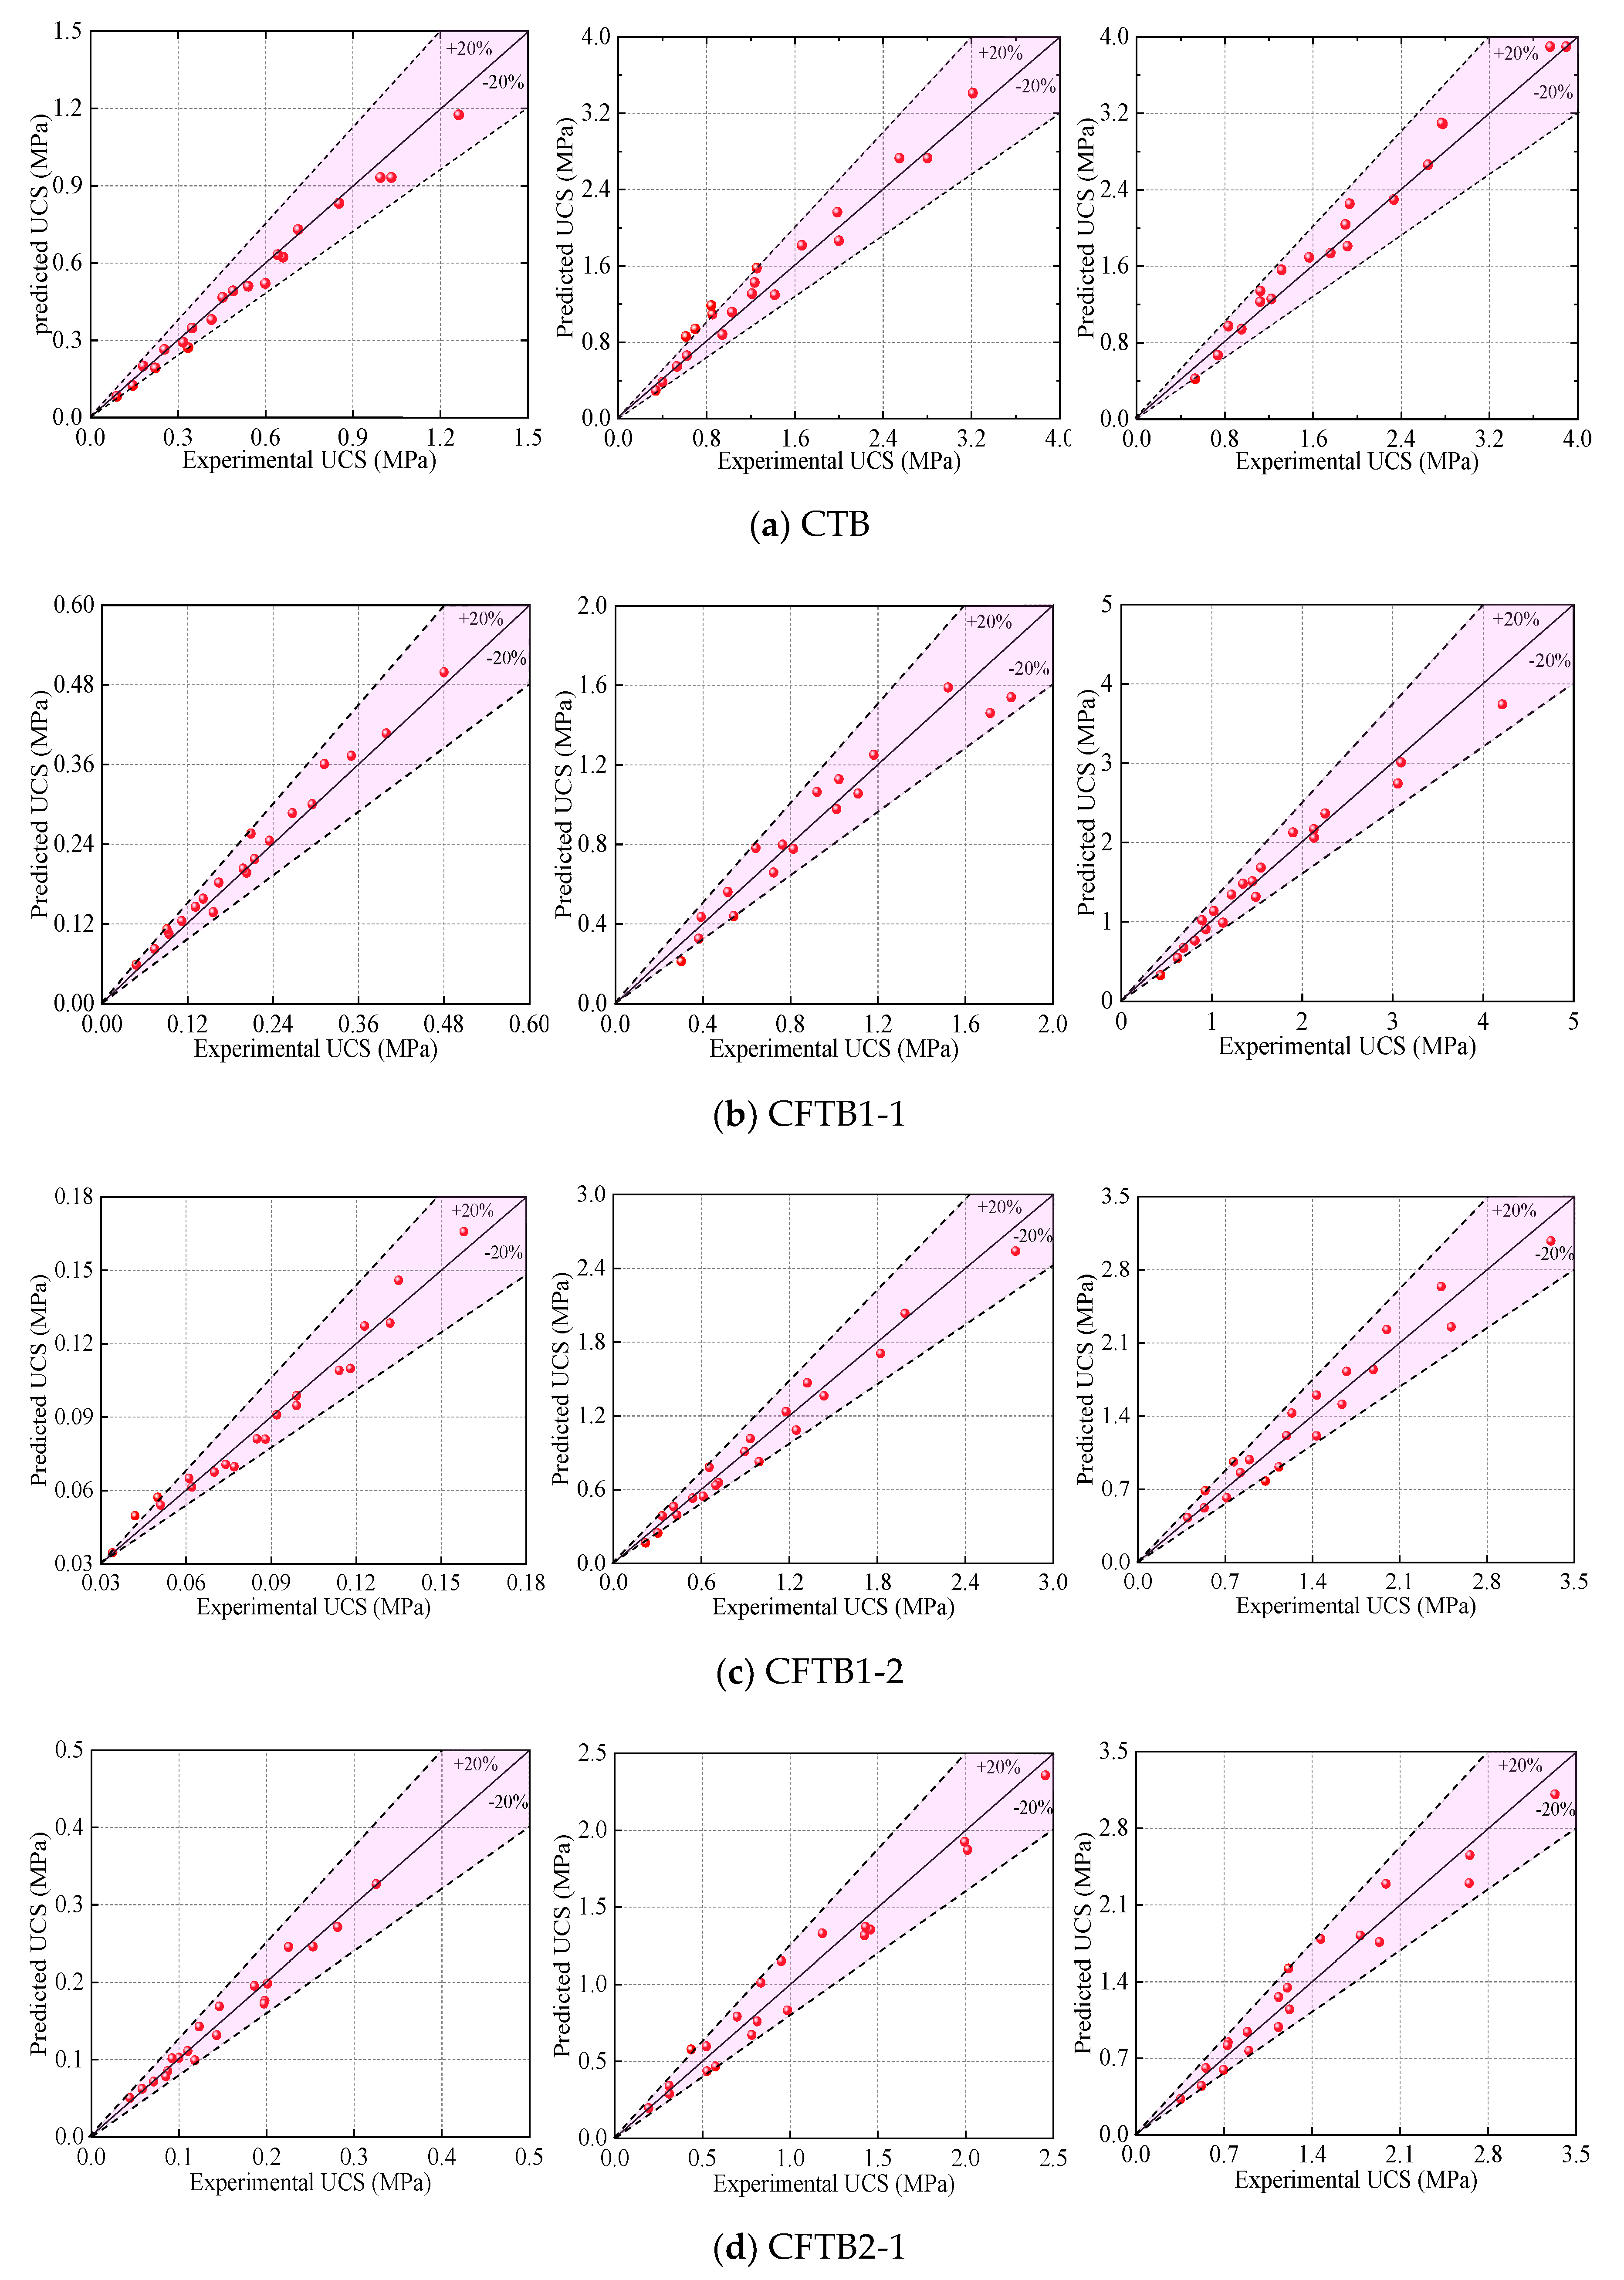
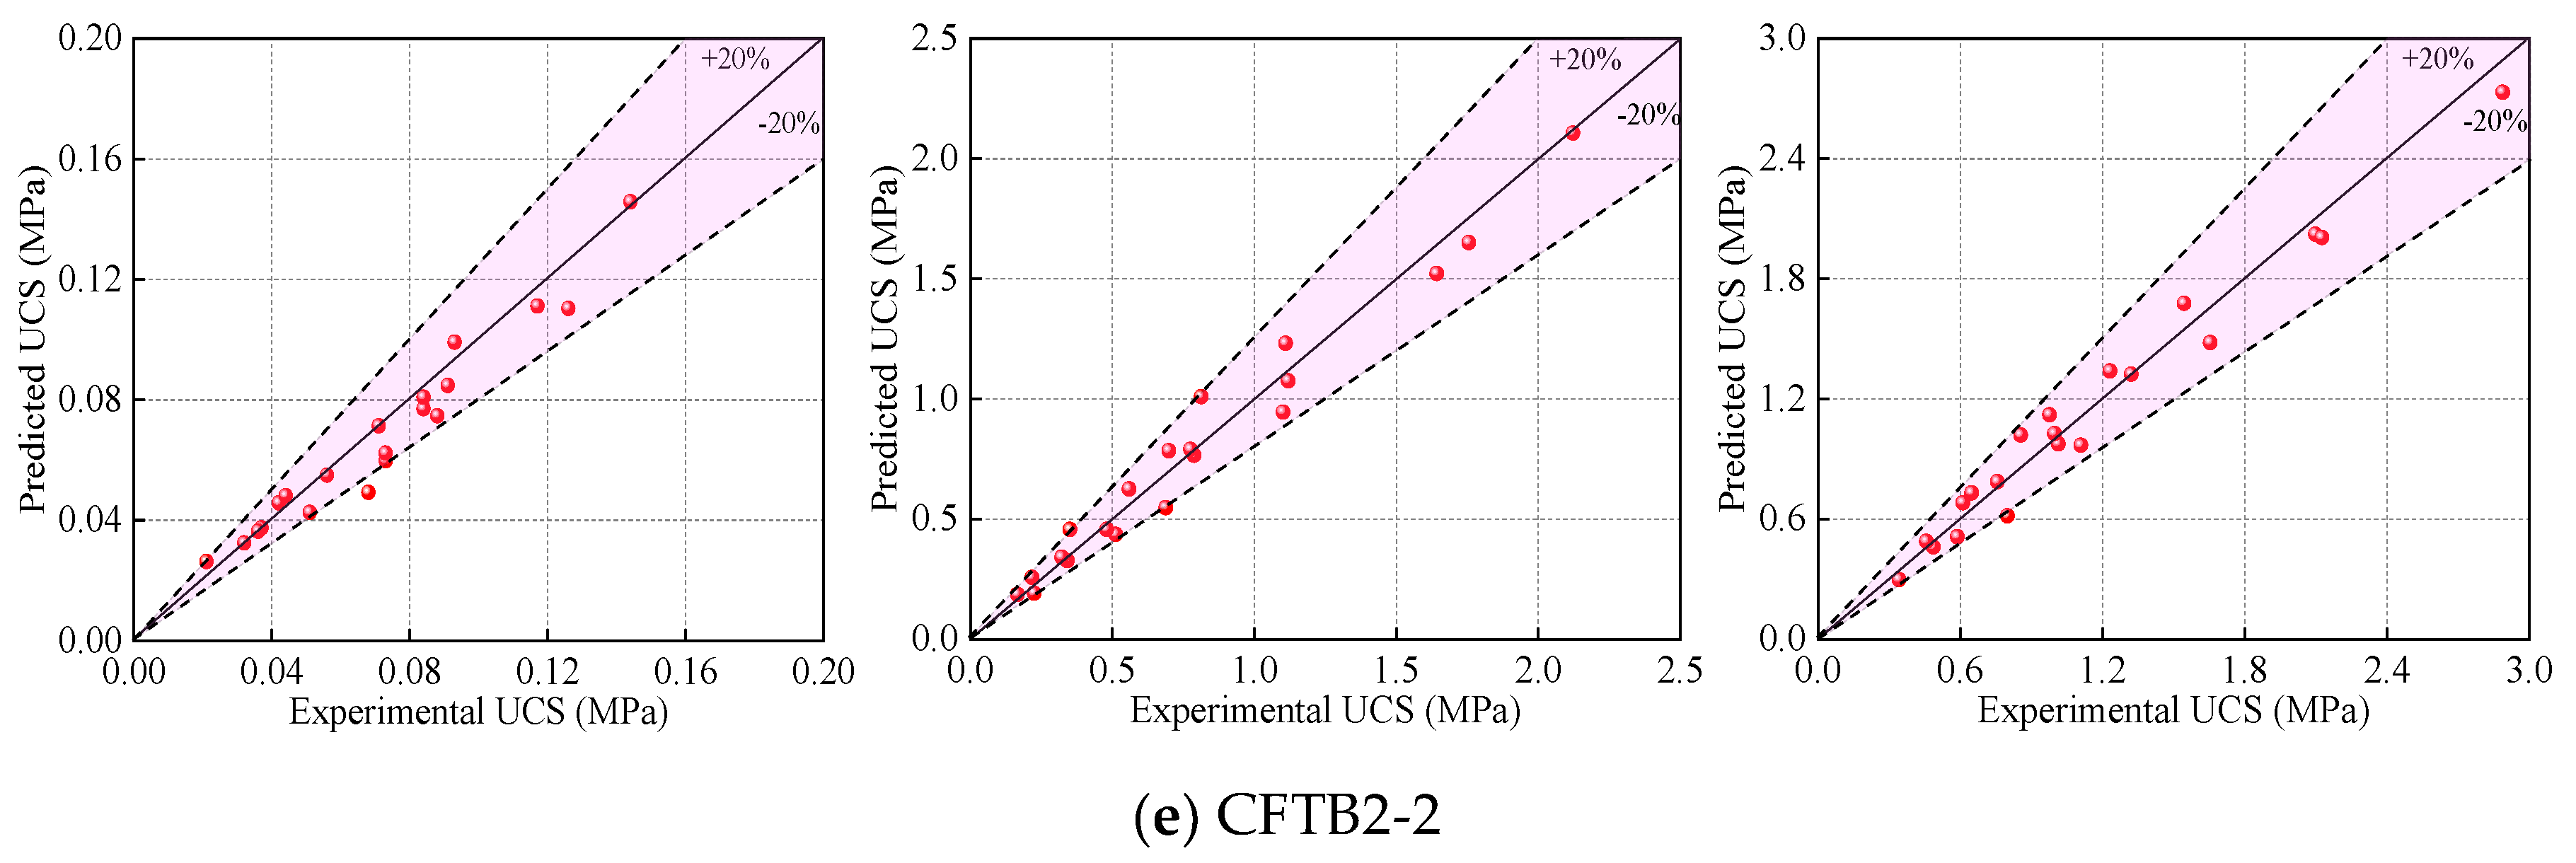
The results of the previous chapters show that there is a linear functional relationship between the viscosity and UCS of different types of backfill. The viscosity parameter measurement of backfill is more simple, convenient, and efficient, so the viscosity parameter of backfill can be used to predict its strength parameter. According to the functional relationship between the viscosity and strength of different curing ages of the backfill sample in Figure 11, the difference between the test value and the predicted value can be obtained under different curing ages, and the results are shown in Figure 12. It can be seen from Figure 12 that the majority of the different ranges between the test value and the predicted value is controlled within 20%, only a few data points are scattered beyond the 20% range, so it is considered that the strength test value of the backfill sample differs little with the predicted value, and the predicted result is relatively reliable.
In addition to fitting analysis, statistical differences between the test values and the predicted values should also be evaluated to determine that the functional relationship between the viscosity and strength of backfill can be used reliably for backfill strength prediction. Given UCS test data of any backfill sample is σfi, the corresponding prediction UCS for its viscosity is σpi, and the total sample is Na. Introducing Mean Square Error (MSE), Root Mean Square Error (RMSE), Mean Absolute Error (MAE), and Mean Absolute Percentage Error (MAPE), we evaluated the error of the UCS test value and prediction value. The evaluation indexes of various evaluation models are shown in Table 7.
It can be seen from Table 7 that MSE indexes are all less than 0.1, RMSE indexes are all less than 0.2, MAE indexes are all less than 0.2, MAPE indexes are all less than 15%, and most MAPE indexes are all less than 10%. Based on the above results, it can be concluded that the adoption of the backfill viscosity parameter to predict its strength parameter is reasonable and reliable.
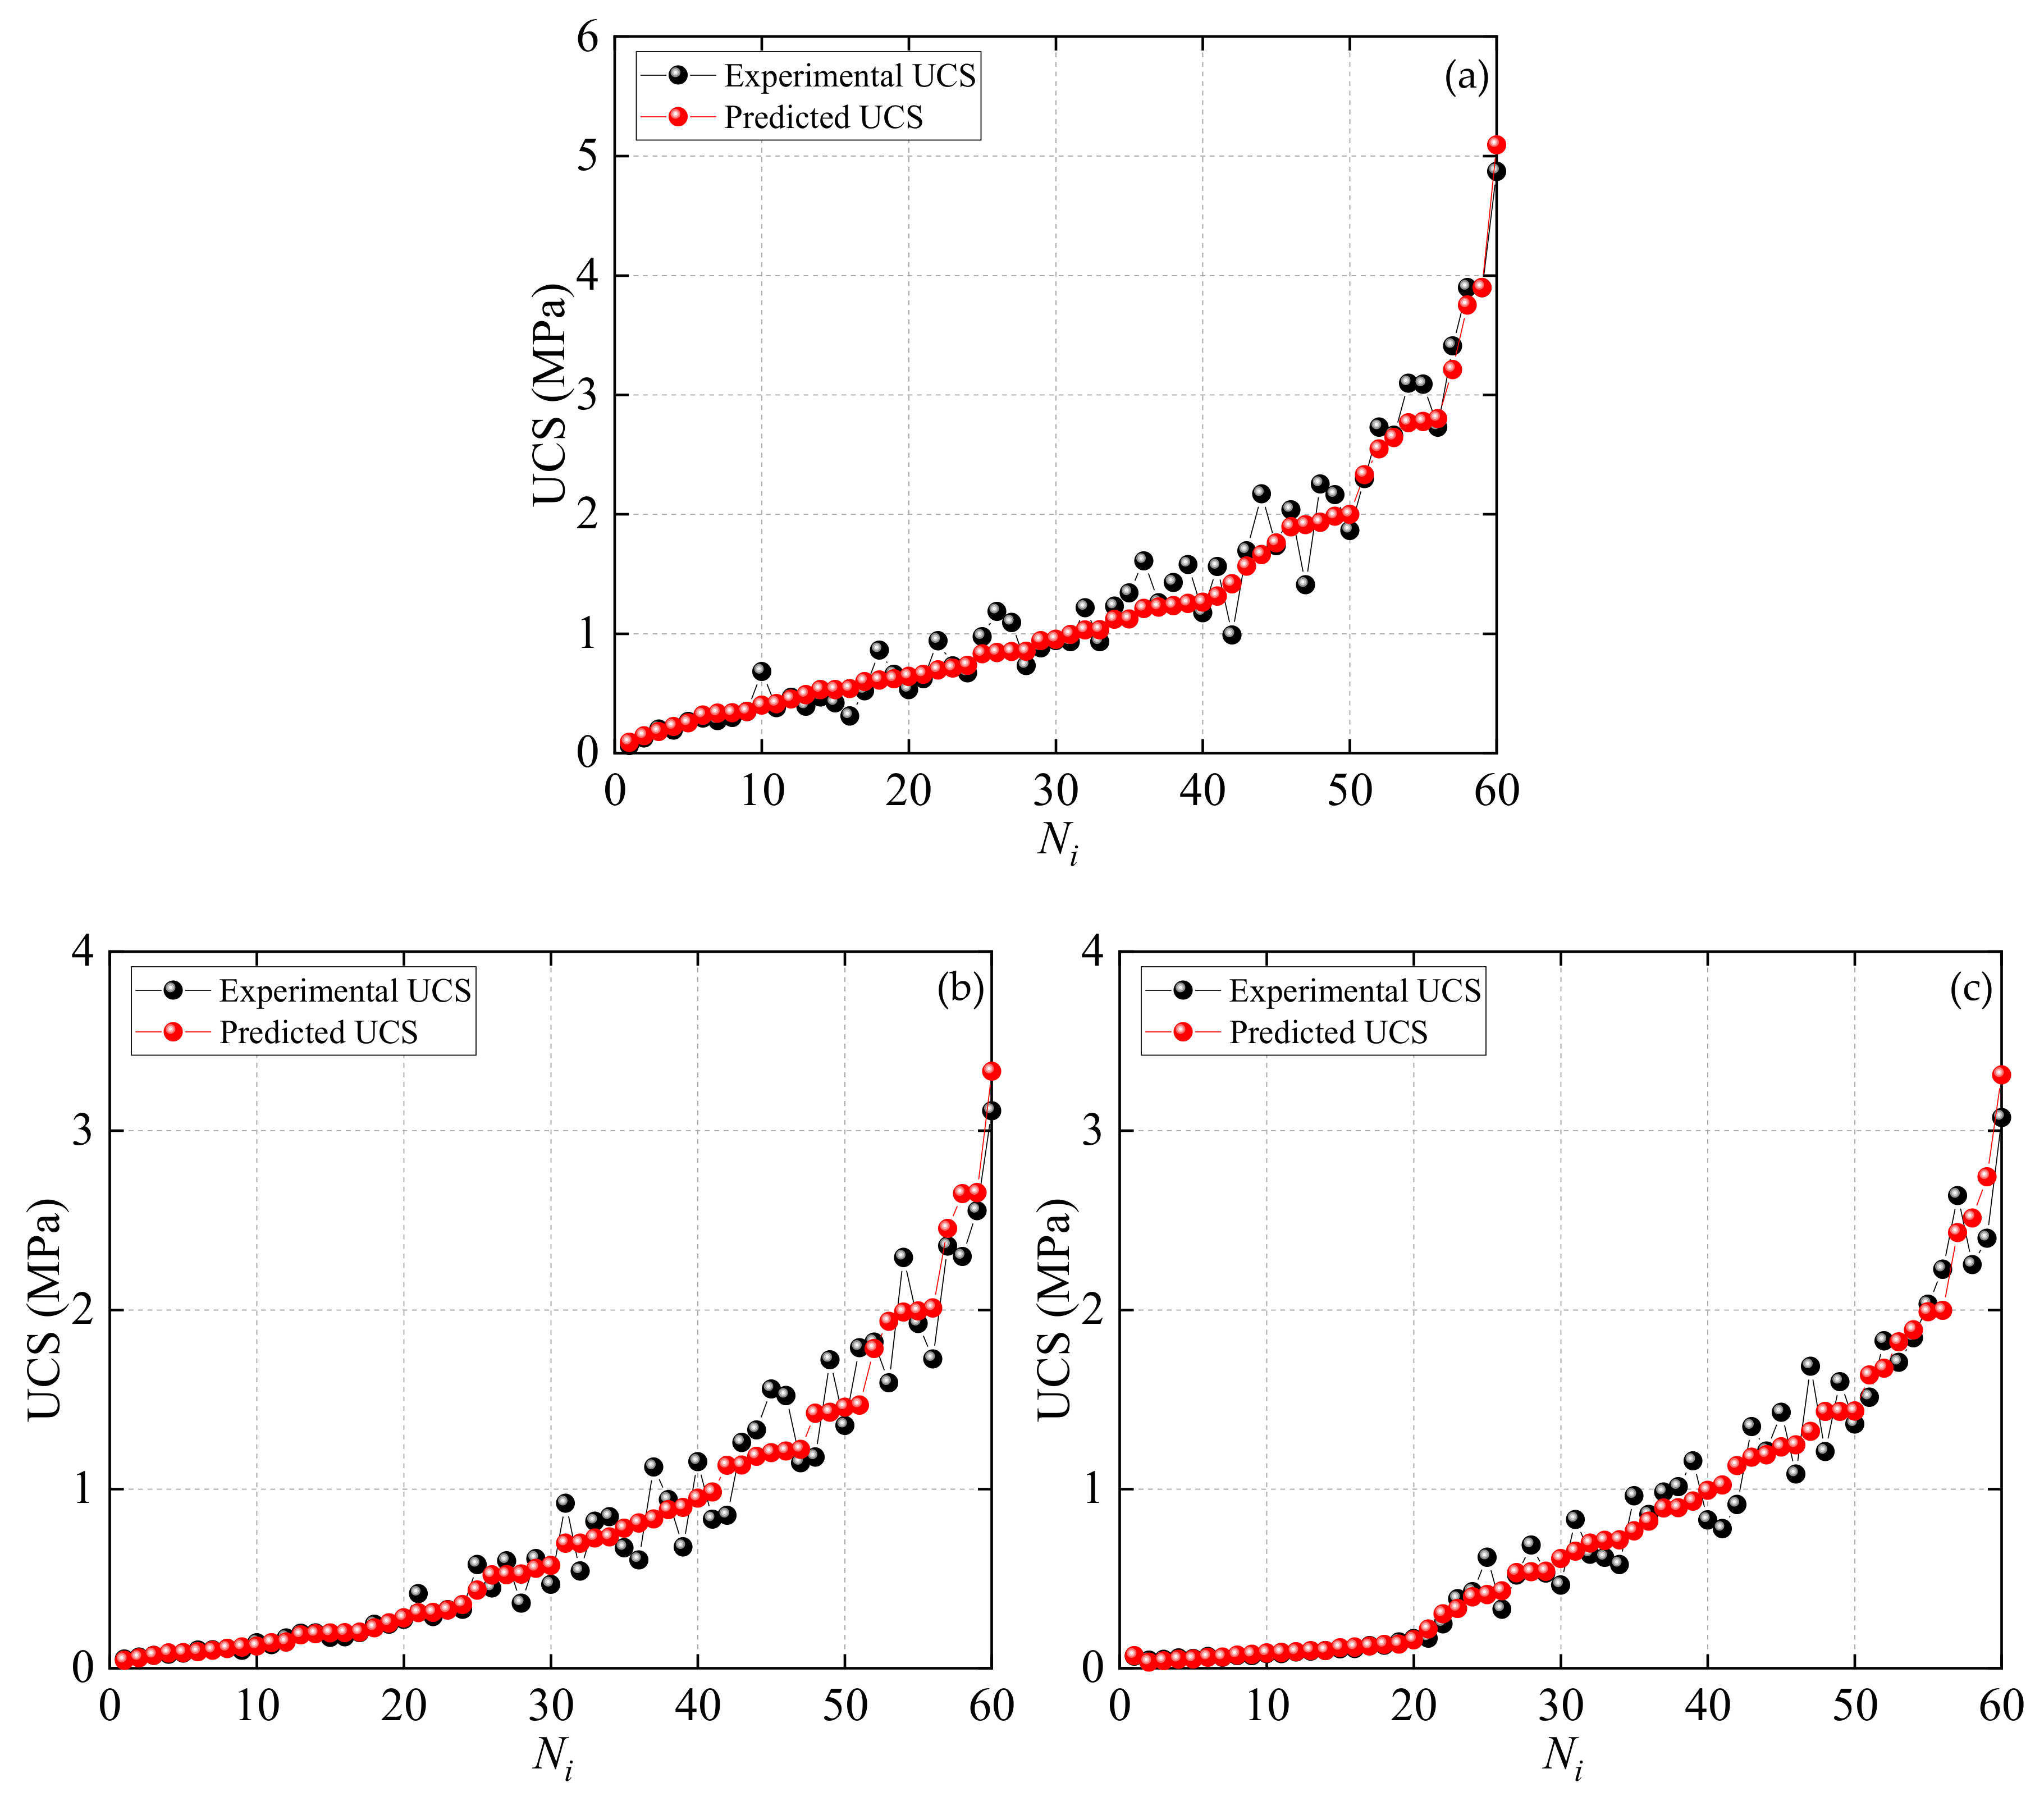
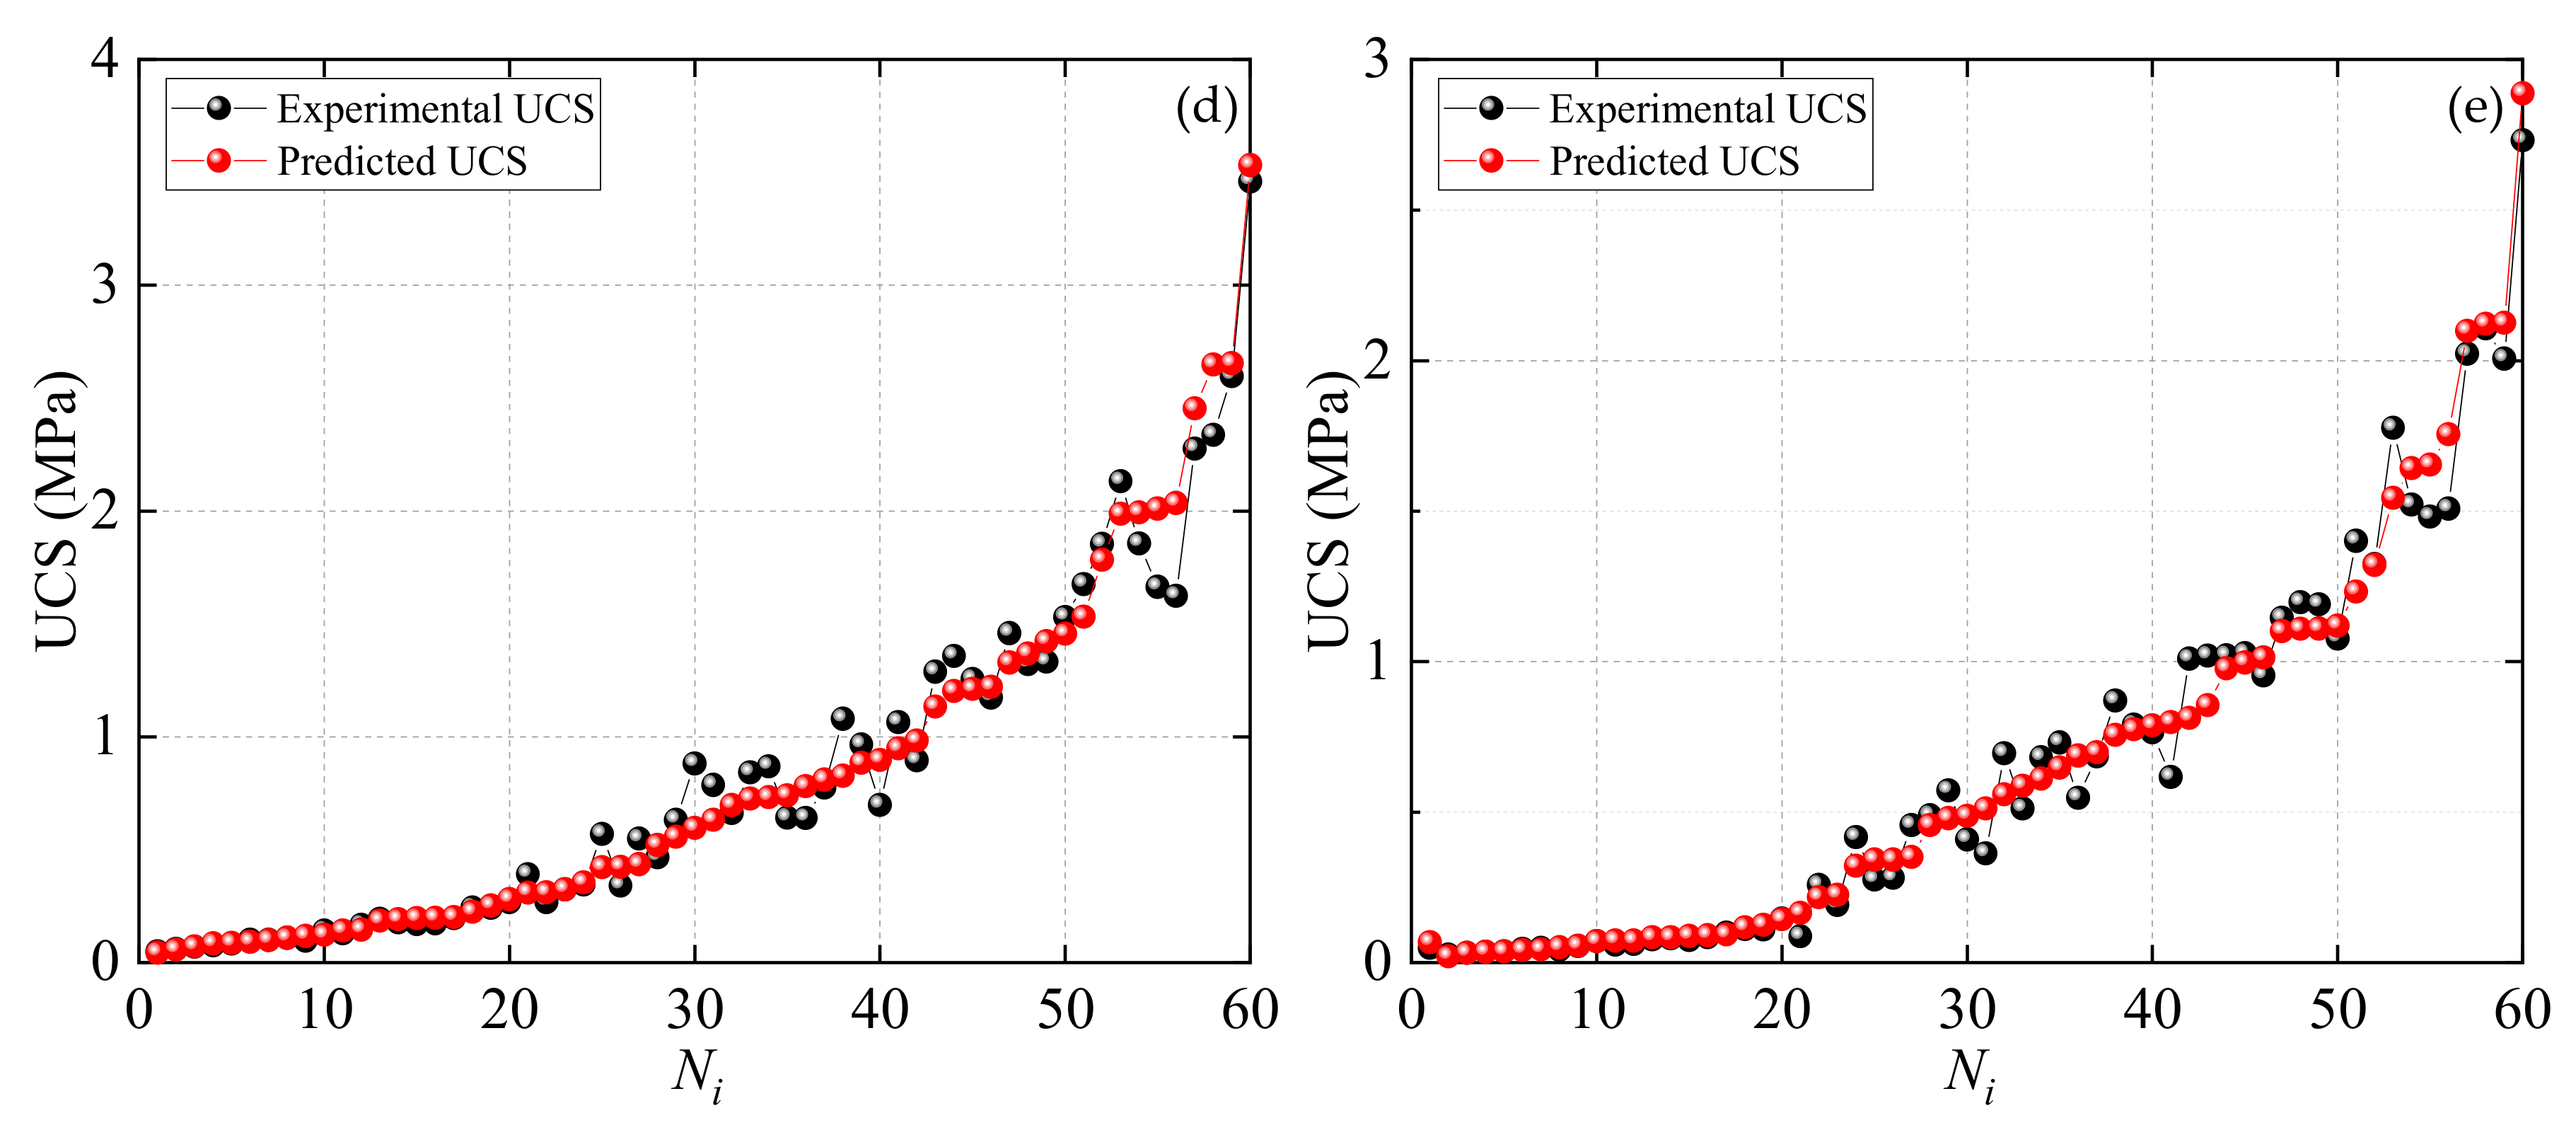
In order to show the difference between the UCS predicted value and the UCS test value more intuitively, Figure 13 shows the comparison between the UCS predicted value and the test value under 60 test conditions for five types of backfill. It can be seen from Figure 13 that the predicted value of UCS of backfill is consistent with the distribution pattern of the test value, and the two results are very consistent. Therefore, it can be judged that the above prediction model is reliable.
4. Conclusions
In this study, two types of fly ash as a fractional OPC replacement were investigated for tailings backfill. Following are the main conclusions drawn from this study:
- (1)
- As SC increases, the viscosity of the backfill slurry increases as a power function. As the b/t ratio decreases, the viscosity of the backfill slurry decreases as an exponential function. The coupling effect of SC and b/t ratio has a great influence on the viscosity of the backfill slurry. The relationship between SC, b/t ratio and viscosity are a quadratic polynomial function of z = a + bx + cy + dx2 + ey2 + fxy.
- (2)
- The viscosity of the backfill slurry mixed with binder is higher than that of a pure tailings slurry. The viscosity of the backfill slurry mixed with FA is higher than that of the backfill slurry without FA. The viscosity of the backfill slurry mixed with FA2 is higher than that of the backfill slurry mixed with FA1. The more FA is added, the higher the viscosity.
- (3)
- With the increase of SC, the UCS of backfill increases as a power function. With the decrease of the b/t ratio, the UCS of all backfill samples decreases as an exponential function. The UCS of all backfill samples increased with an increase of curing time. The coupling effect of the SC and b/t ratio has a great influence on the UCS of backfill samples. The relationship between SC, b/t ratio and viscosity are a quadratic polynomial function of z = a + bx + cy + dx2 + ey2 + fxy.
- (4)
- The UCS of the backfill samples mixed with FA is smaller than that without FA. The higher the FA dosage is, the smaller the UCS of the backfill sample is. At the same FA dosage, the UCS of the backfill sample mixed with FA2 is smaller than that of mixed with FA1.
- (5)
- The UCS of backfill increases with the increase of viscosity, and both of them show a good linear function relationship. The fitting multiple correlation coefficient R2 is higher than 0.9. According to the functional relationship between viscosity and UCS, the viscosity is used to predict the strength of the backfill. The error range of the prediction result is within 15%, and the majority of the error range is within 10%, indicating that it is feasible to use the viscosity parameter to predict the strength parameter of the backfill.
Author Contributions
J.W. and J.F. analyzed the experimental data and initiated the writing of the paper; W.S. modified the manuscript; Y.Z. corrected the English writing. All authors have read and agreed to the published version of the manuscript.
Funding
This research was supported the National Natural Science Foundation of China (Grant No. 51974012), the National Natural Science Foundation of China Youth Fund (51804016), and the Fundamental Research Funds for the Central Universities (FRF-BD-19-005A).
Acknowledgments
The experimental works described in this study were conducted at the Key Laboratory of High-Efficient Mining and Safety of Metal Mines of the Ministry of Education in the University of Science and Technology, Beijing. The authors gratefully acknowledge the staff and students at the laboratory for technical help during testing.
Conflicts of Interest
The authors declare no conflict of interest.
References
- Sofrá, F.; Boger, D. Environmental rheology for waste minimisation in the minerals industry. Chem. Eng. J. 2002, 86, 319–330. [Google Scholar] [CrossRef]
- Belem, T.; Benzaazoua, M. Design and Application of Underground Mine Paste Backfill Technology. Geotech. Geol. Eng. 2008, 26, 147–174. [Google Scholar] [CrossRef]
- Fu, J.X.; Song, W.D.; Tan, Y.Y. Study of stability and evolution indexes of gobs under unloading effect in the deep mines. Geomech. Geoeng. 2018, 14, 439–451. [Google Scholar]
- Fu, J.X.; Song, W.D.; Tan, Y.Y. Study on microstructural evolution and strength growth and fracture mechanism of cemented tailings backfill. Adv. Mater. Sci. Eng. 2016, 2016, 1–13. [Google Scholar] [CrossRef] [Green Version]
- Fourie, A. Preventing catastrophic failures and mitigating environmental impacts of tailings storage facilities. Procedia Earth Planet. Sci. 2009, 1, 1067–1071. [Google Scholar] [CrossRef] [Green Version]
- He, X.; Zheng, C.; Sui, X.; Jing, Q.; Wu, X.; Wang, J.; Si, W.; Zhang, X.-F. Biological damage to Sprague-Dawley rats by excessive anions contaminated groundwater from rare earth metals tailings pond seepage. J. Clean. Prod. 2018, 185, 523–532. [Google Scholar] [CrossRef]
- Fu, J.; Song, W.; Tan, Y. Criterion of local energy release rate of gob instability in deep mines considering unloading stress path. Int. J. Min. Sci. Technol. 2017, 27, 1011–1017. [Google Scholar] [CrossRef]
- Xie, S.-R.; Pan, H.; Chen, D.; Zeng, J.-C.; Song, H.-Z.; Cheng, Q.; Xiao, H.-B.; Yan, Z.-Q.; Li, Y.-H. Stability analysis of integral load-bearing structure of surrounding rock of gob-side entry retention with flexible concrete formwork. Tunn. Undergr. Space Technol. 2020, 103, 103492. [Google Scholar] [CrossRef]
- Tariq, A.; Yanful, E.K. A review of binders used in cemented paste tailings for underground and surface disposal practices. J. Environ. Manag. 2013, 131, 138–149. [Google Scholar] [CrossRef]
- Qi, C.; Fourie, A.; Chen, Q. Neural network and particle swarm optimization for predicting the unconfined compressive strength of cemented paste backfill. Constr. Build. Mater. 2018, 159, 473–478. [Google Scholar] [CrossRef]
- Yilmaz, E. Advances in reducing large volumes of environmentally harmful mine waste rocks and tailings. Miner. Resour. Manag. 2011, 27, 89–112. [Google Scholar]
- Zhang, N.; Yuan, L.; Han, C.; Xue, J.; Kan, J. Stability and deformation of surrounding rock in pillarless gob-side entry retaining. Saf. Sci. 2012, 50, 593–599. [Google Scholar] [CrossRef]
- Ouellet, S.; Bussière, B.; Mbonimpa, M.; Benzaazoua, M.; Aubertin, M. Reactivity and mineralogical evolution of an underground mine sulphidic cemented paste backfill. Miner. Eng. 2006, 19, 407–419. [Google Scholar] [CrossRef]
- Benzaazoua, M.; Bussière, B.; Demers, I.; Aubertin, M.; Fried, É.; Blier, A. Integrated mine tailings management by combining environmental desulphurization and cemented paste backfill: Application to mine Doyon, Quebec, Canada. Miner. Eng. 2008, 21, 330–340. [Google Scholar] [CrossRef]
- Edraki, M.; Baumgartl, T.; Manlapig, E.; Bradshaw, D.; Franks, D.M.; Moran, C.J. Designing mine tailings for better environmental, social and economic outcomes: A review of alternative approaches. J. Clean. Prod. 2014, 84, 411–420. [Google Scholar] [CrossRef]
- Sivakugan, N.; Veenstra, R.; Naguleswaran, N. Underground Mine Backfilling in Australia Using Paste Fills and Hydraulic Fills. Int. J. Geosynth. Ground Eng. 2015, 1, 1–7. [Google Scholar] [CrossRef] [Green Version]
- Benzaazoua, M.; Fall, M.; Belem, T. A contribution to understanding the hardening process of cemented paste backfill. Miner. Eng. 2004, 17, 141–152. [Google Scholar] [CrossRef]
- Xue, Z.; Gan, D.; Zhang, Y.; Liu, Z. Rheological behavior of ultrafine-tailings cemented paste backfill in high-temperature mining conditions. Constr. Build. Mater. 2020, 253, 119212. [Google Scholar] [CrossRef]
- He, Y.; Chen, Q.; Qi, C.; Zhang, Q.; Xiao, C. Lithium slag and fly ash-based binder for cemented fine tailings backfill. J. Environ. Manag. 2019, 248, 109282. [Google Scholar] [CrossRef]
- Huang, L.; Yan, P.; Liu, Y. Effect of alkali content in cement on the fluidity and structural build-up of plasticized cement pastes. Constr. Build. Mater. 2020, 253, 119180. [Google Scholar] [CrossRef]
- Rößler, C.; Eberhardt, B.A.; Kučerova, H.; Moser, B. Influence of hydration on the fluidity of normal Portland cement pastes. Cem. Concr. Res. 2008, 38, 897–906. [Google Scholar] [CrossRef] [Green Version]
- Uchikawa, H.; Hanehara, S.; Shirasaka, T.; Sawaki, D. Effect of admixture on hydration of cement, adsorptive behavior of admixture and fluidity and setting of fresh cement paste. Cem. Concr. Res. 1992, 22, 1115–1129. [Google Scholar] [CrossRef]
- Liu, L.; Xin, J.; Qi, C.; Jia, H.; Song, K.-I. Experimental investigation of mechanical, hydration, microstructure and electrical properties of cemented paste backfill. Constr. Build. Mater. 2020, 263, 120137. [Google Scholar] [CrossRef]
- Panchal, S.; Deb, D.; Sreenivas, T. Variability in rheology of cemented paste backfill with hydration age, binder and superplasticizer dosages. Adv. Powder Technol. 2018, 29, 2211–2220. [Google Scholar] [CrossRef]
- Fang, K.; Fall, M. Effects of curing temperature on shear behavior of cemented paste backfill-rock interface. Int. J. Rock Mech. Min. Sci. 2018, 112, 184–192. [Google Scholar] [CrossRef]
- Cao, S.; Yilmaz, E.; Song, W. Evaluation of Viscosity, Strength and Microstructural Properties of Cemented Tailings Backfill. Minerals 2018, 8, 352. [Google Scholar] [CrossRef] [Green Version]
- Qi, C.; Fourie, A. Cemented paste backfill for mineral tailings management: Review and future perspectives. Miner. Eng. 2019, 144, 106025. [Google Scholar] [CrossRef]
- Liu, L.; Fang, Z.; Qi, C.; Zhang, B.; Guo, L.; Song, K.-I. Numerical study on the pipe flow characteristics of the cemented paste backfill slurry considering hydration effects. Powder Technol. 2019, 343, 454–464. [Google Scholar] [CrossRef]
- Zhou, X.; Hu, S.; Zhang, G.; Li, J.; Xuan, D.; Gao, W. Experimental investigation and mathematical strength model study on the mechanical properties of cemented paste backfill. Constr. Build. Mater. 2019, 226, 524–533. [Google Scholar] [CrossRef]
- Ercikdi, B.; Yılmaz, T.; Külekci, G. Strength and ultrasonic properties of cemented paste backfill. Ultrasonics 2014, 54, 195–204. [Google Scholar] [CrossRef]
- Zhao, K.; Yu, X.; Zhu, S.; Yan, Y.; Zhou, Y.; He, Z.; Song, Y.; Huang, M. Acoustic emission fractal characteristics and mechanical damage mechanism of cemented paste backfill prepared with tantalum niobium mine tailings. Constr. Build. Mater. 2020, 258, 119720. [Google Scholar] [CrossRef]
- Lu, H.; Qi, C.; Chen, Q.; Gan, D.; Xue, Z.; Hu, Y. A new procedure for recycling waste tailings as cemented paste backfill to underground stopes and open pits. J. Clean. Prod. 2018, 188, 601–612. [Google Scholar] [CrossRef]
- Dong, Q.; Liang, B.; Jia, L.; Jiang, L. Effect of sulfide on the long-term strength of lead-zinc tailings cemented paste backfill. Constr. Build. Mater. 2019, 200, 436–446. [Google Scholar] [CrossRef]
- Zheng, J.R.; Sun, X.X.; Guo, L.J.; Zhang, S.M.; Chen, J.Y. Strength and hydration products of cemented paste backfill from sulphide-rich tailings using reactive MgO-activated slag as a binder. Constr. Build. Mater. 2019, 203, 111–119. [Google Scholar] [CrossRef]
- Bull, A.J.; Fall, M. Curing temperature dependency of the release of arsenic from cemented paste backfill made with Portland cement. J. Environ. Manag. 2020, 269, 110772. [Google Scholar] [CrossRef]
- Libos, I.L.S.; Cui, L. Effects of curing time, cement content, and saturation state on mode-I fracture toughness of cemented paste backfill. Eng. Fract. Mech. 2020, 235, 107174. [Google Scholar] [CrossRef]
- Cui, L.; Fall, M. Mechanical and thermal properties of cemented tailings materials at early ages: Influence of initial temperature, curing stress and drainage conditions. Constr. Build. Mater. 2016, 125, 553–563. [Google Scholar] [CrossRef]
- Yilmaz, E.; Benzaazoua, M.; Belem, T.; Bussière, B. Effect of curing under pressure on compressive strength development of cemented paste backfill. Miner. Eng. 2009, 22, 772–785. [Google Scholar] [CrossRef]
- Yingliang, Z.; Jingping, Q.; Xing, J.; Sun, X. Recycling of quarry dust for supplementary cementitious materials in low carbon cement. Constr. Build. Mater. 2020, 237, 117608. [Google Scholar] [CrossRef]
- Saedi, A.; Jamshidi-Zanjani, A.; Darban, A.K. A review on different methods of activating tailings to improve their cementitious property as cemented paste and reusability. J. Environ. Manag. 2020, 270, 110881. [Google Scholar] [CrossRef]
- Peyronnard, O.; Benzaazoua, M. Estimation of the cementitious properties of various industrial by-products for applications requiring low mechanical strength. Resour. Conserv. Recycl. 2011, 56, 22–33. [Google Scholar] [CrossRef]
- Yan, B.; Ren, F.; Cai, M.; Qiao, C. Influence of new hydrophobic agent on the mechanical properties of modified cemented paste backfill. J. Mater. Res. Technol. 2019, 8, 5716–5727. [Google Scholar] [CrossRef]
- Chen, X.; Shi, X.; Zhou, J.; Chen, Q.; Li, E.; Du, X. Compressive behavior and microstructural properties of tailings polypropylene fibre-reinforced cemented paste backfill. Constr. Build. Mater. 2018, 190, 211–221. [Google Scholar] [CrossRef]
- Yi, X.; Ma, G.; Fourie, A. Centrifuge model studies on the stability of fibre-reinforced cemented paste backfill stopes. Geotext. Geomembr. 2018, 46, 396–401. [Google Scholar] [CrossRef]
- Liu, Y.; Li, H.; Wang, K.; Wu, H.; Cui, B. Effects of accelerator–water reducer admixture on performance of cemented paste backfill. Constr. Build. Mater. 2020, 242, 118187. [Google Scholar] [CrossRef]
- Marquez, M.; Robben, A.; Grady, B.P.; Robb, I. Viscosity and yield stress reduction in non-colloidal concentrated suspensions by surface modification with polymers and surfactants and/or nanoparticle addition. J. Colloid Interface Sci. 2006, 295, 374–387. [Google Scholar] [CrossRef]
- Li, W.; Fall, M. Sulphate effect on the early age strength and self-desiccation of cemented paste backfill. Constr. Build. Mater. 2016, 106, 296–304. [Google Scholar] [CrossRef]
- Yin, S.; Shao, Y.; Wu, A.; Wang, Z.; Yang, L. Assessment of expansion and strength properties of sulfidic cemented paste backfill cored from deep underground stopes. Constr. Build. Mater. 2020, 230, 116983. [Google Scholar] [CrossRef]
- Kesimal, A.; Yilmaz, E.; Ercikdi, B.; Alp, I.; Deveci, H. Effect of properties of tailings and binder on the short-and long-term strength and stability of cemented paste backfill. Mater. Lett. 2005, 59, 3703–3709. [Google Scholar] [CrossRef]
- Yılmaz, T.; Ercikdi, B.; Karaman, K.; Külekçi, G. Assessment of strength properties of cemented paste backfill by ultrasonic pulse velocity test. Ultrasonics 2014, 54, 1386–1394. [Google Scholar] [CrossRef]
- Hassani, F.P.; Razavi, S.M.; Isagon, I. A study of physical and mechanical behaviour of gel fill. Cim. Bull. 2007, 100, 1–7. [Google Scholar]
- Zhao, Y.; Taheri, A.; Karakus, M.; Chen, Z.; Deng, A. Effects of water content, water type and temperature on the rheological behaviour of slag-cement and fly ash-cement paste backfill. Int. J. Min. Sci. Technol. 2020, 30, 271–278. [Google Scholar] [CrossRef]
- Du, X.; Feng, G.; Zhang, Y.; Wang, Z.; Guo, Y.; Qi, T. Bearing mechanism and stability monitoring of cemented gangue-fly ash backfill column with stirrups in partial backfill engineering. Eng. Struct. 2019, 188, 603–612. [Google Scholar] [CrossRef]
- Behera, S.K.; Ghosh, C.; Mishra, D.; Singh, P.; Mishra, K.; Buragohain, J.; Mandal, P.K. Strength development and microstructural investigation of lead-zinc mill tailings based paste backfill with fly ash as alternative binder. Cem. Concr. Compos. 2020, 109, 103553. [Google Scholar] [CrossRef]
- Benzaazoua, M.; Belem, T.; Bussière, B. Chemical factors that influence the performance of mine sulphidic paste backfill. Cem. Concr. Res. 2002, 32, 1133–1144. [Google Scholar] [CrossRef]
- Zhao, Y.; Soltani, A.; Taheri, A.; Karakus, M.; Deng, A. Application of Slag–Cement and Fly Ash for Strength Development in Cemented Paste Backfills. Minerals 2018, 9, 22. [Google Scholar] [CrossRef] [Green Version]
- Zhao, Y.; Taheri, A.; Soltani, A.; Karakus, M.; Deng, A. Strength development and strain localization behaviour of cemented paste backfills using portland cement and fly ash. Materials 2019, 3282, 2019. [Google Scholar]
Figure 1.
Incremental and cumulative particle size distribution (PSD) curves of tailings.

Figure 2.
Viscosity testing apparatus of backfill slurry mixes.

Figure 3.
Uniaxial compression test system.

Figure 4.
Viscosity results of different backfill samples: (a) cemented tailings backfill (CTB) and tailings; (b) CFTB1; (c) CFTB2.
Figure 4.
Viscosity results of different backfill samples: (a) cemented tailings backfill (CTB) and tailings; (b) CFTB1; (c) CFTB2.

Figure 5.
Coupling effects of solid contents (SC) and b/t ratio on the viscosity of different type backfill: (a) CTB; (b) CFTB1-1; (c) CFTB1-2; (d) CFTB2-1; (e) CFTB2-2.
Figure 5.
Coupling effects of solid contents (SC) and b/t ratio on the viscosity of different type backfill: (a) CTB; (b) CFTB1-1; (c) CFTB1-2; (d) CFTB2-1; (e) CFTB2-2.

Figure 6.
Comparison of the viscosity of different types of backfill slurry with a b/t ratio of 1:8. (a) CFTB1 and CTB; (b) CFTB2 and CTB; (c) CFTB2-1 and CFTB1-1; (d) CFTB2-2 and CFTB1-2.
Figure 6.
Comparison of the viscosity of different types of backfill slurry with a b/t ratio of 1:8. (a) CFTB1 and CTB; (b) CFTB2 and CTB; (c) CFTB2-1 and CFTB1-1; (d) CFTB2-2 and CFTB1-2.


Figure 7.
Relation between uniaxial compressive strength (UCS) and effect factors: (a) CTB; (b) CFTB1-1; (c) CFTB1-2; (d) CFTB2-1; (e) CFTB2-2.
Figure 7.
Relation between uniaxial compressive strength (UCS) and effect factors: (a) CTB; (b) CFTB1-1; (c) CFTB1-2; (d) CFTB2-1; (e) CFTB2-2.


Figure 8.
Coupling effects of SC and b/t ratio on UCS of different types of backfill.


Figure 9.
Comparison of UCS between CTB and CFTB: (a) UCSCTB-UCSCFTB1-1; (b) UCSCTB-UCSCFTB1-2; (c) UCSCTB-UCSCFTB2-1; (d) UCSCTB-UCSCFTB2-2.
Figure 9.
Comparison of UCS between CTB and CFTB: (a) UCSCTB-UCSCFTB1-1; (b) UCSCTB-UCSCFTB1-2; (c) UCSCTB-UCSCFTB2-1; (d) UCSCTB-UCSCFTB2-2.


Figure 10.
Comparison of UCS of different types of CFTB: (a) UCSCFTB1-1-UCSCFTB1-2; (b) UCSCFTB2-1-UCSCFTB2-2; (c) UCSCFTB2-1-UCSCFTB1-1; (d) UCSCFTB2-2-UCSCFTB2-1.
Figure 10.
Comparison of UCS of different types of CFTB: (a) UCSCFTB1-1-UCSCFTB1-2; (b) UCSCFTB2-1-UCSCFTB2-2; (c) UCSCFTB2-1-UCSCFTB1-1; (d) UCSCFTB2-2-UCSCFTB2-1.

Figure 11.
Relation between UCS and viscosity: (a) CTB; (b) CFTB1-1; (c) CFTB1-2; (d) CFTB2-1; (e) CFTB2-1.
Figure 11.
Relation between UCS and viscosity: (a) CTB; (b) CFTB1-1; (c) CFTB1-2; (d) CFTB2-1; (e) CFTB2-1.


Figure 12.
Deviations between experimental UCS and predicted UCS of different type backfill samples.
Figure 12.
Deviations between experimental UCS and predicted UCS of different type backfill samples.


Figure 13.
Comparison between experimental UCS and predicted UCS of different type backfill Scheme 1. (a) CTB; (b) CFTB1-1; (c) CFTB1-2; (d) CFTB2-1; (e) CFTB2-2.
Figure 13.
Comparison between experimental UCS and predicted UCS of different type backfill Scheme 1. (a) CTB; (b) CFTB1-1; (c) CFTB1-2; (d) CFTB2-1; (e) CFTB2-2.


Table 1.
Physical properties of materials.
| Materials | Density (g/cm3) | Bulk Density (g/cm3) | Porosity (%) |
|---|---|---|---|
| Tailings | 2.67 | 1.65 | 38.20 |
| FA1 | 2.59 | 0.88 | 66.02 |
| FA2 | 3.09 | 1.47 | 52.43 |
Table 2.
Chemical composition of materials.
| Composition | Tailings | FA1 | FA2 |
|---|---|---|---|
| K | 0.02% | 0.10% | 0.97% |
| Na | 0.09% | 0.11% | 0.33% |
| Si | 1.55% | 16.19% | 16.35% |
| Al | / | 13.20% | 2.40% |
| Ca | 24.99% | 1.40% | 35.20% |
| Fe | 0.19% | 15.70% | 0.20% |
| Mg | 10.30% | 0.50% | 1.10% |
| Pb | 0.05% | <0.05% | 0.06% |
| Mn | 0.04% | <0.05% | 0.05% |
| S | <0.05% | / | / |
Table 3.
Test scheme of different types of backfill.
| Sample Type | Binder | OPC: FA | Aggregate |
|---|---|---|---|
| CTB | OPC | / | Tailings |
| CFTB1-1 | OPC + FA1 | 0.8:0.2 | |
| CFTB1-2 | 0.5:0.5 | ||
| CFTB2-1 | OPC + FA2 | 0.8:0.2 | |
| CFTB2-2 | 0.5:0.5 |
Table 4.
Viscosity results of different samples.
| Binder-Tailings Ratio (b/t) | Solid Content (SC)/% | Sample Type | |||||
|---|---|---|---|---|---|---|---|
| CTB | CFTB1-1 | CFTB1-2 | CFTB2-1 | CFTB2-2 | Tailings | ||
| 1:4 | 66 | 810 | 836 | 978 | 878 | 1033 | 512 |
| 1:6 | 772 | 794 | 925 | 811 | 966 | ||
| 1:8 | 693 | 712 | 862 | 760 | 915 | ||
| 1:10 | 625 | 655 | 824 | 724 | 865 | ||
| 1:12 | 563 | 596 | 787 | 679 | 803 | ||
| 1:4 | 68 | 1123 | 1117 | 1213 | 1158 | 1311 | 629 |
| 1:6 | 967 | 994 | 1094 | 989 | 1138 | ||
| 1:8 | 848 | 875 | 1005 | 911 | 1090 | ||
| 1:10 | 765 | 803 | 956 | 875 | 998 | ||
| 1:12 | 701 | 729 | 889 | 786 | 904 | ||
| 1:4 | 70 | 1432 | 1383 | 1503 | 1425 | 1652 | 715 |
| 1:6 | 1230 | 1201 | 1343 | 1244 | 1388 | ||
| 1:8 | 1021 | 1090 | 1180 | 1145 | 1287 | ||
| 1:10 | 881 | 965 | 1095 | 1032 | 1163 | ||
| 1:12 | 793 | 894 | 997 | 865 | 1022 | ||
| 1:4 | 72 | 1675 | 1698 | 1825 | 1733 | 1998 | 805 |
| 1:6 | 1432 | 1467 | 1654 | 1522 | 1644 | ||
| 1:8 | 1232 | 1392 | 1493 | 1423 | 1532 | ||
| 1:10 | 1032 | 1188 | 1336 | 1232 | 1349 | ||
| 1:12 | 892 | 1083 | 1247 | 1131 | 1254 | ||
Table 5.
Fitting relationship between SC, b/t ratio and viscosity of backfill samples.
| Sample Type | Fitting Relationship | R2 |
|---|---|---|
| CTB | V = 13147.7 + 670.9x + 245.0y + 3.1x2− 0.4y2 − 11.4xy | 0.9948 |
| CFTB1-1 | V = 12145.5 + 416.0x − 472.7y + 2.1x2 + 4.6y2 − 7.3xy | 0.9942 |
| CFTB1-2 | V = 28702.1 + 503.8x − 957.7y + 2.5x2 + 8.2y2 − 8.6xy | 0.9966 |
| CFTB2-1 | V = 16992.1 + 523.0x − 623.1y + 1.8x2 + 5.8y2 − 8.8xy | 0.9916 |
| CFTB2-2 | V = 12884.9 + 607.4x − 509.9y + 3.5x2 + 5.1y2 − 10.5xy | 0.9852 |
Note: x = b/t ratio; y = SC.
Table 6.
Fitting relationship between SC, b/t ratio and UCS of backfill samples.
| Sample Type | CT (d) | Fitting Relationship | R2 |
|---|---|---|---|
| CTB | 7 | UCS = 30.54 + 0.38x − 1.01y + 0.005x2 + 0.008y2 − 0.008xy | 0.9917 |
| 14 | UCS = 25.41 + 1.30x − 1.03y + 0.02x2 + 0.01y2 − 0.03xy | 0.9846 | |
| 28 | UCS = 91.88 + 2.24x − 3.19y + 0.03x2 + 0.03y2 − 0.04xy | 0.9933 | |
| CFTB1-1 | 7 | UCS = 9.91 + 0.13x − 0.33y + 0.002x2 + 0.003y2−0.003xy | 0.9908 |
| 14 | UCS = 8.47 + 1.47x − 0.54y + 0.02x2 + 0.01y2 − 0.03xy | 0.9867 | |
| 28 | UCS = 110.75 + 1.75x − 3.62y + 0.02x2 + 0.03y2 − 0.03xy | 0.9884 | |
| CFTB1-2 | 7 | UCS =−0.212 + 0.017x − 0.005y + 0.0002x2 + 0.0002y2 − 0.0004xy | 0.9896 |
| 14 | UCS = 12.69 + 1.29x − 0.62y + 0.02x2 + 0.01y2 − 0.03xy | 0.9934 | |
| 28 | UCS = 83.81 + 1.11x − 2.72y + 0.02x2 + 0.02y2 − 0.04xy | 0.9860 | |
| CFTB2-1 | 7 | UCS = −2.74 + 0.15x + 0.04y + 0.0007x2 + 0.0001y2 − 0.0025xy | 0.9810 |
| 14 | UCS = 7.32 + 1.06x − 0.44y + 0.014x2 + 0.005y2 − 0.021xy | 0.9904 | |
| 28 | UCS = 81.94 + 1.36x − 2.69y + 0.02x2 + 0.02y2 − 0.03xy | 0.9903 | |
| CFTB2-2 | 7 | UCS =0.425 + 0.034x − 0.024y + 0.0002x2 + 0.0003y2 − 0.0007xy | 0.9730 |
| 14 | UCS =40.24 + 1.02x − 1.38y + 0.01x2 + 0.01y2 − 0.02xy | 0.9897 | |
| 28 | UCS =58.36 + 1.47x − 2.00y + 0.01x2 + 0.02y2 − 0.03xy | 0.9769 |
Note: x = b/t ratio; y = SC.
Table 7.
Evaluation Indexes of UCS prediction models for different types of backfill samples.
| Scheme. | CT (d) | MSE | RMSE | MAE | MAPE/% |
|---|---|---|---|---|---|
| CTB | 7 | 0.002 | 0.044 | 0.033 | 7.8 |
| 14 | 0.032 | 0.178 | 0.150 | 11.9 | |
| 28 | 0.030 | 0.172 | 0.136 | 8.1 | |
| CFTB1-1 | 7 | 0.001 | 0.020 | 0.016 | 8.7 |
| 14 | 0.017 | 0.131 | 0.107 | 11.7 | |
| 28 | 0.028 | 0.166 | 0.130 | 9.3 | |
| CFTB1-2 | 7 | 0.001 | 0.005 | 0.005 | 5.5 |
| 14 | 0.009 | 0.097 | 0.082 | 10.9 | |
| 28 | 0.028 | 0.168 | 0.146 | 11.7 | |
| CFTB2-1 | 7 | 0.001 | 0.013 | 0.010 | 7.4 |
| 14 | 0.012 | 0.111 | 0.099 | 11.7 | |
| 28 | 0.031 | 0.177 | 0.148 | 11.5 | |
| CFTB2-2 | 7 | 0.001 | 0.008 | 0.006 | 10.3 |
| 14 | 0.008 | 0.089 | 0.071 | 10.8 | |
| 28 | 0.011 | 0.107 | 0.092 | 9.5 |
Publisher’s Note: MDPI stays neutral with regard to jurisdictional claims in published maps and institutional affiliations. |
© 2021 by the authors. Licensee MDPI, Basel, Switzerland. This article is an open access article distributed under the terms and conditions of the Creative Commons Attribution (CC BY) license (http://creativecommons.org/licenses/by/4.0/).
Share and Cite
MDPI and ACS Style
Wang, J.; Fu, J.; Song, W.; Zhang, Y. Viscosity and Strength Properties of Cemented Tailings Backfill with Fly Ash and Its Strength Predicted. Minerals 2021, 11, 78. https://0-doi-org.brum.beds.ac.uk/10.3390/min11010078
AMA Style
Wang J, Fu J, Song W, Zhang Y. Viscosity and Strength Properties of Cemented Tailings Backfill with Fly Ash and Its Strength Predicted. Minerals. 2021; 11(1):78. https://0-doi-org.brum.beds.ac.uk/10.3390/min11010078
Chicago/Turabian StyleWang, Jie, Jianxin Fu, Weidong Song, and Yongfang Zhang. 2021. "Viscosity and Strength Properties of Cemented Tailings Backfill with Fly Ash and Its Strength Predicted" Minerals 11, no. 1: 78. https://0-doi-org.brum.beds.ac.uk/10.3390/min11010078
Note that from the first issue of 2016, this journal uses article numbers instead of page numbers. See further details here.