Effect of Air Entrainment on Cemented Mine Backfill Properties: Analysis Based on Response Surface Methodology


1
Mining Engineering Department, King Abdulaziz University, Jeddah 21589, Saudi Arabia
2
Department of Mining and Materials Engineering, McGill University, Montreal, QC H3A 0C5, Canada
*
Author to whom correspondence should be addressed.
Minerals 2021, 11(1), 81; https://0-doi-org.brum.beds.ac.uk/10.3390/min11010081
Submission received: 4 December 2020
/
Revised: 7 January 2021
/
Accepted: 12 January 2021
/
Published: 15 January 2021
Abstract
:As part of an extensive research program exploring the potential benefits of using air-entraining admixtures in mine backfill, the experimental study presented in this paper investigates the effect of cement and entrained air dosages on mine backfill unconfined compressive strength (UCS), fresh density, and dry density. Backfill specimens were prepared using silica sand, normal Portland cement, water, and an entrained air admixture. An experimental design with response surface methodology was adopted to develop predictive mathematical models and analyze the results. The results demonstrated that an entrained air dosage of 3.5% could improve the UCS of the mine backfill owing to better dispersion of cement particles. However, a further increase in the dosage reduced the UCS as well as the fresh and dry densities by approximately 200 and 120 kg/m3, respectively. Study results imply that using air-entraining admixtures can potentially enhance mine backfill flowability and reduce the density, thus providing safer and more sustainable working conditions in an underground mining environment.
1. Introduction
Most environmental accidents in the mining industry are caused by mine tailings—the waste material produced from ore upgrading in beneficiation plants [1]. Therefore, tailings are often re-used in mine backfill to minimize the need for tailings storage facilities, thus providing environmental, technical, and economical benefits. For example, the use of tailings in backfill material can reduce the mine tailings footprint by up to 50%, enhance the stability of underground environment, and improve ore recovery [2,3]. Common mine backfilling materials are hydraulic fill, paste fill, and rock fill. Hydraulic fill generally has a pulp density between 60 and 75%, and water is the medium for fill transportation through pipelines [4]. Paste fill is also transported through pipelines; however, it has higher pulp density (75–85%). It contains finer particles: at least 15% of the tailings should be less than 20 µm to permit paste fill to act as a non-segregating fluid [4,5]. Rock fill uses waste rock generated from various sources (e.g., blasted rock from quarries, waste from underground development) and natural aggregates [5]. Rockfill is delivered underground through boreholes and can be cemented to meet specific strength requirements. In general, low doses (2–8 wt.%) of binders (e.g., cement) are commonly used in mine backfill to improve strength [6,7].
Effective backfill design requires knowledge of the mine tailings properties that will influence backfill mechanical performance [6]. For example, mine backfill prepared with tailings containing the sulfide mineral pyrite (FeS2) will be prone to sulfate attack, which reduces the unconfined compressive strength (UCS) of the backfill [7]. To mitigate sulfate attack, pozzolans are widely used in mine backfill to partially replace cement [7,8]. In addition, pozzolanic materials lower binder costs, which account for approximately 75% of the operational costs of mine backfilling [9,10]. At present, wastes from industrial process that have pozzolanic characteristics are widely available, such as fly ash and granulated blast furnace slag [4,8,11,12]. Additionally, mineral or chemical admixtures are used to modify mine backfill rheological and hydration properties [5]. For example, superplasticizers—high-range water reducers—are often added to cemented paste fill to enhance rheological properties [13].
Air-entraining or foaming agents are employed for foam concrete production. Foam concrete is a cement-based material composed of a binder—often cement or a blend of pozzolans and cement—and water mixed with pre-made foam produced using an air-entraining agent [14,15,16]. Other terms used for foam concrete are “lightweight cellular concrete,” “low-density foam concrete”, and “cellular lightweight concrete” [17,18,19,20]. This self-compacting material [21] is highly flowable. It is light and can have a density between 400 and 1800 kg/m3 [22] because micro-cells of air, 50 μm to 1 mm in diameter [23], occupy up to 70% of its volume. Foam concrete is highly versatile and is used in several applications, such as filling of voids, floor screeding, casting of walls, and thermal insulation [24,25,26]. The UCS of foam concrete is generally between 0.43 and 43 MPa after 28 days of curing [27].
The air micro-cells in foam concrete are generated using an air-entraining agent and aerator equipment, resulting in a cellular-textured concrete. Typically, either protein- or synthetic-based air-entraining agents are used [24]. Protein-based agents are more stable, yielding stronger and more closely spaced air cells, whereas synthetic-based agents allow for greater expansion of the cellular structure, thus lowering the density [28,29]. These air-entraining agents are surfactants, and their function is to reduce the surface tension of water. Surfactant molecules have hydrophilic “heads” and hydrophobic “tails” [30]. Additionally, air-entraining agents are negatively charged so that they are electrostatically attracted to the positively charged cement grains [31].
This study aims to use an air-entrainment agent in mine backfill—similar to foam concrete—as a novel approach to potentially enhance mine backfill properties by producing a low-density material that can create a safe and sustainable working environment. In underhand cut-and-fill mining—one variation of the cut-and fill-mining method—the block of ore is extracted in a top-down fashion and backfilling material is placed once the ore is mined out [32]. Therefore, mine workers and machines operate beneath the backfilled stope where a low-density material is more favorable. A UCS of 1 MPa for mine backfill cured for 28 days is usually sufficient to maintain ground control [4,9,10,11,12]. In contrast to previous studies where mine tailings were used [33,34], the backfill specimens in this study were prepared using chemically inert, pure (>95 wt.% SiO2) silica sand instead of mine tailings, because chemically active mine tailings could influence cellular structure upon air entrainment.
The experiments tested backfill specimens prepared at various cement and entrained air dosages. A statistical experimental design was adopted using response surface methodology (RSM) to quantify the influence of the treatment factors on three response variables (UCS, fresh density, and dry density), analyze interactions between factors, and develop predictive models. In addition, microstructural analysis with the aid of image analysis investigated the shape and size distribution of the entrained air bubbles. Study results will improve our understanding of the potential benefits of air-entraining admixtures in mine backfill and can be used as a basis for further research in this field. In addition, this study promotes the use of RSM as a robust statistical method to aid mine backfill design.
2. Experimental Materials
2.1. Silica Sand
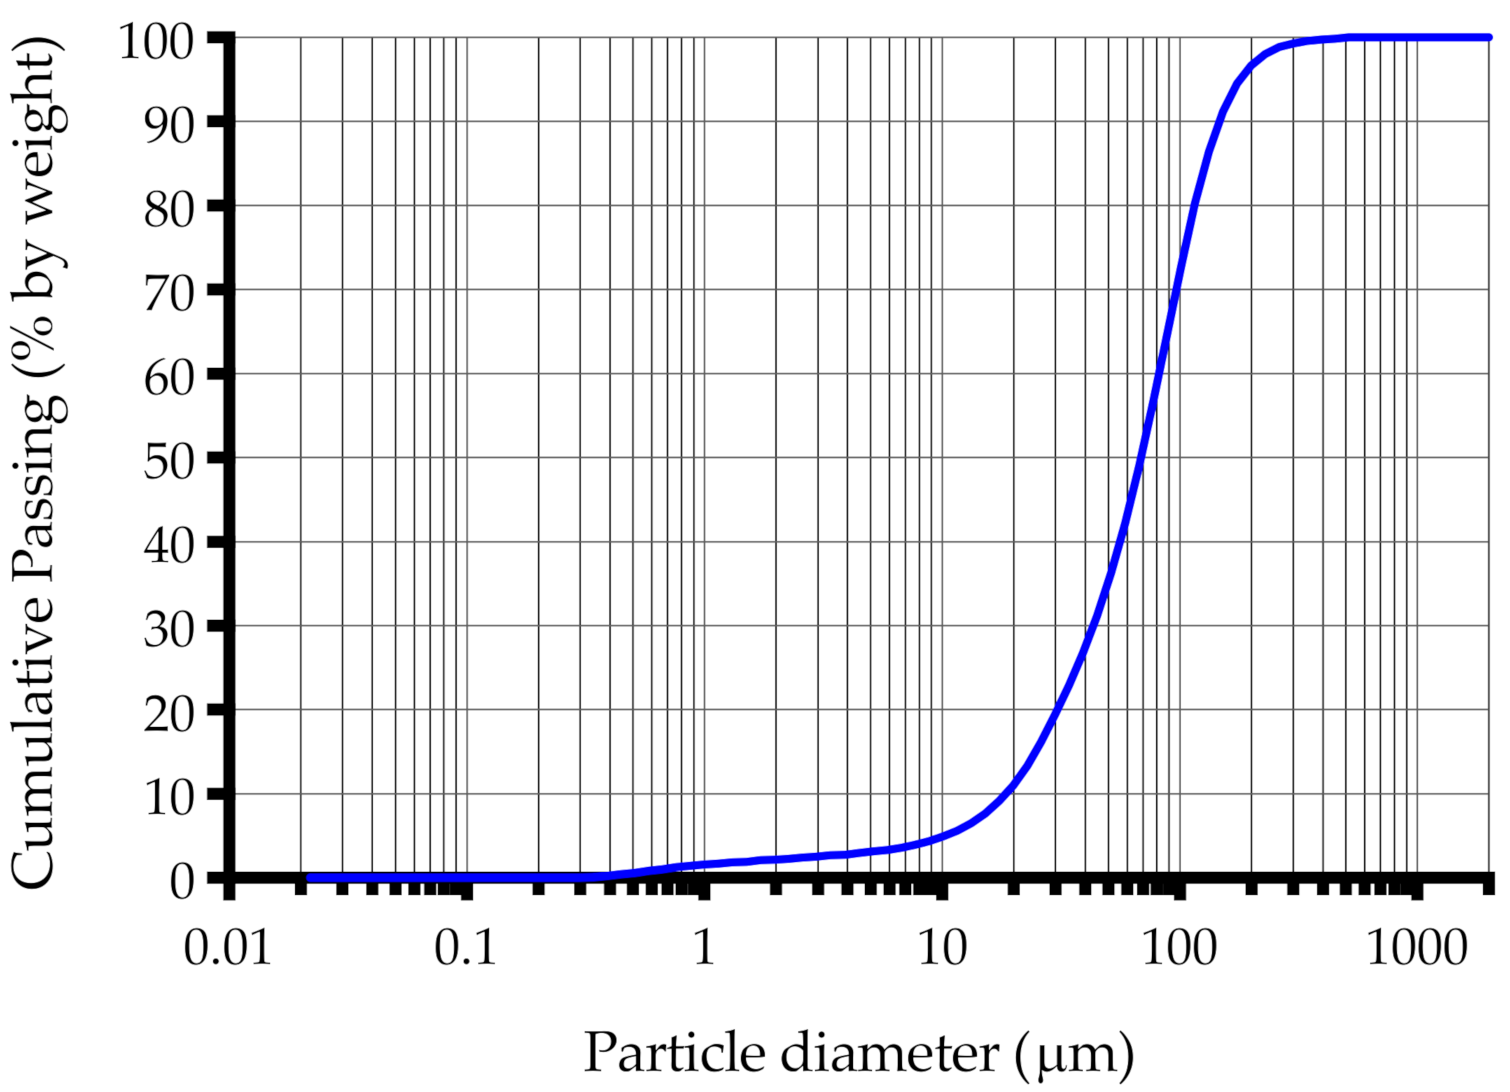
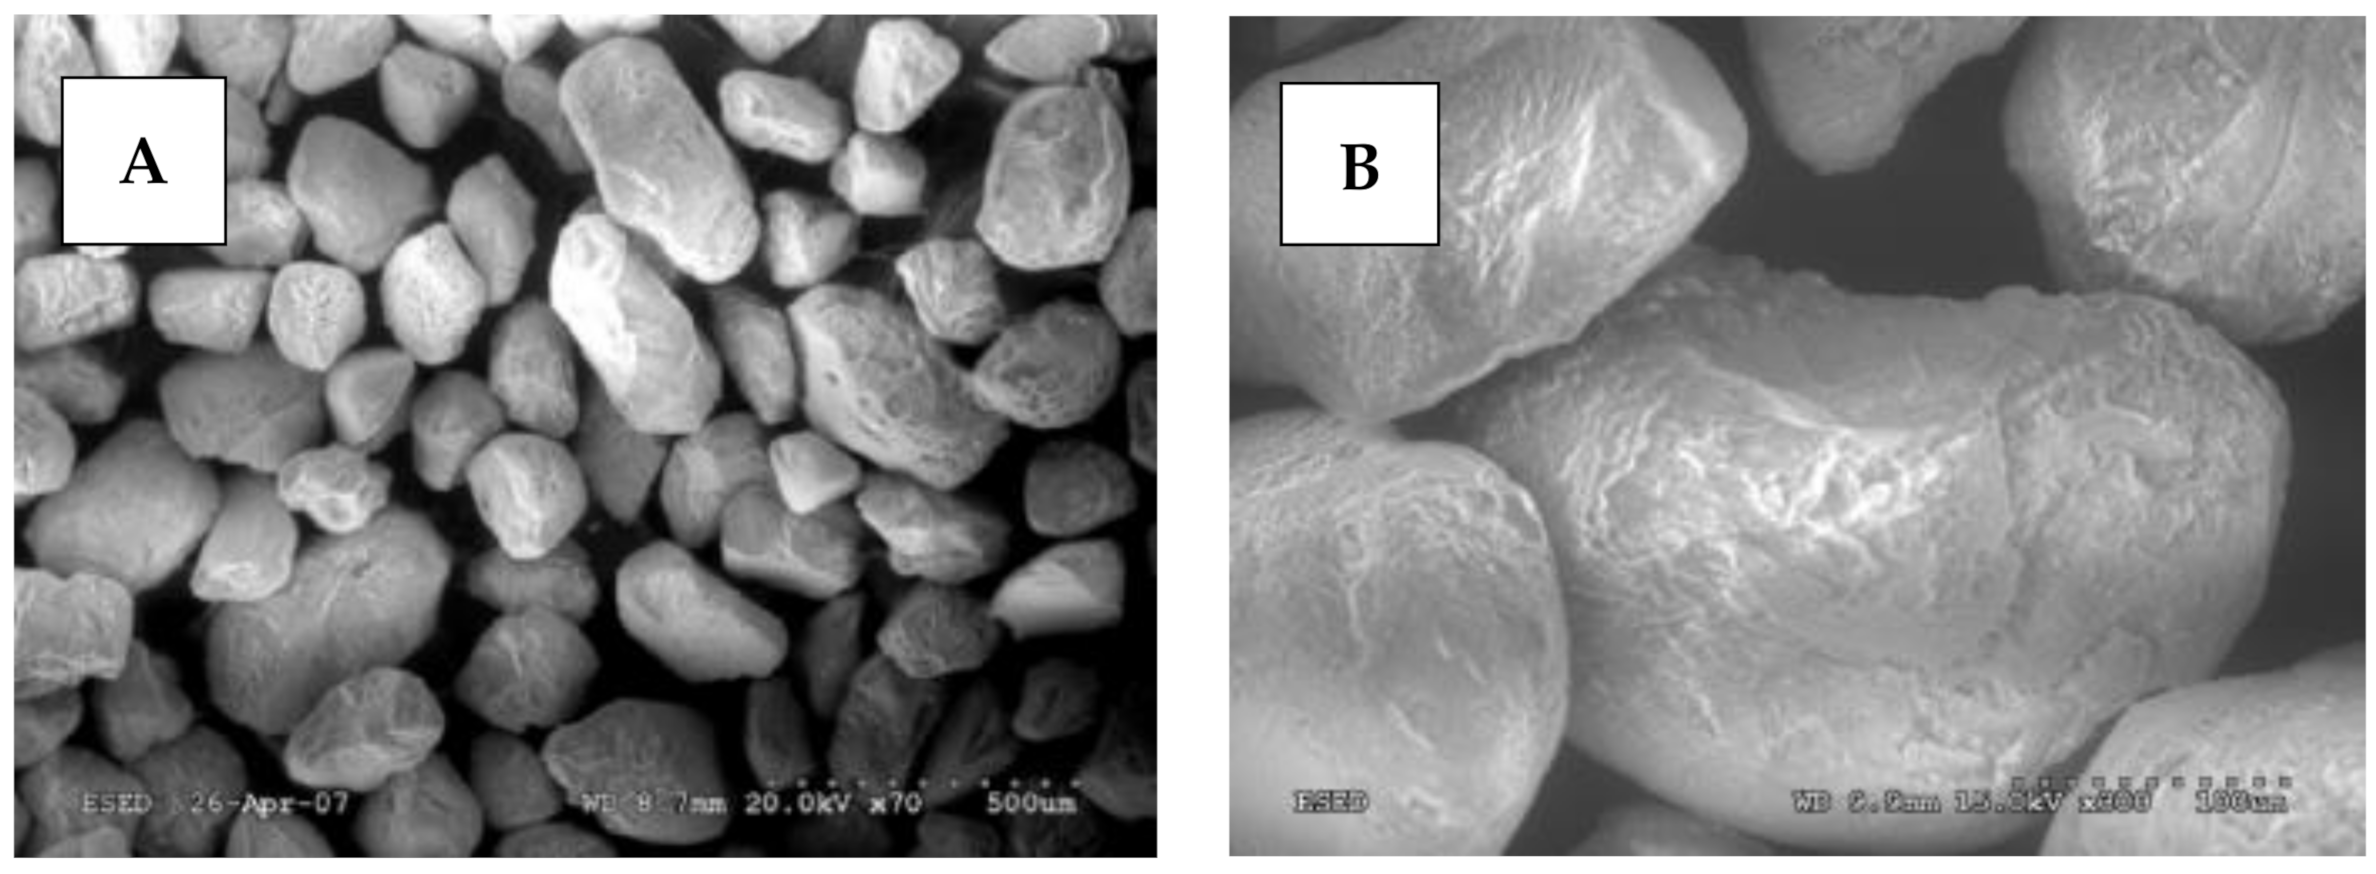
The particle size distribution of the mine backfill strongly influences its physical properties [35]. Figure 1 shows the grain size distribution of the silica sand determined by the laser diffraction method. Table 1 summarizes the parameters obtained from Figure 1, including specific gravity (S.G.), percent passing by weight at five diameters (Dx), uniformity coefficient (Cu), and curvature coefficient (Cc). The coefficients indicate that the silica sand is poorly graded per the unified soil classification system. The silica sand particles are rounded in shape, as shown in the scanning electron micrographs in Figure 2.
2.2. Binding Agent
The binding agent is general use cement, with a specific surface area and S.G. of 3710 cm2/g and 3.15, respectively. Table 2 summarizes the chemical composition of the cement provided by the supplier.
2.3. Water
The water used to prepare mine backfill can be obtained from various sources such as municipal supplies, processing plants, or lakes [37,38]. The chemical properties of the water used in preparation of the backfill material can affect cement hydration and mine backfill the workability. For example, a high concentration of calcium in the mixing water enhances cement hydration, since calcium is the primary element in hydration products [39]. Conversely, a high salt concentration in water reduces the workability of the backfill at a specific binder dosage [40]. In this study, tap water with a pH of 7.4 was used.
2.4. Air-Entraining Agent and Aerator Equipment
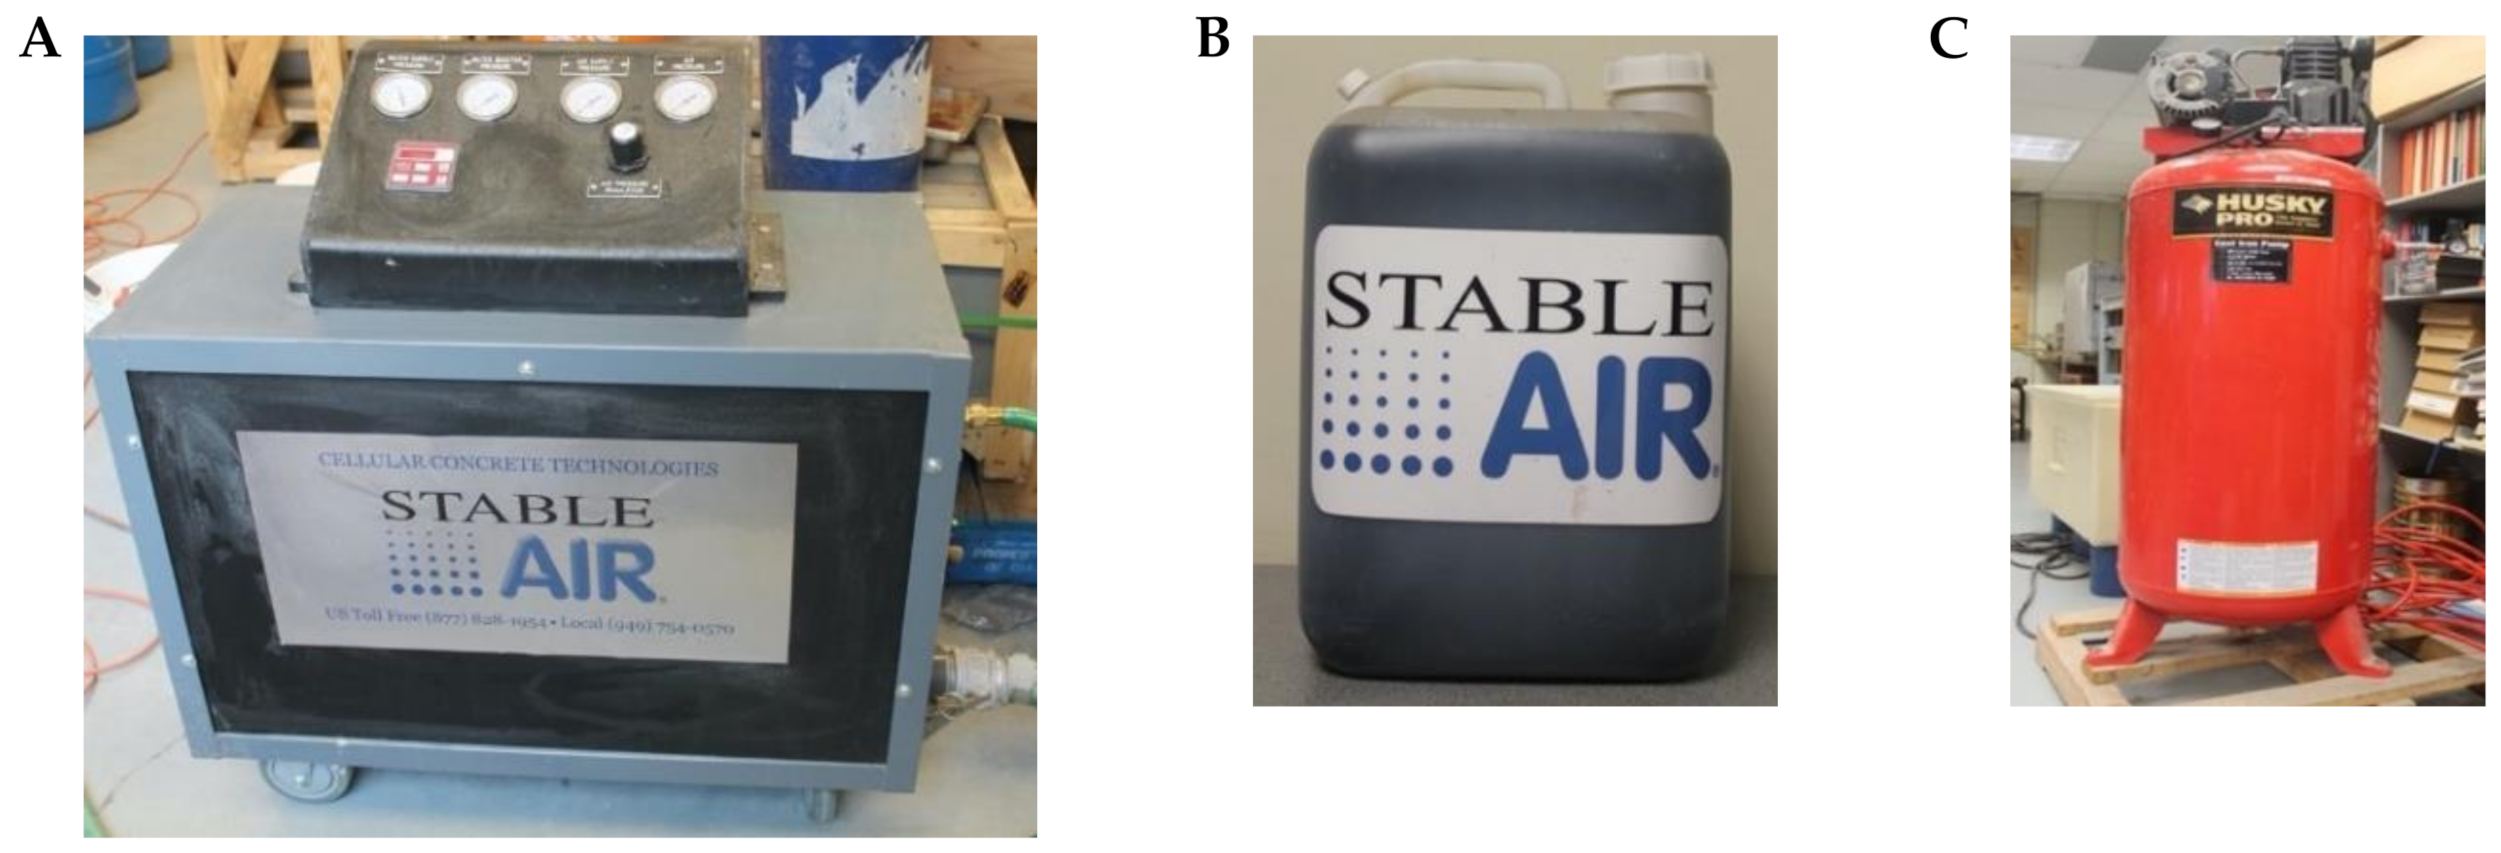
Previous studies have highlighted the importance of selecting a high-quality air-entraining agent to ensure a strong and stable air cell structure that is evenly distributed in the sample [33,34]. Therefore, the Stable Air® system supplied by Vatne Concrete System was chosen, consisting of an air-entraining admixture (Table 3) and M100 Stable Air® aerator (Figure 3A,B). The air-entraining admixture is synthetic-based and satisfies the requirements specified in ASTM C260/C260M − 10a(2016) [41] and C869/C869M − 11(2016) [42]. The aerator is portable, suitable for laboratory-scale tests, and capable of generating an air output from 10 to 12 CFM (0.0047–0.0057 m3/s). The aerator is equipped with a digital timer and pressure gauges for water and air and is designed to generate foam with a density of 69 kg/m3.
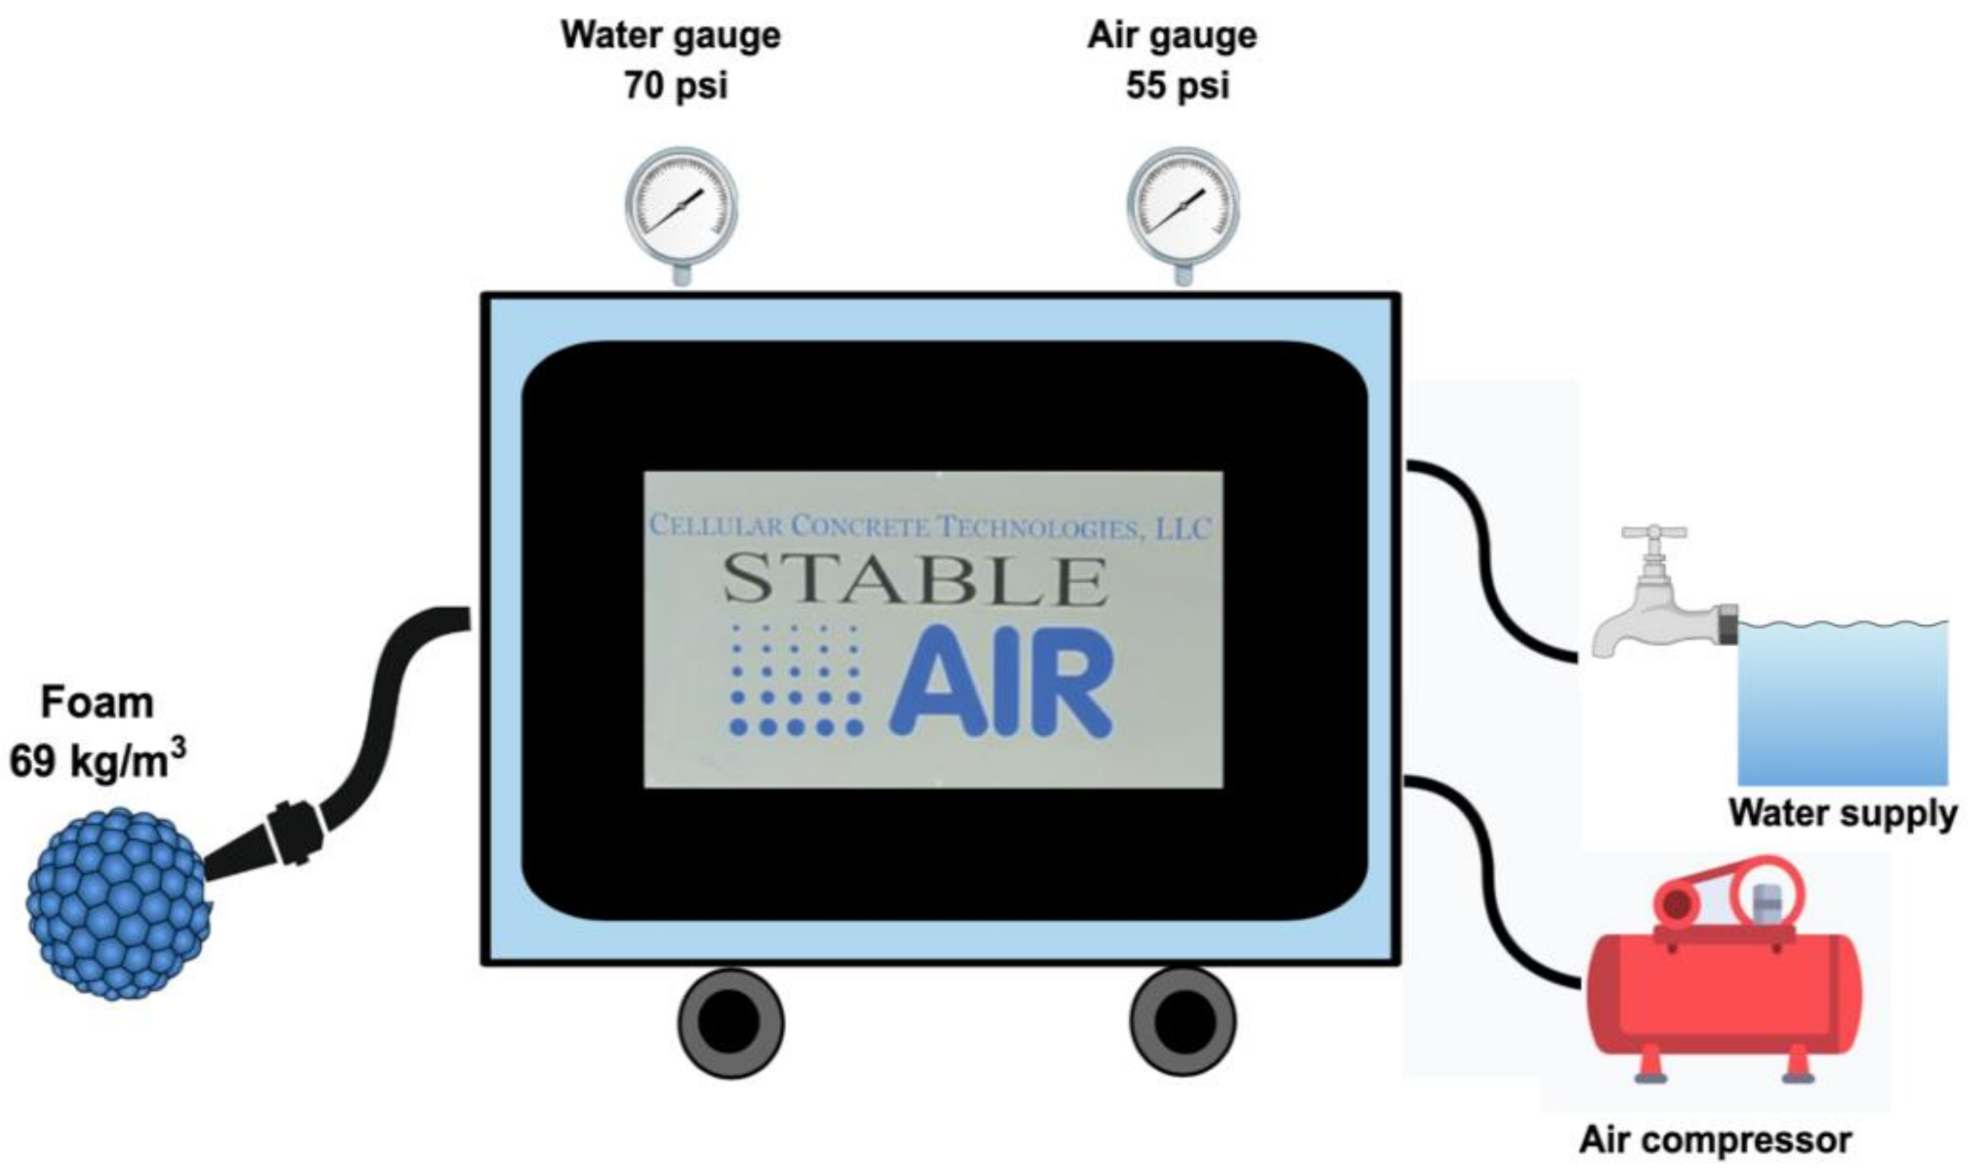
The process of foam generation using the Stable Air® system is as follows (Figure 4):
- The air-entraining agent is fed into the aerator. The agent is then diluted with water with a dilution ratio of 1:120 (1 L air-entraining agent, 120 L water).
- The tap water pressure is regulated to 70 psi (482.6 kPa) with a water pressure gauge.
- The air supply to the aerator is a Husky Pro air compressor capable of generating a maximum air pressure of 135 psi (930.8 kPa; Figure 3C). The air pressure is regulated to 55 psi (379.2 kPa) with an air pressure gauge.
- The combination of the air-entraining agent, water, and compressed air produces a cellular-structure foam that can be added to experimental backfill.
3. Experimental Design
3.1. Backfill Mixtures
The experiment was designed to test various cement and air-entraining agent dosages. Equations (1) and (2) were used to calculate the quantities of each backfill constituent:
where MC, MS, and MF are the mass of cement, silica sand, and foam (g), respectively.
3.2. Response Surface Methodology
Developed by Box and Wilson in 1951 [44], RSM is used to optimize a process by understanding the influential factors, detecting interactions between factors, and developing predictive models. RSM is commonly used for statistical design of experiments involving backfill and concrete. For example, Fall et al. [45] used RSM to develop predictive models based on the relationships between the properties of backfill constituents (tailings, binder, and water) and backfill slump, solids concentration, UCS, and cement cost. In this study, the measured responses (i.e., UCS after three curing ages; fresh density and dry density after 28 days of curing) were analyzed using RSM with a level of significance of 0.05. Moreover, predictive models are developed based on relationships between the influential factors (cement and entrained air dosages) and the measured responses. RSM involves substituting the experimental data into a second-degree polynomial equation (Equation (4)):
where y is the measured response, b0, bi, and bii are regression coefficients, and xi and xj are the influential factors cement and entrained air dosages (%).
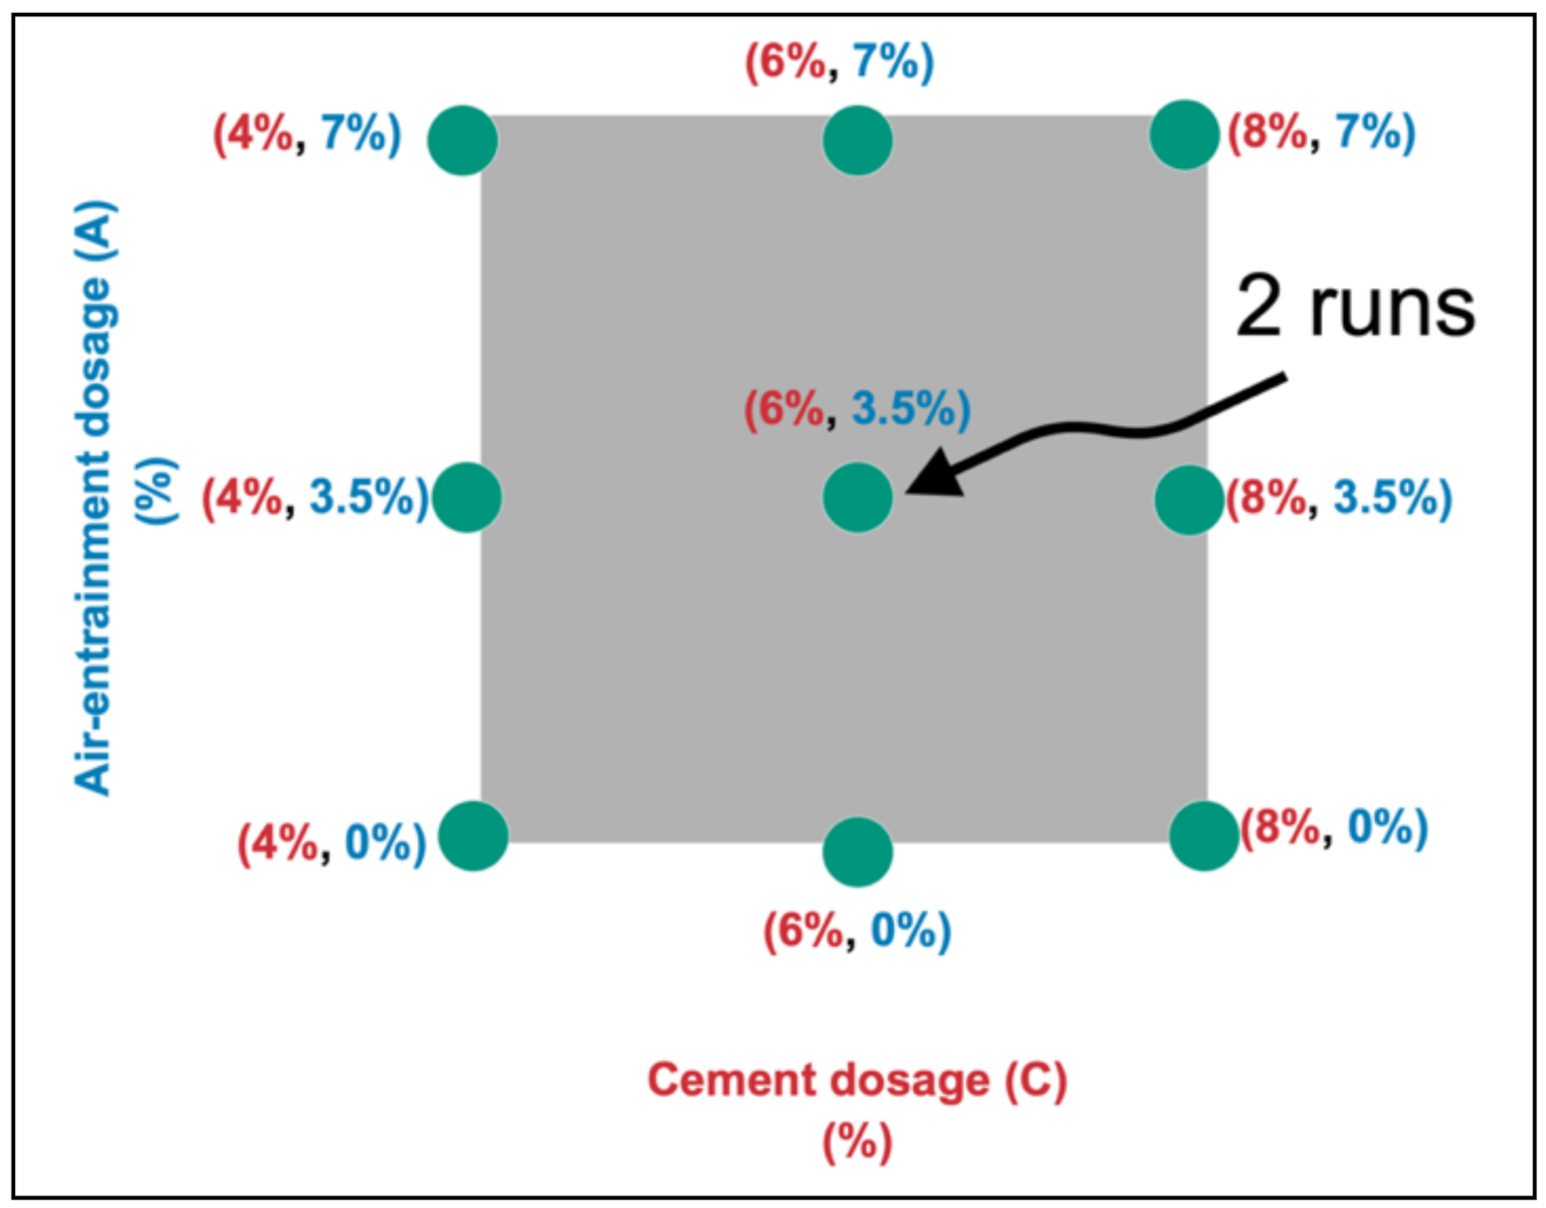
The RSM central composite design adopted in this study requires three levels for each factor to be coded: low level coded as –1, middle level coded as 0, and high level coded as +1 (Table 4). Samples with 0% air served as reference samples to quantify how air entrainment influenced the responses.
The design space can be envisioned as a square, where a mixture design represents a coordinate in the square (Figure 5). The number of runs needed to satisfy the requirement of this design is 10, which is calculated as follows:
- Four runs at the vertices of the square;
- Four runs halfway between the vertices;
- Two runs at the center to account for experimental errors [46].
Table 5 lists the characteristics of the backfill mixtures prepared based on the selected design. Design-Expert® software was used to analyze the measured responses.
3.3. Preparation of Backfill Specimens
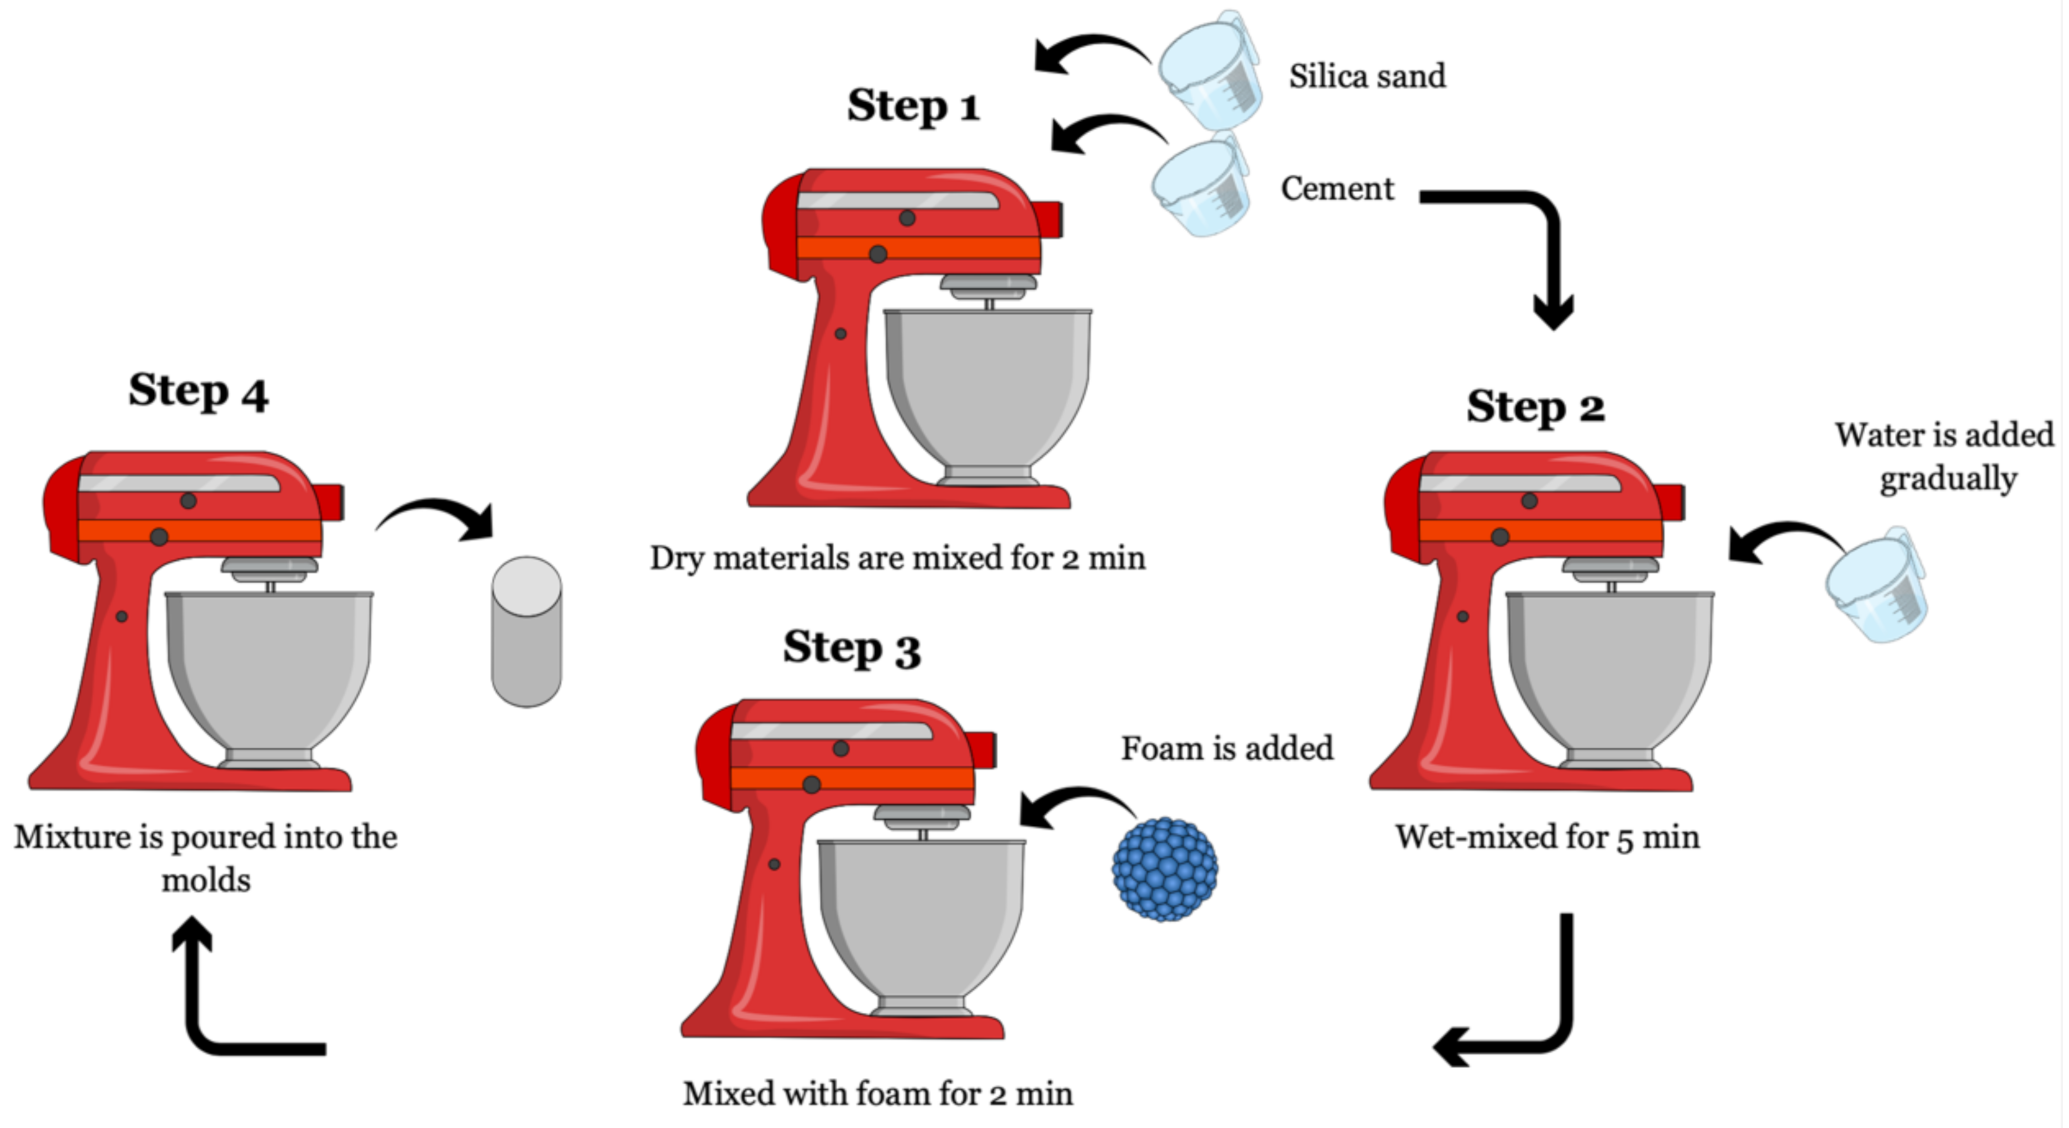
Backfill specimens were prepared in four steps (Figure 6):
- Silica sand and cement were dry-mixed for 2 min in a 4.73-L stand mixer at 75 rpm.
- Water was gradually added, and the mixture was mixed at 75 rpm for 5 min to produce a homogeneous paste.
- Foam generated from the aerator was then added to the paste from step 2 and mixed for 2 min at 58 rpm. A mixing time of 2 min was found to be sufficient since prolonged mixing time collapses the cellular structure and produces inconsistent samples [34]. This step was not performed in reference mixtures (Table 5).
For UCS testing, the prepared mixtures (Table 5) were cured for 7, 14, or 28 days in a curing room. Samples for fresh density testing were not cured and those for dry density testing were cured for 28 days. The curing room is capable of curing backfill specimens under preset temperature of 25 ± 2 °C and relative humidity of 90 ± 2%. These settings were used to simulate underground environment.
4. Testing Methods
4.1. Unconfined Compressive Strength
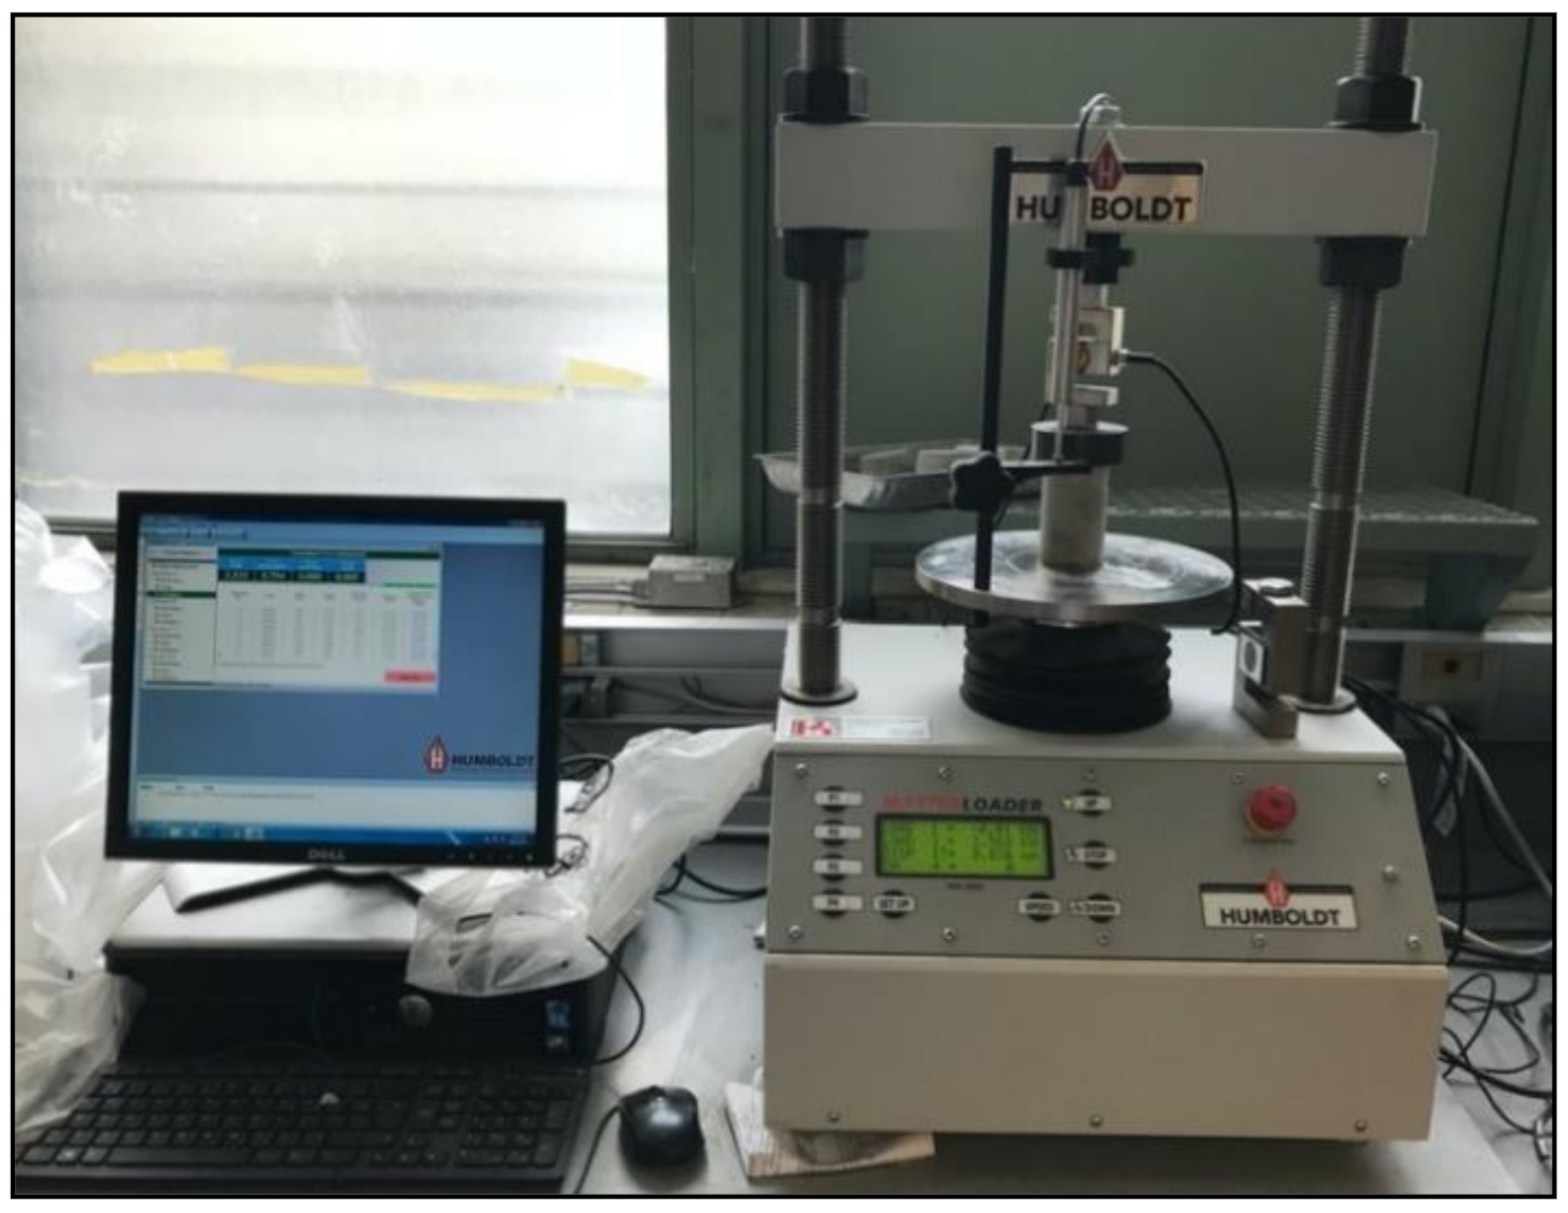
Each specimen was extruded from the mold by applying air pressure through a predrilled hole on the bottom of the mold, and the top and bottom were ground to obtain a flat surface. Specimen height and diameter were measured with Vernier calipers (accuracy ± 0.01 mm) to ensure that all specimens had a height: diameter ratio of 2:1–2.5:1 in accordance with ASTM D2166/D2166M-16 [48].
The UCS of triplicate specimens of each mixture (Table 6) was measured on each curing day using a HUMBOLDT Master Loader equipped with a load cell having a capacity of 50 kN (Figure 8) after ASTM D2166/D2166M-16 [48]. Specimens were subjected to a load of 1 mm/min until compressive failure. The linear variable displacement transducer in the instrument measured the axial deformation used to plot the stress–strain curve. The triplicate measured values were input to Design-Expert® software to be analyzed statistically to produce the response surfaces.
4.2. Fresh and Dry Densities
Fresh and dry densities are essential for design and quality control purposes. The backfill was designed for a targeted fresh density. Known fresh densities are required to verify the required entrained air dosage and ensure mixture consistency. Insufficient or prolonged mixing could affect fresh density and ultimately influence UCS. The dry density is needed to determine the entrained air dosage that will be more favorable in under hand cut-and-fill mining as mentioned above. Additionally, the relationship between the two densities can predict the dry density from fresh density (Section 5.2).
To measure the fresh density, triplicate fresh mixtures (Table 7) were poured into standard containers with a known weight and volume. The weight of the fresh mixture was calculated by subtracting the empty weight of the container from the filled container. The weight of the fresh mixture was divided by the volume of the empty container to calculate the fresh density. Dry density was measured on triplicate specimens after 28 curing days (Table 7). Specimens from the curing room were placed in an oven for 24 h at 100 ± 5 °C. The dimensions and weights of oven-dried specimens were measured using Vernier calipers and a laboratory scale, respectively. The dry densities were calculated by dividing the dry weights of the specimens by their cylindrical volumes.
4.3. Microstructural Properties
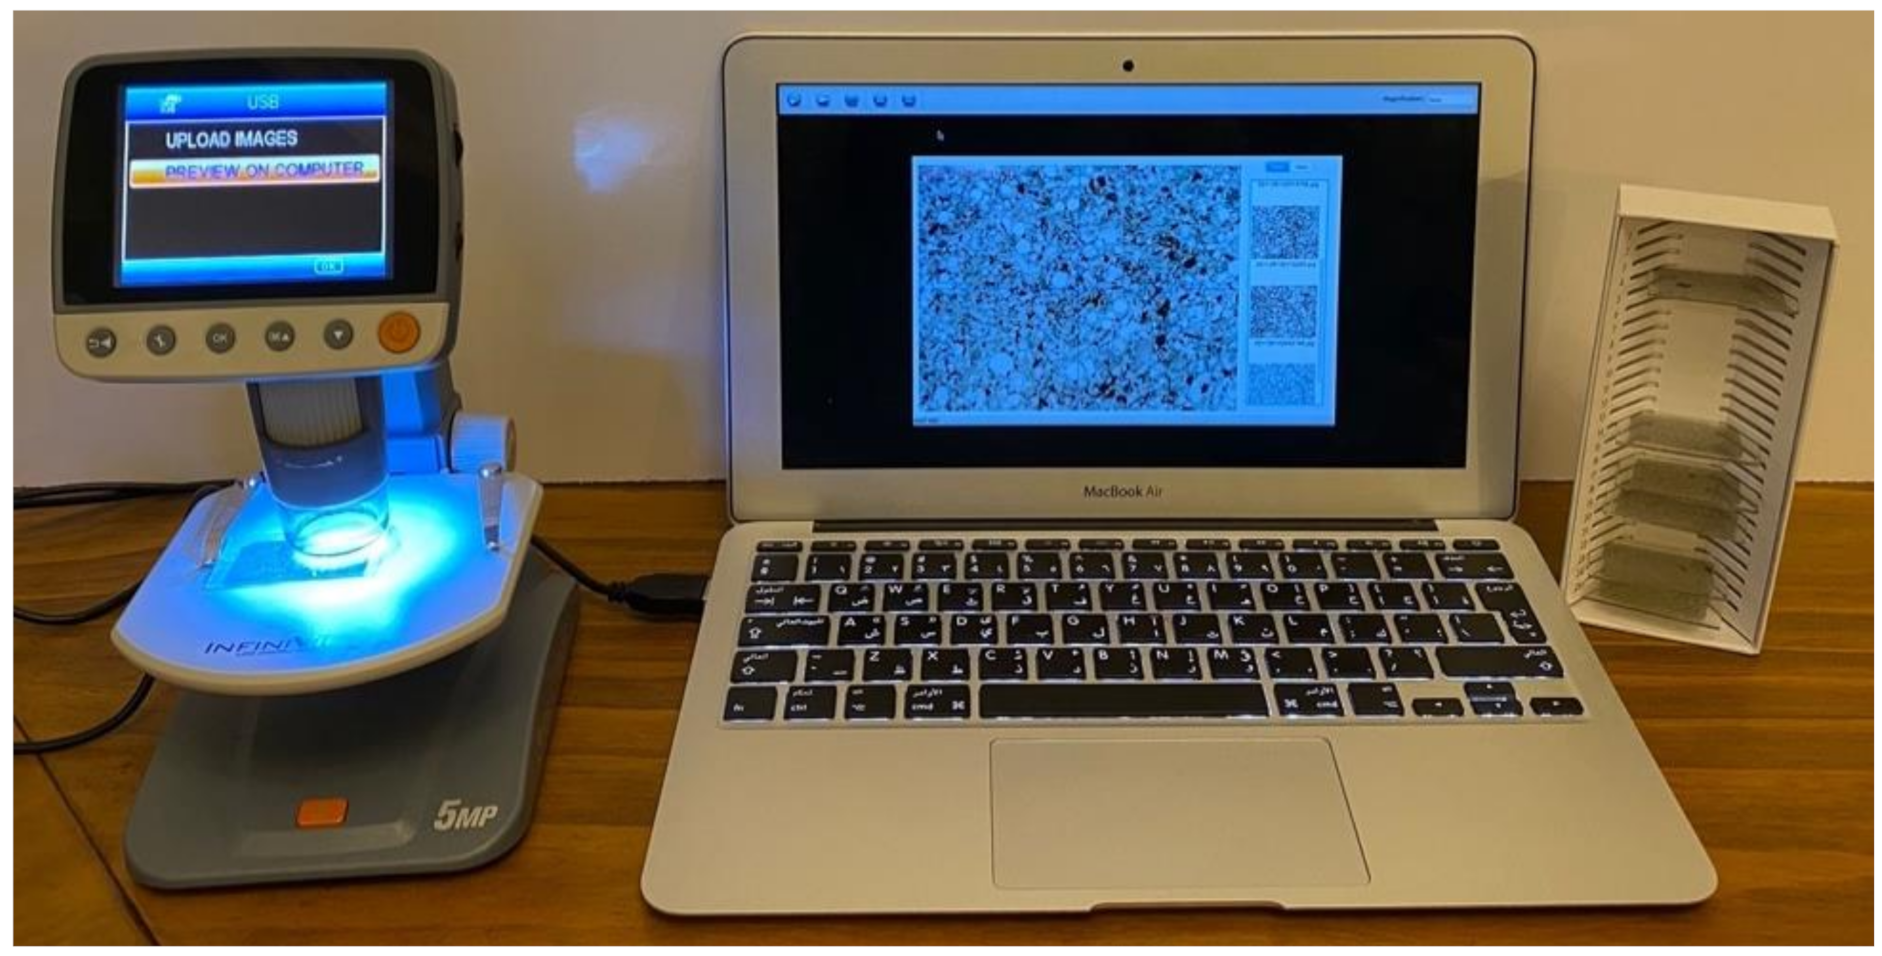
To investigate air bubble shape and size distribution, petrographic thin sections (24 × 46 mm) were prepared for a backfill specimen containing 10% cement and entrained air. Higher cement and entrained air dosages were used to (1) produce a specimen with high UCS, so it would not break during thin section preparation and (2) better visualize and trace air bubbles. A digital Celestron Infiniview® microscope equipped with a 5-megapixel camera and connected to a computer was used to capture and display the images (Figure 9). Images were processed with Fiji ImageJ open-source software (National Institutes of Health, Bethesda, MD) to measure air bubble diameter and distribution. The image was calibrated to convert pixels to millimeters. The diameter of each air bubble was measured twice, once along the x-axis and once along the y-axis, and the mean was used to plot the air bubble size distribution.
5. Results and Discussion
5.1. UCS Response
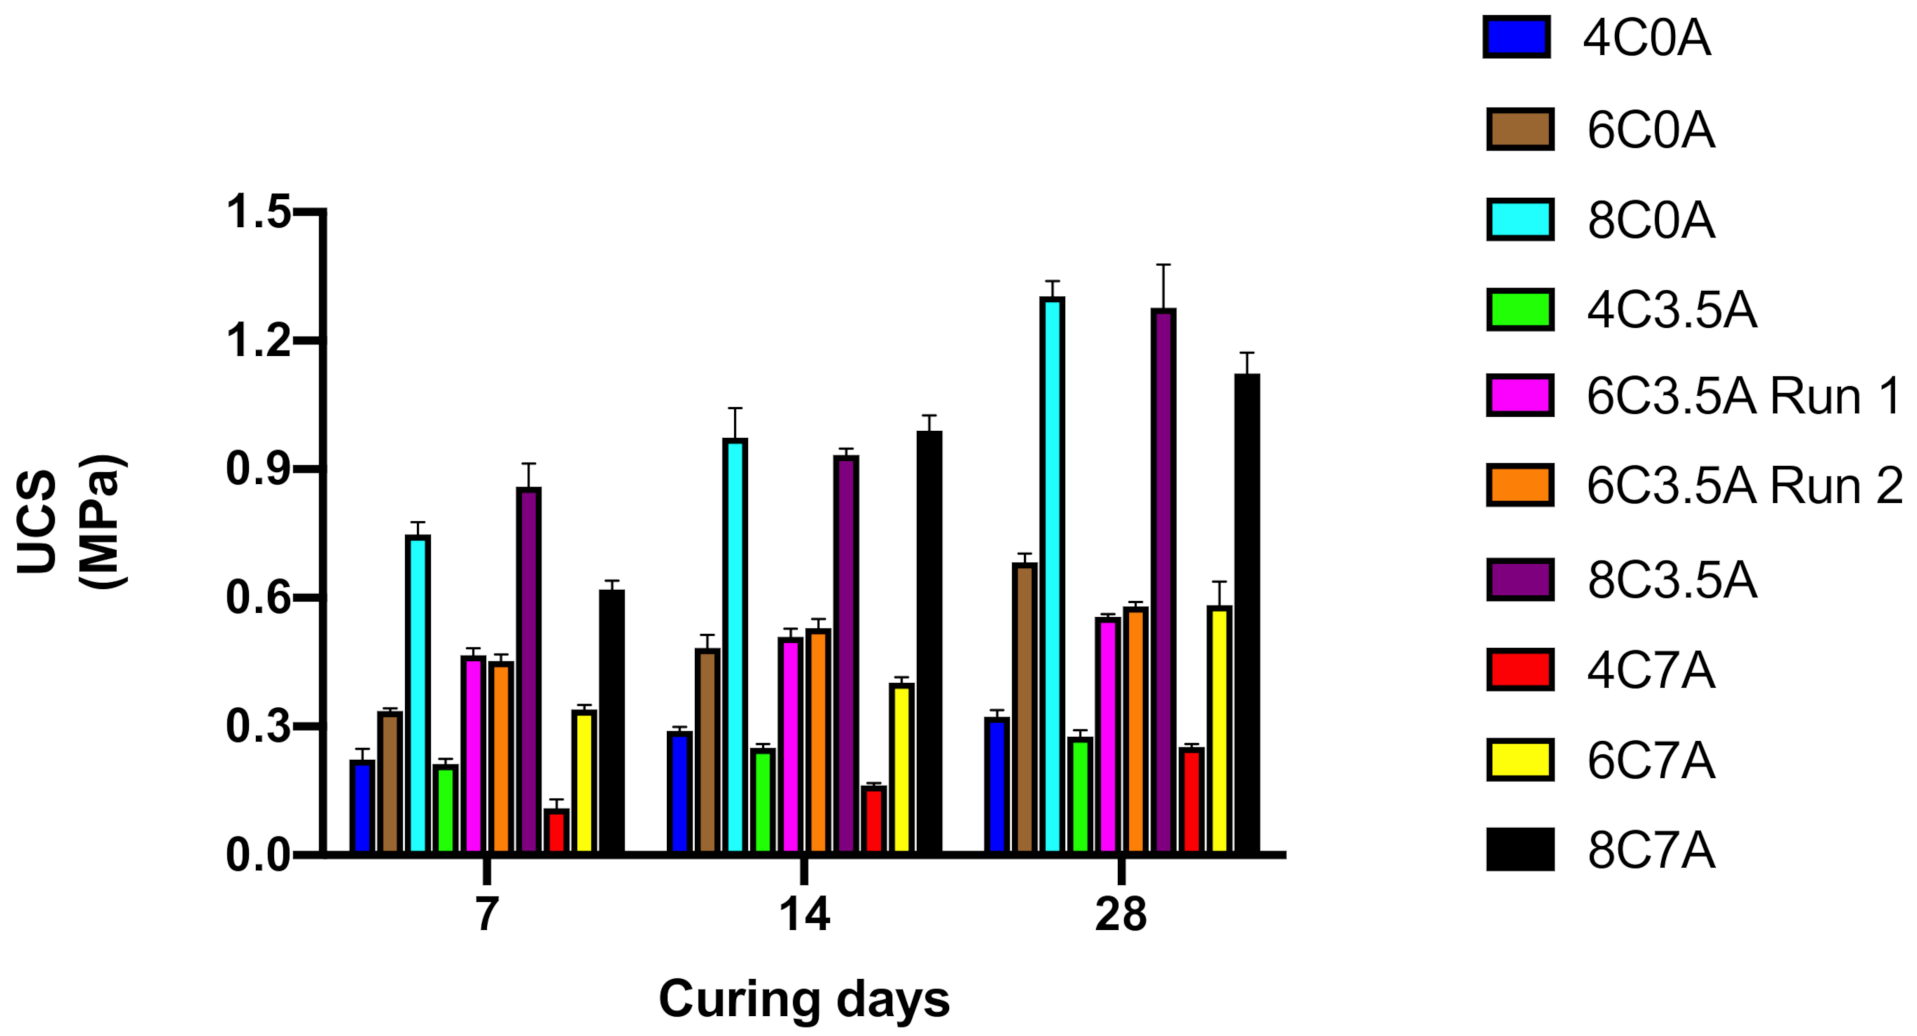
Increasing the cement dosage increased the UCS of the backfill, whereas increasing the entrained air dosage decreased the UCS (Figure 10). However, increasing the entrained air dosage to 3.5% led to an improvement in UCS, which will be discussed in detail in the subsequent sections.
The predictive regression models developed for UCS for 7, 14, and 28 curing days are presented in Equations (5)–(7), respectively:
where A is the entrained air dosage from 0 to 7, and C is the cement dosage from 4 to 8.
UCS7 (MPa) = 0.2721 + 0.05785A − 0.1055C − 0.0095A2 + 0.0206C2 − 0.0005AC
UCS14 (MPa) = 0.6149 − 0.0251A − 0.2030C − 0.0021A2 + 0.0307C2 + 0.0051AC
UCS28 (MPa) = 0.5661 − 0.0006A − 0.2180C + 0.0011A2 + 0.0391C2 − 0.0039AC
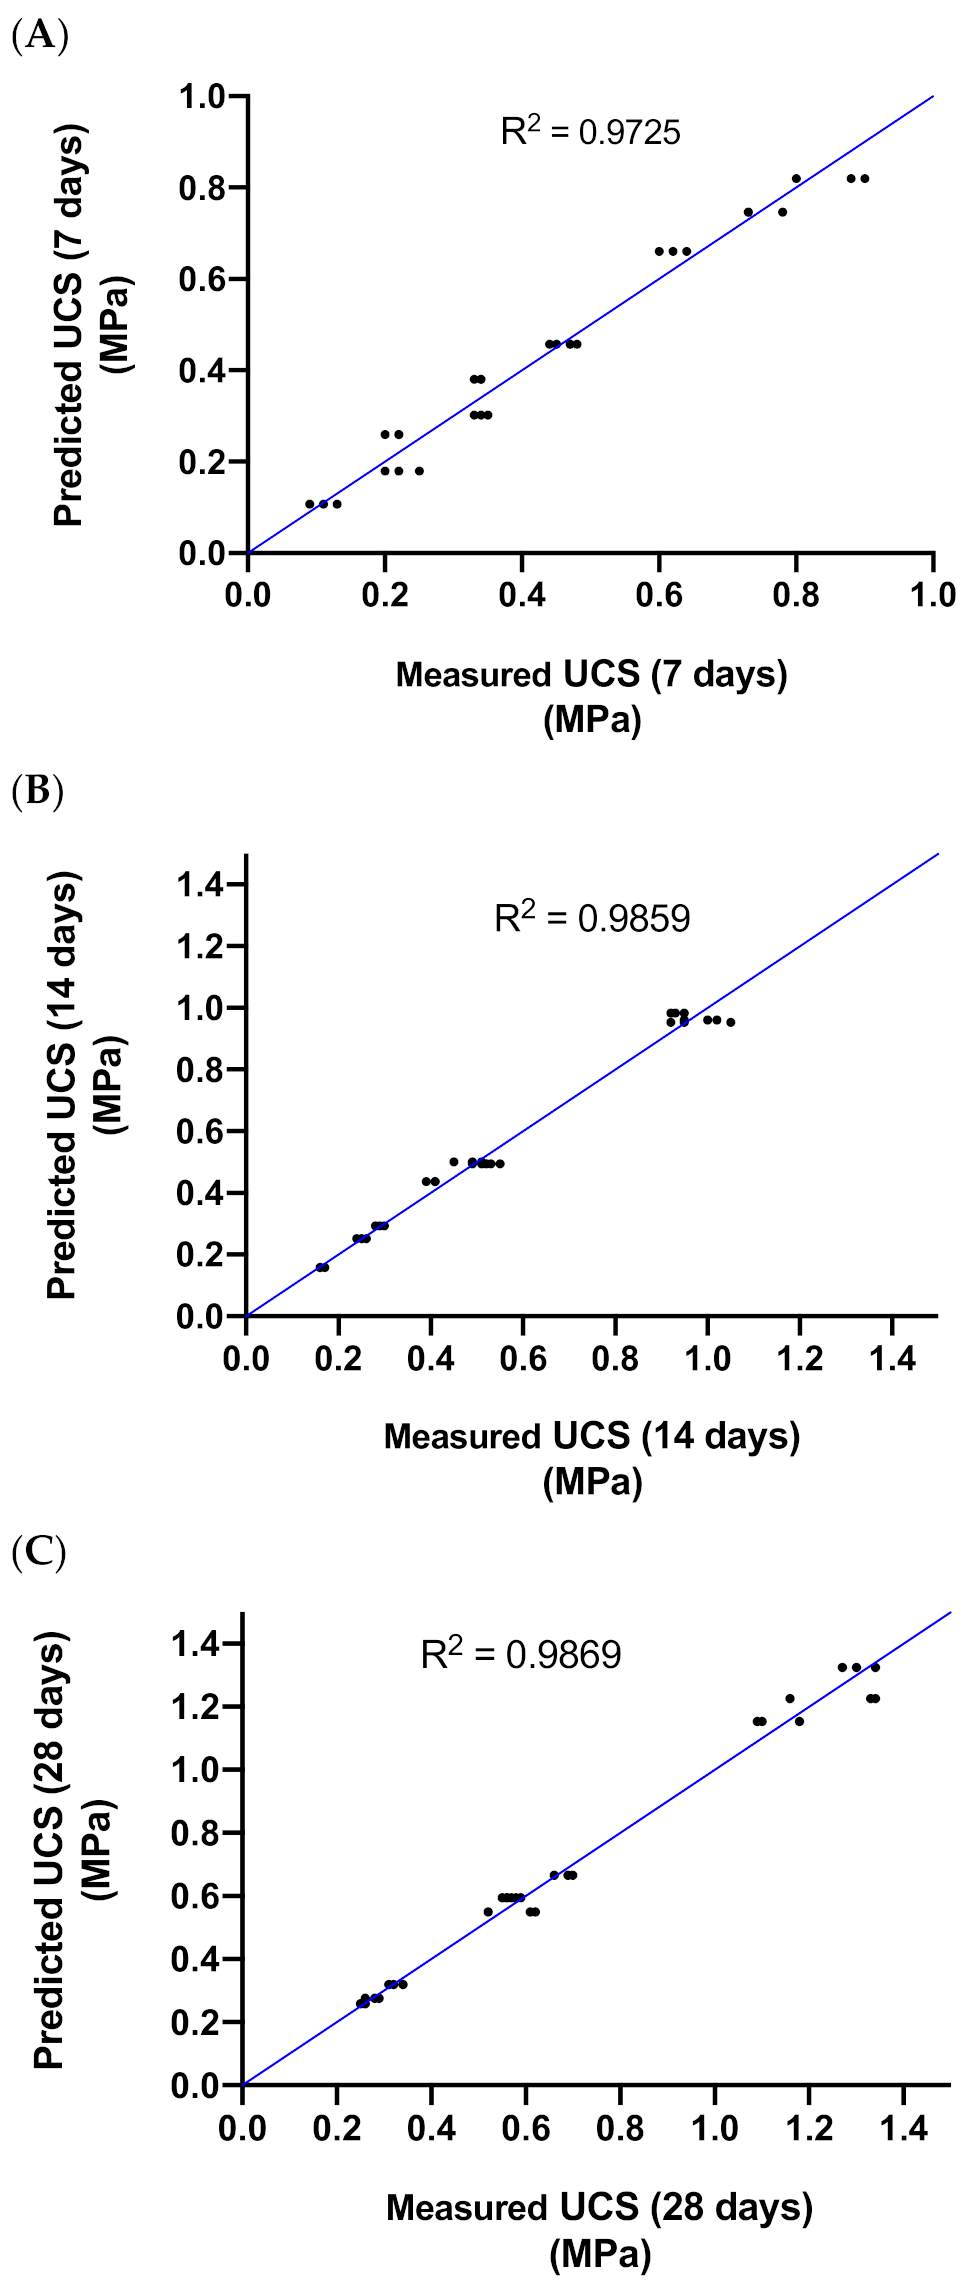
The modeled and measured UCS values were in excellent agreement (Figure 11). More than 97% of the variation in UCS is explained by the factors investigated. The small differences between R2 and adjusted R2 (<0.006) indicate that the models are acceptable.
An analysis of variance (ANOVA) showed that the regression models are statistically significant at α = 0.05 (Table 8). The regression coefficients of C and A are statistically significant across all models (Table 9), which supports the findings above that increasing the cement dosage increases the UCS and increasing the entrained air dosage decreases the UCS. Some interaction was detected between C and A, particularly in the 14-day model, which can be explained by enhanced dispersion of cement particles that would otherwise tend to agglomerate [49,50,51]. These interactions suggest that air entrainment does not necessarily lower the UCS, a contention that can be closely examined in the response surfaces generated from the UCS regression models.
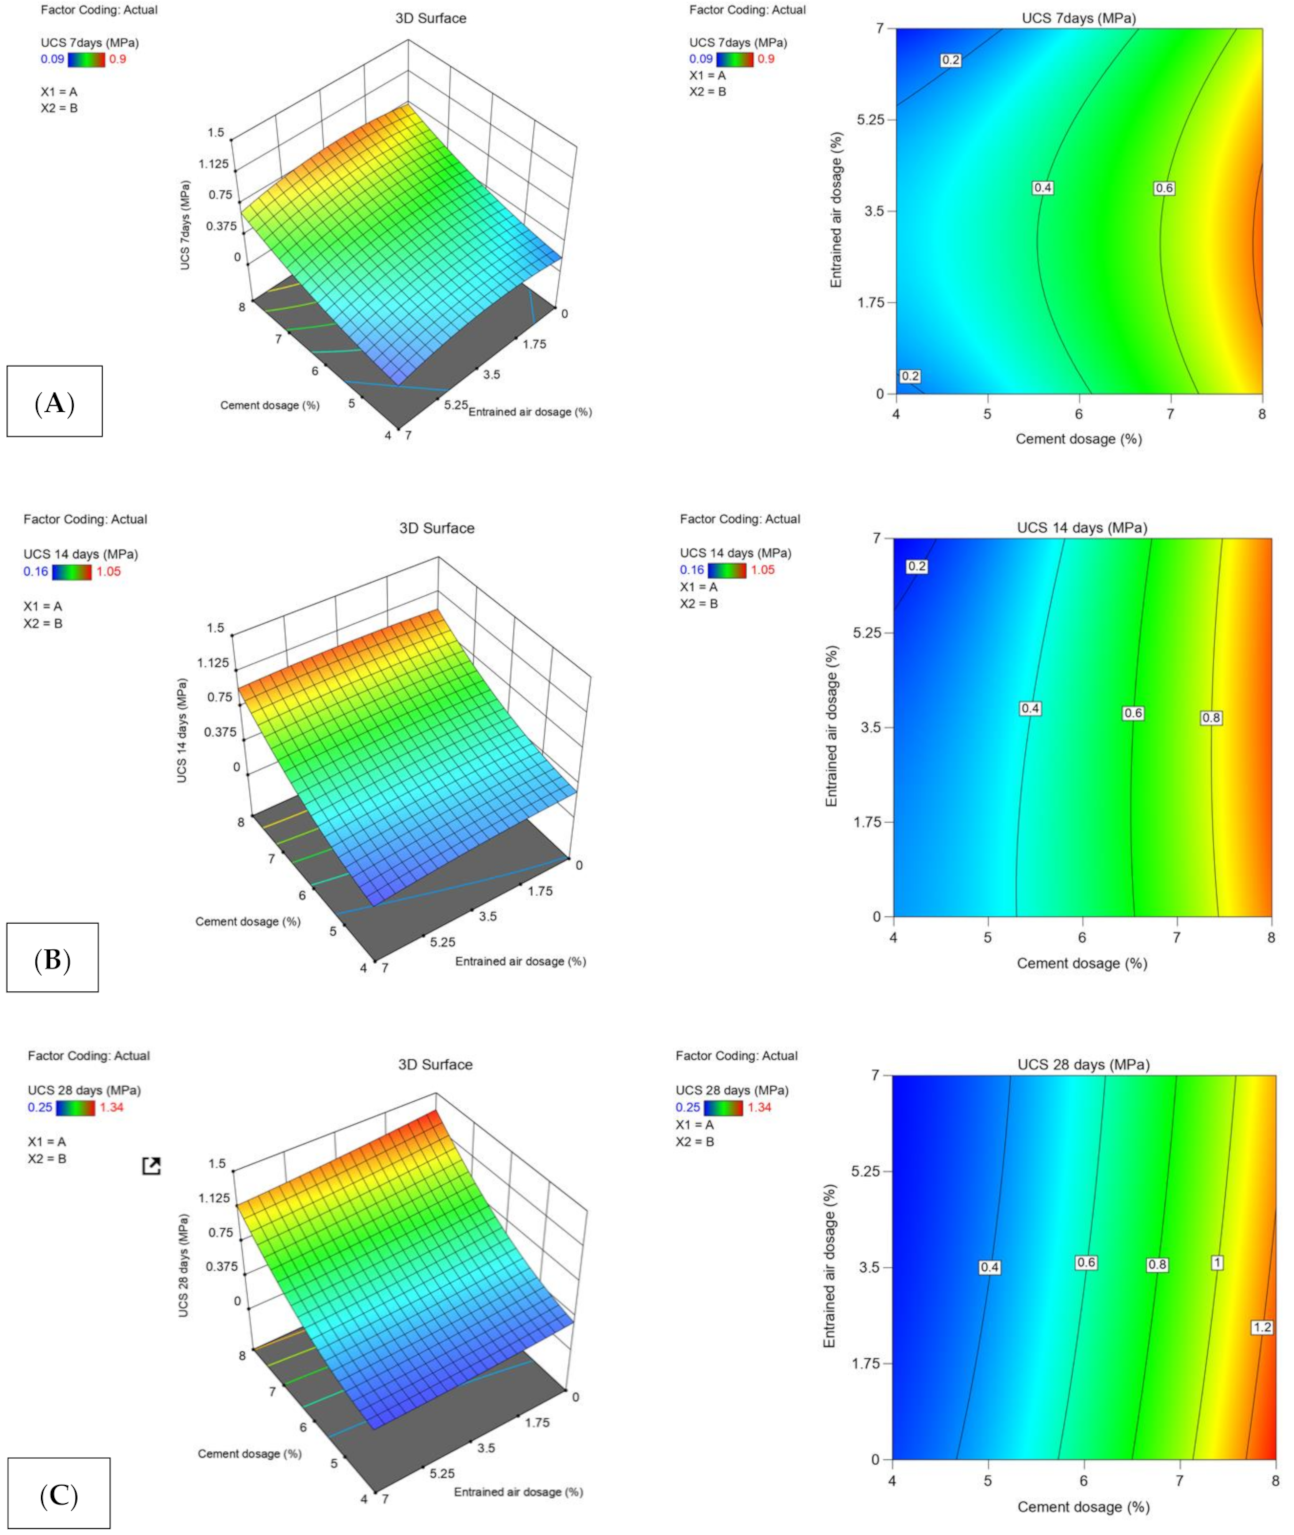
The three-dimensional response surface for the 7-day model (Figure 12A) shows high UCS when the entrained air dosage is 3.5%, owing to the statistically significant positive coefficient of A in Equation (5) and demonstrating that air entrainment can improve UCS at low dosages. However, the UCS was lower at an entrained air dosage of 7%, regardless of curing age. The UCS increased dramatically as the cement dosage increased from 4 to 8%. For example, a mixture with 7% air resulted in an increase in UCS by 348% (0.25 to 1.12 MPa) after 28 days (Figure 12C). However, the entrained air dosage had a weaker effect on UCS after 28 days, decreasing it by approximately 14% (from 1.30 to 1.12 MPa; Figure 12C). This effect is likely due to the higher porosity of the specimens, which reduces the UCS. The contour plots in Figure 12 are useful in determining the UCS when varying cement and entrained air dosages. For example, a UCS of 1 MPa could be achieved in samples cured for 28 days that contain 7.2% cement and 0% entrained air or 7.6% cement and 7% entrained air (Figure 12C).
5.2. Fresh and Dry Density Responses
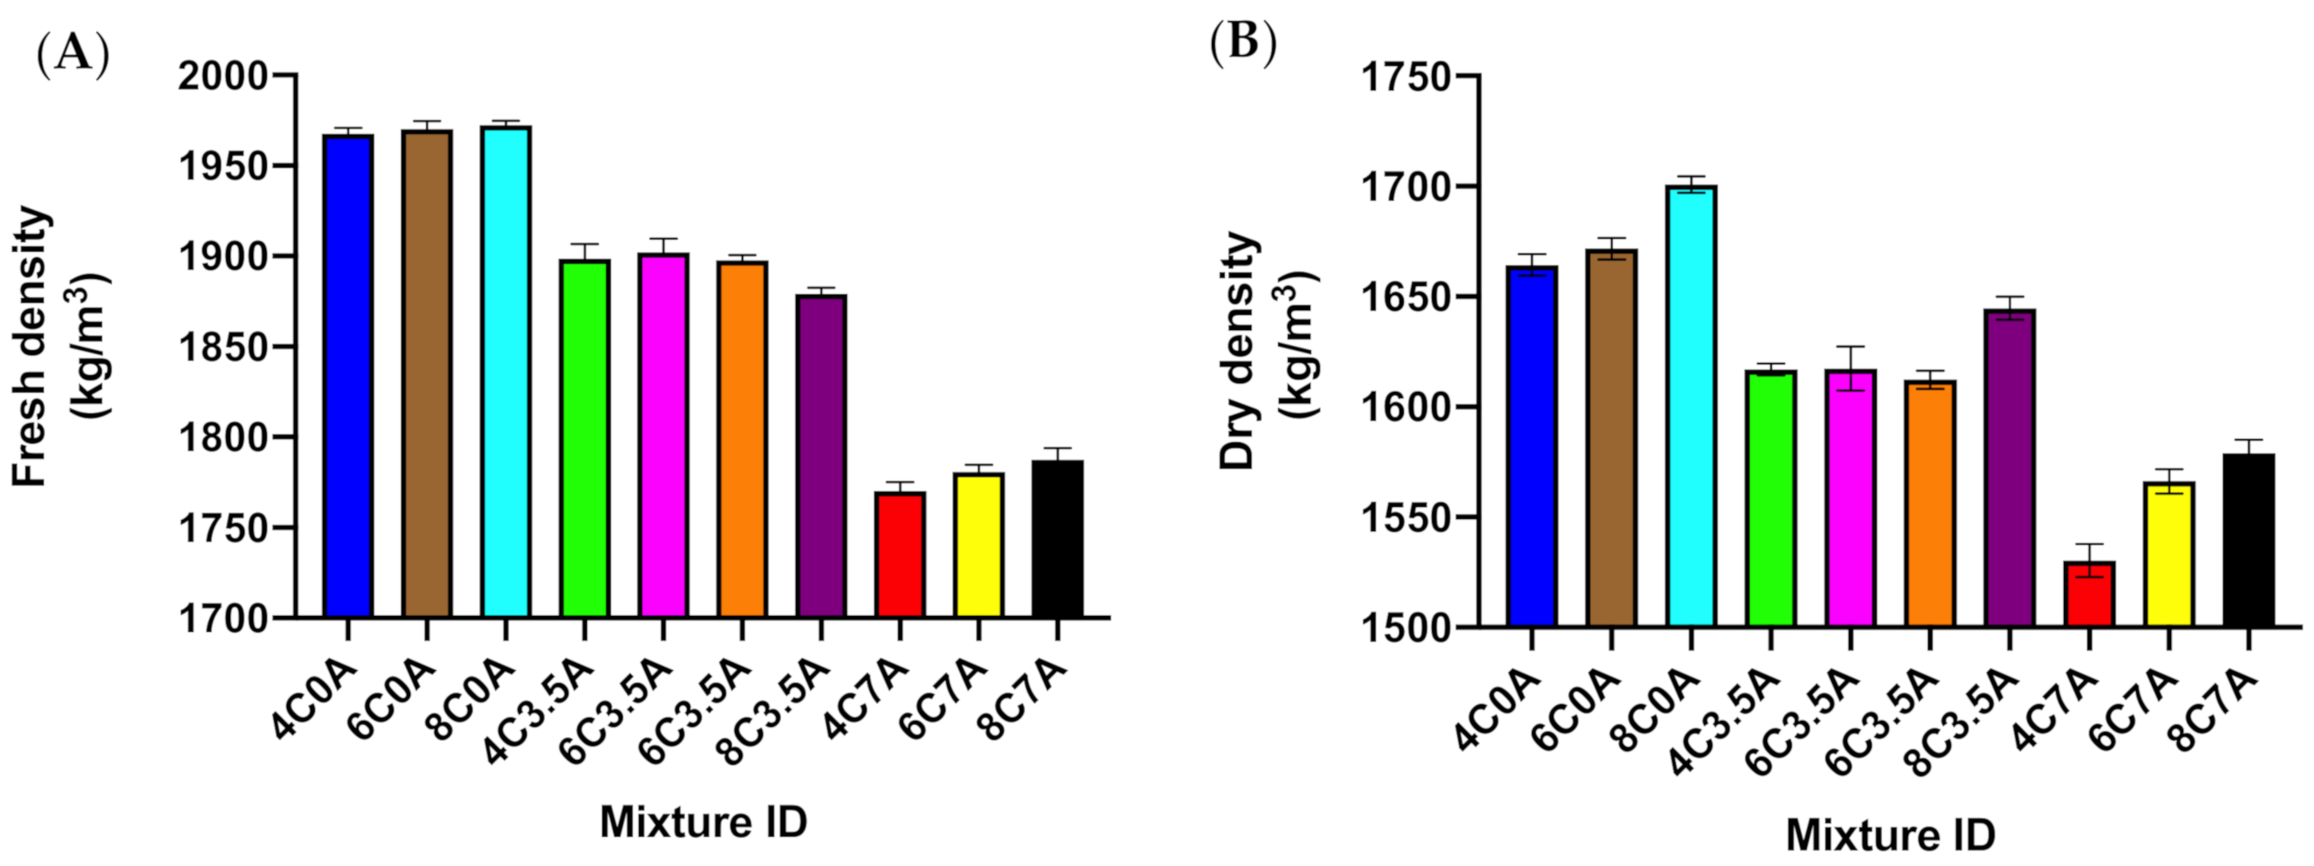
The arithmetic means of fresh and dry densities analyzed in the same manner as UCS decreased as the entrained air dosage increased (Figure 13), supporting the contention that the effect on UCS is due to an increase in porosity. Relative to reference samples containing no entrained air, samples with 7% entrained air had lower fresh (~1750 vs. 1950 kg/m3; Figure 13A) and dry densities (~1580 vs. 1700 kg/m3; Figure 13B).
The predictive regression models developed for fresh and dry densities are presented in Equations (8) and (9), respectively:
where A is the entrained air dosage from 0 to 7, and C is the cement dosage from 4 to 8.
Fresh density (kg/m3) = 1934.29 − 19.2177A + 14.4683C − 1.5335A2 − 1.3214C2 + 0.4524AC
Dry density (kg/m3) = 1686.96 − 16.8537A − 12.0099C − 0.4257A2 + 1.6547C2 + 0.4405AC
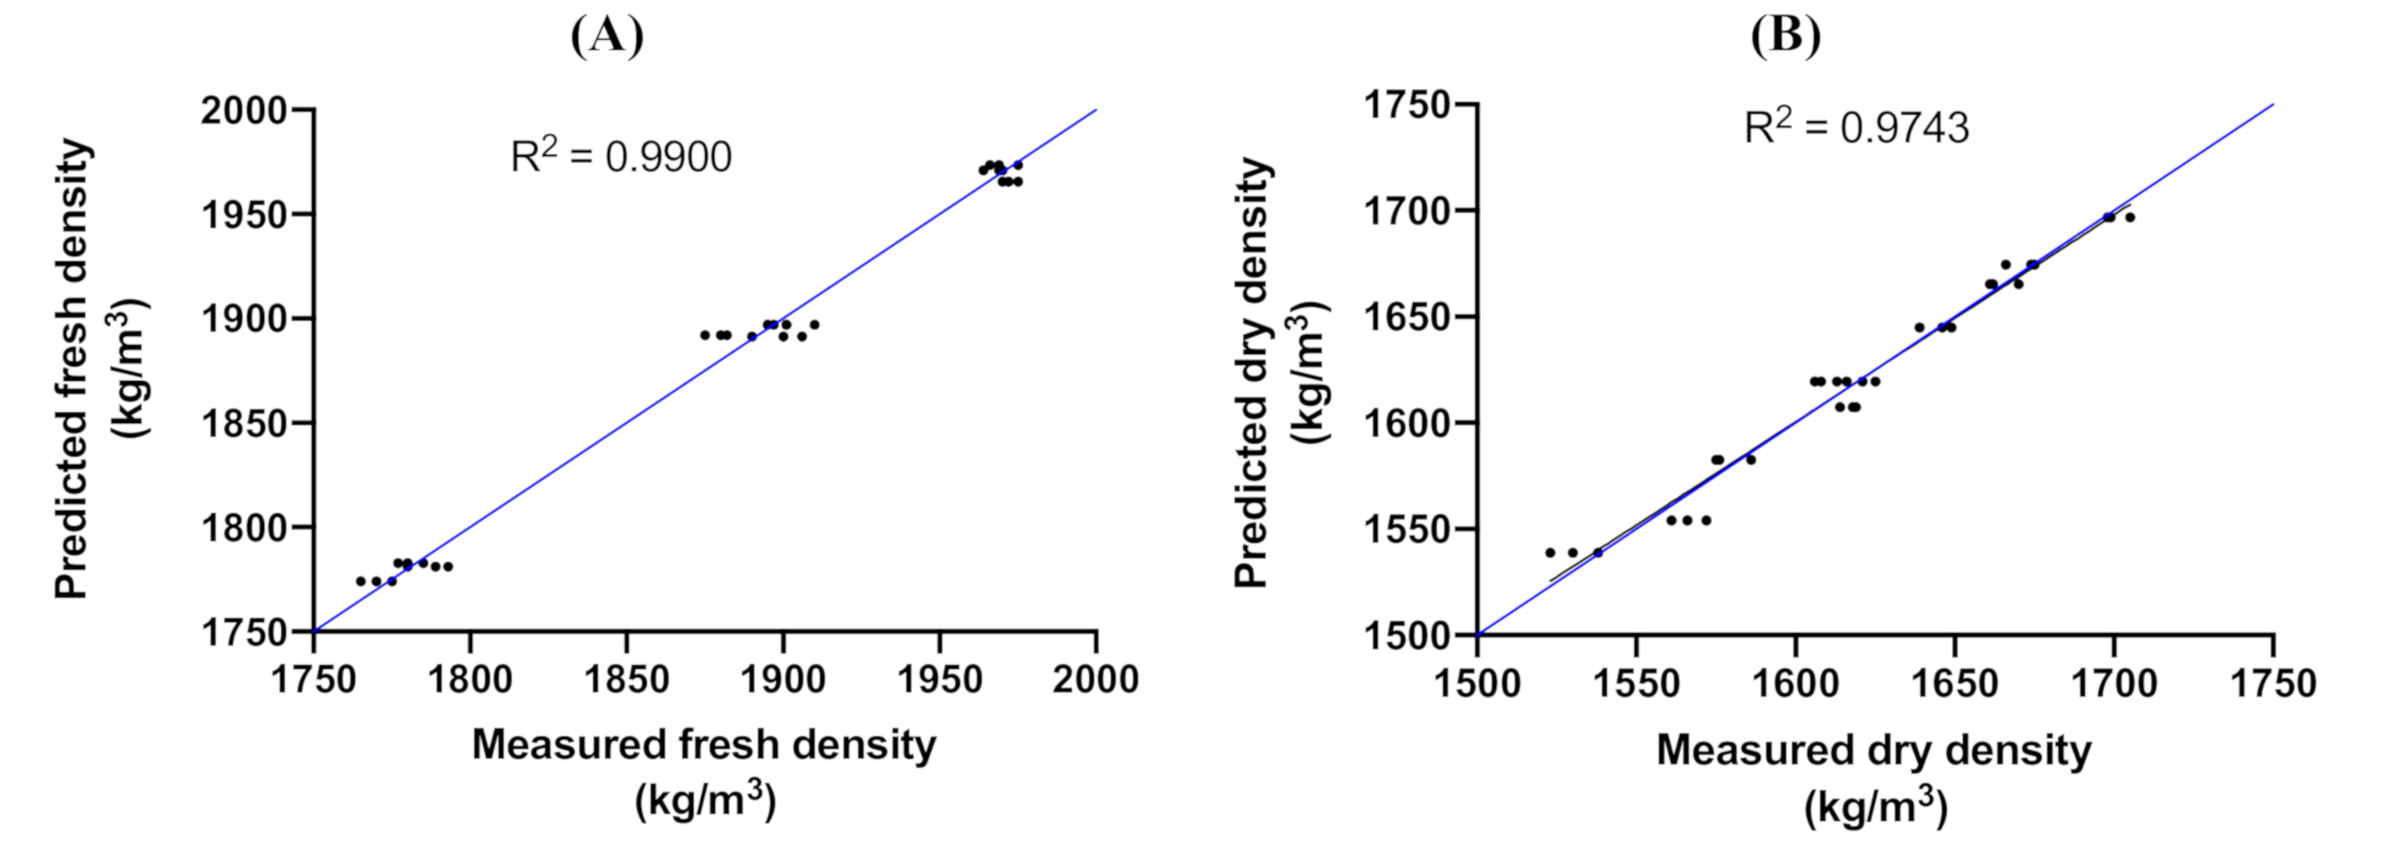
To assess the strength of the density models, the predicted values were plotted against measured values. Again, more than 97% of the variation in the fresh and dry densities, respectively, is explained by the changes in the factors investigated (Figure 14). Moreover, the minor differences between R2 and adjusted R2 (<0.0053) indicate that the models are acceptable.
The ANOVA results for both models and their coefficients (Table 10 and Table 11) suggest that entrained air dosage strongly influences the fresh and dry densities of backfill specimens. The negative coefficient terms of A and A2 in Equation (8) explain the decrease in fresh density when the entrained air dosage is increased. The dry densities are similarly affected.
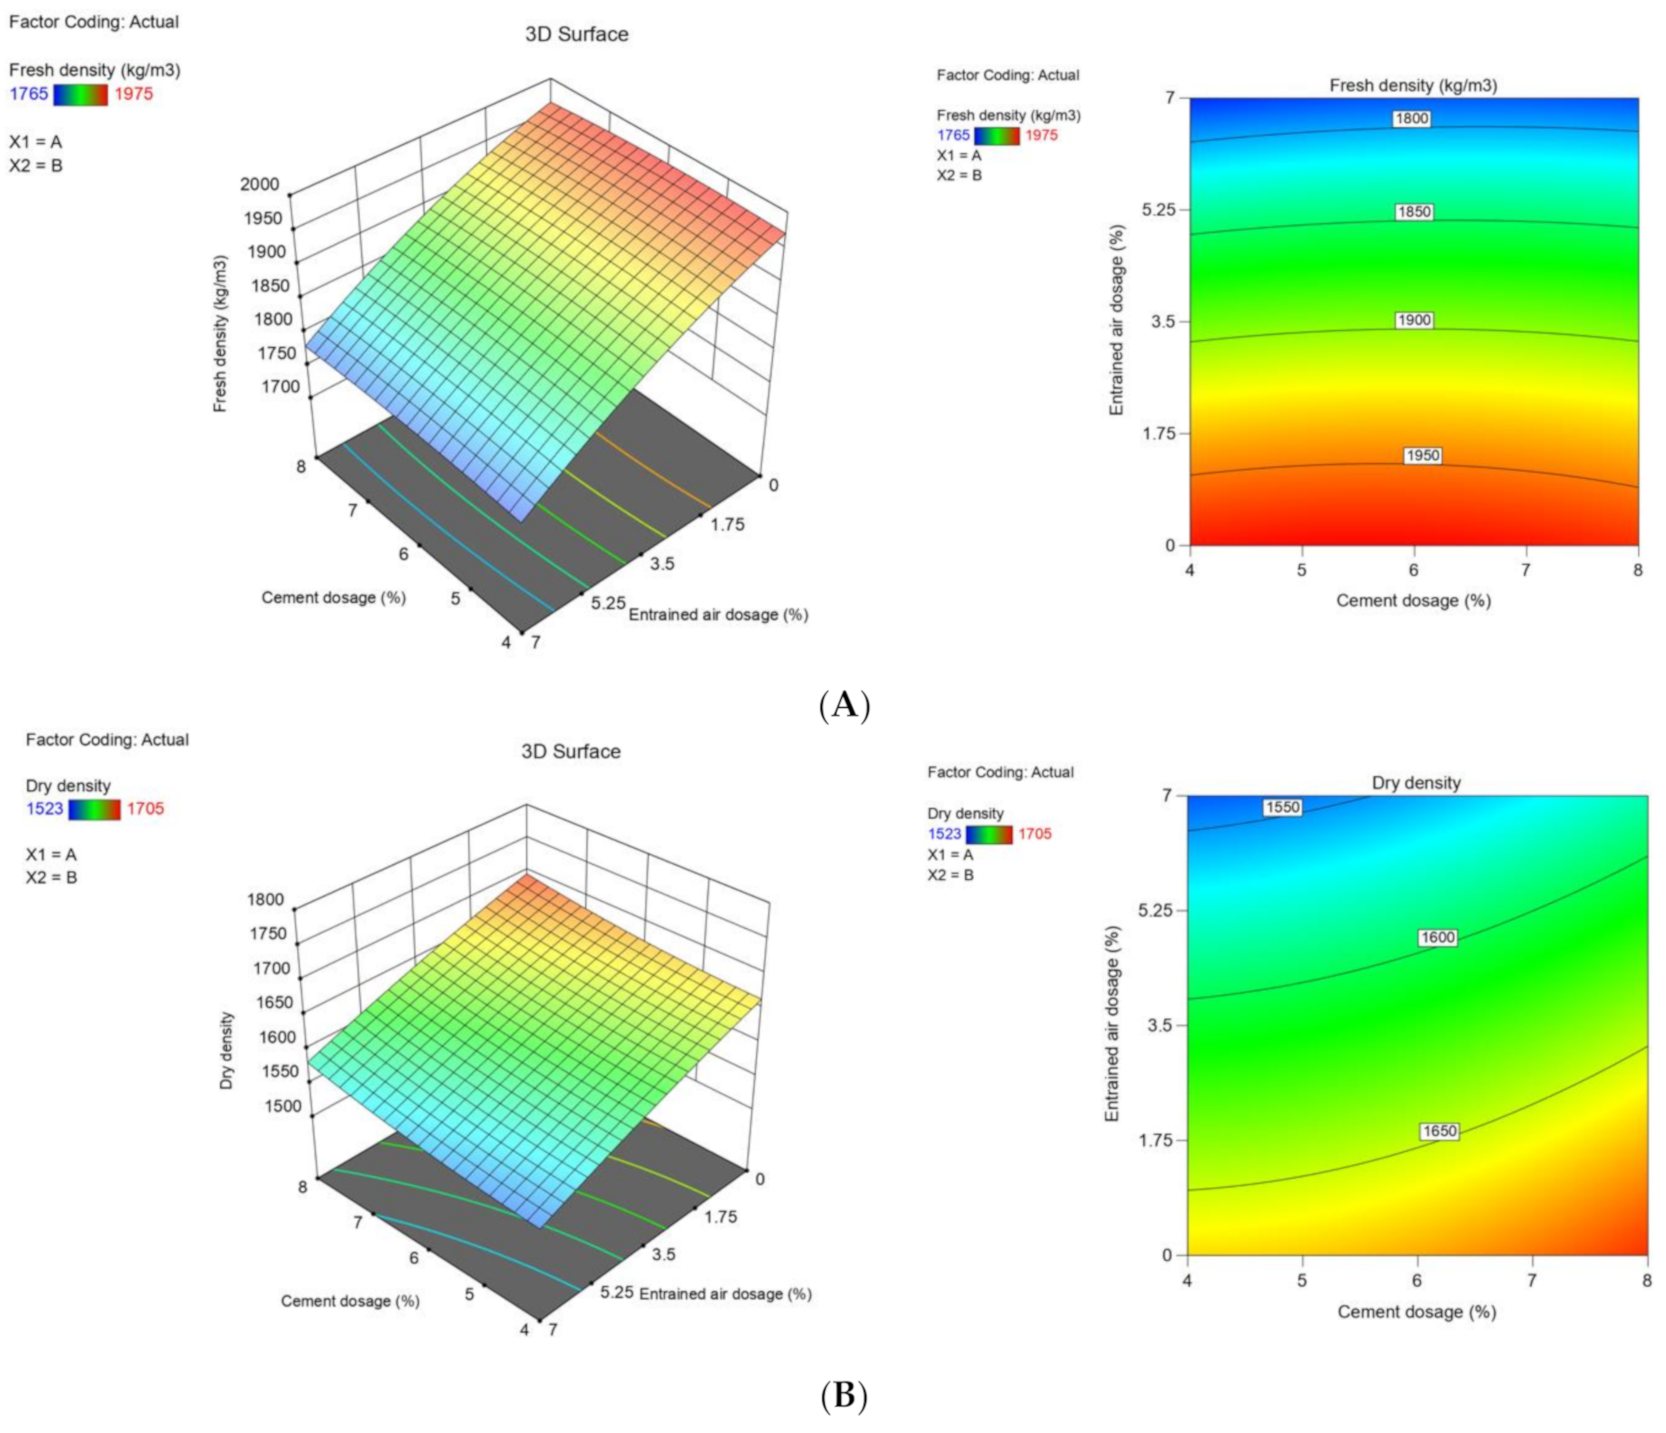
The response surfaces and contour plots for the fresh and dry densities clearly depict an inverse relationship between density and entrained air dosage (Figure 15). By comparison, the cement dosage affects dry density to a lesser extent than entrained air dosage. These findings highlight the potential of using air entrainment in mine backfill where there is a low tailings supply. However, a binder must be added to compensate for adding more air bubbles (i.e., increasing the volume) to achieve the required strength.
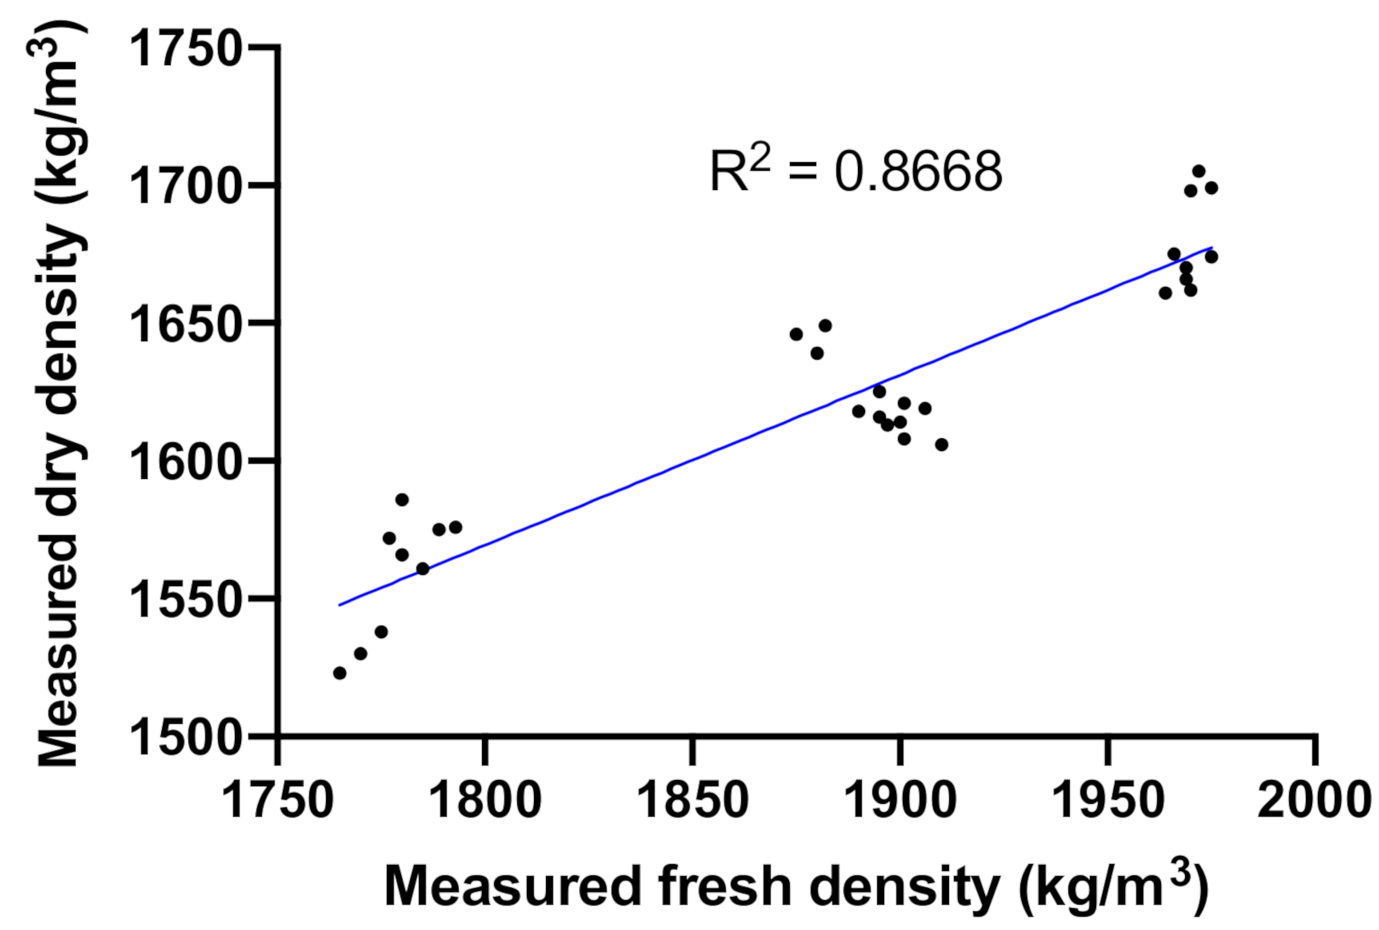
Equation (10) was developed based on the strong positive relationship between measured dry and fresh densities (Figure 16). This model allows prediction of the targeted mine backfill dry densities based on fresh densities.
Dry density (kg/m3) = 458.83 + 0.617 × fresh density (kg/m3)
5.3. Microstructural Properties
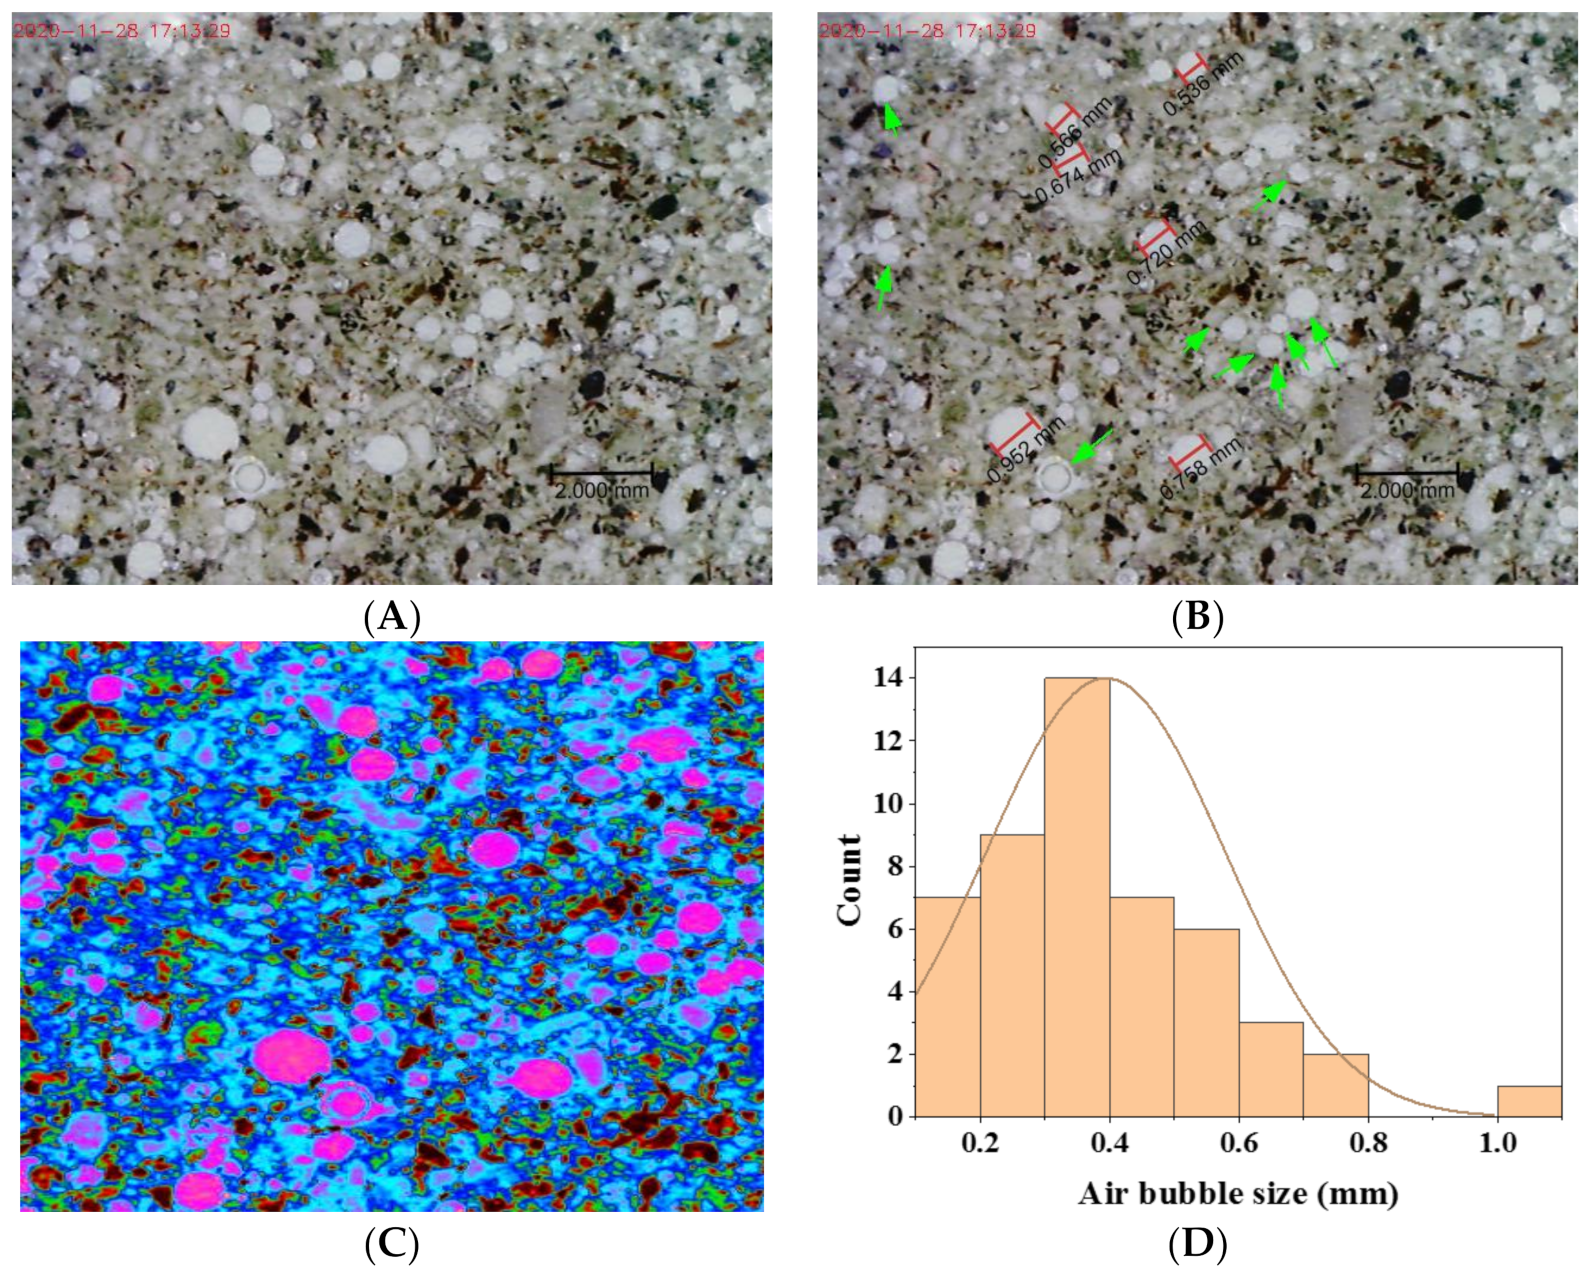
The microstructural analysis showed that air bubbles in the backfill were circular (Figure 17A–C). Detailed measurement of the 49 air bubbles in the thin section after enhancing the image contrast yielded the air bubble size distribution in Figure 17D. Bubbles ranged in diameter from 0.1585 to 1.035 mm (mean ± standard deviation: 0.3936 ± 0.1841 mm; median: 0.3505 mm), which is in good agreement with literature values ranging from 50 μm to 1 mm [23].
6. Conclusions
This experimental study investigated the effect of cement and entrained air dosages on the UCS and fresh and dry densities of mine backfill specimens prepared with silica sand as the main inert material. Linear regression and RSM analyses supported by microstructural image analysis. The conclusions and recommendations based on the findings of this study are as follows:
- The UCS of mine backfill specimens was positively related to cement dosage and negatively related with entrained air dosage. However, a low entrained air dosage (3.5%) improved the UCS, probably owing to better dispersion of cement particles.
- Fresh density was negatively related with entrained air dosage. This finding could guide further research on using air entrainment to improve backfill flowability and reduce pumping costs.
- Dry density was also negatively related with entrained air dosage. Thus, a higher entrained air dosage could ensure a safer work environment where mining methods require a low-density fill, such as underhand cut-and-fill mining.
- RSM was demonstrated to be a powerful statistical tool to quantify the influence of factors on the response of a system, particularly when interactions between variables exist that would not be detected if only one variable was manipulated.
- Image analysis of air bubble shape and size distribution provided insights into the mechanisms driving the observed changes in strength and density.
- Further investigations are encouraged in the following areas:
- Effect of tailings physical and chemical properties on air bubble shape and size distribution;
- Potential use of air-entrainment agents in mine backfill to reduce pipe wear during transport to underground voids;
- Economic viability of using air entrainment in mine backfilling given that the cement dosage must be increased to compensate for the higher dosage of entrained air;
- Applicability of laboratory-scale results to field conditions.
7. Patents
This study was built upon a patent granted in Australia [52].
Author Contributions
Conceptualization, M.H. and F.H.; experimental design, M.H.; samples preparation and testing, M.H.; data analysis, M.H. and F.H.; results discussion, M.H. and F.H.; paper writing, M.H. All authors have read and agreed to the published version of the manuscript.
Funding
This project was supported by the Deanship of Scientific Research (DSR), King Abdulaziz University, Jeddah, under Grant No. G:568-135-1441. The authors, therefore, gratefully acknowledge the DSR technical and financial support.
Institutional Review Board Statement
Not applicable.
Informed Consent Statement
Not applicable.
Data Availability Statement
The data presented in this study are shown in the manuscript.
Acknowledgments
The authors would like to thank the anonymous reviewers for their value-added comments that improved the overall quality of the paper. The authors would also like to extend their appreciation to Vatne Concrete Systems. Finally, the authors would like to thank the Deanship of Scientific Research (DSR) at King Abdulaziz University for funding this research.
Conflicts of Interest
The authors declare no conflict of interest.
References
- Kinnunen, P.; Ismailov, A.; Solismaa, S.; Sreenivasan, H.; Räisänen, M.-L.; Levänen, E.; Illikai, M. Recycling mine tailings in chemically bonded ceramics—A review. J. Clean. Prod. 2018, 174, 634–639. [Google Scholar] [CrossRef] [Green Version]
- Koohestani, B.; Koubaa, A.; Belem, T.; Bussière, B.; Bouzahzah, H. Experimental investigation of mechanical and microstructural properties of cemented paste backfill containing maple-wood filler. Constr. Build. Mater. 2016, 121, 222–228. [Google Scholar] [CrossRef]
- Belem, T.; Benzaazoua, M. An Overview on the Use of Paste Backfill Technology as a Ground Support Method in Cut-and-Fill Mines. In Proceedings of the 5th International Symposium on Ground Support in Mining and Underground Construction, Perth, Australia, 28–30 September 2004; Villaescusa, E., Potvin, Y., Eds.; CRC Press: London, UK, 2004. [Google Scholar]
- Hassani, F.; Archibald, J. Mine Backfill; Canadian Institute of Mining, Metallurgy and Petroleum: Montreal, QC, Canada, 1998. [Google Scholar]
- Potvin, Y.; Thomas, E.; Fourie, A. Handbook on Mine Fill; Australian Centre for Geomechanics: Nedlands, Australia, 2005. [Google Scholar]
- Benzaazoua, M.; Fall, M.; Belem, T. A contribution to understanding the hardening process of cemented pastefill. Miner. Eng. 2004, 17, 141–152. [Google Scholar] [CrossRef]
- Sivakugan, N.; Rankine, R.M.; Rankine, K.J.; Rankine, K.S. Geotechnical considerations in mine backfilling in Australia. J. Clean. Prod. 2006, 14, 1168–1175. [Google Scholar] [CrossRef]
- Niroshan, N.; Sivakugan, N.; Veenstra, R.L. Laboratory study on strength development in cemented paste backfills. J. Mater. Civ. Eng. 2017, 29, 04017027. [Google Scholar] [CrossRef]
- Grice, T. Underground Mining with Backfill. In Proceedings of the 2nd Annual Summit-Mine Tailings Disposal Systems, Brisbane, Australia, 24–25 November 1998; pp. 1–14. [Google Scholar]
- Edraki, M.; Baumgartl, T.; Manlapig, E.; Bradshaw, D.; Franks, D.M.; Moran, C.J. Designing mine tailings for better environmental, social and economic outcomes: A review of alternative approaches. J. Clean. Prod. 2014, 84, 411–420. [Google Scholar] [CrossRef]
- Peyronnard, O.; Benzaazoua, M. Alternative by-product based binders for cemented mine backfill: Recipes optimisation using Taguchi method. Miner. Eng. 2012, 29, 28–38. [Google Scholar] [CrossRef]
- Ercikdi, B.; Cihangir, F.; Kesimal, A.; Deveci, H.; Alp, I. Utilization of industrial waste products as pozzolanic material in cemented paste backfill of high sulphide mill tailings. J. Hazard. Mater. 2009, 168, 848–856. [Google Scholar] [CrossRef]
- Qi, C.; Fourie, A. Cemented paste backfill for mineral tailings management: Review and future perspectives. Miner. Eng. 2019, 144, 106025. [Google Scholar] [CrossRef]
- Sathya Narayanan, J.; Ramamurthy, K. Identification of set-accelerator for enhancing the productivity of foam concrete block manufacture. Constr. Build. Mater. 2012, 37, 144–152. [Google Scholar] [CrossRef]
- Kunhanandan Nambiar, E.K.; Ramamurthy, K. Influence of filler type on the properties of foam concrete. Cem. Concr. Compos. 2006, 28, 475–480. [Google Scholar] [CrossRef]
- Wang, Y.; Zhang, S.; Niu, D.; Su, L.; Luo, D. Strength and chloride ion distribution brought by aggregate of basalt fiber reinforced coral aggregate concrete. Constr. Build. Mater. 2020, 234, 117390. [Google Scholar] [CrossRef]
- Kilincarslan, Ş.; Davraz, M.; Akça, M. The effect of pumice as aggregate on the mechanical and thermal properties of foam concrete. Arab. J. Geosci. 2018, 11, 289. [Google Scholar] [CrossRef]
- Niu, D.; Zhang, L.; Fu, Q.; Wen, B.; Luo, D. Critical conditions and life prediction of reinforcement corrosion in coral aggregate concrete. Constr. Build. Mater. 2020, 238, 117685. [Google Scholar] [CrossRef]
- Falliano, D.; de Domenico, D.; Ricciardi, G.; Gugliandolo, E. Experimental investigation on the compressive strength of foamed concrete: Effect of curing conditions, cement type, foaming agent and dry density. Constr. Build. Mater. 2018, 165, 735–749. [Google Scholar] [CrossRef]
- Tan, X.; Chen, W.; Wang, J.; Yang, D.; Qi, X.; Ma, Y.; Wang, X.; Ma, S.; Li, C. Influence of high temperature on the residual physical and mechanical properties of foamed concrete. Constr. Build. Mater. 2017, 135, 203–211. [Google Scholar] [CrossRef]
- Jones, M.R.; Ozlutas, K.; Zheng, L. High-volume, ultra-low-density fly ash foamed concrete. Mag. Concr. Res. 2017, 69, 1146–1156. [Google Scholar] [CrossRef] [Green Version]
- Bing, C.; Zhen, W.; Ning, L. Experimental research on properties of high-strength foamed concrete. J. Mater. Civ. Eng. 2012, 24, 113–118. [Google Scholar] [CrossRef]
- Aligizaki, K.K. Pore Structure of Cement-Based Materials; CRC Press: London, UK, 2005. [Google Scholar]
- Mugahed Amran, Y.H.; Farzadnia, N.; Abang Ali, A.A. Properties and applications of foamed concrete; a review. Constr. Build. Mater. 2015, 101, 990–1005. [Google Scholar] [CrossRef]
- Tarasov, A.S.; Kearsley, E.P.; Kolomatskiy, A.S.; Mostert, H.F. Heat evolution due to cement hydration in foamed concrete. Mag. Concr. Res. 2010, 62, 895–906. [Google Scholar] [CrossRef] [Green Version]
- Fu, Y.; Wang, X.; Wang, L.; Li, Y. Foam concrete: A State-of-the-art and state-of-the-practice review. Adv. Mater. Sci. Eng. 2020, 6153602. [Google Scholar] [CrossRef] [Green Version]
- Ramamurthy, K.; Kunhanandan Nambiar, E.K.; Indu Siva Ranjani, G. A classification of studies on properties of foam concrete. Cem. Concr. Compos. 2009, 31, 388–396. [Google Scholar] [CrossRef]
- Tikalsky, P.J.; Pospisil, J.; MacDonald, W. A method for assessment of the freeze-thaw resistance of preformed foam cellular concrete. Cem. Concr. Res. 2004, 34, 889–893. [Google Scholar] [CrossRef]
- Beningfield, N.; Gaimster, R.; Griffin, P. Investigation into the Air Void Characteristics of Foamed Concrete. In Proceedings of the International Conference on the Use of Foamed Concrete in Construction, Dundee, UK, 5 July 2005; Dhir, R.K., Newlands, M.D., McCarthy, A., Eds.; Thomas Telford: London, UK, 2005. [Google Scholar]
- Du, L.; Folliard, K.J. Mechanisms of air entrainment in concrete. Cem. Concr. Res. 2005, 35, 1463–1471. [Google Scholar] [CrossRef]
- Panesar, D.K. Cellular concrete properties and the effect of synthetic and protein foaming agents. Constr. Build. Mater. 2013, 44, 575–584. [Google Scholar] [CrossRef]
- Brady, B.H.G.; Brown, E.T. Rock Mechanics for Underground Mining, 3rd ed.; Springer: Dordrecht, The Netherlands, 2006. [Google Scholar] [CrossRef]
- Hefni, M.; Hassani, F.P.; Nokken, M.; Kermani, M.; Vatne, D. Investigation into the development of foam mine fill. In Proceedings of the 11th International Symposium on Mining with Backfill, Perth, Australia, 20–22 May 2014; Australian Centre for Geomechanics: Perth, Australia, 2014; pp. 49–59. [Google Scholar] [CrossRef]
- Hefni, M.; Hassani, F. Experimental development of a novel mine backfill material: Foam mine fill. Minerals 2020, 10, 564. [Google Scholar] [CrossRef]
- Benzaazoua, M.; Fiset, J.F.; Bussière, B.; Villeneuve, M.; Plante, B. Sludge recycling within cemented paste backfill: Study of the mechanical and leachability properties. Miner. Eng. 2006, 19, 420–432. [Google Scholar] [CrossRef]
- Kermani, M.F. An Investigation into the Mechanical Properties of Gelfill. Ph.D. Thesis, McGill University, Montreal, QC, Canada, 2012. [Google Scholar]
- Jiang, H.; Qi, Z.; Yilmaz, E.; Han, J.; Qiu, J.; Dong, C. Effectiveness of alkali-activated slag as alternative binder on workability and early age compressive strength of cemented paste backfills. Constr. Build. Mater. 2019, 218, 689–700. [Google Scholar] [CrossRef]
- Fall, M.; Célestin, J.C.; Pokharel, M.; Touré, M. A contribution to understanding the effects of curing temperature on the mechanical properties of mine cemented tailings backfill. Eng. Geol. 2010, 114, 397–413. [Google Scholar] [CrossRef]
- Wu, A.; Wang, Y.; Wang, H.; Yin, S.; Miao, X. Coupled effects of cement type and water quality on the properties of cemented paste backfill. Int. J. Miner. Process. 2015, 143, 65–71. [Google Scholar] [CrossRef]
- Mahlaba, J.S.; Kearsley, E.P.; Kruger, R.A.; Pretorius, P.C. Evaluation of workability and strength development of fly ash pastes prepared with industrial brines rich in SO4= and Cl– to expand brine utilisation. Miner. Eng. 2011, 24, 1077–1081. [Google Scholar] [CrossRef]
- ASTM International. ASTM C260/C260M–10a(2016), Standard Specification for Air-Entraining Admixtures for Concrete; ASTM International: West Conshohocken, PA, USA, 2016. [Google Scholar] [CrossRef]
- ASTM International. ASTM C869/C869M–11(2016), Standard Specification for Foaming Agents Used in Making Preformed Foam for Cellular Concrete; ASTM International: West Conshohocken, PA, USA, 2016. [Google Scholar] [CrossRef]
- Kunhanandan Nambiar, E.K.; Ramamurthy, K. Models relating mixture composition to the density and strength of foam concrete using response surface methodology. Cem. Concr. Compos. 2006, 28, 752–760. [Google Scholar] [CrossRef]
- Box, G.E.P.; Wilson, K.B. On the experimental attainment of optimum conditions. J. R. Stat. Soc. B 1951, 13, 1–38. [Google Scholar] [CrossRef]
- Fall, M.; Benzaazoua, M.; Saa, E.G. Mix proportioning of underground cemented tailings backfill. Tunnel. Undergr. Space Technol. 2008, 23, 80–90. [Google Scholar] [CrossRef]
- Wagner, J.R.; Mount, E.M.; Giles, H.F. Design of experiments. In Extrusion: The Definitive Processing Guide and Handbook, 2nd ed.; Giles, H.F., Jr., Wagner, J.R., Jr., Mount, E.M., Eds.; William Andrew Publishers: Norwich, UK, 2013; pp. 291–308. [Google Scholar]
- ASTM International. ASTM C31/C31M–19a, Standard Practice for Making and Curing Concrete Test Specimens in the Field; ASTM International: West Conshohocken, PA, USA, 2019. [Google Scholar] [CrossRef]
- ASTM International. ASTM D2166/D2166M-16, Standard Test Method for Unconfined Compressive Strength of Cohesive Soil; ASTM International: West Conshohocken, PA, USA, 2016. [Google Scholar] [CrossRef]
- Lewis, J.A.; Matsuyama, H.; Kirby, G.; Morissette, S.; Young, J.F. Polyelectrolyte effects on the rheological properties of concentrated cement suspensions. J. Am. Ceram. Soc. 2004, 83, 1905–1913. [Google Scholar] [CrossRef]
- Palacios, M.; Puertas, F.; Bowen, P.; Houst, Y.F. Effect of PCs superplasticizers on the rheological properties and hydration process of slag-blended cement pastes. J. Mater. Sci. 2009, 44, 2714–2723. [Google Scholar] [CrossRef]
- Sakai, E.; Kawakami, A.; Daimon, M. Dispersion mechanisms of comb-type superplasticizers containing grafted poly(ethylene oxide) chains. Macromol. Symp. 2001, 175, 367–376. [Google Scholar] [CrossRef]
- Hassani, F.; Hefni, M.; Kermani, M.; Vatne, D. Methods and Systems for Foam Mine Fill. Patent AU2015252777A1, 19 September 2019. [Google Scholar]
Figure 1.
Grain size distribution of the silica sand used to create backfill specimens.

Figure 2.
Scanning electron micrographs of silica sand at (A) 200× and (B) 300× magnification [36].
Figure 2.
Scanning electron micrographs of silica sand at (A) 200× and (B) 300× magnification [36].

Figure 3.
Stable Air® system: (A) aerator, (B) air-entraining agent, and (C) Husky Pro air compressor.
Figure 3.
Stable Air® system: (A) aerator, (B) air-entraining agent, and (C) Husky Pro air compressor.

Figure 4.
Schematic diagram of foam generation using the Stable Air® system.

Figure 5.
Central composite design square depicting backfill mixture characteristics.

Figure 6.
Preparation of backfill mixtures.

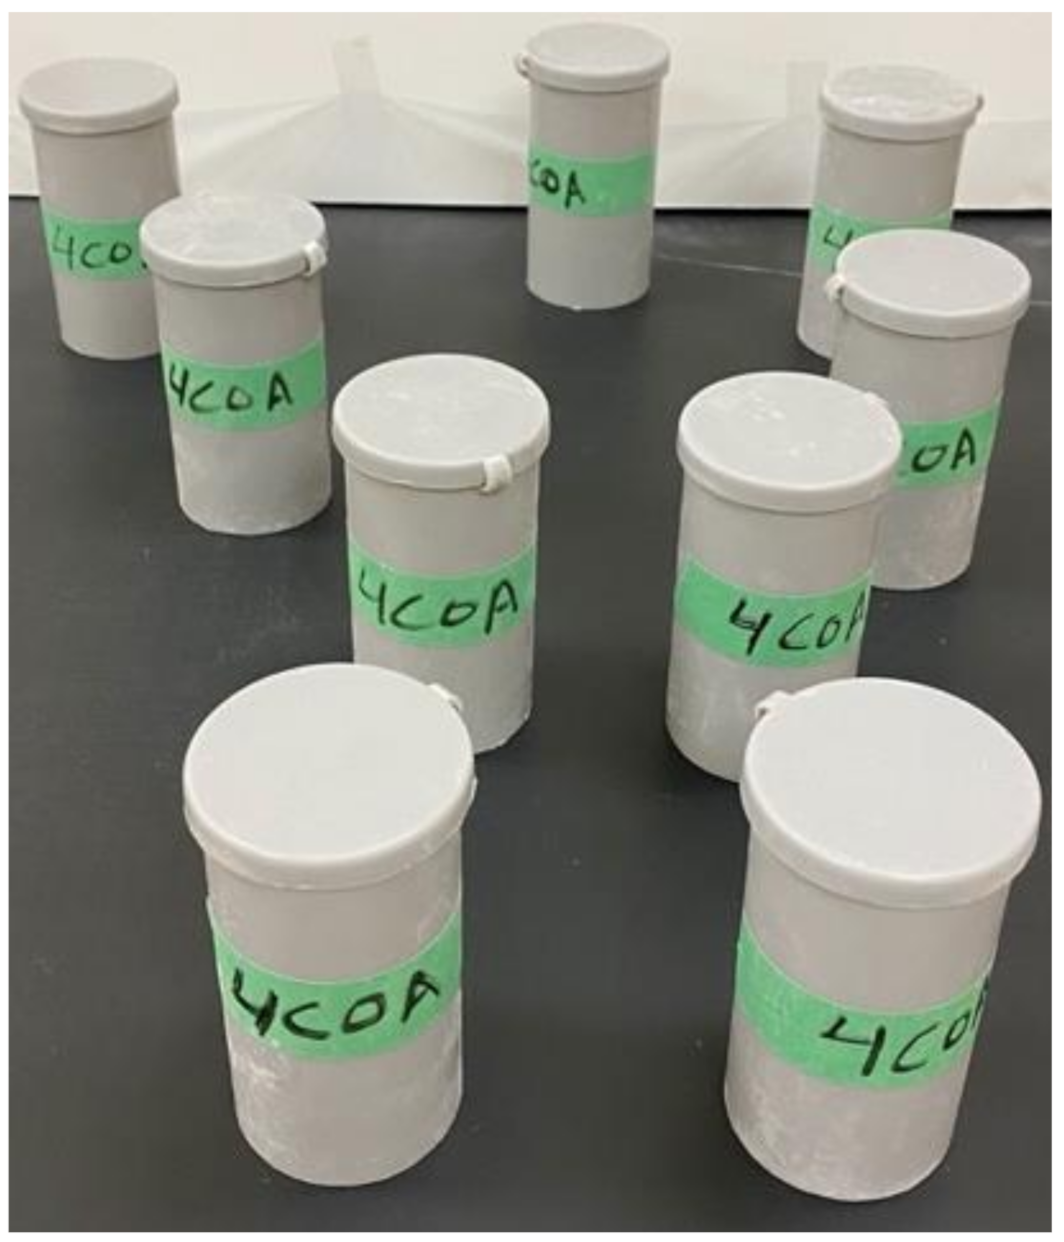
Figure 7.
Plastic molds 5.08 × 10.16 cm in size used to cast backfill mixtures.

Figure 8.
Experimental setup for testing unconfined compressive strength.

Figure 9.
Experimental setup for the thin-section microscopy investigation.

Figure 10.
Unconfined compressive strength of backfill mixtures after 7, 14, and 28 days of curing (see Table 5 for mixture IDs).
Figure 10.
Unconfined compressive strength of backfill mixtures after 7, 14, and 28 days of curing (see Table 5 for mixture IDs).

Figure 11.
Predicted vs. measured UCS after curing backfill samples for (A) 7 days, (B) 14 days, and (C) 28 days.
Figure 11.
Predicted vs. measured UCS after curing backfill samples for (A) 7 days, (B) 14 days, and (C) 28 days.

Figure 12.
Response surfaces and contour plots for UCS models after curing backfill specimens for (A) 7 days, (B) 14 days, and (C) 28 days.
Figure 12.
Response surfaces and contour plots for UCS models after curing backfill specimens for (A) 7 days, (B) 14 days, and (C) 28 days.

Figure 13.
(A) Fresh density of backfill specimens and (B) dry density of backfill specimens cured for 28 days.
Figure 13.
(A) Fresh density of backfill specimens and (B) dry density of backfill specimens cured for 28 days.

Figure 14.
Predicted versus measured (A) fresh density and (B) dry density of backfill specimens.

Figure 15.
Response surfaces and contour plots for (A) fresh density and (B) dry density.

Figure 16.
Measured dry density versus measured fresh density of backfill specimens.

Figure 17.
(A) Micrograph of thin section, (B) micrograph of the thin section with selected measurements of air bubbles (indicated by green arrows), (C) contrast enhancement with colors for better visualization of air bubbles, and (D) air bubble size distribution.
Figure 17.
(A) Micrograph of thin section, (B) micrograph of the thin section with selected measurements of air bubbles (indicated by green arrows), (C) contrast enhancement with colors for better visualization of air bubbles, and (D) air bubble size distribution.


Table 1.
Physical properties of the silica sand used to create backfill specimens.
| S.G. | D10 µm | D30 µm | D50 µm | D60 µm | D90 µm | Cu(1) | Cc(2) |
|---|---|---|---|---|---|---|---|
| 2.65 | 19.76 | 46.45 | 72.68 | 86.47 | 153.43 | 4.38 | 1.26 |
Table 2.
Chemical composition of general use cement.
| Chemical Compound | Chemical Formula | wt.% |
|---|---|---|
| Calcium oxide | CaO | 61.13 |
| Silicon dioxide | SiO2 | 19.40 |
| Aluminum oxide | Al2O3 | 4.61 |
| Magnesium oxide | MgO | 3.30 |
| Sulfur trioxide | SO3 | 2.27 |
| Sodium oxide | NaO | 2.03 |
| Ferric oxide | Fe2O3 | 2.01 |
| Potassium oxide | K2O | 0.71 |
Table 3.
Properties of the air-entraining agent in the Stable Air® system [34].
Table 3.
Properties of the air-entraining agent in the Stable Air® system [34].
| pH | Phase | Odor | S.G. | Color | Solubility in Water |
|---|---|---|---|---|---|
| 8 | liquid | Organic | 1.1 | Brown | 100% |
Table 4.
Factors investigated and coding of the three levels investigated.
| Factor | Unit | Codes and Levels | ||
|---|---|---|---|---|
| −1 | 0 | +1 | ||
| Cement dosage (C) | % | 4 | 6 | 8 |
| Entrained air dosage (A) | % | 0 (reference) | 3.5 | 7 |
Table 5.
Characteristics of the experimental backfill mixtures.
| Mixture ID | Pulp Density (%) | Tailings (g) | Water (g) | Cement (g) | Foam (g) | Water: Cement Ratio |
|---|---|---|---|---|---|---|
| 4C0A (reference) | 78 | 3400 | 998.93 | 141.67 | 0.00 | 7.05 |
| 6C0A (reference) | 78 | 3400 | 1020.19 | 217.02 | 0.00 | 4.70 |
| 8C0A (reference) | 78 | 3400 | 1042.36 | 295.65 | 0.00 | 3.53 |
| 4C3.5A | 78 | 3400 | 998.93 | 141.67 | 4.96 | 7.05 |
| 6C3.5A (2 runs) | 78 | 3400 | 1020.19 | 217.02 | 7.60 | 4.70 |
| 8C3.5A | 78 | 3400 | 1042.36 | 295.65 | 10.35 | 3.53 |
| 4C7A | 78 | 3400 | 998.93 | 141.67 | 9.92 | 7.05 |
| 6C7A | 78 | 3400 | 1020.19 | 217.02 | 15.19 | 4.70 |
| 8C7A | 78 | 3400 | 1042.36 | 295.65 | 20.70 | 3.53 |
Table 6.
Number of backfill specimens subjected to unconfined compressive strength (UCS) testing (see Table 5 for mixture IDs).
Table 6.
Number of backfill specimens subjected to unconfined compressive strength (UCS) testing (see Table 5 for mixture IDs).
| Mixture ID | Curing Time (days) | ||
|---|---|---|---|
| 7 | 14 | 28 | |
| 4C0A (reference) | 3 | 3 | 3 |
| 6C0A (reference) | 3 | 3 | 3 |
| 8C0A (reference) | 3 | 3 | 3 |
| 4C3.5A | 3 | 3 | 3 |
| 6C3.5A Run 1 | 3 | 3 | 3 |
| 6C3.5A Run 2 | 3 | 3 | 3 |
| 8C3.5A | 3 | 3 | 3 |
| 4C7A | 3 | 3 | 3 |
| 6C7A | 3 | 3 | 3 |
| 8C7A | 3 | 3 | 3 |
Table 7.
Number of backfill specimens tested for fresh and dry density.
| Mixture ID | Fresh Density | Dry Density |
|---|---|---|
| 4C0A | 3 | 3 |
| 6C0A | 3 | 3 |
| 8C0A | 3 | 3 |
| 4C3.5A | 3 | 3 |
| 6C3.5A Run 1 | 3 | 3 |
| 6C3.5A Run 2 | 3 | 3 |
| 8C3.5A | 3 | 3 |
| 4C7A | 3 | 3 |
| 6C7A | 3 | 3 |
| 8C7A | 3 | 3 |
Table 8.
ANOVA results for UCS regression models of backfill specimens cured for 7, 14, and 28 days.
Table 8.
ANOVA results for UCS regression models of backfill specimens cured for 7, 14, and 28 days.
| Response (MPa) | Sum of Squares | Mean Square | F Ratio | p Value Prob (F) |
|---|---|---|---|---|
| UCS7 | 1.5621 | 0.3124 | 169.8329 | <0.0001 |
| UCS14 | 2.5442 | 0.5089 | 336.2072 | <0.0001 |
| UCS28 | 4.3139 | 0.8628 | 361.9386 | <0.0001 |
Table 9.
ANOVA results for UCS regression coefficients of backfill specimens cured for 7, 14, and 28 days.
Table 9.
ANOVA results for UCS regression coefficients of backfill specimens cured for 7, 14, and 28 days.
| Model | Coefficient of | Sum of Squares | F Ratio | p Value Prob (F) |
|---|---|---|---|---|
| 7 day | C | 1.4112 | 767.1440 | <0.0001 |
| A | 0.0280 | 15.2241 | 0.0007 | |
| AC | 0.0001 | 0.0725 | 0.7901 | |
| C2 | 0.0475 | 25.8250 | <0.0001 | |
| A2 | 0.0941 | 51.1618 | <0.0001 | |
| 14 day | C | 2.4054 | 1589.258 | <0.0001 |
| A | 0.0181 | 11.9259 | 0.0021 | |
| AC | 0.01541 | 10.1805 | 0.0039 | |
| C2 | 0.10525 | 69.5391 | <0.0001 | |
| A2 | 0.0046 | 3.0582 | 0.0931 | |
| 28 day | C | 4.0613 | 1703.702 | <0.0001 |
| A | 0.0613 | 25.6945 | <0.0001 | |
| AC | 0.0091 | 3.8070 | 0.0628 | |
| C2 | 0.1713 | 71.8562 | <0.0001 | |
| A2 | 0.0012 | 0.5036 | 0.4848 |
Table 10.
ANOVA results for fresh and dry density regression models of backfill specimens.
| Response | Sum of Squares | Mean Square | F Ratio | p Value Prob (F) |
|---|---|---|---|---|
| Fresh density (kg/m3) | 166,695.43 | 33,339.1 | 476.2614 | <0.0001 |
| Dry density (kg/m3) | 72,049.844 | 14,410.0 | 182.1047 | <0.0001 |
Table 11.
ANOVA results for fresh and dry density regression coefficients.
| Model | Coefficient of | Sum of Squares | F Ratio | p Value Prob (F) |
|---|---|---|---|---|
| Fresh density | C | 2.72 | 0.0389 | 0.8453 |
| A | 163,592.0 | 2336.97 | <0.0001 | |
| AC | 120.33 | 1.7190 | 0.2022 | |
| C2 | 195.57 | 2.7938 | 0.1076 | |
| A2 | 2470.32 | 35.289 | <0.0001 | |
| Dry density | C | 6346.89 | 80.208 | <0.0001 |
| A | 65,160.5 | 823.46 | <0.0001 | |
| AC | 114.083 | 1.4417 | 0.2416 | |
| C2 | 306.683 | 3.8757 | 0.0606 | |
| A2 | 190.321 | 2.4052 | 0.1340 |
Publisher’s Note: MDPI stays neutral with regard to jurisdictional claims in published maps and institutional affiliations. |
© 2021 by the authors. Licensee MDPI, Basel, Switzerland. This article is an open access article distributed under the terms and conditions of the Creative Commons Attribution (CC BY) license (http://creativecommons.org/licenses/by/4.0/).
Share and Cite
MDPI and ACS Style
Hefni, M.; Hassani, F. Effect of Air Entrainment on Cemented Mine Backfill Properties: Analysis Based on Response Surface Methodology. Minerals 2021, 11, 81. https://0-doi-org.brum.beds.ac.uk/10.3390/min11010081
AMA Style
Hefni M, Hassani F. Effect of Air Entrainment on Cemented Mine Backfill Properties: Analysis Based on Response Surface Methodology. Minerals. 2021; 11(1):81. https://0-doi-org.brum.beds.ac.uk/10.3390/min11010081
Chicago/Turabian StyleHefni, Mohammed, and Ferri Hassani. 2021. "Effect of Air Entrainment on Cemented Mine Backfill Properties: Analysis Based on Response Surface Methodology" Minerals 11, no. 1: 81. https://0-doi-org.brum.beds.ac.uk/10.3390/min11010081
Note that from the first issue of 2016, this journal uses article numbers instead of page numbers. See further details here.