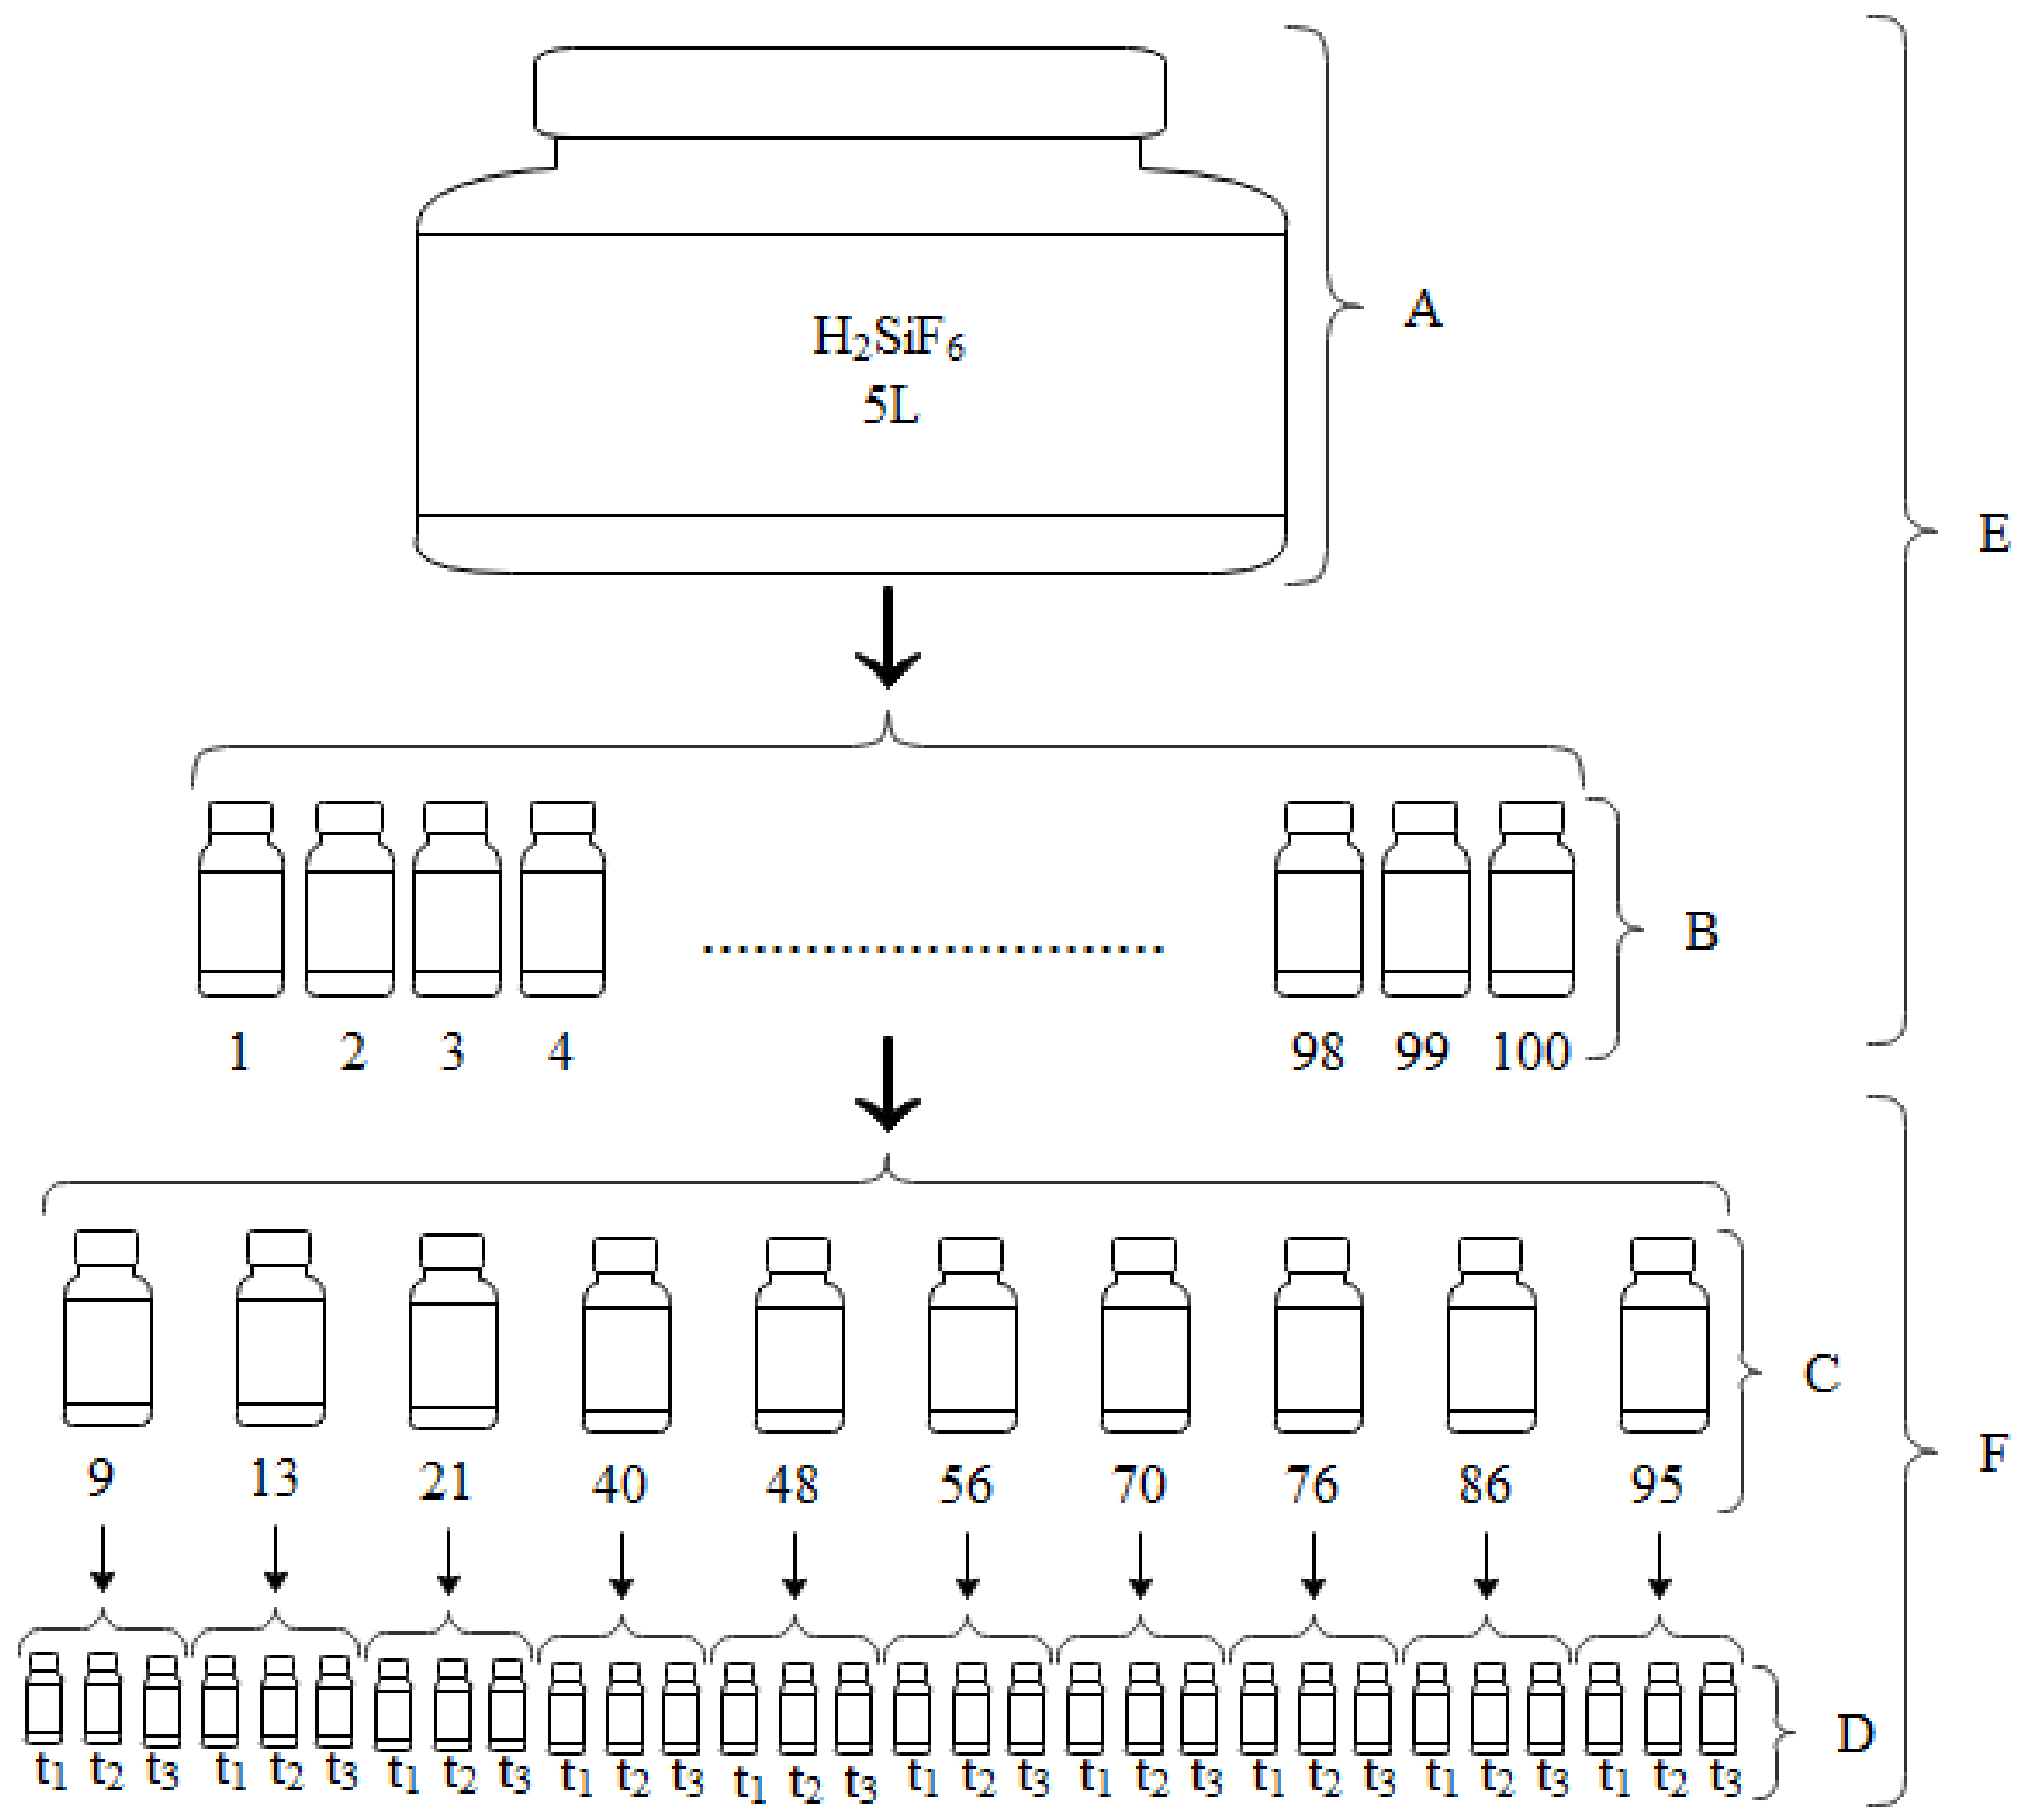
3.1. Homogeneity Assessment of CRM
Homogeneity assessment of the candidate material was performed by analyzing ten randomly selected samples on triplicate as shown in
Figure 2. The mean value for each sample was calculated. Thereafter, the data were initially assessed to determine the presence of outlier means by performing the Grubbs test with a 0.01 and 0.05 risk of error [
16,
17], and we verified that there were no outlying mean values (
Table 2).
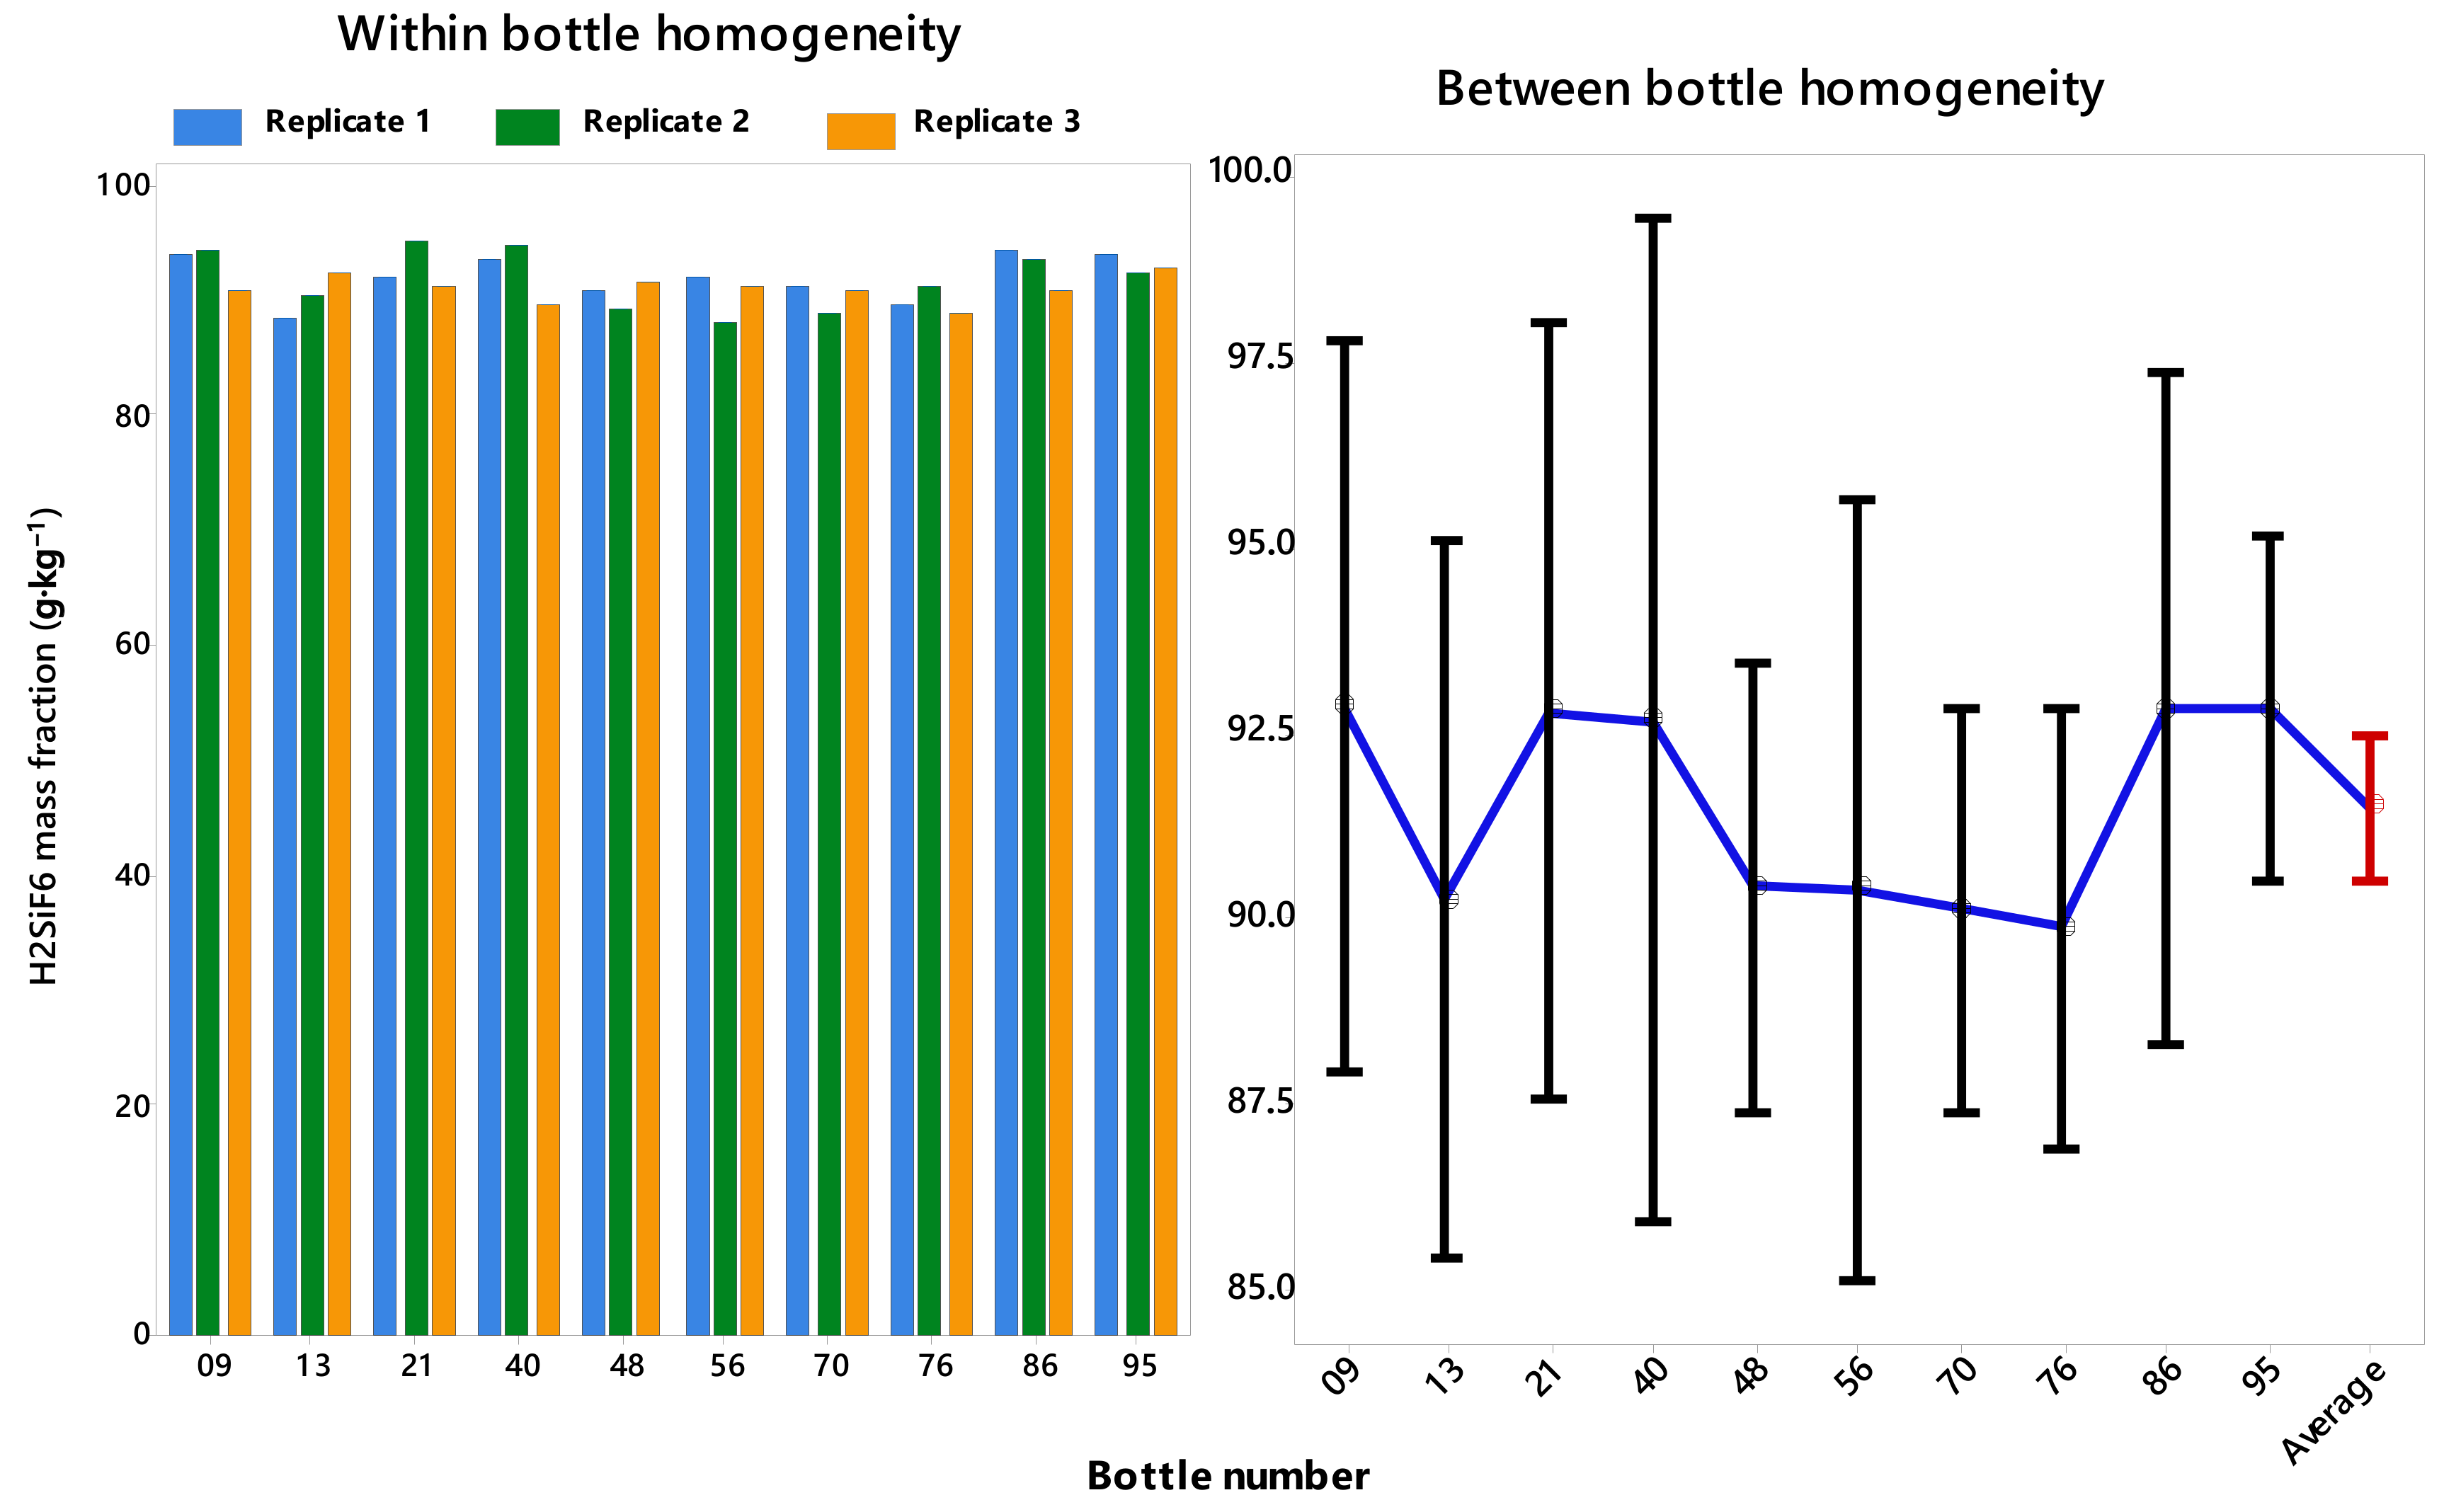
Figure 2 illustrates the within (wb) and between (bb) bottle homogeneity of the H
2SiF
6 mass fraction in the candidate certified reference material.
The within bottle homogeneity in the presented measurements series was determined for the 10 bottles (No. 09, 13, 21, 40, 48, 56, 70, 76, 86, 95). The blue, green, and orange bars in the diagram give the triplicate result for each sample.
The figure, which graphically shows the between bottle homogeneity, summarizes the average of the H2SiF6 mass fraction of aliquots taken from each sample together with the corresponding expanded uncertainty values, and the average value (red line) was determined as the average of the H2SiF6 mass fraction for all the analyzed units.
A first reading of the obtained graphs allows us to conclude that the individual results of the H2SiF6 mass fraction in the aliquots taken from the bottle are within the range given for the mean value of the analyzed package. The calculated intervals for the H2SiF6 mass fraction in the samples have a common part in the interval corresponding to the average value.
To statistically evaluate the homogeneity between different bottles and within the same bottle, a single-factor analysis of variance (ANOVA) at 95% confidence level [
9] was used. The results of this test are presented in
Table 3.
From the ANOVA analysis, it was observed that the F-calculated value was less than the F-critical value at 95% confidence level, demonstrating no significant difference between the between bottle (bb) and within bottle (wb) homogeneity criteria for the H2SiF6 mass fraction, which also indicates that the material was regarded to be sufficiently homogeneous.
It was also observed from the one-way ANOVA of the homogeneity testing results that the mean square between bottles (M
between) was higher than the mean square within bottles (M
within), which means that the method of measurement has good repeatability. In this case, the standard uncertainty associated with between bottle variance (u
bb) was calculated based on the ANOVA results by using Equations (3) and (4) (number of replicates n
0 = 3 and degrees of freedom of mean square within bottles v
Mwithin = 20) [
9]. However, the higher u
bb value (Equation (3)) was chosen for calculating the u
CRM [
18].
The relative standard uncertainty due to between bottle inhomogeneity (ubb) was 1.0% for the H2SiF6 mass fraction.
3.3. Confirmation of Metrological Traceability
Metrological traceability is defined as a property of a measurement result whereby the result can be related to a reference through a documented unbroken chain of calibrations, each contributing to the measurement uncertainty [
21]. The standards ISO/IEC 17025 and ISO 17034 require its demonstration [
22,
23].
The metrological traceability of the obtained results to the SI system was established by evaluating the measured variables included in the calculation according to the EURACHEM/CITAC Guide [
12].
The H
2SiF
6 mass fraction, expressed in g·kg
−1 and determined according to the Standard NF T90-007 [
10], is calculated using the following Equation (6):
where C is the concentration of SiO
2, in milligrams per liter, in the test sample solution; V
t is the volume of the test sample in milliliters (500 mL); V is the volume of dilution (100 mL);
v is the aliquot intake for dilution (5 mL); m is the mass of the sample in grams; and M
H2SiF6 and M
SiO2 are the molar masses of H
2SiF
6 and SiO
2, respectively.
With:
where A is the absorption of the silicon complex in the sample solution; B
1 is the slope of the calibration curve; and B
0 is the intercept of the calibration curve.
It is worth noting that there are seven important parameters influencing the result in Equation (6): the concentration of SiO2 in the test sample solution obtained from the calibration curve (C), the volume of the test sample (Vt), the volume of dilution (V), the volume of the aliquot (v), the mass of the sample (m), the molar mass of H2SiF6, and the molar mass of SiO2. In order to establish the traceability of the result, it is necessary to establish the traceability of these influence parameters.
The absorbance (A), the intercept (B
0), and the slope (B
1) associate the concentration (C) of SiO
2 in the sample solution by Equation (7) to the concentration of the calibration solutions, establishing traceability to the values of the calibration solutions. These calibration solutions were obtained by diluting the reference solution of (999.4 ± 3.4) mg·L
−1 of silicon (Si) in water. The concentration of the reference solution is traceable to a NIST SRM solution (NIST SRM No 3150) according to the manufacturer’s certificate. The dilution steps were carried out using volumetric glassware, whose manufacturer specifies the value of the volume and its tolerance. The calibration solutions were measured using a molecular absorption spectrophotometer at (650 ± 10) nm, then the absorption values and the concentration of the calibration solution were used to calculate the intercept (B
0) and slope (B
1) of the calibration curve by least square linear regression. Photometric accuracy of the spectrophotometer was determined by comparing the difference between the measured absorbance of the reference standard materials and the established standard value [
24]. Neutral density glass-filters F2-666, F3-666, and F4-666 certified by DKD (Germany) of various transmittance values at 440, 465, 546.1, 590, and 635 nm were used for this verification. The wavelength accuracy of the spectrophotometer was evaluated by measuring a known wavelength of a holmium oxide filter standard reference [
24], certified by DKD (Germany). The results of these two tests were satisfactory. These activities achieve traceability for the concentration of SiO
2 (C), which has the largest contribution to the overall uncertainty.
The various volumetric instruments used are class A. Because glassware can deform slightly over time and the glassware calibration is a dominant uncertainty source, the volume of the flask is checked regularly by weighing the given volume of water according to the laboratory glassware standard NF EN ISO 4787 [
13]. The uncertainty of the glass expansion is taken into account in the uncertainty calculation.
The mass (m) needs to be traceable to measurement standards with sufficiently small uncertainty. This is provided regularly by normal calibration procedures for the balance with standard weights of class E2 traceable to the SI system by DKD (Germany). The associated calibration certificate is issued after each calibration. The linearity of the balance is checked regularly with internal standard weights.
The molecular weights of H
2SiF
6 and SiO
2 were calculated from the IUPAC atomic weights of the elements [
25].
To strengthen this metrological traceability, the obtained results with the reference method [
10] were compared to a second method of analysis by AAS. The obtained results are summarized in
Table 5.
Statistical evaluation of the difference between the analytical results obtained from both methods by an F-test to ensure that the variances from each method are statistically similar (F < F
crit 5%) and a Student’s
t-Test for Equal Means from two samples (t < t
crit 5%) [
26] demonstrated that the differences were not significant. Therefore, the mass fractions determined using both protocols with very different principles were in good agreement. In addition, the relative deviation between the two methods is low compared to the uncertainty of the certified value (
Section 3.5), which confirms the traceability of the certified value.
3.4. Accuracy of the Analytical Method Used for the Characterization
Accuracy study is the most important validation criteria and it is an indicator of the utility and applicability of a method with real samples [
27]. It is also known that the result can be biased. Different components contribute to the persistent bias, such as laboratory bias, method bias, and the matrix-variation effect [
27].
Since there are no certified fluosilicic acid solutions available commercially, and no laboratories willing to analyze these solutions independently could be found, method accuracy was therefore problematic. An indication of method trueness can be obtained by comparing the reference method with a second method [
27], as reported in
Section 3.3 (
Table 5). The obtained results from the two methods are in good agreement. Another additional way to evaluate the accuracy of the analytical method used for the characterization of the CRM was by analyzing a pure fluosilicic acid at 34% (
w/
w), with a purity of 33.5% to 35%, by molecular absorbance spectrophotometry [
10], even if its concentration is not certified.
The value of pure fluosilicic acid was therefore in the range of 335 to 350 g·kg
−1, while the mean of the measured values under intermediate precision conditions [
28] was 339 g·kg
−1 (s = 2.01 g·kg
−1), and it was in the range of the uncertainty of the assumed value. Therefore, no significant difference was observed between the measured and assumed values.
3.5. Assignment of Certified H2SiF6 Mass Fraction Value and Its Uncertainty
The certified value of the H
2SiF
6 mass fraction in industrial CRM fluosilicic acid is the mean of the analytical results obtained by molecular spectrophotometry [
10] of the ten randomly selected samples analyzed on triplicate. The calculated value was found to be 91.5 g·kg
−1.
According to the ISO Guide 35 [
9], the combined standard uncertainty for the certified H
2SiF
6 mass fraction (u
CRM) can be obtained following Equation (2) by combining u
char (the standard uncertainty due to characterization), u
hom (the standard uncertainty due to inhomogeneity), and u
lts and u
sts (the standard uncertainties due to long-term and short-term stabilities, respectively).
Table 6 summarizes the contribution of each factor to the overall combined uncertainty for the certified value.
To estimate standard uncertainty due to the characterization of the H
2SiF
6 mass fraction (u
char), the uncertainties from each component in Equation (6) were combined according to the ISO Guide 98-3 (law of propagation of uncertainties approach) [
14] using the following Equation (8).
The uncertainty components for analyzing the H
2SiF
6 mass fraction are presented as a cause-and-effect diagram in
Figure 5.
The concentration of SiO
2 (C in mg·L
−1) is calculated using a calibration curve. The linear least squares fitting procedure used assumes that the uncertainties of the values of the x-axis are considerably smaller than the uncertainty of the values of the y-axis [
15]. Consequently, the usual uncertainty calculation procedures for C only reflect the uncertainty due to random variation in the absorbance and not the uncertainty of the calibration standards, nor the inevitable correlations induced by successive dilution from the same stock solution [
15]; however, the uncertainty of the calibration standards is sufficiently small to be neglected. Thus, the estimated standard uncertainty of C is 0.044 mg·L
−1 with an average of 0.763 mg·L
−1. The uncertainty associated with the mass of the sample is estimated, using the data from the calibration certificate and the manufacturer’s recommendations on uncertainty estimation, as being U = (0.75 + 0.0034 × m) in mg (coverage factor k = 2). This contribution has to be counted twice, once for the tare and once for the gross weight. This gives for the standard uncertainty of the masse (u(m)) a value of 0.00143 g.
The volumetric instruments used are influenced by three major sources of uncertainty: the uncertainty due to the calibrated internal volume of the instrument, the uncertainty due to the glass and solution temperatures differing from the temperature at which the volume was calibrated, and the uncertainty due to the variation in filling the instrument to the mark. The three contributions are combined to give the standard uncertainty of the volume. The typical uncertainties of the 500 mL flask, the 100 mL flask, and the 5 mL pipette are 0.33 mL, 0.07 mL, and 0.01 mL, respectively.
The standard uncertainties of the molar masses of H
2SiF
6 and SiO
2 have been calculated by combining the uncertainty of the atomic weights of their constituent elements published in the current IUPAC table [
25]. The estimated standard uncertainties are 0.0006 g·mol
−1 for the molar mass of H
2SiF
6 and 0.0007 g·mol
−1 for the molar mass of SiO
2.
By combining the uncertainties for each component as follows in Equation (8), the standard uncertainty of the analytical method (uchar) has been estimated at 5.32 g·kg−1.
The combined standard uncertainty of the certified value (u
MRC) was based on the combination of u
char, u
hom (
Section 3.1), u
lts (
Section 3.2.1), and u
sts (
Section 3.2.2), as follows in Equation (2), and was calculated to be 5.84 g·kg
−1. As observed, the major contribution to the overall combined uncertainty (
Table 6) came from the uncertainty of method characterization (u
char), while the contribution from the uncertainty of long-term stability (u
lts) was less significant.
The expanded uncertainty (UMRC) was calculated to be 11.7 g·kg−1 by multiplying the combined standard uncertainty (uMRC) by the coverage factor k (k = 2).


