
Influence of Temperature on Rising Bubble Dynamics in Water and n-pentanol Solutions


Jerzy Haber Institute of Catalysis and Surface Chemistry, Polish Academy of Sciences, ul. Niezapominajek 8, 30-239 Krakow, Poland
*
Author to whom correspondence should be addressed.
Minerals 2021, 11(10), 1067; https://0-doi-org.brum.beds.ac.uk/10.3390/min11101067
Submission received: 18 August 2021
/
Revised: 10 September 2021
/
Accepted: 27 September 2021
/
Published: 29 September 2021
(This article belongs to the Special Issue Interactions between Bubbles and Solid Particles during the Flotation Process)
Abstract
:Data in the literature on the influence of water temperature on the terminal velocity of a single rising bubble are highly contradictory. Different variations in bubble velocity with temperature are reported even for potentially pure systems. This paper presents a systematic study on the influence of temperature between 5 °C and 45 °C on the motion of a single bubble of practically constant size (equivalent radius 0.74 ± 0.01 mm) rising in a clean water and n-pentanol solution of different concentrations. The bubble velocity was measured by a camera, an ultrasonic sensor reproduced in numerical simulations. Results obtained by image analysis (camera) were compared to the data measured by an ultrasonic sensor to reveal the similar scientific potential of the latter. It is shown that temperature has a significant effect on the velocity of the rising bubble. In pure liquid, this effect is caused only by modifying the physicochemical properties of the water phase, not by changing the hydrodynamic boundary conditions at the bubble surface. In the case of the solutions with surface-active substances, the temperature-change kinetics of the dynamic adsorption layer formation facilitate the immobilization of the liquid/gas interface.
1. Introduction
The hydrodynamics of a single bubble are a crucial matter for such engineering and environmental applications as froth flotation, foam fractionation, waste treatment, oil recovery, pulp and paper, distillation, the aeration of water reservoirs and pipe flow (cavitation) [1,2,3,4]. Moreover, bubble motion is important for the design of bubble columns and reactors, where the motion is strictly correlated to mass transfer rates [5]. Furthermore, the description of bubble motion in solutions of surface-active substances (SAS) is used to determine the evolution and development of the dynamic adsorption layer (DAL) [6], the properties of which are essential for predicting real foam stability [7].
The current state of the subject in the literature consists of a vast number of reports showing the impact of bubble size and shape [8,9], surface tension [10], density, viscosity in both phases [11,12,13] and the type of surfactant [14,15,16,17] on single-bubble motion characteristics. Surprisingly, reports on the influence of temperature on the velocity of rising bubbles, even in pure liquids, are quite scarce, despite the fact that this effect has significance for engineering and industrial applications. Moreover, they show considerable contradictory data and trends. Leifer [18] showed that for clean bubbles in water at different temperatures an increase from 0 to 40 °C caused a decrease in the rising velocity, the magnitude of which was influenced by the bubble diameter. Okawa et al. [19] considered the temperature effect on single bubble rise characteristic in distilled water, but this work was focused mostly on a comparison between the influence of the temperature on bubble path oscillations and the method of bubble formation. Only two temperature values, low (15 °C) and high (90 °C) were studied, and in the majority of cases the terminal velocities differed significantly from the theoretical predictions, assuming slip boundary conditions at the liquid/gas interface. Zhang et al. [20] determined the bubble rise velocity profiles in tap water and solutions of Triton X-100 surfactants in the temperature range 6–40 °C and found that, with an increasing temperature, the bubble maximum and terminal velocity also increased. Moreover, they showed that the bubble terminal velocity was reached faster when the temperature was higher. The bubble characteristics in a bubble column between 30 and 60 °C was studied by Issaoui and Ben Mansour [21]. They found that an increase in liquid temperature caused only a slight increase in the bubble rise velocity. Liu et al. [22] reported no temperature influence on the terminal velocity in distilled water for 0–100 °C for bubble of 3.3–6.1 mm.
As can be seen, the literature is full of conflicting information. The most probable reason is a surface purity issue and the rising bubble’s great sensitivity to presence of even traces of surface-active contaminants, which was recently analyzed in a high-quality study by Pawliszak et al. [23]. It seems that, except for the work by Zhang et al. [20], who were perfectly aware of the properties of the system they studied, the experiments were conducted in undefined systems (i.e., contaminated liquids), where velocity was randomly influenced by uncontrolled concentrations of surface-active impurities. In this paper, special care was taken to reduce the number of parameters influencing bubble hydrodynamics (i.e., a constant bubble radius was used). In addition, we were sure that, according to the conclusions given in Pawliszak et al. [23], we were working in a bubble size range where the liquid/gas interface was fully mobile in distilled water. In addition, to check the temperature influence on the kinetics of the dynamic adsorption layer formation at the rising bubble surface, the experiments were also carried out in several chosen concentrations of n-pentanol. The research was conducted using two techniques (visual observations and ultrasonic sensor readings) to increase the certainty of the results and to check the reliability and usefulness of the ultrasonic sensor for determining bubble velocity profiles. The ultrasonic technique, based on the well-known Doppler effect, is not new in fluid dynamics [24]; however, the literature is limited to reports on the determination of bubble velocities in columns [25,26] or tubes (Taylor bubbles) [27,28]. To the best of our knowledge, the use of ultrasound has never been reported for the monitoring of a single bubble rise velocity to determine the kinetics of the formation of the dynamic adsorption layer at the liquid/gas interface.
2. Materials and Methods
2.1. Materials
Commercially available n-pentanol (>99%), a non-ionic surfactant, was purchased from Merck. All solutions in experiments were prepared in ultrapure water (Direct-Q3 UV Water Purification System by Millipore, Burlington, MA, USA, conductivity <0.7 μS/cm). The values of surface tension, density and dynamic viscosity at studied temperatures were taken from the engineering tables [29]. Details on the temperature-dependent physical properties of the water were taken from [29] and are given in Table 1.
2.2. Methods
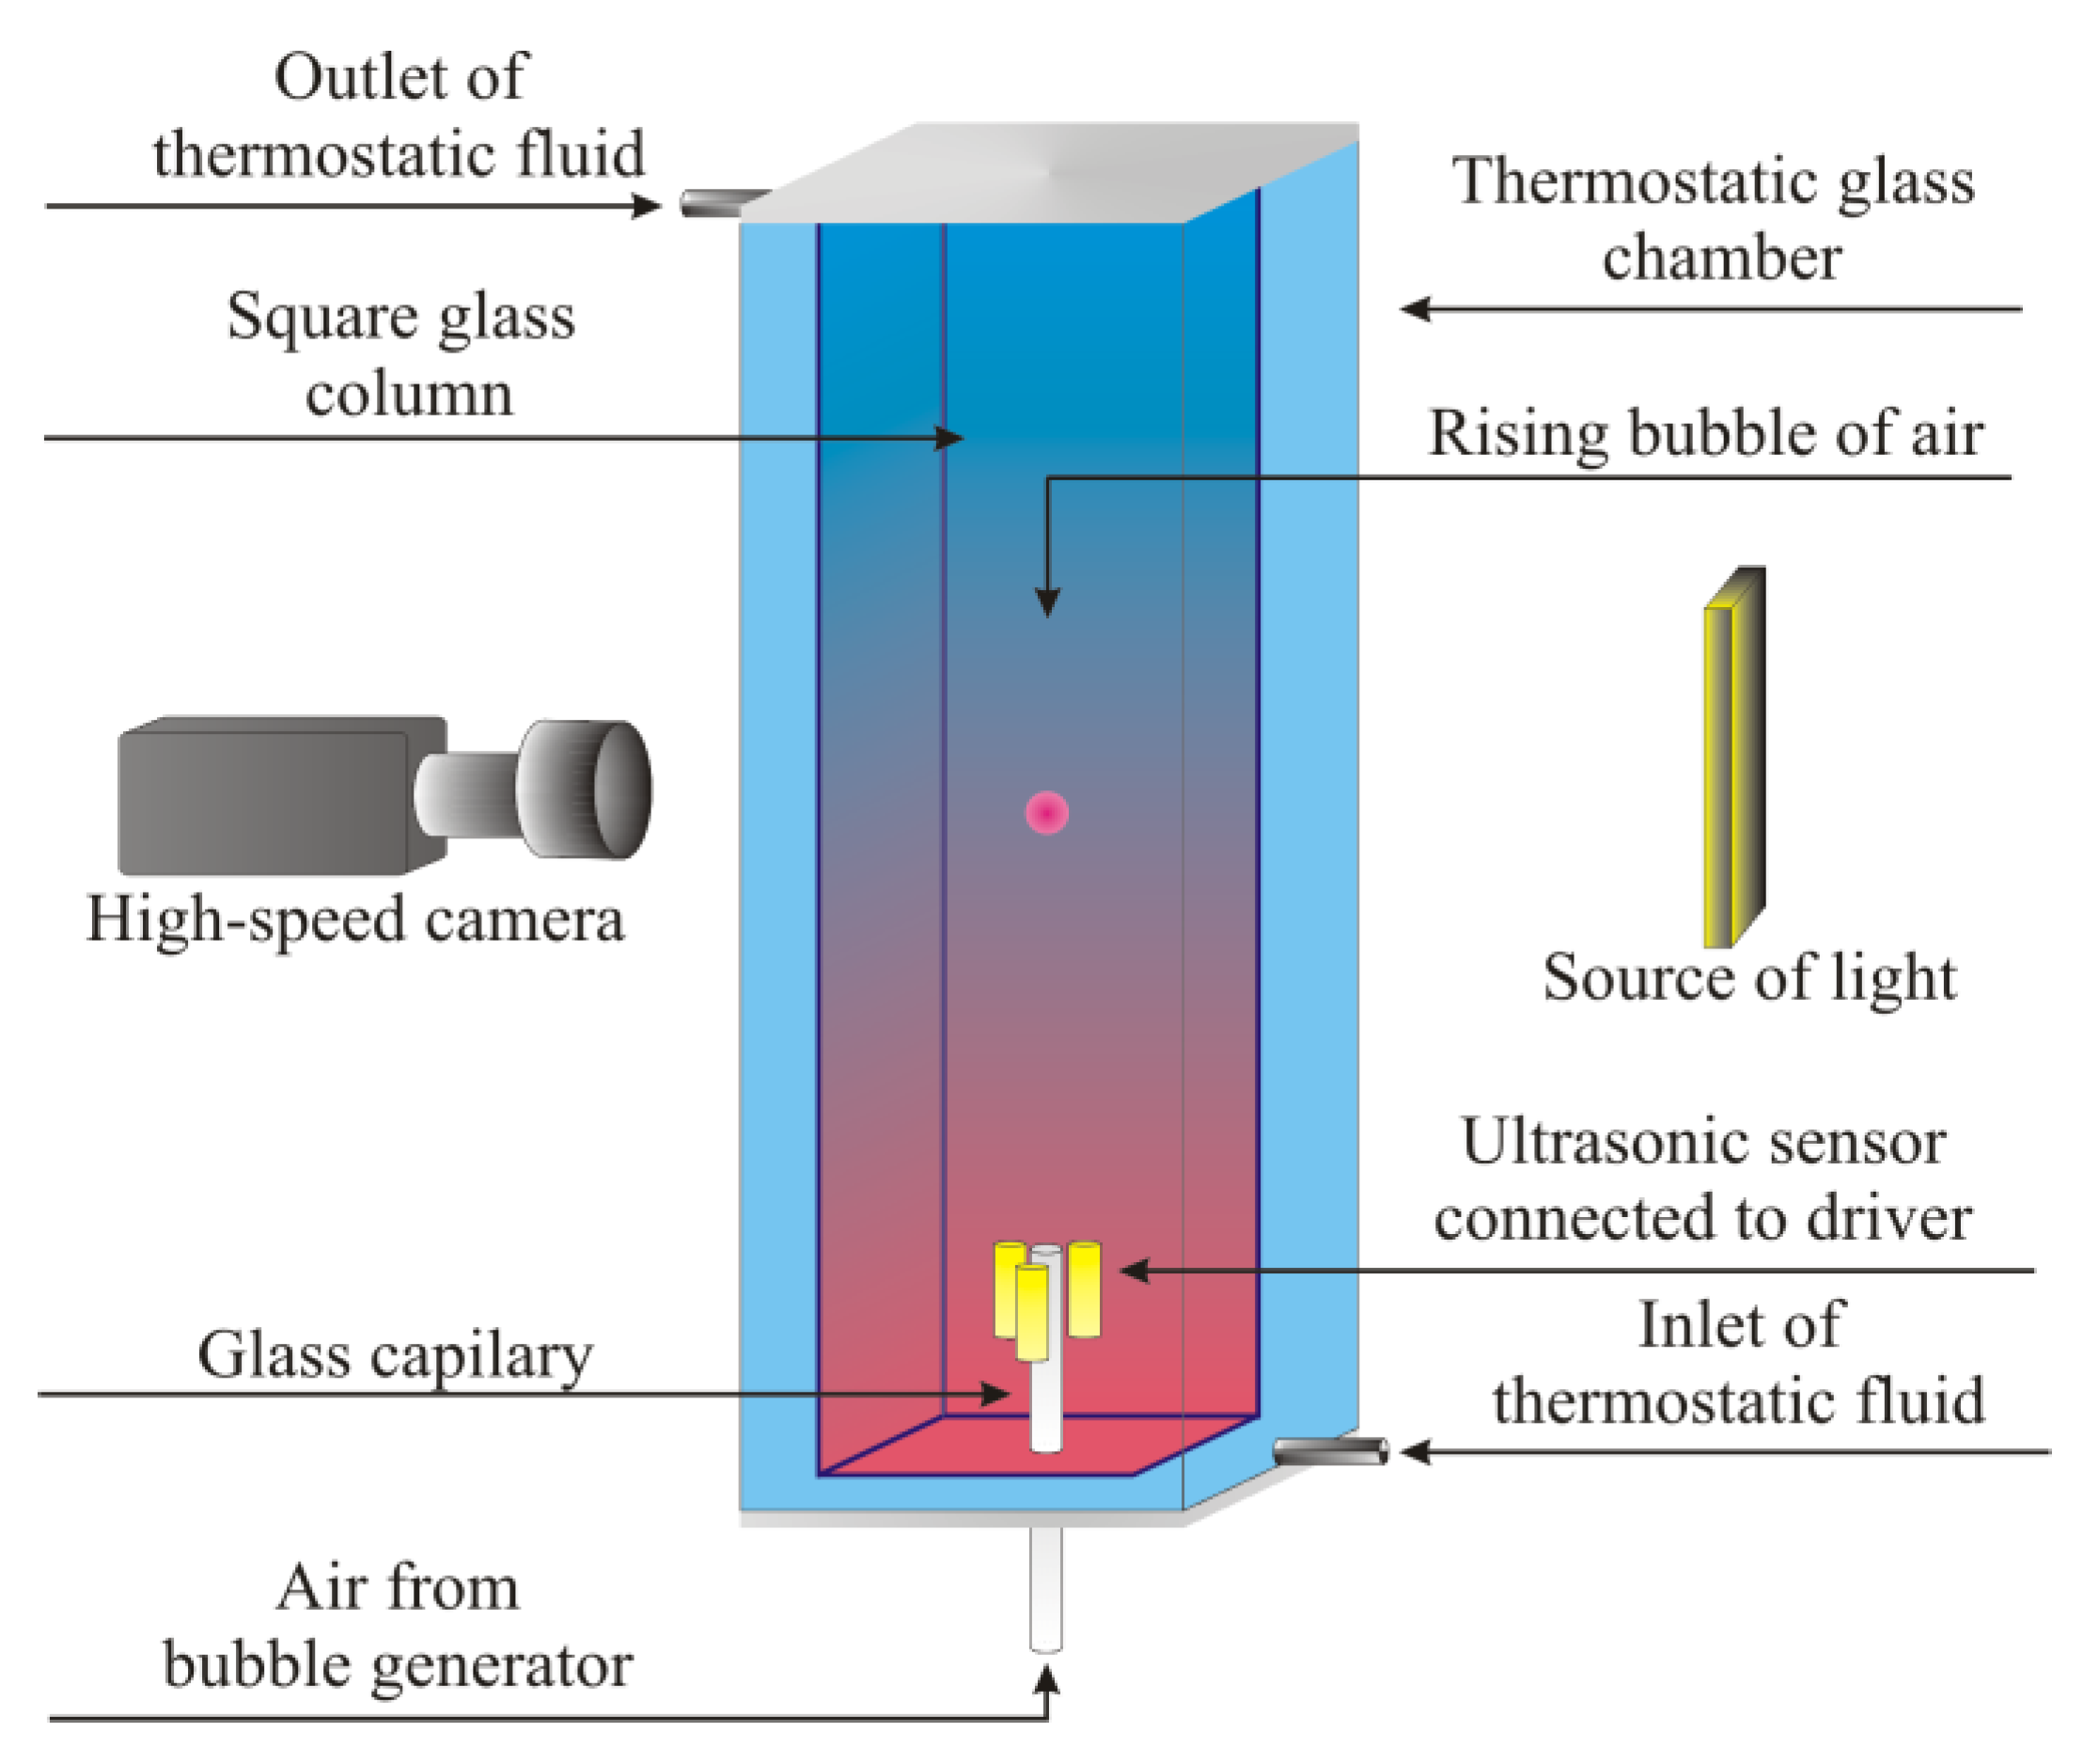
Variations in the local velocities of a single bubble rising in an aqueous phase of different physicochemical properties (tuned by a temperature modification), according to the values given in Table 1) were determined using digital camera observations coupled with image analysis and ultrasonic sensor data. The set-ups used for both experimental approaches are schematically illustrated in Figure 1, and, in both cases, the main parts were identical: a square glass column (40 mm × 40 mm × 400 mm) with a thick-walled glass capillary (inner diameter dc = 0.0753 mm) sealed at the bottom and an automatic bubble generator (Bubble-on-Demand [28]) to form a single bubble with control over its detachment frequency (adjusted to 60 s). Moreover, in both experimental approaches, the column with the tested liquid was placed and sealed inside the larger, outer square glass column (60 mm × 60 mm × 400 mm) to maintain the liquid’s temperature in the inner column at the desired level. Before each experimental series, the temperature was adjusted using a circulating water bath (Thermo Scientific SC100-A10, Waltham, MA, USA), and this process was controlled by an electronic thermometer immersed in the inner column liquid.
It has to be added here that, for experiments in pure water, only the period of rectilinear bubble motion was analyzed. It was observed during the experiments that, after a given distance, the bubble path deviated from a straight line. Moreover, the distance at which this deviation was noticed was generally shorter for higher water temperature. This distance, however, was much larger than needed for the bubble to reach terminal velocity, but an analysis of a temperature-dependent bubble path was beyond the of scope of this paper. For n-pentanol, establishment of terminal velocity strictly depended on the kinetics of the dynamic adsorption layer (DAL) formation. For this particular reason, longer distances covered by the bubble were analyzed, and for a particular pentanol solution concentration, the terminal velocity was calculated from the period where the bubble’s oscillatory motion was observed.
2.2.1. Velocity Determination by Camera and Image Analysis
Details on the experimental protocol and image analysis algorithms used for bubble velocities determination by visual observations can be found elsewhere [10,30,31]. Briefly, in this method, the local bubble velocity could be calculated from analyzing the bubble photos recorded by a CCD camera at equal time intervals. In our case, bubble motion was recorded by the SpeedCam MacroVis (Ettlingen, Germany) at 100 fps. The frame-by-frame analysis of the collected movies was automatized by an in-house-written Python script (using OpenCV 3.4.13 and PIL 7.2.0 modules). The values of a local rising bubble velocity were calculated as:
where , while and are the vertical and horizontal coordinates of a subsequent position of the rising bubble geometrical center within a time interval that matched the camera frequency. For experiments in pure water, the significance of the vertical coordinates’ constituents was negligible. Furthermore, with pictures of the rising bubble, the so-called equivalent bubble diameter (deq) and ratio of the bubble deformation (χ) were calculated as:
where and are the bubble’s vertical and horizontal diameters, respectively. These parameters were used further to analyze the hydrodynamics of the rising bubble under different temperature conditions.
2.2.2. Velocity Determination by Ultrasound
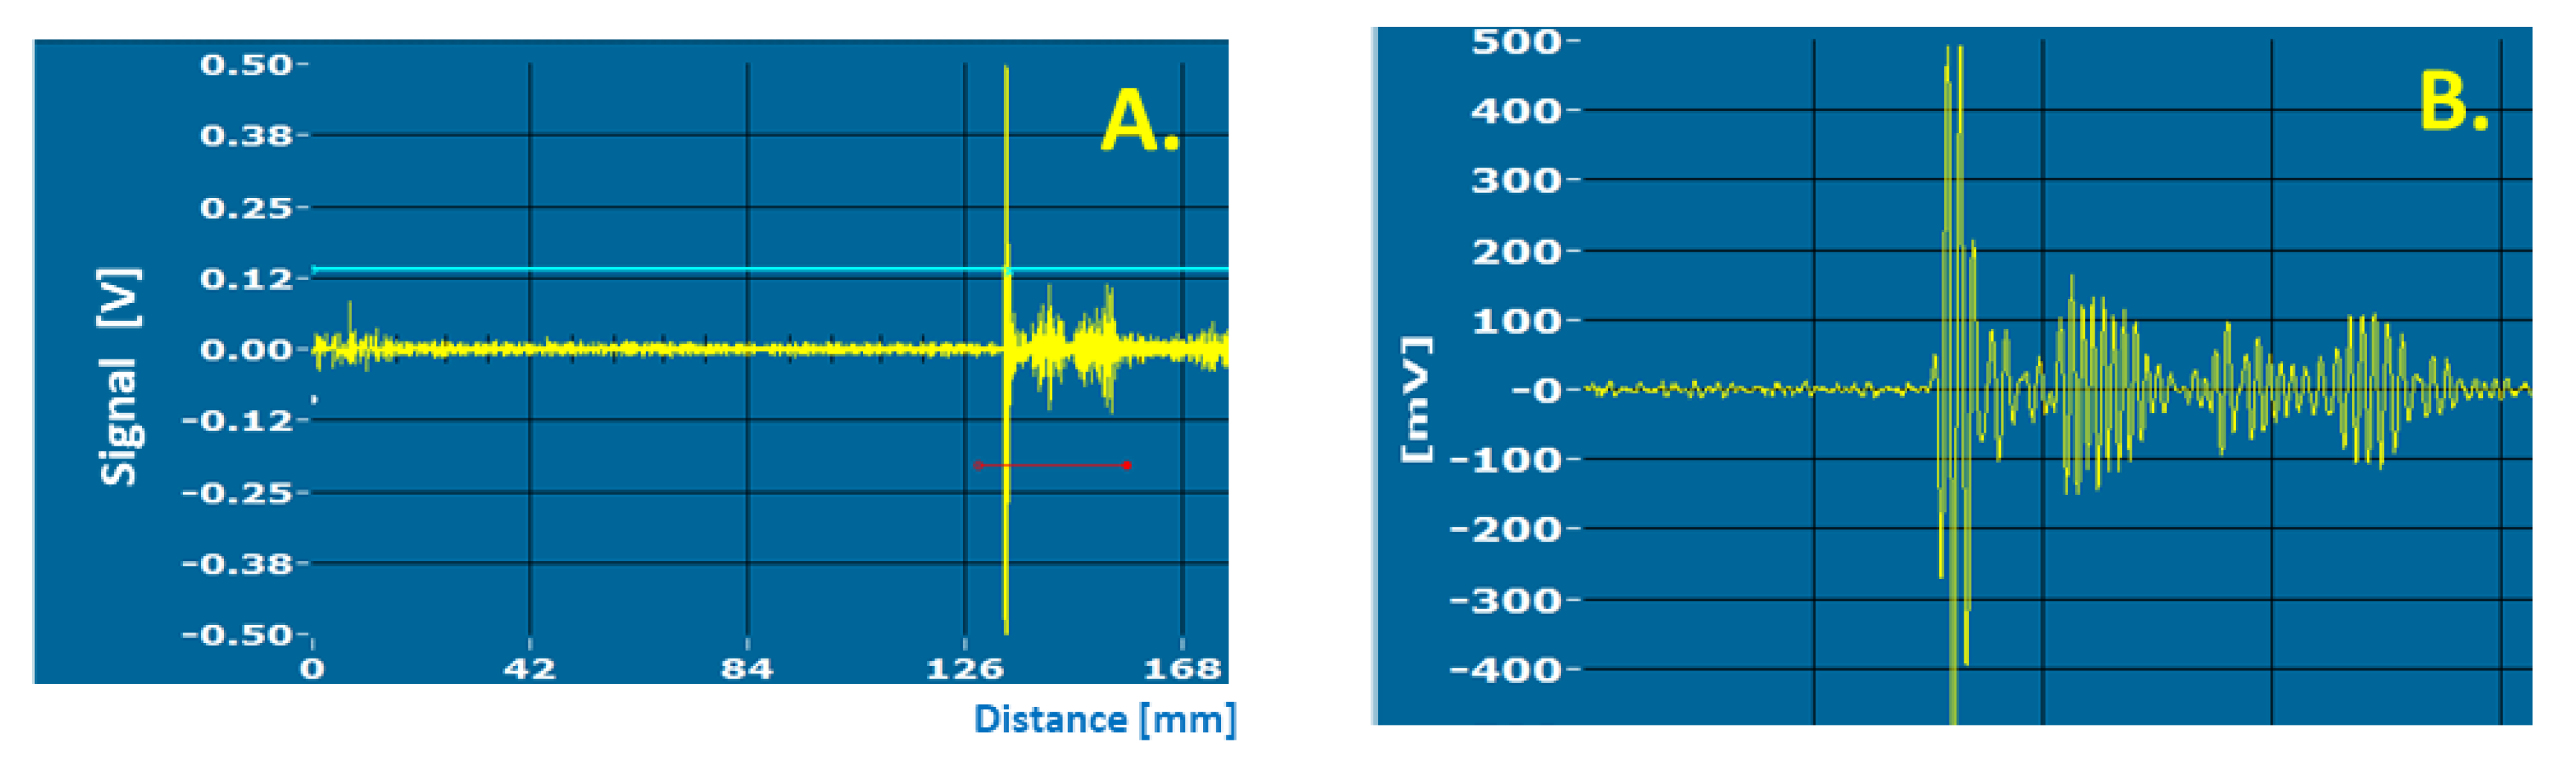
In this approach the ultrasonic sensor mounted on the bottom of the liquid column, transmitted and received at 5 MHz. The bubble rising velocity was determined analyzing the variations in the temporal evolution of a position of the registered signal formed as a result of ultrasonic waves reflected from the rising bubble surface. An example of the signal as a function of distance of the bubble from the capillary is presented in Figure 2. The parameters of the sensor and the time dependent signal position were controlled and recorded by the driver (OPBOX 2.0 mini ultrasonic box), and the software was elaborated by PBP OPTEL (Wrocław, Poland) [32]. The bubble position of the maximum signal value was acquired in constant time intervals of 87.8 ms. The values of the local bubble velocities were calculated by differentiating the temporal evolution of the signal position. For each of the selected temperatures (see Table 1), the velocity as a function of time was measured independently for 10 subsequent single bubbles. It is worth highlighting that, for an accurate determination of the signal temporal evolution, the information about the speed of sound in the liquid phase was necessary. Its values, presented in Table 2, were temperature d-pendent and taken directly from the engineering tables [29].
2.2.3. Numerical Calculations
Modelling of rectilinear bubble motion in liquid of properties of water under different temperature conditions (according to Table 1) was performed using spatial discretization and numerical scheme implemented in a Gerris Flow Solver (release on 6 December 2013), which is described in detail elsewhere [33,34,35].
The numerical algorithms of Gerris were used to solve the governing equations describing the conservation of momentum and mass of an incompressible liquid in the form:
where Q is a strain rate tensor; u is the fluid velocity vector; ρ is the fluid density and μ is its viscosity; p is pressure; t is time; σ is surface tension; δs is a Dirac distribution function (expressing the fact that the surface tension term was concentrated at the interface); κ and n are the curvature and normal unit vector to the interface, respectively [33]. The liquid column of height H = 150 mm and radius L, containing a gas bubble of radius Rb = 0.745 mm, was described by an axisymmetrical cylindrical coordinate system. The chosen value of L was directly related to the numerical (adaptive) grid size, as discussed by Popinet [33] and Zawala [36], and was adjusted for results convergence. It was found that, to obtain the converged data, the L had to be at least 10 mm, which corresponded to the minimum size of the numerical grid cell equal to 4.9 µm. This was consistent with the results of similar calculations presented by Zawala [36]. Initially, at t = 0, the center of the motionless spherical bubble was set 3 mm above the bottom of the liquid column at the symmetry axis (x = 0). After acceleration, constant speed (terminal velocity) of the bubble was established after t = 0.10 s. The bubble motion parameters were calculated for the time period t = 0.14–0.16 s. The liquid density, viscosity and surface tension were taken from Table 1 to mimic the bubble rise in the aqueous phase of different temperatures.
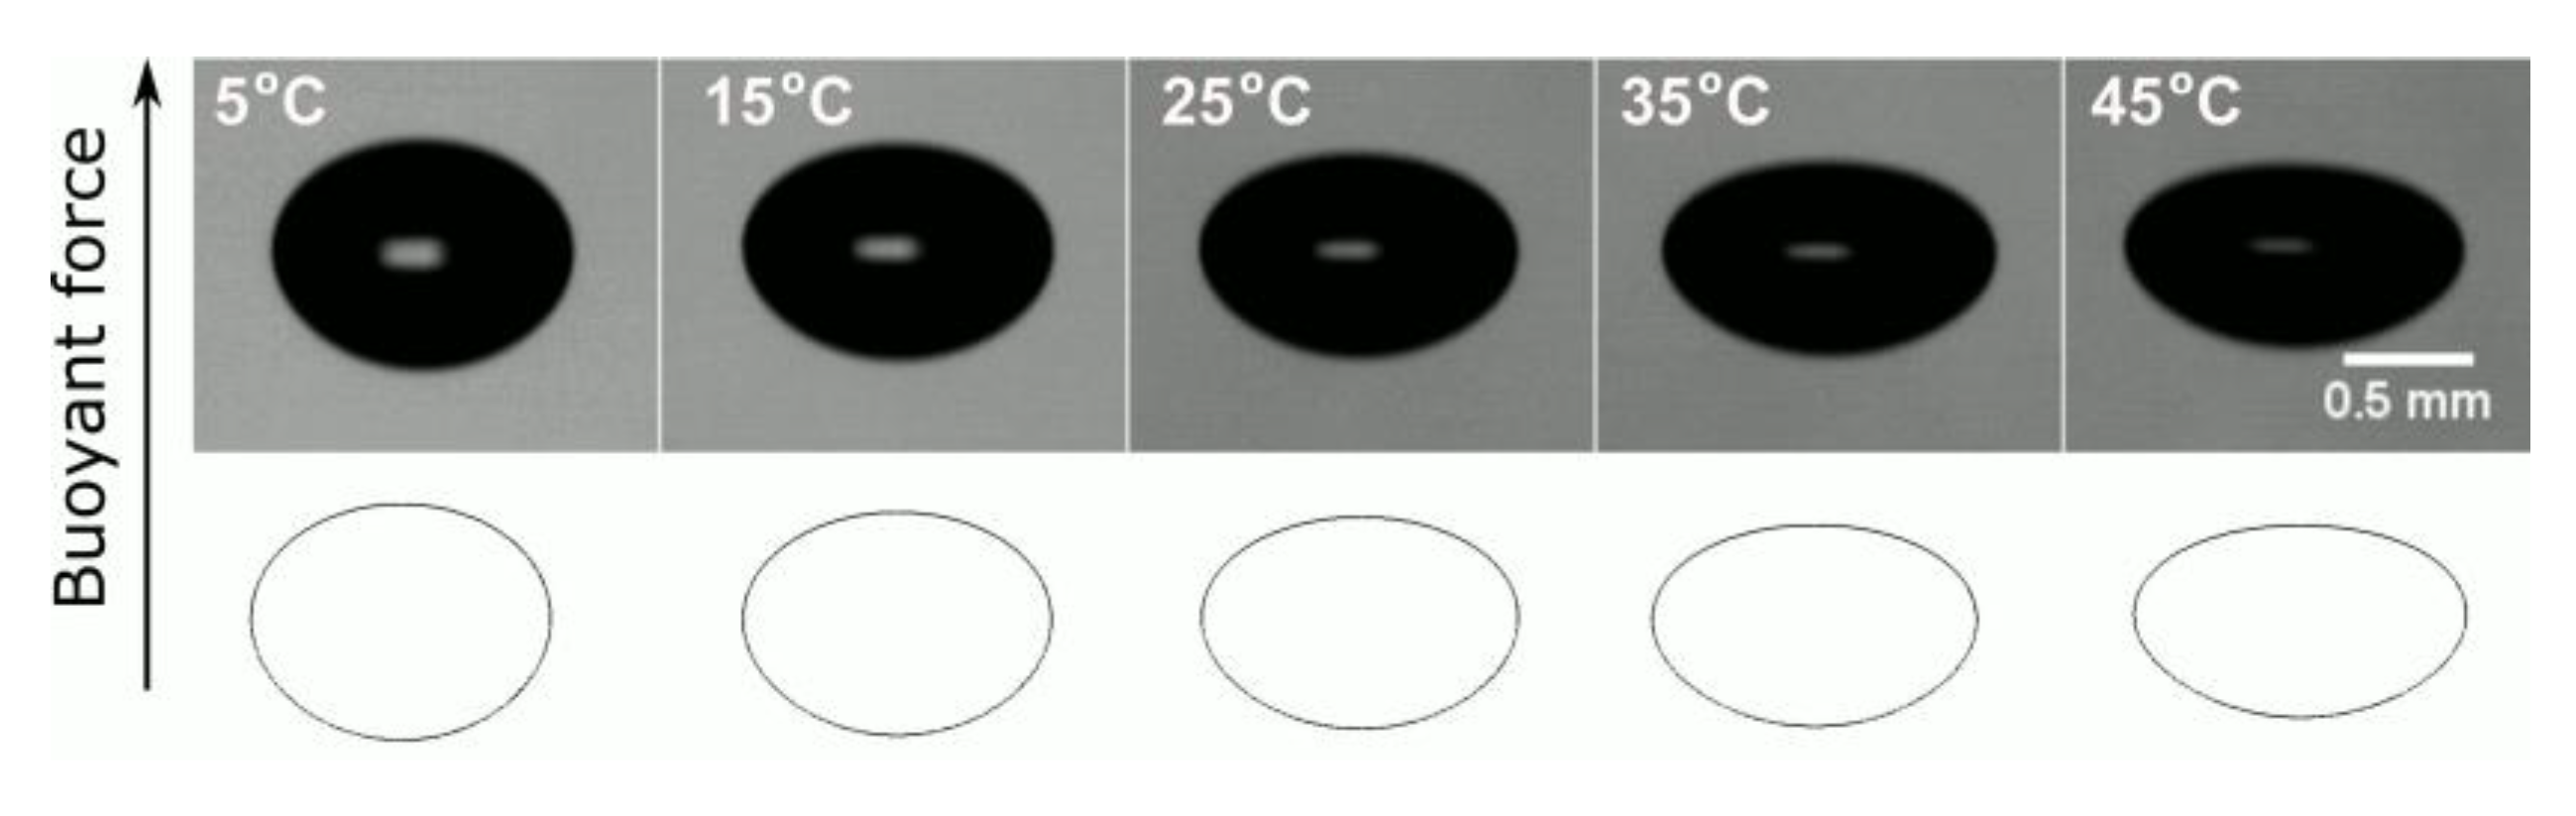
A comparison between experimentally obtained photos of the rising bubble under steady-state conditions and the corresponding numerically reproduced bubble outlines is presented in Figure 3. A very good qualitative agreement between these sets of data was found. The quantitative analysis of the data is presented further in the paper.
3. Results
3.1. Bubble Rising in Pure Water
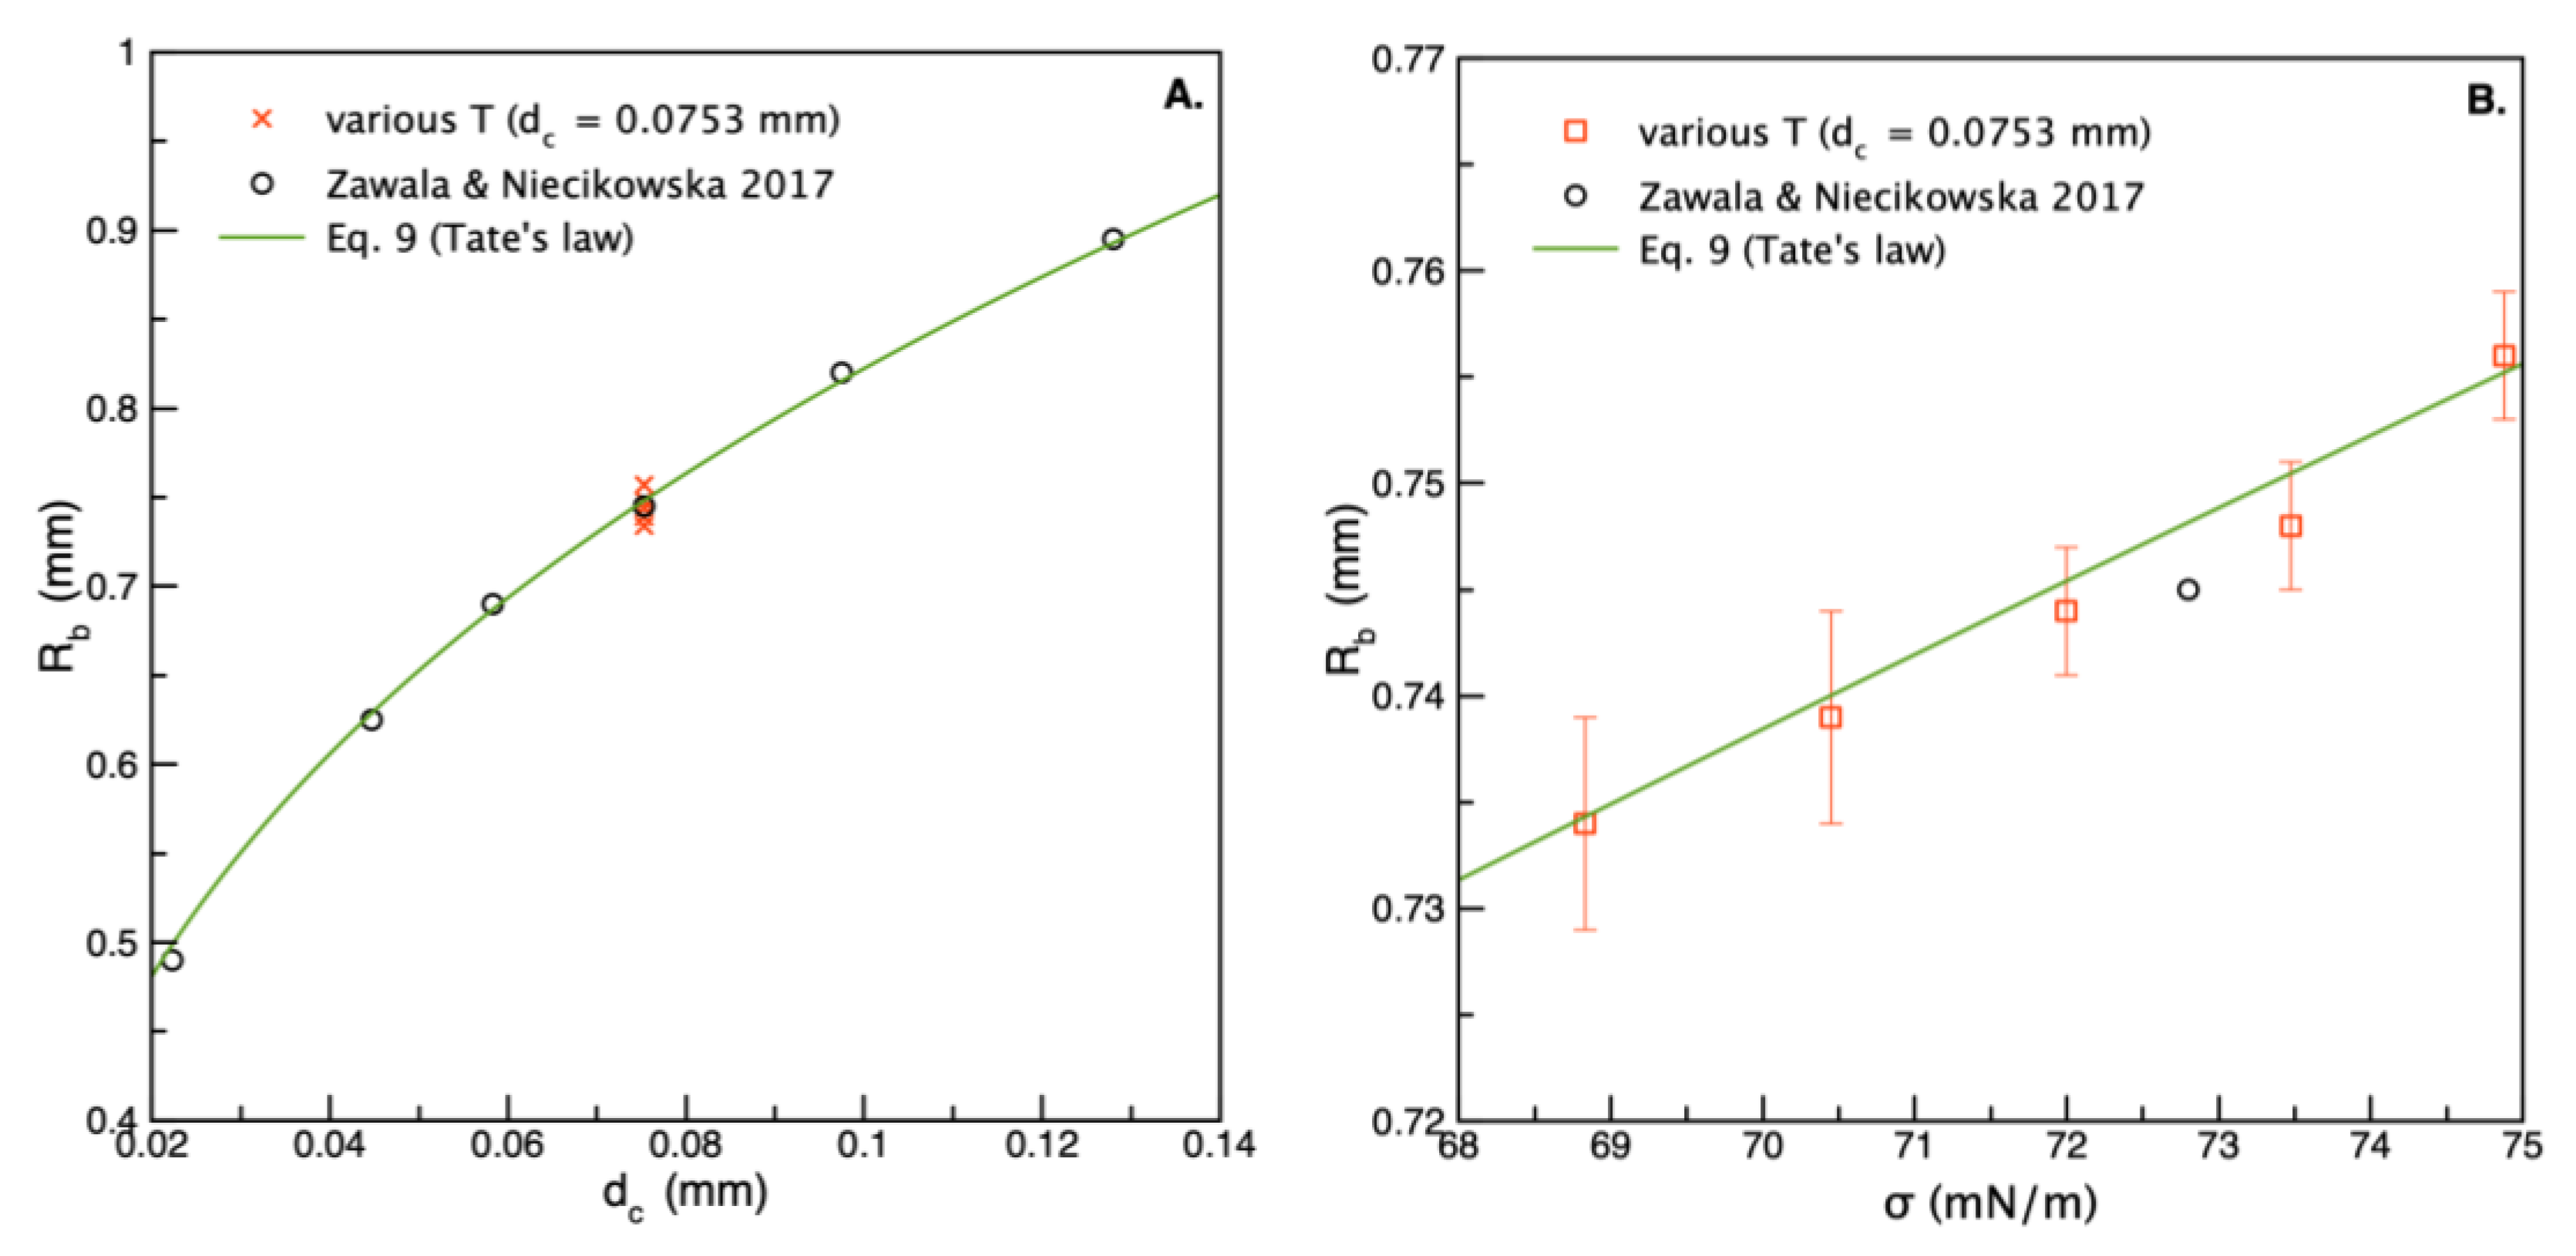
Values of the bubble radius (), calculated from the camera registered rising bubble photos are presented in Figure 4 (dc = 0.0753 mm). In addition, the values reported by Zawala and Niecikowska [30] acquired for bubbles formed at capillaries of various dc but a constant temperature T = 21 ± 1 °C were given for comparison. The solid line represents the theoretical size of the bubble detaching from the capillary, which can be calculated by balancing the buoyant (detaching) force:
and capillary (attachment) force:
where is the bubble volume; is the density difference between the liquid () and gas () phases; is the surface tension; is the contact angle (equal to 0 for a clean glass capillary surface); g is the gravitational constant. At the moment of bubble detachment, Fb equaled Fc, and this relation could be rearranged to give an equation known as Tate’s law [20,37]:
As seen in Figure 4A, a very good agreement between the experimental data and theoretical predictions of Equation (9) for water at T = 21 ± 1 °C was obtained [30]. The Rb values measured in water of different T were also consistent with the predictions; nevertheless, slight deviations from the theoretical line could be observed, caused by variations in the water physicochemical parameters, especially surface tension values. Figure 4B presents a comparison of the Rb as a function of water surface tension (Table 1), and a quite good match between experimental and theoretical values was found. This proved that the bubble was generated (by the elaborated BoD generator [30]) under conditions that allowed the establishment of an equilibrium between and , so the bubble Rb could also be considered at equilibrium. It was seen that a decrease in the value caused by the water temperature increased from 5 °C to 45 °C, resulting in only a slight variation in the Rb (from 0.757 ± 0.005 to 0.734 ± 0.005).
A comparison of the terminal bubble velocities (ut) is presented in Figure 5. The terminal velocity was shown as a function of the temperature. For T = 20 °C, the value from Zawala and Niecikowska’s [30] paper was used. The dashed lines in Figure 5 are second-order polynomials fitted separately to each of the datasets. The solid line is the average polynomial fit. It was evident that the bubble velocity measured by the ultrasonic sensor (us) was higher than for the image analysis (uc). However, the fitted dashed lines indicated that the relative difference between the camera and ultrasonic datasets was similar, so it was caused by a systematic rather than a random factor. It can be presumed that this difference was probably caused by assumptions made on the sound wave speed in the water phase and the different temperature values for which were taken directly from the engineering tables (see Table 2). The difference could have been caused, for example, by wave interference with the column walls. As seen in the inset in Figure 5, the difference between data obtained by both techniques, quantified by the us/uc ratio, was of order of 2–5%. The average second-order polynomial fit, which accurately described the trend of terminal velocity variations (in cm/s) with temperature (expressed in °C) within the range (solid line in Figure 5) was given as:
For CFD data, an agreement with the experimental results decreased with an increasing temperature. This effect was a consequence of an increasing bubble deformation (see Figure 3), i.e., the increase in the bubble dh caused an increase in the drag force resulting from column wall proximity, which could be associated with the so-called wall effect). As seen, both for the ultrasonic and camera methods, the standard deviation values for average terminal velocity were quite small, indicating a good reproducibility. It should be highlighted, however, that, for the camera method, the terminal velocity was calculated from only one experimental run. The ultrasonic sensor, because of its simplicity and swiftness of measurement, allowed for multiple measurements of a bubble velocity profile, which increased the statistical soundness of the terminal velocity values.
Usually, to characterize the bubble dynamics in liquids, various dimensionless numbers are used to allow correlation and comparison between variations in the bubble motion parameters and shape pulsations under different physicochemical conditions. This helps to determine the useful general expressions and dependencies, which could be extended for other systems with comparable bubble shape changes and flow regimes. In our case, for a description of bubble dynamics, the deformation ratio χ (determined on the basis of image analysis) and the rising velocities measured by the two different techniques under different physical conditions (see Table 1), were described using Reynolds (Re) and Weber’s (We) numbers, which allowed a direct comparison with the relations in the models in the literature. In addition, this comparison was used to assess the reliability of the ultrasonic method for determining the bubble dynamics in the aqueous phase. The Re and We were calculated as:
Figure 6A presents experimentally determined values as a function of the Weber number calculated for experimental data by Zawala and Niecikowska [30] and for the data obtained in our studies under various temperatures. Moreover, the data from the numerical calculations were given for comparison. In addition, the empirical relation by Legendre et al. [38] in the form:
was plotted in Figure 6A as a solid line. Quite a good agreement between the data and the relation given by Equation (9) was found. Again, the most significant difference was registered for the ultrasonic method. This was a consequence of the above-mentioned difference in the ut values. Nevertheless, it can be assumed that, in the Rb range, the variations in the bubble vs. We were reasonably described by the Legendre relation [38].
The dependence of Re on We is given in Figure 6B. Here, it was possible to compare the data with the literature results by Pawliszak et al. [23] (experiments at room temperature) and the theoretical predictions reported by Manica et al. [13,39], which allowed the calculation of terminal velocities for rising bubbles of different shapes, assuming a slip hydrodynamic boundary condition at the liquid/gas interface (i.e., when there was no adsorption layer at the bubble surface). As was seen, the agreement of the different sets of literature data, i.e., the bubble velocities determined at the room temperature (21 ± 1 °C), was almost perfect. This was, however, not the case for the ut determined for various T, where a completely different trend was revealed. Intuitively, it could have been expected that this new trend would have been caused not by a modification of the bubble hydrodynamic boundary conditions, but by the liquid physicochemical parameters only. To show the correctness of this claim, the results presented in Figure 6B were analyzed according to the model by Moore, allowing a direct calculation of the bubble drag coefficient (CD). For this purpose, a common relation between We and Re (necessary for further calculations) was quantified. For experiments at room temperature (literature data) the relation between Re and We was almost linear and was approximated (in the considered Rb range) by:
while for various temperature conditions by the Equation (see solid green line in Figure 6B):
To calculate the theoretical drag coefficient associated with the rise of the deformed bubbles in water (clean liquid/gas interface) at various temperatures, the relation elaborated by Moore [38], which is confined to a thin viscous sublayer according to his theory of viscous flow around the bubble, was used:
where and are geometrical factors calculated by Moore [40], which were accurately approximated by the equations given by Loth [41] and Rastello et al. [42]:
To calculate the values as a function of Re, the empirical relations between and We (Equation (13)) as well as Re and We (Equations (14) and (15)) were used. The drag coefficient of the experimentally observed bubbles was calculated from the general expression for the drag force (Fd) acting on the object moving in a liquid phase:
where is the object projected area (for the spherical bubble equal to ). Under steady-state conditions, when the rising velocity was constant (terminal), the . After rearrangement, assuming that for the rising bubble the , the was calculated using experimentally determined and values, as
Figure 7 presents the determined as a function of Re, calculated using Equations (11)–(20). In addition, the values of the drag coefficient of a particle with no-slip hydrodynamic boundary conditions [43] in the form:
were also plotted. As could be expected, the Moore model very accurately described the literature data, obtained at room temperature in pure water. It was seen, moreover, that, after considering the temperature effect by means of Equations (14) and (15), the experimental data (determined both by ultrasonic and camera techniques) were also very well described. It showed evidence that, under various temperatures of pure water, the hydrodynamic boundary conditions of bubbles of various sizes remained unchanged and could be assumed as fully slip.
Moreover, the above analysis showed that the ultrasonic method of bubble velocity determination was reliable but not as accurate as visual observations because it depended on an arbitrarily chosen speed of the sound value, which had to be used during the velocity analysis. Moreover, it did not allow for the determination of the bubble deformation ratio. Nevertheless, the ultrasonic method was significantly faster and gave a much better level of statistical confidence in a remarkably reduced time. In our opinion, it can be successfully used as a reliable tool for single bubble velocity measurements, especially in opaque or turbid solutions where camera observations were difficult or impossible.
In addition, experiments on the bubble motion in water of different temperatures allowed for the determination of the useful relations between the dimensionless numbers and the T values. These relations, which are presented in Figure 8, could be expressed as:
All the empirically determined relations between the various parameters during the period of rectilinear bubble rising under a steady-state condition in water of different temperatures are shown in Table 3. We believe that these relations could also be used for different bubble shapes and sizes under rectilinear motion.
3.2. Bubble Velocity Variations in n-pentanol Solutions of Various Concentrations and Temperature
3.2.1. Analysis of the Local Velocity Profiles in Different Temperatures
Profiles of the local bubble velocity (i.e., velocity variations as a function of the distance covered by the bubble in various concentrations of n-pentanol solutions) are presented in Figure 9. The data redrawn from Zawala et al. [44] were compared with corresponding profiles taken by the ultrasonic sensor. The literature data were obtained using the classical camera technique and manual frame-by-frame image analysis [44].
Despite the slightly different temperatures of the solutions (our measurements were performed in 25 °C, while the literature results were reported at 21 °C), quite a good agreement between the two sets of data was seen. All characteristic bubble velocity changes, including the maximum deceleration and the moment of the terminal velocity establishment, were accurately captured. It is well established that these characteristic velocity variations can serve as fingerprints for the dynamic behavior of the adsorption/desorption processes at the solution/air interface [31]; in other words, they can be used to track the development and stages of the formation of the so-called dynamic adsorption layer (DAL). For example, the maximum bubble velocity was an indication that the DAL did not yet form but just started [45]. The terminal velocity establishment meant that the DAL was fully formed; that is, there was an uneven distribution of surfactant molecules, with a depletion zone at the bubble top pole [6,44,45]. As seen in Figure 9, the ultrasonic method can be used as a complementary tool for these purposes. As already mentioned, a main advantage was its speed—there was no need for a time-consuming image analysis step. On the other hand, ultrasonic measurements did not provide any information about bubble size and deformation or the evolution of bubble shape with time or distance. As was shown by Krzan et al. [45], this is an additional important parameter that can be used to analyze the DAL formation at moving liquid/gas interfaces.
To elucidate the influence of the temperature on kinetics of the DAL formation, each bubble velocity profile, taken in the n-pentanol solution of considered temperature (Table 1) was normalized according to the maximum velocity value (umax). The umax values for chosen n-pentanol concentration are presented in Table 4. As seen, the bubble maximum velocity increased with the temperature—this result was consistent with the reports by Zhang et al. [20], who observed a similar trend in Triton X-100 solution of concentration 1.25 × 10⁻⁴ mol/m3. Figure 10 presents a comparison of normalized velocity for three chosen n-pentanol concentrations. The concentration 1 × 10⁻⁴ and 5 × 10⁻³ M corresponded to the concentrations where the DAL was established just after the bubble acceleration period, while the concentration 1.5 × 10⁻³ M was intermediate, where the DAL formation was associated with a maximum velocity existence.
As seen for 1 × 10⁻⁴ M and 1.5 × 10⁻³ M, the effect of increasing the solution temperature was similar to that of increasing the solution concentration (compare with the data in Figure 9). It was especially pronounced for 1.5 × 10⁻³ M, where the terminal velocity decreased as the temperature increased and, in addition, the moment of its establishment shifted slightly towards shorter distances (i.e., the DAL was established a little bit faster). The explanation of this effect was rather obvious: a higher temperature meant a higher bubble velocity and a simultaneous increase in the rate of convective diffusion transport of the n-pentanol molecules to the rising bubble surface. Similar trends were shown in the solution of Triton X-100 by Zhang et al. [20]
3.2.2. Analysis of Terminal Velocity (at a Distance of 200 mm)
The effect of temperature on the terminal velocities was further analyzed according to the empirical equation developed by Kowalczuk et al. [17]:
where uw is the bubble velocity in water (maximum possible); umin is the minimum velocity of the bubble (with fully immobilized interface); c is the surface-active substance bulk concentration; CMV is the so-called concentration at minimum velocity. As was discussed elsewhere [14,15,16], the CMV can be used as a very useful tool for characterizing the kinetics of surfactant adsorption at the rising bubble interface (the kinetics of bubble surface immobilization), solution foaming properties and a comparison of these factors for different types of surface-active substances.
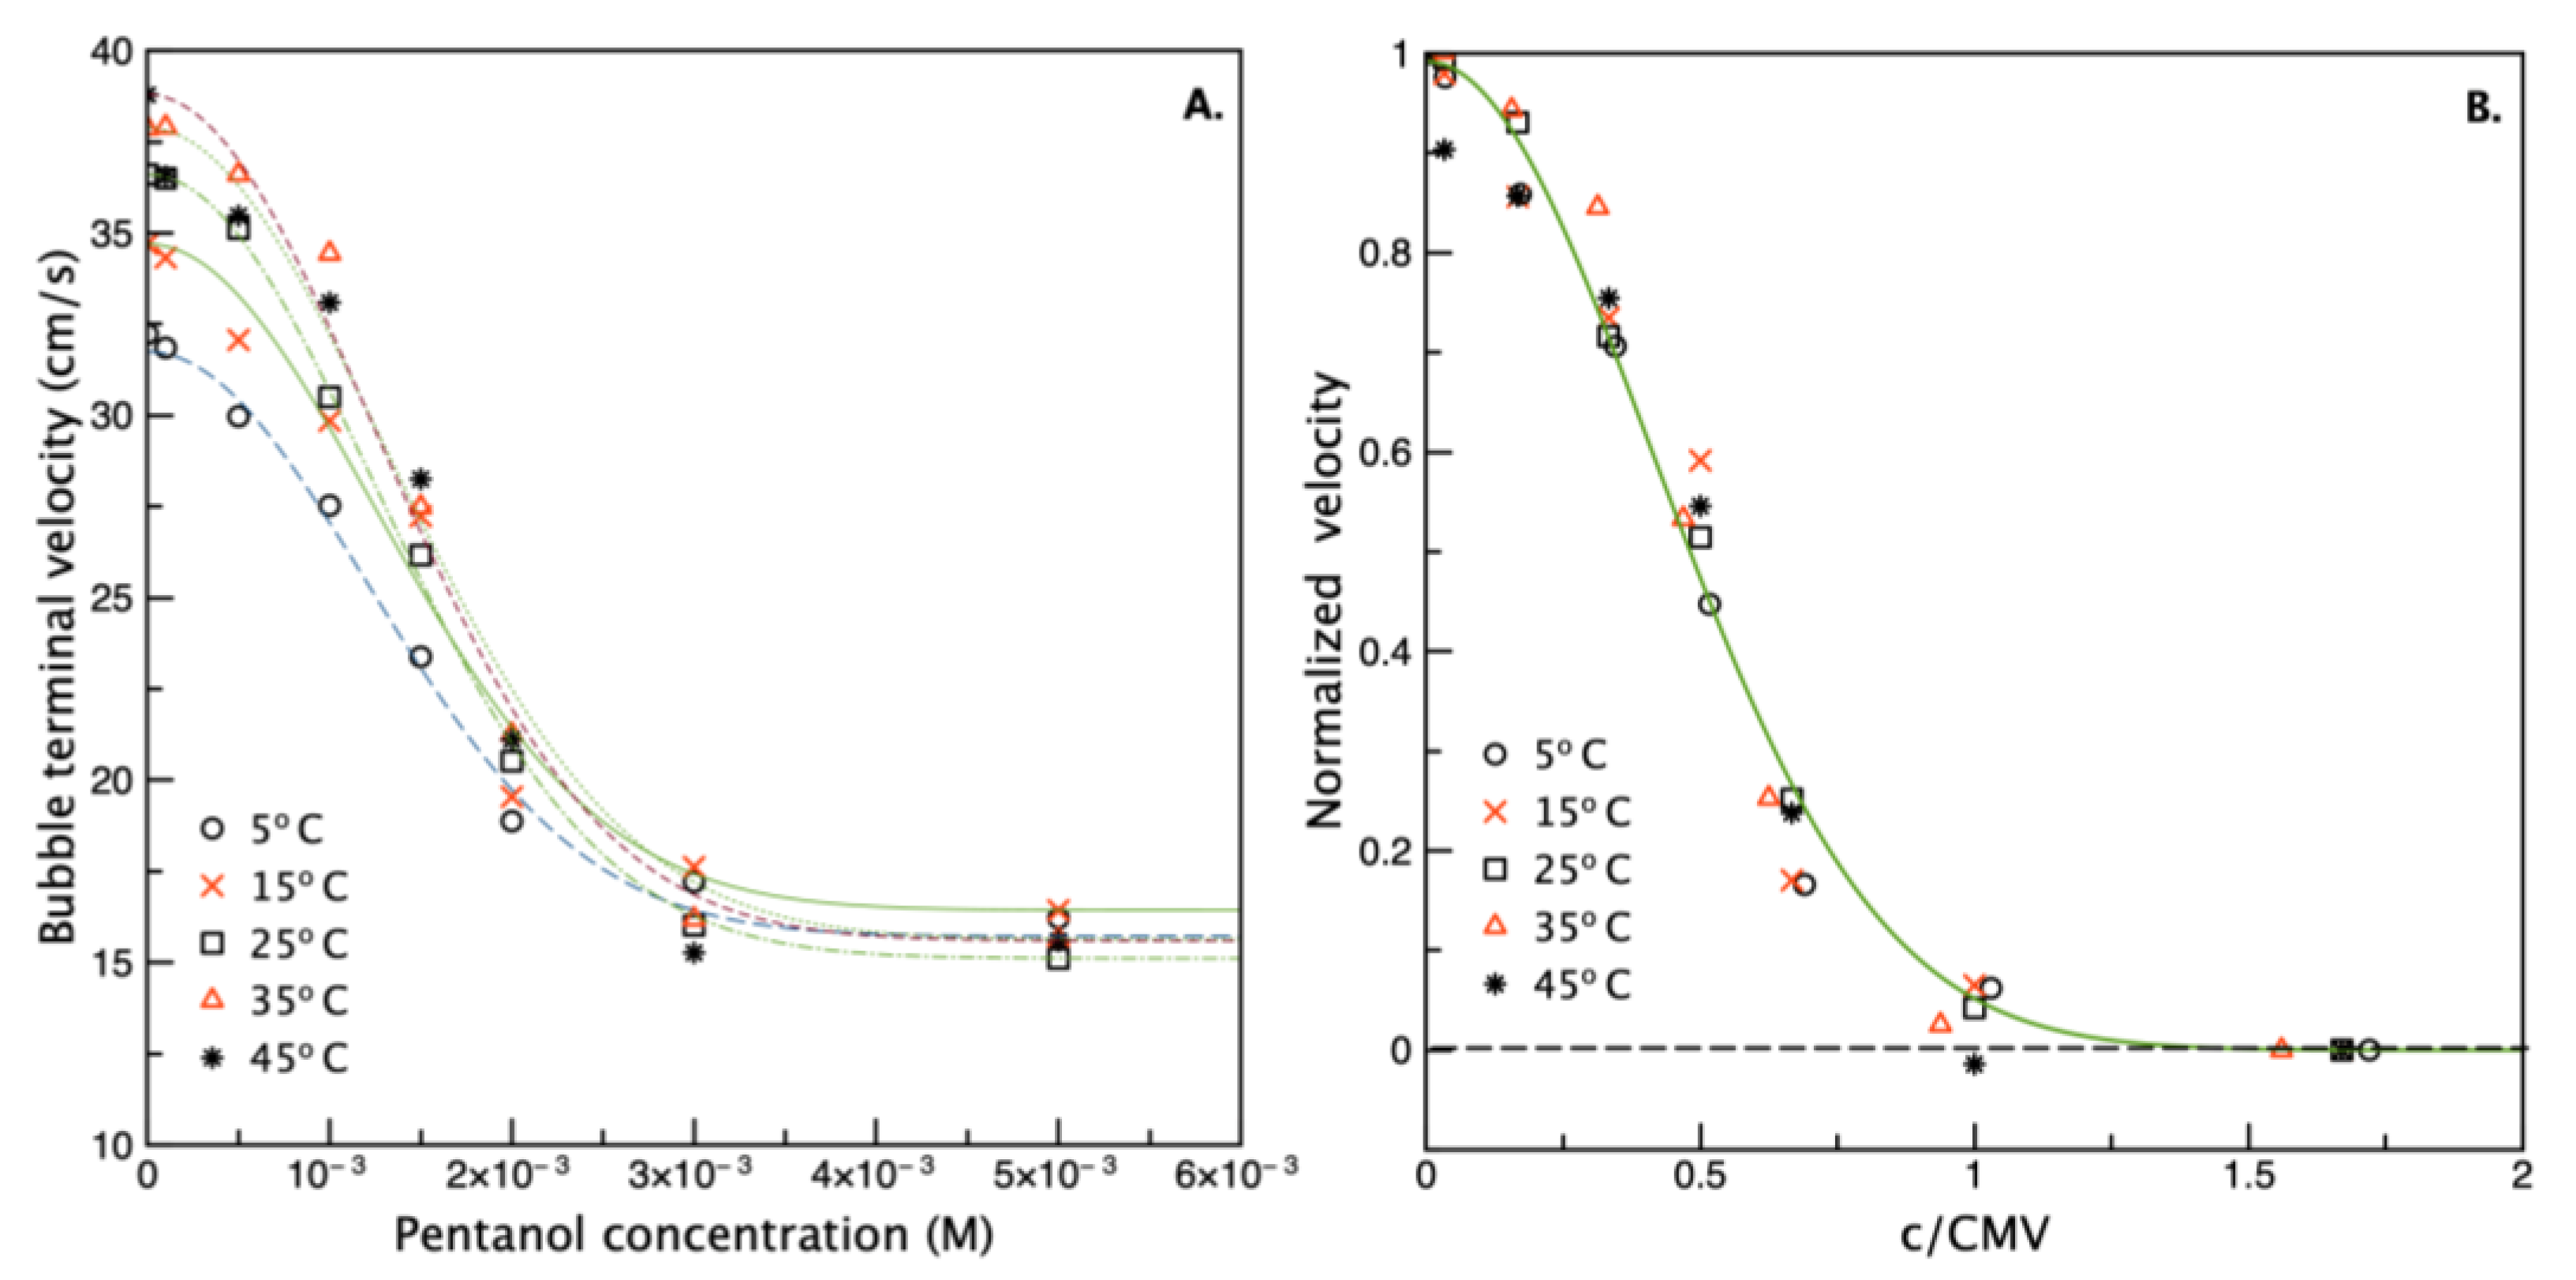
Figure 11A presents the ut values for bubble velocity at 200 mm. In the great majority of experiments, this distance was enough to establish terminal velocity in all n-pentanol concentrations, except for 1×10⁻³ M (see Figure 9). For this specific case, especially for lower temperatures, the calculated ut values were slightly higher than those corresponding to the fully developed DAL. The points presented in Figure 11 were experimental data, while the lines were predictions of Equation (24), which described the ut vs. c dependence very accurately for all temperature ranges. As expected, the CMV values, calculated as a fitting parameter of Equation (24) and presented in Table 5, were practically identical for all temperature values. That meant that, despite the difference in absolute bubble velocity values, the concentration that caused the complete immobilization of the rising bubble surface (above which no further velocity decrease was noticed) was temperature-independent.
By plotting the normalized bubble velocity vs. c/CMV values, all experimental data taken for different temperatures were seen to converge in one universal curve, which indicated that the n-pentanol influenced the bubble rising velocity in a similar manner. It was the final evidence that the temperature, in this case, influenced only the kinetics of adsorption of the n-pentanol at the liquid/gas interface.
4. Conclusions
Experiments performed using two independent experimental methods, supported by numerical calculations and an analysis of the results, showed that, for a clean system, the temperature did not change the hydrodynamic boundary conditions at the rising bubble surface. Under various temperatures of pure water, the hydrodynamic boundary conditions of the bubbles of a given size remained unchanged and could be assumed to be fully slip. An increase in the rising velocity was caused only by modifying the physicochemical parameters of the water (density, viscosity and surface tension). Concerning the bubble’s diameter, an increase in the temperature from 5 to 45 °C caused only a slight size modification. In turn, the bubble deformation varied significantly: the deformation ratio increased with the water temperature and its value was accurately quantified using Legendre’s equation.
It was shown, moreover, that the concentration values at minimum bubble velocity (CMV), calculated from experiments of a bubble rising in n-pentanol solutions of different concentrations, were practically identical for all temperatures. It meant that, despite the difference in the absolute bubble velocity, the concentration, causing the complete immobilization of the rising bubble surface (above which no further velocity decrease could be noticed) was temperature-independent. The temperature only influenced the timescale of the bubble surface immobilization. This observation confirmed the results presented by Zhang et al. [20], which associated this effect with an increase in diffusion kinetics of the surfactant molecules.
The results and analysis showed that the ultrasonic method of determining the rising velocity of a single bubble was reliable, yet not as accurate as a visual observation because the ultrasonic sensor depended on an arbitrarily chosen speed of sound in a liquid phase, which had to be used during calculations. Moreover, it did not allow for the determination of the bubble deformation ratio, which (according to the literature) is an important parameter for helping to quantify the dynamic adsorption layer formation stages. On the other hand, the ultrasonic method was significantly faster and gave a much better level of statistical confidence in a remarkably reduced time. In our opinion, it can be successfully used as a reliable tool for single bubble velocity measurements, especially in opaque or turbid solutions, where camera observations are difficult or impossible.
Author Contributions
Conceptualization, M.B. and J.Z.; methodology, M.B. and J.Z.; software, J.Z.; validation, M.B. and J.Z.; formal analysis, M.B. and J.Z.; investigation, M.B.; resources, J.Z.; data curation, J.Z.; writing—original draft preparation, M.B. and J.Z.; writing—review and editing, M.B. and J.Z.; visualization, M.B. and J.Z.; supervision, J.Z.; project administration, J.Z.; funding acquisition, J.Z. All authors have read and agreed to the published version of the manuscript.
Funding
This research was partially funded by the National Science Centre, grant number 2017/25/B/ST8/01247, and partially supported in a frame of the ICSC PAS statutory task.
Acknowledgments
Partial financial support from (NCN grant no) is acknowledged with gratitude.
Conflicts of Interest
The authors declare no conflict of interest. The funders had no role in the design of the study; in the collection, analyses, or interpretation of data; in the writing of the manuscript; or in the decision to publish the results.
Nomenclature
| dc | diameter of the capillary orifice |
| deq | bubble equivalent diameter |
| dh | horizontal (major) bubble axis |
| dv | vertical (minor) bubble axis |
| Rb | bubble equivalent radius (deq/2) |
| —liquid phase density | |
| —gas phase density | |
| g | —gravitational constant |
| σ | —surface tension |
| Fb | —buoyant (attachment) force |
| Fc | —capillary (detachment) force |
| Fd | —drag force |
| θ | —contact angle between air and water phases |
| Vb | —bubble volume |
| ut | —bubble terminal velocity |
| us | —bubble terminal velocity by ultrasonic method |
| uc | —bubble terminal velocity by image analysis |
| We | —Weber number |
| Re | —Reynolds number |
| CD | —drag coefficient |
| A | —bubble’s projected area |
| χ | —bubble deformation ratio |
References
- Kulkarni, A.A.; Joshi, J.B. Bubble formation and bubble rise velocity in gas-liquid systems: A review. Ind. Eng. Chem. Res. 2005, 44, 5873–5931. [Google Scholar] [CrossRef]
- Kannan, A.; Hristov, P.; Li, J.; Zawala, J.; Gao, P.; Fuller, G.G. Surfactant-laden bubble dynamics under porous polymer films. J. Colloid Interface Sci. 2020, 575, 298–305. [Google Scholar] [CrossRef]
- Sarafraz, M.M.; Shadloo, M.S.; Tian, Z.; Tlili, I.; Alkanhal, T.A.; Safaei, M.Z.; Goodarzi, M.; Arjomandi, M. Convective Bubbly Flow of Water in an Annular Pipe: Role of Total Dissolved Solids on Heat Transfer Characteristics and Bubble Formation. Water 2019, 11, 1566. [Google Scholar] [CrossRef] [Green Version]
- Ellahi, R.; Zeeshan, A.; Hussain, F.; Safaei, M.R. Simulation of cavitation of spherically shaped hydrogen bubbles through a tube nozzle with stenosis. Int. J. Numer. Methods Heat Fluid Flow 2020, 30, 2535–2549. [Google Scholar] [CrossRef]
- Nguyen, A.V.; Evans, G.M. Attachment interaction between air bubbles and particles in froth flotation. Exp. Therm. Fluid Sci. 2004, 28, 381–385. [Google Scholar] [CrossRef]
- Dukhin, S.S.; Kovalchuk, V.I.; Gochev, G.G.; Lotfi, M.; Krzan, M.; Malysa, K.; Miller, R. Dynamics of Rear Stagnant Cap formation at the surface of spherical bubbles rising in surfactant solutions at large Reynolds numbers under conditions of small Marangoni number and slow sorption kinetics. Adv. Colloid Interface Sci. 2015, 222, 260–274. [Google Scholar] [CrossRef]
- Borkowski, M.; Kosior, D.; Zawala, J. Effect of initial adsorption coverage and dynamic adsorption layer formation at bubble surface in stability of single foam films. Colloids Surf. A Physicochem. Eng. Asp. 2020, 589, 124446. [Google Scholar] [CrossRef]
- Zawala, J.; Malysa, K. Influence of the Impact Velocity and Size of the Film Formed on Bubble Coalescence Time at Water Surface. Langmuir 2011, 27, 2250–2257. [Google Scholar] [CrossRef]
- Krasowska, M.; Malysa, K. Kinetics of bubble collision and attachment to hydrophobic solids: I. Effect of surface roughness. Int. J. Miner. Process. 2007, 81, 205–216. [Google Scholar] [CrossRef]
- Kosior, D.; Zawala, J. Initial degree of detaching bubble adsorption coverage and the kinetics of dynamic adsorption layer formation. Phys. Chem. Chem. Phys. 2018, 20, 2403–2412. [Google Scholar] [CrossRef]
- Suñol, F.; González-Cinca, R. Rise, bouncing and coalescence of bubbles impacting at a free surface. Colloids Surf. A Physicochem. Eng. Asp. 2010, 365, 36–42. [Google Scholar] [CrossRef]
- Sanada, T.; Watanabe, M.; Fukano, T. Effects of viscosity on coalescence of a bubble upon impact with a free surface. Chem. Eng. Sci. 2005, 60, 5372–5384. [Google Scholar] [CrossRef]
- Manica, R.; Klaseboer, E.; Chan, D.Y.C. The hydrodynamics of bubble rise and impact with solid surfaces. Adv. Colloid Interface Sci. 2016, 235, 214–232. [Google Scholar] [CrossRef]
- Tan, Y.H.; Rafiei, A.A.; Elmahdy, A.; Finch, J.A. Bubble size, gas holdup and bubble velocity profile of some alcohols and commercial frothers. Int. J. Miner. Process. 2013, 119, 1–5. [Google Scholar] [CrossRef]
- Tan, Y.H.; Finch, J.A. Frother structure-property relationship: Effect of hydroxyl position in alcohols on bubble rise velocity. Miner. Eng. 2016, 92, 1–8. [Google Scholar] [CrossRef]
- Tan, Y.H.; Finch, J.A. Frother structure-property relationship: Effect of alkyl chain length in alcohols and polyglycol ethers on bubble rise velocity. Miner. Eng. 2016, 95, 14–20. [Google Scholar] [CrossRef]
- Kowalczuk, P.B.; Zawala, J.; Drzymala, J. Concentration at the minimum bubble velocity (CMV) for various types of flotation frothers. Minerals 2017, 7, 118. [Google Scholar] [CrossRef] [Green Version]
- Leifer, I.; Patro, R.K.; Bowyer, P. A study on the temperature variation of rise velocity for large clean bubbles. J. Atmos. Ocean. Technol. 2000, 17, 1392–1402. [Google Scholar] [CrossRef]
- Okawa, T.; Tanaka, T.; Kataoka, I.; Mori, M. Temperature effect on single bubble rise characteristics in stagnant distilled water. Int. J. Heat Mass Transf. 2003, 46, 903–913. [Google Scholar] [CrossRef]
- Zhang, Y.; Sam, A.; Finch, J.A. Temperature effect on single bubble velocity profile in water and surfactant solution. Colloids Surf. A Physicochem. Eng. Asp. 2003, 223, 45–54. [Google Scholar] [CrossRef]
- Issaoui, R.; Ben Mansour, L. Experimental study of temperature effects on bubble characteristics and gas holdup in electroflotation column. Desalin. Water Treat. 2019, 162, 186–192. [Google Scholar] [CrossRef]
- Liu, N.; Yang, Y.; Wang, J.; Ju, B.; Brantson, E.T.; Tian, Y.; Dong, Y.; Mahlalela, M. Experimental Investigations of Single Bubble Rising in Static Newtonian Fluids as a Function of Temperature Using a Modified Drag Coefficient. Nat. Resour. Res. 2020, 29, 2209–2226. [Google Scholar] [CrossRef]
- Pawliszak, P.; Ulaganathan, V.; Bradshaw-Hajek, B.; Manica, R.; Beattie, D.A.; Krasowska, M. Mobile or Immobile? Rise Velocity of Air Bubbles in High-Purity Water. J. Phys. Chem. C. 2019, 15131–15138. [Google Scholar] [CrossRef]
- Wongsaroj, W.; Hamdani, A.; Thong-un, N.; Takahashi, H.; Kikura, H. Ultrasonic Measurement of Velocity Profile on Bubbly Flow Using a Single Resonant Frequency. Multidiscip. Digit. Publ. Inst. Proc. 2018, 2, 549. [Google Scholar] [CrossRef] [Green Version]
- Batsaikhan, M.; Hamdani, A.; Kikura, H. Velocity measurement on two-phase air bubble column flow using array ultrasonic velocity profiler. Int. J. Comput. Methods Exp. Meas. 2018, 6, 86–97. [Google Scholar] [CrossRef]
- Li, J.; Zhang, H.; Li, D.; Chen, H. On the Performance of Wireless-Energy-Transfer-Enabled Massive MIMO Systems with Superimposed Pilot-Aided Channel Estimation. IEEE Access 2015, 3, 2014–2027. [Google Scholar] [CrossRef]
- Nakamura, H. Trace: Tennessee Research and Creative Exchange Application of Ultrasound for Bubble Measurement in Water and Mercury. Master’s Thesis, University of Tennessee, Knoxville, TN, USA, 2010. [Google Scholar]
- Azevedo, M.B.; De Faccini, J.L.H.; Su, J. Ultrasonic Measurements of Bubble Shape and Liquid Film Thickness of a Taylor Bubble Rising in a Stagnant Water Column. In Proceedings of the 2013 International Nuclear Atlantic Conference—INAC, Recife, Brazil, 24–29 November 2013. [Google Scholar]
- Engineering ToolBox, Velocity of Sound in Water. 2004. Available online: https://www.engineeringtoolbox.com/sound-speed-water-d_598.html (accessed on 26 August 2021).
- Zawala, J.; Niecikowska, A. Bubble-on-demand generator with precise adsorption time control. Rev. Sci. Instrum. 2017, 88, 095106. [Google Scholar] [CrossRef]
- Ulaganathan, V.; Gochev, G.; Gehin-Delval, C.; Leser, M.E.; Gunes, D.Z.; Miller, R. Effect of pH and electrolyte concentration on rising air bubbles in β-lactoglobulin solutions. Colloids Surf. A Physicochem. Eng. Asp. 2016, 505, 165–170. [Google Scholar] [CrossRef]
- Optel Sp. z o.o. Available online: https://www.optel.eu/ (accessed on 25 August 2021).
- Popinet, S. An accurate adaptive solver for surface-tension-driven interfacial flows. J. Comput. Phys. 2009, 228, 5838–5866. [Google Scholar] [CrossRef] [Green Version]
- Fuster, D.; Agbaglah, G.; Josserand, C.; Popinet, S.; Zaleski, S. Numerical simulation of droplets, bubbles and waves: State of the art. Fluid Dyn. Res. 2009, 41, 065001. [Google Scholar] [CrossRef]
- Popinet, S. Gerris: A tree-based adaptive solver for the incompressible Euler equations in complex geometries. J. Comput. Phys. 2003, 190, 572–600. [Google Scholar] [CrossRef] [Green Version]
- Zawala, J. Energy balance in viscous liquid containing a bubble: Rise due to buoyancy. Can. J. Chem. Eng. 2016, 94, 586–595. [Google Scholar] [CrossRef]
- Tate, T. On the magnitude of a drop of liquid formed under different circumstances. Lond. Edinb. Dublin Philos. Mag. J. Sci. 1864, 27, 176–180. [Google Scholar] [CrossRef]
- Legendre, D.; Zenit, R.; Velez-Cordero, J.R. On the deformation of gas bubbles in liquids. Phys. Fluids 2012, 24, 043303. [Google Scholar] [CrossRef] [Green Version]
- Manica, R.; Klaseboer, E.; Chan, D.Y.C. The impact and bounce of air bubbles at a flat fluid interface. Soft Matter 2016, 12, 3271–3282. [Google Scholar] [CrossRef] [Green Version]
- Moore, D.W. The velocity of rise of distorted gas bubbles in a liquid of small viscosity. J. Fluid Mech. 1965, 23, 749–766. [Google Scholar] [CrossRef]
- Loth, E. Drag of non-spherical solid particles of regular and irregular shape. Powder Technol. 2008, 182, 342–353. [Google Scholar] [CrossRef]
- Rastello, M.; Marié, J.L.; Lance, M. Drag and lift forces on clean spherical and ellipsoidal bubbles in a solid-body rotating flow. J. Fluid Mech. 2011, 682, 434–459. [Google Scholar] [CrossRef] [Green Version]
- Skelland, A.H.P.; Clift, R.; Grace, J.R.; Weber, M.E. Bubble, Drops, and Particles; Academic Press, Inc.: Cambridge, UK, 1978; pp. 1–380. [Google Scholar]
- Zawala, J.; Swiech, K.; Malysa, K. A simple physicochemical method for detection of organic contaminations in water. Colloids Surf. A. Physicochem. Eng. Asp. 2007, 302, 293–300. [Google Scholar] [CrossRef]
- Krzan, M.; Zawala, J.; Malysa, K. Development of steady state adsorption distribution over interface of a bubble rising in solutions of n-alkanols (C5, C8) and n-alkyltrimethylammonium bromides (C8, C12, C16). Colloids Surf. A Physicochem. Eng. Asp. 2007, 298, 42–51. [Google Scholar] [CrossRef]
Figure 1.
Schematic illustration of the experimental set-up used to determine bubble rising velocity in the aqueous phase of various temperatures using camera and an ultrasonic sensor.
Figure 1.
Schematic illustration of the experimental set-up used to determine bubble rising velocity in the aqueous phase of various temperatures using camera and an ultrasonic sensor.

Figure 2.
(A) Example of the signal registered during bubble rise in the liquid (aqueous phase) as a function of distance; (B) magnified signal (magnification area marked by the red line).
Figure 2.
(A) Example of the signal registered during bubble rise in the liquid (aqueous phase) as a function of distance; (B) magnified signal (magnification area marked by the red line).

Figure 3.
Qualitative comparison of the bubble shapes observed experimentally and determined by means of numerical calculations.
Figure 3.
Qualitative comparison of the bubble shapes observed experimentally and determined by means of numerical calculations.

Figure 4.
Radius of the bubble rising in water (measured by image analysis) as a function of (A) capillary orifice diameter and (B) water surface tension variations caused by the temperature changes.
Figure 4.
Radius of the bubble rising in water (measured by image analysis) as a function of (A) capillary orifice diameter and (B) water surface tension variations caused by the temperature changes.

Figure 5.
Terminal velocity of the rising bubble formed at orifice of dc = 0.0753 mm in water of temperature ranging from 5 °C to 45 °C (see Table 1 for details), determined using ultrasonic and camera techniques.
Figure 5.
Terminal velocity of the rising bubble formed at orifice of dc = 0.0753 mm in water of temperature ranging from 5 °C to 45 °C (see Table 1 for details), determined using ultrasonic and camera techniques.

Figure 6.
Dependence between (A) rising bubble deformation ratio and Weber number, and (B) Reynolds number and Weber number determined on the basis of various techniques.
Figure 6.
Dependence between (A) rising bubble deformation ratio and Weber number, and (B) Reynolds number and Weber number determined on the basis of various techniques.

Figure 7.
Drag coefficient of the bubble rising in water of various temperatures. Points—experimental values calculated according to Equation (20); lines—theoretical predictions of Clift et al. (immobile liquid/gas interface) and Moore (mobile liquid/gas interface).
Figure 7.
Drag coefficient of the bubble rising in water of various temperatures. Points—experimental values calculated according to Equation (20); lines—theoretical predictions of Clift et al. (immobile liquid/gas interface) and Moore (mobile liquid/gas interface).

Figure 8.
Temperature dependence of (A) Weber number and (B) Reynolds number associated with a bubble rising in water.
Figure 8.
Temperature dependence of (A) Weber number and (B) Reynolds number associated with a bubble rising in water.

Figure 9.
Comparison of the bubble local velocity profiles obtained on the basis of camera and image analysis approach (data redrawn from [44]) and using ultrasonic technique.
Figure 9.
Comparison of the bubble local velocity profiles obtained on the basis of camera and image analysis approach (data redrawn from [44]) and using ultrasonic technique.

Figure 10.
Comparison of profiles of the bubble velocity for three chosen concentrations of n-pentanol solutions of different temperatures.
Figure 10.
Comparison of profiles of the bubble velocity for three chosen concentrations of n-pentanol solutions of different temperatures.

Figure 11.
Influence of temperature on (A) bubble terminal velocity as a function of n-pentanol concentration and (B) normalized velocity () as a function of c/CMV (data acquired using the ultrasonic method).
Figure 11.
Influence of temperature on (A) bubble terminal velocity as a function of n-pentanol concentration and (B) normalized velocity () as a function of c/CMV (data acquired using the ultrasonic method).


Table 1.
Physical properties of water under various temperatures, studied in the paper.
| No. | Temperature (°C) | Density (kg/m3) | Viscosity ((Pa⋅s × 10−3) | Surface Tension (mN/m) |
|---|---|---|---|---|
| 1 | 5 | 999.9 | 1.52 | 74.9 |
| 2 | 15 | 999.1 | 1.14 | 73.5 |
| 3 1 | 20 | 998.2 | 1.00 | 72.8 |
| 4 | 25 | 997.0 | 0.89 | 72.0 |
| 5 | 35 | 994.1 | 0.72 | 70.4 |
| 6 | 45 | 990.2 | 0.60 | 68.8 |
1 experimental data on bubble velocity and deformation from [30].
Table 2.
Speed of sound used to determine the rising bubble using an ultrasonic sensor (taken from Eng. Toolbox [29]).
Table 2.
Speed of sound used to determine the rising bubble using an ultrasonic sensor (taken from Eng. Toolbox [29]).
| No. | Temperature (°C) | Sound Velocity in Pure Water (m/s) |
|---|---|---|
| 1 | 5 | 1427 |
| 2 | 15 | 1465 |
| 3 | 25 | 1495 |
| 4 | 35 | 1518 |
| 5 | 45 | 1534 |
Table 3.
Empirical relations between various parameters useful for the description of bubble dynamics in water of different temperature (for 200 < Re < 1000).
Table 3.
Empirical relations between various parameters useful for the description of bubble dynamics in water of different temperature (for 200 < Re < 1000).
| No. | Dependence | Empirical Relation (Valid for Bubble in Waterat Temperature = 5–45 °C) |
|---|---|---|
| 1 | Terminal velocity vs. Temperature | (Equation (10)) |
| 2 | Reynolds vs. Weber number | (Equation (15)) |
| 3 | Weber number vs. Temperature | (Equation (22)) |
| 4 | Reynolds number vs. Temperature | (Equation (23)) |
Table 4.
Temperature dependence of the bubble maximum velocity in n-pentanol solution of concentration 1.5 × 10⁻³ M.
Table 4.
Temperature dependence of the bubble maximum velocity in n-pentanol solution of concentration 1.5 × 10⁻³ M.
| c (mol/dm3) | Temperature (°C) | umax (cm/s) |
|---|---|---|
| 1.5 × 10⁻³ | 5 | 24.6 |
| 15 | 29.9 | |
| 25 | 30.3 | |
| 35 | 33.0 | |
| 45 | 34.6 |
Table 5.
Values of the concentration at minimum velocity (CMV) for n-pentanol solutions of different temperatures.
Table 5.
Values of the concentration at minimum velocity (CMV) for n-pentanol solutions of different temperatures.
| No. | Temperature (°C) | CMV (mol/dm3) |
|---|---|---|
| 1 | 5 | 2.9 × 10⁻³ |
| 2 | 15 | 3.0 × 10⁻³ |
| 3 | 20 | 3.0 × 10⁻³ |
| 4 | 25 | 3.2 × 10⁻³ |
| 5 | 35 | 3.0 × 10⁻³ |
Publisher’s Note: MDPI stays neutral with regard to jurisdictional claims in published maps and institutional affiliations. |
© 2021 by the authors. Licensee MDPI, Basel, Switzerland. This article is an open access article distributed under the terms and conditions of the Creative Commons Attribution (CC BY) license (https://creativecommons.org/licenses/by/4.0/).
Share and Cite
MDPI and ACS Style
Borkowski, M.; Zawala, J. Influence of Temperature on Rising Bubble Dynamics in Water and n-pentanol Solutions. Minerals 2021, 11, 1067. https://0-doi-org.brum.beds.ac.uk/10.3390/min11101067
AMA Style
Borkowski M, Zawala J. Influence of Temperature on Rising Bubble Dynamics in Water and n-pentanol Solutions. Minerals. 2021; 11(10):1067. https://0-doi-org.brum.beds.ac.uk/10.3390/min11101067
Chicago/Turabian StyleBorkowski, Mariusz, and Jan Zawala. 2021. "Influence of Temperature on Rising Bubble Dynamics in Water and n-pentanol Solutions" Minerals 11, no. 10: 1067. https://0-doi-org.brum.beds.ac.uk/10.3390/min11101067
Note that from the first issue of 2016, this journal uses article numbers instead of page numbers. See further details here.