
Value of Rapid Mineralogical Monitoring of Copper Ores
by
Matteo Pernechele
1,*, 
Ángel López
2,
Diego Davoise
2,
María Maestre
2,
Uwe König
1 and 
Nicholas Norberg
1 1
Malvern Panalytical B.V., 7602 EA Almelo, The Netherlands
2
Atalaya Mining Plc, 21660 Minas de Riotinto, Spain
*
Author to whom correspondence should be addressed.
Minerals 2021, 11(10), 1142; https://0-doi-org.brum.beds.ac.uk/10.3390/min11101142
Submission received: 15 September 2021
/
Revised: 11 October 2021
/
Accepted: 13 October 2021
/
Published: 17 October 2021
(This article belongs to the Special Issue Value of Mineralogical Monitoring for the Mining and Minerals Industry)
Abstract
:An essential operation in the mineral processing of copper ores into concentrates is blending, as it guarantees a constant feed for the flotation cells, increases metal recovery rate and reduces tailings. In this study, copper ores from Huelva province (Spain) were investigated by quantitative XRD (X-ray diffraction) methods to optimize blending and detect penalty minerals, which can affect flotation and concentrate quality. The Rietveld method in combination with cluster analysis, PLSR and more traditional chemical analysis provide a more complete and in-depth characterization of the ore and the whole process. The mineralogical monitoring can be fully automated to enable real-time decision making.
1. Introduction
Copper is an essential element for today’s technologies, including the pursuit of a green economy and electrification of transport. Mining of copper ores has generated 20 Mt of copper in 2020 globally, and the total reserves are estimated to be 870 Mt [1]. Approximately 250 Mt of copper ores are located at the Iberian Pyrite Belt (IPB), a massive sulfide deposit, which has been mined throughout history. The mineral beneficiation of the ores into concentrates involves comminution followed by flotation, which increases the copper content by 1–2 orders of magnitude. The selection and optimization of the separation and concentration process ultimately affect the economic recovery of the copper ore.
The ore grade is defined by both chemistry and mineralogy, but the mineralogy has a more important role in the recovery rate. When dispersed in a solution, different minerals (as well as different surfaces of the same minerals) have different interfacial energies and surface properties, such as point of zero charge, wettability and chemical affinities [2]. The flotation process exploits the difference in wettability of the different surfaces in aqueous solution to separate the valuable minerals from the gangue. The addition of different pH regulators, ions or surfactants to the solid-water dispersion can selectively change the wettability of different minerals, therefore allowing a high degree of flexibility to the separation and beneficiation process.
The knowledge and control of the mineralogy during ore blending operation, therefore, have an impact on the flotation optimization and ultimately on the copper recovery. Proper blending and optimized flotation also minimize unwanted elements which can decrease the value of the concentrates, such as arsenic (As) and antimony (Sb). The surface properties of minerals also affect agglomeration during comminution. They influence the colloidal properties of a material in suspensions and the flocculation and agglomeration phenomena during dewatering operation. For instance, the presence of swelling clays has a detrimental role in the dewatering of the tailings; therefore, the mineralogy also plays an important role in water consumptions and tailing management. If present in large quantities, clay minerals can also cause pipe blocking and, therefore, halt part of the mineral processing operations.
The main characterization technique to probe the mineralogy of a material is X-ray powder diffraction (XRPD), as it detects the atomic planes that are defined by the mineral space group and unit cell atomic content. In this work, we assess the use of the XRPD technique for the rapid quantification of minerals through the flotation process. The Rietveld refinement [3] is carried out by control files, which contain a database of tens of structures together with a pre-defined refinement strategy. The precision of the analysis was assessed by comparing the results to independent elemental analysis. The capability of clustering techniques such as PCA (principal component analysis) and predictive tools such as PLSR (partial least square regression) were also evaluated and compared with classical Rietveld results.
Correlation between mineralogy and mineral processing are presented in the discussion. The fast generation of reliable data which can be used for decision making is a key component to the digitalization of the mining industry. This research on copper ore materials and their mineral processing can easily be translated to other industrial activities, where the mineralogical knowledge can spark innovation directed toward sustainable goals [4,5,6,7,8].
2. Materials and Methods
2.1. Materials
In this study, we characterized different copper ore blends from the Iberian Pyrite Belt and quantified the mineralogical changes occurring during the flotation beneficiation process. The samples were provided by Atalaya (Minas de Riotinto, Spain), a European mining company focused on research, exploration and processing of copper ores. The assay results are reported in Table 1 and they were obtained using inductively coupled plasma-optical emission spectrometry (ICP Avio 500, Perkin Elmer Inc., Waltham, United States) (ICP-OES). The metal zonation of the copper ore in the region (Huelva province) is mostly composed of chalcopyrite and pyrite, while the host rock is mostly made of chlorite-group minerals, sericite and silica varieties [9]. A total of 265 samples were characterized and equally divided in three categories: the blended ores used as feed for the flotation cells, the flotation concentrates and the flotation tailings.
2.2. Method
The particle sizes of the materials were below 250 µm. Sample preparation for XRD (X-ray diffraction) included grinding with a swing mill (also known as shatterbox, vibratory disc mill or pulverizer) to reduce the particle size below 60 µm and improve mineral quantification by quantitative X-ray diffraction (QXRD). Samples were prepared the for XRD analysis in a 27 mm backloading sample holder to reduce the preferential orientation.
The XRD scans were collected using the Minerals Edition of Aeris benchtop X-ray diffractometer (Malvern Panalytical B.V., Almelo, The Netherland) (40 kV–15 mA), with a goniometer radius of 145 mm, Kα = 1.79 Å cobalt-anode X-ray tube, 0.04 Soller slits, ¼ divergence slits, 23 mm mask, low beam-knife, step size 0.02° and acquisition time of 80 s/step. The Bragg-Brentano measurement covered a range of 5–80 °2θ (atomic planes from 1.39 Å to 20.51 Å), allowing the detection of clay minerals. The use of a cobalt tube avoids iron fluorescence usually observed with Cu-radiation, therefore improving penetration depth of X-rays in the sample and improving counting statistics. The use of a linear PIXcel1D Medipix3 detector (Malvern Panalytical B.V., Almelo, The Netherland) with an active length of 5.54 °2θ allows a scan acquisition time of a few minutes, and the results are immediately analyzed by automatic Rietveld routines installed in the Minerals Edition of Aeris.
2.3. Analysis
The phase identification was done with the HighScore Plus software package version 4.8 (Malvern Panalytical B.V., Almelo, The Netherland) [10] and the ICDD PDF-4 database (accessed on 3 March 2021) [11]. The phase identification was performed on specific, representative XRD scans selected by cluster analysis, which will be covered in the results section. The identified mineral phases are reported in Table 2, together with their averaged weight percentages as determined by the Rietveld refinement [12]. More than 10 other minerals were identified, but are mainly present in minor amounts, e.g., tennantite, galena, arsenopyrite, dolomite, gypsum, marcasite and chalcocite. The Rietveld routines were created with HighScore Plus and executed by software RoboRiet 4.8, a dedicated implementation of Rietveld quantification for automation projects. The results were verified by executing manual Rietveld refinements in HighScore Plus.
3. Results
3.1. Minerals Present in the Blends, Tailings and Concentrates
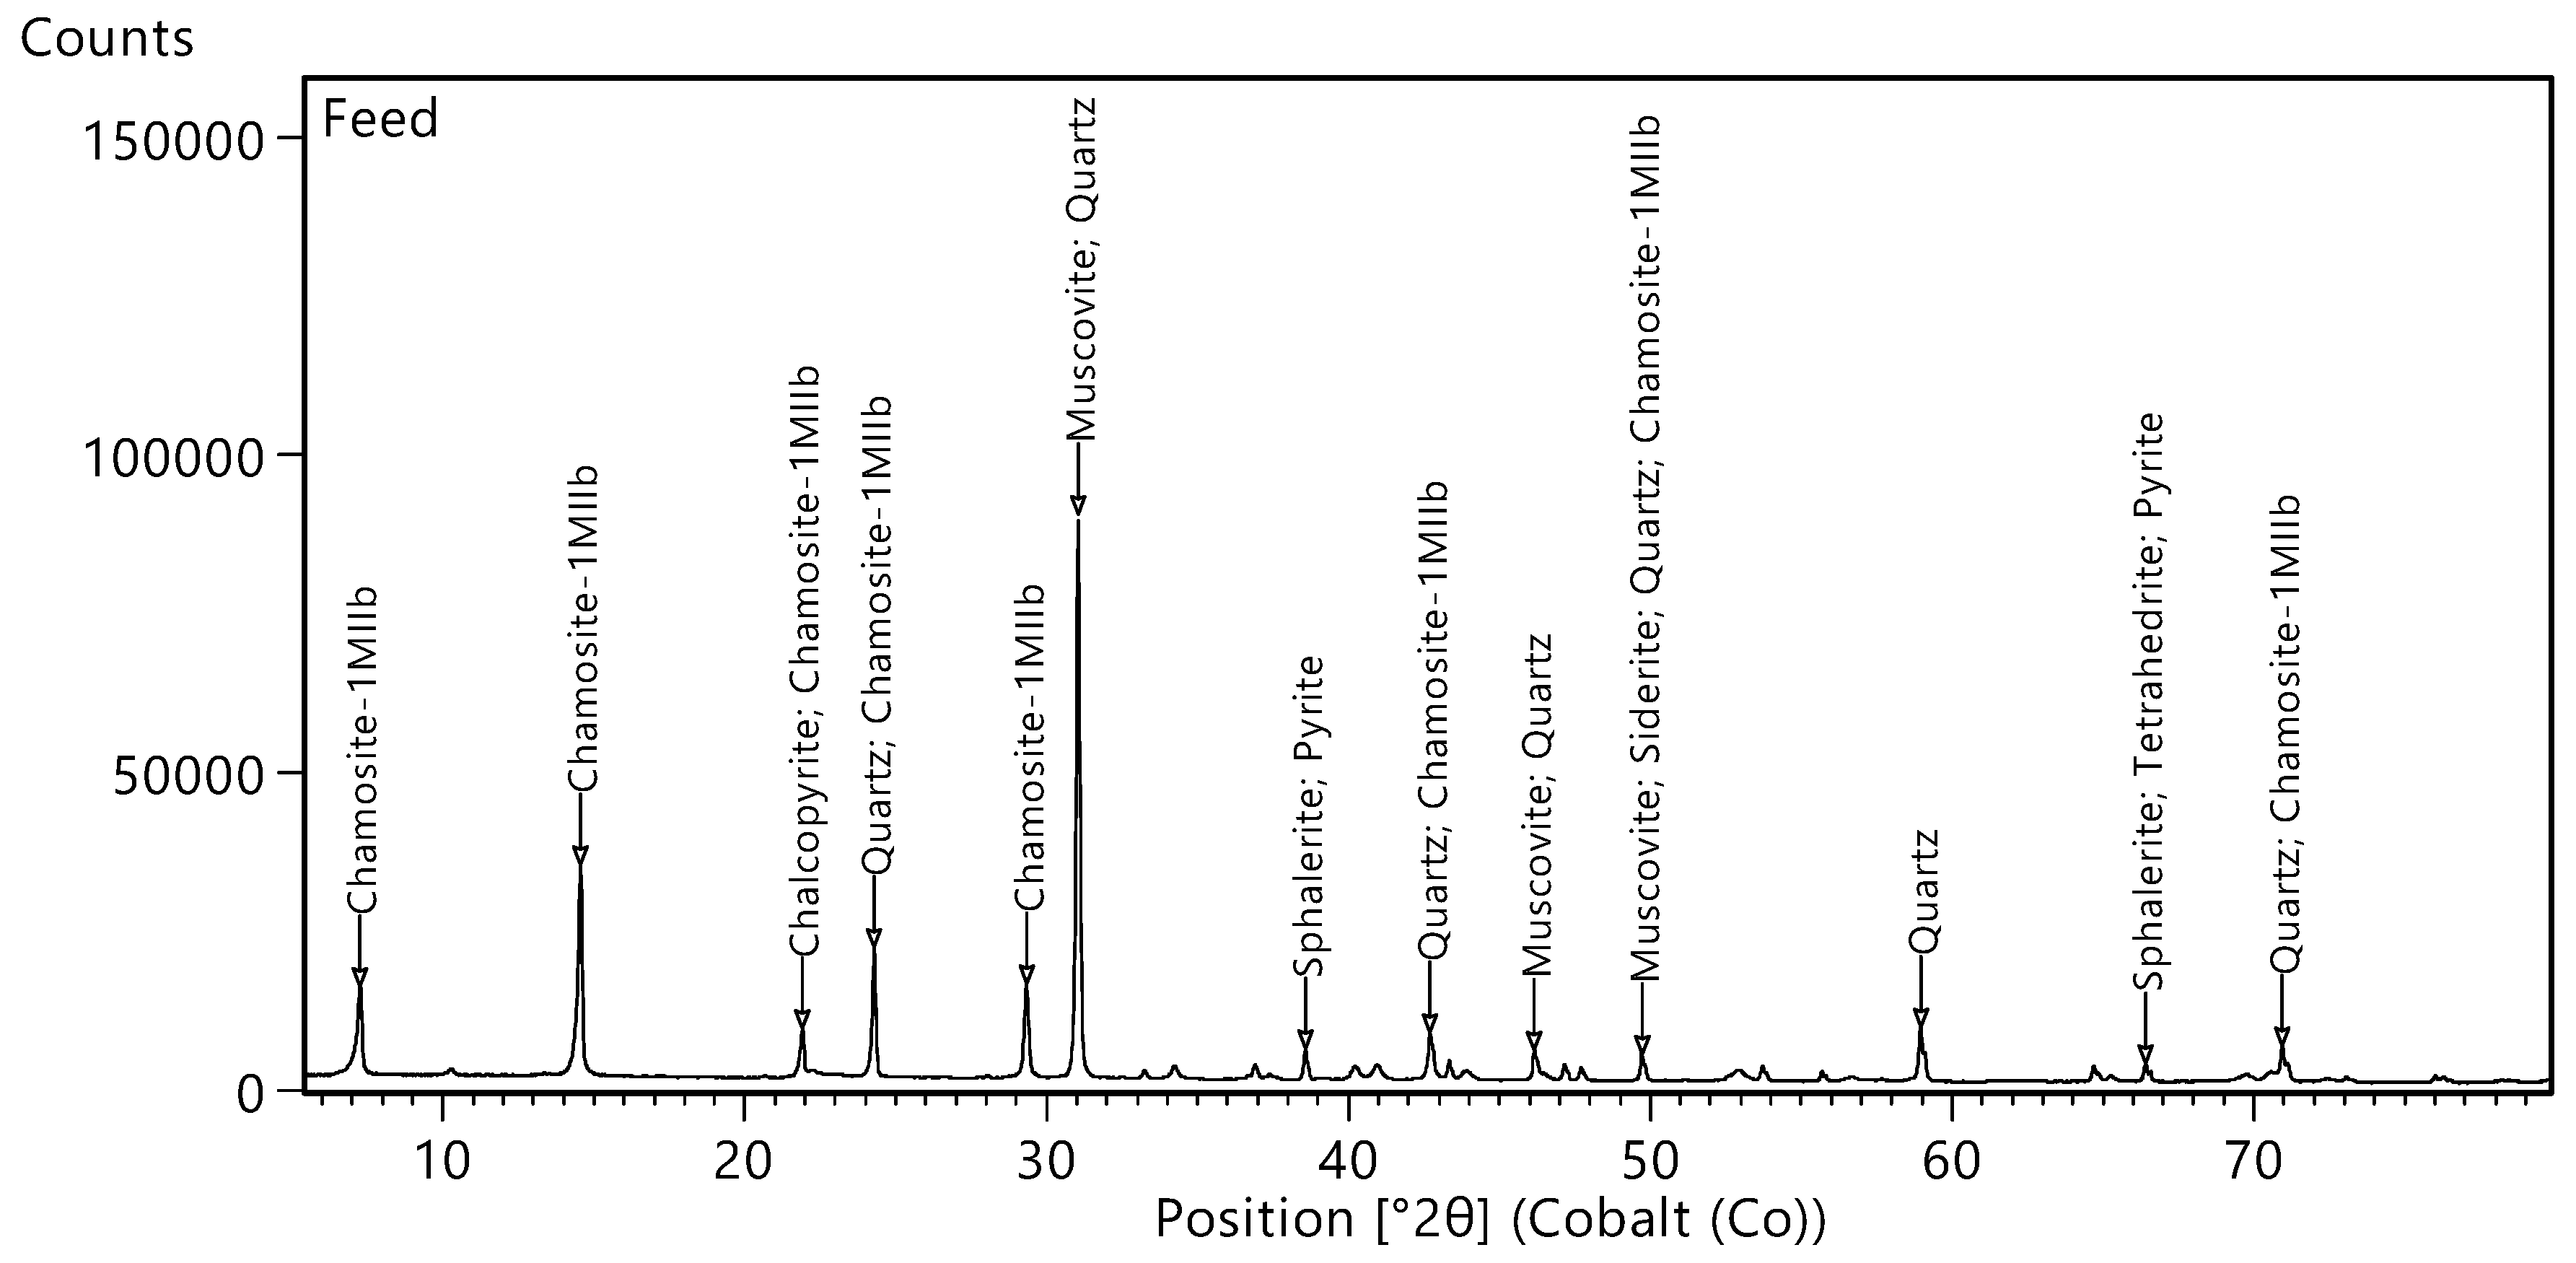
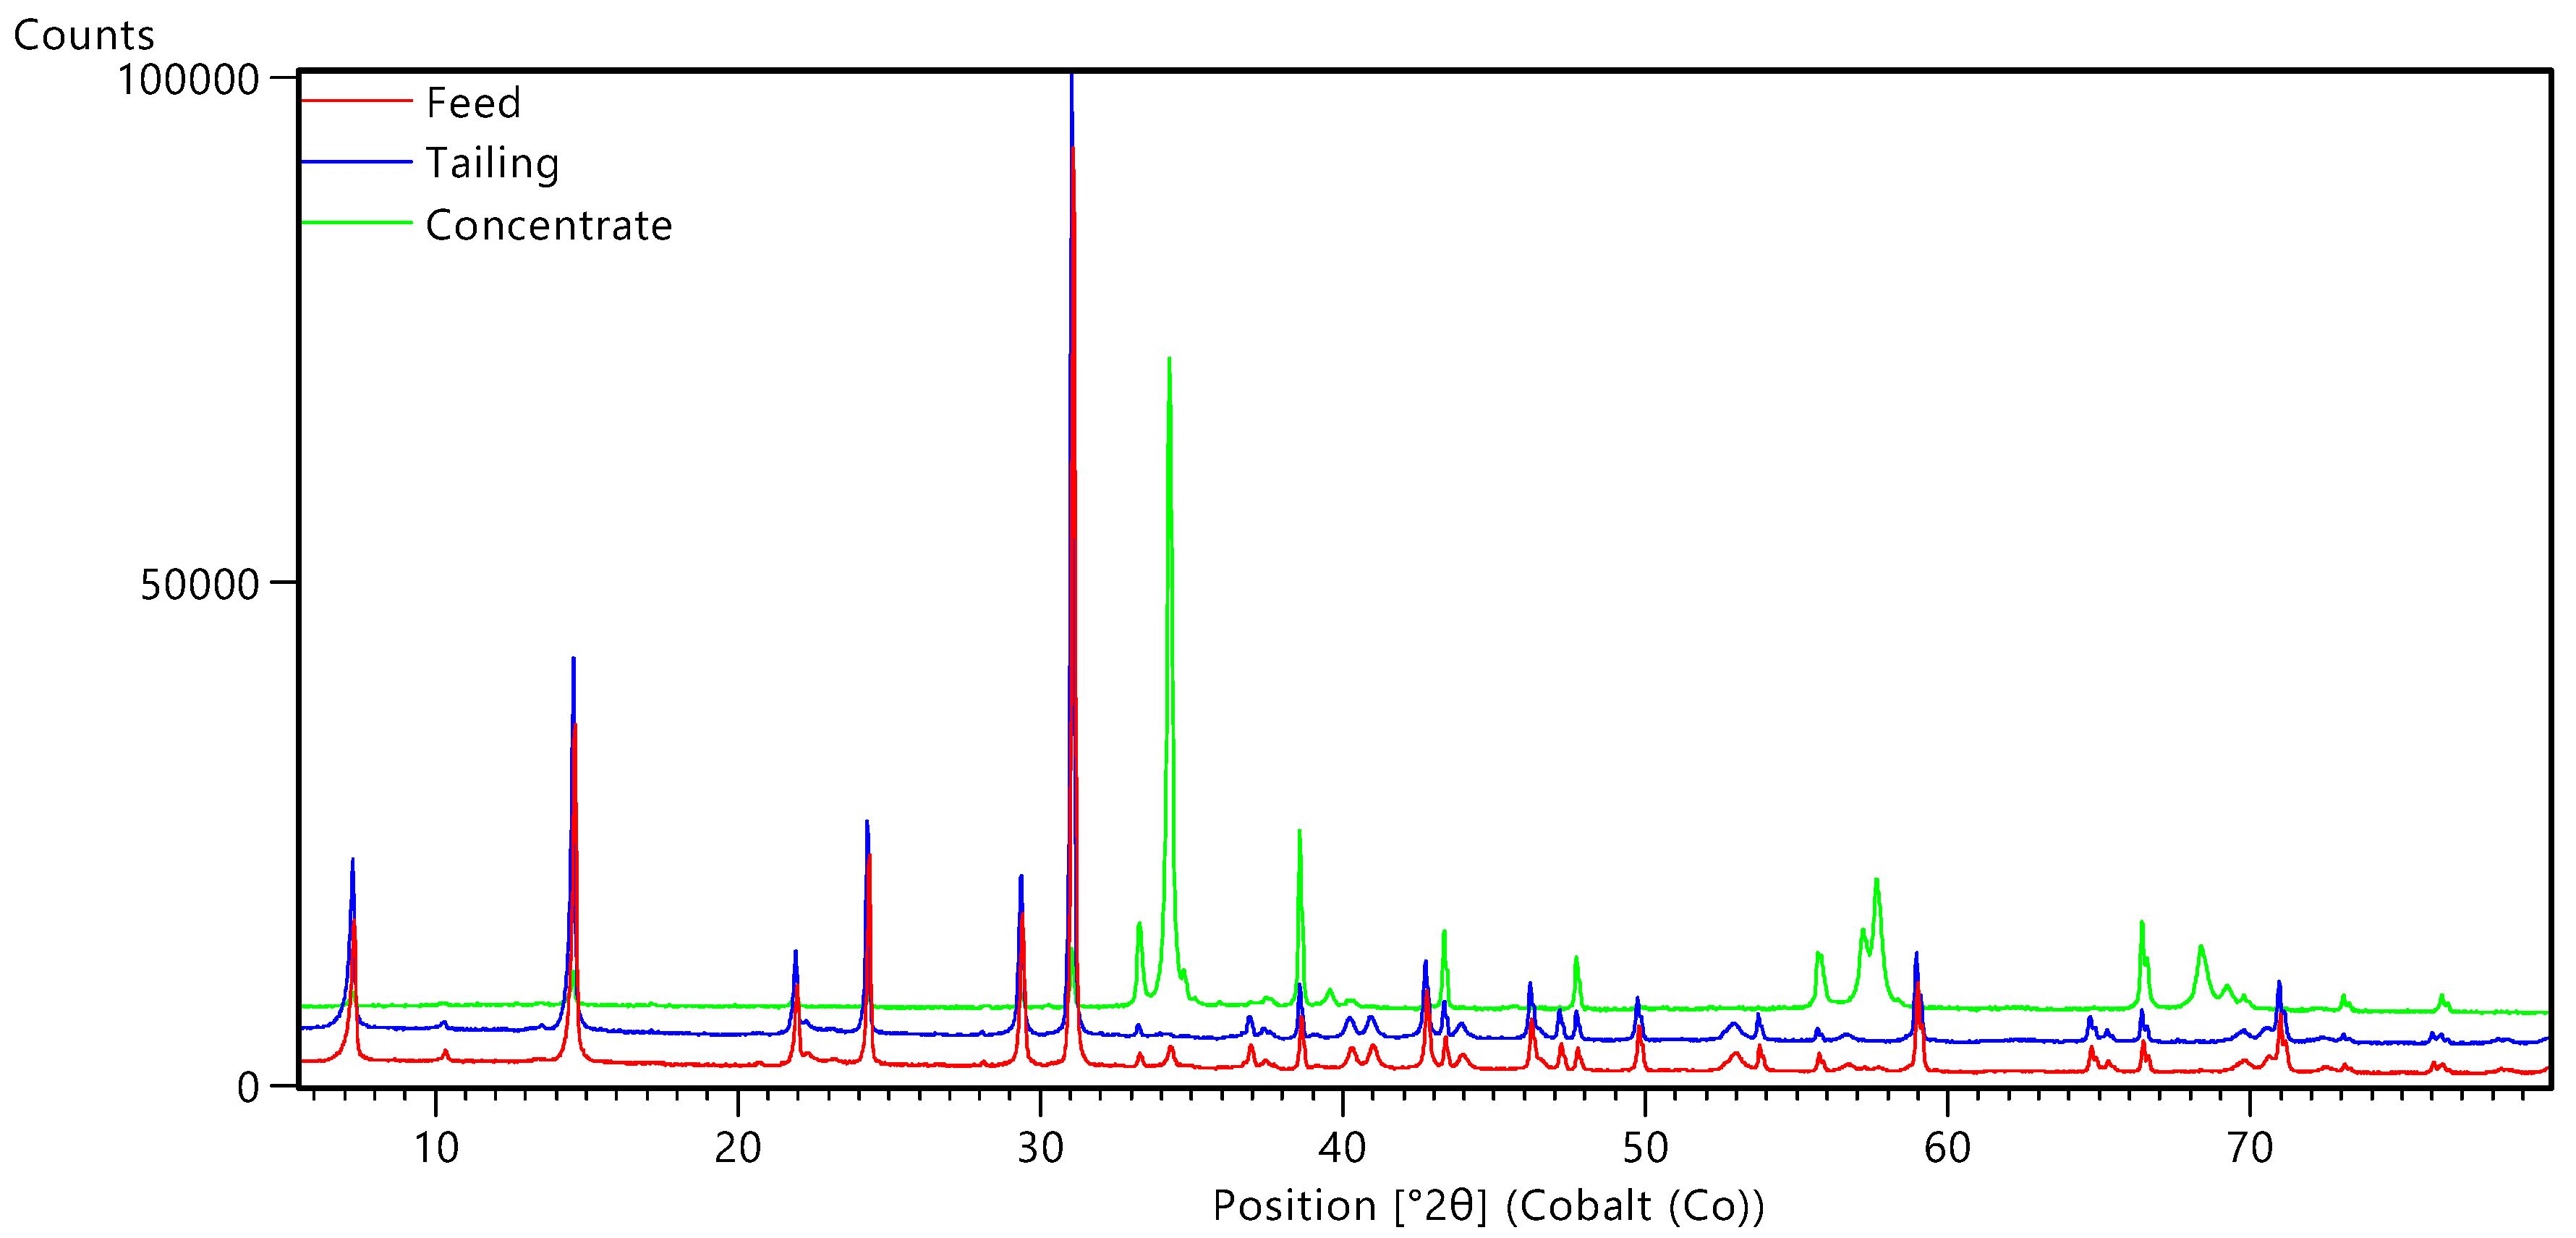
The major minerals with their distinctive most intense peak positions are reported in Figure 1. The material is an ore blend used as feed for flotation. Its diffraction pattern is the representative scan as defined by cluster analysis. The main diffraction peaks correspond to quartz, pyrite and phyllosilicates (chamosite and muscovite). The main copper-bearing mineral is chalcopyrite, which has several diffraction peaks in the range of 20–70 °2θ, the most intense at 34.2 °2θ, which is better observed in the diffractograms of a representative concentrate material (Figure 2). The diffraction patterns of tailings and feeds are quite similar, while the patterns of the concentrates display lower diffraction intensity of gangue minerals and higher intensity for copper, zinc and iron sulfide minerals. A list of major minerals can be found in Table 2.
The Rietveld refinement requires XRD scans of a certain quality, especially when the mineral quantification is performed in a quality control environment with automatic RoboRiet routines. The data should be characterized by features such as a low and flat background and high diffraction intensities (most intense peak with >10,000 counts). The peak position overlap of certain minerals, e.g., sphalerite with pyrite, chalcopyrite with gypsum and tetrahedrite, supports the use of Rietveld refinement as a full pattern fitting approach, whereas classical straight-line calibration methods can cause a bias in the results.
3.2. Details on Chalcopyrite and Tetrahedrite Monitoring
In this section we focused on the capability of XRD techniques to detect and quantify minerals present at minor concentrations, in particular the residual chalcopyrite content in a tailing sample (Figure 3) and Bi-Sb-Pb-As sulphosalts present in a concentrate sample (Figure 4).
For the tailing sample, the copper concentration is Cu = 0.16 wt% as determined by ICP, while the chalcopyrite is 0.45 wt% as determined by automatic Rietveld refinement. Chalcopyrite contains 34.6% of copper and the back-calculated copper content from Rietveld analysis is 0.16 wt%, in agreement with ICP results. Vertical bars show diffraction peaks of chalcopyrite CuFeS2, including its most intense peak at 2θ = 34.2°. The latter peak is due to the diffraction of Kα = 1.79 Å X-rays and chalcopyrite atomic planes with distance d = 3.03 Å (space group I-42d, a = b = 5.290 Å and c = 10.426 Å, miller indexes h = 1, k = 1 and l = 2). With a background count of 1680 counts and a peak intensity of 572 counts, the chalcopyrite diffraction peak has a signal-to-noise ratio SNR ≈ 14.4, which passes the criteria of limit of detection (SNR)LOD = 3 and limit of quantification (SNR)LOQ = 10 [13]. One advantage of Rietveld refinement over classical straight line calibration method is the proper intensity extractions of overlapping peaks, such as chalcopyrite peak at 2θ = 34.2° and gypsum peak at 2θ = 34.0°, see Figure 3.
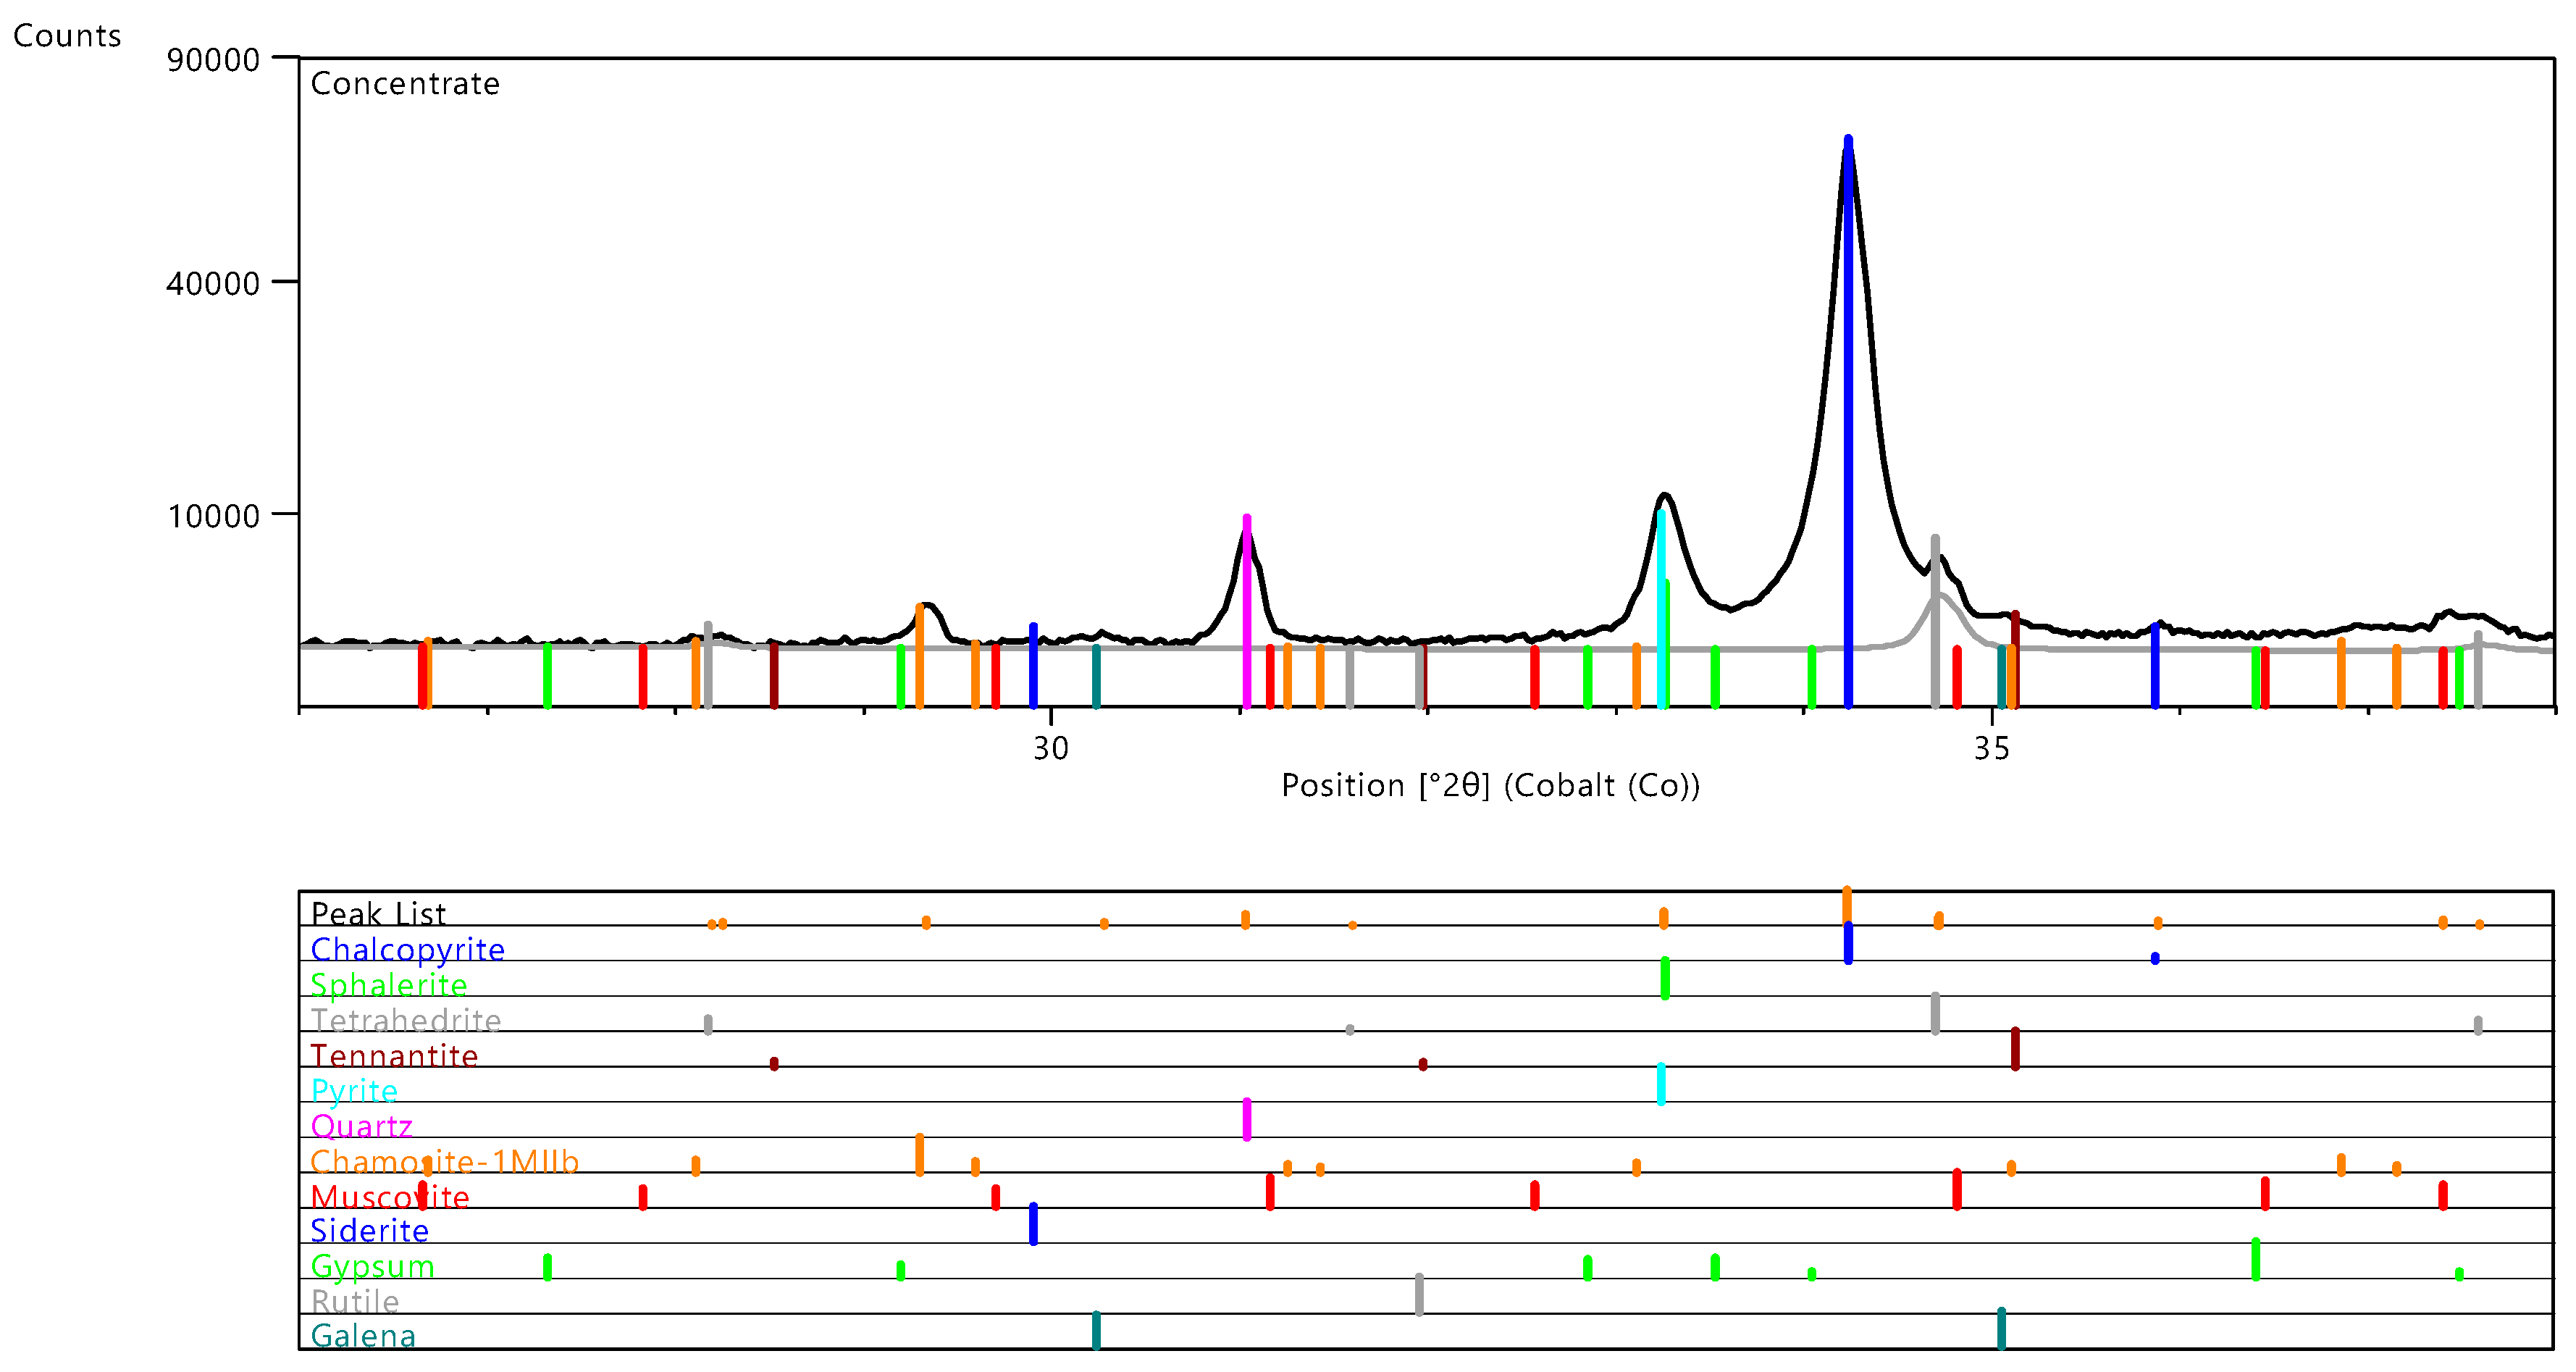
Similarly, the main diffraction peak of Bi-Sb-Pb-As sulphosalts partially overlap with chalcopyrite peak, Figure 4. The phase ID with HighScore Plus assigned the diffraction peak at 2θ = 34.74° to the tetrahedrite family, specifically to ICDD: 01-074-3633, a mercury-copper-antimony-arsenic sulfide. Such phase was selected as the best available structural model based on scores of search-match algorithm of HighScore, graphical refinement criteria and agreement with antimony elemental concentration in the concentrates, see Figure 7. From the net peak intensity I = 1425 counts and background intensity B = 3120 counts, the signal-to-noise ratio can be calculated: SNR = I/√B ≈ 25.
3.3. Rietveld Refinements and Trends
The mineralogical quantification of the major phases is reported in Table 2. The chalcopyrite in the concentrate is 40–50 times higher than in the ore blends. Other major minerals which show higher percentage in the concentrate are sphalerite, tetrahedrite and pyrite.
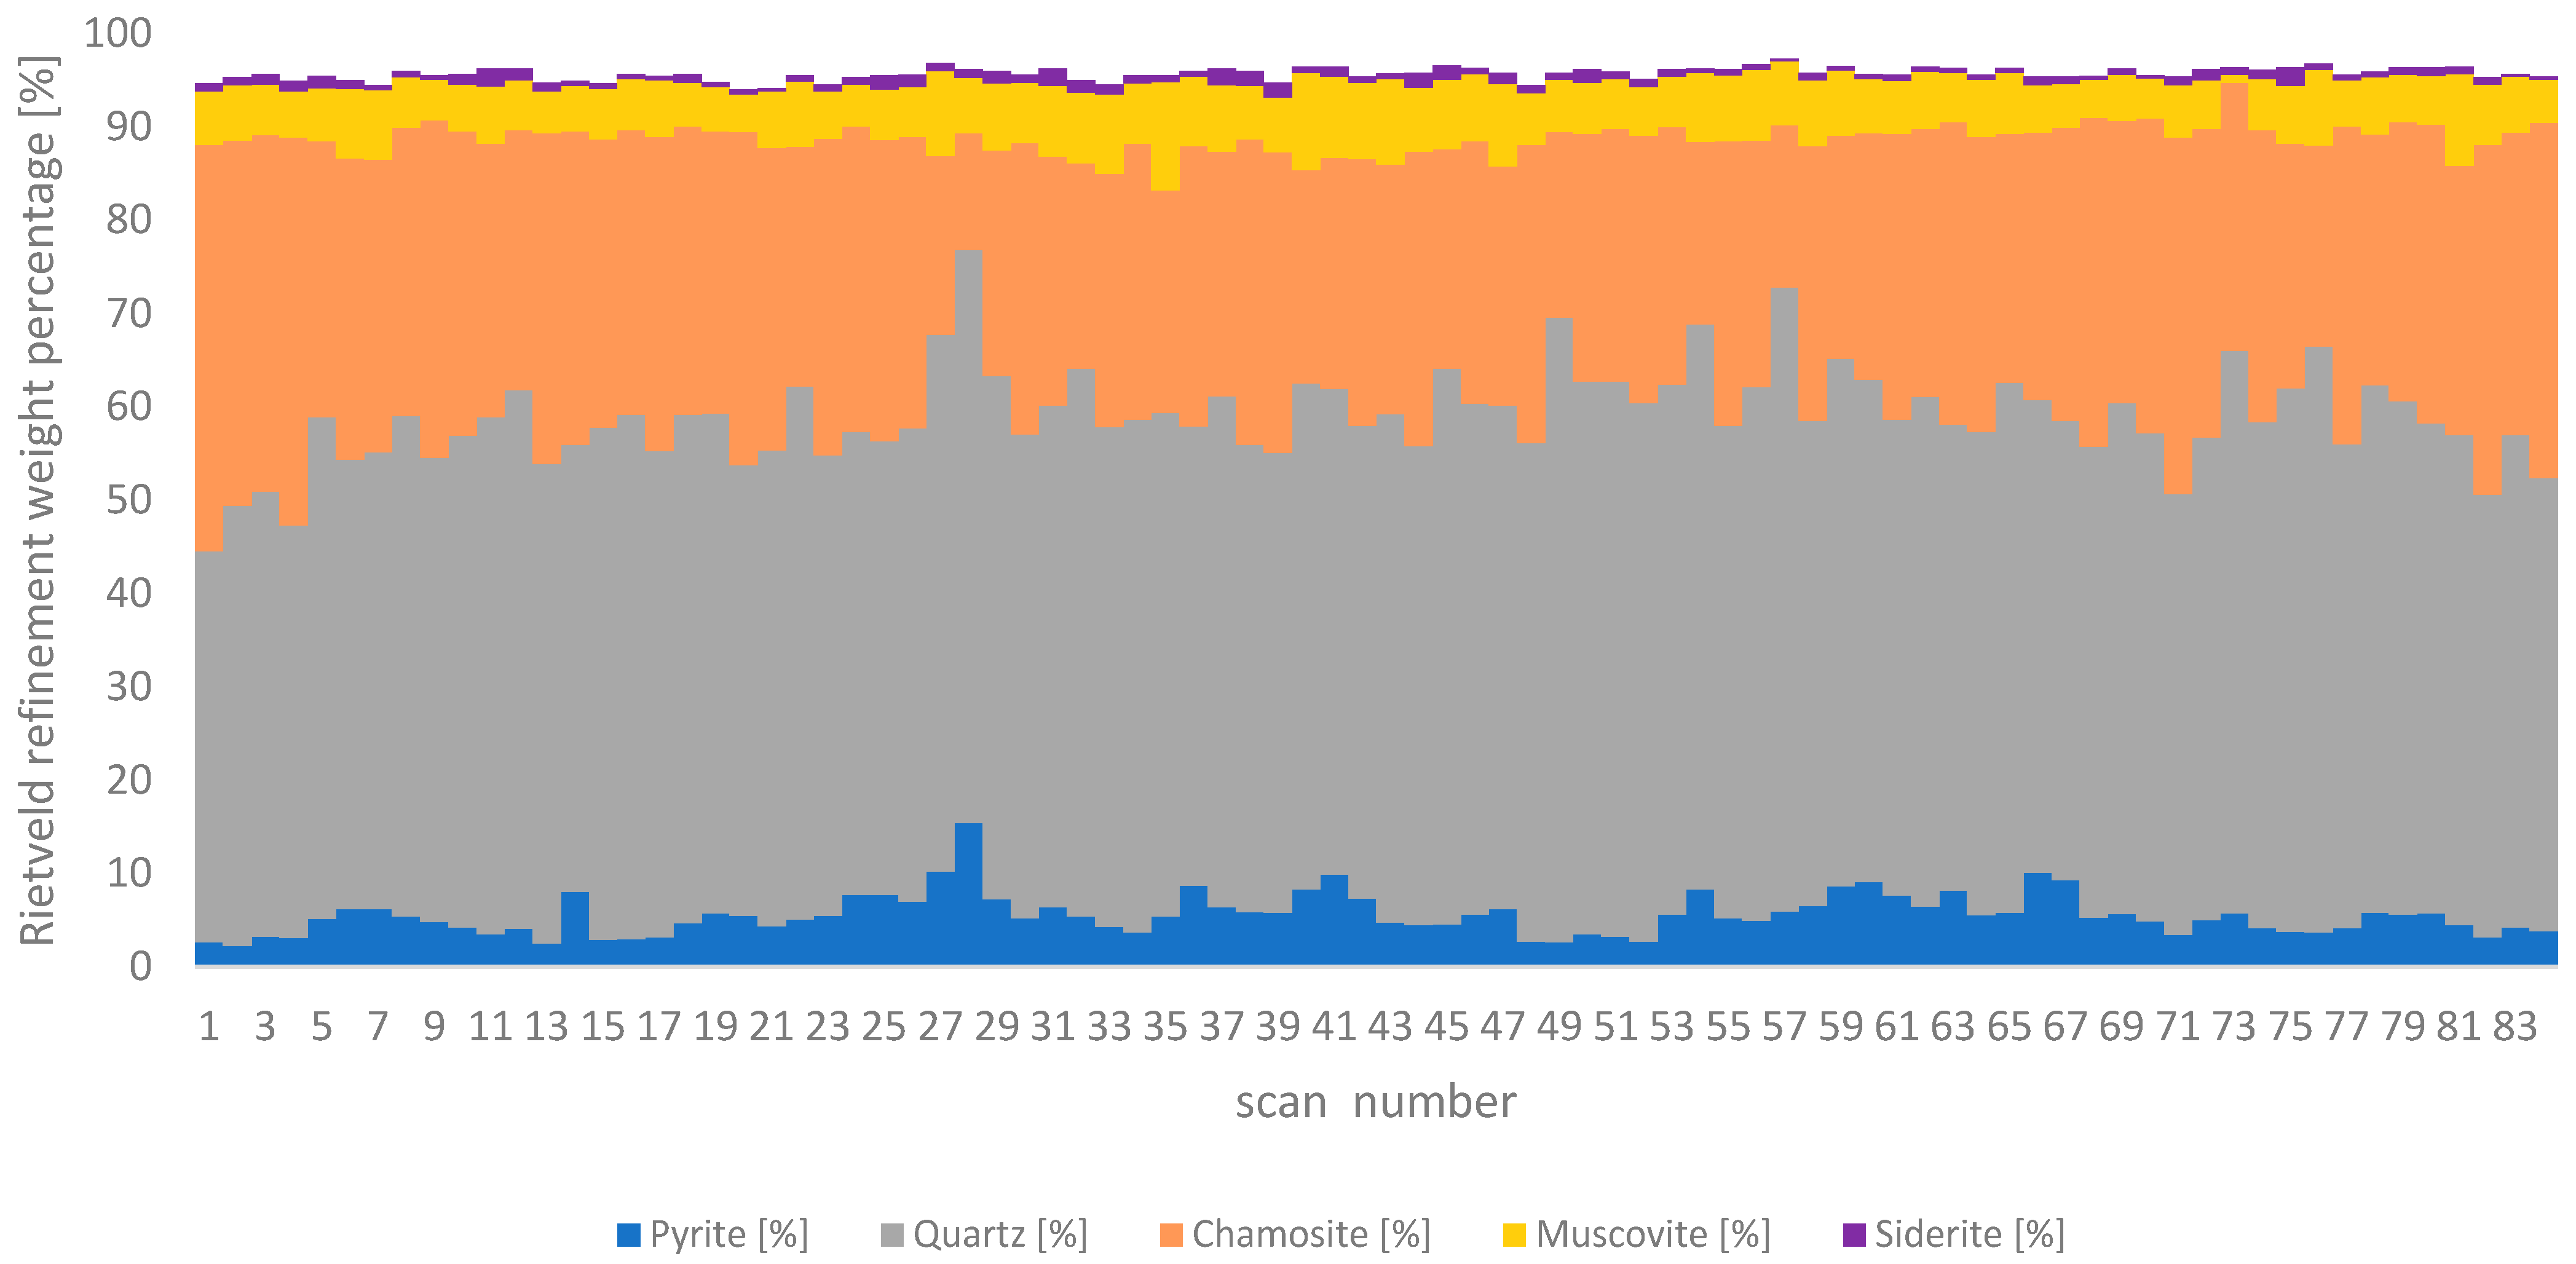
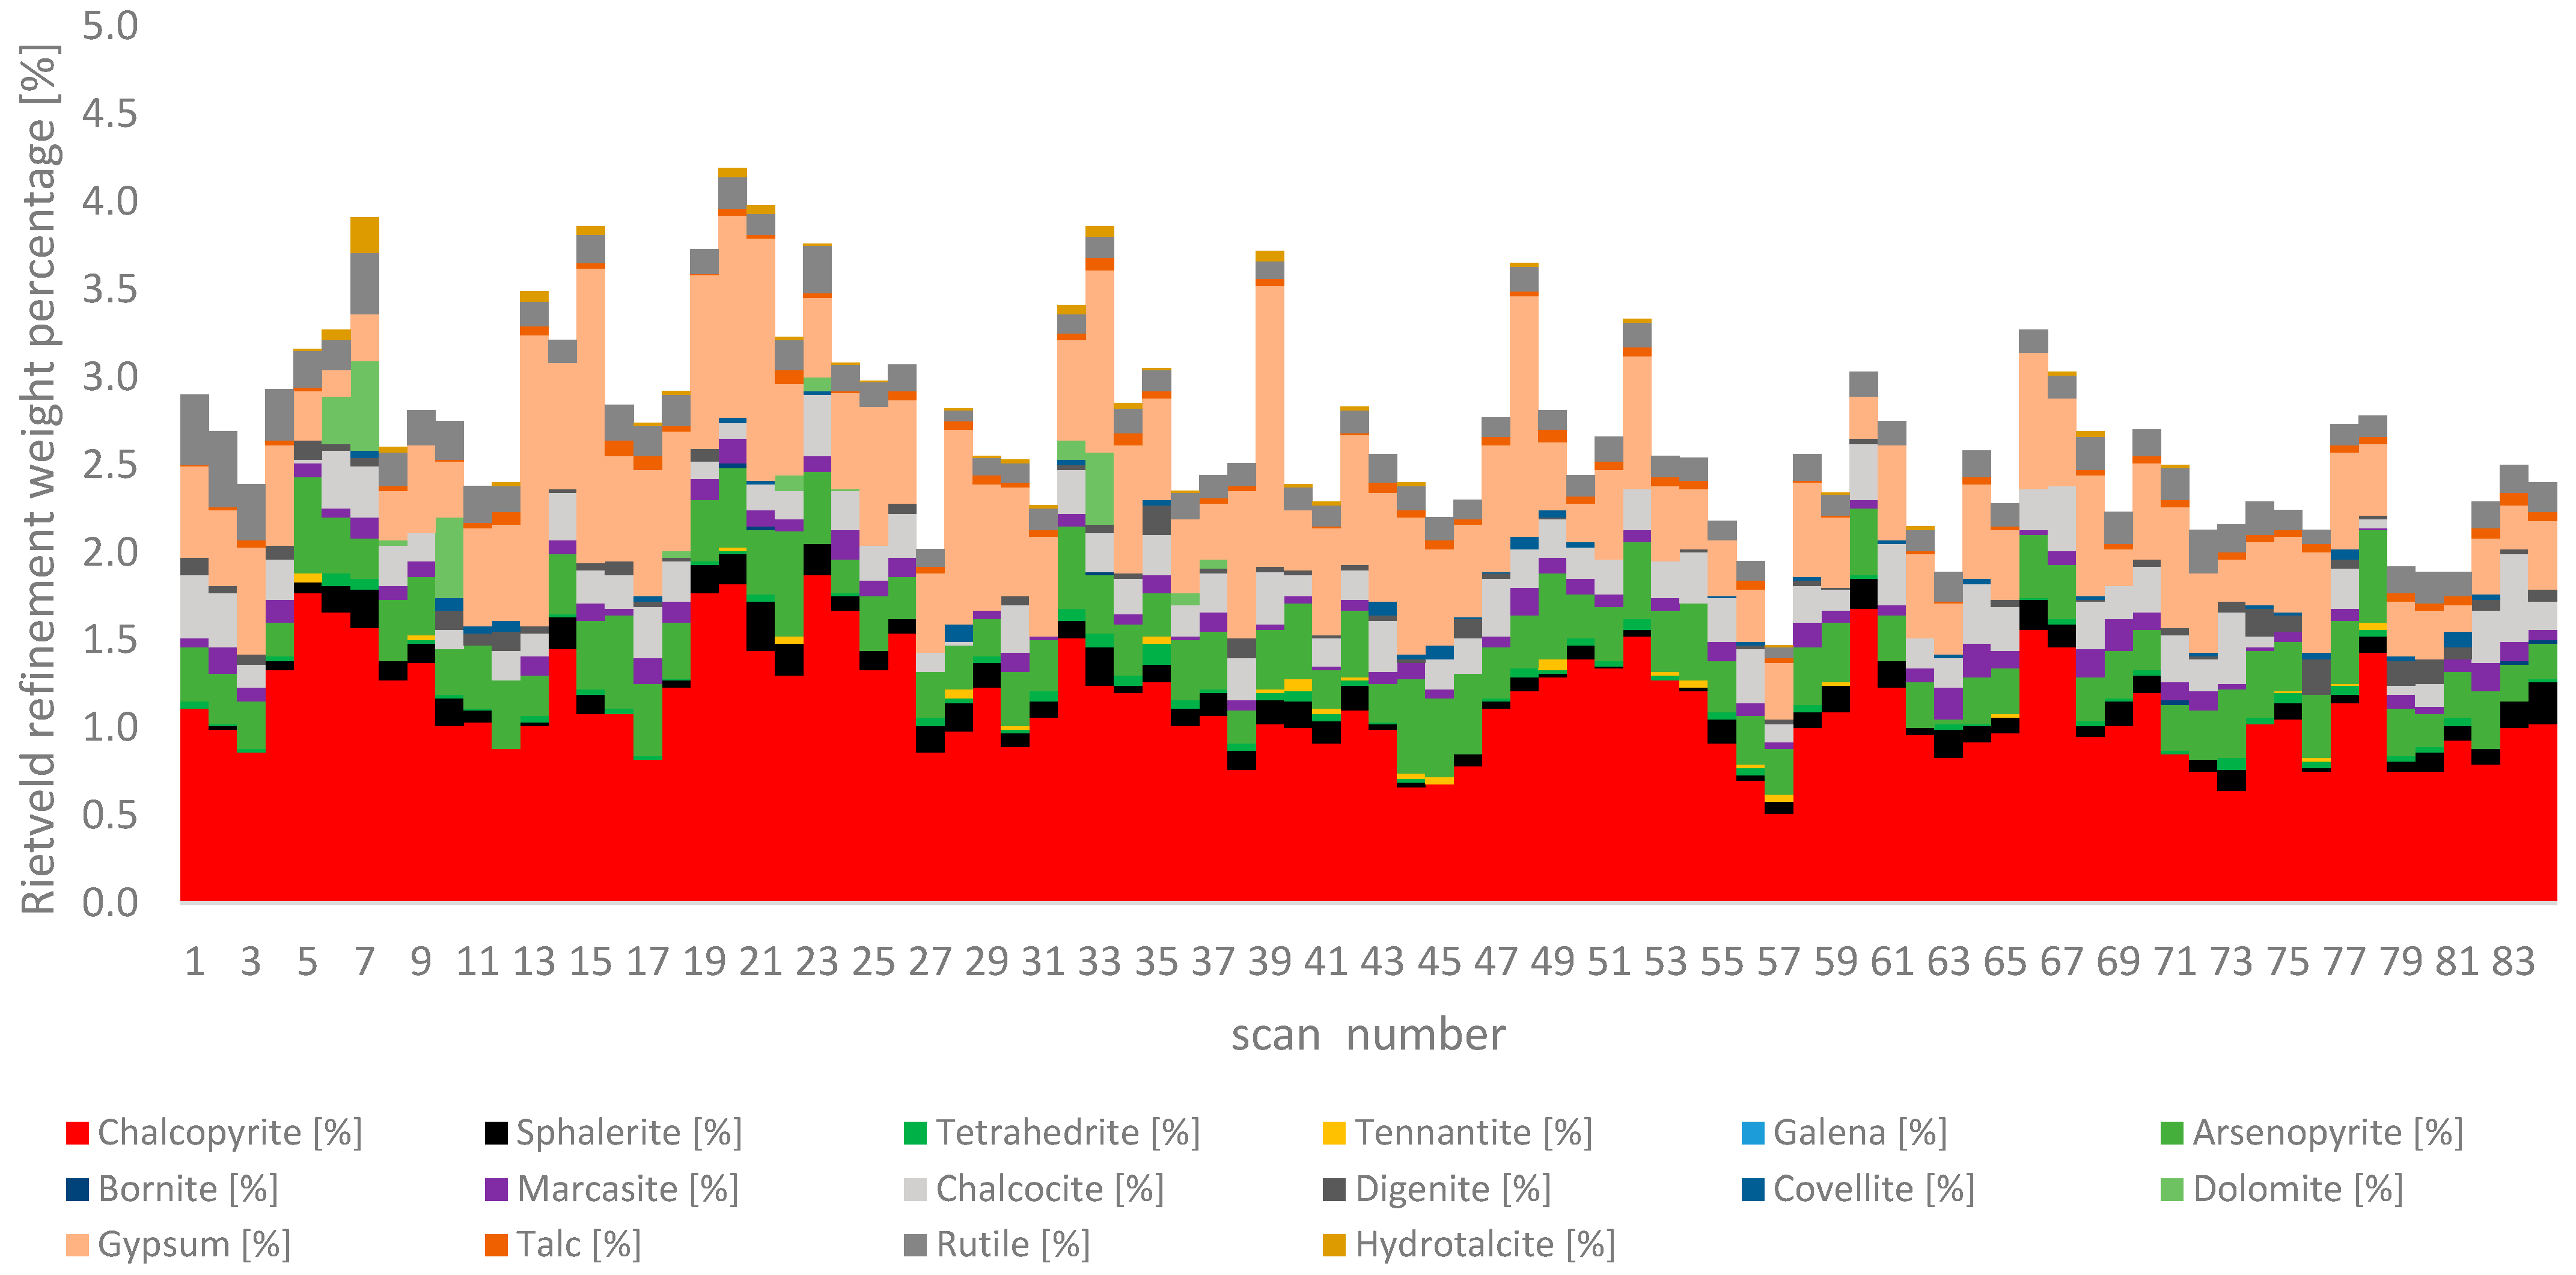
The visualization of the Rietveld results of different ore blends over time allows the plants to assess and control the mineral variability of the feed used in the flotation cell. The most prominent difference in the ore blends is the type of gangue mineralogy, characterized by the amount of pyrite and chamosite, Figure 5. The flotation parameters, the surfactant selection and surfactant amount can therefore be optimized based on such quantities. The variation over time of the chalcopyrite content as well as other relevant minerals included in the Rietveld analysis is shown in Figure 6. Chalcopyrite is the main copper ore mineral and it varies between 0.5 wt% and 1.9 wt%, which is well above the limit of detection, see Figure 3. The limit of detection is approximately 120 net counts, as calculated from LOD = [3 ∗ net intensity ∗ (background)−0.5] [13]. A SNR > 10 is the minimum prerequisite to accurately quantify a mineral in a mixture. The accuracy of the Rietveld results depends also on (1) particles statistic, (2) degree of overlap with peaks from other phases, (3) preferential orientation, (4) overgrinding and (5) microabsorption.
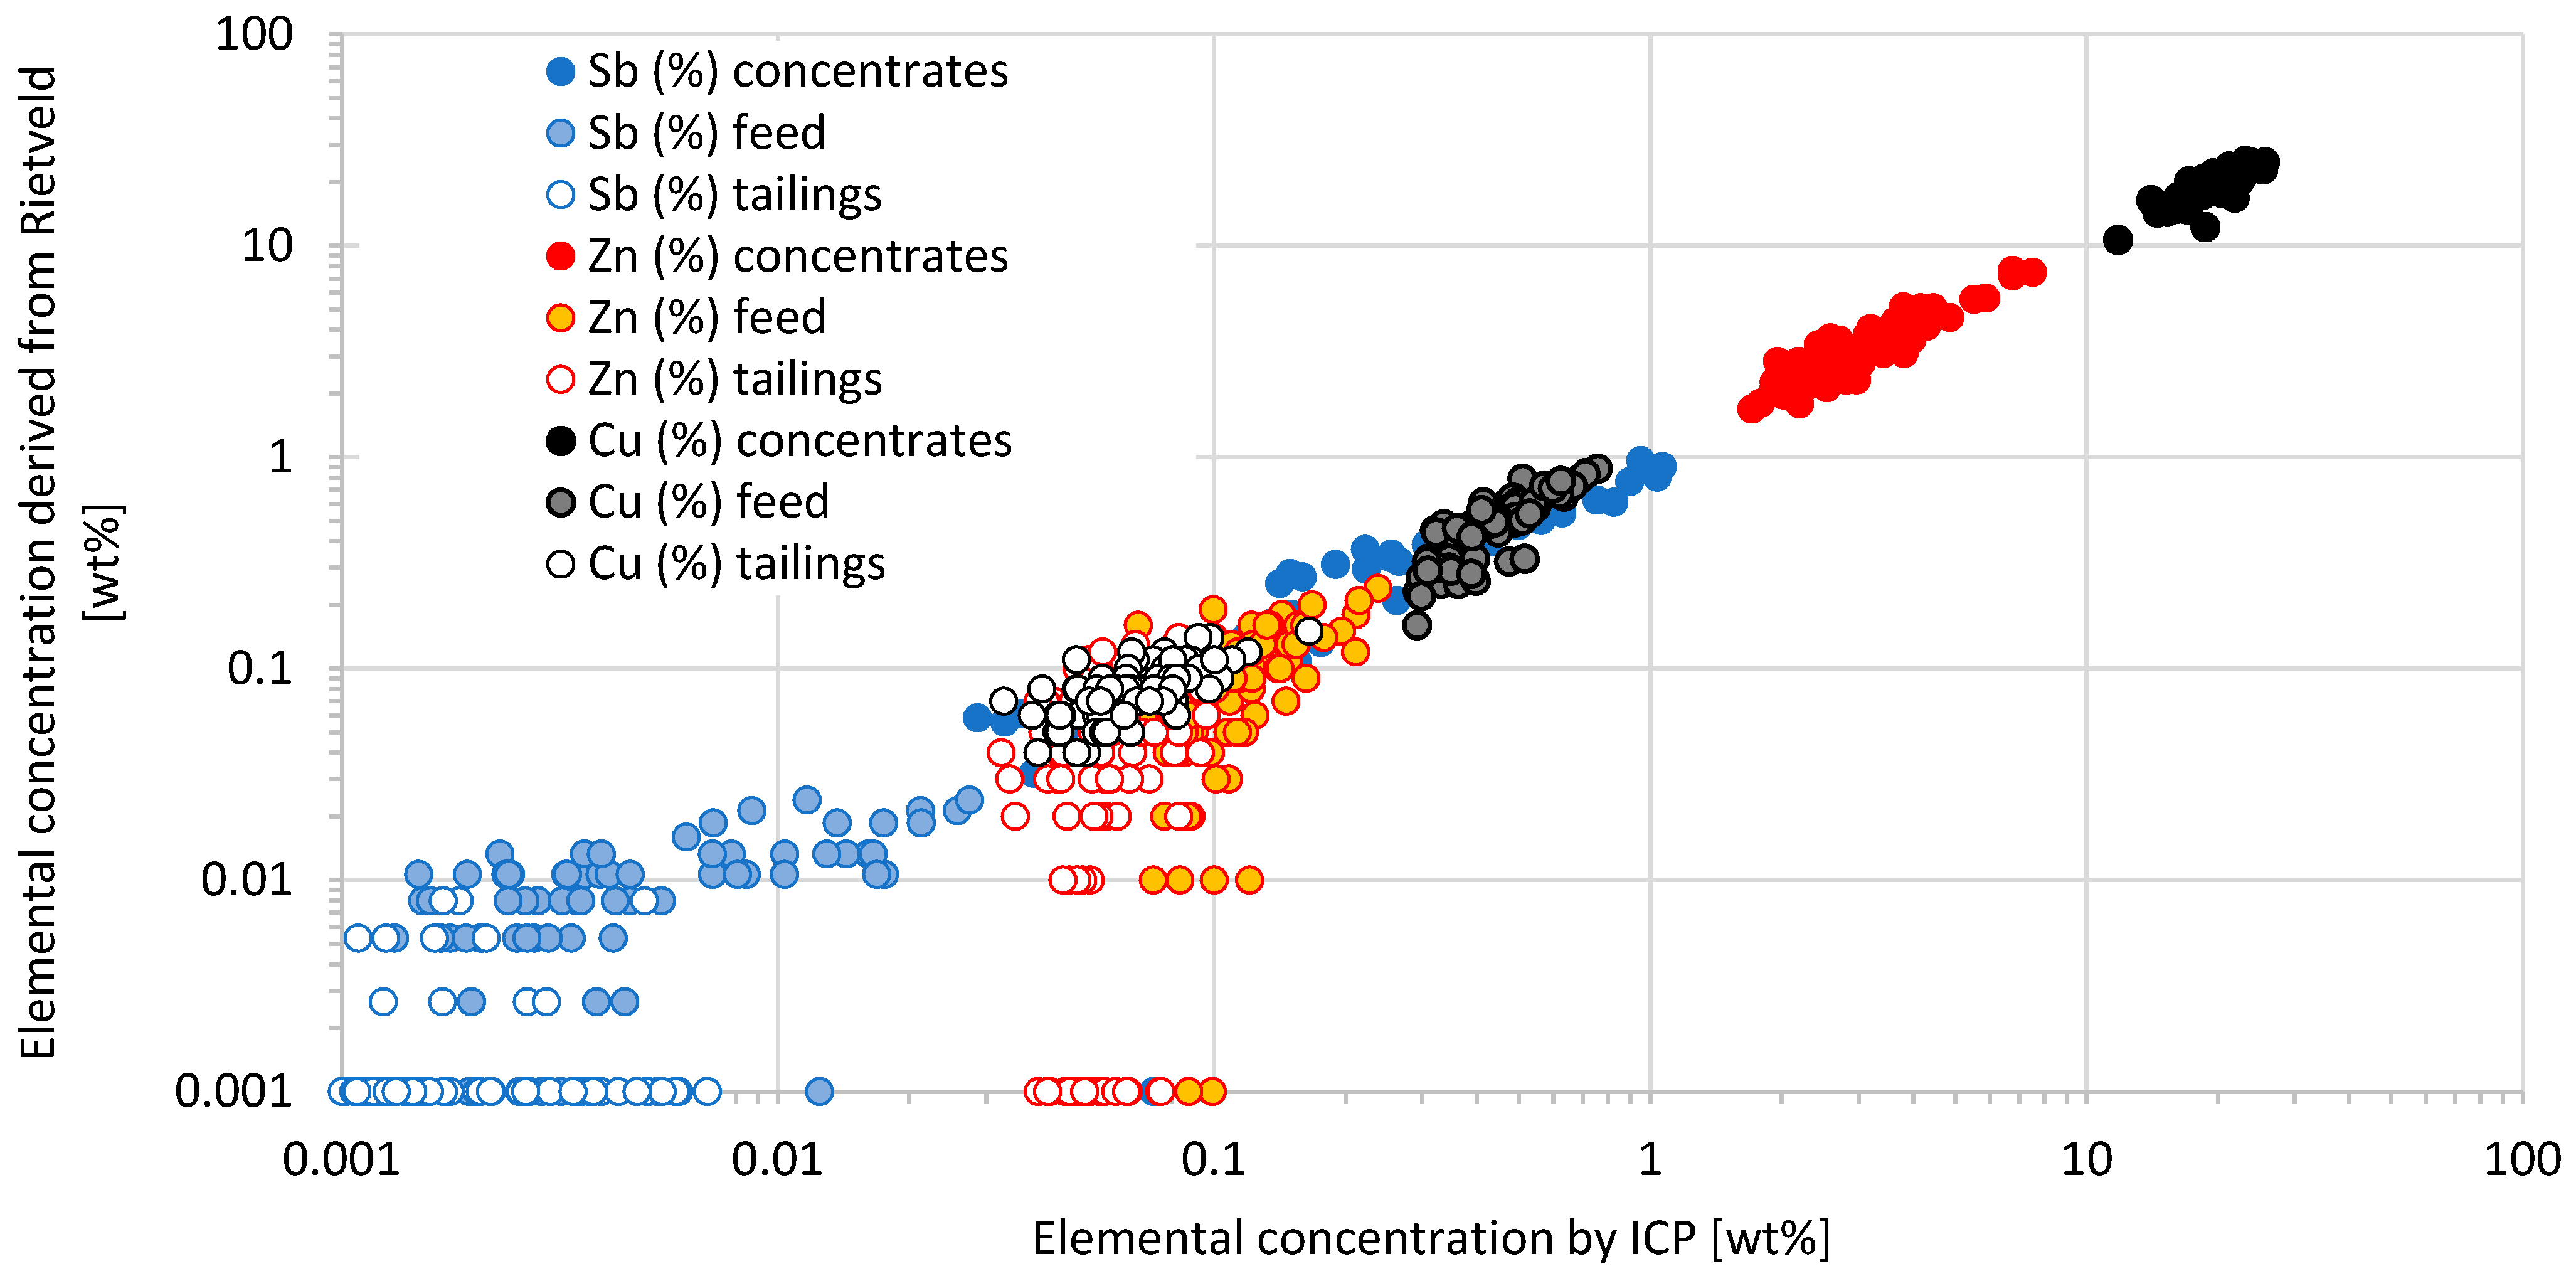
The accuracy of the XRD results was verified for all 265 materials by comparing the elemental composition calculated from the Rietveld refinements with the ICP values, see Figure 7. The elemental composition of copper, zinc and antimony can be fitted with straight lines which give, respectively, R2 values of 0.99, 0.98 and 0.96, and slope values of 0.99, 1.05 and 0.94. The automatic Rietveld analysis gave accurate results with precision that depends on the mineral species and their concentrations. For instance, the precision of zinc calculated from Rietveld greatly decreases when the zinc content is below 0.2 wt%, which corresponds to a sphalerite concentration of 0.3 wt%, Figure 7. The relatively higher LOD of sphalerite is due to its strong overlap with pyrite diffraction peaks.
Deviation from expected results can be attributed to incorrect Rietveld structural models and refinement strategy, but most importantly, on sample preparation. The materials in this study are highly complex as they contain hard minerals, such as quartz and pyrite, and soft minerals, such as phyllosilicates, sphalerite and chalcopyrite. The mass absorption coefficient of pyrite is almost twice the value of quartz; therefore, microabsorption effects are likely to affect the analysis if samples are not properly ground. Vice versa, when samples are overly ground, the soft minerals can be partially amorphized. The disc mill used in this study has its disadvantages and advantages: it can affect sample crystallinity due to high energy impacts, but it fastens sample preparation operations, which can be integrated in a fully automated laboratory for quality control purposes. The use of dedicated XRD sample preparation procedures (milling and pressing parameter) and optimized data collection strategies can further improve the quantification of crystalline phases, including secondary copper minerals.
3.4. Statistical Methods—Principal Component Analysis (PCA): Clustering of Copper Concentrates
An alternative and powerful method to study the major minerals trends is the cluster analysis. In this example, the copper concentrate scans are grouped into clusters which are then visualized using Principal Component Analysis. During cluster analysis, the proprietary search-match algorithm of HighScore compares all the XRD scans and calculates a correlation matrix. The three principal components of the PCA substitute the 3300 datapoints of each XRD scan and they explain the majority of variance in the correlation matrix.
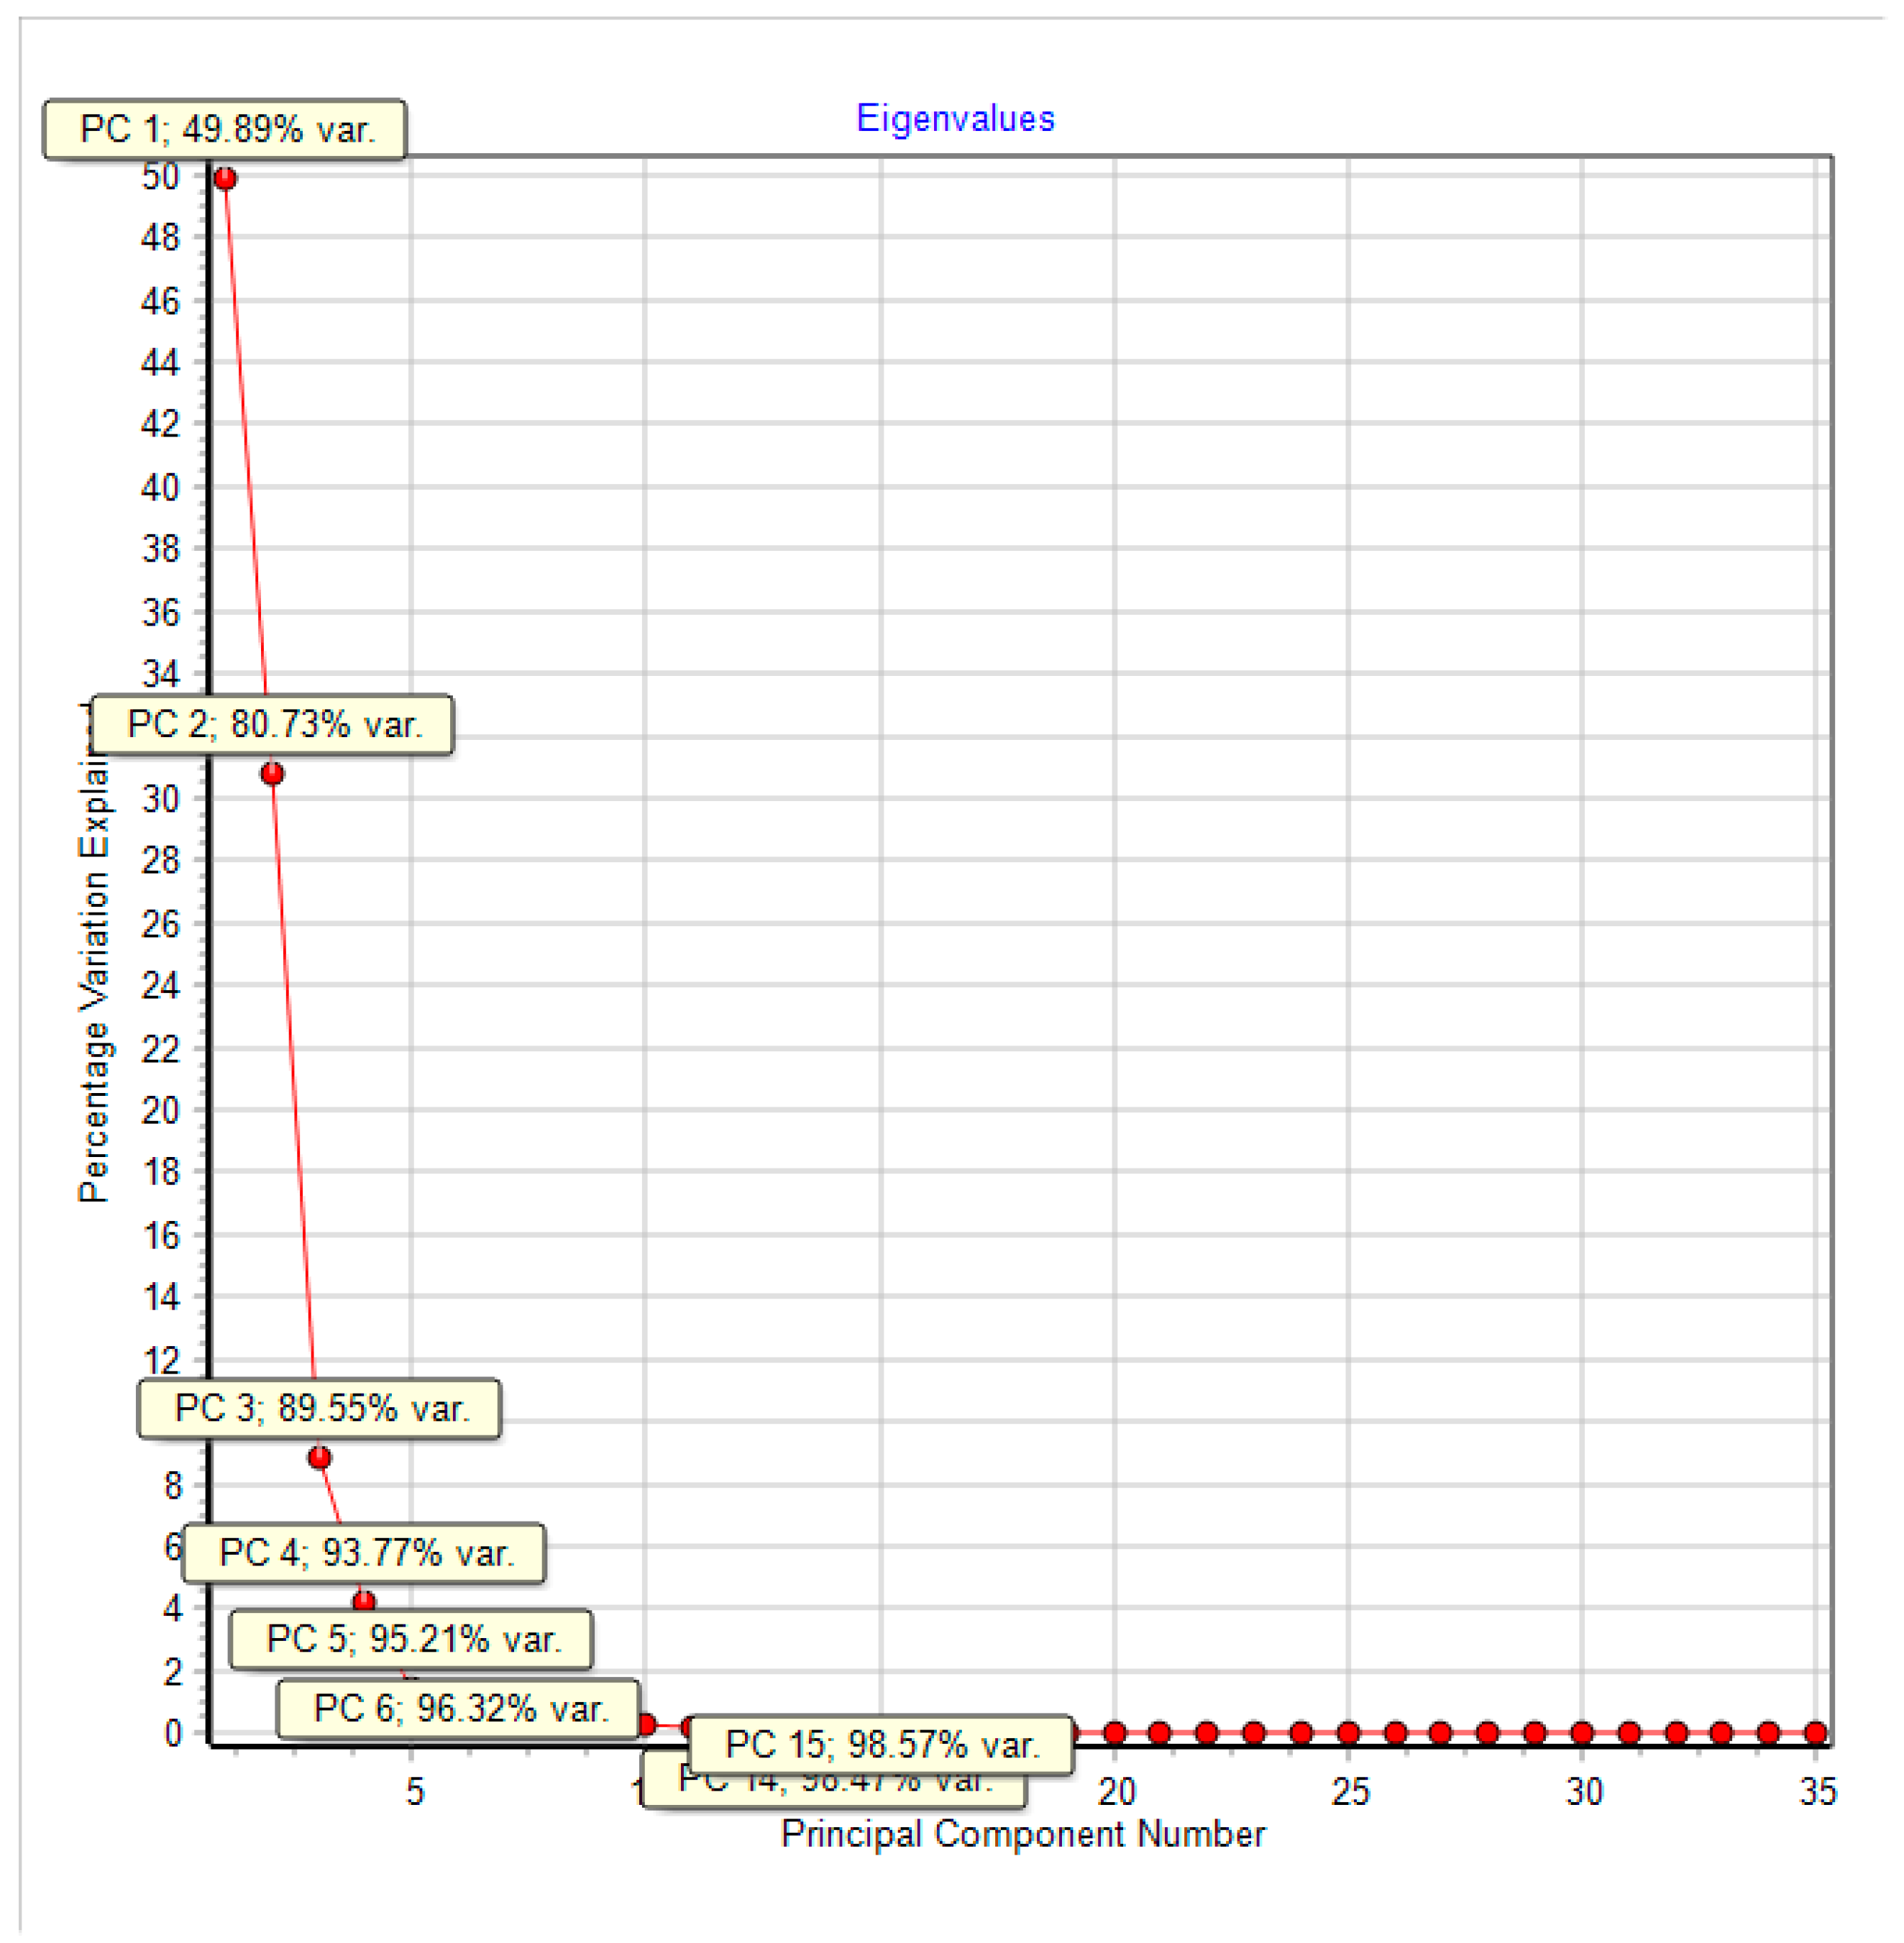
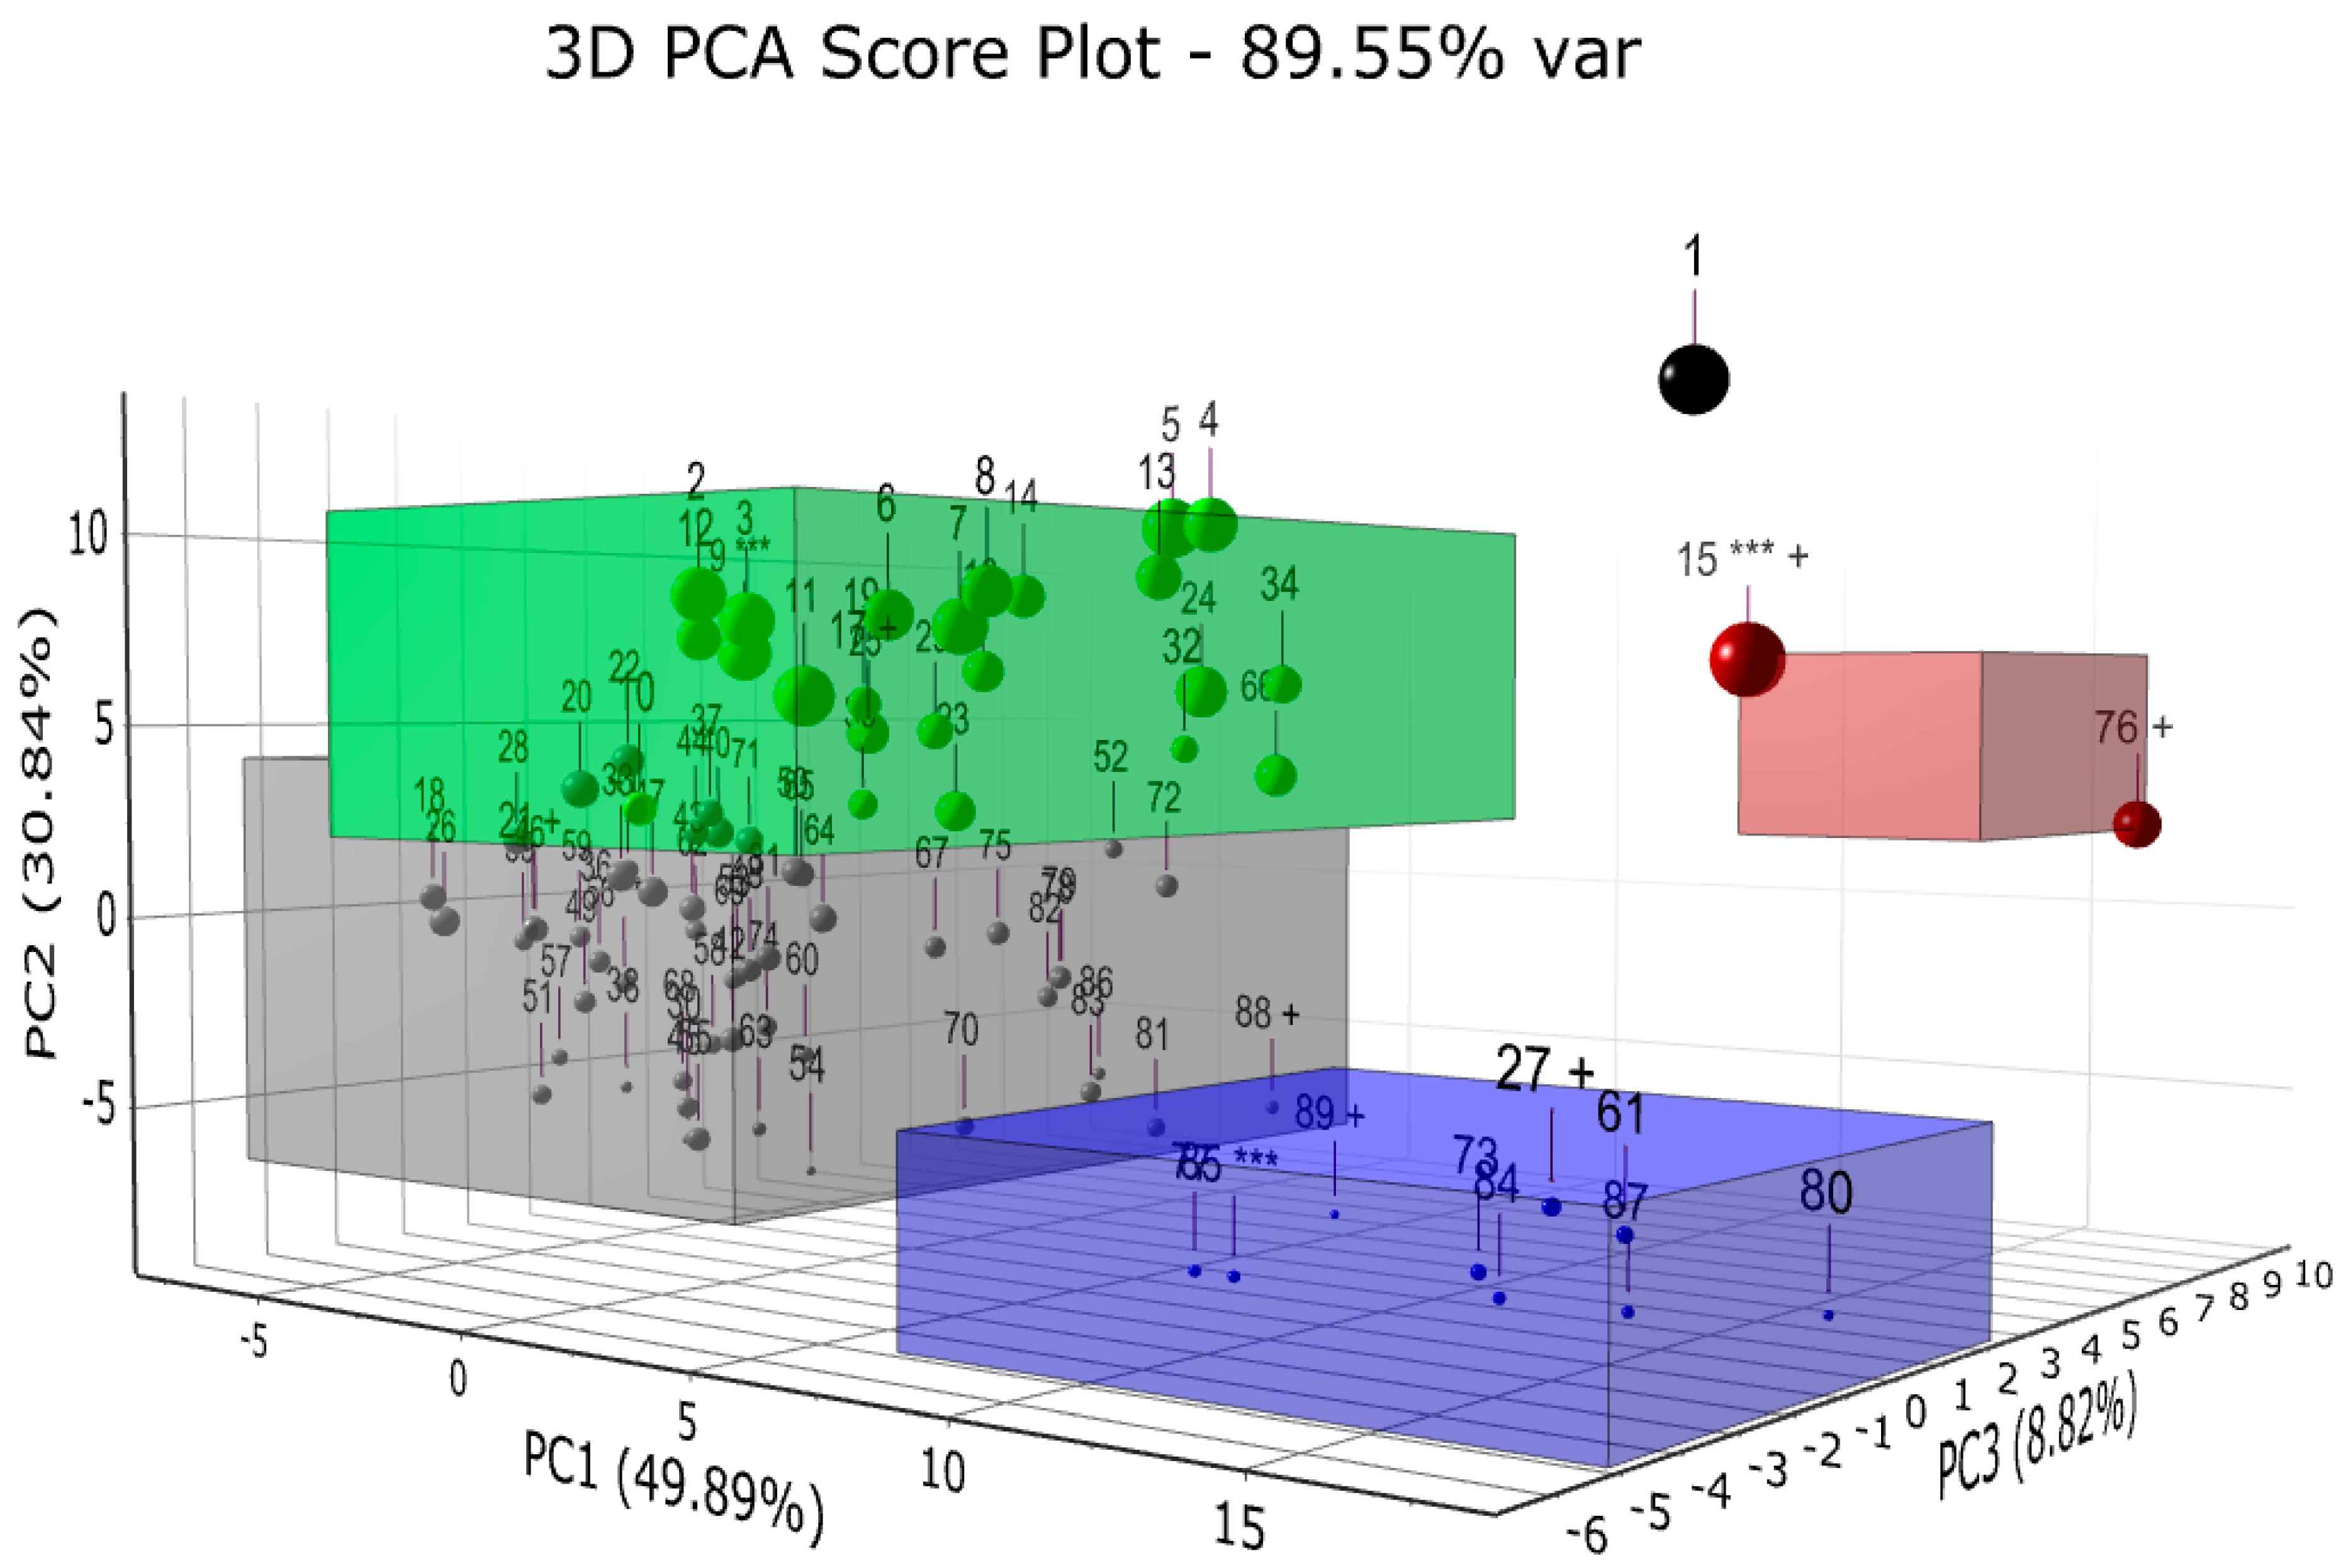
The first, second and third principal component explain, respectively, 50%, 31% and 9% of the variance, see the eigenvalue plot in Figure 8. In total, 89.55% of the variance of the correlation matrix is described in the PCA plot in Figure 9. The 90 different copper concentrates can be grouped into four major clusters plus an outlier that could not be grouped into any of the four clusters. The size of each marker is proportional to the pyrite content as determined by Rietveld refinement. The PCA plot shows that the pyrite content varies along the second principal component of the PCA plot. Each cluster has specific mineralogical properties; Table 3 focuses on the main differences among the clusters. The blue and gray cluster are the richest in chalcopyrite, but the blue cluster is higher in quartz and chamosite and lower in pyrite. The green and brown clusters are progressively richer in pyrite and poorer in chalcopyrite. Finally, the one outlier has a composition similar to the brown cluster, but it has a significant amount of secondary copper minerals, such as digenite Cu9S5 and covellite CuS.
The XRD scans and the cluster algorithm parameter can be saved and used in the future to automatically classify an unknown material based on which cluster it belongs to. With such information, the processing plant can quickly and automatically decide if and where a copper concentrate needs to be further processed, blended and stored.
3.5. Statistical Methods—Partial Least Squares Regression (PLSR): Predicting Antimony in Copper Concentrates
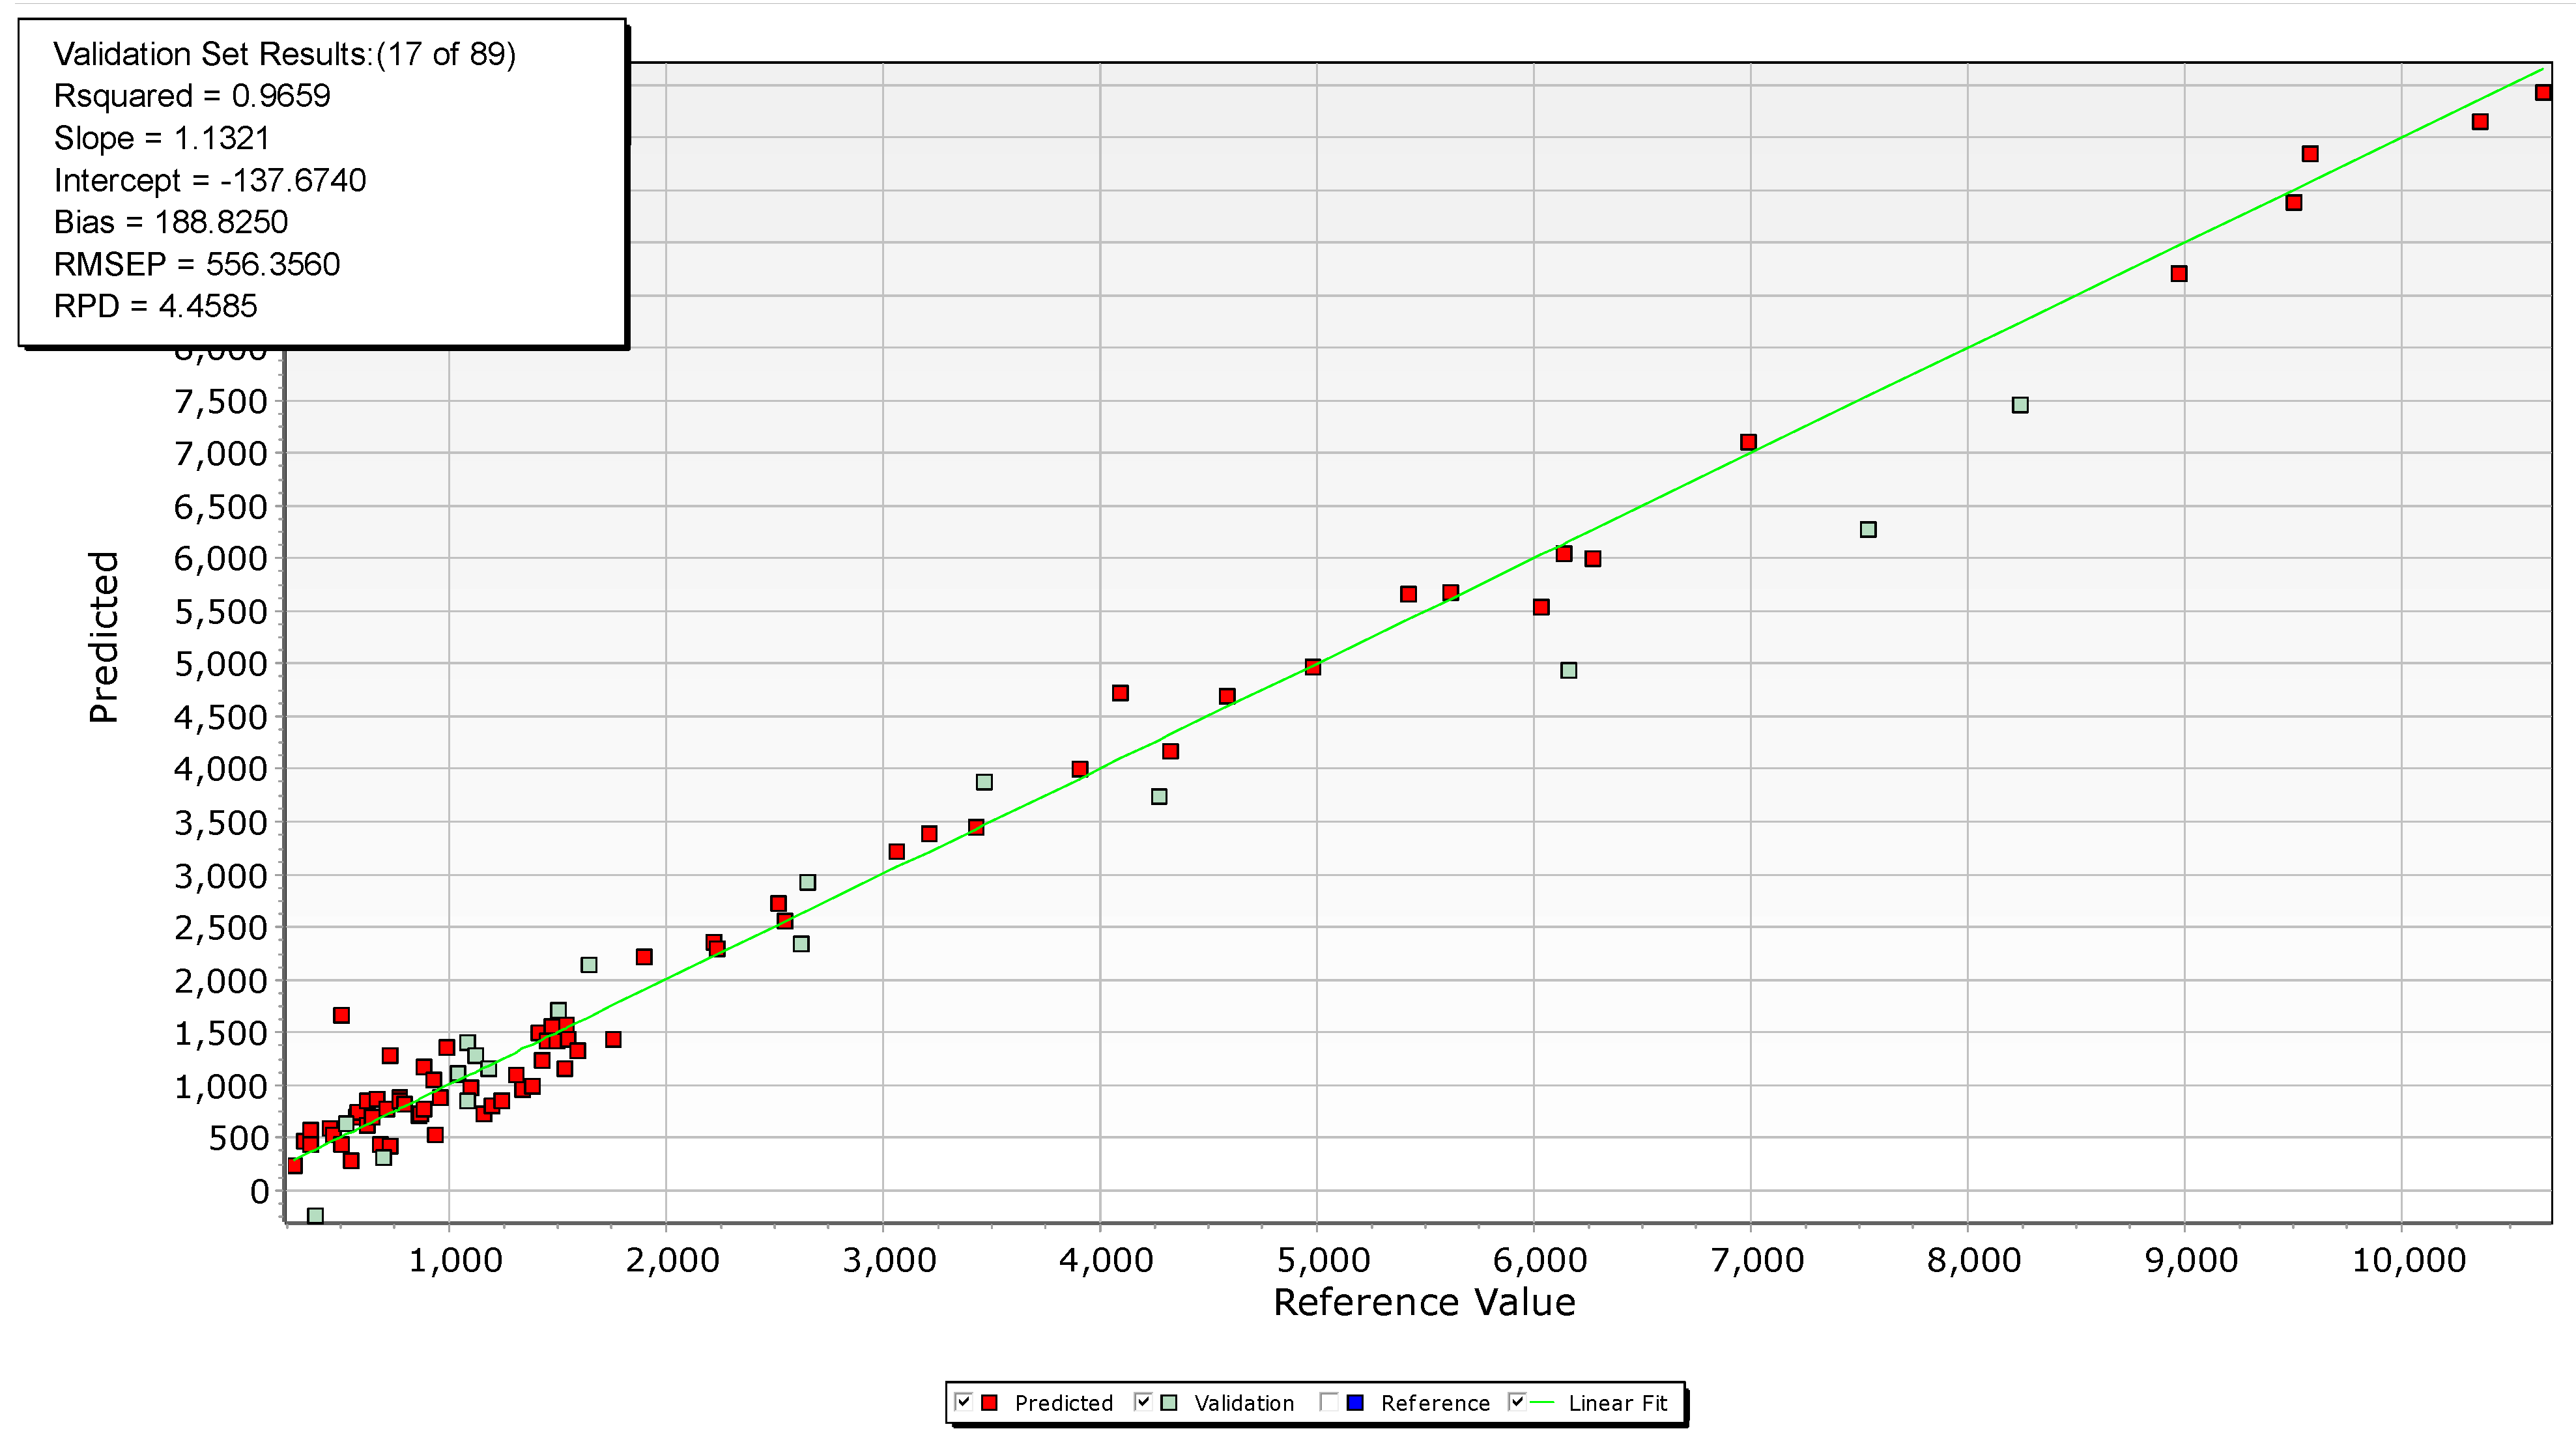
Essential information for the mining process can also be extracted from the raw XRD scans by training the SIMPLS algorithm (statistically inspired modification of the partial least squares) [14] implemented in HighScore Plus. The algorithm belongs to the data mining method of partial least square regression. In this example, the training values of antimony content in the concentrates were provided by ICP chemical analysis. Since PLSR is a statistical method, several scans are needed to obtain a reliable PLSR calibration file. Here, we used 72 XRD scans for building the model and 17 XRD scans, i.e., 20% of the scans, to cross-calibrate the model (Figure 10). The latter were used to calculate the Root Mean Square Error of Prediction RMSEP = 556 ppm, which represents 1σ standard deviation of the predicted values. The PLSR model can then be used to estimate the antimony concentration of unknown samples without the need of Rietveld refinement, especially for copper concentrates with antimony concentration between 287 ppm and 10,650 ppm, the concentration range of the training values.
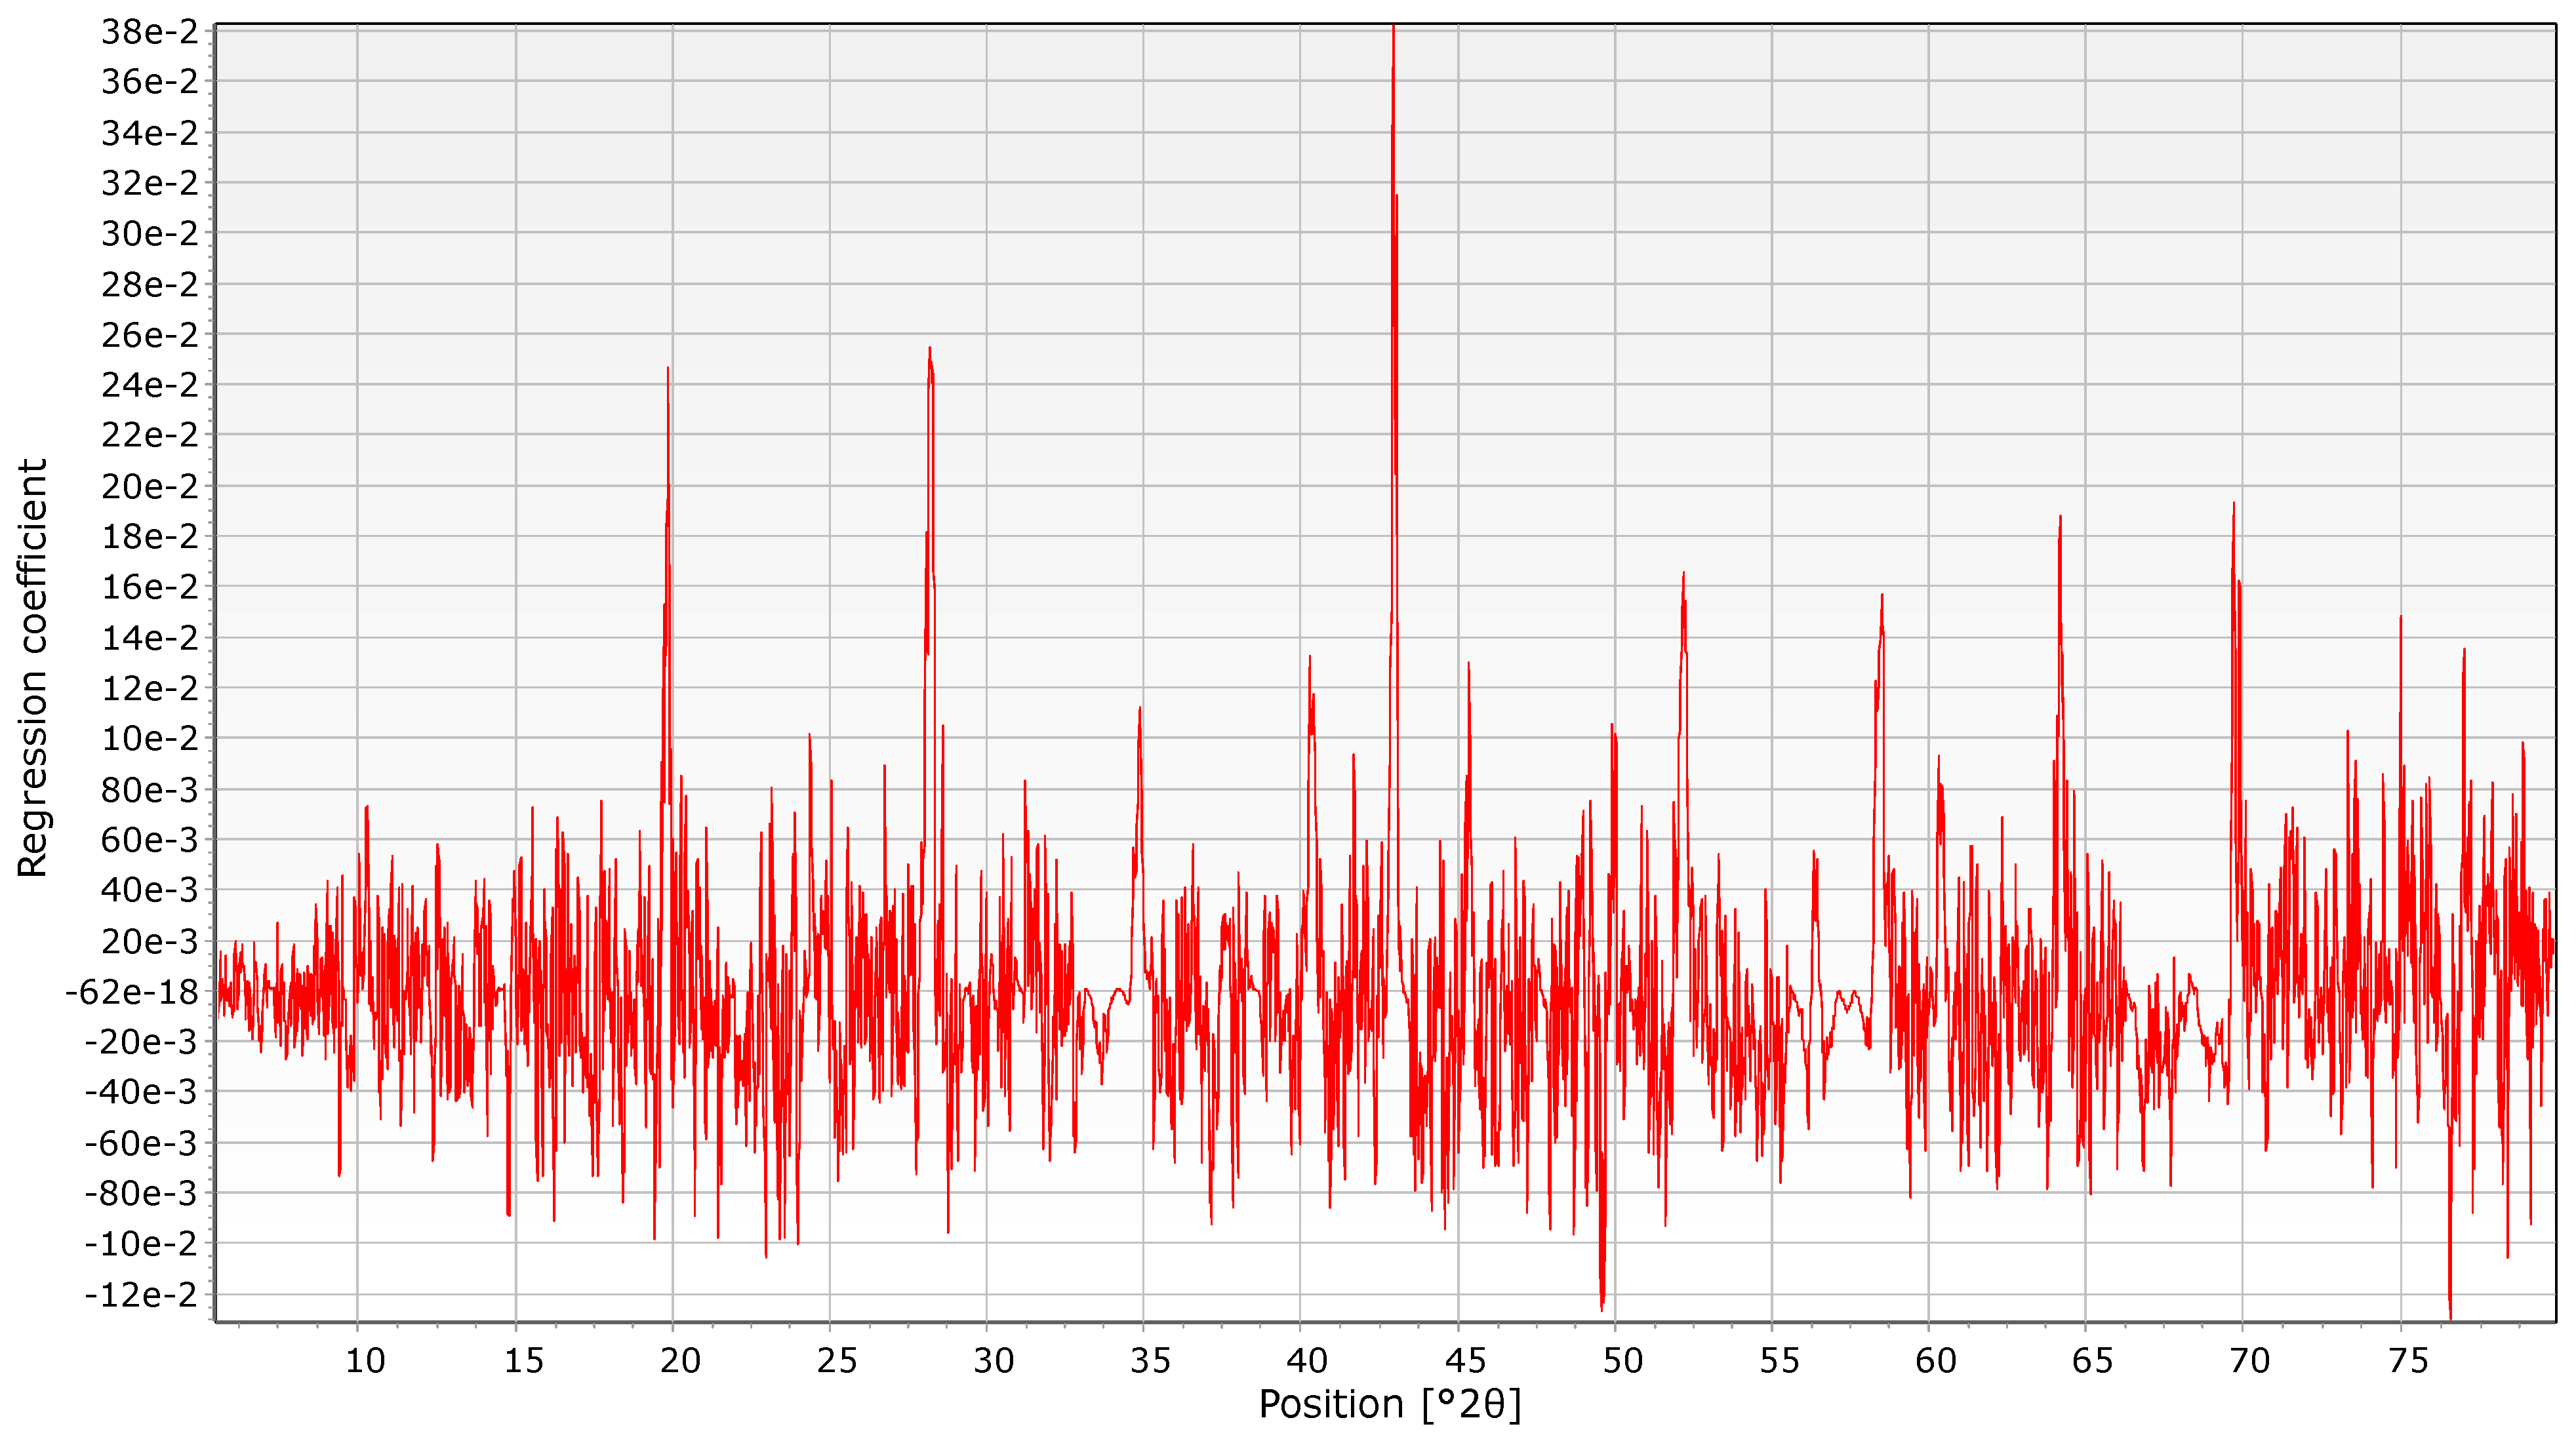
Several evaluation plots are available to assess the calibration model as well as extracting further information from the raw data. For instance, in Figure 11, the regression coefficients vs °2θ plot reveals the diffraction angles ranges most useful to build the PLSR calibration model. The regression coefficient has large values (>0.02) at the °2θ values of the tetrahedrite peaks, Table 4. As expected, this shows that the tetrahedrite is the main carrier of Sb in the analyzed samples. Such information was not accessible by wet chemistry or by Rietveld refinement alone and can be used to select the right surfactant to depress this mineral species. The comparison of the regression coefficient in Figure 11 with the relative peak intensity I[%] of tetrahedrite in Table 4 reveals how the PLSR model considers both the diffraction peak intensities as well as their degree of overlap with other phases. For instance, the less intense but isolated 2θ = 28.2° peak, has a higher coefficient than the main peak at 2θ = 34.7°, partially overlapping with the chalcopyrite peak at 2θ = 34.3° (Figure 4).
4. Discussion
In this study, we demonstrated the fast and accurate mineralogical monitoring of copper ore blends, tailing and concentrates. The fully automatable XRD analysis and Rietveld refinement of the Minerals Edition of Aeris provides both mineralogical overviews and precious details throughout the entire copper process, from exploration to final products. Such information is accessible to non-expert users and can be easily visualized on screen or stored into a LIMS system. Hard minerals, such as quartz, should be monitored to increase the lifetime of crushing and milling equipment. The type of copper bearing minerals (such as chalcopyrite, digenite and covellite) allows a better selection of collectors in the flotation process. Similarly, the correct depressant and suspension chemistry should be selected to suppress the flotation of a minerals bearing penalty elements, such as tetrahedrite, which contains antimony.
Accurate quantitative mineralogical analysis is not the only added value of XRD. If the minerals carry information of specific properties of a material, the information can also be extracted using algorithms other than Rietveld. Clustering and predictive tools, such as PCA and PLSR, add further possibilities to process control and allow mineral processing engineers and scientist to collect invaluable insights. In this work, these two analysis techniques were evaluated and compared with classical Rietveld results. They can be even easier to use than crystallographic information and Rietveld experience is not needed.
PCA analysis is particularly useful for qualitative or discriminatory analysis, as well as to simplify the classification problem of complex high dimensional data. As the higher-grade deposits are depleted, there is an increasing need to beneficiate more challenging ore bodies. XRD and PCA can be used to mix different ore grades to an optimal blend, adapt the downstream process and increase recovery [15]. Cluster analysis can be used to identify samples which best describe groups of materials and it reduces the time spent by staff performing manual analysis. The representative scans of each cluster as well as the most diverse scans within each cluster are automatically calculated. PCA can also quickly identify outliers: samples with peculiar mineralogical composition or badly prepared and mislabeled specimens. Therefore, PCA can fasten and improve the process of data cleaning before further processing the data.
Thanks to the modern detectors and diffractometers, it is easy and cheap to collect tens of training sets to build PLSR calibration models. The implementation of such models on the Aeris extracts indirect properties from the raw XRD data, such as their chemistry or more complex quantities, such as process-relevant parameters [16]. In general, any physical or chemical quantity with a high degree of correlation with the mineralogical composition of the material can be estimated using PLSR. Therefore, XRD and PLSR can replace more time- and cost-consuming analytical techniques, such as wet chemistry.
In conclusion, X-ray diffraction (XRD) is an essential tool for mineralogical analysis and it can be easily implemented in process environments to improve mine operations and save costs.
Author Contributions
Conceptualization, M.P., Á.L., D.D., U.K. and N.N.; Data curation, M.P. and M.M.; Formal analysis, M.P. and N.N.; Investigation, M.P., D.D. and M.M.; Methodology, M.P. and M.M.; Project administration, D.D.; Resources, Á.L. and U.K.; Supervision, D.D. and U.K.; Validation, M.M.; Writing—original draft, M.P.; Writing—review & editing, D.D., U.K. and N.N. All authors have read and agreed to the published version of the manuscript.
Funding
This research received no external funding.
Data Availability Statement
All data were gathered at Atalaya Mine Plc. laboratories at Minas de Riotinto (Spain) and treated at Malvern Panalytical B.V laboratories in Almelo (The Netherlands).
Acknowledgments
The support of Solvay, Atalaya Mining and Malvern Panalytical management for allowing this project is gratefully acknowledged.
Conflicts of Interest
The authors declare no conflict of interest.
References
- Gleisberg, D. Mineral Commodity Summaries; Government Printing Office: District of Columbia, WA, USA, 2021; Volume 3. [CrossRef]
- Leja, J. Surface Chemistry of Froth Flotation; Springer: Boston, MA, USA, 1981. [Google Scholar] [CrossRef]
- Rietveld, H.M. Line Profiles of Neutron Powder-Diffraction Peaks for Structure Refinement. Acta Crystallogr. 1967, 22, 151–152. [Google Scholar] [CrossRef]
- Paine, M.; König, U.; Staples, E. Application of Rapid X-Ray Diffraction (Xrd) and Cluster Analysis to Grade Control of Iron Ores. In Proceedings of the 10th International Congress for Applied Mineralogy (ICAM); Springer: Berlin/Heidelberg, Germany, 2012; pp. 495–501. [Google Scholar] [CrossRef]
- König, U.; Norberg, N.; Gobbo, L. From Iron Ore to Iron Sinter—Process Control Using X-Ray Diffraction (XRD). In Anais dos Seminários de Redução, Minério de Ferro e Aglomeração; Editora Blucher: São Paulo, Brazil, 2017; pp. 146–153. [Google Scholar] [CrossRef] [Green Version]
- König, U.; Degen, T.; Norberg, N. PLSR as a New XRD Method for Downstream Processing of Ores:—Case Study: Fe2+ Determination in Iron Ore Sinter. In Powder Diffraction; Cambridge University Press: Cambridge, UK, 2014; Volume 29, pp. S78–S83. [Google Scholar] [CrossRef]
- König, U.; Gobbo, L.; Reiss, C. Quantitative XRD for Ore, Sinter, and Slag Characterization in the Steel Industry. In Proceedings of the 10th International Congress for Applied Mineralogy (ICAM); Springer: Berlin/Heidelberg, Germany, 2012; pp. 385–393. [Google Scholar] [CrossRef]
- Galluccio, S.; Pöllmann, H. Quantifications of Cements Composed of OPC, Calcined Clay, Pozzolanes and Limestone. In RILEM Bookseries; Springer: Berlin/Heidelberg, Germany, 2020; Volume 25, pp. 425–442. [Google Scholar] [CrossRef]
- Tornos, F. Environment of Formation and Styles of Volcanogenic Massive Sulfides: The Iberian Pyrite Belt. Ore Geol. Rev. 2006, 28, 259–307. [Google Scholar] [CrossRef]
- Degen, T.; Sadki, M.; Bron, E.; König, U.; Nénert, G. The High Score Suite. In Powder Diffraction; Cambridge University Press: Cambridge, UK, 2014; Volume 29, pp. S13–S18. [Google Scholar] [CrossRef] [Green Version]
- Gates-Rector, S.; Blanton, T. The Powder Diffraction File: A Quality Materials Characterization Database. Powder Diffr. 2019, 34, 352–360. [Google Scholar] [CrossRef] [Green Version]
- Rietveld, H.M. A Profile Refinement Method for Nuclear and Magnetic Structures. J. Appl. Crystallogr. 1969, 2, 65–71. [Google Scholar] [CrossRef]
- Shrivastava, A.; Gupta, V. Methods for the Determination of Limit of Detection and Limit of Quantitation of the Analytical Methods. Chronicles Young Sci. 2011, 2, 21. [Google Scholar] [CrossRef]
- De Jong, S. SIMPLS: An Alternative Approach to Partial Least Squares Regression. Chemom. Intell. Lab. Syst. 1993, 18, 251–263. [Google Scholar] [CrossRef]
- Lance, G.N.; Williams, W.T. A General Theory of Classificatory Sorting Strategies: 1. Hierarchical Systems. Comput. J. 1967, 9, 373–380. [Google Scholar] [CrossRef] [Green Version]
- König, U. Process Monitoring for Iron Ore Pelletizing—XRD in Combination with PLSR. In Iron Ore; AUSIMM: Perth, Australia, 2019; pp. 121–126. [Google Scholar]
Figure 1.
XRD scan of a flotation feed. The diffraction pattern of this feed is the representative scan as defined by the cluster analysis.
Figure 1.
XRD scan of a flotation feed. The diffraction pattern of this feed is the representative scan as defined by the cluster analysis.

Figure 2.
Characteristic XRD scans of the ore blend used as feed for the flotation cell, tailings and concentrates. XRD scans of tailings and concentrates are here vertically shifted by 3000 and 6000 counts for clarity.
Figure 2.
Characteristic XRD scans of the ore blend used as feed for the flotation cell, tailings and concentrates. XRD scans of tailings and concentrates are here vertically shifted by 3000 and 6000 counts for clarity.

Figure 3.
XRD pattern of a tailing sample with 0.16 wt% of copper in the range 26–38 °2θ. Upper curve represents measured data, lower curve in blue represents Rietveld contribution of 0.45 wt% chalcopyrite. Vertical bars are peak positions of crystalline phases.
Figure 3.
XRD pattern of a tailing sample with 0.16 wt% of copper in the range 26–38 °2θ. Upper curve represents measured data, lower curve in blue represents Rietveld contribution of 0.45 wt% chalcopyrite. Vertical bars are peak positions of crystalline phases.

Figure 4.
XRD pattern of ore concentrate in the range 26–38 °2θ. Upper curve represents measured data, lower curve in gray represents Rietveld contribution of 1.6 wt% of tetrahedrite. Vertical bars are peak positions of crystalline phases.
Figure 4.
XRD pattern of ore concentrate in the range 26–38 °2θ. Upper curve represents measured data, lower curve in gray represents Rietveld contribution of 1.6 wt% of tetrahedrite. Vertical bars are peak positions of crystalline phases.

Figure 5.
Mineralogical variability of ore blends for the major gangue minerals as determined by XRD and Rietveld refinement.
Figure 5.
Mineralogical variability of ore blends for the major gangue minerals as determined by XRD and Rietveld refinement.

Figure 6.
Mineralogical variability of ore blends for minor mineralogical phases, as determined by XRD and Rietveld refinement.
Figure 6.
Mineralogical variability of ore blends for minor mineralogical phases, as determined by XRD and Rietveld refinement.

Figure 7.
Agreement between chemical compositions obtained from ICP and Rietveld refinement. Zero values obtained by Rietveld are set to 0.001 for graphical purpose.
Figure 7.
Agreement between chemical compositions obtained from ICP and Rietveld refinement. Zero values obtained by Rietveld are set to 0.001 for graphical purpose.

Figure 8.
Eigenvalues plot explaining how the data variance is described by the most relevant principal components (PCs).
Figure 8.
Eigenvalues plot explaining how the data variance is described by the most relevant principal components (PCs).

Figure 9.
Principal Components Analysis plot of XRD scans of copper concentrates. Each scan is represented by a sphere with a radius proportional to its pyrite content. The four clusters and the one outlier are visualized in different colors. *** representative XRD scan of each cluster, + most different XRD scans within a cluster.

Figure 10.
PLSR plot of predicted values and reference values of antimony concentration in copper concentrates. The plot contains both training and validation data of the model.
Figure 10.
PLSR plot of predicted values and reference values of antimony concentration in copper concentrates. The plot contains both training and validation data of the model.

Figure 11.
PLS regression coefficients for antimony concentration in concentrates. The coefficients identify the parts of the diffractogram contributing most to the PLSR regression model.
Figure 11.
PLS regression coefficients for antimony concentration in concentrates. The coefficients identify the parts of the diffractogram contributing most to the PLSR regression model.


Table 1.
Average chemical composition of the available samples. #Samples represents the number of XRD samples analyzed per each material type.
Table 1.
Average chemical composition of the available samples. #Samples represents the number of XRD samples analyzed per each material type.
| Material Type | #Samples | Cu (%) | S (%) | Zn (%) | Pb (ppm) | Fe (%) | As (ppm) | Sb (ppm) | Bi (ppm) |
|---|---|---|---|---|---|---|---|---|---|
| Blends | 87 | 0.46 | 5.11 | 0.11 | 157 | 12.3 | 190 | 58 | 29 |
| Tailings | 88 | 0.07 | 4.58 | 0.06 | 115 | 11.98 | 178 | 17 | 26 |
| Concentrates | 90 | 20.33 | 35.90 | 3.26 | 2800 | 30.36 | 1260 | 2443 | 230 |
Table 2.
Average weight percentages of major minerals as determined by Rietveld refinements. The mineral variability within the same material type is reported as the absolute standard deviation (1σ) in between brackets.
Table 2.
Average weight percentages of major minerals as determined by Rietveld refinements. The mineral variability within the same material type is reported as the absolute standard deviation (1σ) in between brackets.
| Material | Agreements Index | Minerals Quantification (wt%) | ||||||||
|---|---|---|---|---|---|---|---|---|---|---|
| Cu and Zn Bearing Minerals | Gangue | |||||||||
| Rwp | GOF | Chalcopyrite | Sphalerite | Tetrahedrite | Pyrite | Quartz | Chamosite | Muscovite | Siderite | |
| Blends | 7 (1) | 3.4 (0.4) | 1.1 (0.3) | 0.1 (0.1) | 0.0 (0.0) | 5 (2) | 53 (4) | 30 (5) | 6 (2) | 0.8 (0.6) |
| Tailings | 7 (1) | 3.5 (0.5) | 0.2 (0.1) | 0.0 (0.0) | 0.0 (0.0) | 5 (2) | 53 (5) | 31 (6) | 6 (2) | 0.8 (0.3) |
| Concent. | 3.5 (0.4) | 2.2 (0.2) | 55 (8) | 5.1 (1.6) | 0.9 (0.8) | 24 (9) | 4 (2) | 4 (2) | 0.2 (0.2) | 0.9 (0.3) |
Table 3.
Average weight percentages of selected minerals of different clusters of copper concentrate, as determined by Rietveld refinements. The mineral variability within the same cluster is reported as the standard variation in between brackets. #Samples represents the number of samples included in each cluster.
| Cluster Color | #Samples | Cluster Features | Minerals Quantification [wt%] | |||
|---|---|---|---|---|---|---|
| Chalcopyrite | Pyrite | Quartz | Chamosite | |||
| Blue Cluster | 9 | High CuFeS2/Low FeS2 | 60 (7) | 12 (2) | 10 (2) | 6 (1) |
| Gray Cluster | 53 | High CuFeS2/Medium FeS2 | 63 (4) | 20 (4) | 4 (1) | 2 (1) |
| Green Cluster. | 25 | Medium CuFeS2/Medium FeS2 | 50 (5) | 33 (7) | 4 (1) | 1 (1) |
| Brown Cluster | 2 | Low CuFeS2/High FeS2 | 40 (13) | 45 (14) | 4 (1) | 2 (1) |
| Black Outlier | 1 | Secondary copper minerals | 35 | 45 | 3 | 1 |
Table 4.
2theta angles in the diffraction pattern of copper concentrates with the highest regression coefficient for the PLSR model of antimony, and diffraction peaks of the corresponding phase.
Table 4.
2theta angles in the diffraction pattern of copper concentrates with the highest regression coefficient for the PLSR model of antimony, and diffraction peaks of the corresponding phase.
| °2θ | Phase Assignment | H K L Miller Indexes | I [%] from 01-074-3633 |
|---|---|---|---|
| 18.9 | Tetrahedrite | 0 2 0 | 2.5 |
| 28.2 | Tetrahedrite | 0 2 2 | 7.1 |
| 34.7 | Tetrahedrite | 2 2 2 | 100 |
| 40.4 | Tetrahedrite | 0 4 0 | 21.2 |
| 42.9 | Tetrahedrite | 0 3 3 | 7.7 |
| 45.4 | Tetrahedrite | 0 4 2 | 1.6 |
| 50.0 | Tetrahedrite | 2 4 2 | 1.6 |
| 52.2 | Tetrahedrite | 1 4 3 | 6.1 |
| 58.4 | Tetrahedrite | 0 4 4 | 39.8 |
| 64.2 | Tetrahedrite | 1 6 1 | 6.3 |
| 69.7 | Tetrahedrite | 2 6 2 | 20.3 |
Publisher’s Note: MDPI stays neutral with regard to jurisdictional claims in published maps and institutional affiliations. |
© 2021 by the authors. Licensee MDPI, Basel, Switzerland. This article is an open access article distributed under the terms and conditions of the Creative Commons Attribution (CC BY) license (https://creativecommons.org/licenses/by/4.0/).
Share and Cite
MDPI and ACS Style
Pernechele, M.; López, Á.; Davoise, D.; Maestre, M.; König, U.; Norberg, N. Value of Rapid Mineralogical Monitoring of Copper Ores. Minerals 2021, 11, 1142. https://0-doi-org.brum.beds.ac.uk/10.3390/min11101142
AMA Style
Pernechele M, López Á, Davoise D, Maestre M, König U, Norberg N. Value of Rapid Mineralogical Monitoring of Copper Ores. Minerals. 2021; 11(10):1142. https://0-doi-org.brum.beds.ac.uk/10.3390/min11101142
Chicago/Turabian StylePernechele, Matteo, Ángel López, Diego Davoise, María Maestre, Uwe König, and Nicholas Norberg. 2021. "Value of Rapid Mineralogical Monitoring of Copper Ores" Minerals 11, no. 10: 1142. https://0-doi-org.brum.beds.ac.uk/10.3390/min11101142
Note that from the first issue of 2016, this journal uses article numbers instead of page numbers. See further details here.