
Experimental Study on Failure Mechanical Properties of Two Kinds of Seafloor Massive Sulfides

1
College of Mechanical and Electrical Engineering, Central South University, Changsha 410083, China
2
National Key Laboratory of Deep-Sea Mineral Researches Development and Utilization Technology, Changsha 410013, China
*
Author to whom correspondence should be addressed.
Minerals 2021, 11(10), 1144; https://0-doi-org.brum.beds.ac.uk/10.3390/min11101144
Submission received: 27 August 2021
/
Revised: 14 October 2021
/
Accepted: 14 October 2021
/
Published: 18 October 2021
(This article belongs to the Section Mineral Deposits)
Abstract
:Remarkable hydrostatic pressures have a significant effect on the failure mechanical properties of seafloor minerals, which also affects the selection and development of mining excavation tools. In this paper, a Brazilian splitting test and triaxial compression test were adopted to investigate the strength and deformation behavior of two kinds of seafloor massive sulfides (SMS) samples at a small-scale size. Based on the mineralogical characterization of the studied samples, the mechanical properties were preliminarily correlated with their internal structures and mineral compositions. Results indicate that there is a significant difference in the triaxial compression deformation properties between the two kinds of SMS samples and the geotechnical data are controlled by mineral type and composition, including porosity. In general, the triaxial compression process of the two kinds of samples included initial compaction, elastic stage, yield stage, failure stage and residual stage, and shows strain softening characteristics after the peak. With the increase in confining pressure, the strain-softening behavior of the white sample is mitigated and gradually changes into strain-hardening. The peak strength and peak strain of the two samples increased linearly with the increase in confining pressure within the confining pressure range of these tests, and the failure pattern of the specimens also changed from a typical brittle failure to a ductile failure. The results of this study provide data to support further understanding of different kinds of SMS, and are of great significance in the design of efficient SMS exploitation equipment.
1. Introduction
Marine minerals, such as manganese nodules, co-rich ferromanganese crusts, and seafloor massive sulfides, are generally regarded as potential resources that could have a significant impact on the international metal market [1,2]. These deep-sea mineral commodities are formed by very different geological processes, resulting in deposits with distinctly different characteristics. Seafloor massive sulfide (SMS) deposits, which are associated with both active and inactive hydrothermal vents along oceanic ridges, are rich in copper, gold, zinc, lead, and silver, and are found mainly in water depth of 1500 to 4000 m [3,4,5]. Thus far, numerous mineralogical studies have been carried out on sulfide deposits in terms of element analysis, mineral composition [6,7], and mineralization [8,9]. However, the geotechnical properties of SMS deposits, especially mechanics under remarkable hydrostatic pressure, are extremely important for seafloor excavation. Regarding the mechanical properties of SMS samples, only some core data and measurements of SMS are presently publicly available [10], and the data mainly focus on specific parameters, such as the maximum fracture strength of minerals. Yamazaki et al. [11,12] conducted several geotechnical tests on SMS samples from the sunrise mining area in the Okinawa Trough and obtained their mechanical properties. The authors stated that porosity and metal content influenced the mechanical properties of those samples. Spagnoli et al. [13] subdivided 12 SMS samples from two different locations into three types: black smokers, white smokers, and caprock, and investigated their geotechnical properties. However, due to the differences in the places of mineral occurrence and the different test methods, the data obtained by different researchers vary considerably.
In real submarine SMS deposits, SMS is in a triaxial stress state caused by hydraulic pressure and burial depth. The mechanical behavior and deformation characteristics under a high confining pressure are important to develop an efficient mining technology for exploitation. In geotechnical engineering, the triaxial compression strength test is a basic way to investigate the deformation and strength characteristics of rock under triaxial stress states. Many scientists have performed research on the mechanical (and other) properties of different kinds of rocks under triaxial stress states [14,15,16,17,18,19]. Miyazaki et al. [15] conducted drained triaxial compression tests on artificial methane-hydrate-bearing sediment samples under hydrate-stable temperature-pressure conditions. The authors stated that the strength and stiffness of the specimens increase with methane hydrate saturation and with an effective confining pressure, and the secant Poisson’s ratio decreases with effective confining pressure. Zhang et al. [16] carried out mechanical and permeability experiments on containing-gas raw coal and sandstone samples. The results showed that the peak strength of the raw coal and sandstone samples increased linearly with the increase in confining pressure. The permeability of different materials varies significantly with the change of confining pressure. Su [17] and Xu [18] conducted triaxial compression tests on red sandstone and cemented tailings, respectively. Their results showed that the strength parameters of rock under different stress environments are obviously different, and the deformation and failure characteristics also change obviously. Wang [19] studied compressive strength and deformation under uniaxial and triaxial compression tests to investigate the mechanical properties of ultra-high strength concrete and ultra-high-performance concrete under various stress states. These studies were based on non-SMS materials and showed that a triaxial compression test is an effective means to understand mechanical properties, and confining pressure has a great impact on the mechanical and permeability characteristics of rocks, especially on strength and deformation behavior. Due to the unique internal structures and material properties of SMS, the results and conclusions may be different. Hence, further study on the strength and deformation characteristics of different types of SMS ores, under three-dimensional stress states, has important practical engineering significance regarding failure mechanisms, mining methods, and the development of mining operation equipment.
Generally, specimens in uniaxial and triaxial tests will be processed into standard sizes of ϕ 50 mm × 100 mm for testing the rock mechanical properties. In special cases, the sample can also be processed into large or small sizes, on the condition that the length diameter ratio meets certain requirements. In fact, some researchers have used small specimens to study the properties of some special materials. Kodvanj et al. [20] and Garbatov et al. [21] conducted experiments on small-sized specimens of corroded steel, and studied their stress concentrations and mechanical properties. Some scholars have also carried out uniaxial and triaxial tests on rock materials with different specimen sizes. The results showed that, although a size effect exists in the mechanical parameters of differently sized specimens, the small-scale test data can still provide good guidance for further research [22,23,24]. Considering that it is difficult to obtain natural SMS mineral samples under current conditions, and the size of a single sample is usually not large enough, it is unrealistic to study seabed mineral samples using a conventional triaxial compression test.
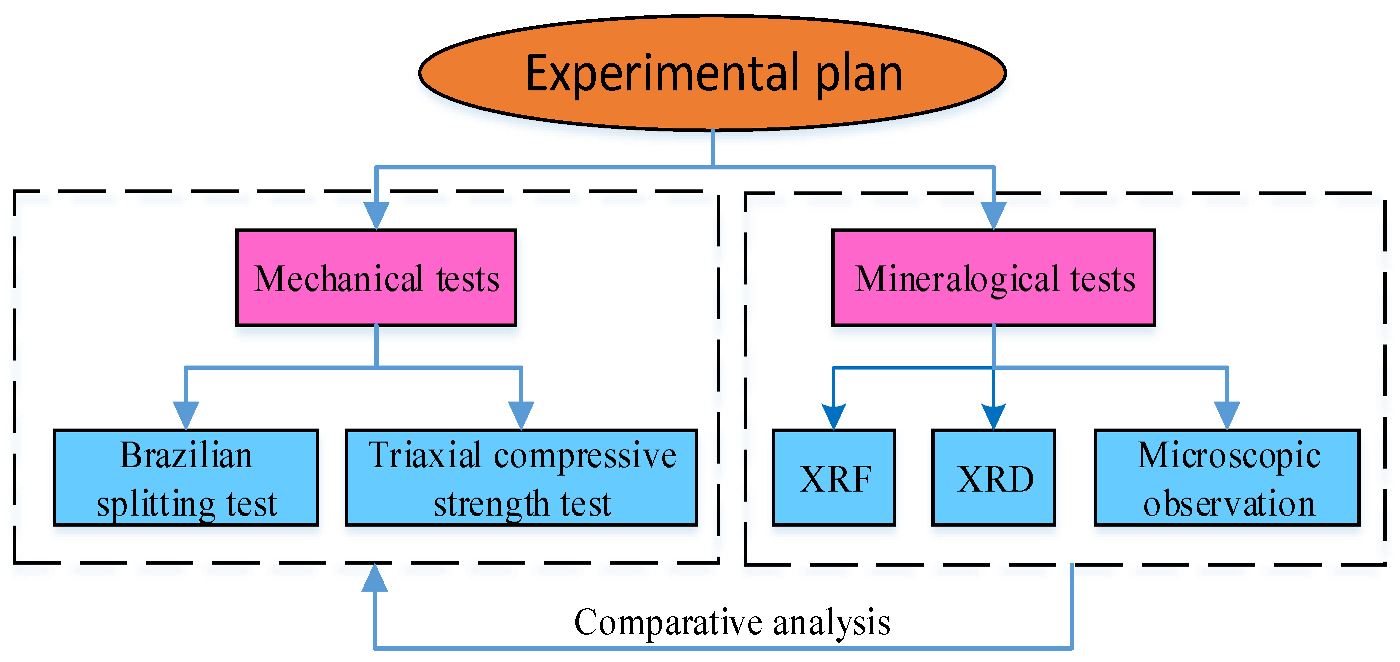
During seafloor excavation, cutting tools are bound to suffer from the resistance of seabed minerals, and the mechanical mechanism of real samples under high confining pressure is the basis of seafloor-cutting research for SMS. However, many of the results available in the literature regarding seafloor excavation are based on tests performed on non-SMS materials [25,26,27]. In this study, the triaxial compression strength and a Brazilian splitting test of two kinds of specimens were conducted. Due to the size limitations of a single sample, the specimens were processed into a small size of ϕ 25 mm × 50 mm. The geotechnical data of black and white SMS samples, such as mineral type and composition, were obtained by X-ray fluorescence spectrum (XRF) and X-ray diffraction (XRD). Subsequently, the texture of the pore spaces of the studied SMS samples were observed by photomicrographs of the polished section. The experimental plan of this study is shown in Figure 1.
This paper focuses on the failure mechanical properties of two kinds of seafloor massive sulfides in a triaxial stress state. This is an important part in the development of deep-sea mining systems. The results also provide new information on key mechanical properties of SMS samples, including tensile strength, compressive strength, cohesive force, internal friction angle, and elastic modulus. Based on the mechanical properties of the two SMS samples, the mineralogical characteristics were preliminarily related to the mechanical results. We attempt to explain the differences in the mechanical behavior and deformation characteristics between the two samples from the perspective of mineralogy. The data introduced in this research give a new perspective for understanding the mineralogical characteristics of SMS samples. This is beneficial for further exploitation of SMS deposits, and especially for the development of seabed excavation equipment.
2. Sample and Test Scheme
2.1. Test Samples
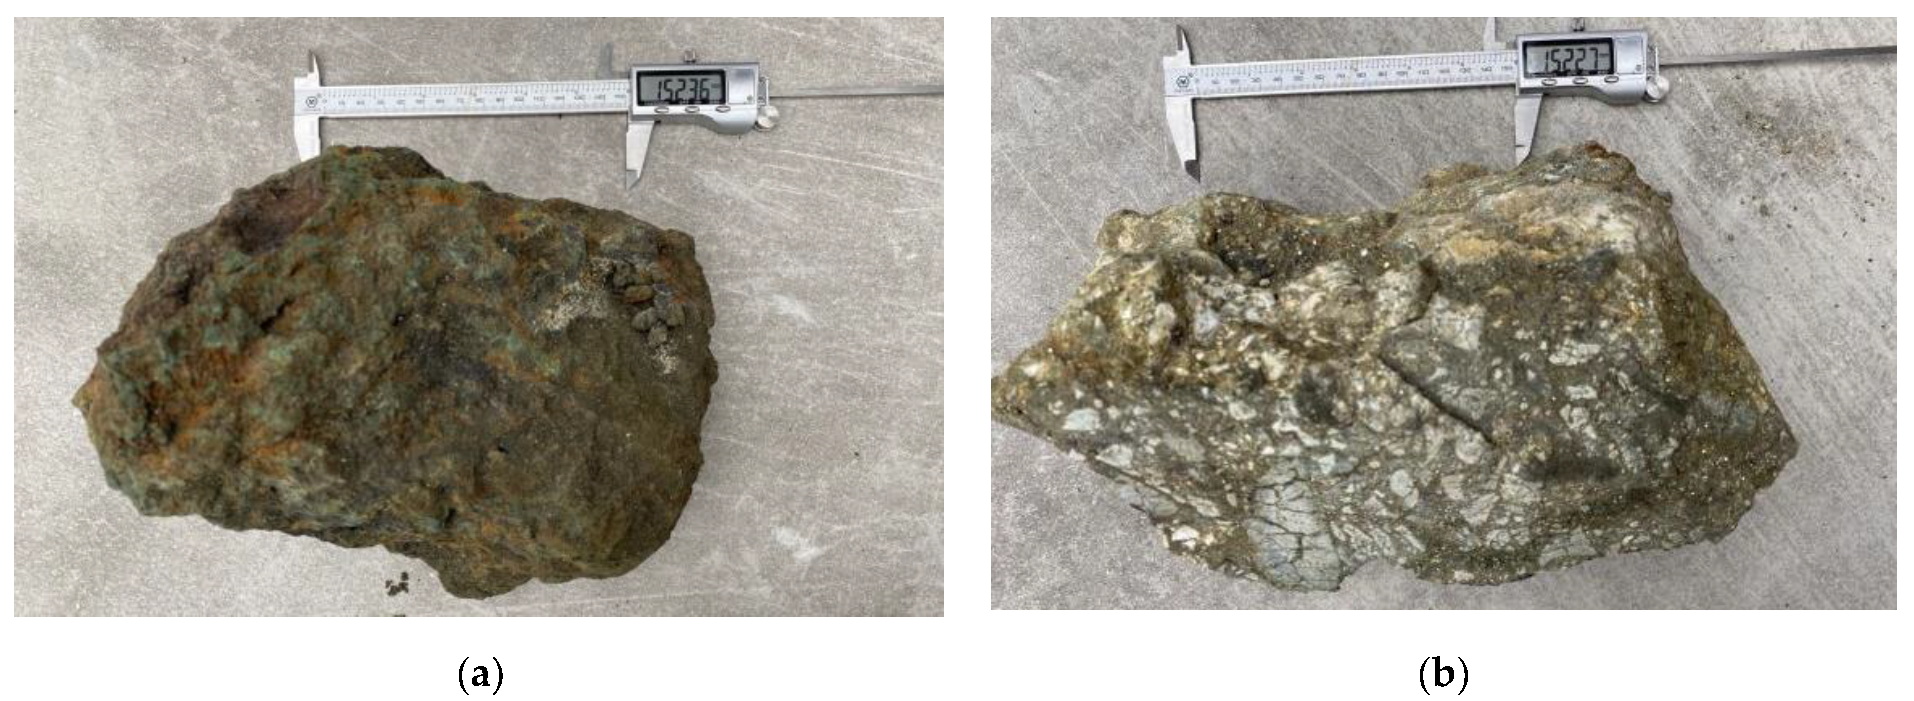
SMS deposits are formed by the eruption of seafloor hydrothermal fluid [13,28]. After erupting from a vent, most of their mineral content precipitates in the form of chimney structures and stockwork mineralization in the permeable subsurface due to rapid cooling due to mixing with cold seawater. The appearance of the solid mineral occurs as cylindrical chimney structures: so-called black- or white smokers (caused mainly by the presence of iron, copper, zinc, and sulfur). White and black smoker chimneys often occur in the same large vent complex, indicating that they are supplied from the same high-temperature plumbing system at depth. Black smokers represent high-temperature mineralization and are formed from emanating vent fluids with temperatures of up to 410 °C. White smokers usually begin to grow at around 300 °C or less, and are visually white due to the presence of gray–white particles (amorphous silica, some barite and anhydrite) [13]. In order to gain more accurate results, real ore samples are necessary for subsequent experimental studies. Therefore, we applied for two different types of SMS samples from the China Ocean Sample Repository. The samples tested for these geotechnical experiments were collected from the southwest Indian Ocean ridge area with a grab sampler and the segments are, respectively, 30IV-SWIR-S012TVG01 and 34IV-SWIR-S035TVG08. As shown in Figure 2a,b, the samples included a black smoker and a white smoker with a similar mass of about 10 kg.
In the present study, the mineral density and porosity of the SMS samples were first obtained using conventional methods to provide preliminary information regarding future deep-sea mining cutting projects. The detailed results are shown in Table 1.
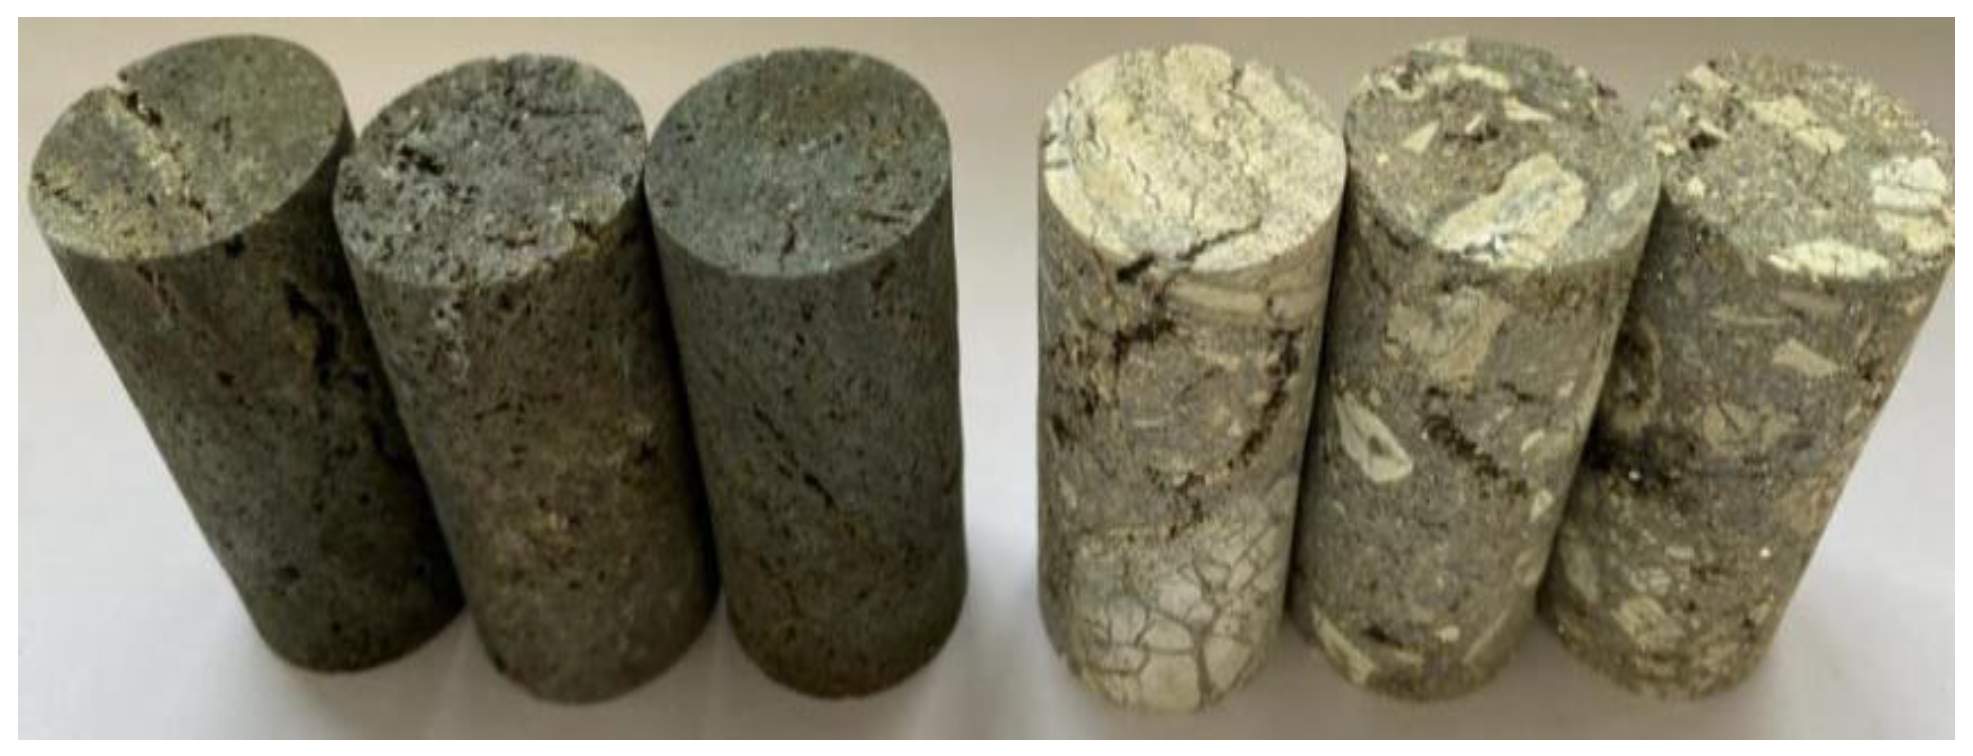
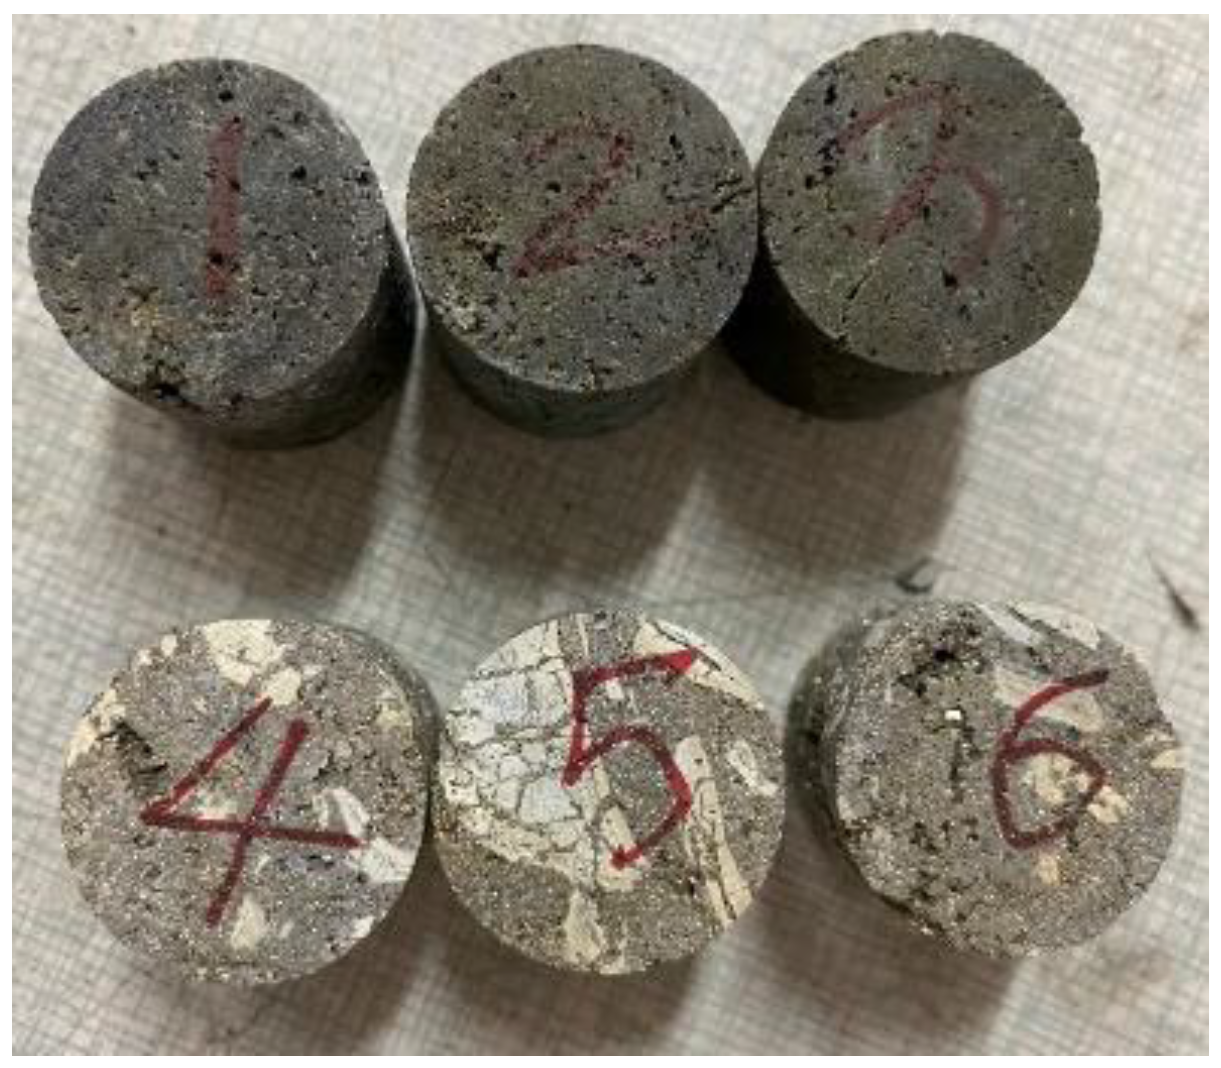
It is well known that both the triaxial compression test and the Brazilian splitting test have strict requirements in terms of the size and shape of specimens. In general, samples are processed into standard size samples, but for small-sized or coarse-grained rocks, they can be processed into non-standard samples. Triaxial compression specimens should meet the requirements of a height diameter ratio of 2:1–2.5:1, and the Brazilian splitting specimen should meet the requirements of height diameter ratio of 0.5:1–1:1. Therefore, according to the technical requirements, the triaxial compression test and Brazilian splitting test specimens were processed into smaller size specimens, with the size of ϕ 25 mm × 50 mm and ϕ 25 mm × 25 mm, respectively. Since these ores have been stored on land for a certain period of time, the samples needed to be soaked in seawater for more than 24 h before sample preparation, so as to ensure that the ores were filled with water and to ensure the accuracy of the test results. Figure 3 and Figure 4 show the morphology of the two kinds of specimens in these tests, and reveal that there are many pores and defects in these specimens. Heat-shrinkable tube was used to seal the sample to prevent the hydraulic oil from entering the sample during the test and affecting the conclusion of the mechanical properties. It should be noted that, before the triaxial compression test, it was necessary to repair obvious holes on the sample surfaces with lime or cement to prevent the high confining pressure oil from penetrating the heat-shrinkable tube and causing the test failure.
2.2. Brazilian Splitting Test System
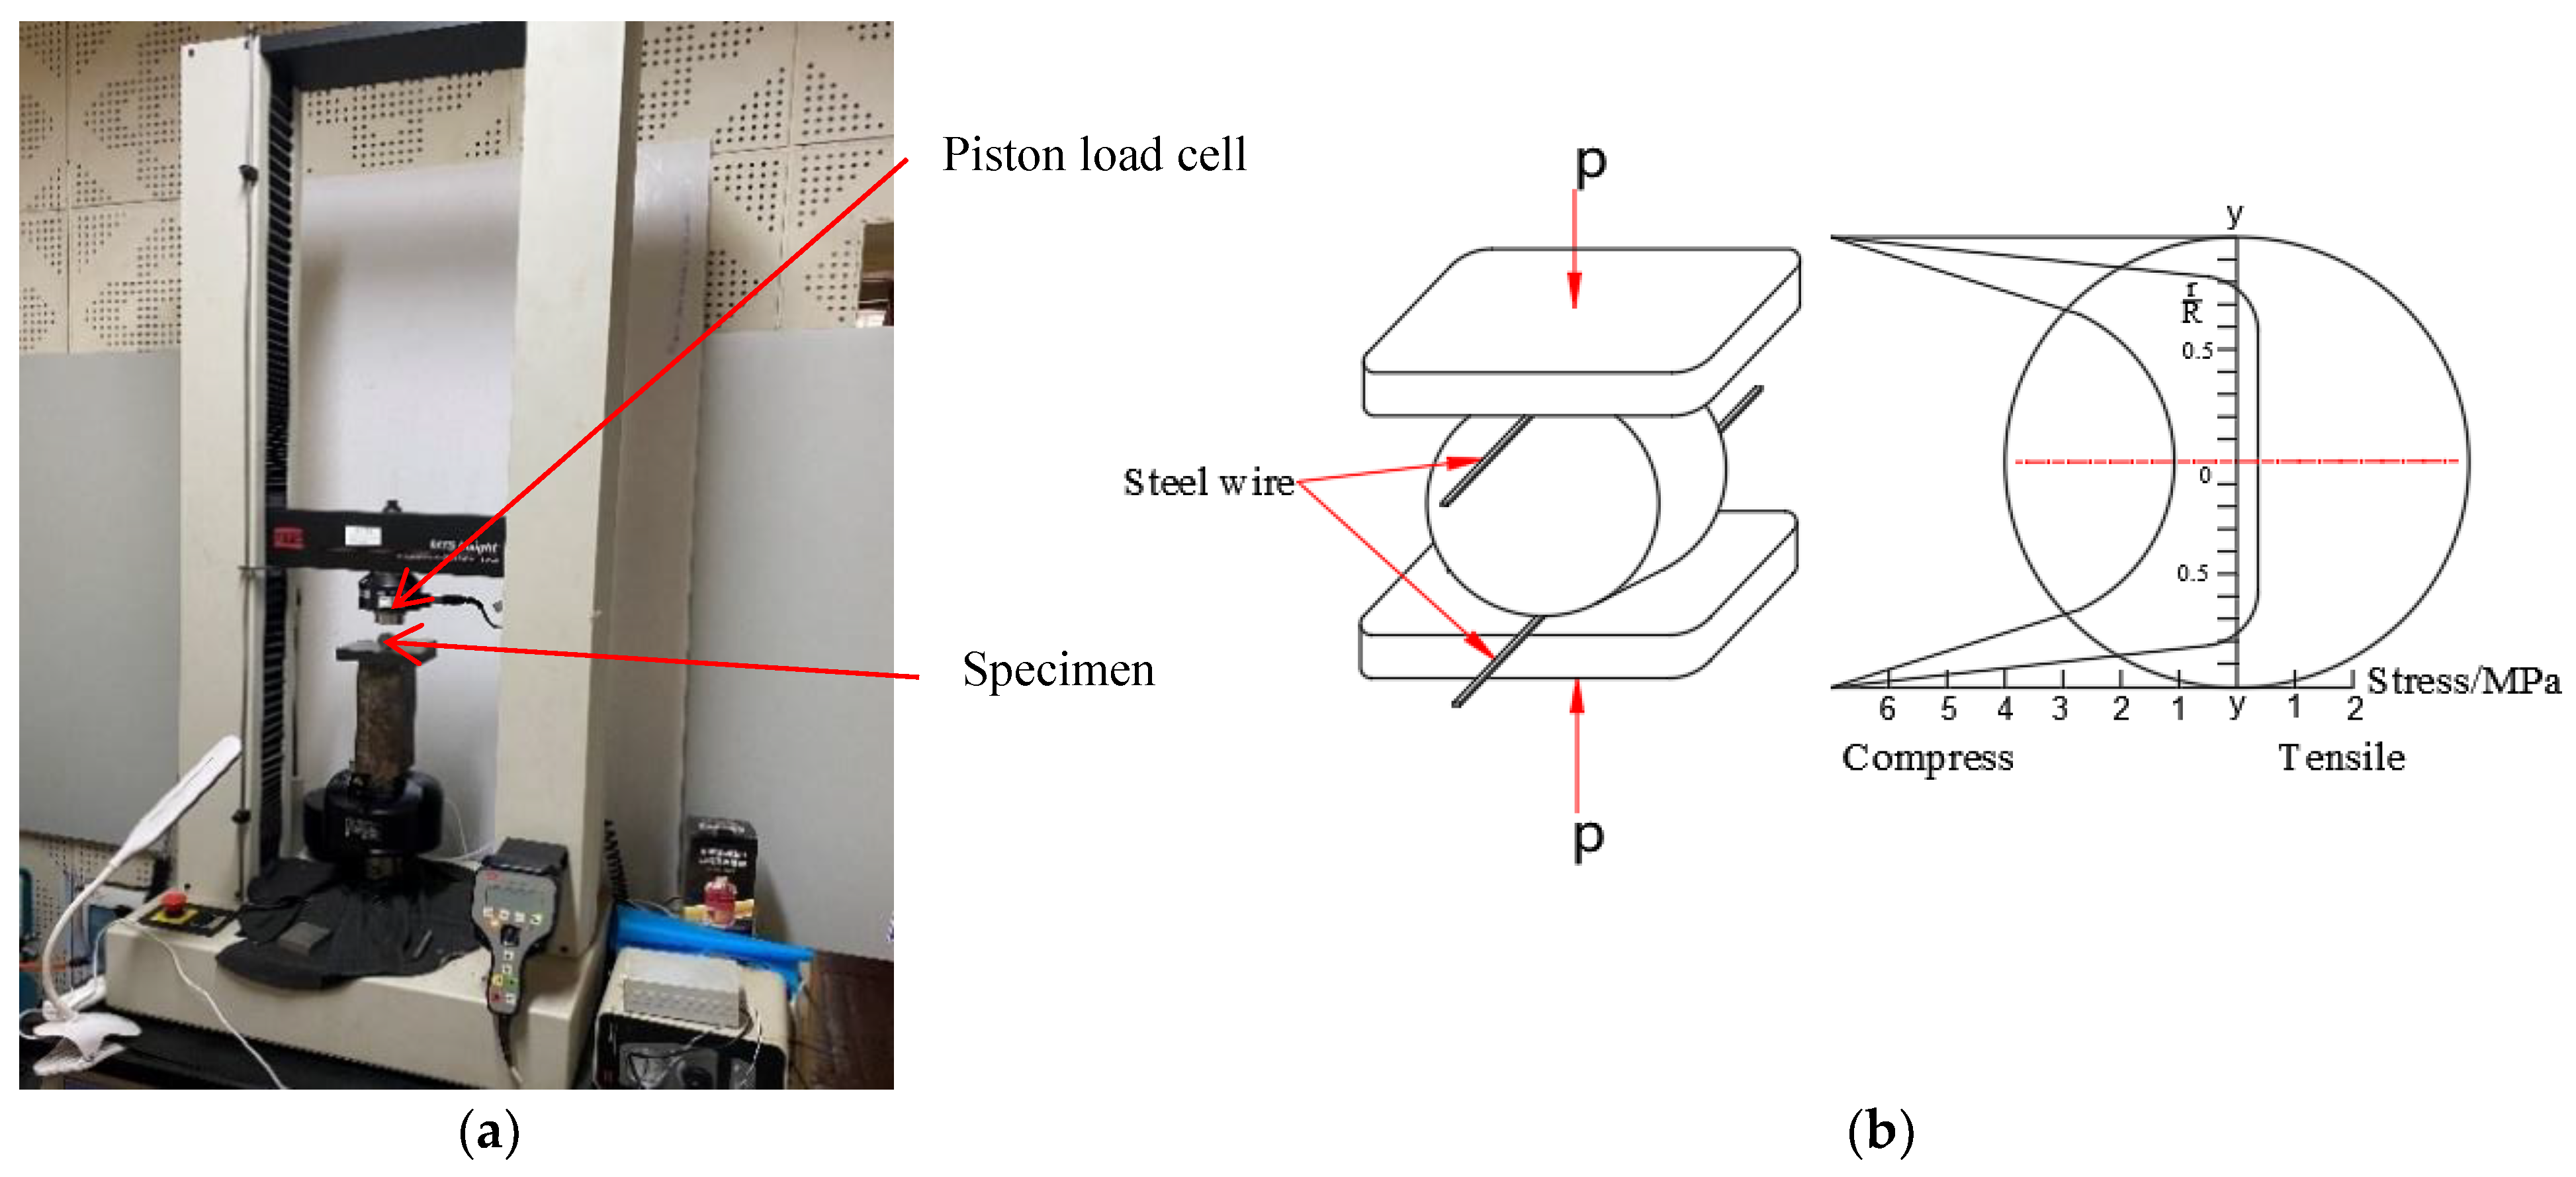
The tensile strength of a rock is the maximum stress that the rock can bear under the condition of tension. Because the Brazilian splitting test is simple and the test results are close to those measured using the direct tensile method, it is often used to measure the tensile strength of rock. As shown in Figure 5, the tensile strength of the cylinder specimen is measured by placing two steel wire strips on the diameter direction of the cylinder specimen and applying a relative linear load to destroy it along the diameter direction of the specimen. The maximum tensile stress acting in the center of the specimen is:
where σt is the maximum tensile stress in the center of the specimen, MPa; P is peak tensile force at failure, N; and d and t are diameter and thickness of the pressure bearing disc, mm.
The Brazilian splitting test was carried out using the 23 MTS insight biomechanical testing machine (Figure 5a) at the Advanced Research Center of Central South University, with a maximum range of 30 kN. Figure 5b shows the diagram of loading and stress distributions in the splitting. During the test, the displacement loading method was adopted, and the loading rate was set at 0.8 mm/min.
2.3. Triaxial Compression Test System
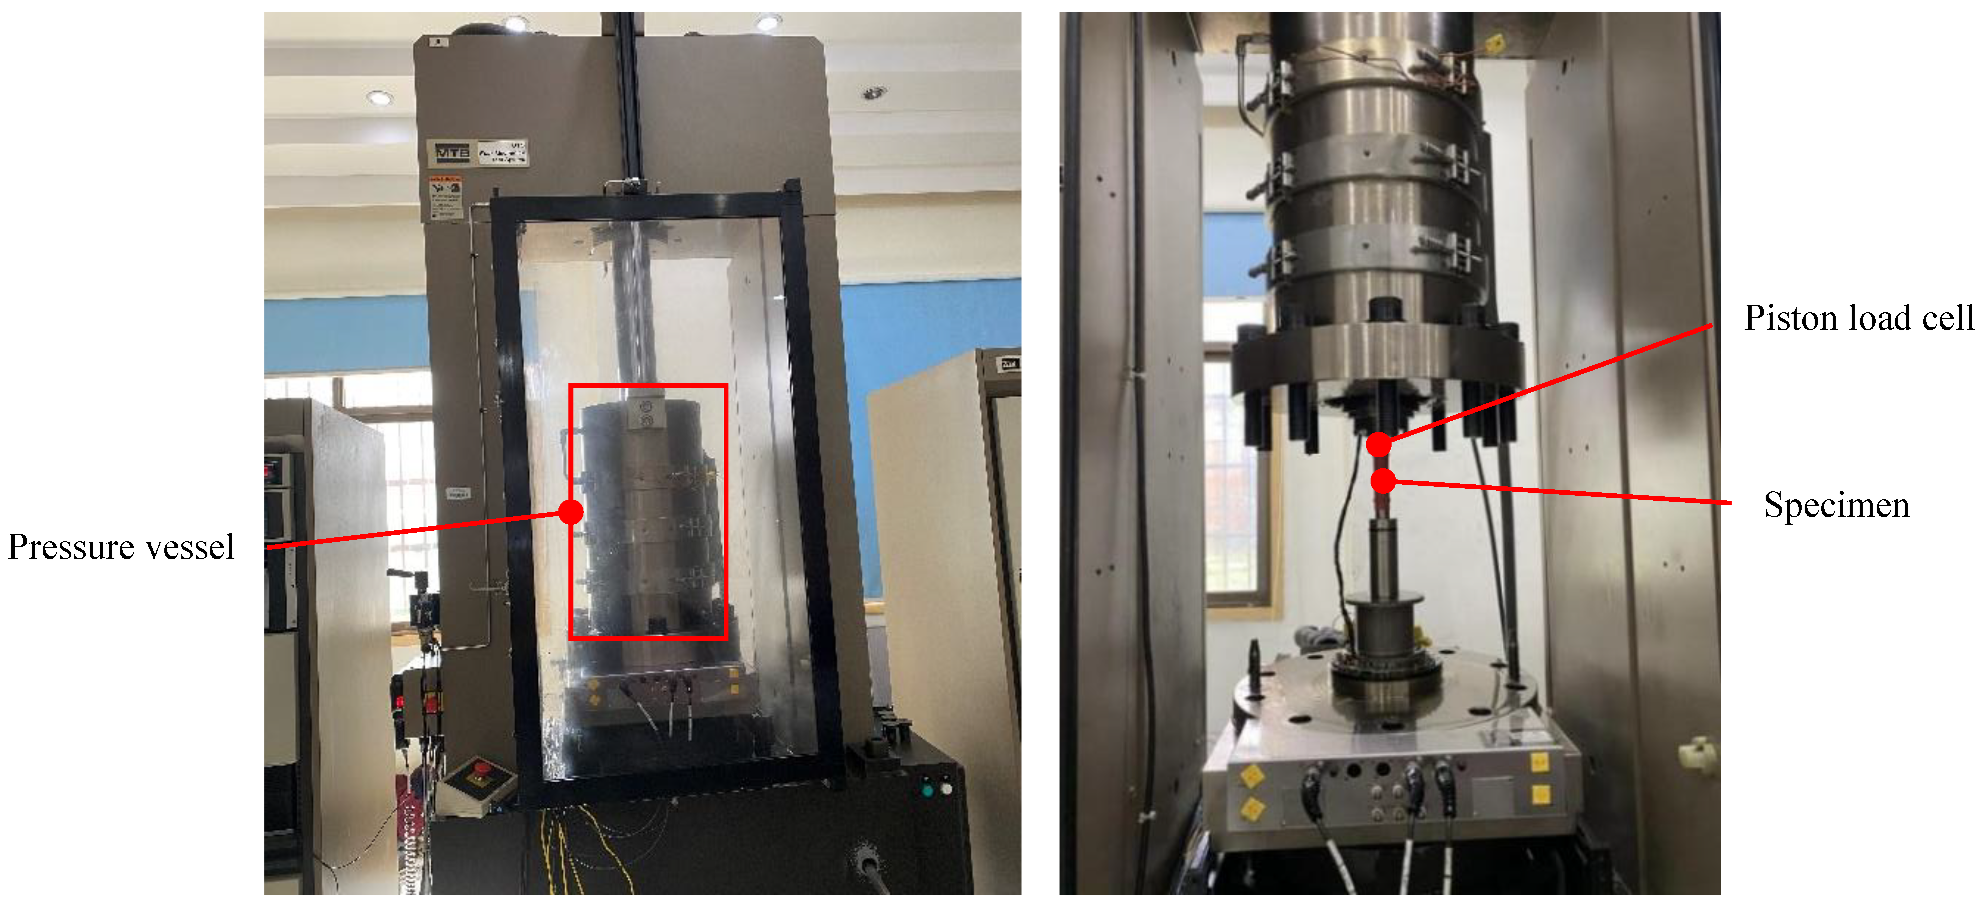
The equipment for the triaxial compression test in this study was the MTS815 Electro-hydraulic Servo-controlled Rock Mechanics Testing System (shown in Figure 6) at the Modern Analysis and Test Center of Central South University. The test system is a fully digital control system with a servo controlled automatic triaxial compression and measurement system. Because of its intelligence, simple operation, and other advantages, the system is widely used in conventional mechanical testing of rock, concrete, and other materials. The data measured in conventional triaxial compression tests usually include confining pressure, axial load, circumferential strain, and axial strain. However, due to the non-standard size of the specimens, circumferential strain was not considered in this study.
The SMS deposits were distributed in a high hydrostatic pressure environment, which is a triaxial stress state. The triaxial compressive test of rock is a triaxial compression shear test based on the Mohr Coulomb strength failure theory. The triaxial compression test under equal lateral pressure (σ2 = σ3) was a special case that is suitable for three-dimensional stress states, and the lateral pressure was determined by engineering needs and rock characteristics. In the test process, the residual strength and stress–strain of the material could also be obtained clearly so that the failure process and state of the specimen could be observed more intuitively.
The main processes of the test were as follows: firstly, the specimen was preloaded under static pressure (σ1 = σ2 = σ3) to make it come fully into contact with the testing platform. Secondly, different constant confining pressures, σ3 (corresponding to the minimum principal stress σ1min), were set around each specimen. Then, the confining pressure was kept constant, and the axial uniform pressure σ1 was applied to the specimen and gradually increased. The evolutionary process of the stress state of the SMS specimen in triaxial compression test is shown in Figure 7. Finally, when σ1 increased to the critical value σ1max, shear failure occurred in the sample. In the tests, displacement control was applied with a constant axial deformation rate of 0.12 mm/min and the confining pressure was set to 2, 5, 8 and 10 MPa, respectively.
2.4. Micro-Structure and Mineralogical Tests
The macroscopic properties of rock materials are often determined by their internal composition and structure. In order to explain the differences in the strength and deformation behavior between ore samples from a microscopic point of view, some mineralogical surveys of black and white samples were conducted. Within the scope of the petrographic investigation, the quantitative mineral composition was determined by using XRD and the element composition was determined by using XRF. From the point of view of the mineral microstructure, the polished sections were studied using the VHX-5000 Super-high magnification lens zoom 3D microscope in State Key Laboratory of High Performance Complex Manufacturing of Central South University and the investigation was focused on the portion and size distribution of the pore spaces. The 3D microscope is produced by KEYENCE and integrated with stereoscopic microscope, tool microscope and metallographic microscope as one to enlarge the microscope image to observe the microinterface. Subsequently, the survey results of the two kinds of ore samples were correlated with the geotechnical data and discussed.
3. Results and Discussion of Geotechnical Test
3.1. Brazilian Splitting Test
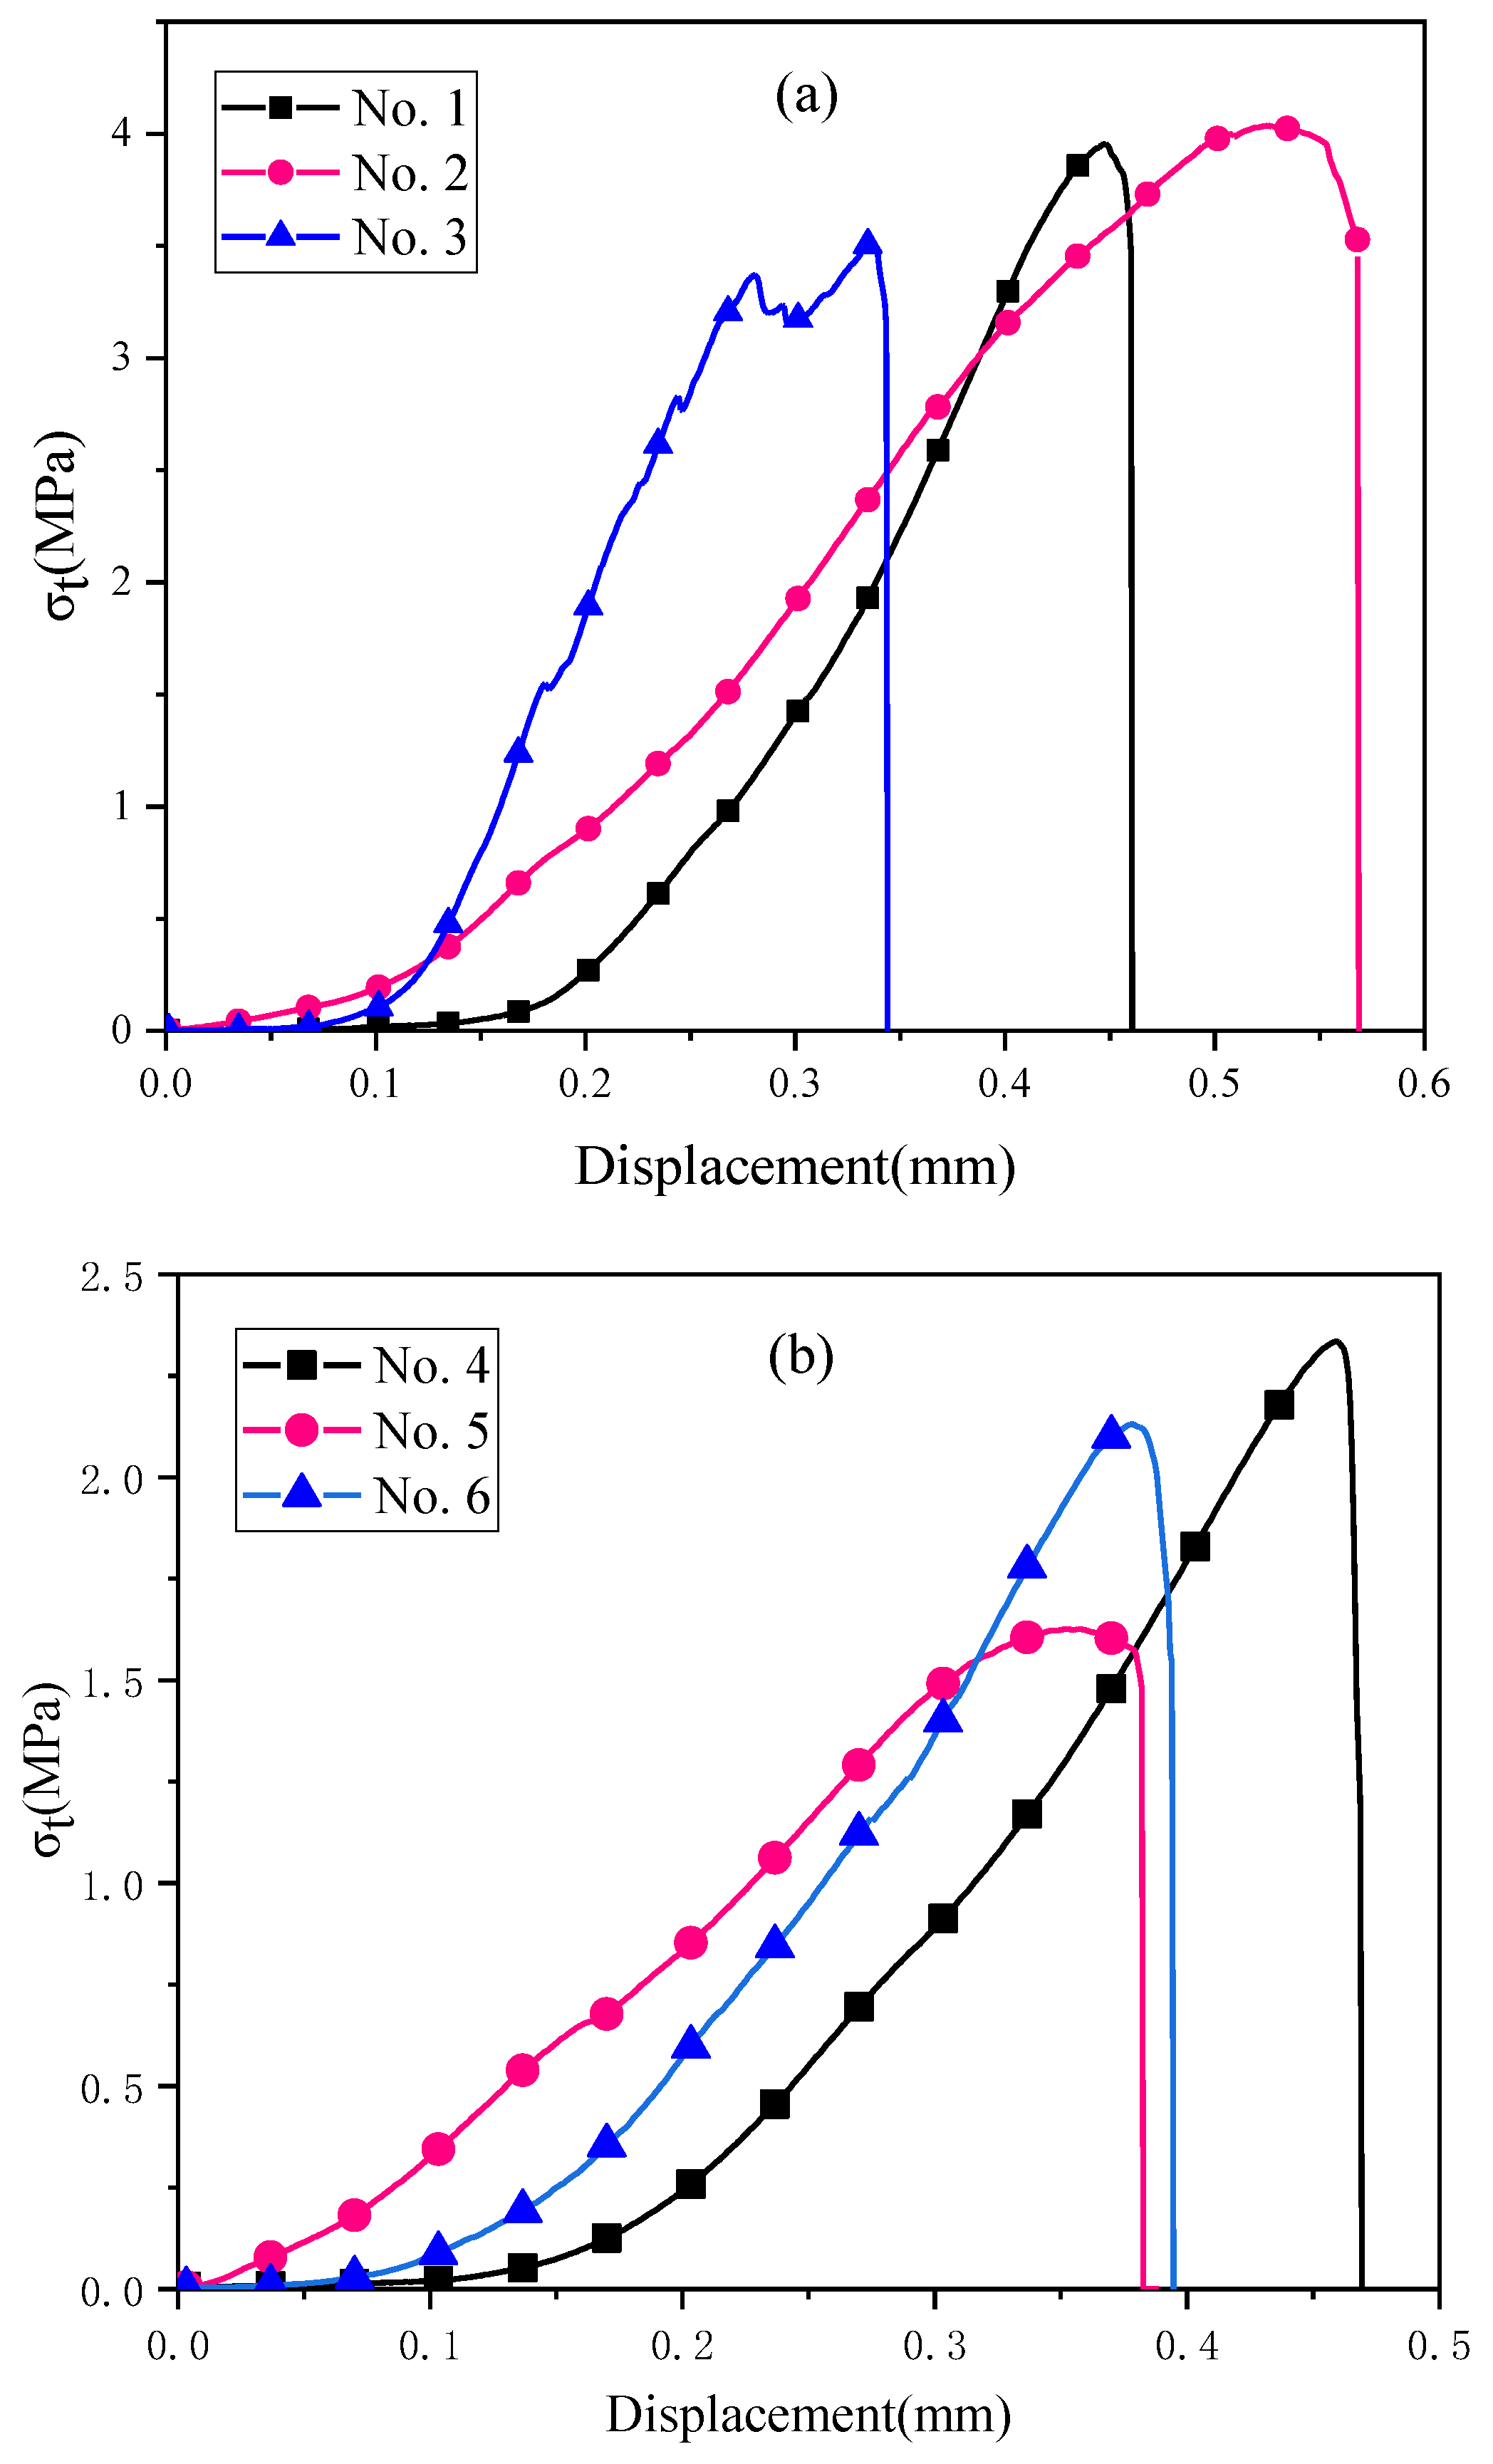
During the splitting test, data such as force and displacement were recorded by the test system in real time and the load–displacement curves of the two kinds of SMS samples are shown in Figure 8. With an increase in axial displacement, the load–displacement curves of the black specimens and white specimens were similar, and generally went through three stages: compaction, linear elasticity, and failure drop. When the load reached the peak value, the sample is suddenly destroyed and the residual strength drops rapidly. Meanwhile, the pre-peak yield stage of the curve is not obvious, showing the characteristics of brittleness. The compression and elastic deformation belong to the energy storage stage, while the plastic deformation stage is the strain energy release stage.
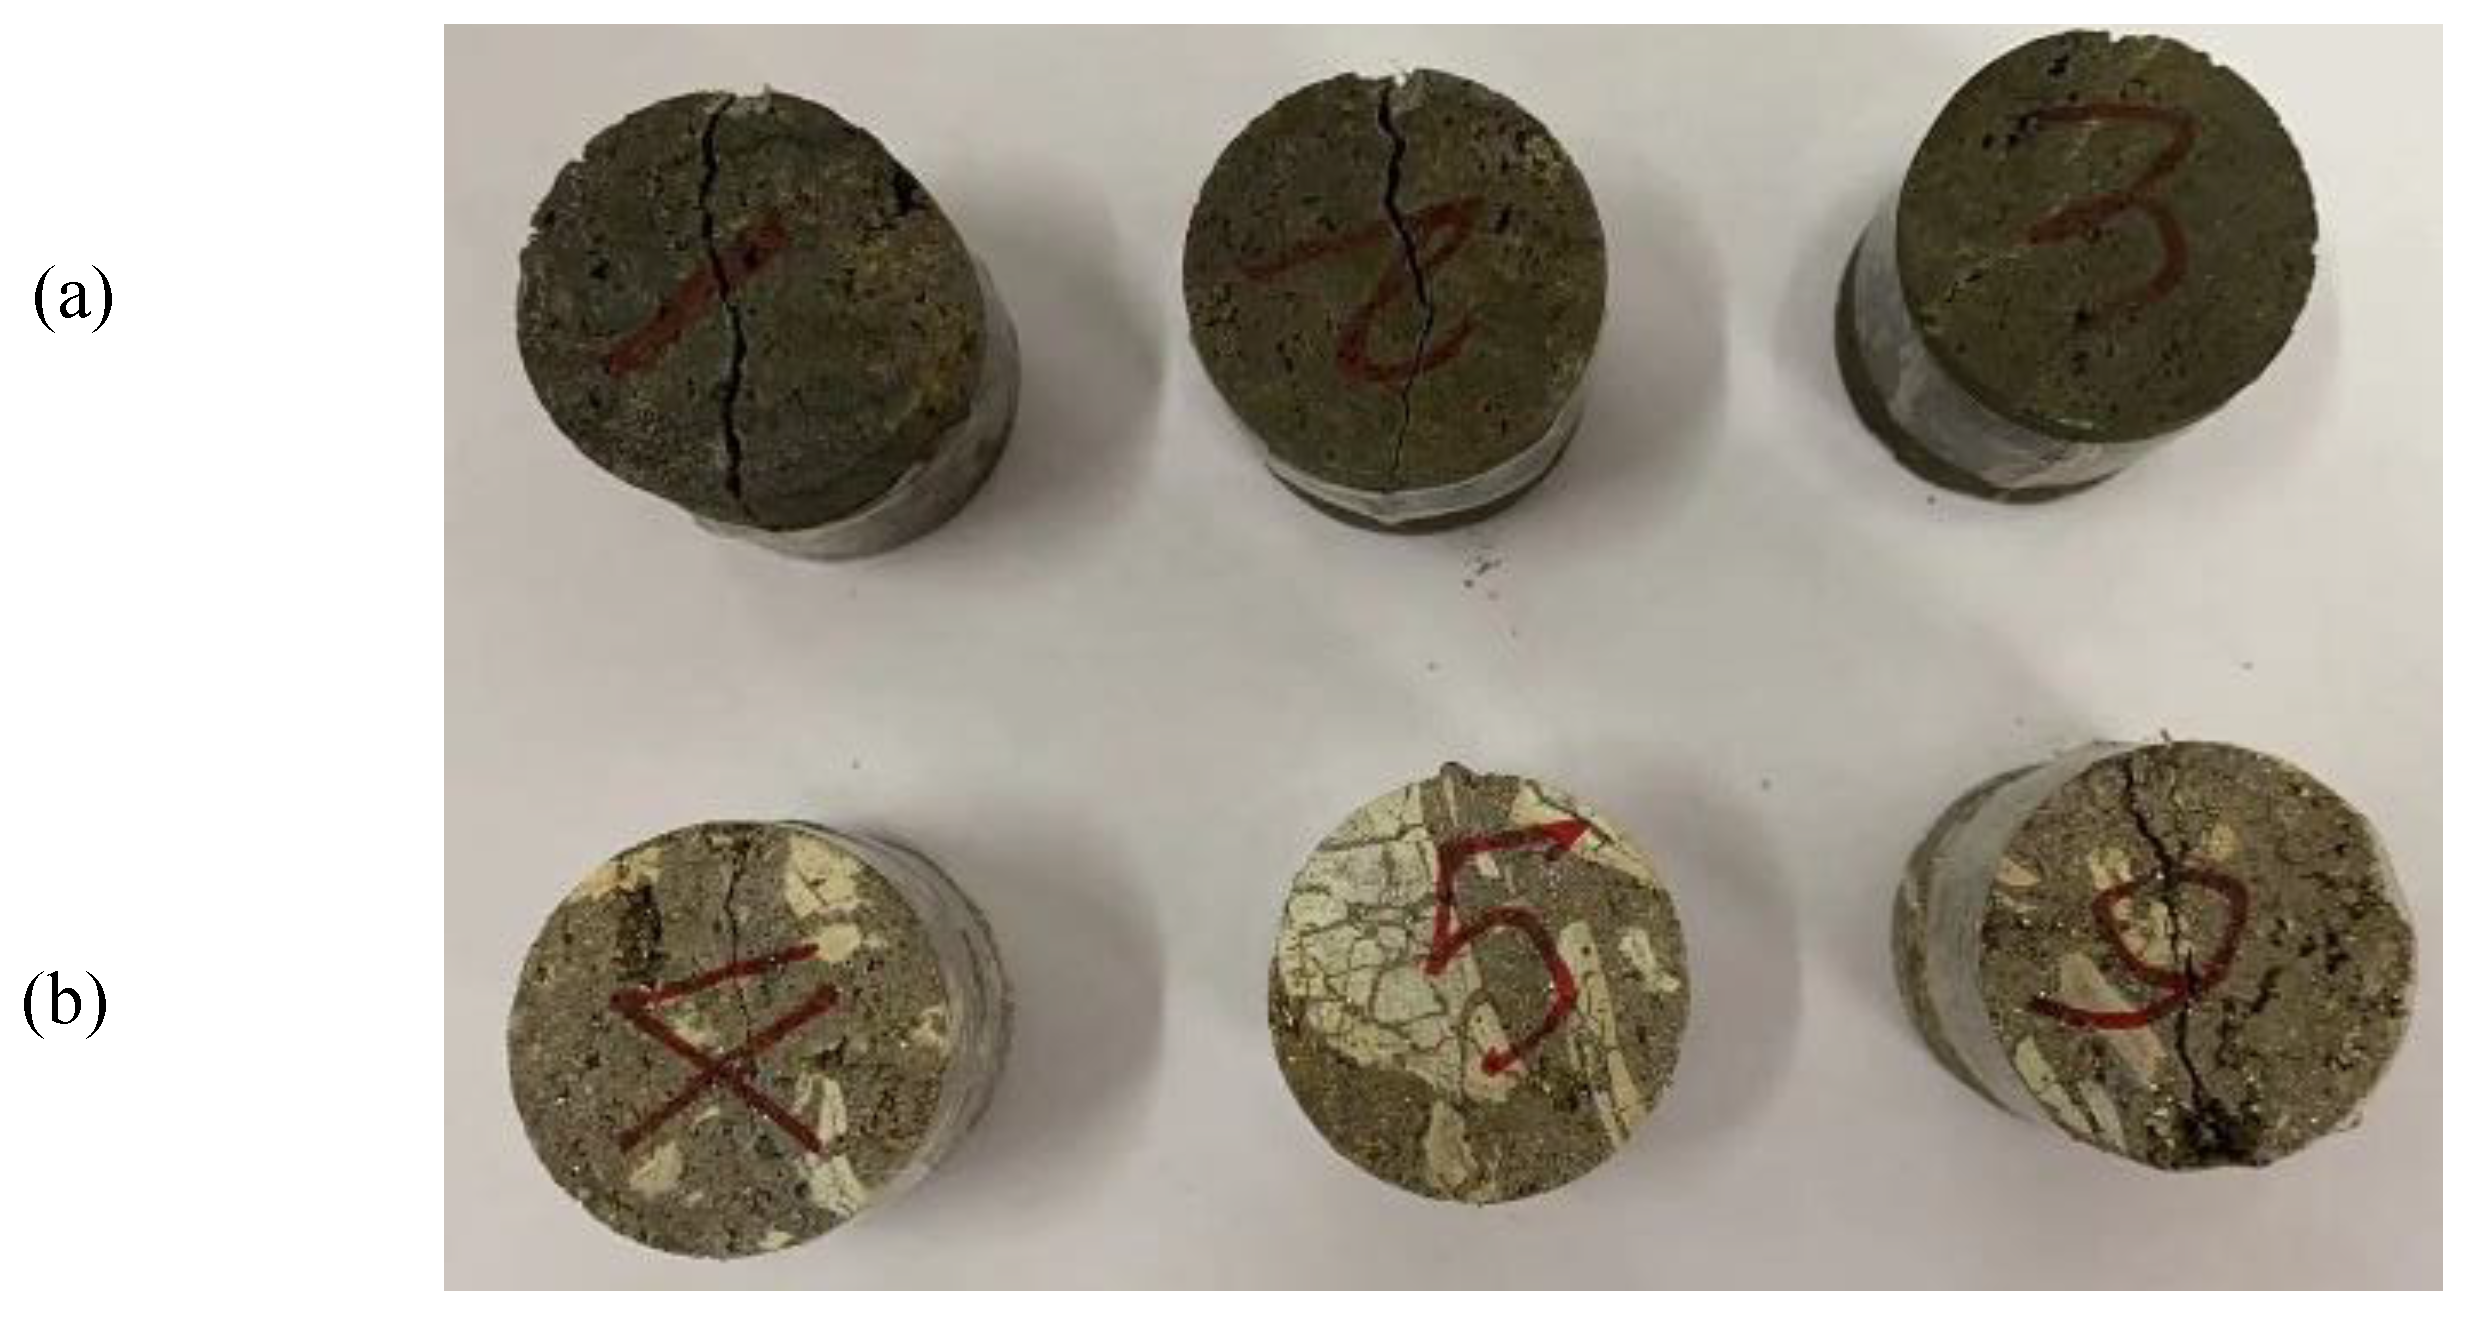
Figure 9 shows the splitting failure modes of black and white SMS specimens. In general, the final failure mode of these specimens is consistent. Each specimen produces radial penetrating cracks along the sample immediately after reaching the peak radial pressure, which also shows that the Brazilian splitting test can effectively obtain the tensile strength parameters of polymetallic sulfide samples. However, the crack of the No. 3 specimen shifted radially, which may have been caused by the influence of pores in the specimen. In addition, as shown in Table 2, the tensile strength of the No. 5 specimen was significantly lower than that of other specimens in the white group, and no obvious crack was found after failure; the data of the No. 5 specimen were judged as failure and eliminated.
The peak strength and radial deformation of the two kinds of specimens are summarized in Table 2. We can see that the tensile strength of the black sample is higher than that of the white sample. Since the data of the No. 5 were eliminated, the average tensile strength of black and white samples are 3.84 MPa and 2.25 MPa, respectively.
3.2. Mechanical Properties under Triaxial Compression
3.2.1. Deformation Characteristics
In the present study, 10 black and 10 white specimens were prepared for the triaxial compression strength tests. Unfortunately, several white specimens failed due to the characteristics of the material, and the success rate of the black sample was relatively high. The entire compressive process, as well as the acquisition and processing of test data were completed using the detection and control system.
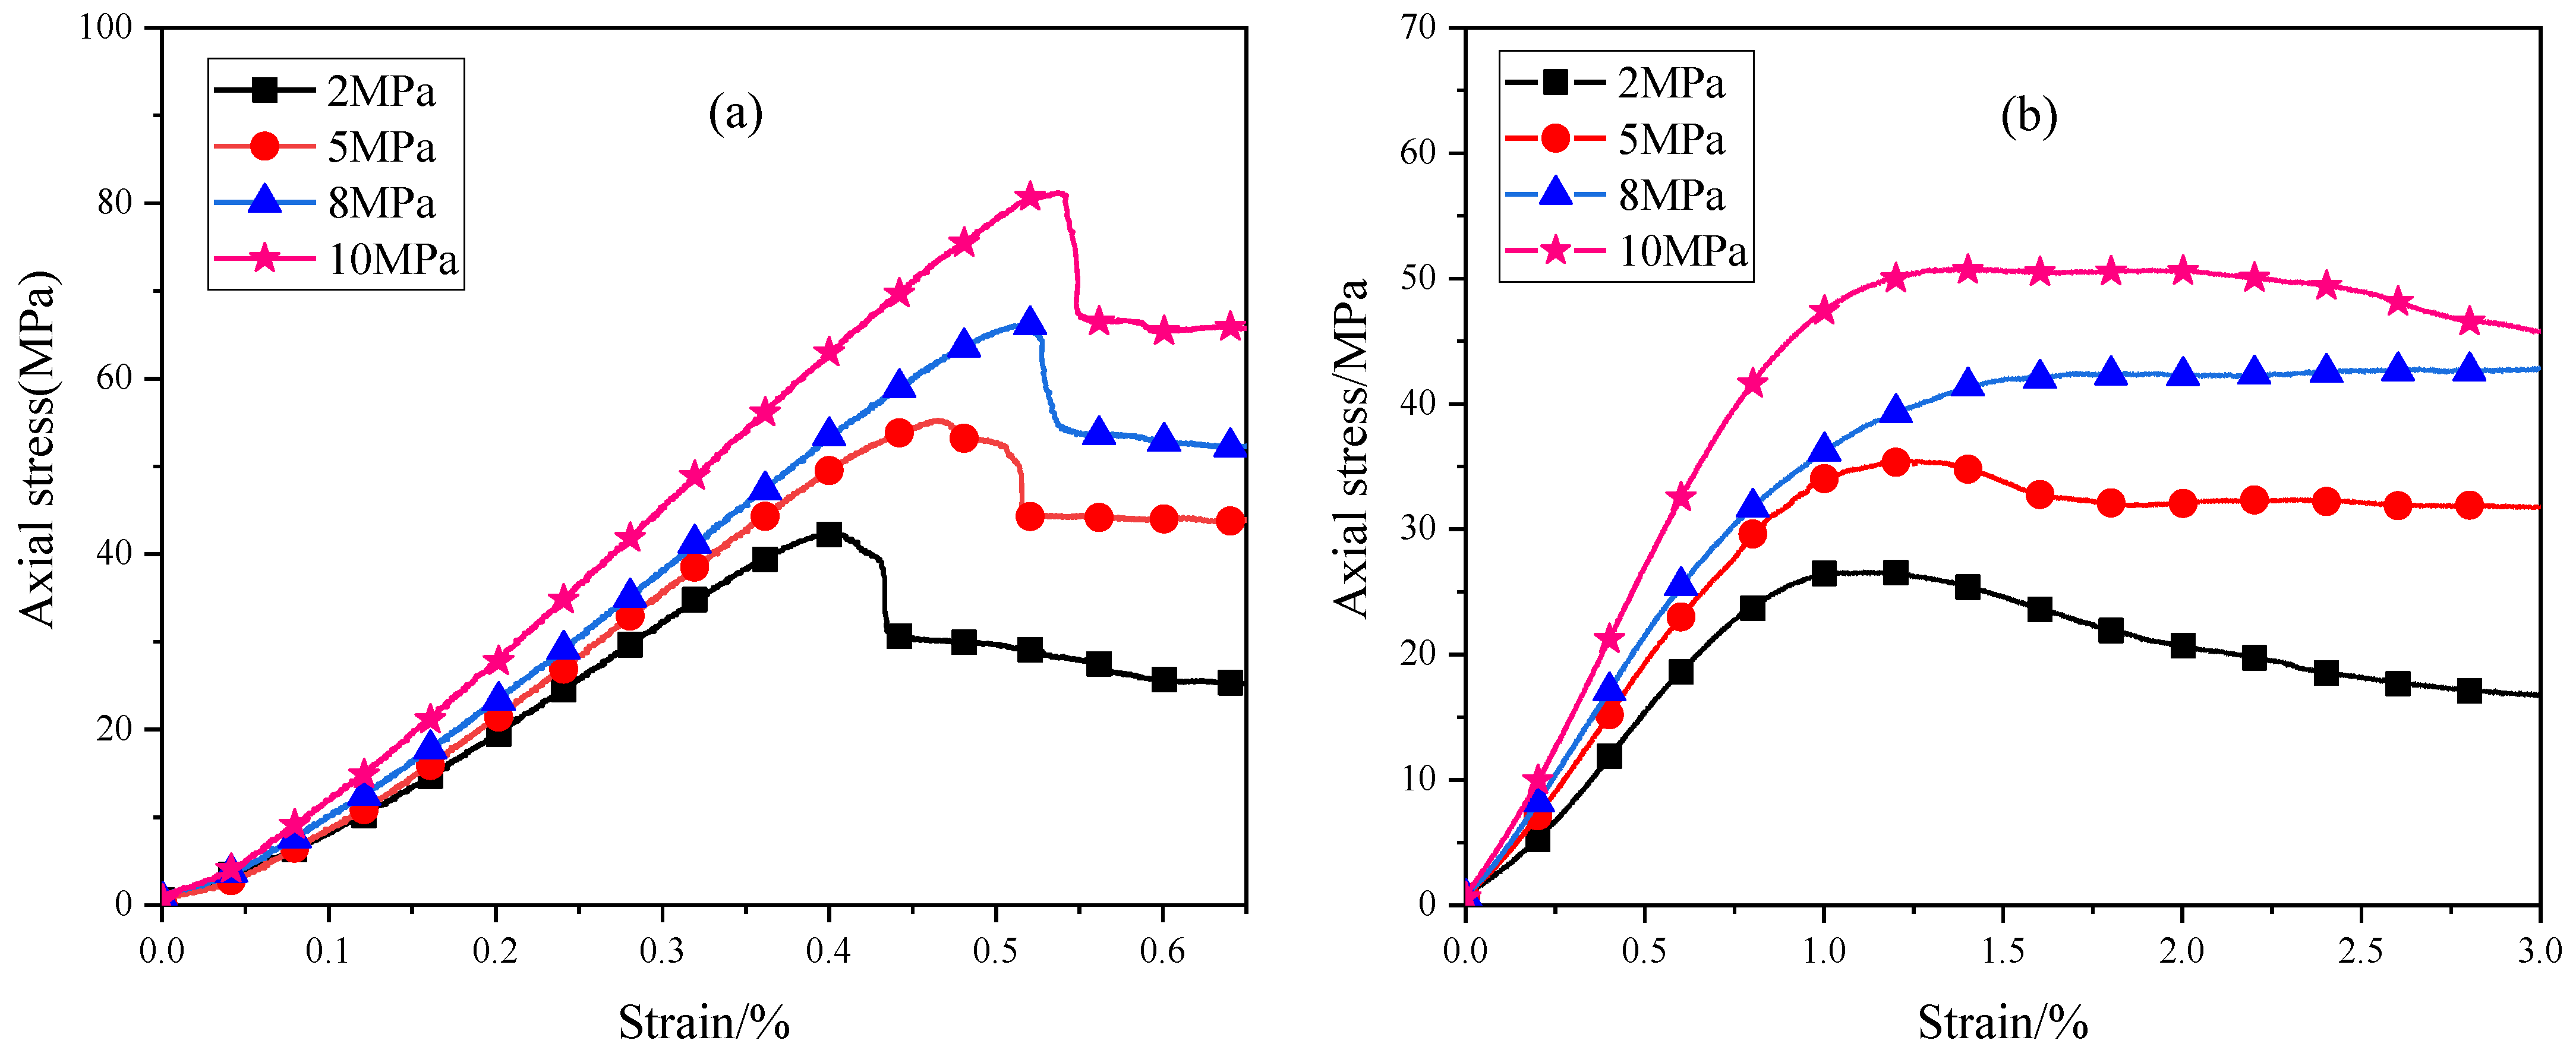
The typical relationship between the stress and corresponding strain of black and white SMS specimens is illustrated in Figure 10. The confining pressure, σ3 (minimum principal stress), and axial peak stress, σ1, were extracted and are shown in Table 3. As shown in the table, the distribution of the peak load and principal stress σ1 from low to high is consistent with the theoretical results of mineralogical composition, which further proves that the mechanical behavior of these samples can represent the properties of SMS.
Figure 10 shows that the yield stress and peak strengths of the two types of SMS specimens increase gradually with the increase in confining pressure. As shown in Figure 10a, the black specimen underwent the following stages during triaxial compression: compaction stage, linear stage, yield stage, failure stage and residual stage, showing typical rock failure characteristics. Similar to the black specimens, the white specimens also experienced the initial compaction stage, linear stage, and yield stage under a certain confining pressure. As shown in Figure 10, the axial stress of all specimens in the initial deformation stage increased linearly with the axial strain. However, the post peak characteristics of the white specimens were significantly different from those of the black specimens. When the stress exceeds the peak value, it will not reduce sharply with an increase in strain, but transforms from strain softening (post-peaks stress decay of stress−strain curves) to ideal plasticity, and then to strain hardening with the increase in confining pressure. When the confining pressure increases to a certain value, a yield platform appeared in the deformation curve, showing plastic flow of the material, and the peak value of the rock was the ideal plasticity. The corresponding confining pressure is called transformed confining pressure. When a confining pressure is lower than the transformed confining pressure, there is a peak point (peak strength) on the stress–strain curve of the SMS sample. With the continuous increase in confining pressure, there is no peak point in the stress–strain curve of rock, the stress increases monotonically with strain, showing strain hardening characteristics. It should be noted that under the confining pressure of 10 MPa, the peak stress appears in the curve and shows a slight strain softening. This may be caused by the internal material dispersion of the natural specimen, resulting in the high strength of a single specimen and the corresponding increase in the converted confining pressure.
Figure 10 shows that the confining pressure had an obvious impact on the brittle-ductile transformation of SMS, because there were corresponding physical mechanisms for brittle and ductile deformation and failure modes [29]. The brittle failure corresponds to fracture, friction (contact friction), and fragmentation flow (relative motion and mutual crushing between particles or blocks); the ductile failure corresponds to plastic flow, including solid flow caused by dislocation, diffusion, and super plasticity. With the confining pressure increasing from low to high, the brittle–ductile transformation of SMS is essentially the transition of the deformation mechanism. The transition process is conducive to the inelastic deformation of SMS samples, and the increase in inelastic deformation components is reflected in the macroscopic deformation behavior, which is shown as inelastic yield deformation.
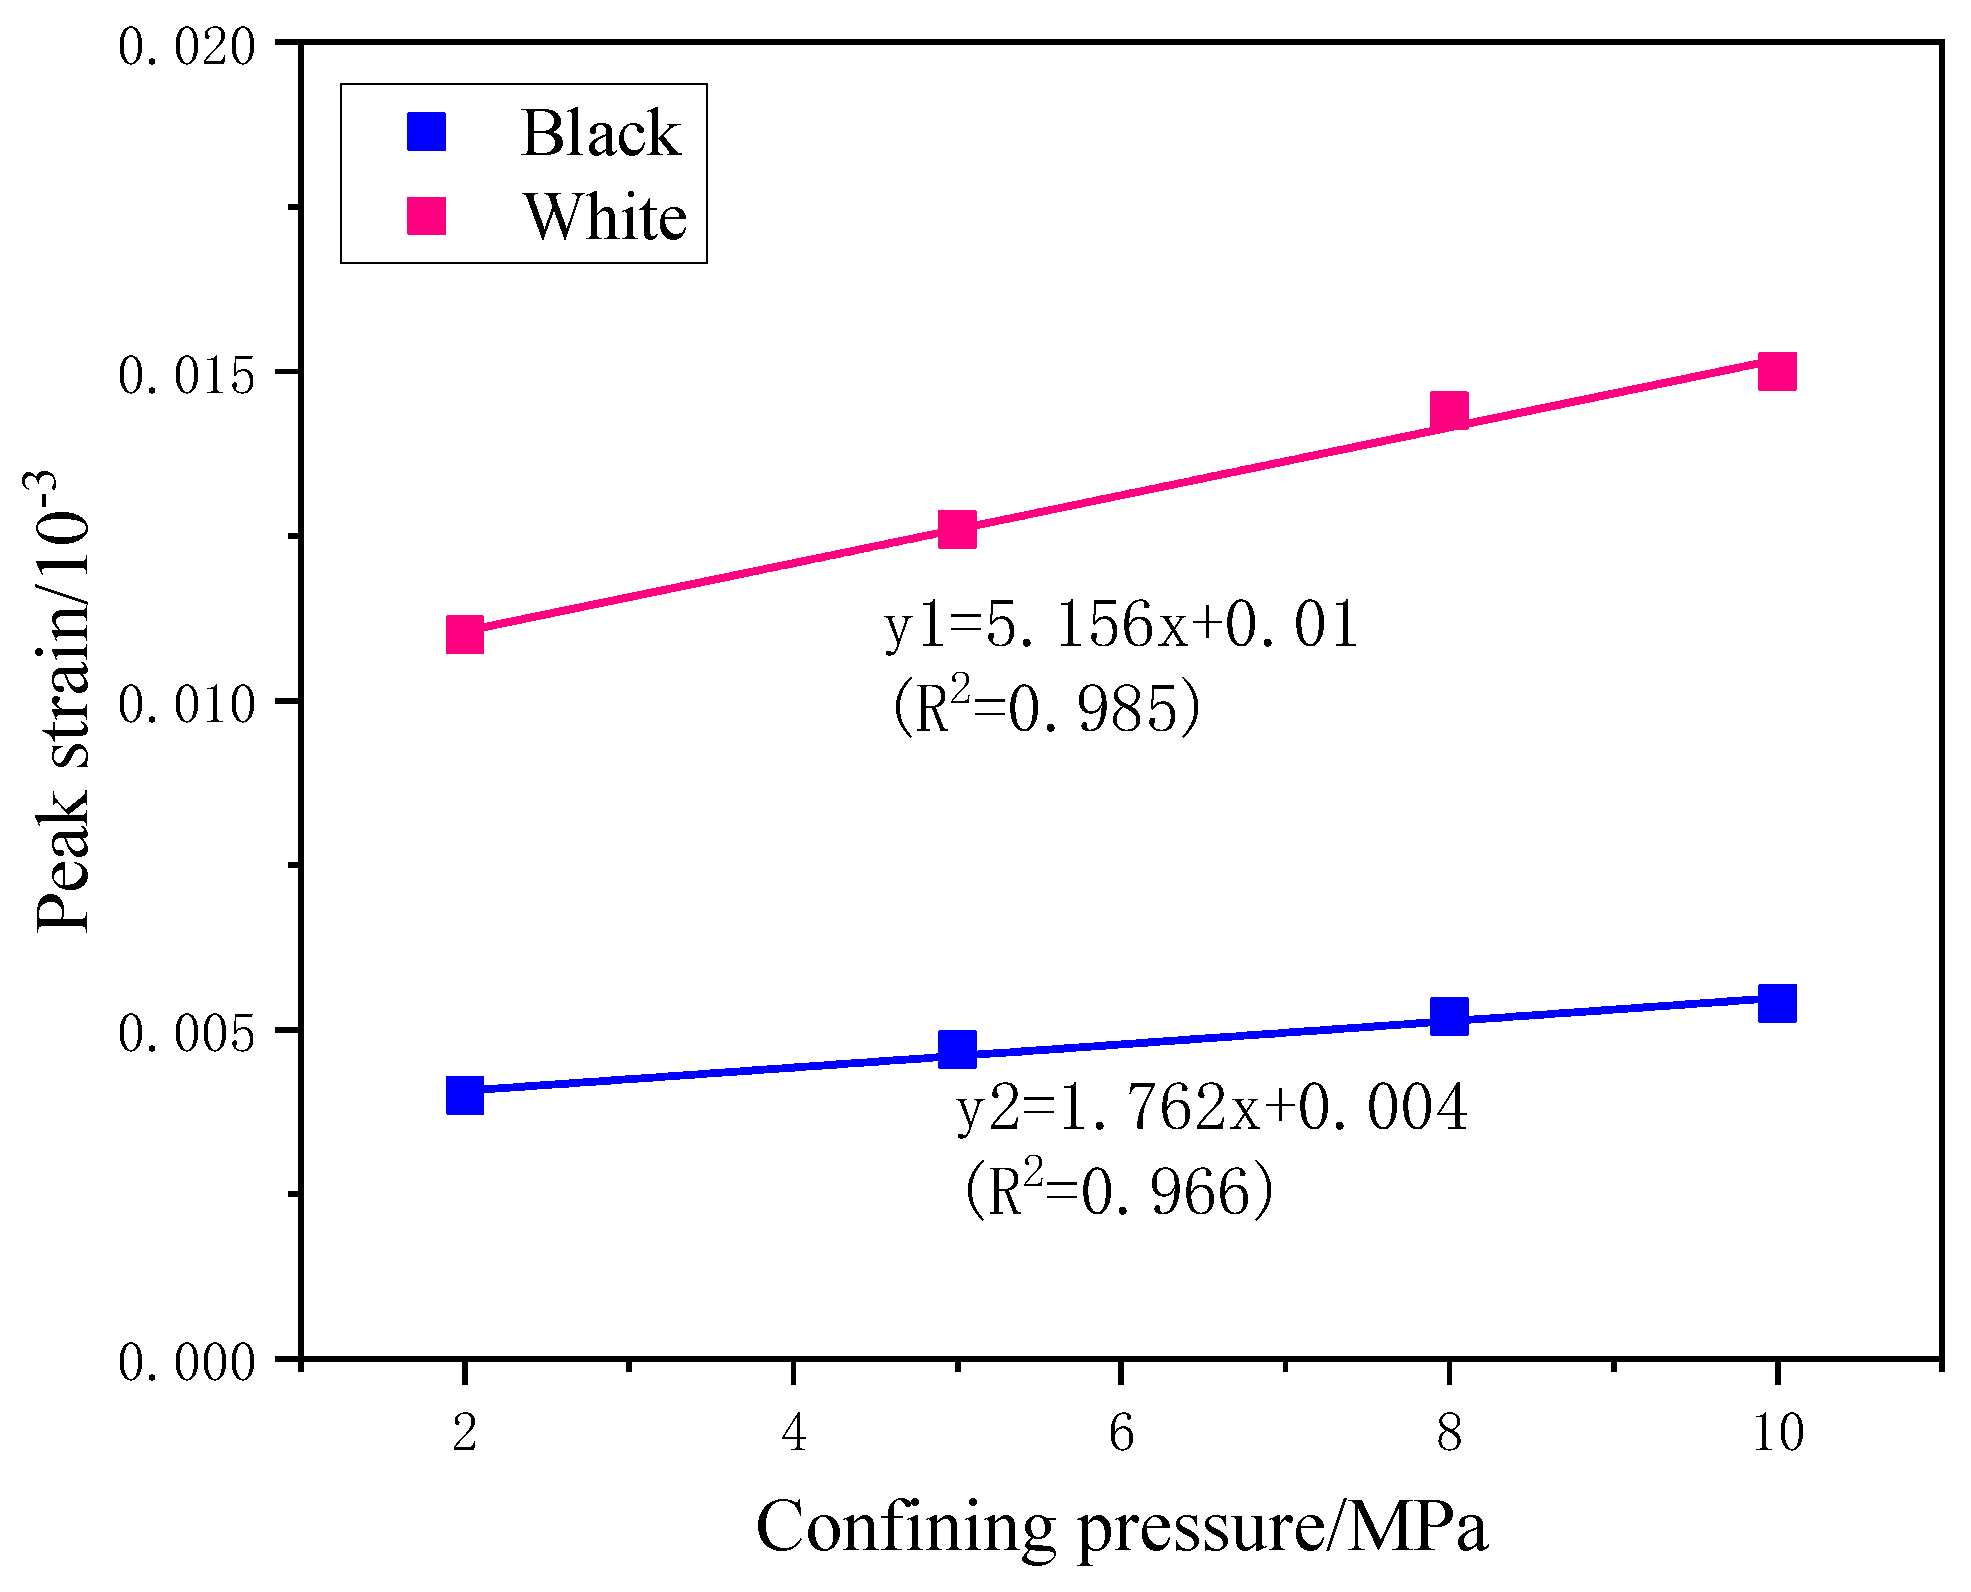
As shown in Figure 10, the plastic deformation corresponding to the peak stress increases correspondingly with the increase in confining pressure, and there may be some correlation between the peak strain and confining pressure. The peak strain here refers to the corresponding strain value when the sample reached the peak strength. The relationship between the peak strain and the confining pressure of the two types of SMS samples is shown in Figure 11. It is possible to observe that the peak strain values of specimens increase linearly with the growth of confining pressure before the ideal plastic state, which indicates that the increase of confining pressure strengthens the specimen to bear greater axial compression deformation. Meanwhile, the sensitivity of the white sample peak strain to confining pressure is significantly higher than that of the black sample. This is because the strength of the white sample was lower, so the same confining pressure had a more profound effect on the weaker white sample.
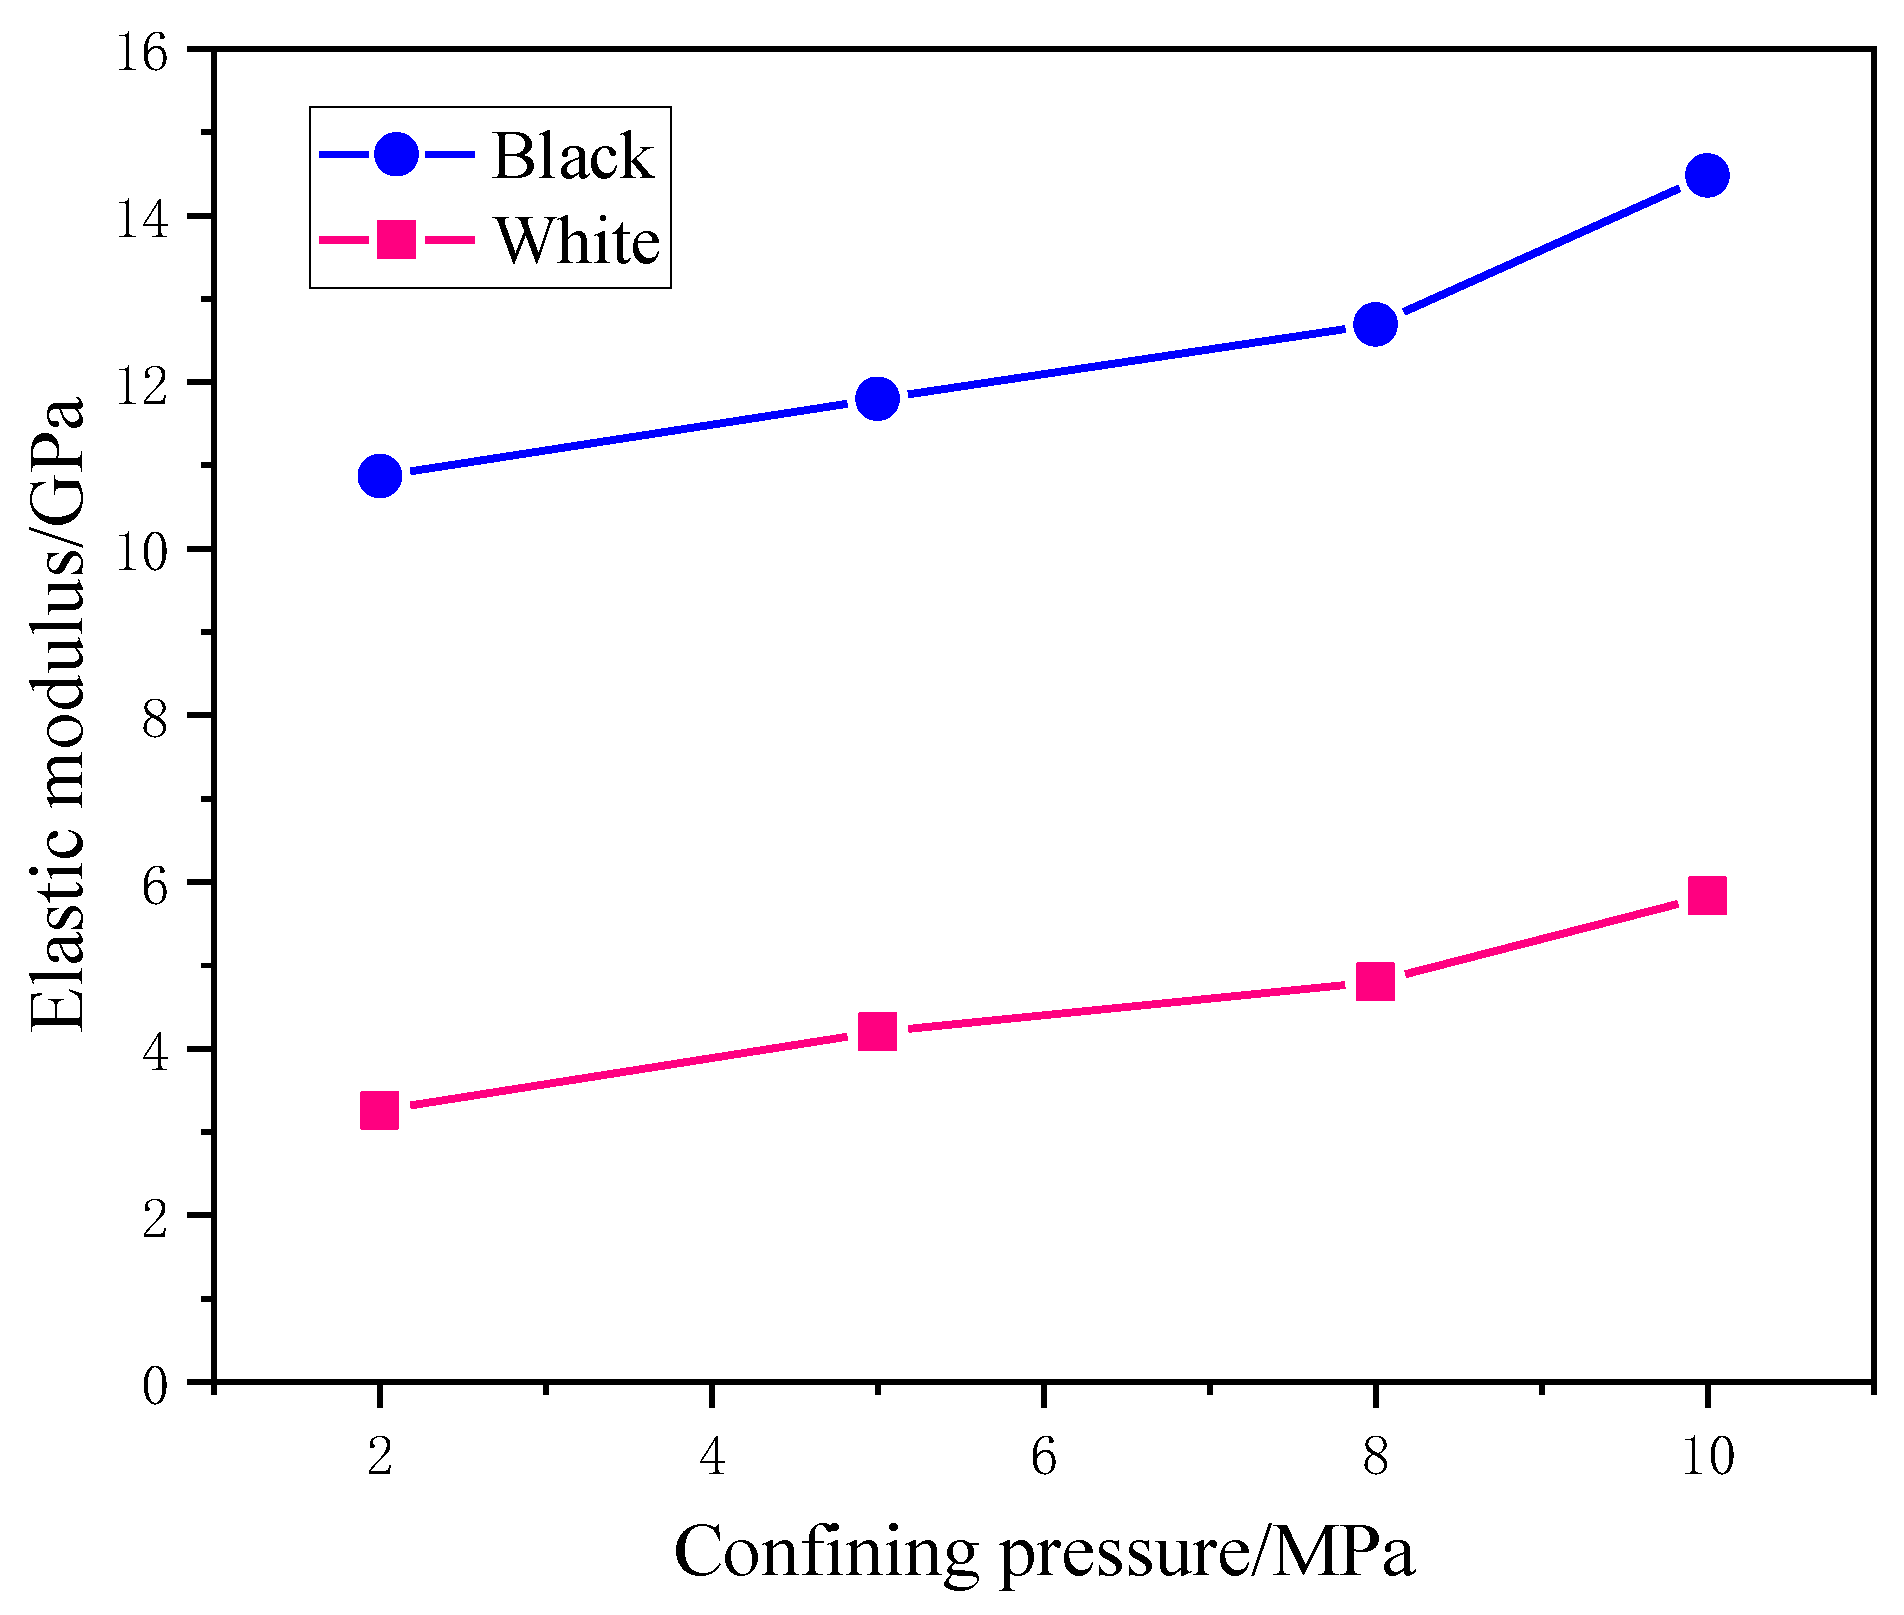
Elastic modulus and Poisson’s ratio can be used to evaluate the strength and deformation characteristics of rock, and can be a good reflection of the stiffness and deformation coefficient of elastic stage. The elastic modulus and Poisson’s ratio vary with the rock type, particle size, and pore size. Due to the limitation of test conditions, the radial deformation of rock sample cannot be well measured, only the elastic modulus of rock is analyzed. By calculating the slope of the straight section of the stress–strain curve in Figure 10 (the straight section between 30–70% of the peak strength), the evolution of elastic modulus with confining pressure can be obtained, as shown in Figure 12. It can be observed that the elastic modulus of the black sample is significantly larger than that of the white sample. In addition, the elastic modulus of the two SMS samples increased obviously with the increase in confining pressure, although there is no obvious law for the growth rate of elastic modulus with confining pressure due to the discrete nature of natural samples. This is because a higher confining pressure is conducive to crack closure, improves the stiffness of specimens, and then improves the elastic modulus of specimens. Moreover, due to the effect of confining pressure, the friction between fracture surfaces increases the bearing capacity of the crack, and the friction also affects the slip to improve the elastic modulus of SMS specimen.
3.2.2. Internal Friction Angle and Cohesion
The yield and failure law of rock strength theory under complex stress conditions has always been a hot issue in geotechnical research, by which the triaxial strength criterion of rock has been mainly studied. The Mohr Coulomb strength criterion, cohesion and internal friction coefficient, can be used to explain rock strength characteristics [30,31]. According to Coulomb strength criterion, the shear strength τm can be determined by cohesion c and internal friction angle , which can be expressed as:
where σ is the normal stress on the failure surface. When expressed in the form of principal stress, the Coulomb strength criterion can be written as follows:
where m is strength criterion parameters. Equation (3) shows that maximum axial stress σ1 of a given rock sample is linearly related to confining pressure σ3. Cohesion c and internal friction angle φ are the key mechanical parameters of the rock sample. Then the internal friction angle φ can be calculated using Formula (4).
The cohesive force (c) is
where is uniaxial compression strength.
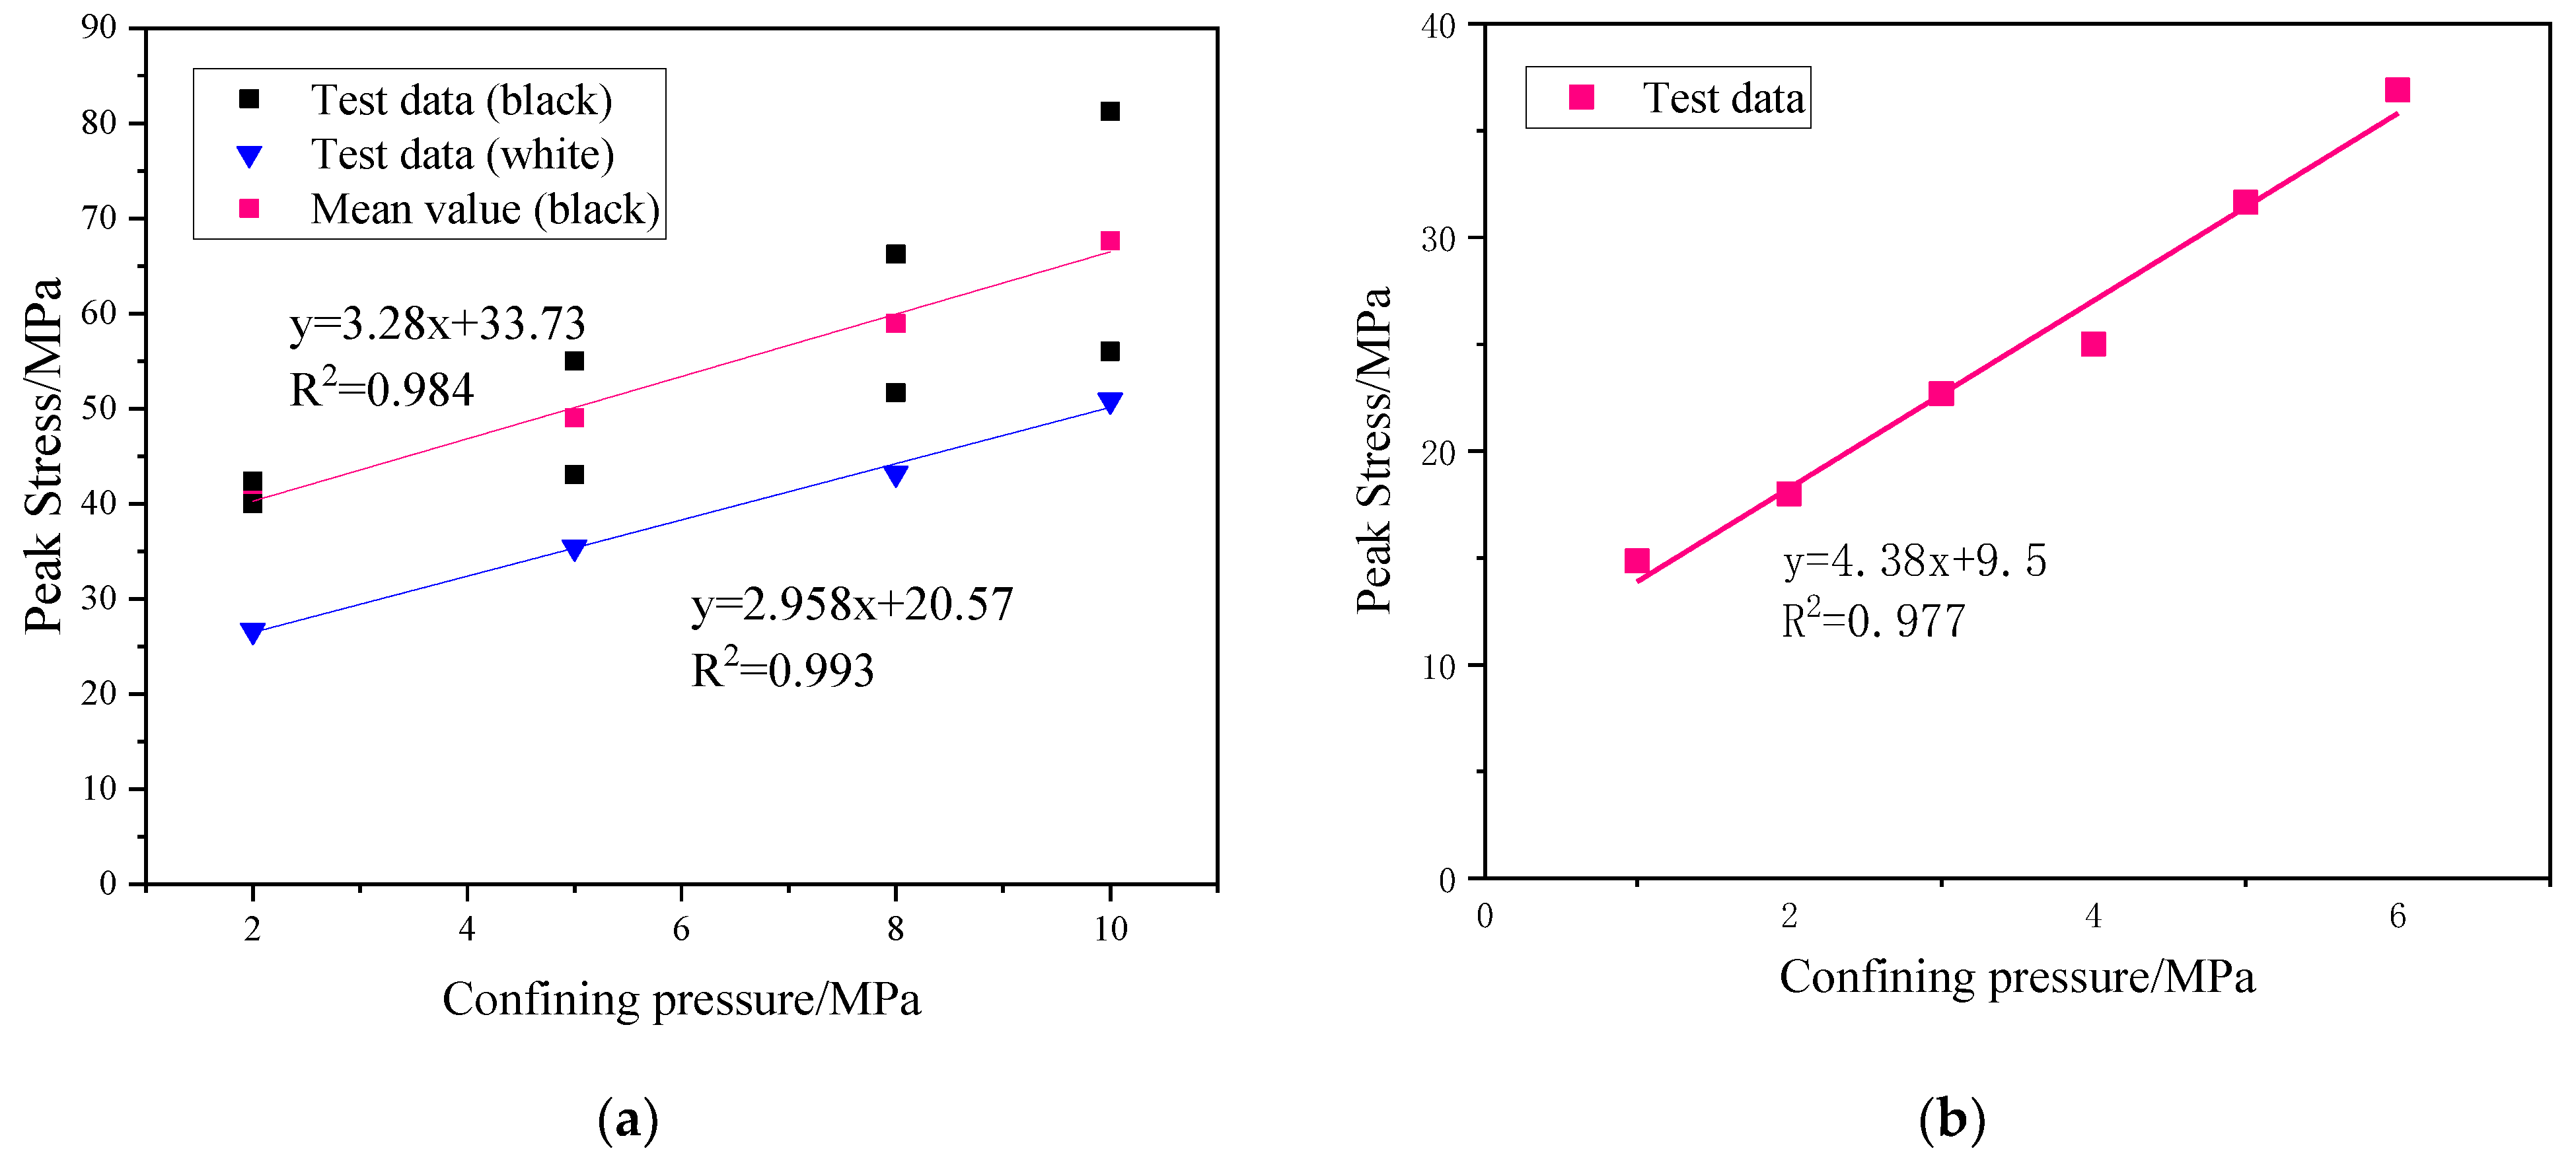
The relationship between the maximum axial stress and the confining pressure can be obtained by plotting and fitting the peak strength under different confining pressures. As natural SMS ore is the aggregate of mineral particles with a certain heterogeneity, the dispersion of peak strength is obvious under the same confining pressure. Nevertheless, the peak strength of the sample enhances with the increasing confining pressure. According to the data in Table 3, under the conditions of 2 MPa, 5 MPa, 8 MPa, and 10 MPa, the peak strength deviation of the black sample are 6%, 21.7%, 21.96% and 31%, respectively, which also indirectly proves that the increase of confining pressure leads to the increase of peak strength deviation. In order to reduce the influence of non-uniformity of material properties on test data, the average value of data under the same confining pressure is used in data fitting. Figure 13a illustrates the growth rate of axial peak stress with confining pressure is somewhat lower than the respective value shown in Figure 13b from the literature [32], although the data in the literature were measured from different single samples. The data in this linear regression analysis only include the triaxial compressive strength under different confining pressures and the uniaxial compressive strength can be predicted by the fitted curve.
The fitting curve of the black specimens was y = 3.28x + 33.73, R2 = 0.984. Using the same method, the fitting curve of the white specimens was y = 2.958x + 20.57, R2 = 0.993. The correlation coefficient R2 of the two fitting curves was greater than 0.98, which shows that there was a good correlation between the confining pressure and peak stress for the studied SMS specimens. The results of friction angle and cohesion of the two samples calculated using Formulas (3) and (4) are shown in Table 4. The predicted uniaxial compressive strength of black sample and white sample were 33.73 MPa and 20.57 MPa, respectively. In terms of white specimens, the uniaxial compressive strength predicted by triaxial compression regression analysis was higher than the test value of 17.78 MPa, in Table 3, with an error of 15.7%.
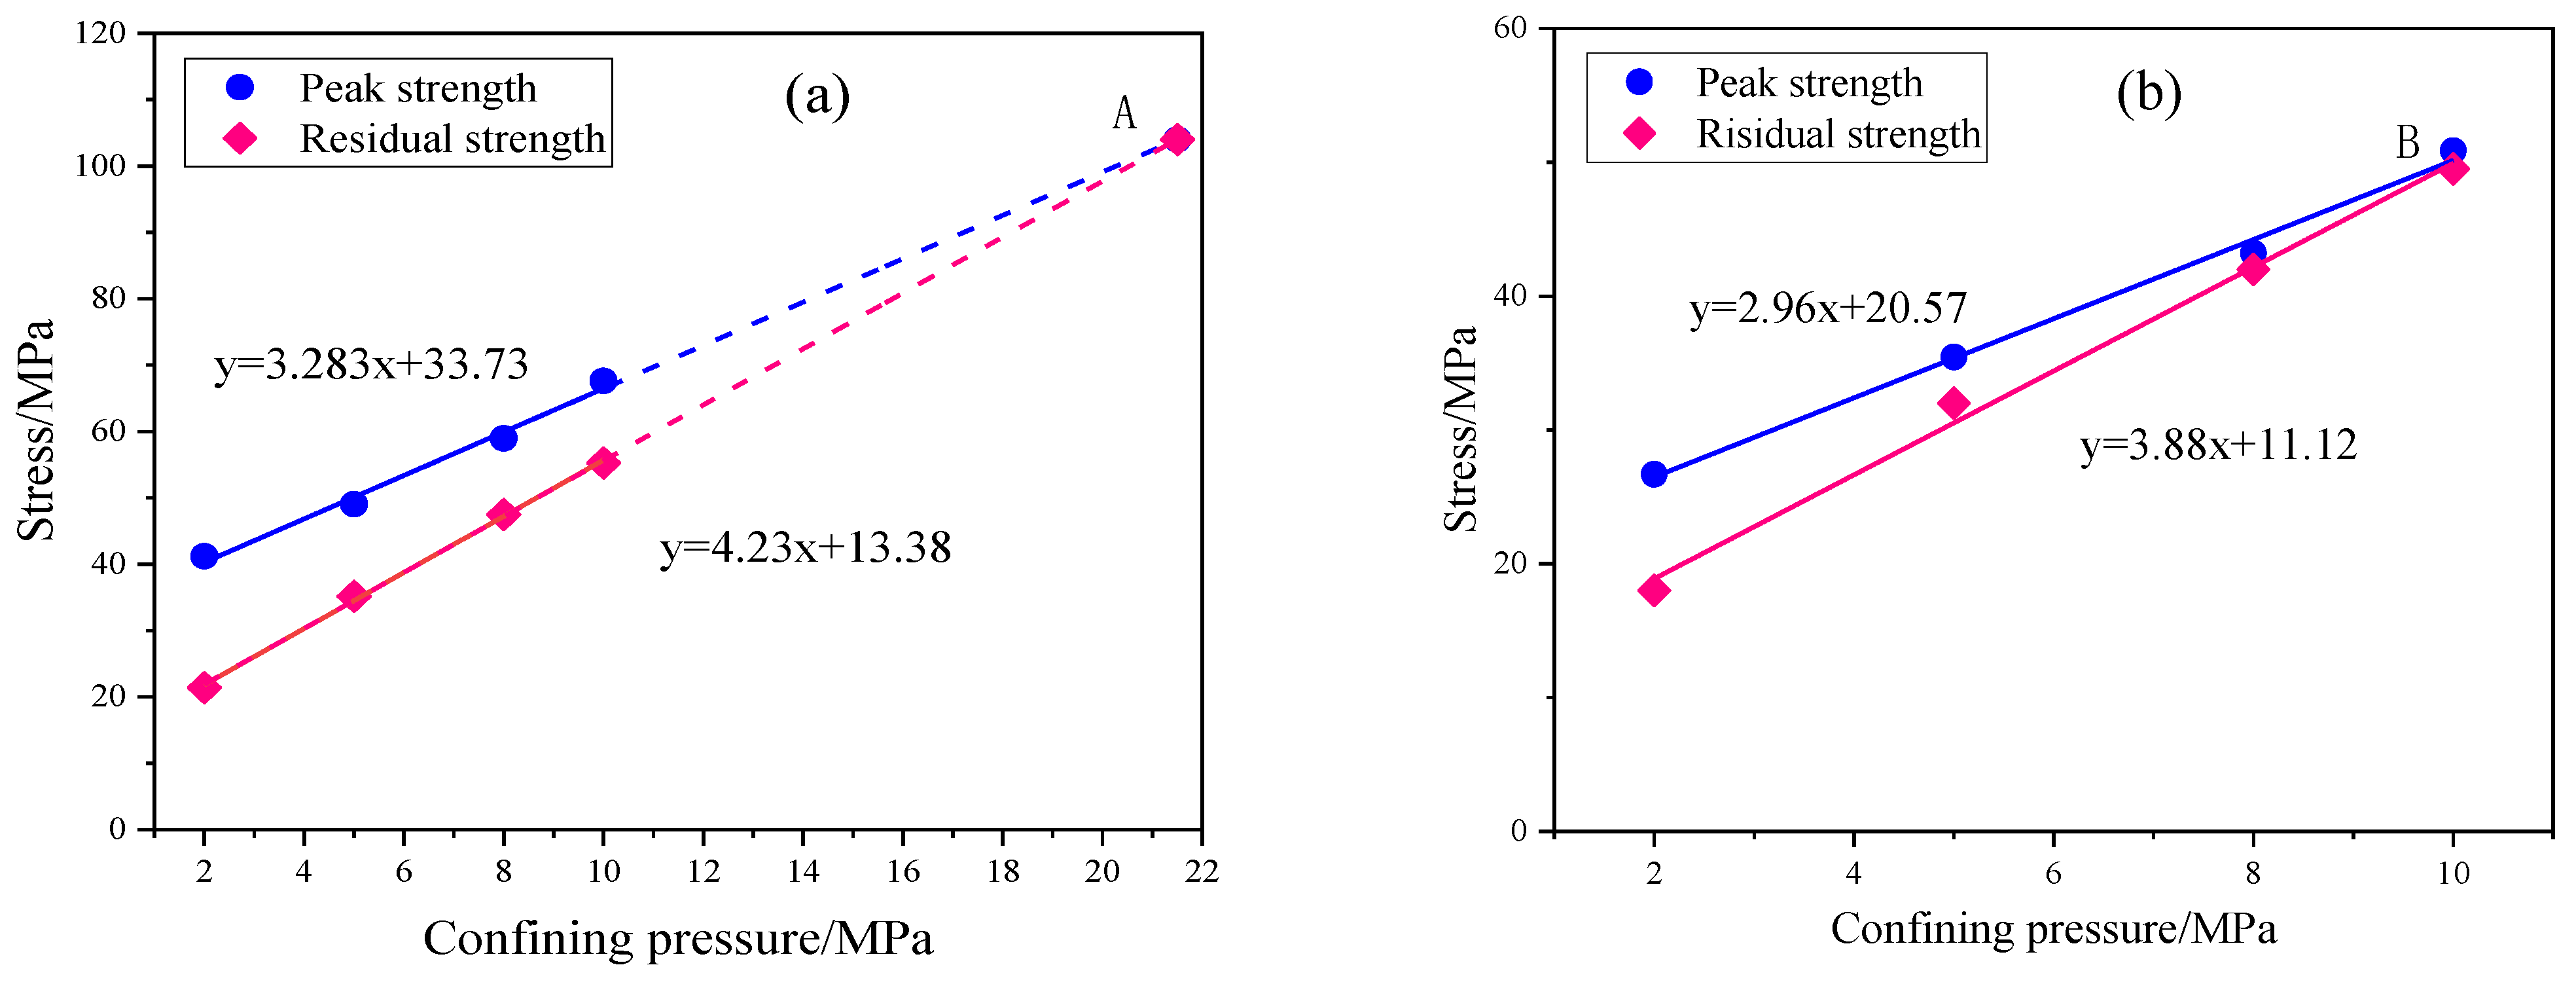
Figure 14 shows the relationship between peak strength, residual strength, and confining pressure of the two SMS samples. We can see that the variation trends of the two samples are similar, indicating that the peak strength and residual strength increased with an increase in confining pressure, and the growth rate of residual strength with confining pressure is greater than that of peak strength. After entering the residual stage, the macro fracture is formed in the specimens, and the friction between two parts is the main effect in the sample. At this time, the cohesion is low. The two straight lines in Figure 14a,b intersect at point A and point B, respectively. At the intersection, the peak strength and residual strength are equal, which means that the specimen is in the ideal plastic state. Therefore, this intersection is actually the brittle ductile transition point of SMS, and the corresponding confining pressure is the transition confining pressure. When the confining pressure is lower than the transition pressure, the specimen exhibits strain softening; and when the confining pressure is higher than the stress–strain relationship, the specimen exhibits strain hardening. As shown in Figure 14a, it can be predicted that the transition confining pressure of the small-sized black sample of SMS is about 21.5 MPa, the corresponding peak strength is about 104 MPa, and the corresponding stress ratio of critical state is about 0.21. Based on Figure 14b, the transition confining pressure of the white sample is about 10.3 MPa, the corresponding peak strength is about 51 MPa, and the stress ratio of critical state is about 0.2. This means that although the strength properties of the two types of SMS are different, the corresponding stress ratio in the critical state of them is about 0.2.
3.2.3. Failure Pattern
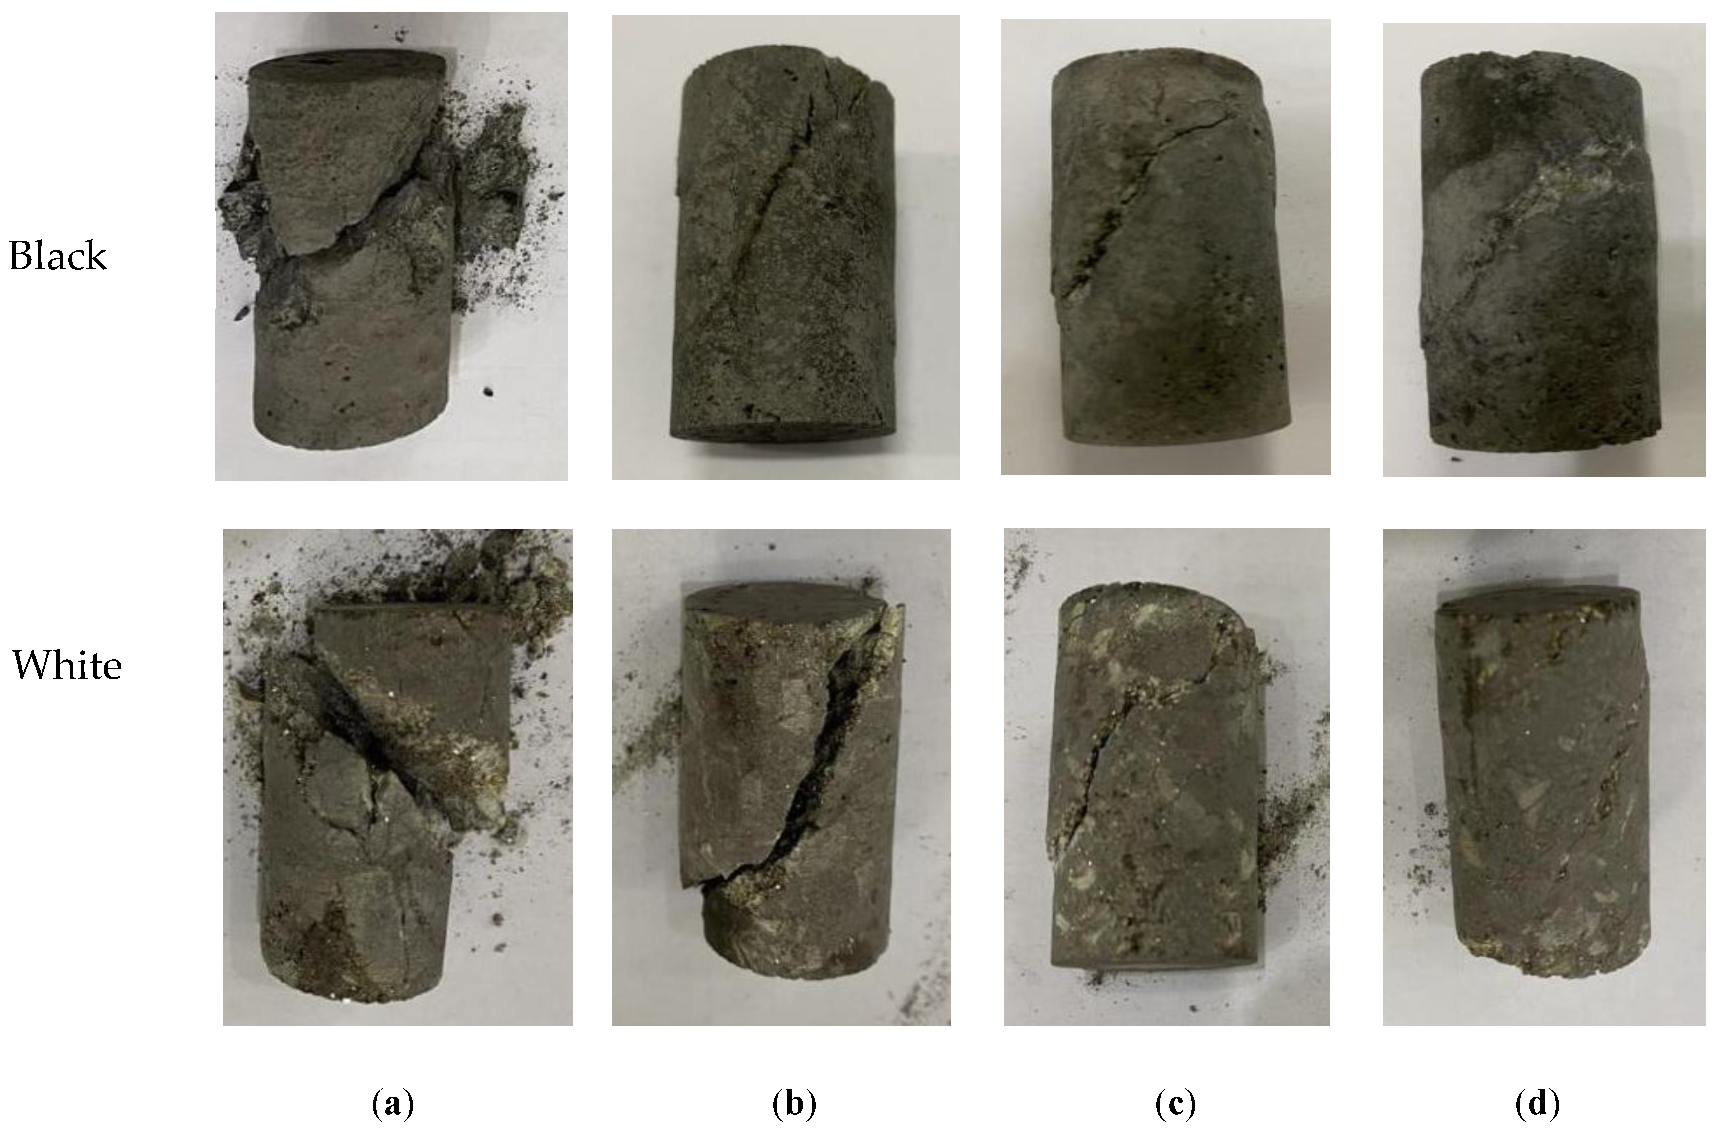
As discussed in Section 2.3, the triaxial compressive strength test of rock is a triaxial compression shear test based on the Mohr Coulomb strength failure theory. The failure pattern images of the small SMS specimens under different confining pressures are illustrated in Figure 15. It was observed that there was no significant difference between the deformation and failure modes of these samples. Three types of failure modes were observed in the specimens, namely shear slip, bulging, and mixed failure of bulging and shear slip. Shear slip means that the shear failure of a specimen occurred to the sample in a weak plane. The SMS specimen with a strain softening response produced a shear banding in the weak plane, and the shear bands were mainly distributed along the shear plane at an angle of 45° + φ/2. Specifically, when the confining pressure is 2 MPa, the specimen shows a dilatancy failure. In this case, the fracture surface is more complex, and there are shear expansion cracks in the process of shear sliding failure, which shows the characteristics of local tensile failure. With the increase in confining pressure, the failure pattern of the specimen tended to be simple at 5 MPa, and a single shear plane appeared, and the specimen cracked at one end. This could be explained by the end friction effect of the metal indenter: the stiffness of the metal indenter in contact with the end of the specimen is large, which inhibits the transverse expansion of the specimen in the process of axial compression and produces friction, changes the stress state near the end of the specimen and increases the confining pressure effect. When the confining pressure continued to increase to 8 MPa, the failure mode of specimens under triaxial compression was mainly shear failure of a single inclined plane, but the main fracture direction has a trend of transition from the end to the side. When the confining pressure increased to 10 MPa, there was no obvious fracture surface after the failure of the sample and the sample maintained a relatively high integrity. Careful observation shows that there are some small irregular oblique cracks and transverse cracks on the outside of the sample, and there is spalling in the local area. The increase of the middle diameter of the specimen indicates that the specimen has a large plastic deformation under the confining pressure.
4. Microstructural and Mineralogical Interpretation
4.1. Mineral Composition
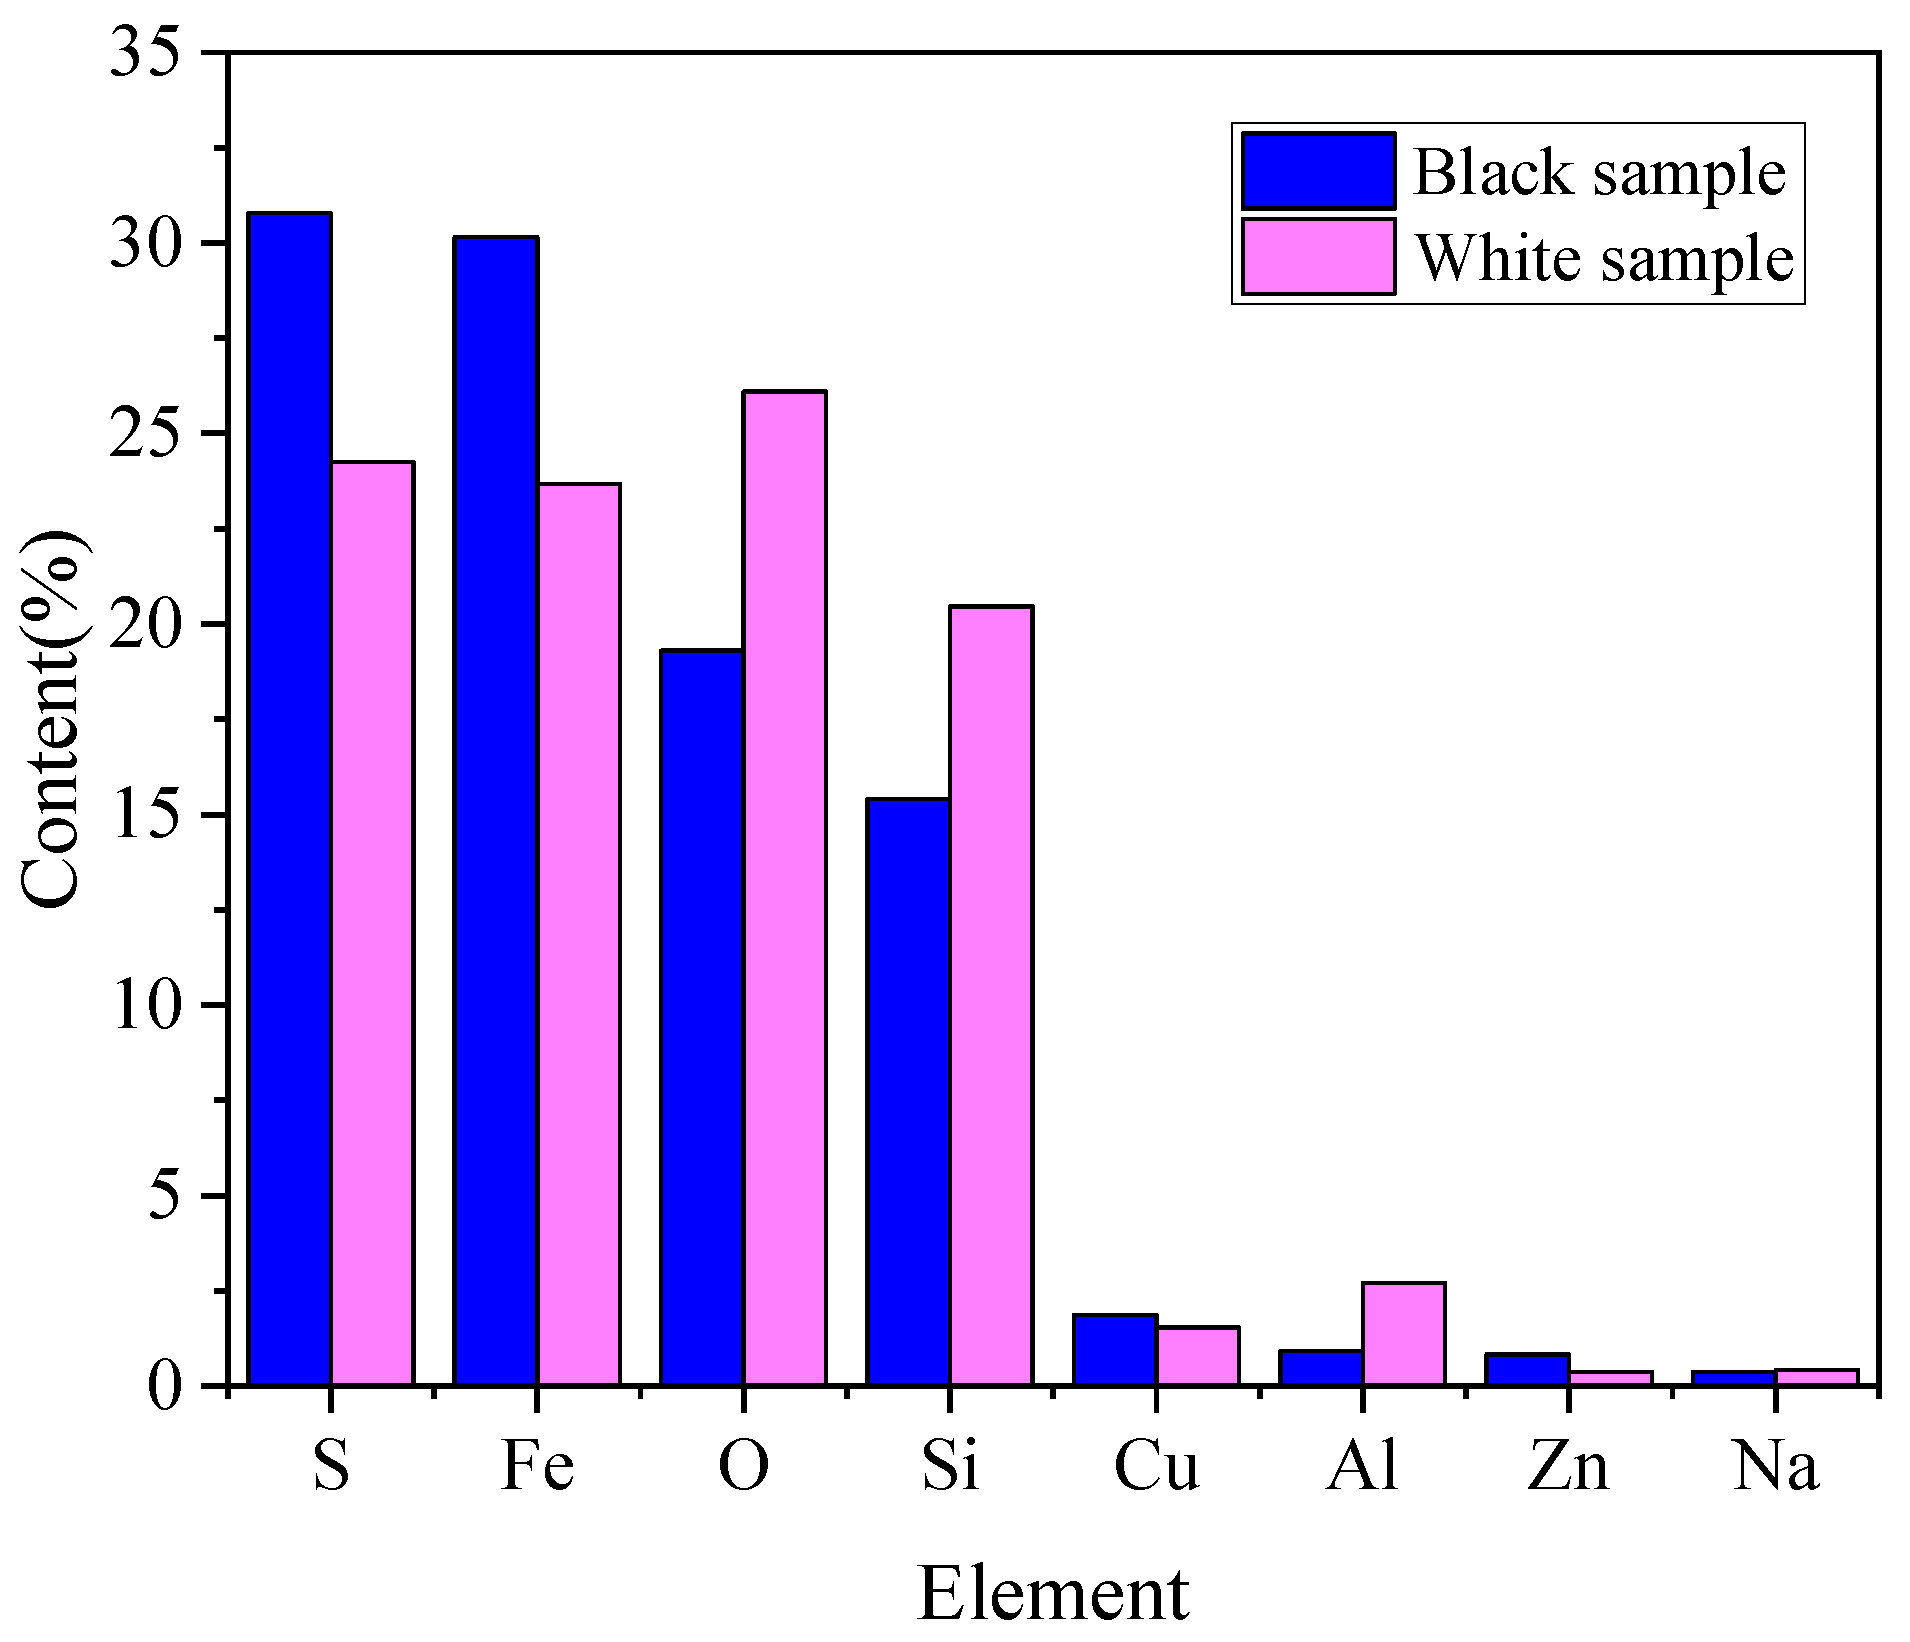
Not many results about the geotechnical properties of SMS are presently available to the public, and the influence of mineralogy seems to play an important role in the results of the geotechnical properties. From the point of view of mineral detection, the elemental composition of raw materials was first analyzed quantitatively using XRF, and the results are shown in Figure 16. We can see that the content of Fe in both minerals exceeds 20%, and that in black samples exceeds 30%. In addition, Cu + Al + Zn represent very important minerals with regard to the economic value of SMS ore. According to previous studies [13,33], an Fe sulfide compound usually exists in the form of pyrite or marcasite, and gangue abundant in SMS ore is usually composed of silica with elements of silicon and oxygen. These results are basically consistent with previous studies, and can provide some useful information for understanding the elemental composition of SMS ore. However, the number of samples and also the spectrum of the type of elements were limited, it is necessary to study and investigate more samples to obtain more significant results.
In order to further explore the relationship between mineral mechanical properties and mineralogical properties, the quantitative mineral composition was determined by using XRD. As shown in Table 5, the basic mineral phases in the black samples are pyrite, marcasite, chalcopyrite, while the difference between the white sample is that iron basically exists in the form of pyrite rather than white iron. According to the mineralogical and textural study of Lehrmann et al. [34], the mineral composition in this study is consistent with the conclusion that longer extinct SMS mounds are pre-dominated by iron mineral assemblages. In addition, combined with element quantitative analysis shown in Figure 16 and previous research results, the content of gangue minerals in white sample is significantly higher than that in black sample.
The hardness of Fe sulfide compound and amorphous silica, which account for the main content, may be a factor in the difference in the mechanical properties of the black and white samples. The chemical formula of pyrite is FeS2, which is the hardest of the main mineral phases of the ore. In the literature, Spagnoli et al. [13] and Anthony et al. [35] found measurements pf Vickers hardness number (HV units) of 1750 and 1564, respectively. The second-hardest mineral is marcasite, which is also a Fe sulfide compound with a measured HV unit of 1442 HV units and 1006 HV units in above literatures. While amorphous silica is a relatively soft phase with a low hardness value of only 500–600 HV units. Consequently, the higher content of Fe sulfide compound with a high hardness and the lower content of silica with low hardness are an important reason why the strength of the black sample is significantly higher than that of the white sample.
4.2. Microscopic Interpretation
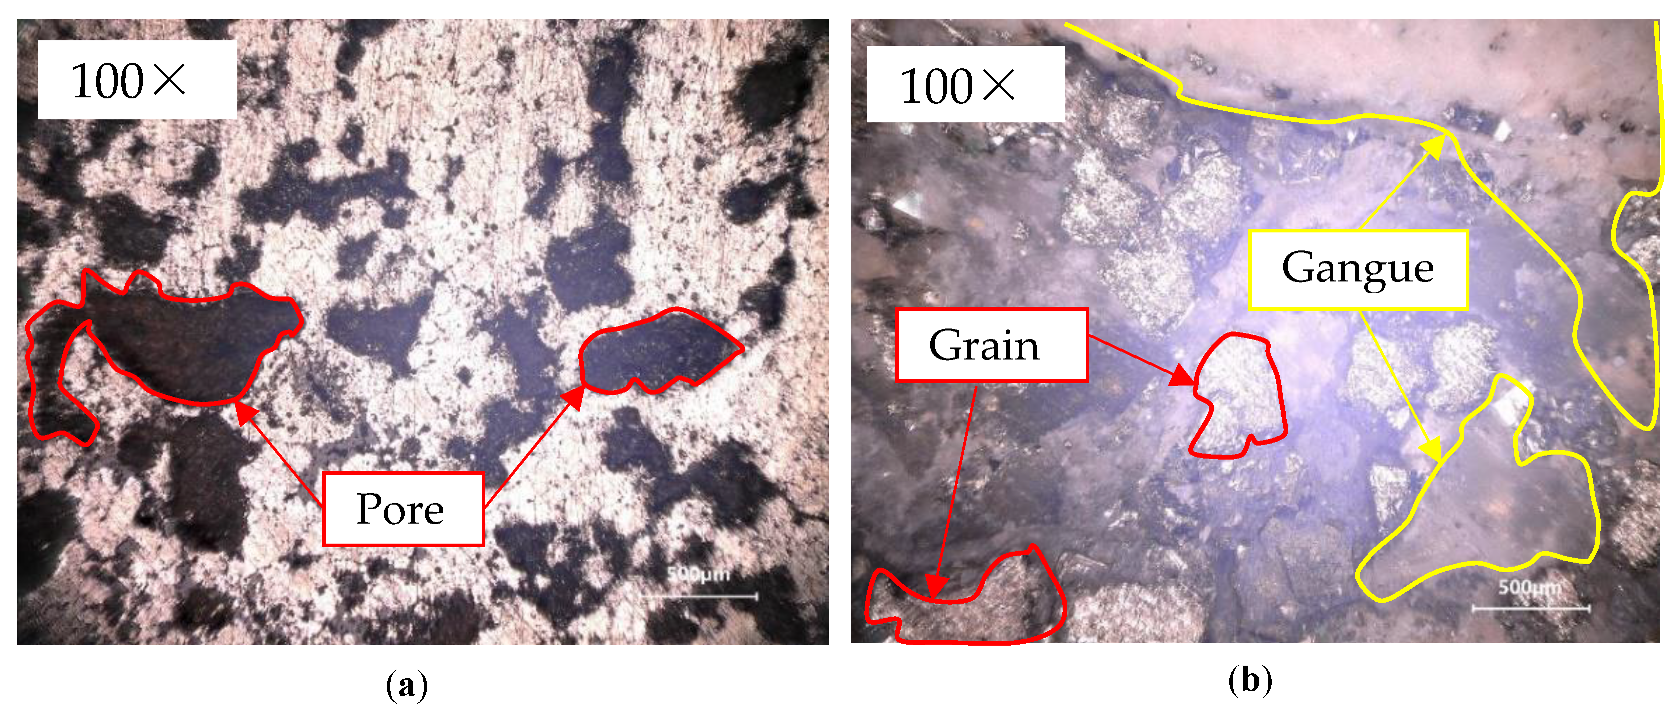
The investigation also focuses on internal structure from the micro perspective, since the intergrowth patterns of the porosity with the supporting mineral framework will have an influence on the geotechnical strength behavior. In general, the porosity exhibits an inverse relationship to the stability of the mineral substance. As shown in Table 1, the porosity of the black sample and the white sample are 20.94% and 25.86% respectively. Microcracks generated by pores easily expand in the compression process, and further produce instability failure through rock samples, which affects the bearing capacity and reduces the strength. Figure 17a,b shows the 100 times magnification planar micrographs of two kinds of SMS samples, showing remarkable differences between the microstructures of the studied ore types. As shown in some geological research [13], further influences controlling the strength of SMS could be the average grain size and the degree of connected porosity. According to the microscopic study of cross-section polishing, it can be seen that the interior of the black sample is very fine and dense, the observed pores are very irregular, and the connection degree between the pores is low, which leads to the high strength of the material. In the white sample, there are many granular structures with a loose arrangement, and the single particle size can reach 500 μm. The porosity is well interconnected and controlled by the surface construction of grains with different sizes. For these reasons, the strength of the white sample is low.
Although there are local structural differences among different samples in the above mineralogical investigation, different test results still show high correspondence. For example, black samples with higher material strength usually contain a higher content of Fe sulfide compound with high hardness and less silica with low hardness. Furthermore, the black sample has not only the lowest porosity, but is also characterized by fine-grained and is densely intergrown. On the contrary, the white sample is characterized by a very high porosity combined with a high degree of pore interconnection and very high amorphous silica content, all of which leads to a lower material strength and weak resistance to external force deformation. Consequently, in the triaxial compression test, the same confining pressure will show a greater impact on the white sample with lower material strength, and will show strain hardening more easily. Moreover, higher confining pressure is conducive to crack closure, and the friction between fracture surfaces increases the crack bearing capacity, which will lead to the improvement of the elastic modulus of SMS specimens with the increase of confining pressure.
5. Conclusions
This study presents a detailed analysis on the physical and mineralogical properties of SMS samples coming from the southwest Indian Ocean ridge area. The conclusions are summarized as follows:
(1) The tensile strength and compressive strength of the black sample are higher than those of white samples. According to the mineral test results of the two samples, the basic mineral phases in the studied massive sulfide samples are pyrite, marcasite and chalcopyrite, and the gangue phase is mainly amorphous silica. The black sample contains more metal phases with higher strength, while the silica component with lower strength in the white sample is higher. The mineral composition may be one of the reasons for the high material strength of the black sample and the low material strength of the white sample. In addition, the porosity exhibits an inverse relationship to the stability of the mineral substance [13] further influences controlling the strength of SMS could be the average grain size and the degree of connected porosity.
(2) From the geotechnical point of view, both the black and white specimens show typical brittle failure characteristics. In the process of triaxial compression, the load displacement curve generally goes through three stages: compaction, linear elasticity and failure drop. The difference is that the post peak characteristics of black samples show obvious strain softening, while the strain softening behavior of white samples gradually changes to strain hardening with the increase of confining pressure. Consequently, in the triaxial compression test, the same confining pressure will cause a greater influence and damage on the white sample with lower material strength, and will show strain hardening more easily.
(3) Due to more coarse particles, higher porosity and better internal pore connectivity, the elastic modulus of white samples is lower than that of black samples. This is because this loose structure is easier to cause dislocation and deformation between internal particles in compression, resulting in the increase of elastic modulus. With the increase of confining pressure, the deformation and failure of the material are further limited, resulting in the increase of peak strength, elastic modulus and axial strain of the two specimens. Moreover, within the test confining pressure range, the two kinds of samples conform to the Mohr Coulomb strength criterion. Additionally, there is a positive linear relationship between the peak strain and confining pressure. According to the criterion, the internal friction angle and cohesion of the samples are calculated, which provides basic research for the mining research of SMS and provides reference.
(4) The failure mode of SMS samples in triaxial compression is mainly along a shear plane. When the confining pressure is low, the specimen shows a dilatancy failure, showing brittle failure characteristics. With the increase of confining pressure, it shows shear failure along the shear plane. As confining pressure increases further, confining pressure restrains lateral deformation, and the expansion failure mode plays a leading role in SMS specimens.
It should be noted that this study only considers the strength and deformation behavior of materials under triaxial stress, rather than water pressure. Therefore, the conclusion can only reveal the mechanical parameters of SMS material without considering the permeability under hydrostatic pressure. In addition, it is necessary to study and investigate more samples to obtain more significant results, which can also be statistically interrelated.
Author Contributions
The paper emerged from the long-term cooperation of the authors. Conceptualization, Y.L. and H.D.; methodology, H.D.; test and analysis, H.D. and M.L.; writing—original draft preparation, H.D.; writing—review and editing, Y.L. and M.L. All authors have read and agreed to the published version of the manuscript.
Funding
This research was funded by the National Natural Science Foundation of China, grant number 51674286; Major science and technology projects of Hunan Province, China, grant number 2020GK1020 and the Planned Science and Technology Project of Hunan Province, China, grant number 2019SK2271.
Acknowledgments
The authors would like to thank China Ocean Sample Repository for providing valuable samples of polymetallic sulfides and thank the editors and anonymous reviewers for their careful work and thoughtful suggestions that have helped improve this paper substantially.
Conflicts of Interest
The authors declare no conflict of interest.
References
- Li, Y.; Liu, C.; Su, S.H. Analysis of the Effect of Payment Mechanism on Exploitation of Polymetallic Nodules in the Area. Minerals 2021, 11, 221. [Google Scholar] [CrossRef]
- Petersen, S.; Krätschell, A.; Augustin, N. News from the seabed—Geological characteristics and resource potential of deep-sea mineral resources. Mar. Policy 2016, 70, 175–187. [Google Scholar] [CrossRef]
- Kato, Y.; Fujinaga, K.; Nakamura, K. Deep-Sea Mud in the Pacific Ocean as a Potential Resource for Rare-Earth Elements. Nat. Geosci. 2011, 4, 535–539. [Google Scholar] [CrossRef]
- Kowalczuk, P.B.; Snook, B.; Kleiv, A.R. Efficient extraction of copper and zinc from seafloor massive sulphide rock samples from the Loki’s Castle area at the Arctic Mid-Ocean Ridge. Miner. Eng. 2018, 115, 106–116. [Google Scholar] [CrossRef]
- Boschen, R.E.; Rowden, A.A.; Clark, M.R. Mining of deep-sea seafloor massive sulfides: A review of the deposits, their benthic communities, impacts from mining, regulatory framework and management strategies. Ocean Coast. Manag. 2013, 84, 54–67. [Google Scholar] [CrossRef] [Green Version]
- Münch, U.; Lalou, C.; Halbach, P. Relict hydrothermal events along the super-slow Southwest Indian spreading ridge near 63degree56primeE-mineralogy, chemistry and chronology of sulfide samples. Chem. Geol. 2001, 177, 341–349. [Google Scholar] [CrossRef]
- Cao, H.; Sun, Z.L.; Liu, C.L. Mineralogical composition and its significance of hydrothermal sulfides from the Longqi hydrothermal field on the Southwest Indian Ridge. Mar. Geol. Quat. Geol. 2018, 38, 179–192. [Google Scholar]
- Halbach, P.; Fouquet, Y.; Herzig, P. Energy and Mass Transfer in Marine Hydrothermal Systems; Dahlem University Press: Berlin, Germany, 2003; pp. 85–122. [Google Scholar]
- Nakamura, K.; Takai, K. Indian Ocean. Hydrothermal Systems: Seafloor Hydrothermal Activities, Physical and Chemical Characteristics of Hydrothermal Fluids, and Vent-Associated Biological Communities; Springer: Tokyo, Japan, 2015. [Google Scholar]
- Spagnoli, G.; Freudenthal, T.; Strasser, M. Development and Possible Applications of Mebo200 for Geotechnical Investigations for the Underwater Mining. In Proceedings of the Offshore Technology Conference, Houston, TX, USA, 5 May 2014. [Google Scholar]
- Yamazaki, T. Economic Validation Analyses of Japan’s Proposed Nodule, Crust, and Kuroko-type SMS Mining in 2006. In Proceedings of the IEEE Xplore, Vancouver, BC, Canada, 29 September–4 October 2007. [Google Scholar] [CrossRef]
- Yamazaki, T.; Park, S.H. Relationship Between Geotechnical Engineering Properties and Assay of Seafloor Massive Sulphides. In Proceedings of the 13th International Offshore and Polar Engineering Conference, Honolulu, HI, USA, 25–30 May 2003. [Google Scholar]
- Spagnoli, G.; Jahn, A.; Halbach, P. First results regarding the influence of mineralogy on the mechanical properties of seafloor massive sulfide samples. Eng. Geol. 2016, 214, 127–135. [Google Scholar] [CrossRef]
- Chemenda, A.I. Three-dimensional numerical modeling of hydrostatic tests of porous rocks in a triaxial cell. Int. J. Rock Mech. Min. Sci. 2015, 76, 33–43. [Google Scholar] [CrossRef]
- Miyazaki, K.; Masui, A.; Sakamoto, Y. Triaxial compressive properties of artificial methane-hydrate-bearing sediment. J. Geophys. Res. Solid Earth 2011, 116, B06102. [Google Scholar] [CrossRef]
- Zhang, B.A.; Li, X.M.; Zhang, D.M. Study on Mechanical and Permeability Characteristics of Containing Gas Coal-Rock Under Conventional Triaxial Compression. Geotech. Geol. Eng. 2021, 04, 1–12. [Google Scholar]
- Su, C.D.; Fu, S.Y. Experimental study of triaxial compression deformation and strength characteristics of red sandstone. Chin. J. Rock Mech. Eng. 2014, 33, 3164–3169. [Google Scholar]
- Xu, W.B.; Liu, B.; Wu, W.L. Strength and deformation behaviors of cemented tailings backfill under triaxial compression. J. Cent. South Univ. 2020, 27, 3531–3543. [Google Scholar] [CrossRef]
- Wang, Y.Z.; Wang, Y.B.; Zhao, Y.Z. Experimental study on ultra-high performance concrete under triaxial compression. Constr. Build. Mater. 2020, 263, 120225. [Google Scholar] [CrossRef]
- Kodvanj, J.; Garbatov, Y.; Soares, C. Numerical analysis of stress concentration in non-uniformly corroded small-scale specimens. J. Mar. Sci. Appl. 2020, 20, 1–9. [Google Scholar] [CrossRef]
- Garbatov, Y.; Soares, C.G.; Parunov, J. Tensile strength assessment of corroded small-scale specimens. Corros. Sci. 2014, 85, 296–303. [Google Scholar] [CrossRef]
- Hu, W.L.; Dano, C.; Hicher, P.Y. Effect of sample size on the behavior of granular materials. Geotech. Test. J. 2011, 34, 186–197. [Google Scholar]
- LI, C.Y.; CHEN, Z.B. Specimen size effect of strongly weathered granite of seabed in triaxial tests under K0-consolidation condition. J. Cent. South Univ. (Sci. Technol.) 2020, 51, 1646–1653. [Google Scholar]
- Zhu, J.G.; Zhong, L.; Weng, H.Y. Study on Effect of Specimen Size upon Strength and Deformation Behaviour of Coarse-grained Soil in Triaxial Test. J. Sichuan Univ. (Eng. Sci. Ed.) 2012, 44, 92–96. [Google Scholar]
- Grima, A.; Miedema, M.; Van De Ketterij, S.A. Effect of high hyperbaric pressure on rock cutting process. Eng. Geol. 2015, 196, 24–36. [Google Scholar] [CrossRef]
- Kaitkay, P.; Lei, S. Experimental study of rock cutting under external hydrostatic pressure. J. Mater. Process. Technol. 2005, 195, 206–213. [Google Scholar] [CrossRef]
- Waquet, B.; Faulds, D.; Benbia, A. Understanding the Effects of Deep-Sea Conditions on Seafloor Massive Sulfide Deposits Crushing Process. In Proceedings of the Offshore Technology Conference, Houston, TX, USA, 5 May 2011. [Google Scholar]
- Hannington, M.; Jamieson, J.; Monecke, T. The abundance of seafloor massive sulfide deposits. Geology 2011, 39, 1155–1158. [Google Scholar] [CrossRef]
- Paterson, M.S.; Wong, T. Experimental Rock Deformation—The Brittle Filed; Springer: Berlin/Heidelberg, Germany, 2005; pp. 211–237. [Google Scholar]
- Jaeger, J.C.; Cook, N.G.W.; Zimmerman, R. Fundamentals of Rock Mechanics; Wiley-Blackwell: Hoboken, NJ, USA, 2007. [Google Scholar]
- Labuz, J.F.; Zang, A. Mohr–Coulomb Failure Criterion. Rock Mech. Rock Eng. 2012, 45, 975–979. [Google Scholar] [CrossRef] [Green Version]
- Dai, Y.; Ma, F.Y.; Zhu, X. Mechanical Tests and Numerical Simulations for Mining Seafloor Massive Sulfides. J. Mar. Sci. Eng. 2019, 7, 252. [Google Scholar] [CrossRef] [Green Version]
- Chen, X.; Sun, X.M.; Wu, Z.W. Mineralogy and Geochemistry of Deep-Sea Sediments from the Ultraslow-Spreading Southwest Indian Ridge: Implications for Hydrothermal Input and Igneous Host Rock. Minerals 2021, 11, 138. [Google Scholar] [CrossRef]
- Lehrmann, B.; Stobbs, L.; Lusty, P. Insights into Extinct Seafloor Massive Sulfide Mounds at the TAG, Mid-Atlantic Ridge. Minerals 2018, 8, 302. [Google Scholar] [CrossRef] [Green Version]
- Anthony, J.W.; Bideaux, R.A.; Bladh, K.W. Handbook of Mineralogy; Mineralogical Society of America: Chantilly, France, 2003; Volume I, pp. 20151–21110. [Google Scholar]
Figure 1.
Experimental plan of this study.

Figure 2.
Original SMS samples. (a) black sample; (b) white sample.

Figure 3.
Specimens of triaxial compression test.

Figure 4.
Specimens of Brazilian splitting test.

Figure 5.
Brazilian splitting test device and principle. (a) Device for the Brazilian splitting test and (b) diagram of loading and stress distribution in the splitting test.
Figure 5.
Brazilian splitting test device and principle. (a) Device for the Brazilian splitting test and (b) diagram of loading and stress distribution in the splitting test.

Figure 6.
High performance rock triaxial test system MTS 815.

Figure 7.
Evolution of stress state of SMS specimen in triaxial compression test.

Figure 8.
Tensile stress–displacement curve of (a) black sample and (b) white sample.

Figure 9.
Brazilian splitting failure modes of two kinds of SMS samples. (a) Black; (b) White.

Figure 10.
Stress strain curves of (a) black sample and (b) white sample.

Figure 11.
Relationship between peak axial strain and confining pressure.

Figure 12.
Elastic modulus of SMS specimens.

Figure 13.
Relationship between peak stress and confining pressure of (a) small-scale specimens and (b) standard specimens [32].
Figure 13.
Relationship between peak stress and confining pressure of (a) small-scale specimens and (b) standard specimens [32].

Figure 14.
Strength analysis of (a) black sample and (b) white sample.

Figure 15.
Failure pattern images of SMS specimens under different confining pressure: (a) 2 MPa; (b) 5 MPa; (c) 8 MPa; (d) 10 MPa.
Figure 15.
Failure pattern images of SMS specimens under different confining pressure: (a) 2 MPa; (b) 5 MPa; (c) 8 MPa; (d) 10 MPa.

Figure 16.
Element content of specimens.

Figure 17.
Micrographs of specimens: (a) black sample and (b) white sample.


Table 1.
Density and porosity of the SMS samples.
| Type | Dry Density (kg/m3) | Wet Density (kg/m3) | Porosity (%) |
|---|---|---|---|
| Black | 3050 | 3245 | 20.94 |
| White | 3145 | 3387 | 25.86 |
Table 2.
Data of Brazilian splitting test.
| Number | Size | P (kN) | σt (MPa) | Type | |
|---|---|---|---|---|---|
| Diameter (mm) | Height (mm) | ||||
| 1 | 25.43 | 25.02 | 3.952 | 3.95 | Black |
| 2 | 25.44 | 25.05 | 3.520 | 3.52 | Black |
| 3 | 25.42 | 25.04 | 4.035 | 4.04 | Black |
| 4 | 25.33 | 24.97 | 2.335 | 2.35 | White |
| 5 | 25.36 | 25.03 | 1.626 | 1.63 | White |
| 6 | 25.31 | 25.01 | 2.131 | 2.14 | White |
Table 3.
Data of triaxial compression test.
| Number | Size | σ1 (MPa) | σ3 (MPa) | Type | |
|---|---|---|---|---|---|
| Diameter (mm) | Height (mm) | ||||
| 1-1 | 25.30 | 50.08 | 2 | 42.40 | Black |
| 1-2 | 25.28 | 50.06 | 2 | 40.00 | Black |
| 1-3 | 25.26 | 50.08 | 5 | 55.00 | Black |
| 1-4 | 24.96 | 50.06 | 5 | 43.08 | Black |
| 1-5 | 25.14 | 50.04 | 8 | 66.22 | Black |
| 1-6 | 25.08 | 50.02 | 8 | 51.68 | Black |
| 1-7 | 25.44 | 50.06 | 10 | 81.25 | Black |
| 1-8 | 24.95 | 50.02 | 10 | 54.03 | Black |
| 2-1 | 25.08 | 50.08 | 0 | 17.78 | White |
| 2-2 | 25.18 | 50.04 | 2 | 26.68 | White |
| 2-3 | 25.14 | 50.07 | 5 | 35.44 | White |
| 2-4 | 25.13 | 50.12 | 8 | 43.21 | White |
| 2-5 | 25.17 | 50.16 | 10 | 50.87 | White |
Table 4.
Cohesion and internal friction angle of two types of specimens.
| Sample Type | Cohesion c (MPa) | Internal Friction Angle φ (°) |
|---|---|---|
| Black | 9.31 | 32.19 |
| White | 5.98 | 29.67 |
Table 5.
Mineral composition of two types of specimens.
| Sample Type | Pyrite (FeS2) | Marcasite (FeS) | Chalcopyrite (CuFeS2) | Others (Including Amorphous) |
|---|---|---|---|---|
| Black | 25.1% | 31.9% | 5.4% | 37.6% |
| White | 46.3% | -a | 4.2 | 49.5% |
a The content is very small and can be ignored.
Publisher’s Note: MDPI stays neutral with regard to jurisdictional claims in published maps and institutional affiliations. |
© 2021 by the authors. Licensee MDPI, Basel, Switzerland. This article is an open access article distributed under the terms and conditions of the Creative Commons Attribution (CC BY) license (https://creativecommons.org/licenses/by/4.0/).
Share and Cite
MDPI and ACS Style
Dai, H.; Li, Y.; Li, M. Experimental Study on Failure Mechanical Properties of Two Kinds of Seafloor Massive Sulfides. Minerals 2021, 11, 1144. https://0-doi-org.brum.beds.ac.uk/10.3390/min11101144
AMA Style
Dai H, Li Y, Li M. Experimental Study on Failure Mechanical Properties of Two Kinds of Seafloor Massive Sulfides. Minerals. 2021; 11(10):1144. https://0-doi-org.brum.beds.ac.uk/10.3390/min11101144
Chicago/Turabian StyleDai, Huan, Yan Li, and Mengdan Li. 2021. "Experimental Study on Failure Mechanical Properties of Two Kinds of Seafloor Massive Sulfides" Minerals 11, no. 10: 1144. https://0-doi-org.brum.beds.ac.uk/10.3390/min11101144
Note that from the first issue of 2016, this journal uses article numbers instead of page numbers. See further details here.