Article

Fluctuations in Graphitization of Coal Seam-Derived Natural Graphite upon Approaching the Qitianling Granite Intrusion, Hunan, China

School of Geosciences and Surveying Engineering, China University of Mining and Technology (Beijing), Beijing 100083, China
*
Authors to whom correspondence should be addressed.
Submission received: 15 September 2021 / Revised: 7 October 2021 / Accepted: 15 October 2021 / Published: 18 October 2021

Abstract

:
The Lutang graphite deposit in Chenzhou, Hunan province, China, is a well-known coal seam-derived graphite (graphite formed from coal during its natural evolution) deposit with proven reserves of 9.5 million tons and prospective reserves of around 20 million tons (2015 data). The graphite occurs at an andalusite bearing sericite quartz chlorite metamorphic mudstone around a c. 530 km2 Qitianling granite intrusion. A set of coal seam-derived graphite samples from the Lutang graphite deposit in Hunan was examined by geochemical, crystallographic, and spectroscopic techniques to assess changes in the degree of graphitization approaching the intrusion. The carbon content, degree of graphitization, and Raman spectral parameters of series coal seam-derived natural graphite samples show a fluctuating increase with increasing proximity to the granite intrusion. The profile of geological structural features has a close spatial correlation with the variations in the degree of graphitization of series coal seam-derived natural graphite, and a strain-enhanced graphitization model is proposed. Moreover, the geographical distribution and the degree of graphitization are positively related to changes in the iron content of chlorite, suggesting a graphitization process promoted by mineral catalysis during metamorphism. A close spatial relationship exists between graphite mineral and chlorite occurrences when approaching the intrusive mass. The results of this research are important for understanding the role of tectonic stress and mineral catalysis on the genesis of coal-derived graphite.

1. Introduction

Contact metamorphism is a typical natural process of transformation of the protolith into a new type of rock under variations of the physico-chemical environment caused by magmatic intrusion. The zone of contact metamorphism around the igneous intrusion (metamorphic aureole) varies according to the type and depth of the intrusive event, the porosity, and the thermal conductivity of the adjacent crust [1,2,3]. It is generally believed that the heat radiated from the contact with the intrusion is the highest in the central metamorphic aureole. Therefore, the metamorphic grade is highest in the center and diminishes with increasing distance from the contact [4,5,6].
Contact metamorphism of coal under the influence of intrusive magmatism is also a common geological phenomenon. The heat, emanation, and dynamic effects of the intruded rock can induce graphitization in the coal seam and organic matters in the associated rock, thus forming coal seam-derived graphite. This type of graphite is also known as natural graphite derived from coal [7,8] or microcrystalline graphite [9]. As a type of graphite ores, coal seam-derived graphite has attracted significant interest from researchers due to its economic efficiency, ease of mining, and potential utilization as a cutting-edge material.
Previous research results show that the degree of structural ordering in coal is controlled by the metamorphic rank thereof [5,10,11,12,13,14,15,16]. Meanwhile, much investigation on the formation of coal seam-derived graphite using optical microscopy, X-ray diffraction (XRD), micro-Raman spectroscopy, and high-resolution transmission electron microscopy (HRTEM) has been performed. However, there is no consensus on the mechanism of graphitization of coal under natural processes at time of writing this paper. Previous studies found the precursor materials, metamorphic temperature, duration of action of heat, catalyst, fluid activity, pressure, and shear stress exert different influences on the transformation from coal to graphite [17,18,19,20,21,22]. Franklin investigated the graphitization of different origins of carbon materials at different temperatures [20]. Oberlin and Terriere pointed out that the microporous nature of anthracite is responsible for a preferential planar orientation of the polyaromatic structures in comparison with Kerogens [19]. Bonijoly et al. endorsed findings to the effect that the temperature, pressure, and shear stress caused by metamorphism and tectonics facilitate the graphitization process. Pusz et al. showed how the texture of the higher-rank anthracites is more flexible (thus conducive to rearrangement) than lower-rank anthracite during heat-treatment at up to 1000 °C [23]. Nyathi et al. stated that the more metamorphosed anthracite tends to graphitize in a manner resulting in better crystal structure than less metamorphosed anthracite during high-temperature treatment [24]. By conducting comparative experiments, Pappano and Schobert found that anthracite with mineral catalysts more readily forms a three-dimensional ordered graphite structure than demineralized anthracite in heating experiments [25].
The development of coal seam-derived graphite in geological settings is a complex process, as a highly stable graphite structure formed from amorphous coal due to the magma intruding into coal seams at depths of several kilometers. According to specific geological context, research into the coal to graphite transformation during contact metamorphism has emerged, revealing the mechanism of coal-to-graphite transformation under natural conditions [10,26]. The coal-to-graphite transformation in coal starts at the semi-anthracite rank, which contains a small amount of aromatic ring structures. It is then transformed to anthracite, meta-anthracite, and finally forms semi-graphite and graphite in a manner dependent on the degree of ordering of the polyaromatic layers. It is well accepted that with decreasing distance from the intrusive mass, the original coal is gradually transformed into anthracite, meta-anthracite, semi-graphite, and graphite.
However, we found that the degrees of graphitization of coal seam-derived natural graphite samples do not increase monotonically with decreasing distance to the intrusion, suggesting that the temperature is not the only factor controlling this natural graphitization process. Other factors, such as strain and mineral catalyzation, should also be considered; therefore, it is imperative to clarify the main conditions for participating in natural coal graphitization. Here, we present results of geochemical analysis and microstructure analysis (X-ray diffraction and Raman spectroscopy) of coal seam-derived graphite sampled at various distances from the intrusion, discussing the relationship between fluctuations in the degree of graphitization of coal seam-derived graphite with tectonic events and chemical composition.

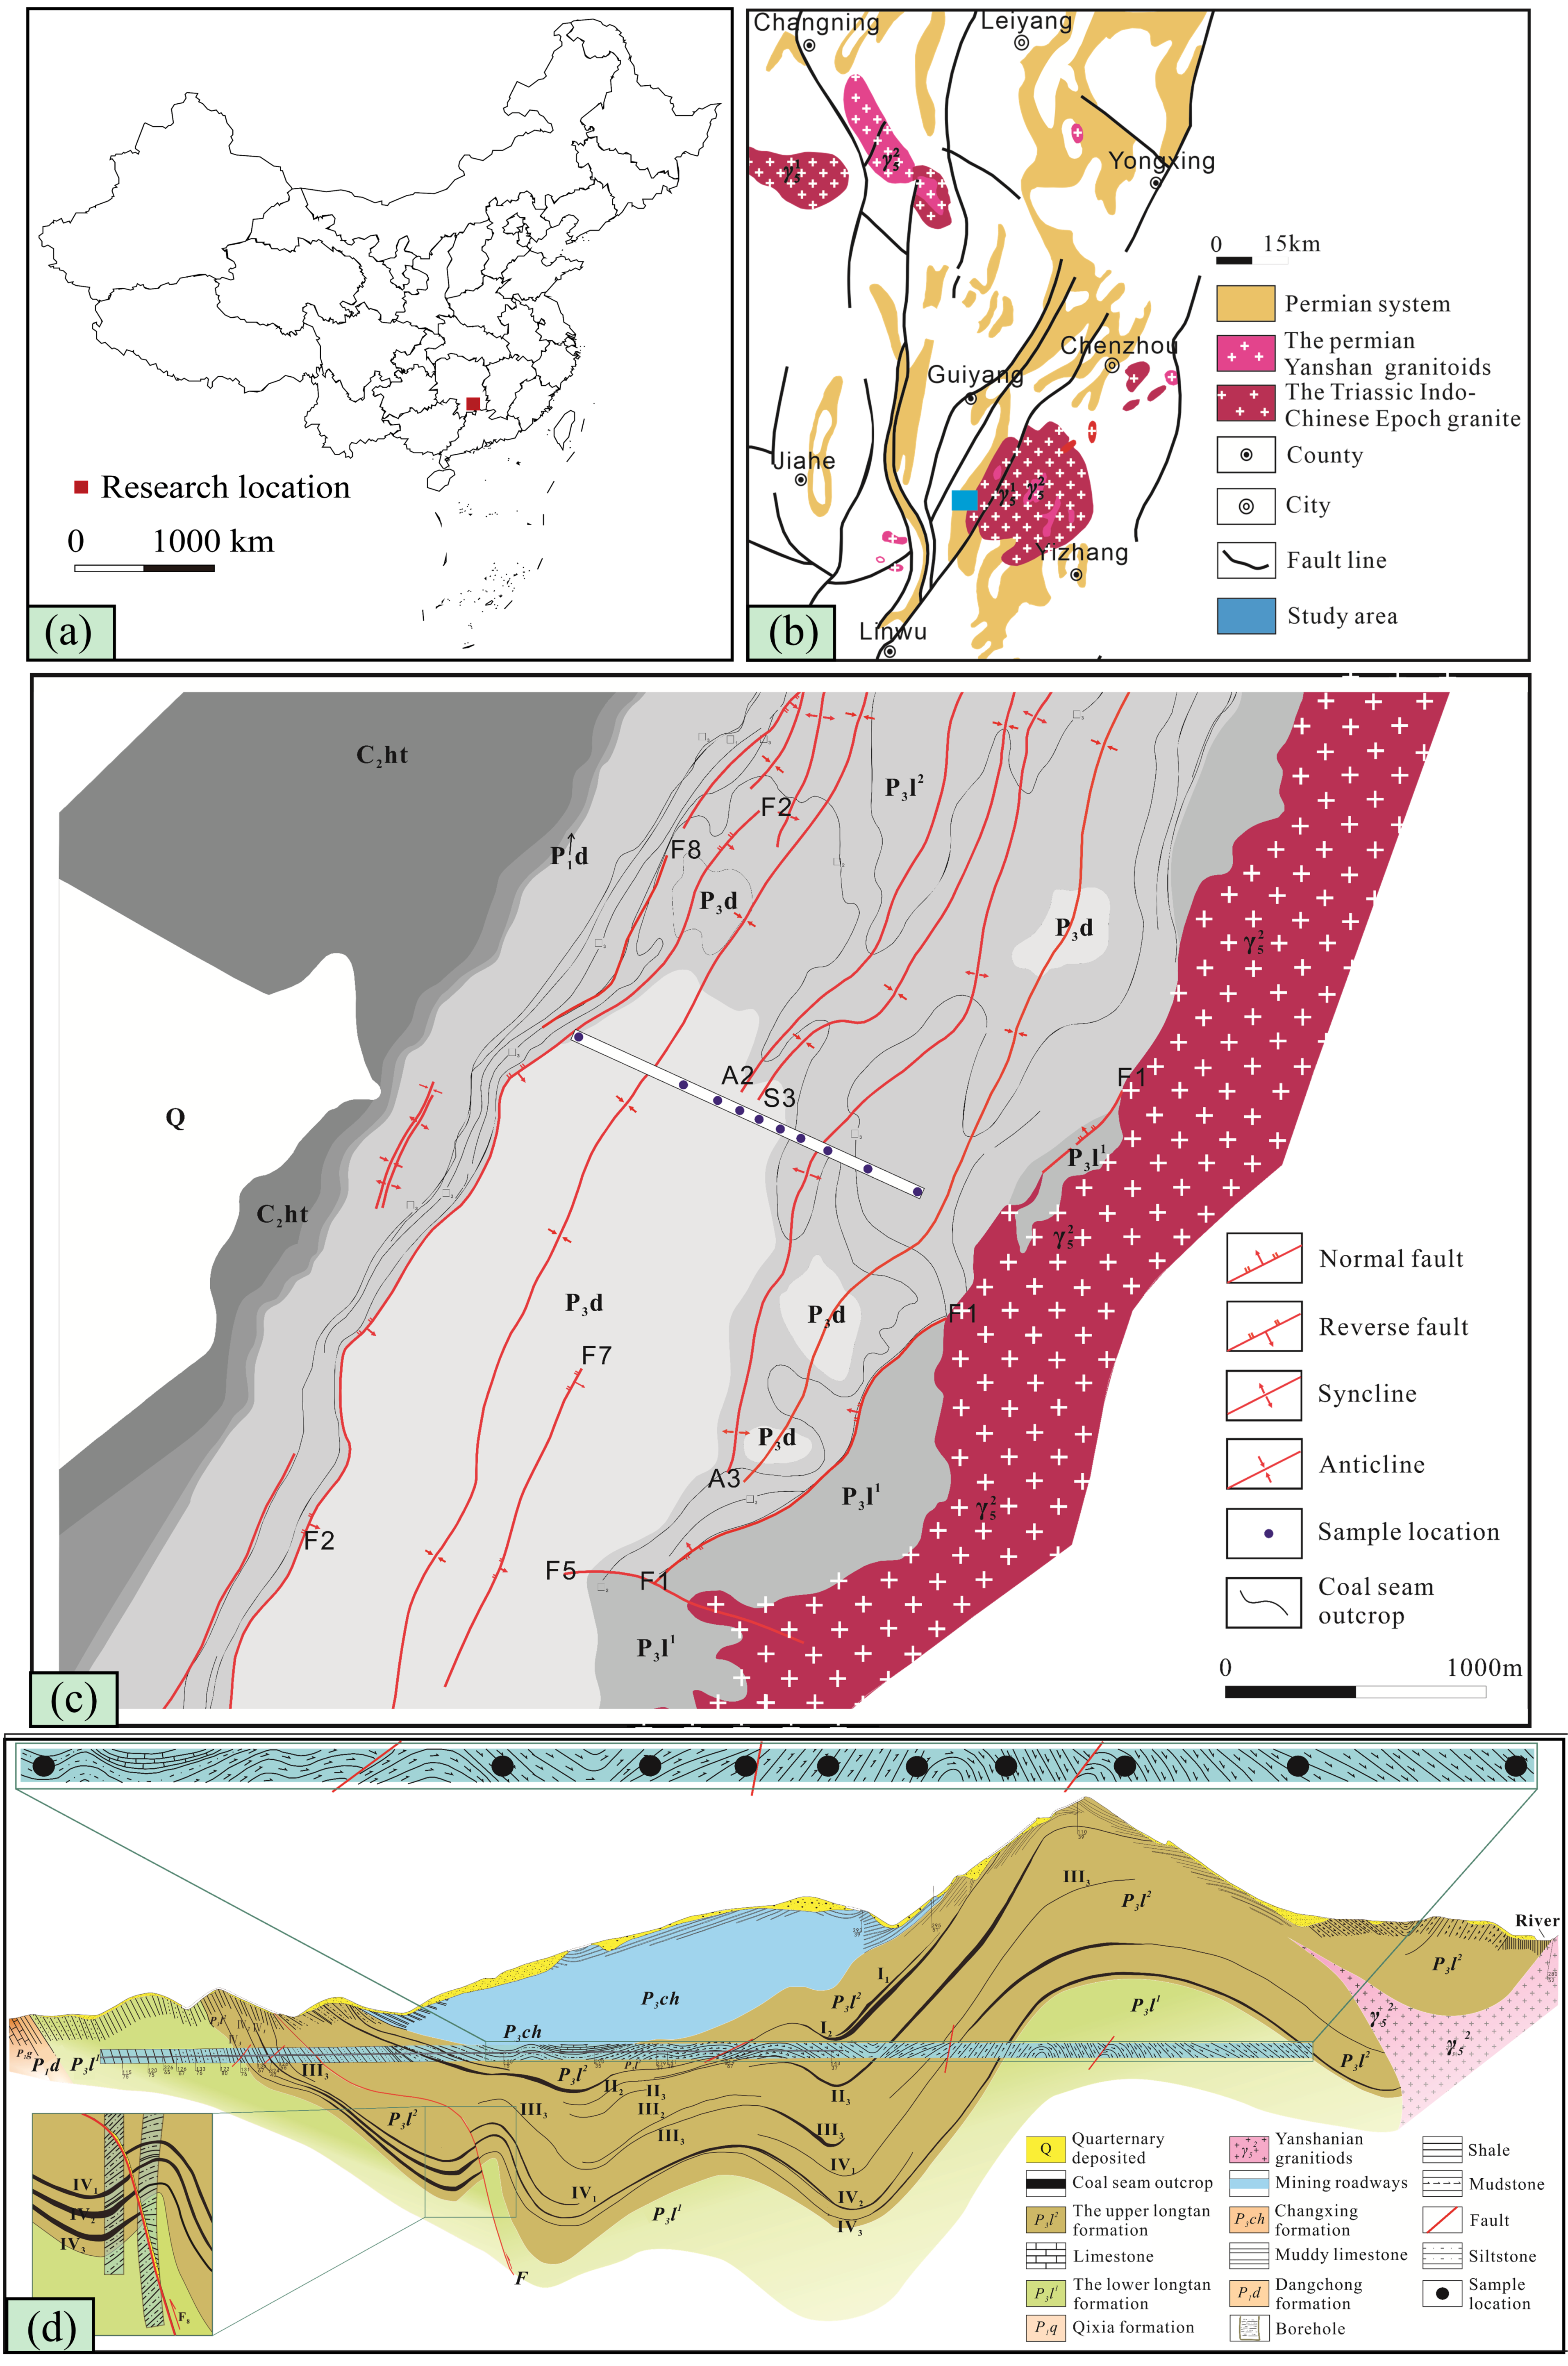
2. Geological Setting

The Lutang coal seam-derived graphite is located at the Lutang–Shatian composite syncline on the northern margin of the middle section of the Nanling metallogenic belt that is controlled by the compound syncline (Figure 1a,b). The Qitianling granitic pluton is a batholith formed at multiple stages during the early Yanshanian period (163–146 Ma), which can be divided into three intrusive stages [27,28,29]. The contact boundary between the Qitianling granite body and the ore-bearing strata is NNE striking and mostly subject to dentate or branch-like intrusive contact (Figure 1c). Complicated folds and reverse faults formed due to the intense tectonic movement and magma intruding events, while different degrees of contact metamorphism occurred at different distances from the intrusive rock mass.
In the western side of the pluton of the study area, a sequence of index minerals (cordierite, kyanite, andalusite, and tourmaline) representing different petrographic facies of contact metamorphism [32] appears. The metamorphic framework of Qitianling intrusion in this study can be divided into three metamorphic zones from west to east that include medium-weak hornfels zones, strongly hornfels, and hornfels, which consist of spotted-schist and hornfels comprising the following sequence: chlorite, biotite, cordierite, andalusite-cordierite, and garnet-andalusite [33].
The main tectonic structure is characterized by the Lutang–Shatian syncline that trends NNE in the research area. The west wing outcrops are relatively complete, and the syncline axis is gentle, while the east flank of the syncline is incompletely exposed. Affected by the compression of the intrusive rock, the east flank is relatively large and contains many secondary folds. Therefore, most of the deformation features on the western flank are characterized by broad, gentle folds, while the tectonic units at the eastern flank are marked by distinct, tight folds. In addition, the development of fault structures in the mining area destroys the continuity and integrity of the mining layer; near the intrusive rock mass, the faults are generally high-angle reverse faults, which cut graphite deposits and cause duplication and deformation of the deposits (Figure 1d).
In the mining area, the upper Permian Longtan formation is the coal-bearing stratum, which consists of a set of littoral sedimentary structures dominated by sandstone, siltstone, mudstone, and four layers of coal seams (I, II, III, IV) [34]. The coal seams were gradually transformed into graphite (coal seam-derived graphite) under the influence of the Qitianling granite intrusion. The coal seam-derived graphite strata consist of four layers divided into 11 small layers in which only five layers can be mined, and layers I2 and IV3 are the main mining seams [35]. Strong deformations were common in the channels and working faces during sampling.

3. Samples and Analytical Procedures

3.1. Sampling

A total of 30 graphite-seam channel samples (including ten coal seam-derived graphite and 20 non-coal/graphite roof, parting, and floor strata at the sampling site) were collected along a line approaching the intrusion from the underground working faces. Samples were numbered according to their spatial position within the mining area. From the entrance of the mine towards the granite body, all the collected samples were stored in polyethylene bags immediately in order to reduce contamination and oxidation from mine operations as much as possible. In addition, the samples were collected in accordance with the Chinese Standard for Collecting Channel Samples GB482-2008 [36].

3.2. Analytical Methods

3.2.1. Proximate and Ultimate Analyses

Proximate analyses were conducted in accordance with Chinese National Standard GB/T 3521-2008 (method for chemical analysis of graphite) [37], while the ultimate analyses were made using a Vario Macro Cube element analyzer (Elementar, Hanau, Germany) in accordance with Chinese National Standard GB/T 31391-2015 [38].

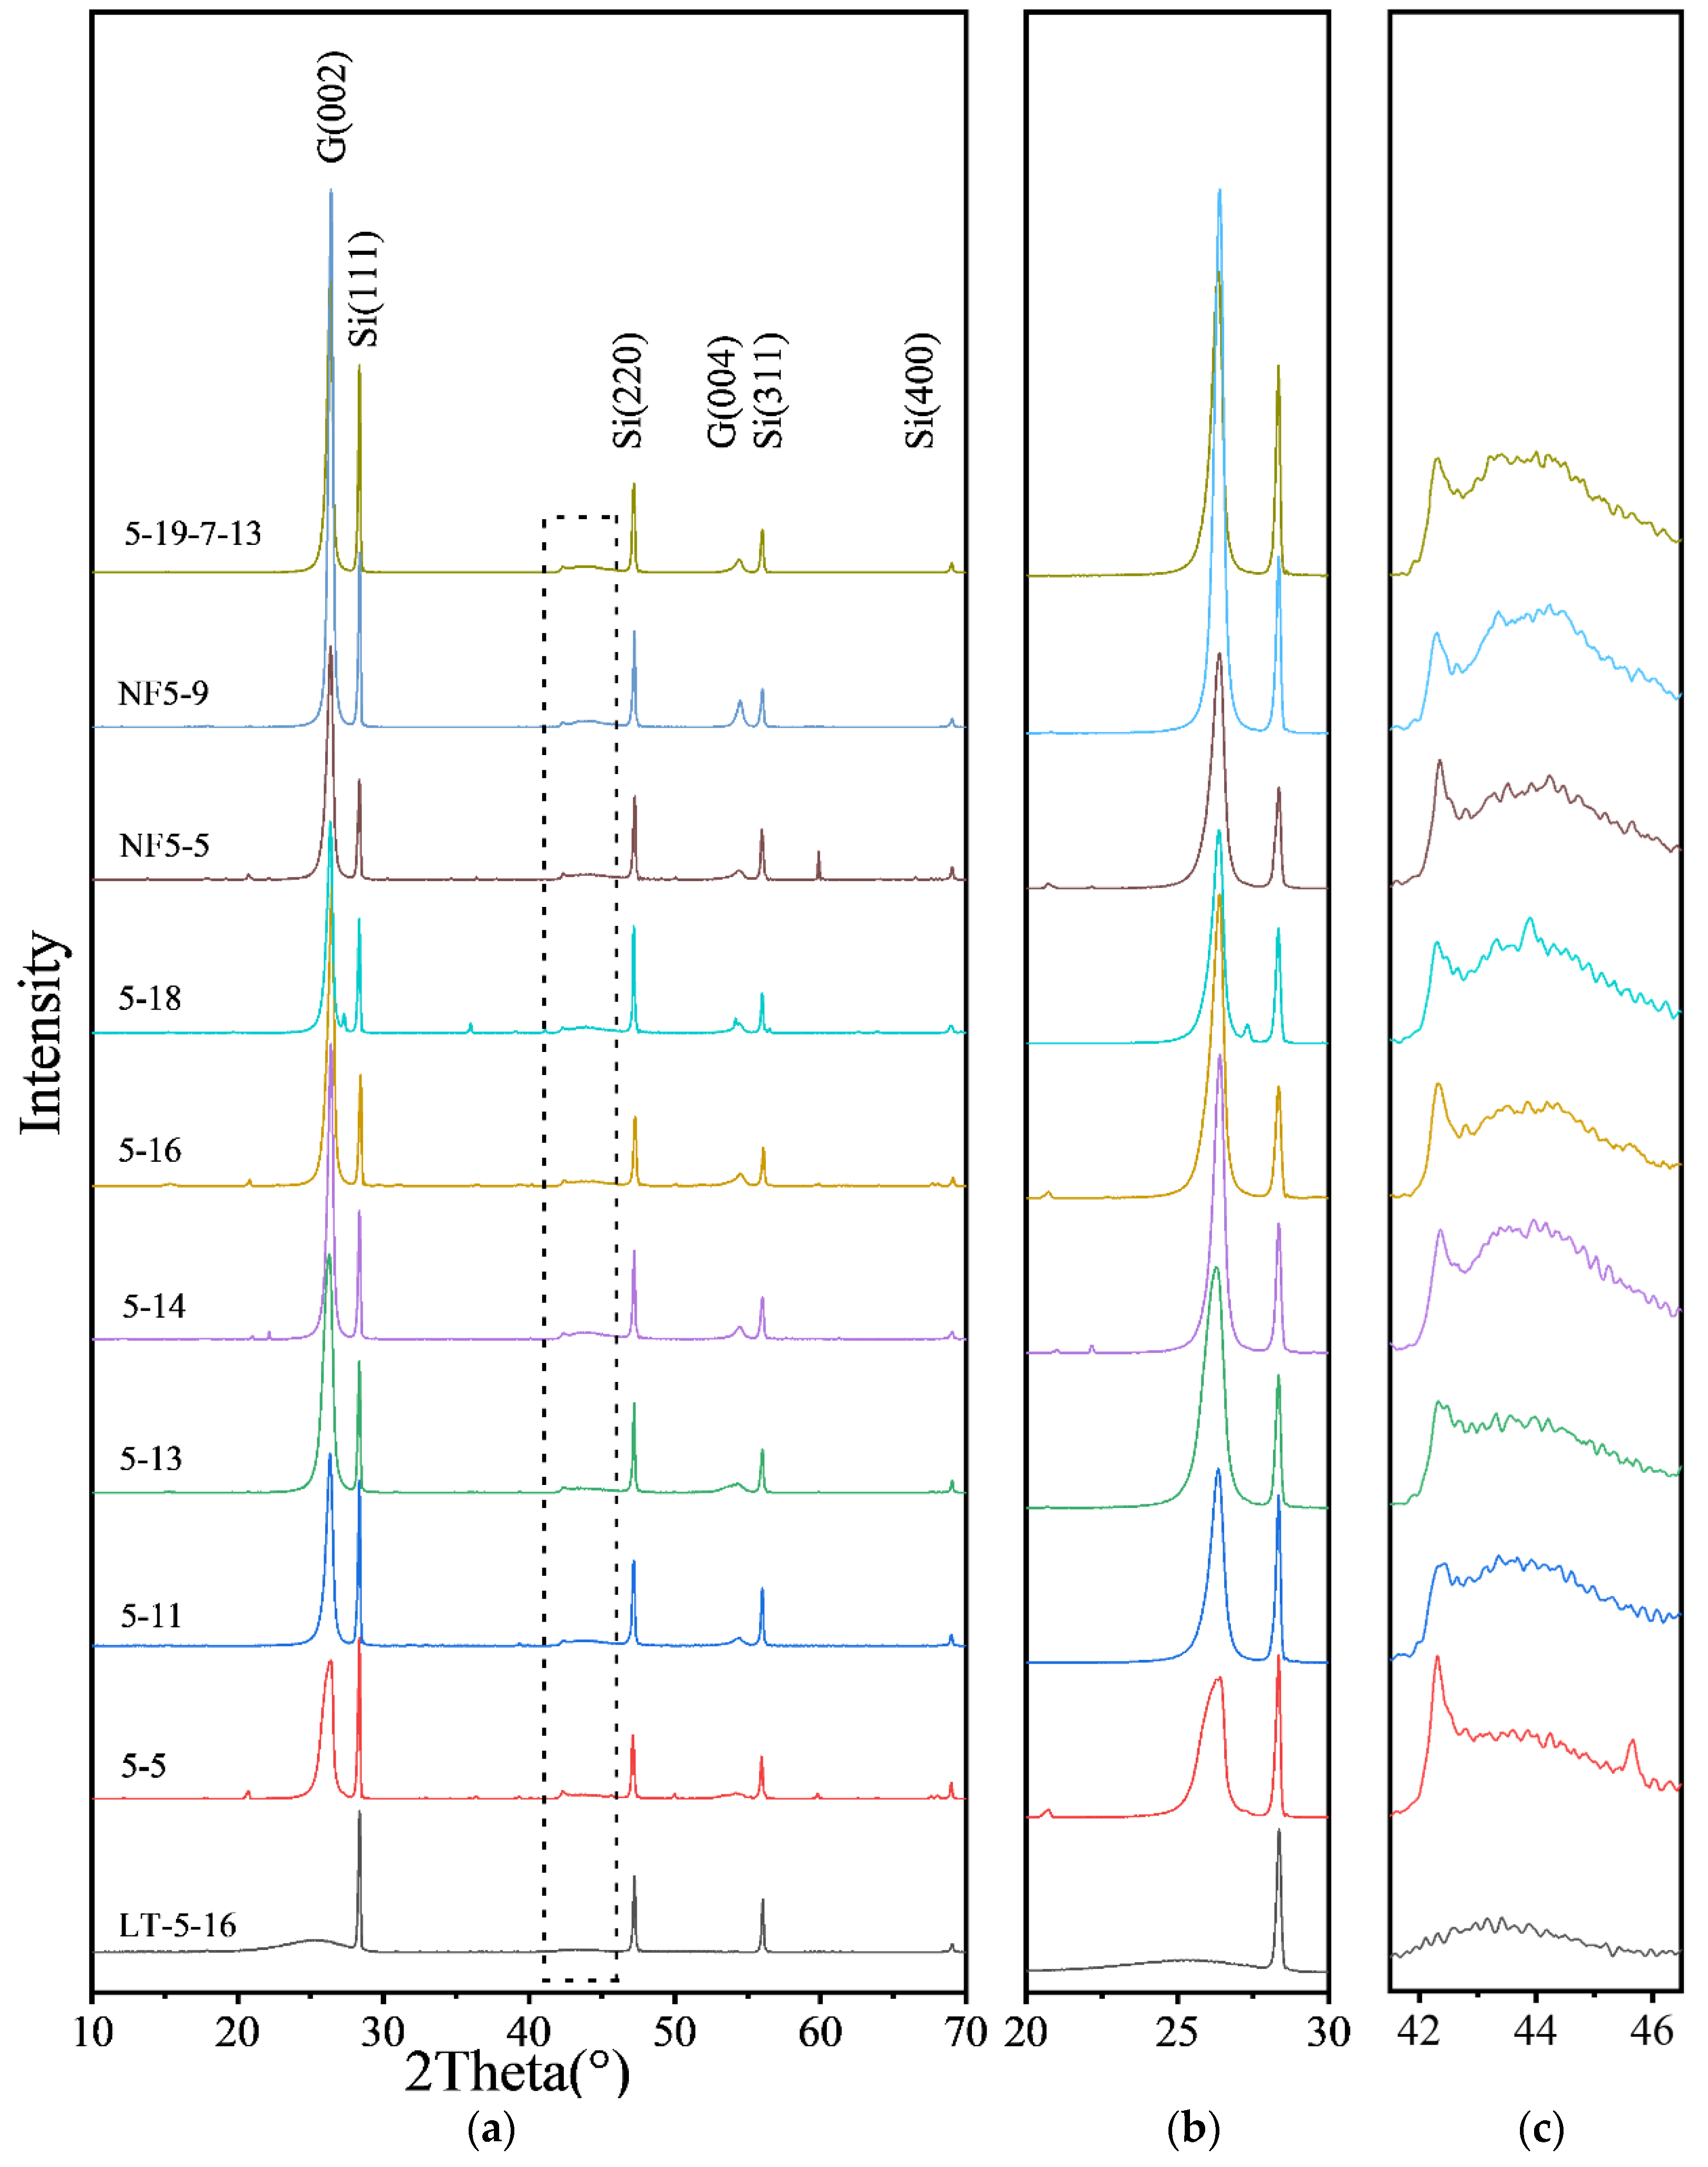
3.2.2. X-ray Diffraction

XRD analysis was performed for the coal seam-derived graphite. Each graphite sample was pretreated with a mixture of hydrofluoric acid and hydrochloric acid. The liquid-solid ratio was 2, the volume ratio of hydrochloric acid was 40%, and the reaction time was three hours at 60 °C after being washed four times [39]. Both CBGs and host rock measurements were conducted on a Rigaku D/MAX-2500PC X-ray powder diffractometer (Rigaku, Tokyo, Japan) (40 kV, 100 mA) with Cu Kα graphite monochromatized radiation (λ = 1.54178 Å) over the scanning range 2.5° ≤ 2 θ ≤ 70° at a scanning speed of 2°/min. The stacking height (Lc) and lateral size of CBG crystallites were determined from (002)~26.8° and (100)~42.5° reflection peaks, respectively, using conventional Scherrer equations: La = 1.84λ/βa cos(θa); Lc = 0.89λ/βc cos(θc), where βa and βc denote the full width at half maximum (FWHM) of fitted (100) and (002) peaks, respectively, and θa and θc are the corresponding scattering Bragg angles of each peak [40].

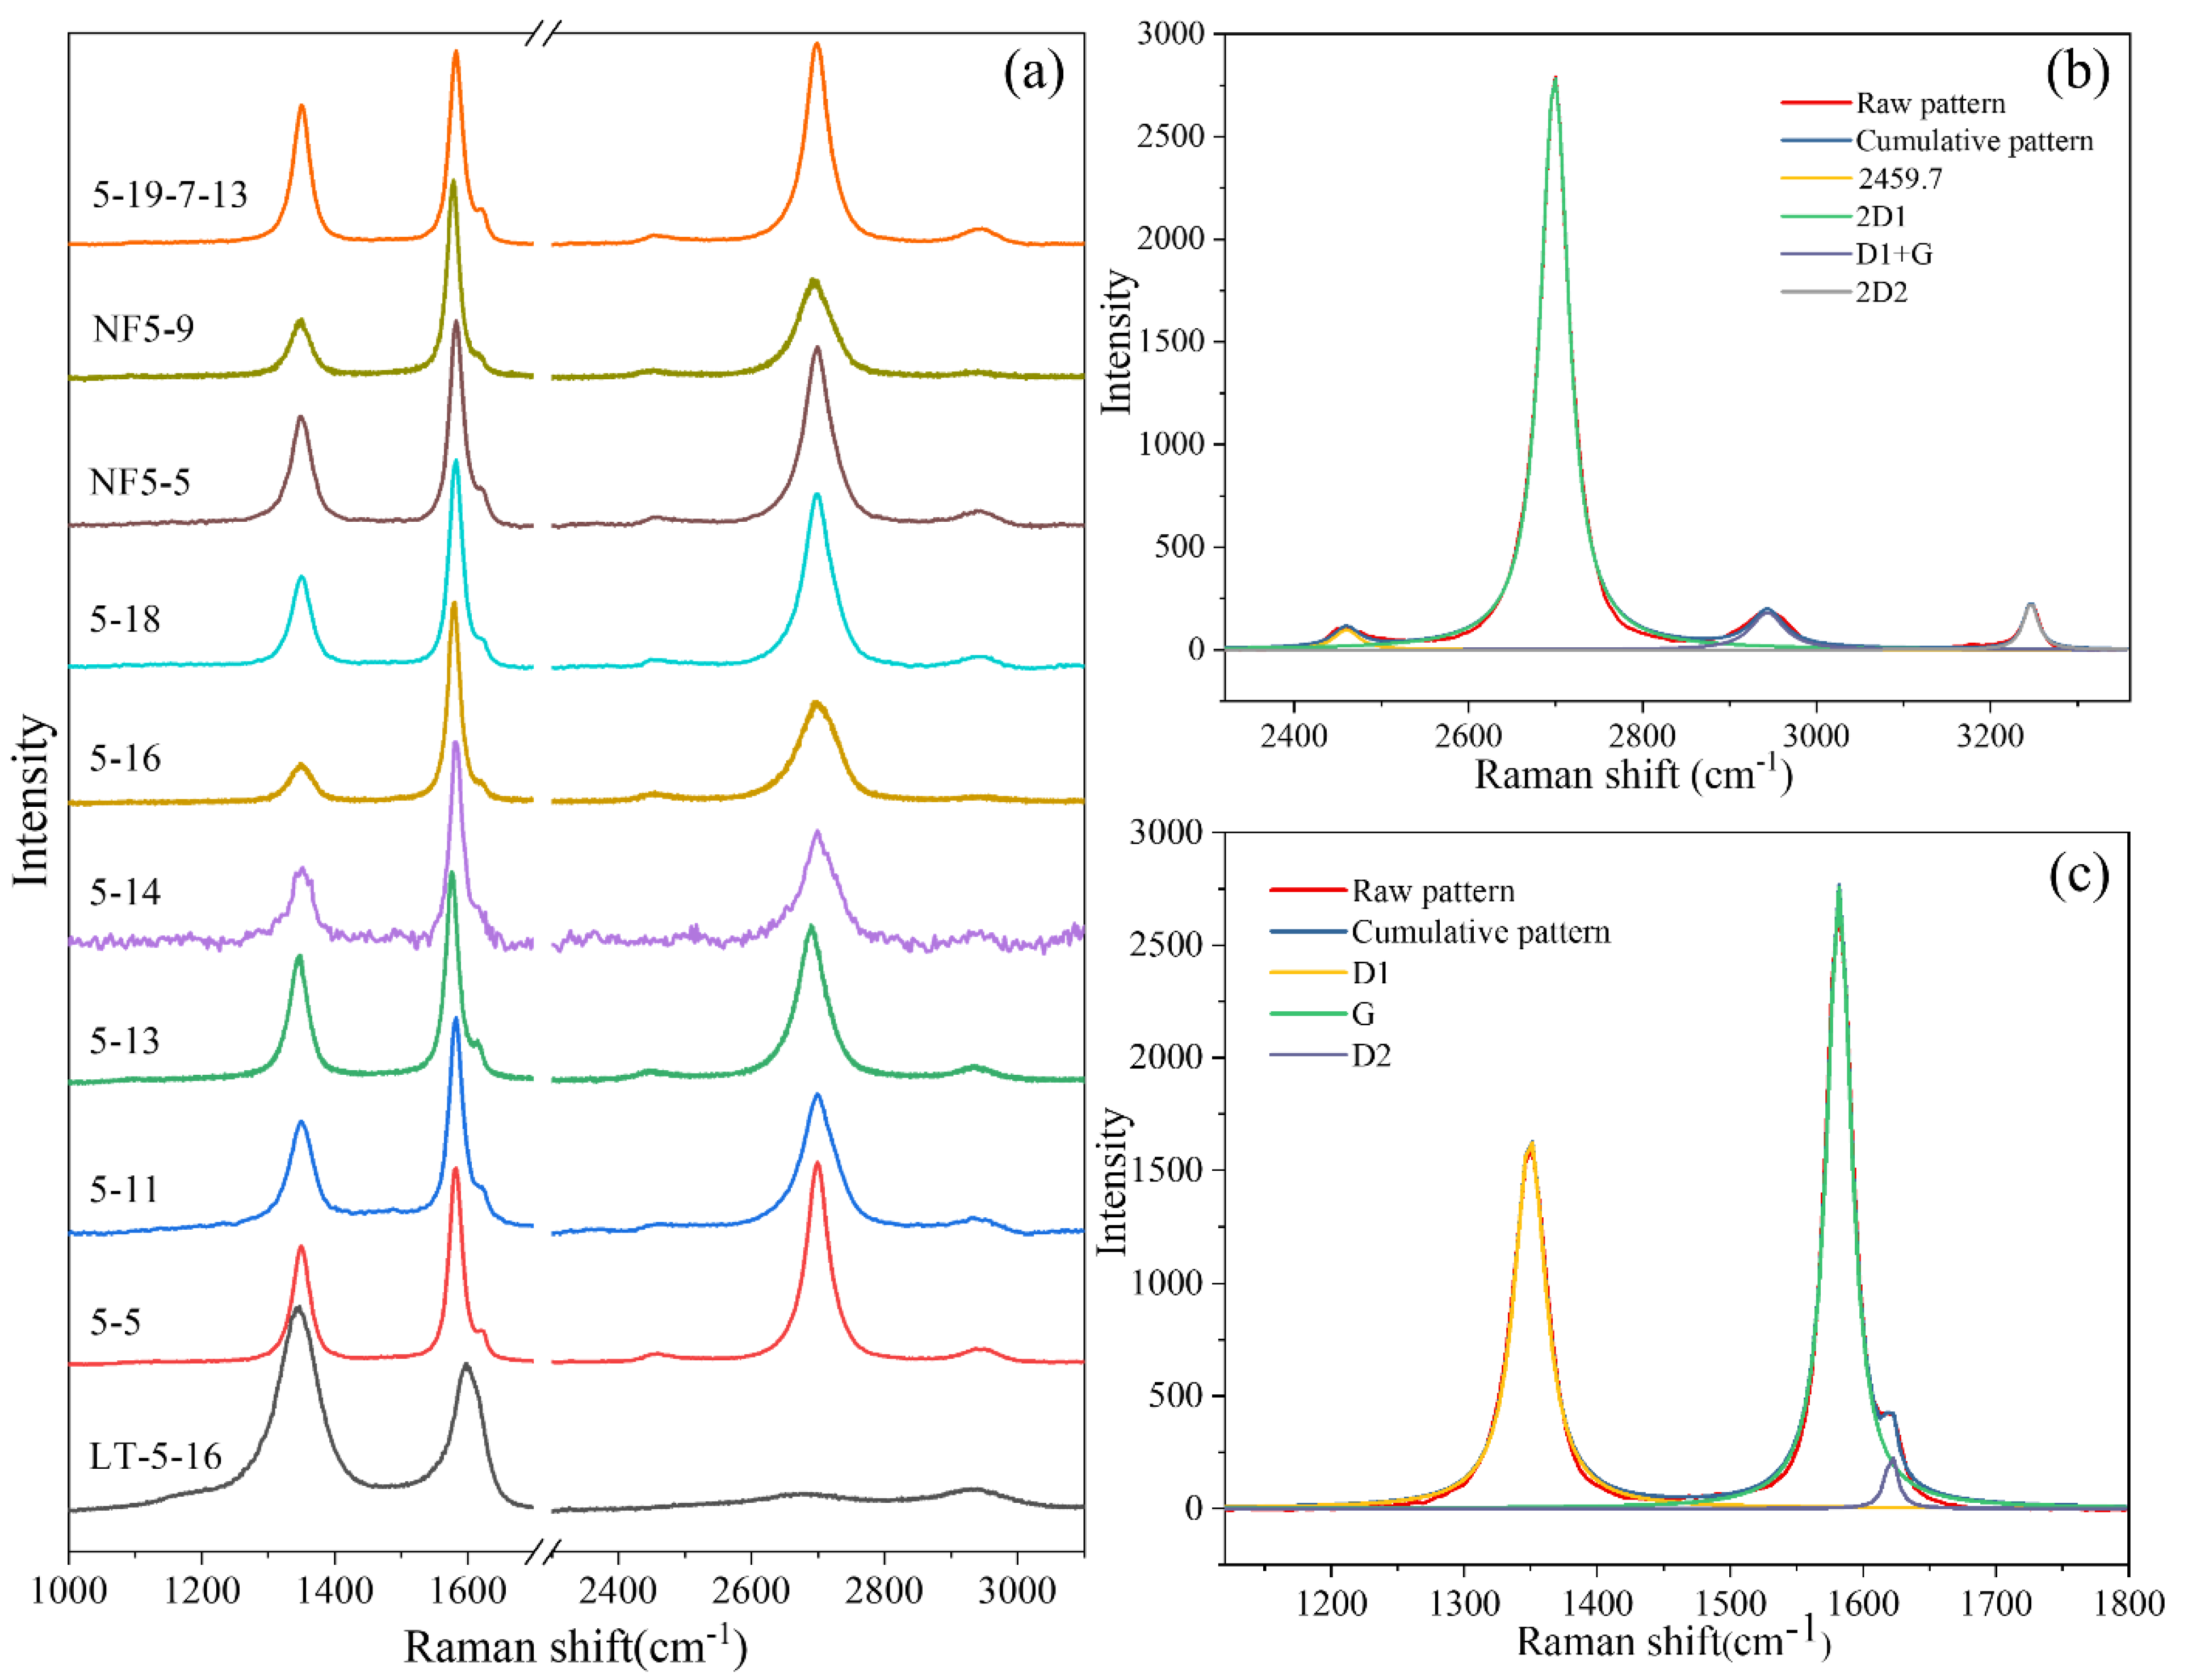
3.2.3. Raman Spectroscopy

A HORIBA HR800 confocal micro-Raman spectrometer (Horiba, Paris, France), equipped with an Nd-YAG laser (5 mW, 532 nm) and a BX41 50x objective lens (Olympus) was used to characterize the micro and nanostructures of graphite at room temperature. Extended scans from 600 to 3200 cm−1 for the Raman spectrum were conducted in situ on each graphite specimen, with a registration time of 60 s allowed for each spectrum. Meanwhile, the Raman spectrometer was equipped with a density filter to avoid the thermal decomposition of samples. Each spectral analysis was conducted with LabSpec 5 (LS5) software (Version LS5: 2.02, Horiba, Paris, France) [41,42].

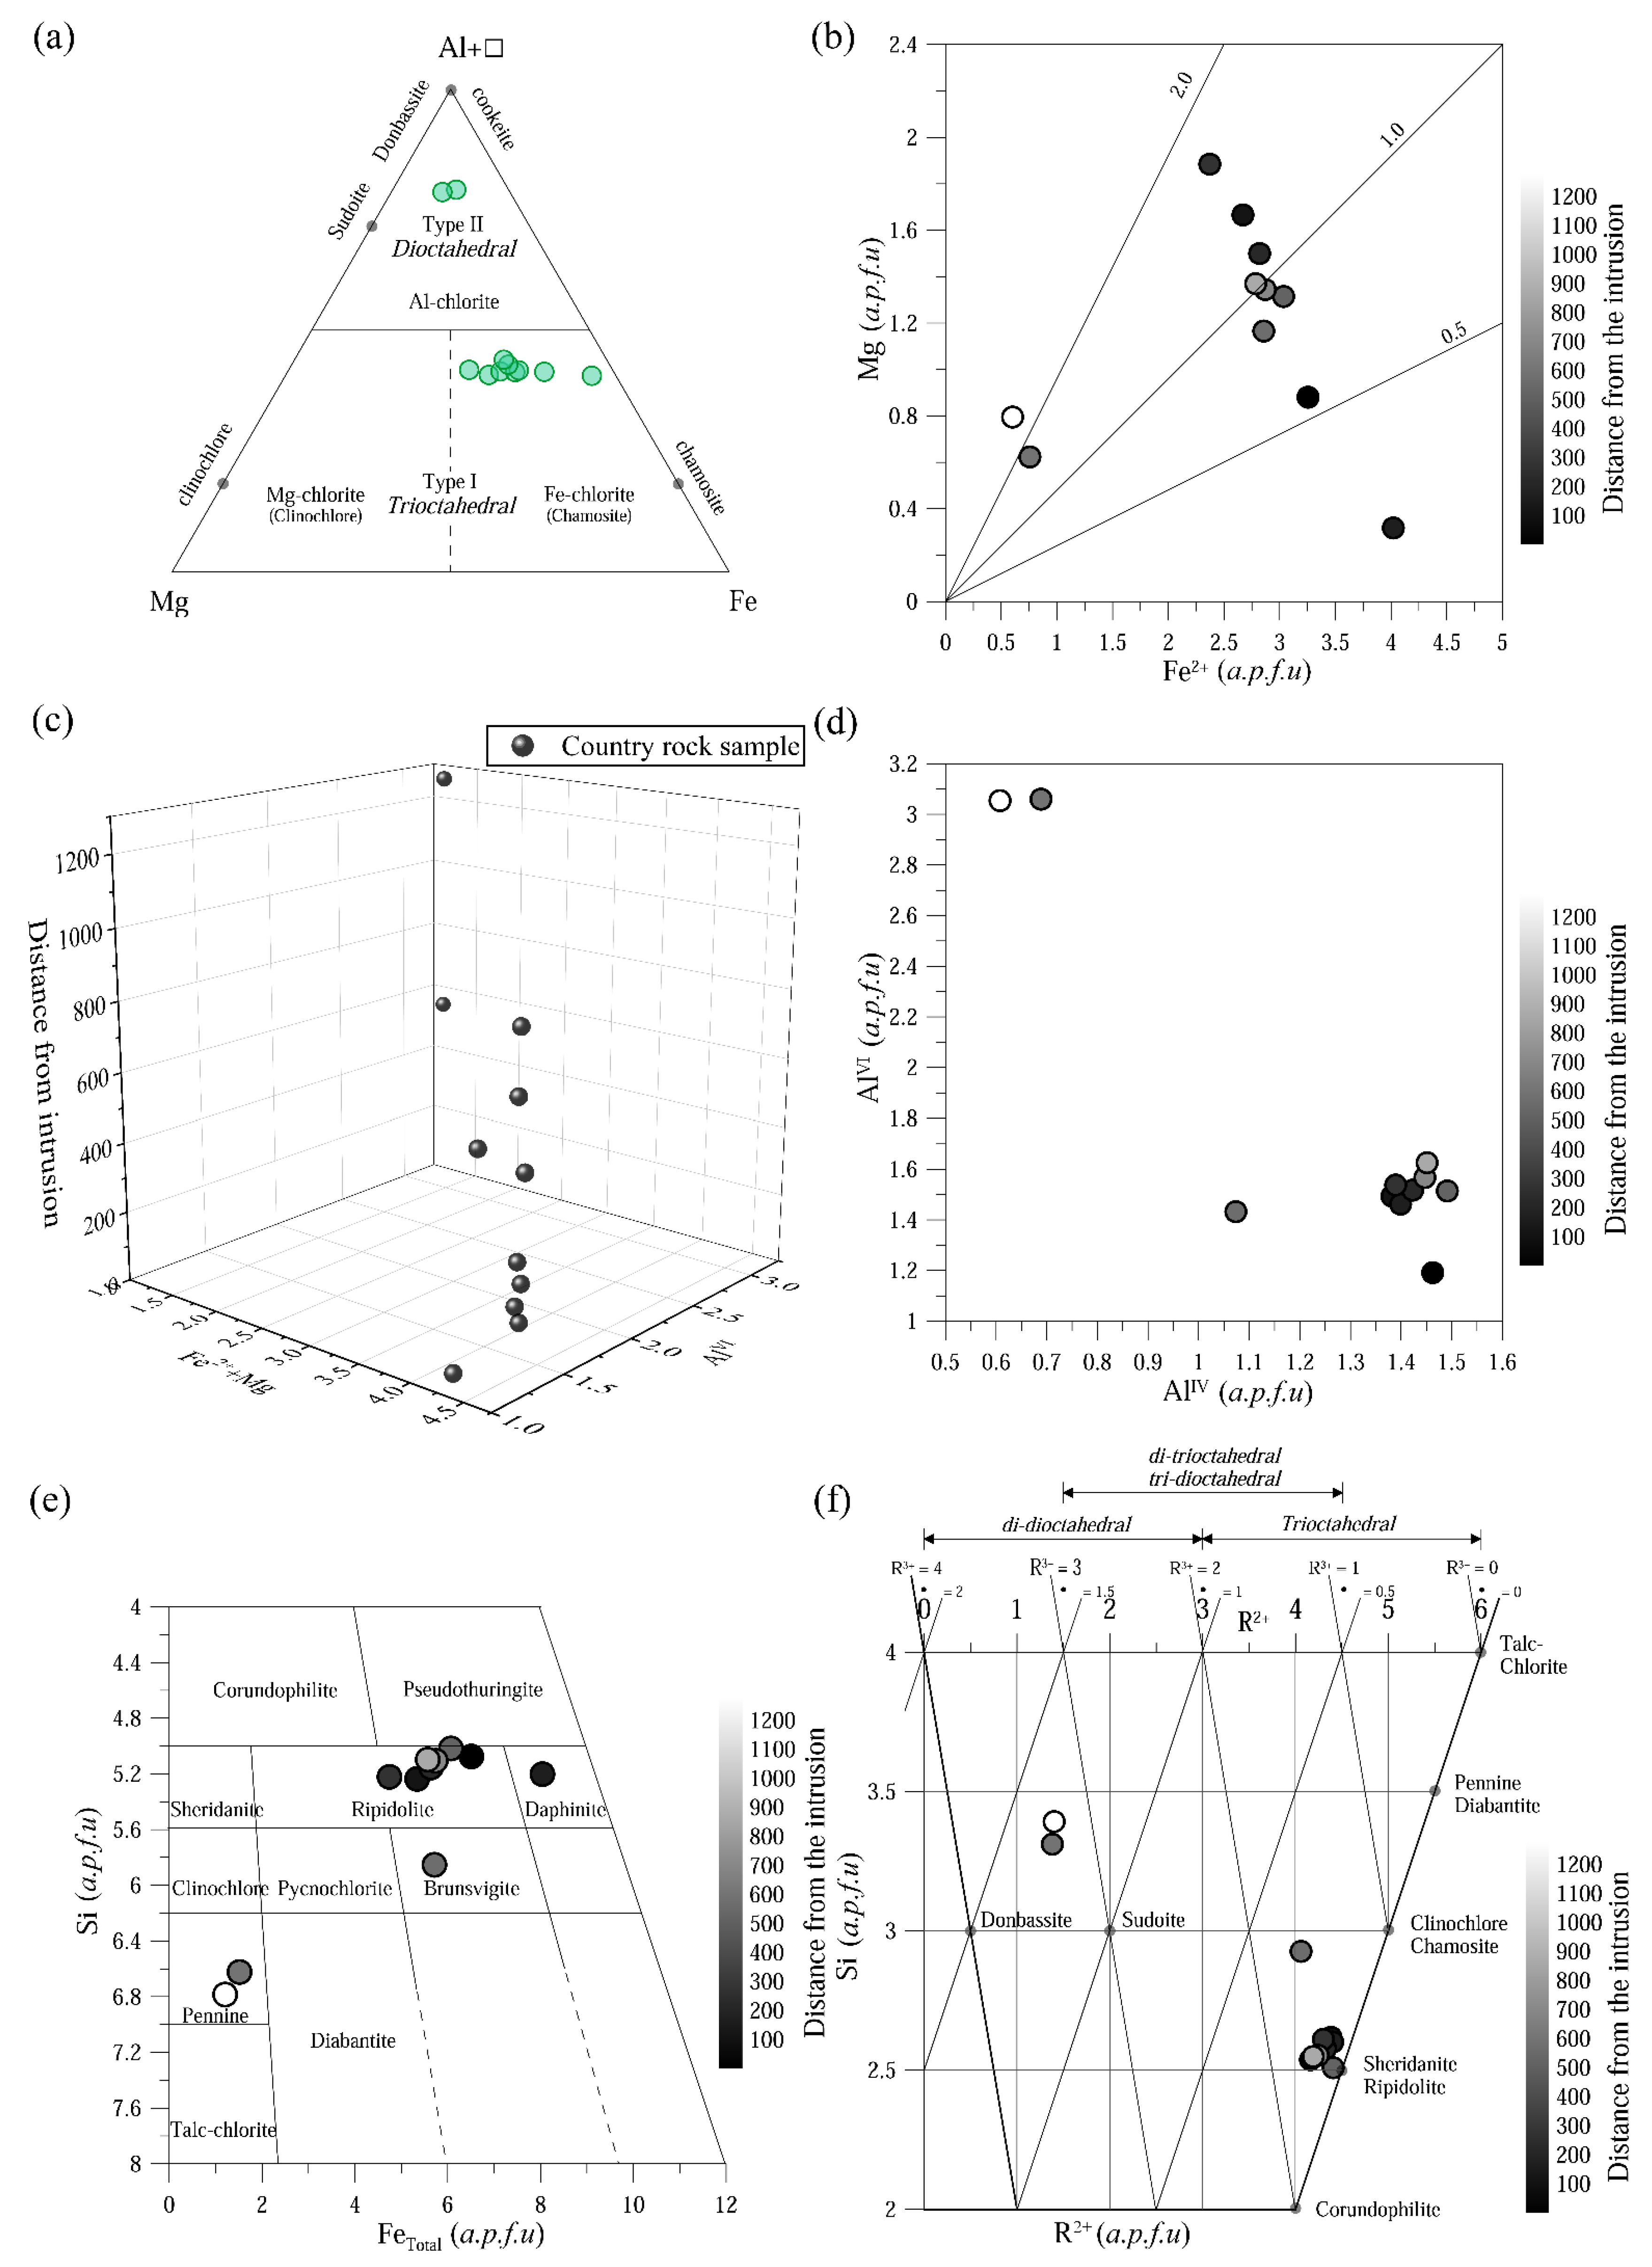
3.2.4. Electron Probe

Chemical analyses of chlorite were undertaken using a Shimadzu EPMA-1600 electron probe, using natural and synthetic standard minerals, with the following standard conditions: 15 kV and 10 nA, (PAP correction procedure). Simultaneously, the analytical spot radius was set to 1.5 µm. The chlorite chemical formula was based on 14 oxygen atoms per formula unit (a.p.f.u). In order to calculate the crystallization temperature for chlorite, the WinCcac software [43] was used in which 12 empirical formulae based on previous research were established to calculate the paleotemperature.

4. Results

4.1. Proximate, Ultimate, and Microscopic Analyses
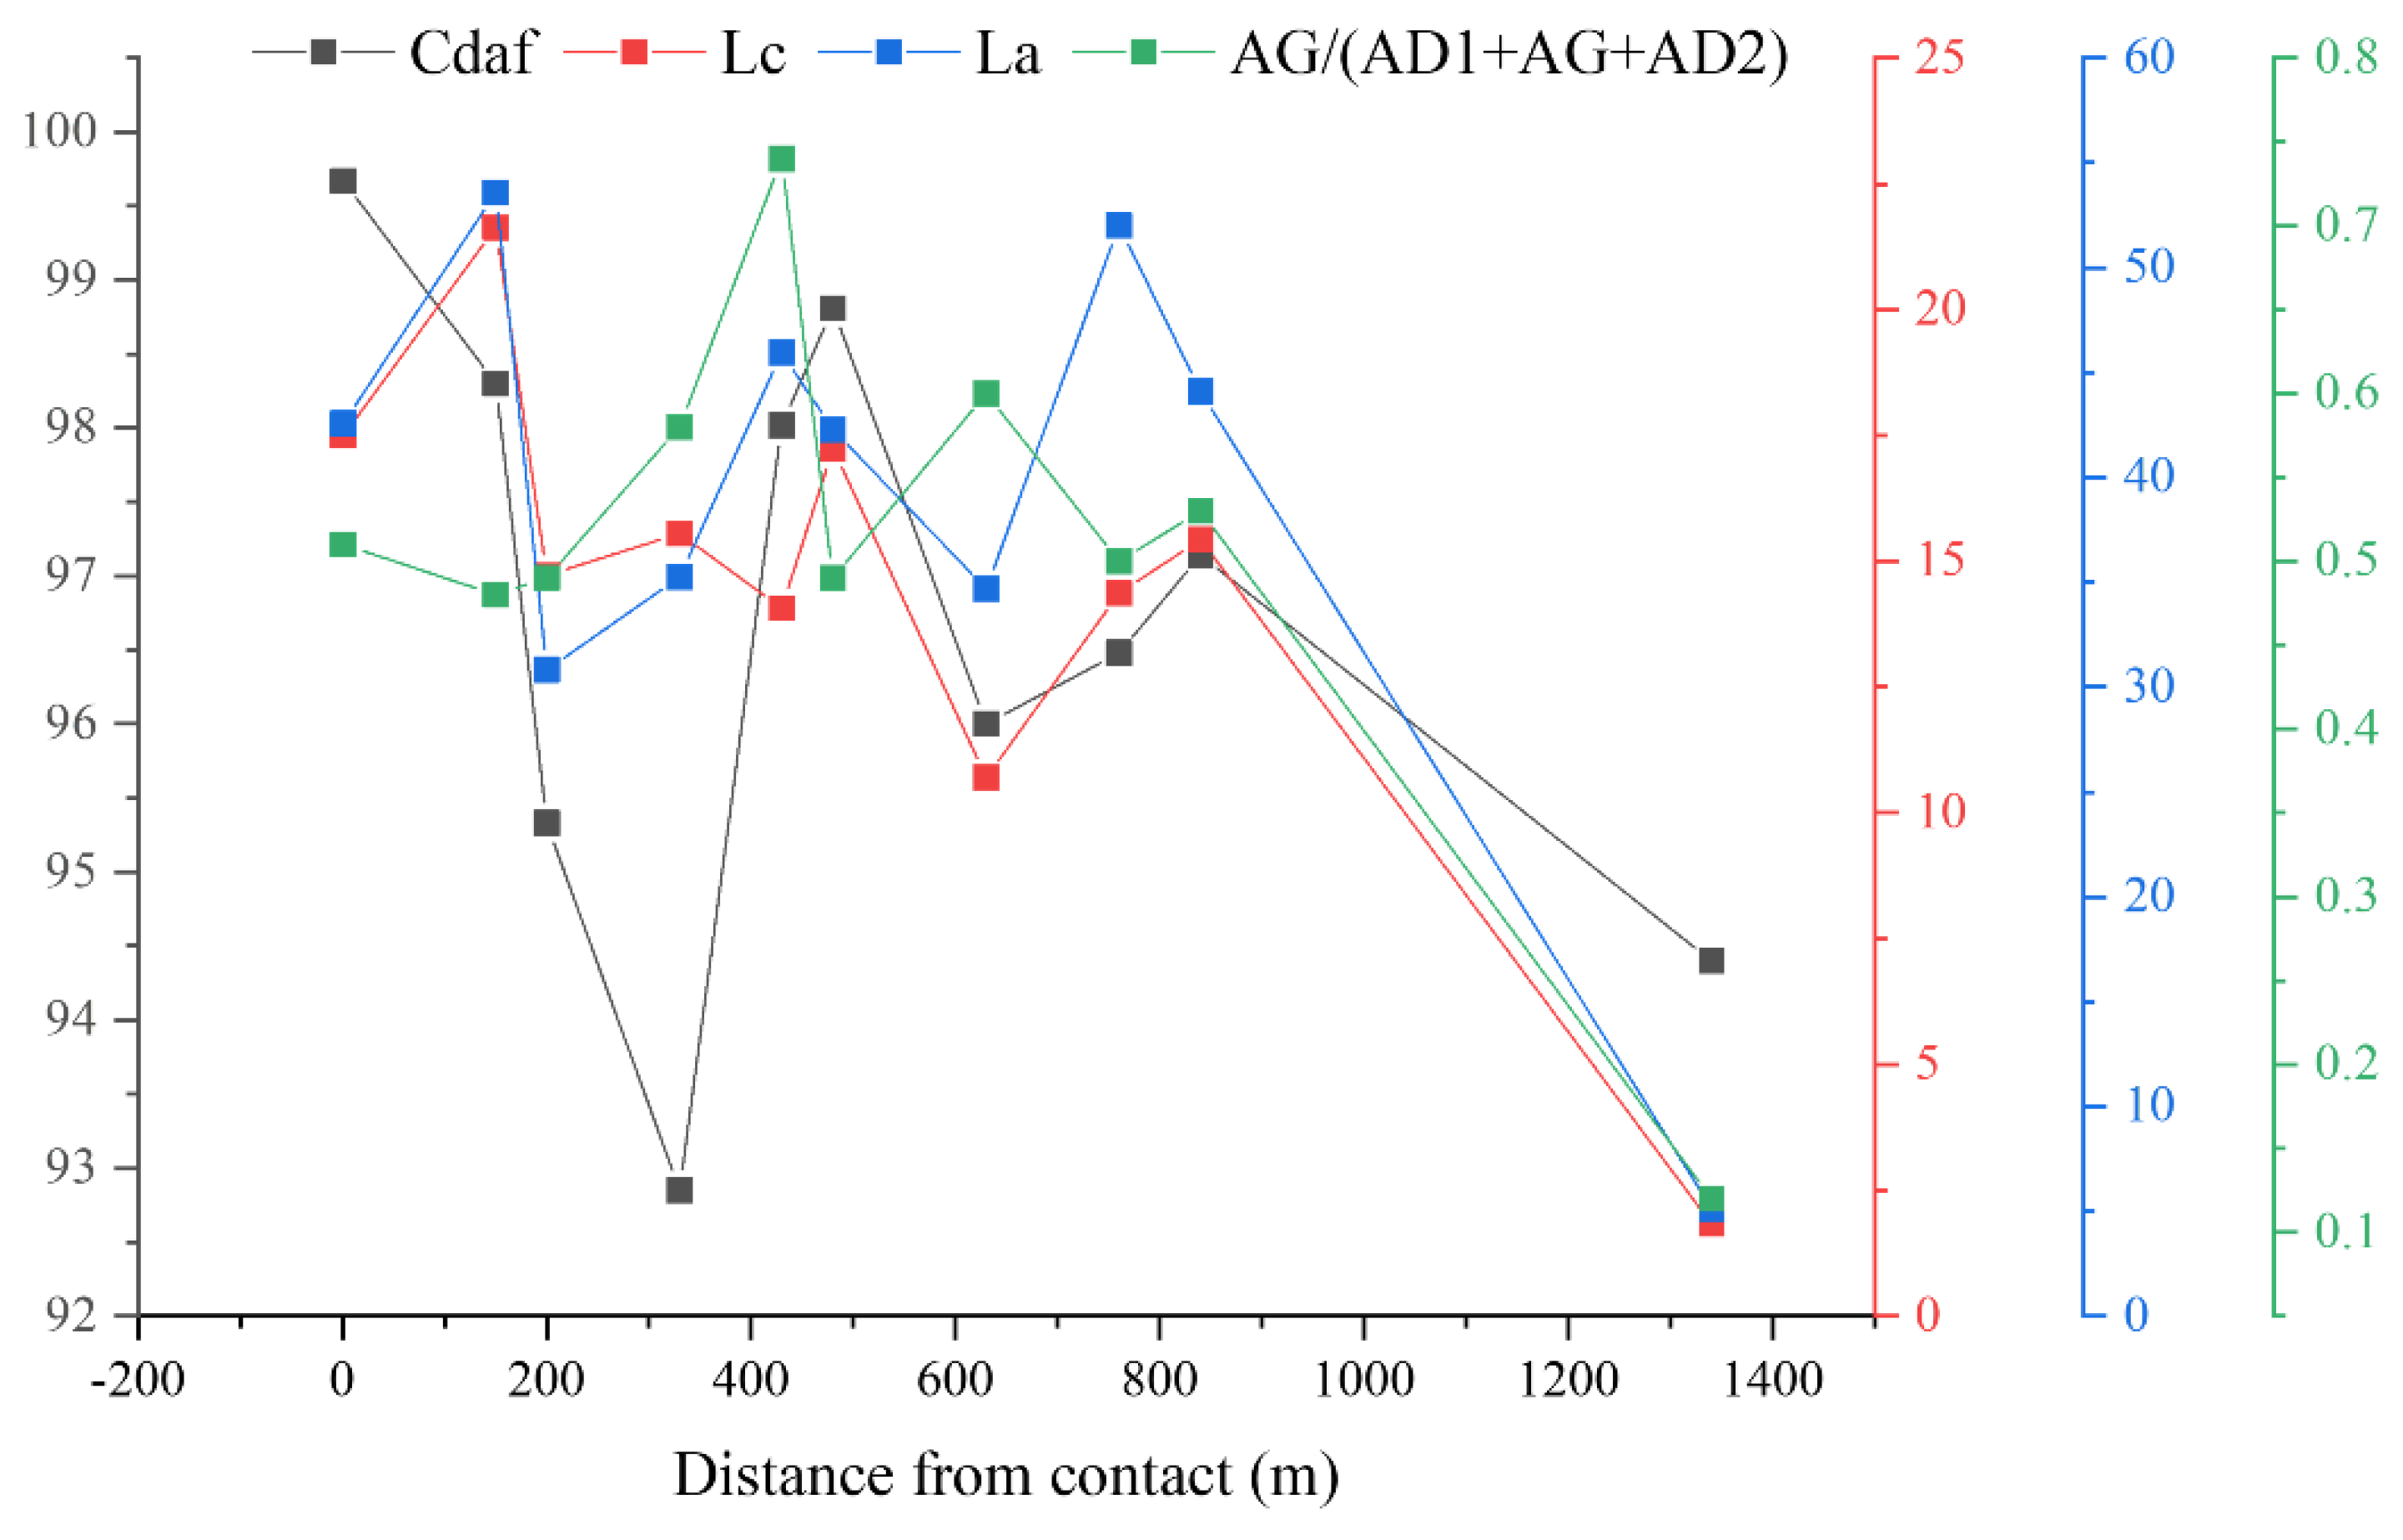
The geochemical data of series naturally graphitized coal specimens are shown in Table 1. The carbon content (daf) ranges from 92.85 to 99.67 wt%, and the H content is near or below the detection limit. The volatile matter yields of the series samples are lower than 6%, indicating that all specimens reached a metamorphic grade commensurate with anthracite (or above). As the ratio of VM/Cdaf has a low range of 0.27–6.11 × 10⁻², this points to the relatively higher coal rank and lower thermal sensitivity than compared to other lower rank coal towards combustion and pyrolysis [44,45]. As shown in Figure 2, the ash content (%, d) is between 0.25% and 6%, which generally decreases when approaching the intrusion; however, it still shows a trend of decreasing volatility, with significant fluctuations therein. The carbon content (%, daf) measured between 92.85% and 99.67%, showing a fluctuating increase in the sampling sites closer to the contact horizon, and similar results for naturally graphitized coals were also obtained by Wang et al. [46,47].

4.2. XRD Analysis

Figure 3 presents the XRD spectra of 10 series of naturally graphitized coals arranged by distance from the intrusion, with two illustrations of partially enlarged details viewed on the (002) and (100) peaks showing the data in the low-intensity region. As shown in Table 2, only one anomalous estimated d002 interlayer spacing (0.3454 nm), in a specimen sampled at the greatest distance from the magmatic intrusion, was characterized as anthracite (d002 > 0.340 nm, with a typical anthracite diffraction profile), as shown in Figure 3 and Table 2 [48], while other d002 values range from 0.3367 to 0.3393 nm, as represented by sharp peaks and narrow full width at half maxima (FWHM), evincing its graphitic characteristics [48]. The FWHM of series samples shows a fluctuating decrease with decreasing the distance from the intrusion. A similar trend was found in crystalline parameters (Lc and La). The values of Lc ranged from 10.7 to 21.63 nm in addition to that of the most distant specimen at 1.83 nm; with the exception of the most distant sample, the La values changed in a more complicated manner albeit they were all within the range of 30.82–53.58 nm. This finding indicates that tridimensional ordering occurred with decreasing distance to the contact horizon even though the permutation is not strictly or universally applicable [49,50]. Notably, the structural parameters (Lc and La) of LT-5-5 (the second farthest sampling site from the intrusion) are not lower than those close to the intrusion. These distinct formations might be because of anomalous thermal gradients and the catalysis of abnormal elements during their graphitization. The mechanism of the distinct formation will be further discussed in later sections.

4.3. Raman Analysis

Figure 4 shows the Raman spectral profiles of series samples, and the main Raman spectral parameters are listed in Table 3. Overall, there are three bands, the D bands at 1320–1350 cm−1, the G bands at c. 1580 cm−1, and the D2 band at c. 1620 cm−1 in the first-order portion [51,52]. Viewed from the top in the first-order Raman region, the narrow and relatively strong G band is considered to be the vector of highly ordered graphite (basal plane) [52], and a relatively broad defect induced by the D band represents a state of disordered stacking in the crystalline structure [53]. Both are repeating and overlapping (Figure 4), showing that the samples are in the stage of the transformation from disordered turbostratic graphite to graphite [53,54]. The D2 band separated from the shoulder of the G band becomes weaker from specimens NF-5-5 to NF-5-9. The up-turn in the D2 band suggests a hexagonal lattice involving graphene layers that are not stacked between two other graphene layers in a manner similar to a sandwich [55], representing the lower limit of the graphite zone [56]; its intensity decreases with the increase in the degree of organization [57]. Thus, both the D band and D2 band suggest symmetry-breaking processes [58,59,60,61].
The bands in the second-order Raman spectra were generally attributed to the overtone or a combination of the bands in the first-order spectrum, especially for the highly ordered carbon materials [61,62]; thus, the Raman parameter of second-order-like position, shape, and intensities can impart similar information as the corresponding bands in the first-order region. The most conspicuous feature is the 2D band with solid intensity, except in the specimen sampled at greatest distance from the pluton, which is considered as the overtone of the D band and is believed to be related to the number of graphene layers and does not reflect any disorder or defect in the structure of the graphite crystal [63,64]. The intensity of the 2D2 band, defined as a counterpart in the second order spectra of the D2 band, is usually increased, accompanied by the 2D band as the crystallinity increases when its precursor is transformed to graphitizable carbon [65,66,67,68,69]. The D + G band is defined as the combination of the D band and G band in the first-order region [64,65]. It can be attributed to the larger aromatic rings present in the coal [70]. The attribution of the (2D)R band at c. 2460 cm–1 is suggested as indicative of the presence of such large aromatic rings in coal [70].
The intensity ratios and the half-height width are often used to characterize the degree of structural changes underway [7,8,10]. However, the half-height width was greatly affected by test conditions (i.e., different gratings, CCD cameras, etc.) [71]. As a function of the band intensity and the FWHM, the band area ratios are not only a combined parameter of the two parameters mentioned above but also provide the necessary information with respect to the carbon crystalline structure [60]. The parameter R1, which is the intensity ratio of the D and G bands, is evidence used to assess the degree of disordering of graphite crystalline structure and is suitable for use as a tool to compare different heating rates [52,72,73]. The parameter R2 = AG/(AD1 + AD2 + AG) (area ratio of bands) was used to determine the improvement in the order degree of structure [50,60,72,74].
As observed in Table 3, R1 ranges between 0.18 and 7.17. As a vector of the disorder of crystalline structure, a disordered structure is not regularly arranged according to the distance from the rock mass, as found in the XRD analysis. The value of R2 ranges from 0.12 to 0.74. With the exception of the most distant specimen, all other R2 values exceed 0.4, which is interpreted as the distinction between semi-graphite and graphite [72]. Thus, the analysis above is consistent with the XRD analysis: what is also of note is the fact that the degree of structural change (represented by R2) is not arranged in order according to distance from the heat source.

4.4. Chlorite Chemical Composition

Previous studies stated that the interlayered smectite or illite in the matrix of altered rocks might increase the concentrations of Na+, K+, and Ca2+ in the major element data of chlorite [75,76,77,78], which will affect the accuracy of subsequent analysis. Thus, the value of (CaO + Na2O + K2O) content of 0.5 wt% was selected as an upper limit herein. The chlorite chemical composition on the spatial distribution of samples is displayed in Table 4 and plotted in Figure 5. As shown in Table 4, there are lower concentrations of K2O (0–0.08 wt%), Cr2O3 (0–0.39 wt%), MnO (0–0.66 wt%), CaO (0–0.69 wt%), Na2O (0.25–2.11 wt%), and TiO2 (0–4.46 wt%) relative to that of other major oxides. The SiO2 content ranged from 22.39 to 35.88 wt%, and these were relatively stable with Al2O3 (19.58–33.55 wt%). Moreover, the concentration of MgO (1.84–11.81 wt%) was lower, but a higher FeO (7.61–41.59 wt%) was detected relative to other oxides in most specimens.
The structure calculation of chlorite was conducted by using WinCcac as proposed elsewhere [43]. The results show that the composition of Si ranged from 2.51 to 3.39 apfu, Fe: 0.60–4.02, R2+ (Mg + Fe +Mn): 1.38–4.41 apfu, and Fe/(Fe + Mg) mol: 0.43–0.93. Figure 5a shows that most chlorite from the Lutang graphite mining area could be classified as Type-I chlorite, which is characteristically Mg-poor and Fe-rich [79]. On the other hand, two samples that were relatively far from the intrusion belonged to Type-II (i.e., the total amount of Mg and Fe did not account for most of the number of atoms in each formula unit). Figure 5b shows that the content of MgO is negatively correlated with FeO, indicating an essential ionic substitution mechanism between Fe2+ and Mg2+ [43]; Figure 5c illustrates the trend whereby the content of Al keeps increasing while that of (Fe2++Mg) is decreasing, suggesting that 3(Mg, Fe2+) VI ⇔ +2(Al3+) VI substitution dominates [43,80,81] due to the tetrahedral vacancies usually occupied by Si and AlIV, while the octahedra are often occupied by Mg2+, Fe2+, and AlVI [81]. This result is consistent with Figure 5d (AlIV versus AlVI diagram for chlorite), which suggests that the tetrahedral Al values are negatively correlated with the octahedral Al concentrations in the specimens.
In the plot of Fe versus Si (a.p.f.u) after [82] (Figure 5e), the chlorite samples are plotted mainly in/near the ripidolite field besides two samples that are relatively far from the intrusion fall in the pennine field. Similarly, in the diagram of Si versus Fe (a.p.f.u) [83] (Figure 5f) based on the chlorite structure differences, most of the chlorite components are plotted in the sheridanite-ripidolite field, and the octahedral sites are occupied by R2+. In addition, as presented in the Al+-Mg-Fe classification diagram [79], most of the chlorite specimens were Fe-rich.
The non-stoichiometric composition of chlorite displays a wide range of variations that are related to the prevailing physico-chemical conditions at formation and protolith composition. Based on previous studies on the relationship of the formation temperature and composition of chlorite, i.e., chlorite geothermometers [43,78,80,84], combined with mineralogical observations (assemblages, modes, and mineral chemistry), we found that the quasi-constant chemical composition is the main feature of the sampling strata throughout the study area.

5. Discussion

It is generally accepted that the metamorphic process from coal to graphite is mainly due to the influence of thermal energy [85,86]. With the influence of heat-treatment triggered by a magmatic intrusion, the macromolecules of coal gradually loose heteroatoms, the aromatic ring structure of the coal is rearranged and becomes stacked while the number and size of the aliphatic functional groups fixed upon the aromatic layers become lower and small. Then, a short-range ordered graphite structure gradually forms, and this evolves to a long-range ordered graphite structure. On this basis, previous studies on the evolution of graphitization under natural conditions have shown that the distance from the magma intrusion, which is the heat source, is a key factor controlling the degree of graphitization. However, in this study, it was found that in the zone near the heat source, the degree of graphitization is not strictly ordered according to distance from the intruded magma. The non-progressive extension of the structure of graphite occurs not only by heat treatment but as a result of other factors.

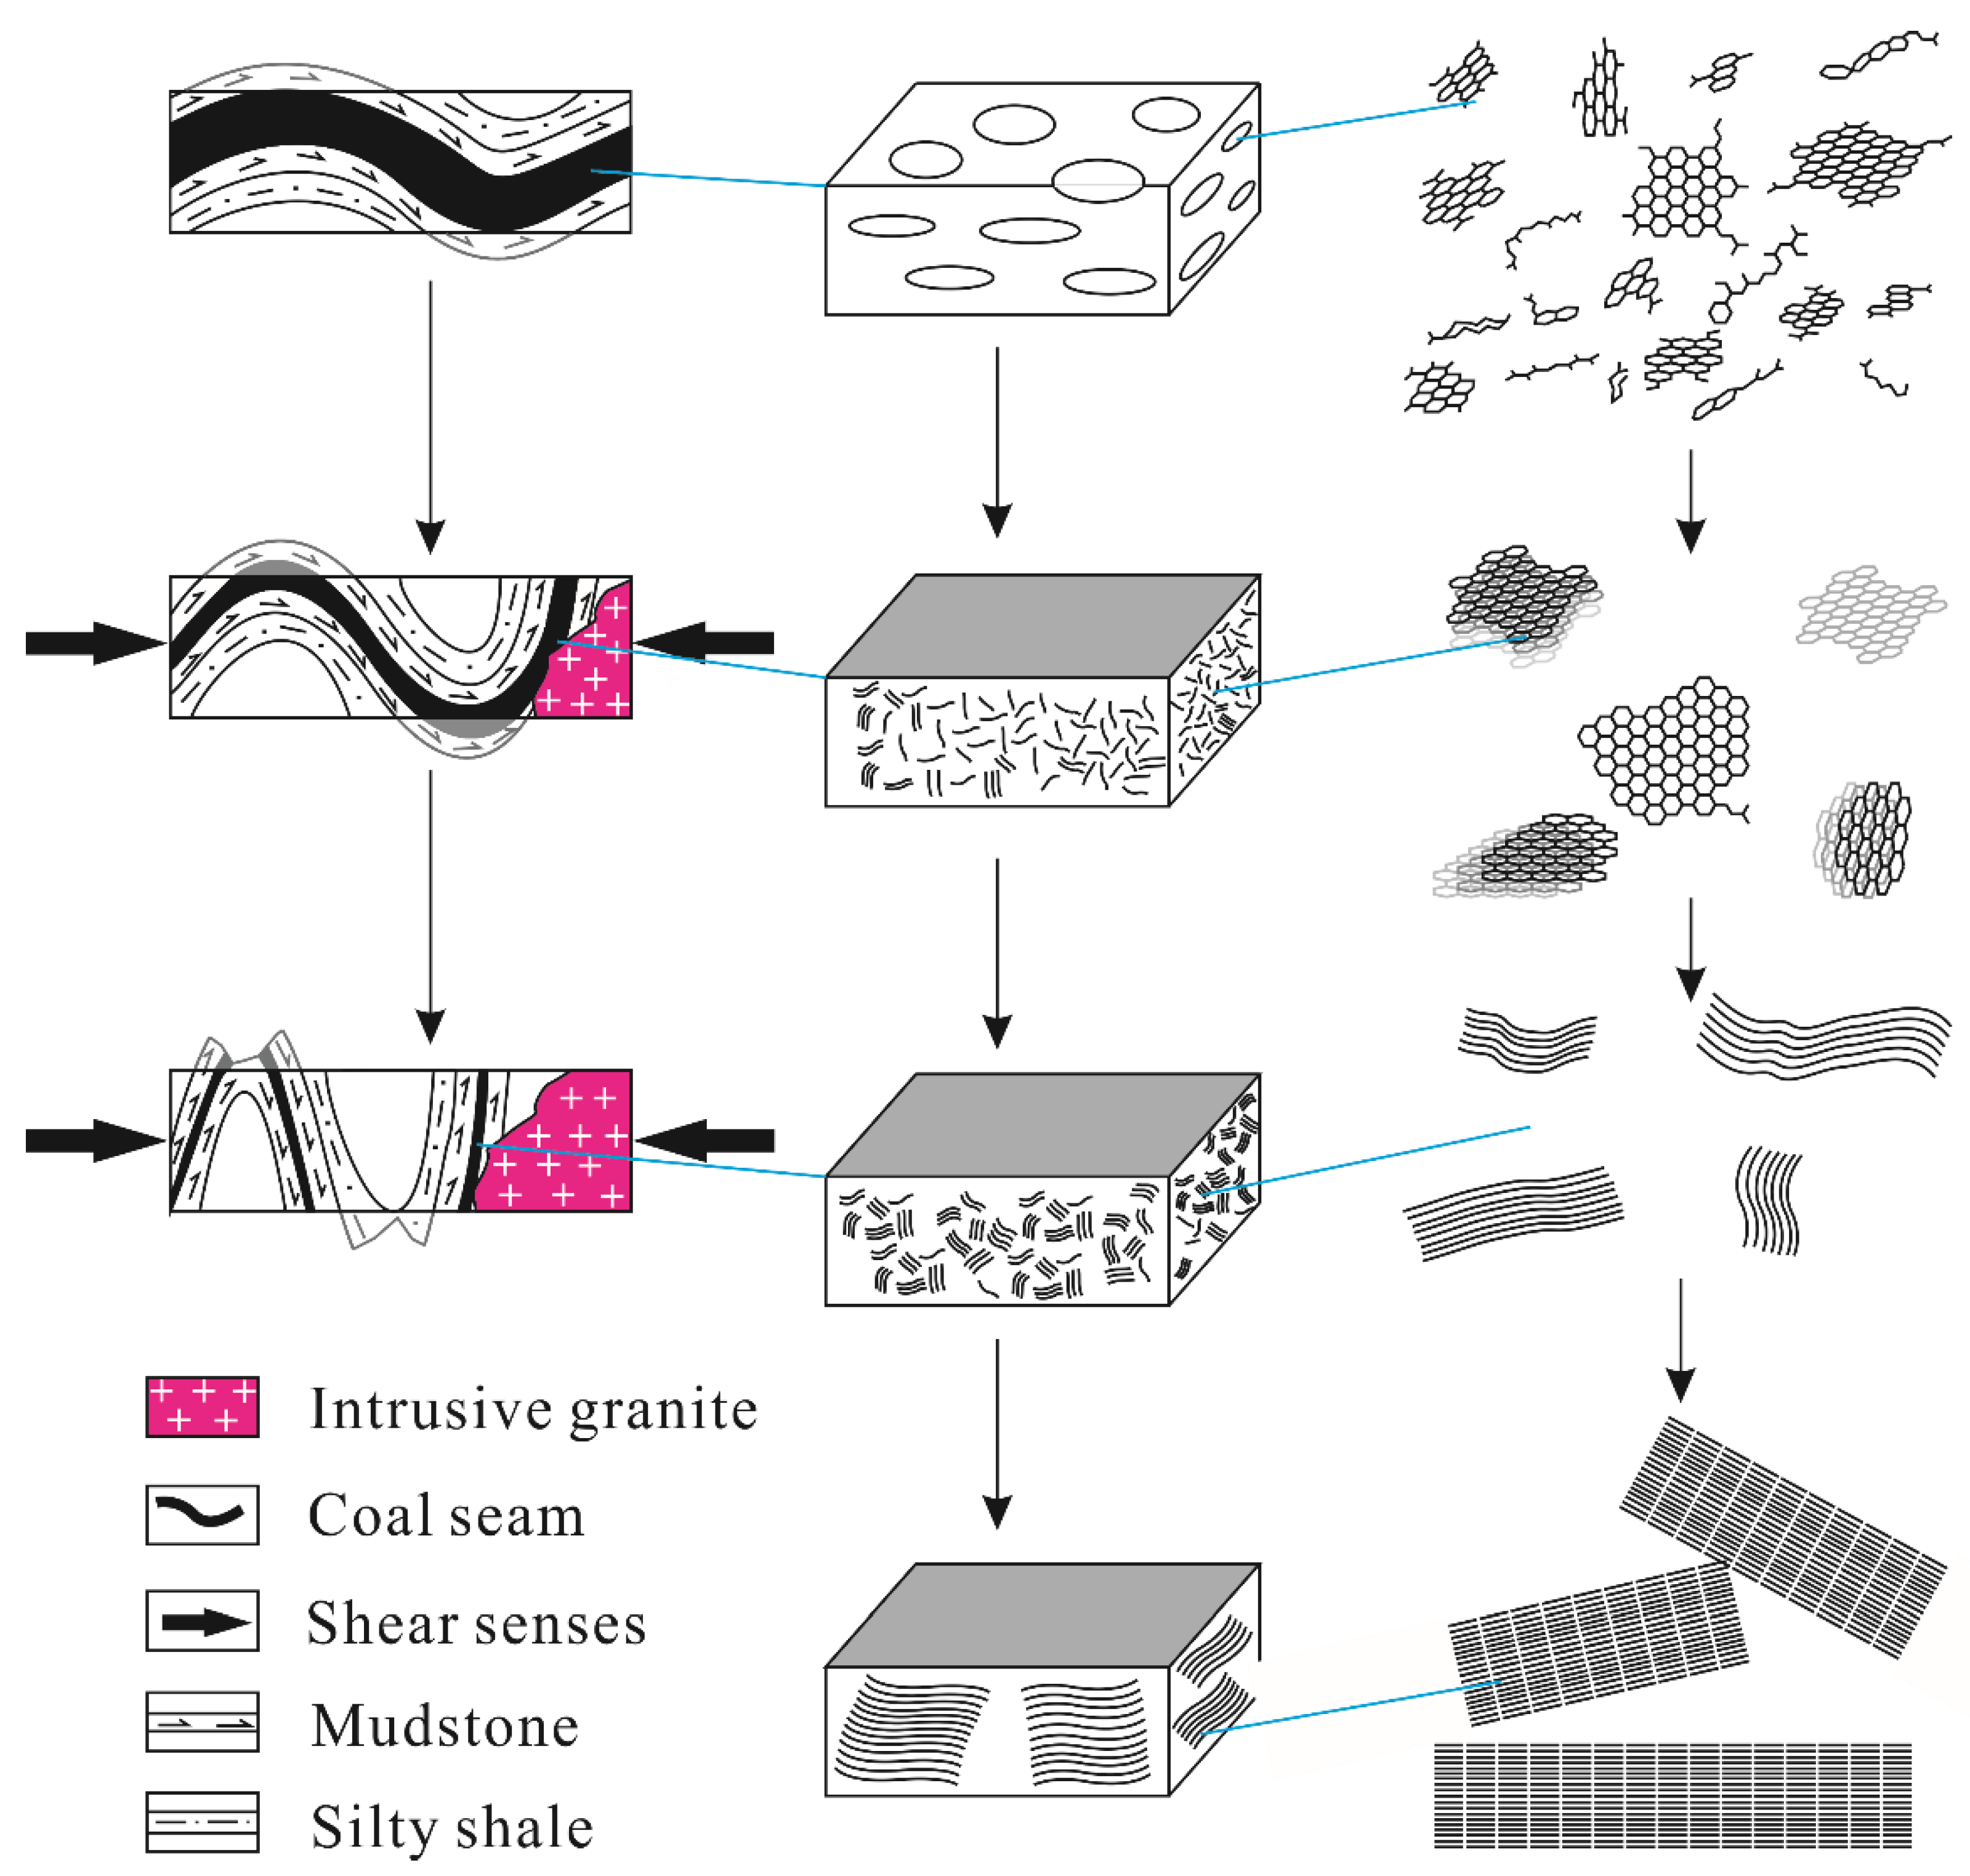
5.1. The Geological Strain Effect

As shown in Figure 6, with decreasing distance from the contact horizon, the order of grain size and structure is significantly higher than that of anthracite, and the carbon content (C%, daf), structural parameters (Lc and La), and Raman spectral parameter (AG/AD1 + AG + AD2) indicate fluctuating increases with increasing proximity to the Qitianling granite intrusion. Meanwhile, the Raman spectral parameter and XRD results show excellent consistency in indicating changes in graphitized structure. The trends in such fluctuations are consistent with the shape of the fold (Figure 1d). The occurrence of folding in the mining area of western Qitianling is associated with the tectonic period of igneous intrusion; thus, the strain energy generated by folding probably accelerates the ordering of polyaromatic rings in coal (Figure 7).
According to Bonijoly et al. [87], the graphitization of anthracites during their natural evolution is thermodynamically impossible with heat alone. Bustin confirmed that the strain energy could lower the temperatures for graphitization of carboniferous materials, and graphitization can occur at 600 °C under deviatoric compression in the laboratory [85,88]. This is consistent with the fact that the most graphitized samples were collected from highly deformed seams that were clearly observed at the tunnel when sampling at local mines. The stress is usually concentrated at the axis position of the fold and lowest at the middle wing of the fold; thus, the degree of graphitization of coal seam-derived graphite is highest at the fold axis and lowest at the middle of the wing (Figure 7).

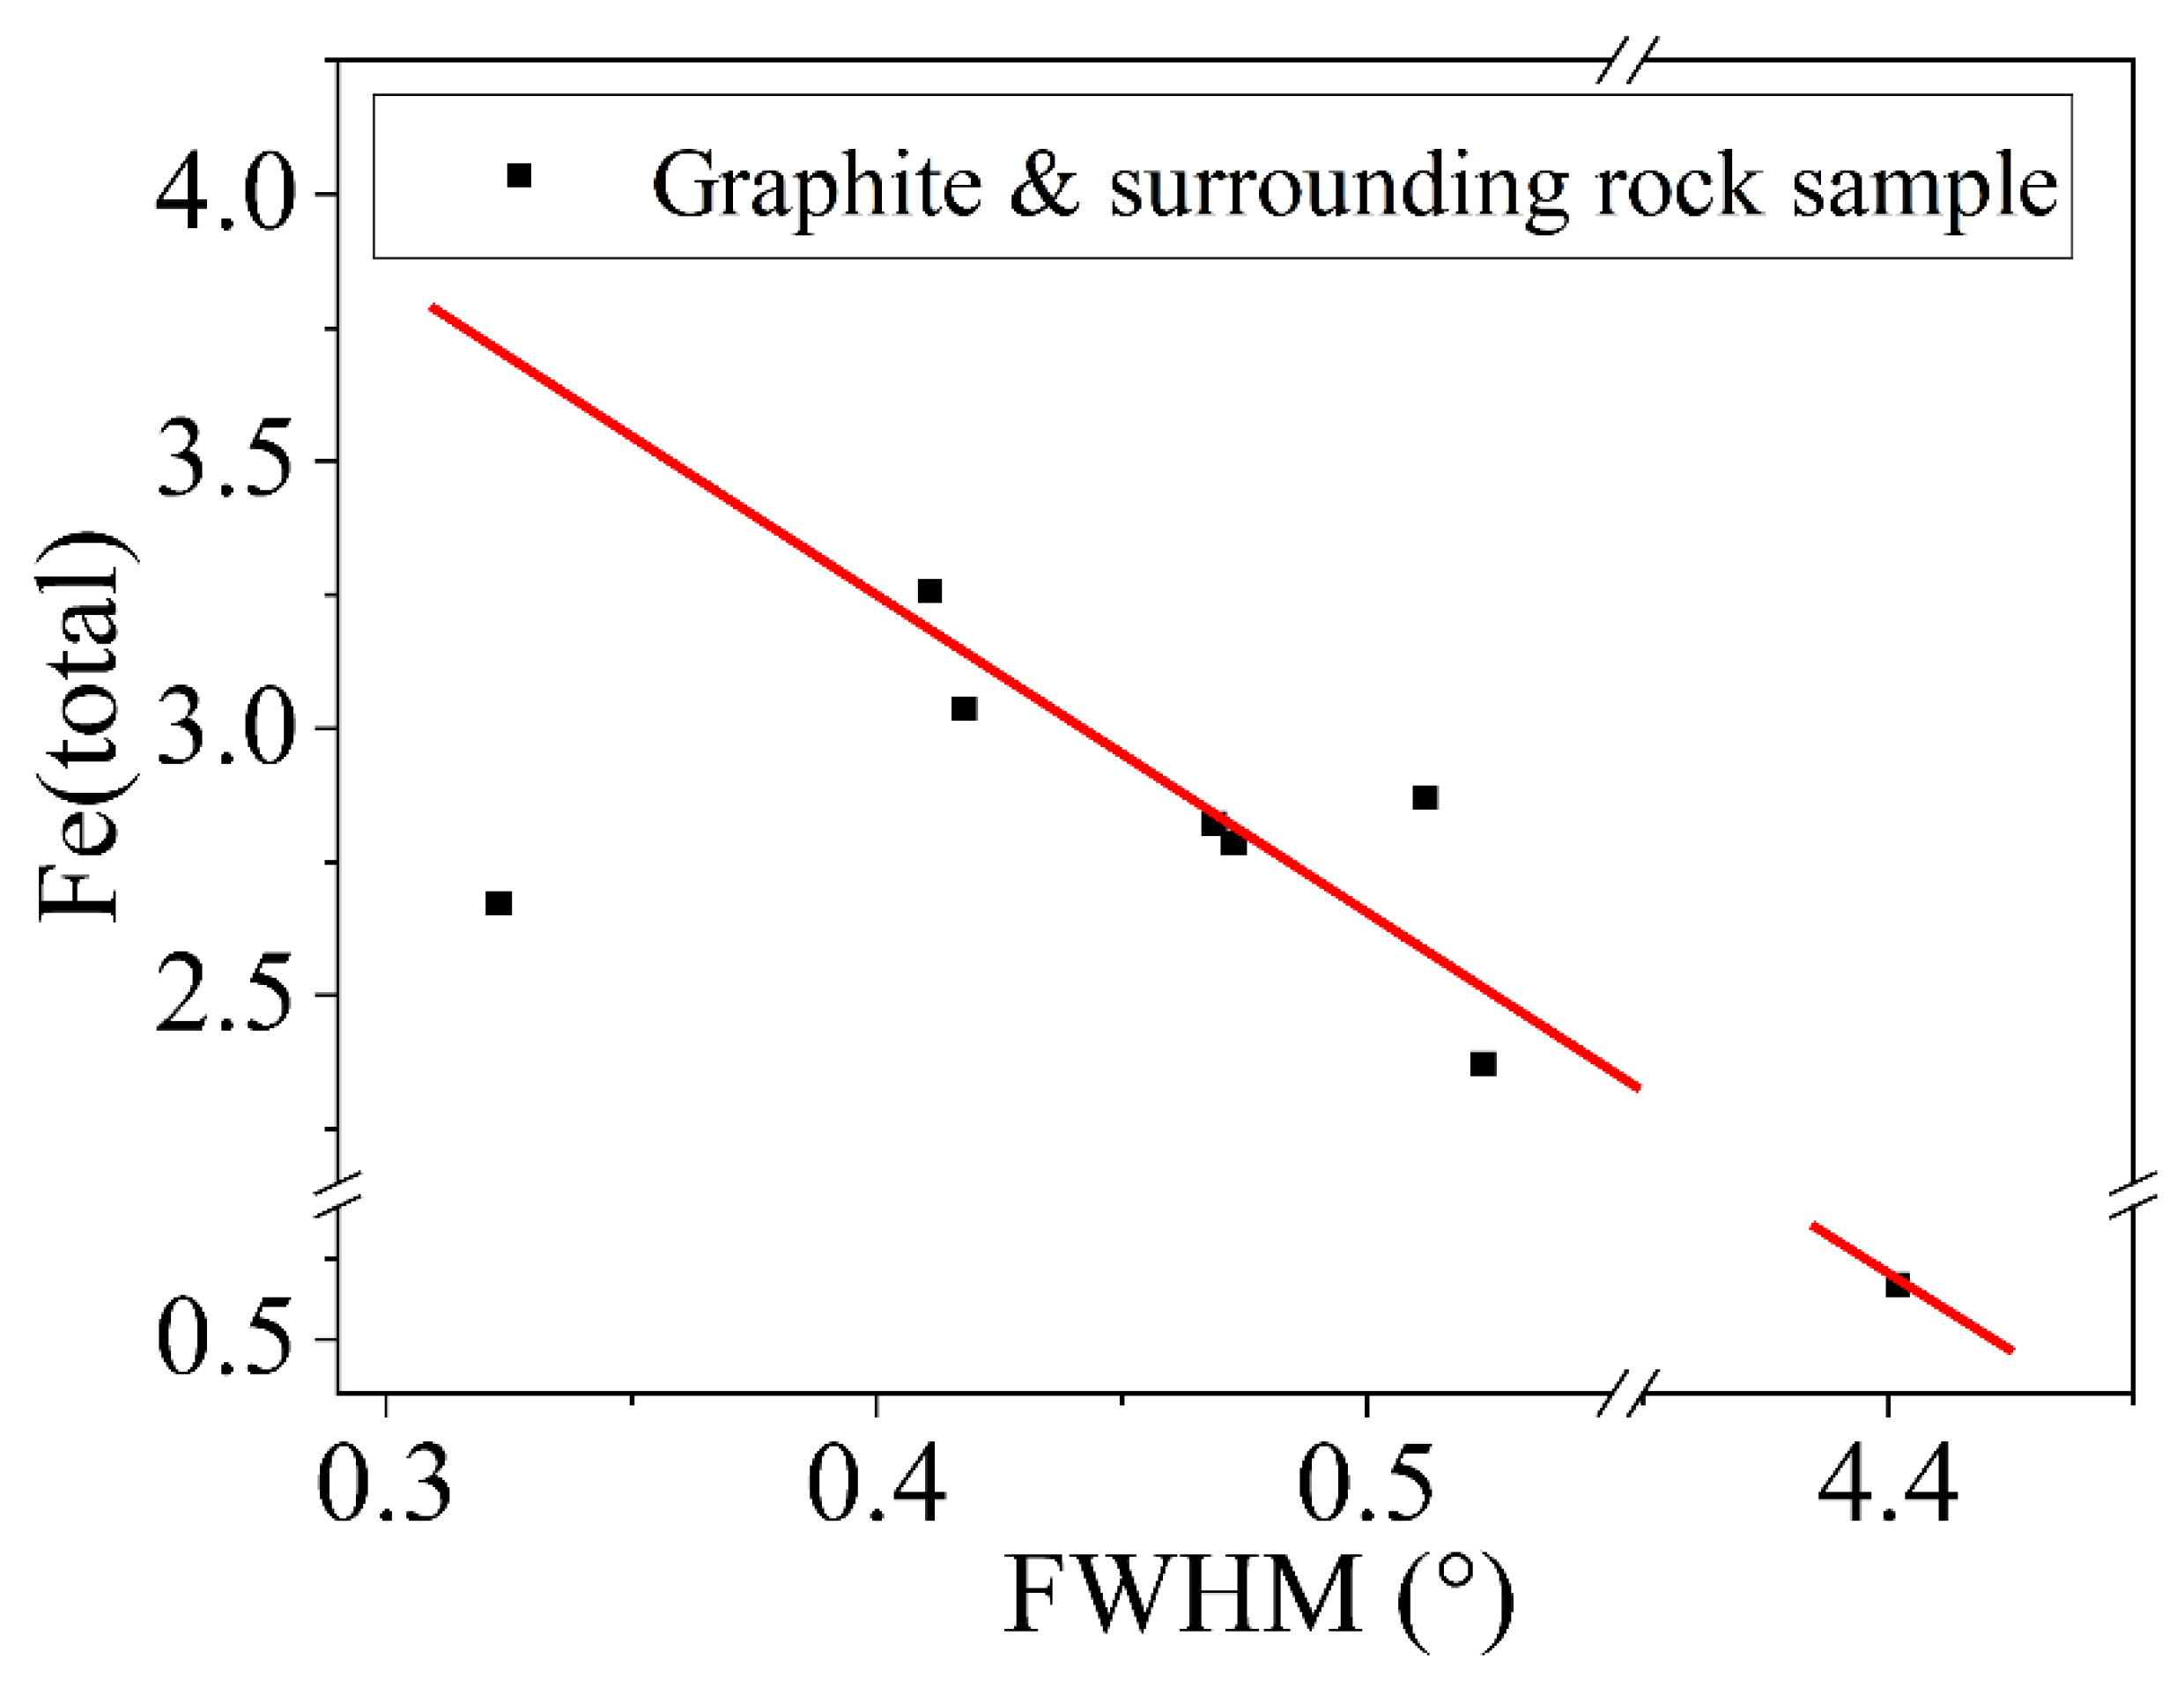
5.2. Natural Catalytic Graphitization by Iron-Bearing Minerals

As ubiquitous phyllosilicates in sedimentary, metamorphic, and hydrothermal environments, chlorites induce a high degree of isomorphous substitution. The chemical composition, such as AlIV content and chlorite Fe/(Fe + Mg) ratio, is known to be a function of the physico-chemical conditions of crystallization and the bulk composition of the host rocks. According to the calculation in Table 4, the temperature of chloriteization is far from reaching the lower limit of synthetic graphitization mentioned above. However, the compositional difference among the chlorite reflects protolith and fluid chemistry, which could influence the graphitization process in the period of geological activity.
As mentioned, the ionic substitution mechanisms of Fe2+ ⇔ Mg2+, Tschermak AlIVAlVI ⇔ Si (Mg2+, Fe2+), and di-trioctahedral 3(Mg2+, Fe2+) ⇔ +2AlVI) play an important role in the formation chlorite at the sampling tunnel. Approaching the nature of the contact, Fe/(Fe + Mg) ratios clearly increased, and most of the chlorite was classified as Fe-chlorite, indicating that the chlorite was mainly influenced by precursor Fe-rich minerals or the mafic-rich hydrothermal fluid.
Previous studies have found that the ore-forming temperature of coal-to-graphite in nature is about 600–900 °C, whereas the experimental temperature of coal graphitization in the laboratory exceeds 2000 °C [19,89]. In order to decrease the activation temperature for synthetic graphite, previous researchers have tried to increase the pressure and add appropriate catalysts. The catalyst is the most critical factor influencing the graphitization process of various carbons when temperature and carbon precursors are determined. Previous studies have entailed the use of certain major inorganic elements contained in the mineral matter of coals, such as silicon, iron, or aluminum, as catalysts in the graphitization of different precursor carbon materials [19,90,91]. Since clay minerals (e.g., illite, chlorite, or kaolinite) are the main minerals present in coal [92,93,94], it is widely accepted that the presence of iron in the clay minerals promotes the structural ordering of carbon materials during high-temperature treatment.
As shown in Figure 8, the (002) diffraction FWHM of graphite shows a close relationship with the Fe2+ (total) content in chlorite. There is an increase in the value of total Fe2+ of chlorite and a decrease in the FWHM (d002) of XRD spectra of graphite. As the structural ordering of graphite improves, the composition of Fe2+ is enriched. The appearance of chlorite may be altered from surrounding rock after graphitization. However, most of the coals often include various impurities (e.g., quartz, clays, or pyrite), which decompose by heat-treatment caused by intrusive events. Consequently, a catalytic graphitization process may occur, either due to iron or silica [19,90].

6. Conclusions

The carbon content (C%, daf), structural parameters (La and Lc), and Raman spectral parameter (AG/AD1 + AG + AD2) of a series of coal seam-derived natural graphite samples exhibit fluctuating increases with decreasing distance to the Qitianling granite intrusion. After thorough analysis on the relationship between fluctuation variation degree of coal seam-derived graphite with the tectonic event and chemical composition, the following conclusions can be drawn:
(1) The strain energy generated by folding during igneous intrusion can accelerate the ordering of polyaromatic rings in coal. The stress is usually concentrated at the axis of a fold and is lowest at the middle wing of the fold; thus, the degree of graphitization of coal seam-derived graphite is maximized at the fold axis and lower at the wing of the fold.
(2) A high Fe content in the chlorite from the peripheral intrusion halo suggests a higher degree of graphitization at one sampling site. The iron ion transfer during mineral phase transformation will play a catalytic role in the formation of coal seam-derived natural graphite.
(3) The compositional variations in chlorite could be used as a guide for the exploration of coal seam-derived graphite mineralization in shallow levels of a contact metamorphic environment.

Author Contributions

Software, Z.W., M.H. and H.C.; formal analysis, Y.W.; writing—original draft preparation, Y.W.; writing–review and editing, Y.W. and K.L.; supervision, Q.L. All authors have read and agreed to the published version of the manuscript.

Funding

This research has been supported by the National Natural Science Foundation of China (41672150 and 42002187).

Acknowledgments

Special thanks are given to Bohui Xu, Xianjian Cui, Lu Liu, and Botao Song for part samples collection.

Conflicts of Interest

The authors declare no conflict of interest.

References

  1. Yardley, B.W.D. An Introduction to Metamorphic Petrology; Longman Singapore Publishers (Pte) Ltd.: Singapore, 1990. [Google Scholar]
  2. Philpotts, A.; Ague, J. Principles of Igneous and Metamorphic Petrology, 2nd ed.; Cambridge University Press: Cambridge, UK, 2009; p. 685. [Google Scholar]
  3. Frost, B.R.; Frost, C.D. Essentials of Igneous and Metamorphic Petrology; Cambridge University Press: New York, NY, USA, 2014. [Google Scholar]
  4. Shi Bin, L.X.; Xin, M.; Lin, Y.; Zhao, Y.; Liu, Q. Mineralogic characteristics of pyrophyllite mudstone in Mentougou, western Beijing. Coal Geol. Explor. 2017, 45, 25–31. [Google Scholar] [CrossRef]
  5. Pattison, D.R.M. The fate of graphite in prograde metamorphism of pelites: An example from the Ballachulish aureole, Scotland. Lithos 2006, 88, 85–99. [Google Scholar] [CrossRef]
  6. Marchildon, N.; Simandl, G.J.; Hancock, K.D. The AA graphite deposit, Bella Coola area, British Columbia_ exploration implications for the coast plutonic complex. Geol. Fieldwork 1992, 1993, 9. [Google Scholar]
  7. Zhang, S.; Liu, Q.; Zhang, H.; Ma, R.; Li, K.; Wu, Y.; Teppen, B.J. Structural order evaluation and structural evolution of coal derived natural graphite during graphitization. Carbon 2020, 157, 714–723. [Google Scholar] [CrossRef]
  8. Yuan, L.; Liu, Q.; Mathews, J.P.; Zhang, H.; Wu, Y. Quantifying the structural transitions of chinese coal to coal-derived natural graphite by XRD, Raman spectroscopy, and HRTEM image analyses. Energy Fuels 2021, 35, 2335–2346. [Google Scholar] [CrossRef]
  9. Li, K.; Rimmer, S.M.; Liu, Q.; Zhang, Y. Micro-Raman spectroscopy of microscopically distinguishable components of naturally graphitized coals from central Hunan province, China. Energy Fuels 2019, 33, 1037–1048. [Google Scholar] [CrossRef]
  10. Li, K.; Liu, Q.; Rimmer, S.M.; Huggett, W.W.; Zhang, S. Investigation of the carbon structure of naturally graphitized coals from central Hunan, China, by density-gradient centrifugation, X-ray diffraction, and high-resolution transmission electron microscopy. Int. J. Coal Geol. 2020, 232. [Google Scholar] [CrossRef]
  11. Likhanov, I.I.; Reverdatto, V.V.; Sheplev, V.S.; Verschinin, A.E.; Kozlov, P.S. Contact metamorphism of Fe- and Al-rich graphitic metapelites in the transangarian region of the Yenisei Ridge, eastern Siberia, Russia. Lithos 2001, 58, 55–80. [Google Scholar] [CrossRef]
  12. Yao, Y.; Liu, D.; Huang, W. Influences of igneous intrusions on coal rank, coal quality and adsorption capacity in Hongyang, Handan and Huaibei coalfields, North China. Int. J. Coal Geol. 2011, 88, 135–146. [Google Scholar] [CrossRef]
  13. Dun, W.; Guijian, L.; Ruoyu, S.; Xiang, F. Investigation of structural characteristics of thermally metamorphosed coal by FTIR spectroscopy and X-ray diffraction. Energy Fuels 2013, 27, 5823–5830. [Google Scholar] [CrossRef]
  14. Li, K.; Liu, Q.; Hou, D.; Wang, Z.; Zhang, S. Quantitative investigation on the structural characteristics and evolution of high-rank coals from Xinhua, Hunan Province, China. Fuel 2021, 289. [Google Scholar] [CrossRef]
  15. Dun, W.; Guijian, L.; Ruoyu, S.; Shancheng, C. Influences of magmatic intrusion on the macromolecular and pore structures of coal: Evidences from Raman spectroscopy and atomic force microscopy. Fuel 2014, 119, 191–201. [Google Scholar] [CrossRef]
  16. Peng, Y.; Song, B.; Liu, L.; Liu, Q. Metamorphic mineral assemblage and metamorphic zones of Yangshigou area in western Beijing. Coal Geol. Explor. 2017, 45, 32–45. [Google Scholar] [CrossRef]
  17. Large, D.J.; Christy, A.G.; Fallick, A.E. Poorly crystalline carbonaceous matter in high grade metasediments: Implications for graphitisation and metamorphic fluid compositions. Contrib. Mineral. Petrol. 1994, 116, 108–116. [Google Scholar] [CrossRef]
  18. Buseck, P.R.; Beyssac, O. From organic matter to graphite: Graphitization. Elements 2014, 10, 421–426. [Google Scholar] [CrossRef]
  19. Oberlin, A.; Terriegravere, G.; Boulmier, J.L. Carbonification, carbonization and graphitization as studied by high resolution electron microscopy. TANSO 1975, 1975, 153–171. [Google Scholar] [CrossRef] [Green Version]
  20. Franklin, R.E. Crystallite growth in graphitizing and non-graphitizing carbons. Proc. R. Soc. Lond. Ser. A Math. Phys. Sci. 1951, 209, 196–218. [Google Scholar] [CrossRef]
  21. Atria, J.V.; Rusinko, F.; Schobert, H.H. Structural ordering of pennsylvania anthracites on heat treatment to 2000–2900 °C. Energy Fuels 2002, 16, 1343–1347. [Google Scholar] [CrossRef]
  22. Kipling, J.J.; Sherwood, J.N.; Shooter, P.V.; Thompson, N.R. Factors influencing the graphitization of polymer carbons. Carbom 1964, 1, 315–320. [Google Scholar] [CrossRef]
  23. Pusz, S.; Kwiecińska, B.K.; Duber, S. Textural transformation of thermally treated anthracites. Int. J. Coal Geol. 2003, 54, 115–123. [Google Scholar] [CrossRef]
  24. Nyathi, M.S.; Clifford, C.B.; Schobert, H.H. Characterization of graphitic materials prepared from different rank Pennsylvania anthracites. Fuel 2013, 114, 244–250. [Google Scholar] [CrossRef]
  25. Pappano, P.J.; Schobert, H.H. Effect of natural mineral inclusions on the graphitizability of a pennsylvania anthracite. Energy Fuels 2009, 23, 7. [Google Scholar] [CrossRef]
  26. Li, K.; Rimmer, S.M.; Presswood, S.M.; Liu, Q. Raman spectroscopy of intruded coals from the Illinois Basin: Correlation with rank and estimated alteration temperature. Int. J. Coal Geol. 2020, 219. [Google Scholar] [CrossRef]
  27. Zhu, L.; Wu, Y.; Zuo, W.; Xue, Y. Study on coal-bearing strata sedimentary environment and coal accumulation pattern in chenlei coalfield, Hunan province. Coal Geol. China 2015, 27, 4. [Google Scholar] [CrossRef]
  28. Li, C.; Wang, D.; Zhou, L.; Zhao, H.; Li, X.; Qu, W. Study on the Re-Os isotope composition of graphite from the lutang graphite deposit in Hunan province. Rock Miner. Anal. 2017, 36, 8. [Google Scholar] [CrossRef]
  29. Zhu, J.; Wang, R.; Zhang, P.; Xie, C.; Zhang, W.; Zhao, K.; Xie, L.; Yang, C.; Che, X.; Yu, A.; et al. Zircon U-Pb geochronological framework of Qitianling granite batholith, middle part of Nanling Range, South China. Sci. China Earth Sci. 2009, 52, 16. [Google Scholar] [CrossRef]
  30. Ma, L. Geological Map of Hunan Province; Geological Publishing House: Beijing, China, 2002. [Google Scholar]
  31. Zheng, G.; Shao, Z.; Che, Q.; Wang, L.; Huang, M. Detailed Exploration Geological Report of Lutang Minefield in Heye Mining Area, Guiyang County, Hunan Province; Southern Hunan Geological Team, Bureau of Geology and Mineral Resources of Hunan Province: Changsha, China, 1986.
  32. Jiang, H. Genetic types and geological characteristics of graphite-like deposits in Hunan Province. Non-Met. Mines 1994, 5. Available online: https://wenku.baidu.com/view/656930b85527a5e9856a561252d380eb629423fd.html (accessed on 5 October 2021).
  33. Shao, Z.; Che, Q. Geological characteristics of heye graphite deposit of quiyang county. Hunan Geol. 1988, 7, 25–30. [Google Scholar]
  34. Zhengqi, P.; Tao, W.; Yuhong, G. New ideas on the study of permian period coal-bearing strata in Hunan. Hunan Geol. 1997, 16, 4. [Google Scholar]
  35. An, J.; Tang, F.; Li, J. Metallogenic rules and resource potential of the graphite deposit in Hunan Province. J. Geol. 2016, 40, 5. [Google Scholar] [CrossRef]
  36. National Standard (Recommended). Sampling of Coal Seams; Standardization Administration of the P.R.C.: Beijing, China, 2008; GB/T 482-2008. [Google Scholar]
  37. National Standard (Recommended). Method for Chemical Analysis of Graphite; Standardization Administration of the P.R.C.: Beijing, China, 2008; GB/T 3521-2008. [Google Scholar]
  38. National Standard (Recommended). Ultimate Analysis of Coal; Standardization Administration of the P.R.C.: Beijing, China, 2015; GB/T 31391-2015. [Google Scholar]
  39. Tang, W. Studies on Aphanitic Graphite Purified by Mixed-acid Method and Microwave Absorbing Properties. Master’s Thesis, Changsha University of Science & Technology, Changsha, China, 2013. [Google Scholar]
  40. Tagiri, M. A measurement of the graphitizing-degree by the X-ray powder diffractometer. J. Jpn. Assoc. Mineral. Petrol. Econ. Geol. 1981, 76, 8. [Google Scholar] [CrossRef]
  41. Vidano, R.; Fischbach, D.B. New lines in the raman spectra of carbons and graphite. J. Am. Ceram. Soc. 1978, 61, 5. [Google Scholar] [CrossRef]
  42. Hinrichs, R.; Brown, M.T.; Vasconcellos, M.A.Z.; Abrashev, M.V.; Kalkreuth, W. Simple procedure for an estimation of the coal rank using micro-Raman spectroscopy. Int. J. Coal Geol. 2014, 136, 52–58. [Google Scholar] [CrossRef]
  43. Yavuz, F.; Kumral, M.; Karakaya, N.; Karakaya, M.Ç.; Yıldırım, D.K. A Windows program for chlorite calculation and classification. Comput. Geosci. 2015, 81, 101–113. [Google Scholar] [CrossRef]
  44. Ghetti, P. DTG combustion behaviour of coal: Correlations with proximate and ultimate analysis data. Fuel 1986, 65, 4. [Google Scholar] [CrossRef]
  45. Xie, X.; Zhao, Y.; Qiu, P.; Lin, D.; Qian, J.; Hou, H.; Pei, J. Investigation of the relationship between infrared structure and pyrolysis reactivity of coals with different ranks. Fuel 2018, 216, 521–530. [Google Scholar] [CrossRef]
  46. Li, K.; Rimmer, S.M.; Liu, Q. Geochemical and petrographic analysis of graphitized coals from Central Hunan, China. Int. J. Coal Geol. 2018, 195, 267–279. [Google Scholar] [CrossRef]
  47. Wang, L.; Cao, D.; Peng, Y.; Ding, Z.; Li, Y. Strain-induced graphitization mechanism of coal-based graphite from Lutang, Hunan Province, China. Minerals 2019, 9, 617. [Google Scholar] [CrossRef] [Green Version]
  48. Kwiecińska, B.; Petersen, H.I. Graphite, semi-graphite, natural coke, and natural char classification—ICCP system. Int. J. Coal Geol. 2004, 57, 99–116. [Google Scholar] [CrossRef]
  49. Marques, M.; Suárez-Ruiz, I.; Flores, D.; Guedes, A.; Rodrigues, S. Correlation between optical, chemical and micro-structural parameters of high-rank coals and graphite. Int. J. Coal Geol. 2009, 77, 377–382. [Google Scholar] [CrossRef]
  50. Rodrigues, S.; Suárez-Ruiz, I.; Marques, M.; Flores, D.; Camean, I.; García, A.B. Development of graphite-like particles from the high temperature treatment of carbonized anthracites. Int. J. Coal Geol. 2011, 85, 8. [Google Scholar] [CrossRef]
  51. Pócsik, I.; Hundhausen, M.; Koós, M.; Ley, L. Origin of the D peak in the Raman spectrum of microcrystalline graphite. J. Non-Cryst. Solids 1998, 227–230, 1083–1086. [Google Scholar] [CrossRef]
  52. Tuinstra, F.; Koenig, J.L. Raman spectrum of graphite. J. Chem. Phys. 1970, 53, 1126–1130. [Google Scholar] [CrossRef] [Green Version]
  53. Pimenta, M.A.; Dresselhaus, G.; Dresselhaus, M.S.; Cancado, L.G.; Jorio, A.; Saito, R. Studying disorder in graphite-based systems by Raman spectroscopy. Phys. Chem. Chem. Phys. 2007, 9, 1276–1291. [Google Scholar] [CrossRef] [PubMed]
  54. Schuepfer, D.B.; Badaczewski, F.; Guerra-Castro, J.M.; Hofmann, D.M.; Heiliger, C.; Smarsly, B.; Klar, P.J. Assessing the structural properties of graphitic and non-graphitic carbons by Raman spectroscopy. Carbon 2020, 161, 359–372. [Google Scholar] [CrossRef]
  55. Dresselhaus, M.S.; Jorio, A.; Saito, R. Characterizing graphene, graphite, and carbon nanotubes by raman spectroscopy. Annu. Rev. Condens. Matter Phys. 2010, 1, 89–108. [Google Scholar] [CrossRef]
  56. Rantitsch, G.; Lämmerer, W.; Fisslthaler, E.; Mitsche, S.; Kaltenböck, H. On the discrimination of semi-graphite and graphite by Raman spectroscopy. Int. J. Coal Geol. 2016, 159, 48–56. [Google Scholar] [CrossRef]
  57. Green, P.D.; Johnson, C.A.; Thomas, K.M. Applications of laser Raman microprobe spectroscopy to the characterization of coals and cokes. Fuel 1983, 62, 11. [Google Scholar] [CrossRef]
  58. Reich, S.; Thomsen, C. Raman spectroscopy of graphite. Philos. Trans. A Math. Phys. Eng. Sci. 2004, 362, 2271–2288. [Google Scholar] [CrossRef]
  59. Sadezky, A.; Muckenhuber, H.; Grothe, H.; Niessner, R.; Pöschl, U. Raman microspectroscopy of soot and related carbonaceous materials: Spectral analysis and structural information. Carbon 2005, 43, 1731–1742. [Google Scholar] [CrossRef]
  60. Sheng, C. Char structure characterised by Raman spectroscopy and its correlations with combustion reactivity. Fuel 2007, 86, 2316–2324. [Google Scholar] [CrossRef]
  61. Nemanich, R.J.; Solin, S.A. First- and second-order Raman scattering from finite-size crystals of graphite. Phys. Rev. B 1979, 20, 392–401. [Google Scholar] [CrossRef]
  62. Thomsen, C. Second-order Raman spectra of single and multiwalled carbon nanotubes. Phys. Rev. 2000, 61. [Google Scholar] [CrossRef]
  63. Zaida, A.; Bar-Ziv, E.; Radovic, L.R.; Lee, Y.-J. Further development of Raman Microprobe spectroscopy for characterization of char reactivity. Proc. Combust. Inst. 2007, 31, 1881–1887. [Google Scholar] [CrossRef]
  64. Antunes, E.F.; Lobo, A.O.; Corat, E.J.; Trava-Airoldi, V.J.; Martin, A.A.; Veríssimo, C. Comparative study of first- and second-order Raman spectra of MWCNT at visible and infrared laser excitation. Carbon 2006, 44, 2202–2211. [Google Scholar] [CrossRef]
  65. Lee, Y.-J. The second order Raman spectroscopy in carbon crystallinity. J. Nucl. Mater. 2004, 325, 174–179. [Google Scholar] [CrossRef]
  66. Endo, M.; Kim, C.; Karaki, T.; Tamaki, T.; Nishimura, Y.; Matthews, M.J.; Brown, S.D.M.; Dresselhaus, M.S. Structural analysis of the B-doped mesophase pitch-based graphite fibers by Raman spectroscopy. Phys. Rev. B 1998, 58, 6. [Google Scholar] [CrossRef]
  67. Hishiyama, Y.; Irumano, H.; Kaburagi, Y.; Soneda, Y. Structure, Raman scattering, and transport properties of boron-doped graphite. Phys. Rev. B 2001, 63, 245406. [Google Scholar] [CrossRef]
  68. Xu, B.; Song, Y.; Liu, Q.; Ding, S.; Wu, Y. Research Status of Metallogenic Mechanism of Aphanitic Graphite. Adv. Geosci. 2018, 08, 133–140. [Google Scholar] [CrossRef]
  69. Chieu, T.C.; Dresselhaus, M.S.; Endo, M. Raman studies of benzene-derived graphite fibers. Phys. Rev. B 1982, 26, 5867–5877. [Google Scholar] [CrossRef]
  70. Xu, J.; Tang, H.; Su, S.; Liu, J.; Han, H.; Zhang, L.; Xu, K.; Wang, Y.; Hu, S.; Zhou, Y.; et al. Micro-Raman spectroscopy study of 32 kinds of Chinese coals: Second-order Raman spectrum and its correlations with coal properties. Energy Fuels 2017, 31, 7884–7893. [Google Scholar] [CrossRef]
  71. Lünsdorf, N.K.; Dunkl, I.; Schmidt, B.C.; Rantitsch, G.; von Eynatten, H. Towards a higher comparability of geothermometric data obtained by raman spectroscopy of carbonaceous material. Part I: Evaluation of biasing factors. Geostand. Geoanalytical Res. 2014, 38, 73–94. [Google Scholar] [CrossRef]
  72. Beyssac, O.; Goffé, B.; Chopin, C.; Rouzaud, J.N. Raman spectra of carbonaceous material in metasediments: A new geothermometer. J. Metamorph. Geol. 2002, 20, 13. [Google Scholar] [CrossRef]
  73. Henry, D.G.; Jarvis, I.; Gillmore, G.; Stephenson, M. Raman spectroscopy as a tool to determine the thermal maturity of organic matter: Application to sedimentary, metamorphic and structural geology. Earth-Sci. Rev. 2019, 198. [Google Scholar] [CrossRef]
  74. Quirico, E.; Rouzaud, J.N.; Bonal, L.; Montagnac, G. Maturation grade of coals as revealed by Raman spectroscopy: Progress and problems. Spectrochim. Acta A Mol. Biomol. Spectrosc. 2005, 61, 2368–2377. [Google Scholar] [CrossRef] [PubMed]
  75. Hillier, S.; Velde, B. Octahedral occupancy and the chemical composition of diagenetic (low-temperature) chlorites. Clay Miner. 1991, 26, 20. [Google Scholar] [CrossRef]
  76. Foster, M.D. Interpretation of the composition and a classification of the chlorites. United States Geol. Surv. Prof. Pap. 1962, 414-A, 1–33. [Google Scholar] [CrossRef] [Green Version]
  77. Inoue, A.; Kurokawa, K.; Hatta, T. Application of chlorite geothermometry to hydrothermal alteration in toyoha geothermal system, southwestern Hokkaido, Japan. Resour. Geol. 2010, 60, 19. [Google Scholar] [CrossRef]
  78. Cathelineau, M.; Nieva, D. A chlorite solid solution geothermometer The Los Azufres (Mexico) geothermal system. Contrib. Mineral. Petrol. 1985, 91, 10. [Google Scholar] [CrossRef]
  79. Zane, A.; Weiss, Z. A procedure for classifying rock-forming chlorites based on microprobe data. Rend. Fis. Acc. Lincei 1998, 9, 6. [Google Scholar] [CrossRef]
  80. Zhang, S.; Xiao, B.; Long, X.; Chu, G.; Cheng, J.; Zhang, Y.; Tian, J.; Xu, G. Chlorite as an exploration indicator for concealed skarn mineralization: Perspective from the Tonglushan Cu–Au–Fe skarn deposit, Eastern China. Ore Geol. Rev. 2020, 126, 103778. [Google Scholar] [CrossRef]
  81. Cathelineau, M. Cation site occupancy in chlorites and illites as a function of temperature. Clay Miner. 1988, 23, 471–485. [Google Scholar] [CrossRef]
  82. Hey, M.H. A new review of the chlorites. Mineral. Mag. J. Mineral. Soc. 1954, 30, 16. [Google Scholar] [CrossRef]
  83. Wiewióra, A.; Weiss, Z. Crystallochemical classifications of phyllosilicates based on the unified system of projection of chemical composition: II. The chlorite group. Clay Miner. 1990, 25, 10. [Google Scholar] [CrossRef]
  84. Zane, A.; Sassi, R.; Guidotti, C.V. New data on metamorphic chlorite as a petrogenetic indicator mineral, with special regard to greenschist-facies rocks. Can. Mineral. 1998, 36, 713–726. [Google Scholar] [CrossRef]
  85. Bustin, R.M.; Rouzaud, J.N.; Ross, J.V. Natural graphitization of anthracite experimental considerations. Carbon 1995, 33, 13. [Google Scholar] [CrossRef]
  86. Qiu, T.; Yang, J.-g.; Bai, X.-j. Insight into the change in carbon structure and thermodynamics during anthracite transformation into graphite. Int. J. Miner. Metall. Mater. 2020, 27, 11. [Google Scholar] [CrossRef]
  87. Bonijoly, M.; Oberlin, M.; Oberlin, A. A possible mechanism for natural graphite formation. Int. J. Coal Geol. 1982, 1, 283–312. [Google Scholar] [CrossRef]
  88. Ross, J.V.; Bustin, R.M.; Rouzaud, J.N. Graphitization of high rank coals—the role of shear strain: Experimental considerations. Organic Geochemistry. Org. Geochem. 1991, 17, 12. [Google Scholar] [CrossRef]
  89. Badenhorst, C.; Santos, C.; Lázaro-Martínez, J.; Białecka, B.; Cruceru, M.; Guedes, A.; Guimarães, R.; Moreira, K.; Predeanu, G.; Suárez-Ruíz, I.; et al. Assessment of graphitized coal ash char concentrates as a potential synthetic graphite source. Minerals 2020, 10. [Google Scholar] [CrossRef]
  90. Ōya, A.; Marsh, H. Phenomena of catalytic graphitization. J. Mater. Sci. 1982, 17, 309–322. [Google Scholar] [CrossRef]
  91. Wang, W.; Thomas, K.M.; Poultney, R.M.; Willmers, R.R. Iron catalysed graphitisation in the blast furnace. Carbon 1995, 33, 1525–1535. [Google Scholar] [CrossRef]
  92. Li, X.; Dai, S.; Nechaev, V.P.; Graham, I.T.; French, D.; Wang, X.; Zhao, L.; Zhao, J. Mineral matter in the late permian C1 coal from Yunnan Province, China, with emphasis on its origins and modes of occurrence. Minerals 2020, 11, 19. [Google Scholar] [CrossRef]
  93. McIntosh, J.A.; Tabor, N.J.; Rosenau, N.A. Mixed-layer illite-smectite in pennsylvanian-aged paleosols: Assessing sources of illitization in the illinois basin. Minerals 2021, 11, 108. [Google Scholar] [CrossRef]
  94. Liu, S.; Ma, W.; Zhang, Y.; Zhang, Y.; Qi, K. Sequential transformation behavior of iron-bearing minerals during underground coal gasification. Minerals 2018, 8, 90. [Google Scholar] [CrossRef] [Green Version]
Figure 1. (a) Location of the research area; (b) geological sketch map of southern Hunan showing the general geological features of the study area (after Ma, 2002) [30]; (c) geological map of the study area with sampling positions; (d) schematic cross section through the mining area including the sampling positions. (a,b) have been redrawn and modified based on Zheng et al. (1986) [31].
Minerals 11 01147 g001
Figure 2. Contents of Ad and Cdaf versus distance from the intrusive contact horizon.
Minerals 11 01147 g002
Figure 3. XRD patterns of coal seam-derived graphite in 2θ ranges (a) between 10° and 70°, (b) between 20° and 30°, and (c) between 42° and 46°.
Minerals 11 01147 g003
Figure 4. (a) Raman spectra of series coal seam-derived graphite samples, (b) peak fitting of Raman spectrum in the first-order region in case of sample 5-5, and (c) peak fitting of Raman spectrum in the second order region in case of sample 5-5.
Minerals 11 01147 g004
Figure 5. Chlorite chemical composition and the spatial distribution of specimens. (a) (Al+□)-Mg-Fe (after Zane and Weiss (1998) [79]; (b) Fe2+ vs. Mg (a.p.f.u) (after Yavuz et al. (2015)) [43]; (c) AlVI vs. Fe2++Mg vs. Distance from the intrusion; (d) AlVI vs. AlIV; (e) Fe vs. Si (a.p.f.u) (Hey and Hey (1954)) [82]; (f) R2+ vs. Si (a.p.f.u) (after Wiewióra and Weiss (1990)) [83].
Minerals 11 01147 g005
Figure 6. Relationships between Cdaf (%) content, the parameter (Lc, La) of grain size, Raman spectral parameter (AG/AD1 + AG + AD2), and distance from the contact horizon (m).
Minerals 11 01147 g006
Figure 7. Strain-induced graphitization model of coal seam-derived graphite.
Minerals 11 01147 g007
Figure 8. Relationships between the value of total Fe2+ of chlorite and the FWHM (d002) of graphite XRD spectra.
Minerals 11 01147 g008
Table 1. Proximate and ultimate analysis of samples.
SamplesDistance (m)Proximate Analysis (%)Ultimate Analysis (%, daf)H/CO/CVM/Cdaf
10−2
NO.MoistAshFCVMSCHNO10−2
LT-5-1613400.2551.845.52.70.0394.40.020.694.830.020.052.86
5-58400.328.269.752.050.1197.1400.132.58nd0.032.11
5-117600.7627.869.662.540.2196.4800.113.12nd0.032.63
5-136300.4114.781.893.410.06960.110.453.370.110.043.55
5-144800.3910.488.531.070.0598.8100.071.06nd0.011.08
5-16 4300.258.489.791.810.0598.0200.091.84nd0.021.85
5-18 330620.773.635.670.1292.850.50.456.040.540.076.11
NF5-52000.2823.273.213.590.1195.3300.384.15nd0.043.77
NF5-91500.8227.870.971.230.0398.300.171.49nd0.021.25
5-19-7-3110.3517.881.930.270.0399.6700.060.23nd0.010.27
Note: Data are ordered by decreasing distance to the intrusion horizon. Moist—moisture, air-dry basis; Ash—ash yield, dry basis; FC—fixed carbon, dry basis; VM—volatile matter, dry ash-free basis; Nd—not detected; ad—air-dry basis; d—dry basis; daf—dry ash-free basis.
Table 2. XRD parameters and optical reflectance of samples.
SamplesD (m)d002 (nm)FWHM (°)Lc (nm)La (nm)
LT-5-1613400.34544.4021.835.14
5-58400.33670.52315.4344.09
5-117600.33810.56214.3652.01
5-136300.33930.75410.7034.69
5-144800.33720.46817.2442.27
5-164300.33750.57414.0645.94
5-183300.33750.51915.5535.25
NF5-52000.33740.54814.7230.82
NF5-91500.33730.37321.6353.58
5-19-7-3110.33790.46117.5042.57
Table 3. The Raman spectral parameters derived from peak fitting of the series samples.
Sample NO.Distance (m)D1 BandG BandD2 BandR1R2
PositionFWHMPositionFWHMPositionFWHM
LT-5-1613401345.3174.631560.16128.161601.4748.227.170.12
5-5 8401349.4931.471581.9923.651621.2817.230.60.53
5-117601350.1346.231581.9826.041621.9729.030.50.5
5-13 6301347.2934.511576.8241615.521.060.430.6
5-14 4801349.5949.741582.5122.221615.634.970.370.49
5-16 4301349.0742.41579.3921.741620.1816.040.180.74
5-18 3301349.6435.741582.0824.191620.0921.50.440.58
NF5-52001349.4639.221582.8424.581619.0125.230.720.49
NF5-91501349.1944.411579.921.651620.6316.310.450.48
5-19-7-3111349.3540.081582.1223.011620.0221.40.530.51
Table 4. Chemical composition (wt %) of chlorite from Lutang deposit analyzed by EPMA, along with their structural formulae and estimated formation temperatures.
Samples5-19-7-31NF5-9NF5-55-185-165-145-135-115-5LT-5-16
(%) SiO2 22.923.9222.523.824.3922.3926.9522.9623.4735.88
TiO24.460.060.010.2900.151.56000.58
Al2O320.3222.292123.0423.222.7619.582324.0432.86
Cr2O30.040.080.310.070.30.030.030.390.050.08
FeO35.1229.1741.5931.1426.532.3931.4630.8730.667.61
MnO0.280.510.660.070.490.610.410.320.40.04
MgO5.3310.211.849.2911.817.877.28.118.465.64
CaO0.060.10.110.060.1500.170.280.430.42
Na2O0.250.310.40.40.290.320.430.340.332.04
K2O00.040.020.060.020.040.060.080.070.03
Total (%)88.7686.6988.4488.2287.1586.5687.8586.3587.9185.18
(apfu)Si2.53762.61812.6012.57712.61082.50872.92652.55312.54883.3924
Ti0.37170.00490.00090.023600.01260.1274000.0412
Al2.65382.87532.86112.94032.92693.00552.50593.01433.07693.6617
Cr0.00350.00690.02830.0060.02540.00270.00260.03430.00430.006
Fe(2+)3.25462.674.02062.81992.37233.0352.8572.87072.78450.6017
Mn0.02630.04730.06460.00640.04440.05790.03770.03010.03680.0032
Mg0.88051.66590.31711.49961.88461.31451.16561.34441.36960.795
Ca0.00710.01170.01360.0070.017200.01980.03340.050.0425
Na0.05370.06580.08970.0840.06020.06950.09050.07330.06950.374
K00.00560.00290.00830.00270.00570.00830.01130.00970.0036
Type (Zane and Weiss (1998) [79])Type-IType-IType-IType-IType-IType-IType-IType-IType-IType-II
(Octahedral vacant)0.27190.11150.10640.1270.13560.0630.37740.15310.1791.4988
R2+4.16144.38324.40244.32594.30134.40744.06034.24534.191 1.3999
Fe/(Fe + Mg)0.78710.61580.92690.65280.55730.69780.71020.68110.67030.4308
Mg/(Mg + Fe2+)0.21290.38420.07310.34720.44270.30220.28980.31890.32970.5692
TCN85-AlIV (°C)324307310315308330241320321321
TCN85-Octahedral Vacancy (°C)218255256252250267193245239239
TZF95-AlIV (°C)286285260290292301211293295295
TX97-AlIV (°C)205252124249279252112245251251
Publisher’s Note: MDPI stays neutral with regard to jurisdictional claims in published maps and institutional affiliations.

