
Specific Mixing Energy of Cemented Paste Backfill, Part I: Laboratory Determination and Influence on the Consistency


Research Institute on Mines and the Environment (RIME), Université du Québec en Abitibi-Témiscamingue (UQAT), 445 Boul. de l’Université, Rouyn-Noranda, QC J9X 5E4, Canada
*
Author to whom correspondence should be addressed.
Minerals 2021, 11(11), 1165; https://0-doi-org.brum.beds.ac.uk/10.3390/min11111165
Submission received: 26 August 2021
/
Revised: 4 October 2021
/
Accepted: 14 October 2021
/
Published: 21 October 2021
(This article belongs to the Special Issue Backfilling Materials for Underground Mining, Volume II)
Abstract
:Slump determination is widely used to assess the consistency and transportability of fresh cemented paste backfill (CPB). CPB consistency can depend on the mixing procedure for CPB preparation. In this paper, a method was developed to determine the specific mixing energy (SME) that is dissipated during the preparation of CPB mixtures and to analyze its effect on CPB consistency. For this purpose, CPB recipes were prepared using two tailings and the mixing parameters (mixing time and speed and load mass) were successively varied. SME was determined for each mixture using a power meter equipped with an energy recording system mounted on a laboratory Omcan mixer. Slump was also determined for each mixture. A semi-empirical model was then developed to predict SME as a function of the mixing parameters. Results showed that predicted SME compared well with measured SME during CPB preparation. Results also showed that slump increased with increasing SME. The influence of SME on the rheological and mechanical properties of CPB and practical applications are presented in a companion paper.
1. Introduction
Modern cut-and-fill underground mines located throughout the world, and particularly in Canada, are increasingly using cemented past backfill (CPB) to fill excavations created by the extraction of mineral resources [1,2,3,4]. Backfill provides geomechanical stability by acting as support for the stopes and allows reducing BY up to 50% the amount of potentially environmentally hazardous tailings that would otherwise need to be stored on the surface in tailings ponds [5,6,7]. This geomechanical stability ensures safe working conditions and increases ore recovery by enabling mining of adjacent pillars [8,9].
CPB can be described as a complex composite material obtained by mixing filtered tailings, a relatively small binder content (2–8% with respect to the mass of dry tailings), and mixing water [10,11,12]. The binder allows the CPB to develop adequate mechanical properties in the short, medium, and long term [9,13,14]. Enough water is added to obtain the desired consistency. Because the CPB mixture must be transported through pipelines and boreholes from the surface paste plant to the underground backfill site, it must have the appropriate rheological properties for transport. The rheological properties of CPB are often assessed by parameters such as yield stress and dynamic viscosity [15,16,17,18,19,20,21]. These properties affect the fluidity of the mixture, or its flow capacity under the effect of applied pumping pressure or gravitational force without causing pipeline plugs during CPB transport. Pipeline plugs can have adverse impacts on mining operations, including productivity losses and higher backfilling costs. In practice, however, CPB consistency is determined using the Abrams cone slump test [22] in order to assess CPB transportability [9,11,20,23,24]. This test is fast and inexpensive. Depending on the mineralogy and physical characteristics of the tailings, a slump ranging from 6 to 10 inches (15.2–25.4 cm) generally meets the criteria for successful CPB transport [24,25]. Intrinsic parameters such as binder type and proportion, mixing water quality, and the mineralogy and grain-size distribution of the tailings can influence both the rheological and mechanical properties of CPB. In the field, certain extrinsic parameters such as the setting and consolidation conditions, curing time, and site geometry also affect CPB strength [16,26,27,28,29,30].
The shear history is another factor that affects the rheological and mechanical properties of CPB. CPB is prepared in the backfill plant at a given slump or solids content and using a given mixing energy. As the CPB is transported through the pipeline, it undergoes continuous shearing caused by friction between solid particles and the pipe wall [3,23,31]. This transport-induced shearing can modify the consistency and rheological properties of the CPB. Recently, changes in CPB properties during pipeline transport were investigated by comparing the surface and underground slump at two different underground mines [23]. Increasing slump was observed at the underground discharge point compared to that measured on the surface.
The impact of mixing conditions on the consistency and rheological and mechanical properties of cementitious materials (e.g., concrete, mortar, and cement paste) has been investigated by various researchers [32,33,34,35]. The main mixing parameters include the mixing time, the amounts of materials to be mixed for a given mixer type (hereinafter, the mixer load mass), the mixing speed, and the order of introduction into the mixer of the constituents [34,36,37]. All these mixing parameters can be expressed as a single parameter called the specific mixing energy (SME) [32]. The SME allows comparing the properties of cementitious materials prepared with various mixing procedures.
The specific energy that is dissipated during transport of CPB through pipelines and boreholes can be estimated from the head loss [20,38,39,40], which in turn may depend on the rheological properties, among others. The rheological properties themselves depend on the mixing energy and the transport energy, resulting in a complex loop. The final properties of the CPB upon deposition in the stope may depend on the total field specific energy, or the sum of the specific mixing energy at the CPB plant and the specific transport energy. Assuming that the total field specific energy and the specific mixing energy (SME) in the laboratory have similar effects on CPB properties (consistency, rheology, strength), it would be more efficient to prepare CPB mixtures in the laboratory during the recipe optimization phase using an SME equal to the specific field energy. However, this hypothesis is still challenging to test. An initial phase would be to develop a method to determine the SME in the laboratory that could be applied to a paste plant mixer.
The influence of the mixing procedure on the consistency and the rheological and mechanical properties of CPB has not yet been thoroughly investigated. For example, using a SP300AT mixer (Omcan Food Machinery, Mississauga, ON, Canada) in our laboratory, the mixing time can vary from 5 to 15 min, the mixing speed can range from low to high [20,37,41], and the mixer load mass can vary. However, it is unclear to what extent this variability in the mixing parameters affects the resulting rheological and mechanical properties of the CPB during laboratory optimization of CPB recipes. Hence, it is difficult to compare inter-laboratory properties of CPB prepared with different mixing procedures. It would therefore be relevant to examine the extent to which CPB properties depend on specific mixing procedures.
The aim of this paper was, first, to develop a method to determine the SME associated with laboratory preparation of CPB; second, to develop a method to predict this SME based on the aforementioned mixing parameters; and third, to investigate the impact of SME on CPB consistency. The impact of SME on the rheological and mechanical properties of CPB was also investigated, and results will be presented in a companion paper.
2. Materials and Methods
2.1. Materials Characterization
Two filtered tailings, T1 and T2, were sampled from two mining sites located in Abitibi (Québec, Canada). The initial solids content (Cw) for T1 and T2 was 82.4% and 78.7%, respectively. The binder, at 4.5% content (by dry mass of tailings), was a blend of 20% general use (GU)/Type I Portland cement and 80% ground granulated blast furnace slag of the total binder mass. Tap water was used as mixing water.
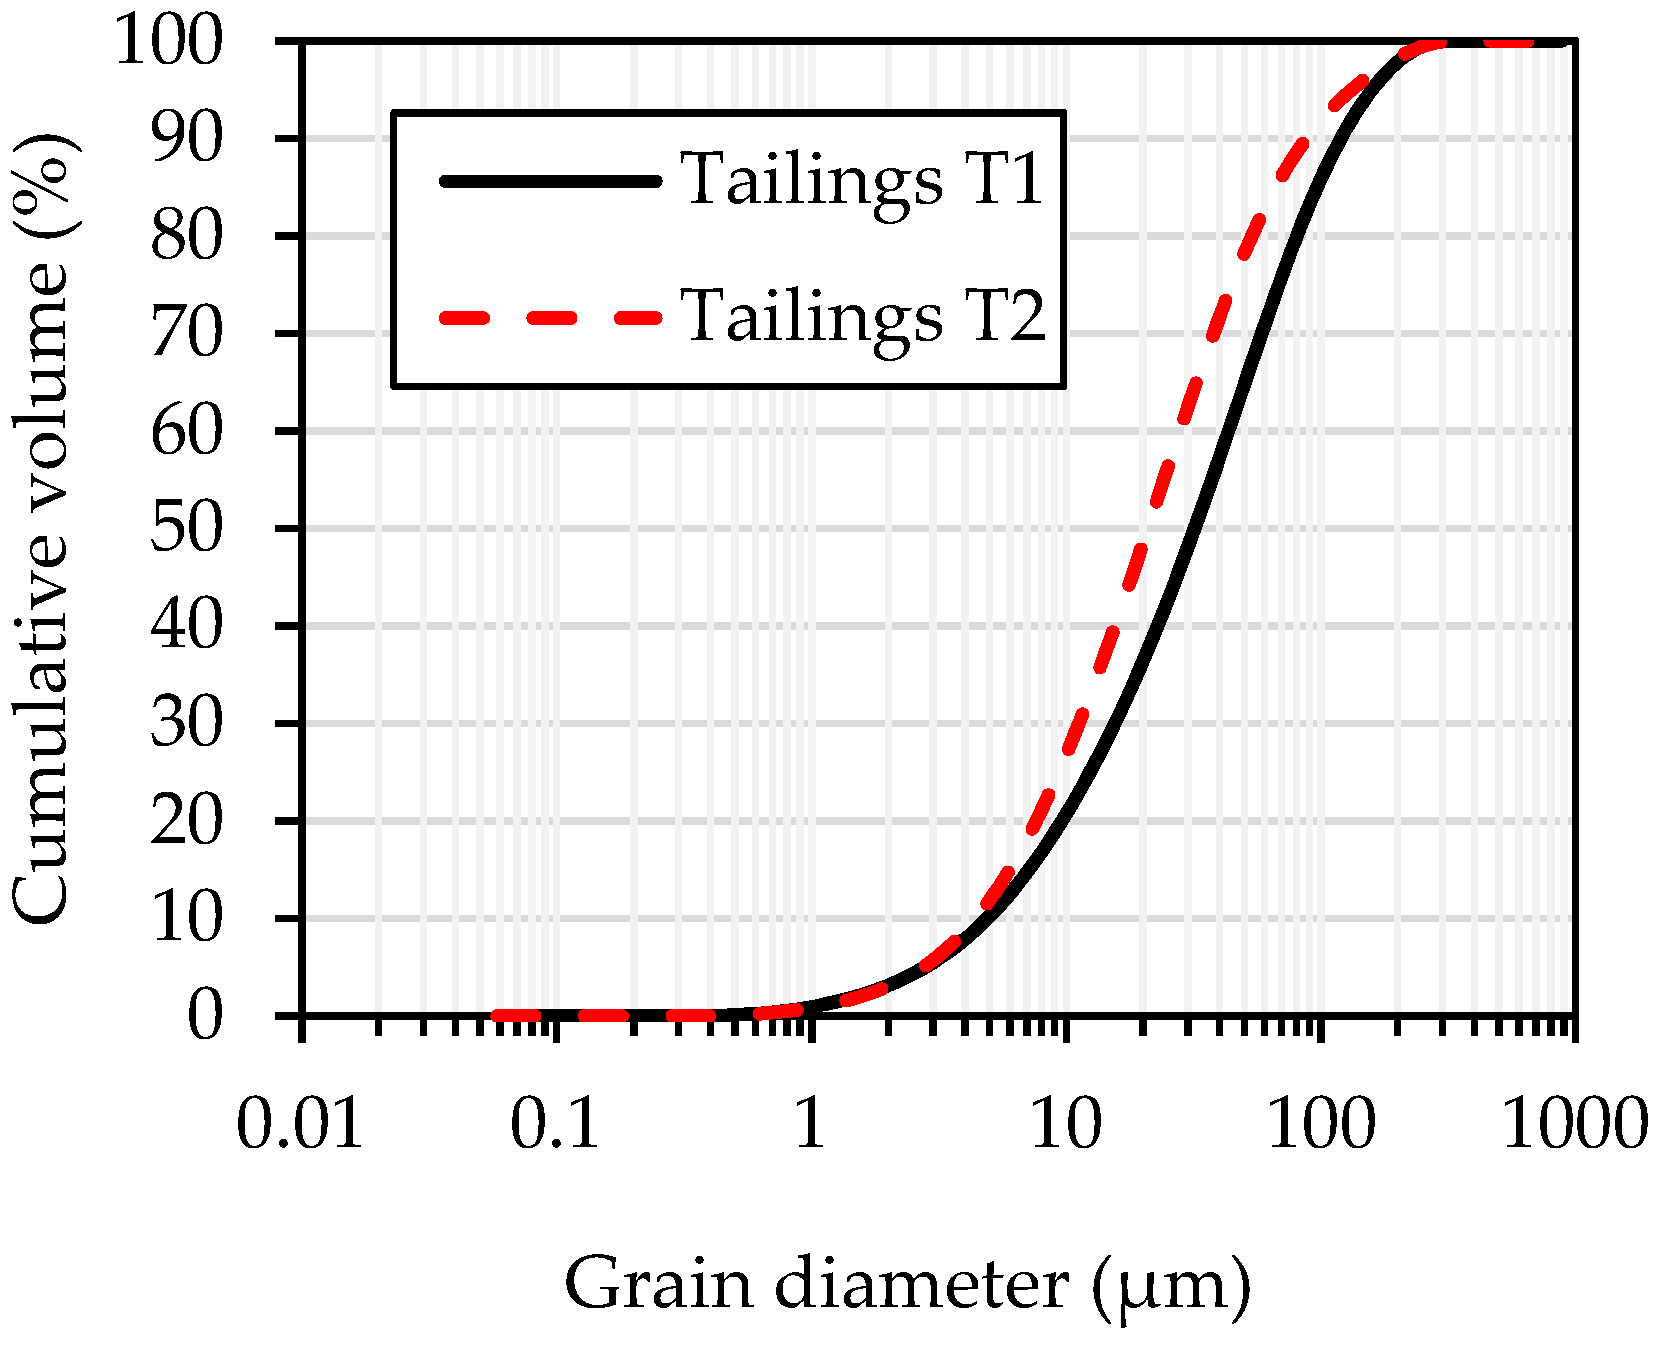
The physical characterization of tailings T1 and T2 included grain-size analysis and determination of the specific gravity of the solid grains (Gs) and the specific surface area (Ss). Grain-size analysis was performed using a Mastersizer 2000 laser particle size analyzer (Malvern Panalytical, Palaiseau, France). The grain-size distribution curves are shown in Figure 1. Table 1 presents the main characteristic parameters of the grain-size curves, including the diameter Dx corresponding to x% passing on the cumulative grain-size distribution curve; the coefficients of uniformity (CU) and curvature (CC); and the fraction of fine particles P80μm (<80 μm) and ultrafine particles P20μm (<20 μm). The P80μm is 80% and 88% and the P20μm is 36% and 48% for T1 and T2, respectively. These tailings are comparable to common Canadian mine tailings derived from hard rocks, in terms of tailings characteristics reported by Bussiere [42].
An AccuPyc 1330 helium pycnometer (Micromeritics, Norcross, GA, USA) was used to determine the specific gravity Gs for the tailings according to [43]. Gs values of 3.14 and 2.97 were obtained for T1 and T2, respectively (see Table 1). This relatively high Gs for T1 is mainly due to the high pyrite content (see Table 3). A GEMINI surface analyzer (Micromeritics) was used to determine the specific surface area SS. The two tailings showed very similar SS, at 2.6 m2/g and 2.7 m2/g for T1 and T2, respectively (see Table 1).
The chemical composition of the tailings solids was determined by complete digestion in HNO3/Br2/HF/HCl followed by inductively coupled plasma and atomic emission spectroscopy (ICP-AES) using a Perkin-Elmer atomic absorption spectrometer. Results are presented in Table 2. Results show high S, Fe, and Al content in both tailings T1 and T2. Other chemical elements such as K, Ca, Na, Mg, Ti, Zn, Mn, Ba, and Li are also present in both tailings.
The mineralogical composition of the tailings was determined by quantitative Rietveld analysis using an AXS D8 ADVANCE X-ray diffractometer (XRD, Bruker, Milton, ON, Canada) with TOPAS software [44]. Results are presented in Table 3. The main mineral phases in tailings T1 are quartz (59%), pyrite (18%), and albite (12%), along with smaller contents of chlorite (4%), gypsum (3%), and muscovite (4%). The main mineral in tailings T2 is quartz (49%), along with smaller contents of albite (12%), chlorite (9%), muscovite (10%), and pyrite (11%). Corundum (2%) is also present in T2.
Table 4 presents the oxide contents in the blended binder, as determined using a XL3t 900-HE XRF Analyzer (Niton UK Limited, Winchester, UK). The binder contains mainly CaO (55.57%) and SiO2 (26.07%). The hydraulicity index ([Al2O3 + SiO2]/[MgO + CaO]) is 0.54.
2.2. Mixing Procedure and Parameters
Mixing was performed in three steps. First, the tailings and binder were introduced into the Omcan SP300AT laboratory mixer. About one-third of the required amount of water was then added and the mixer was turned on at a speed of 91 rpm. Finally, the remaining amount of water was added gradually (to avoid splashing) during the first 90 s after mixer startup, and the mixing speed was then set to the desired value. The Omcan mixer used in this study has three available speeds: 91, 166, and 282 rpm. Its maximum load capacity is 28.4 L.
CPB mixtures were first prepared to determine the solids content corresponding to a slump of 7 inches (178 mm), which is within the 6- to 10-inch range required for adequate CPB transport. The mixing time was kept constant at 5 min at a mixing speed of 166 rpm. For CPB prepared with tailings T1, the load mass was varied from 13.1 to 15.1 kg for solids content ranging from 70% to 80%. For CPB prepared with tailings T2, the load mass was varied from 12.4 to 13.7 kg for solids content ranging from 67% to 75%. The solids content corresponding to a slump of 7 inches was 75% and 70% for CPB mixtures prepared with tailings T1 and T2, respectively. This difference can be explained by the different mineralogical composition of the two tailings. Tailings T1 contains more sulphide minerals (Gs = 3.14) than tailings T2 (Gs = 2.97).
In the following, CPB mixtures prepared with Tailings T1 and T2 are designated as CPB-T1 and CPB-T2, respectively. These solids contents served as reference values for the three series (I–III) of 26 mixtures (M1-M26) prepared to investigate the influence of mixing parameters (mixing time, mixing speed, and load mass) on the specific mixing energy (SME) of CPB (see Table 5). The authors are aware that the consideration of other mixing parameters could have modified these references solids contents. However, repeating this procedure to determine the solids content corresponding to a 7-inch slump for a large number of mixing conditions would have involved excessive time and resources.
The first series of mixtures (M01–M05 for T1 and M13–M17 for T2) was used to investigate the effect of mixing time on SME. Mixing time was varied from 5 to 30 min while keeping other parameters constant (load mass of 4.7 kg and 4.2 kg for T1 and T2, respectively, at 166 rpm mixing speed). These load masses were considered the minimum quantity of CPB required to fill nine molds for triplicate UCS tests at three different curing times. This explains the load mass differences between T1 and T2.
The second series of mixtures (M06–M08 for T1 and M18–M20 for T2) was used to investigate the effect of mixing speed on SME. Mixing speeds of 91, 166, and 282 rpm (corresponding to the low, medium, and high speed of the Omcan SP300AT mixer, respectively) were applied for a constant mixing time of 5 min and a mixer load mass of 4.7 kg and 4.2 kg for T1 and T2, respectively.
The third series of mixtures (M09–M12 for T1 and M21–M26 for T2) was used to investigate the variation in load mass. Mixing time was kept constant at 5 min and mixing speed at 166 rpm while load mass was varied at 4.7, 6.3, 9.5, and 12.6 kg for tailings T1 and at 3.0, 4.7, 6.3, 8.9, 11.9, and 15.6 kg for tailings T2.
The 26 mixtures were subjected to slump testing using a mini-cone [20,45,46] right after their preparation. The mini-cone (101.6 mm bottom diameter, 50.8 mm top diameter, and 152.4 mm height) is exactly half the size of a standard Abrams cone. The mini-cone was selected due to the lower amount of tailings available for laboratory tests. A conversion factor of approximately 2.29 (standard slump = 2.29 × mini-cone slump) was used based on our preliminary test results on different CPB mixtures incorporating tailings T1 and T2 [38]. Conversion factors of about 2.00, 2.20 and 2.28 were obtained for a soil–bentonite cutoff wall backfill [45], for CPB incorporating HE binder [47], and for superplasticized CPB mixtures [20], respectively.
2.3. Determination of Specific Mixing Energy (SME)
The energy needed to mix a CPB batch can be determined by the product of the power consumed during a mixing cycle and the duration of the cycle [48]. For this purpose, an Acuvim IIR-D-333-P2 power meter (Accuenergy Canada Inc., Toronto, ON, Canada) was mounted on the laboratory mixer to measure and record the power and energy consumption during mixing. This system includes an inductive current sensor, a current-voltage transducer, and a data logger to measure and display the power consumption and energy usage, as described below. A simplified diagram of the measurement system is shown in Figure 2.
In Figure 2, an amperometric clamp is used to measure the intensity of the current flowing through the mixer motor. Knowing the supply voltage, the power meter determines the power consumption. The data processing software records values instantly and calculates and displays in real time the energy usage during the mixer running time. Recorded data can be downloaded via an Ethernet communication module. This energy station can operate under conditions of temperature ranging from −25 to 75 °C and relative humidity from 5% to 95%.
It should be mentioned that the Acuvim IIR wattmeter was able to directly measure the energy consumption during mixing with a sensitivity and accuracy of 100 Wh. However, a relatively long mixing time exceeding 15 min was required for the empty running Omcan SP300AT mixer to display and record the minimum value of 100 Wh for the three available mixing speeds, as described further in Section 3.1. This mixing time exceeds that commonly used in the laboratory (5–10 min) at 166 rpm. In other words, the sensitivity of the Acuvim IIR wattmeter did not allow direct measurement of the mixing energy for a mixing time less than 15 min. Consequently, the determination of the dissipated mixing energy was based on the power consumption, as explained below.
The power consumption for the mixer can be determined by the following equation:
where P (W) is the active power consumption by the mixer, U (V) is the voltage, I (A) is the current, and φ (°C) is the phase shift between the current and the voltage. The cosφ value (measured by the wattmeter) is the power factor that accounts for the efficiency of the mixer motor.
The dissipated energy E (Wh) during mixing can be determined by the following expression:
where t (h) is the run time, tf (h) is the mixing time, Δti (h) is the data recording time interval, n is the number of recordings (n = tf/Δti), and Pi (W) is the power recorded at the end of each interval Δti. The values of I, U, and E were measured with a relative error of 0.2% (Acuvim II series power meter User’s Manual). A relatively short time interval Δti of 10 s (=1/360 h) was chosen for the data recording so that the variation in power consumption and dissipated energy during mixing could be observed.
Note that the empty running mixer consumes an energy E0. When the mixer is running after a load mass m (kg) of materials has been introduced, the total dissipated energy E includes E0. The effective dissipated energy during mixing is therefore calculated as E–E0. For a load mass m > 0, the specific mixing energy (SME) is then defined as follows:
The parameters E (Wh), P (W), and Pi (W) refer to the mixer running while loaded and E0, P0, and P0i refer to running while empty.
3. Results
This section presents typical curves representing the variation in power and energy consumption by the mixer when running empty and loaded and the results of the influence of mixing time, mixing speed, and load mass on dissipated SME during CPB mixture preparation, as presented in Table 5.
3.1. Typical Energy E0 for an Empty Running Mixer
Figure 3 shows the variation in the power consumption P0 and energy usage E0 as a function of time when the Omcan SP300AT mixer is running empty at the three available speeds (91, 166, and 282 rpm). For all speeds, the mixer was first run at 91 rpm for 90 s before switching to higher speeds. At 91 rpm, the instantaneous power consumption was about 309 W. When the speed was increased to 166 and 282 rpm, the power consumption rose instantaneously to 336 W and 377 W, respectively. For a given constant rotational speed, relatively small fluctuations with a weak decreasing trend were observed over the mixer running time. The power consumption P0 decreased from 309 W to 307 W at 91 rpm after a running time tf of 19.5 min, from 336 W to 327 W at 166 rpm after tf = 18.5 min and from 377 W to 326 W at 282 rpm after tf = 16.7 min. The running time required to record the first energy value of 100 Wh (corresponding to the wattmeter sensitivity) was displayed. A dissipated energy of 100 Wh required a running time of 1170 s (19.5 min), 1080 s (18 min), and 930 s (15.5 min) when the mixer was running at a speed of 91 rpm, 166 rpm, and 282 rpm, respectively.
The method for calculating E0 using Equation (2) was validated by comparing calculated and measured E0 (at the first recording of 100 Wh on the wattmeter). Results are presented in Figure 4. The relative error in the E0 calculation is less than 1% (i.e., 0.06%), which is assumed acceptable.
3.2. Typical Mixing Energy E for a Loaded Running Mixer
When the mixer is running loaded during CPB preparation, the measured curve P(t) is used to calculate the total mixing energy E and hence the SME. Figure 5 shows the variation in P(t) and E(t) as a function of mixing time for a mixing speed of 166 rpm, mixing time of 15 min, and load mass of 4.7 and 4.2 kg for tailings T1 (mixture M04) and T2 (mixture M20), respectively.
Figure 5 shows a relatively high mixing power consumption P (up to 385 W) at startup, when the mixer containing the tailings, binder, and one-third of the required amount of water is switched on. The high power consumption at this stage is due to the fact that the ingredients are still completely heterogeneous and the amount of water in the mixer is relatively small. A sharp decline in P (to about 340 W) with mixing time is then observed as the remaining water is added during the first 90 s of mixing, thereby decreasing the mixing resistance of the mixture. At this point, the mixing speed was set at 166 rpm, which increased the power consumption. The power consumption curve then tends to decrease slightly over the mixing time, with more or less fluctuations as the CPB evolves towards a homogeneous mixture. Although both tailing types show almost similar trends in the power consumption curves, tailings T2 required higher mixing power compared to tailings T1. This could be due to the different physicochemical and mineralogical composition of the two tailings. Thus, tailings T2 is finer (see Figure 1), has higher SS (see Table 1), and contains more phyllosilicate minerals such as chlorite as well as muscovite and sulfate minerals such as gypsum (see Table 3).
The P(t) curves presented in Figure 5 were then used to determine the mixing energy E(t) that was dissipated over the mixing time using Equation (2). The variation in mixing energy as a function of mixing time for both tailings is also presented in Figure 5, showing increased mixing energy with increased mixing time.
3.3. Influence of Mixing Parameters on the SME for CPB and Its Consistency
As mentioned above, the SME was recorded during the preparation of CPB’s recipes to establish a link with its various influence parameters. A slump test was performed at the end of the preparation of each CPB recipe to investigate the impact of varying mixing parameters on the CPB consistency. The variation in SME with mixing time for CPB prepared with tailings T1 (mixtures M01–M05) and T2 (mixtures M13–M17) using the Omcan SP300AT mixer rotating at 166 rpm is presented in Figure 6a. The load mass was 4.7 and 4.2 kg for T1 and T2, respectively (see Table 5). The SME increases almost linearly with mixing time. Thus, when mixing time increases from 5 to 30 min, SME increases almost linearly from 0.6 to 3.8 Wh/kg for tailings T1 (with a determination coefficient R2 = 0.99) and from 1.1 to 6.0 Wh/kg for Tailings T2 (with R2 = 0.99). Moreover, for a given mixing time, the dissipated SME is greater for CPB prepared with tailings T2 than with T1.
Figure 6b shows the variation of slump height of CPB-T1 and CPB-T2 with the mixing time. It can be seen in this figure that the slump height tends to increase (from 18.2 to 19.6 cm and from 18.0 to 19.0 cm for CPB-T1 and CPB-T2, respectively) in a more or less remarkable manner when the mixing time gradually increases from 5 to 10 min. A similar result on concrete, showing an increase in slump of 1.4 cm when the mixing time gradually increased from 4 to 10 min has been reported by [49]. This behavior can be attributed to the deflocculation of agglomerates of solid particles, followed by the release of water and air initially trapped in the fine particles contained in the mixtures. Indeed, under the action of mixing, the pale of the mixer induces a shear force in the CPB mass in the plane imposed by the rotation direction of the mixer [50]. According to the flow particle interaction theory, this shear stress reduces the level of the energy barrier to be reached by the solid particles of the CPB to get out of their potential well [51,52]. In other words, the relative movements of solid particles on each other in the CPB matrix increases. The longer the mixing time, the more numerous the shear planes in the CPB mass, and therefore the lower the level of the energy barrier. As result, the agglomerates in the mixture are destroyed, or at least reduced, and the water and air initially retained in the pores of the solid grains by capillary action are released on the surface of the grains. The water thus released participates in the fluidization of the CPB and the air in its densification.
Extending the mixing time from 10 to 30 min slightly increases the value of the slump (from 19.6 to 20.3 cm and from 19.0 to 19.9 cm for CPB-T1 and CPB-T2, respectively), with a reduced rate of increase compared to mixing time up to 10 min. This trend could be associated with a combined effect of different phenomena including the evaporation of water, evolution of the hydration process of the binder and even the emergence of colloidal interactions (extra fine particles smaller than about 1 µm). Depending on the extent of these phenomena, the fluidization process of the CPB during mixing can be altered.
A few studies showing a decrease in the slump height over the mixing time of cementitious materials have even been reported, in particular in the case of concrete mixtures [53,54]. Depending on the proportion of the binder in the mixture, this behavior can be explained by the precipitation of portlandite and other hydrates formed after the initiation of the hydration process [16]. Indeed, the entanglement of the C-S-H links, not broken by kneading, can cause a loss of fluidity of the mixture [55,56]. In the context of this study, the low proportion of cement used (20% GU contained in 4.5% of the binder, or 0.9% cement in the mixtures) would explain the above results obtained where the slump increases with the mixing time.
The influence of CPB mixing speed on SME is shown in Figure 7a for mixtures M06 to M08 prepared with tailings T1 and mixtures M18 to M20 prepared with tailings T2 for a mixing time of 5 min (see Table 5). For CPB prepared with tailings T1, SME is 0.4, 0.6, and 0.8 Wh/kg for a mixing speed of 91, 166, and 282 rpm, respectively. For tailings T2, SME is 0.6, 1.1, and 1.3 kWh/kg for 91, 166, and 282 rpm, respectively. Note that SME increases with increased mixing speed according to a power model (R2 = 0.99 and 0.92 for T1 and T12, respectively).
The variation of the slump of CPB-T1 and CPB-T2 mixtures as a function of the mixing speed is presented in Figure 7b. This figure shows a tendency for a slight increase in the slump (from 17.5 to 18.9 cm and from 17.5 to 18.5 cm for CPB-T1 and CPB-T2, respectively) when the mixing speed gradually increases from 91 to 282 rpm. These results are supported by those obtained by [57]. According to these authors, a mixing speed threshold between 200 and 300 rpm must be reached to significantly improve the consistency of the CPB. The observation of Figure 7b shows that the greatest value of the slump (18.9 and 18.5 cm in the cases of CPB- T1 and CPB-T2, respectively), reflecting a better fluidity of the CPB, was reached when the mixing speed was set at 282 rpm. This behavior would be linked to the breakdown of the flocculation structure within the mixture and to the dispersion of solid particles in the CPB matrix. The distance between solid particles affects the microstructure of the CPB [58,59]. The microstructure plays a major role in the consistency of the CPB. Indeed, the attractive forces between the particles, in particular those of van der Waals, intervene essentially to ensure the cohesion at the interface of the molecules of the solids and the liquid within a granular suspension [60,61]. A more intense mixing speed induces shearing effort capable of overcoming the attractive forces between the particles and of dispersing them within the mixture. The results on the variation in SME as a function of mixing time (Figure 6) and mixing speed (Figure 7) confirm those obtained for cement paste [32], who showed that the specific dissipated energy during cement paste mixing increased linearly with mixing time and following a power law relationship with respect to mixing speed.
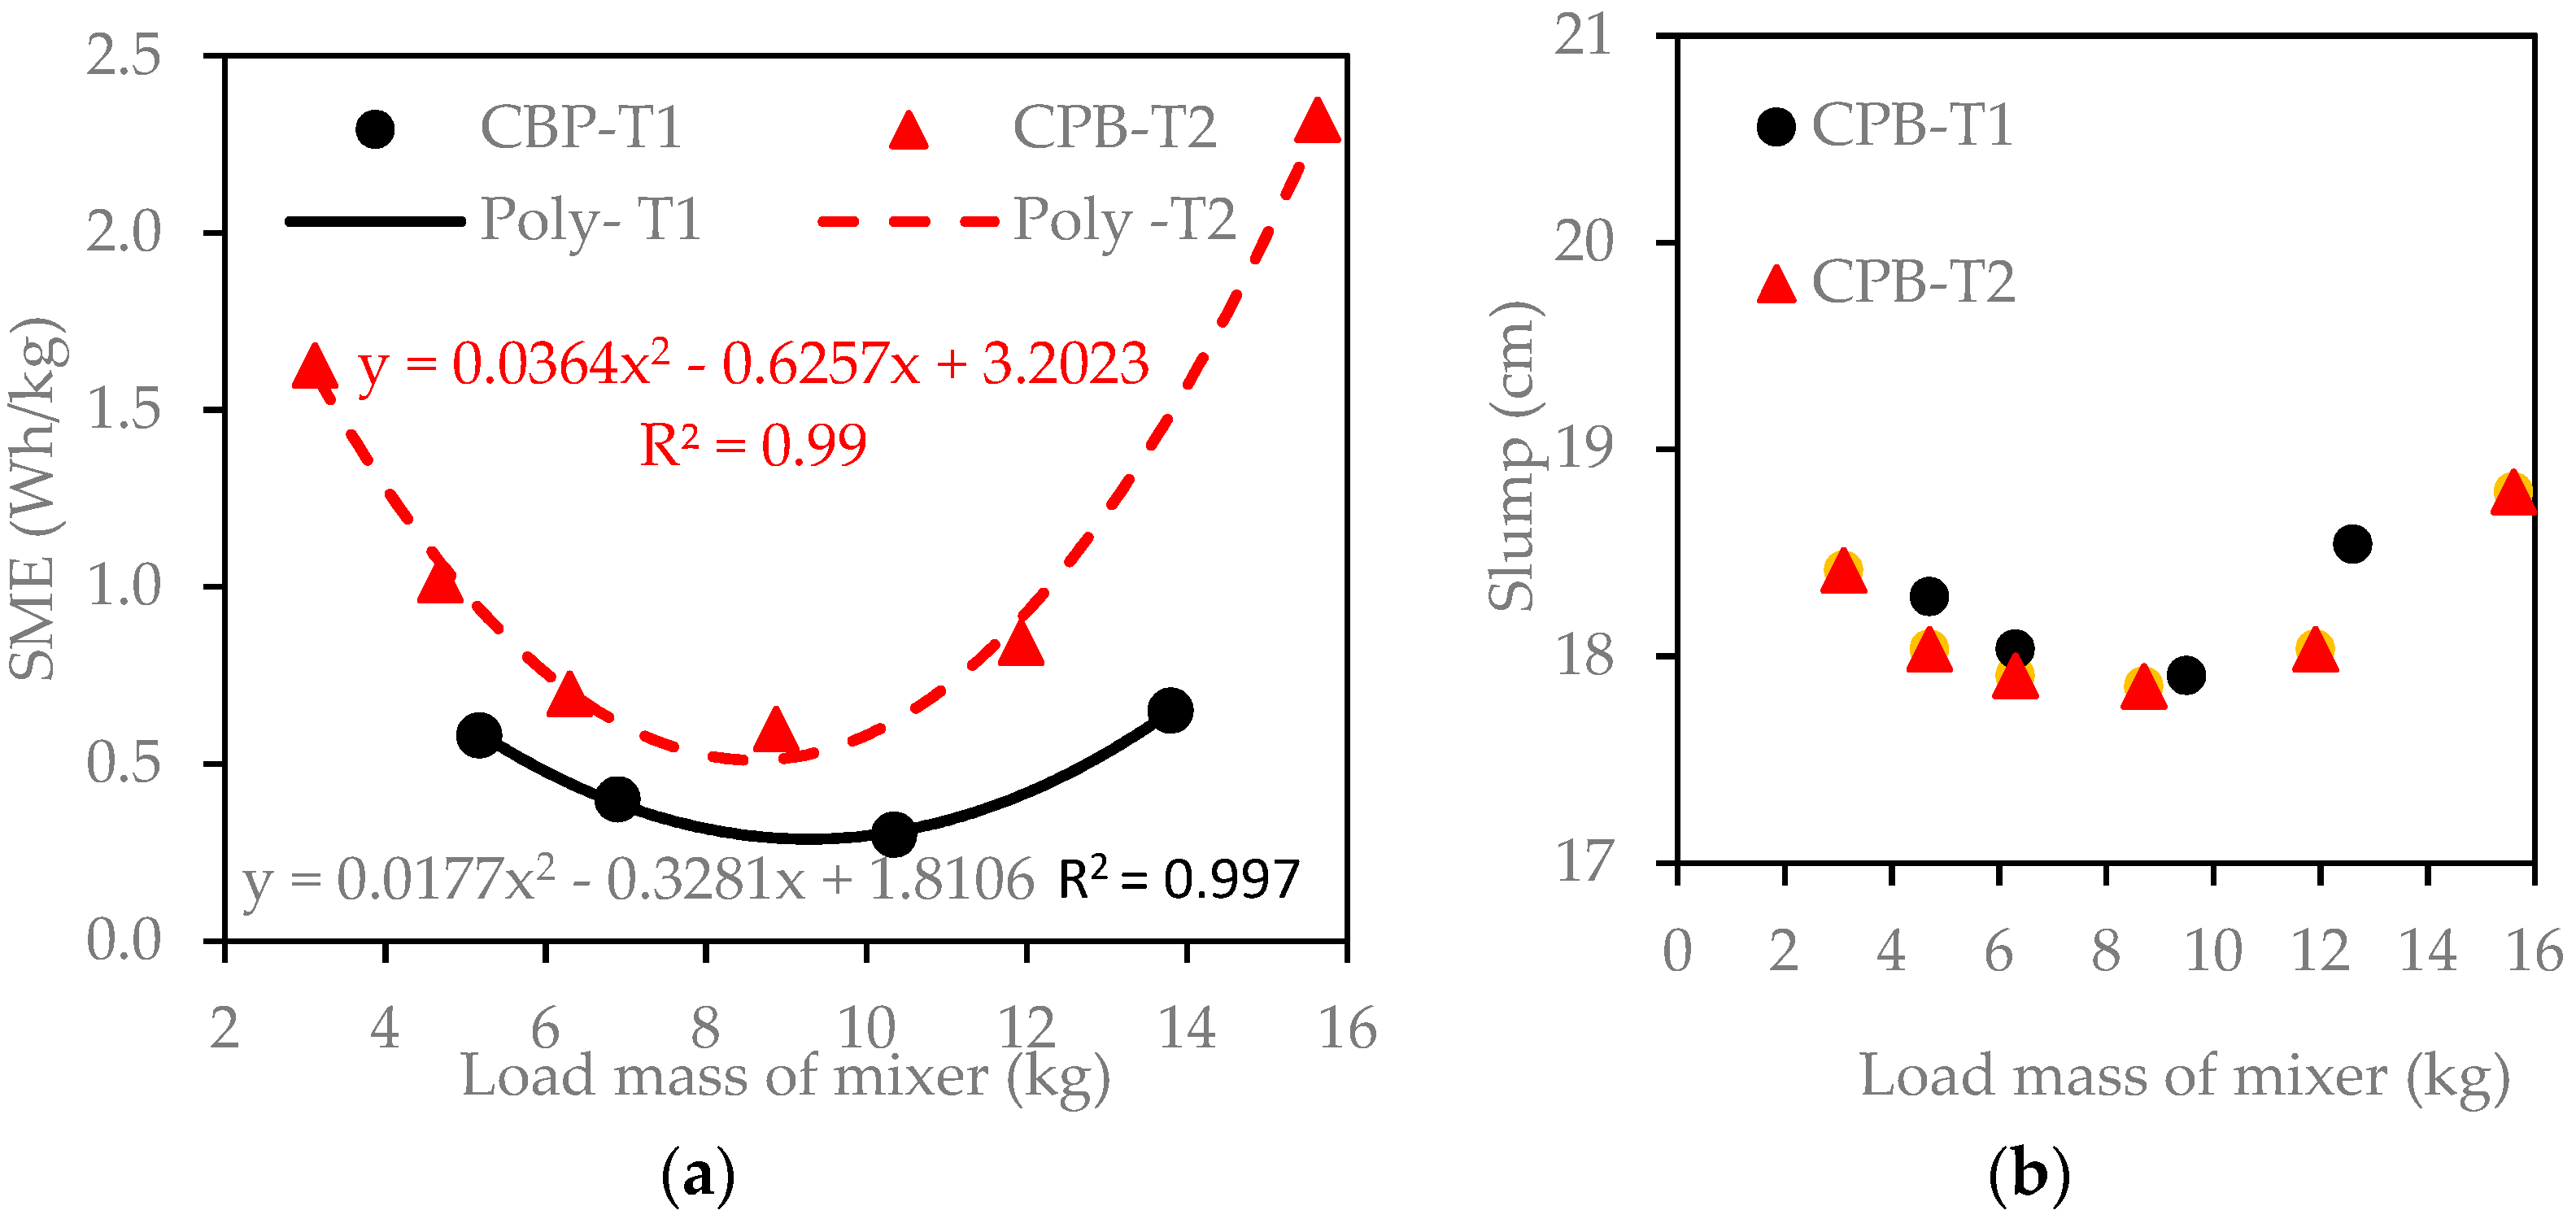
The variation in SME as a function of load mass in the Omcan mixer is presented in Figure 8a for CPB mixtures M09 to M12 prepared with tailings T1 and mixtures M21 to M26 prepared with tailings T2 (see Table 5). Mixing speed and time were set at 166 rpm and 5 min, respectively (see Table 5).
SME decreases with increasing load mass to reach a minimum of about 0.3 Wh/kg and 0.5 Wh/kg for tailings T1 and T2, respectively, at a load mass of around 9.5 kg. Thereafter, SME tends to increase with increasing mixer load mass to values above about 9.5 kg. The U-shaped curves presented in Figure 8 shows an upward opening quadratic relationship (parabola shaped) with R2 of 0.99 for the mixtures prepared with both tailings. Figure 8b shows the variation of the CPB slump for CPB-T1 and CPB-T2 with the load mass of the mixer. It can be seen that when the load mass gradually increases from 3 to 9.5 kg, the slump remains almost constant, but tends to decrease slightly (from 18.3 to 17.9 cm when the load mass varies from 4.7 to 9.5 kg for CPB-T1 and from 18.4 to 17.9 cm when the load mass varies from 3.0 to 8.9 kg for CPB-T2). On the other hand, when the load mass is more than about 9.5 kg, the slump tends to increase progressively (18.6 cm for a load mass of 12.6 kg and 18.8 cm for a load mass of 15.6 kg for CPB-T1 and CPB-T2, respectively). This slight increase in slump could be attributed to the intensification of the shearing force requires to keep a constant mixing speed due to the increase in the self-weight of the mixed materials. As the volume available in the mixer bowl remains constant, increasing the load mass results in increased shear forces due to the more intense frictions between the grains themselves and between the solid grains and the wall of the mixer. This accelerates the homogenization process of the mixture and tends to improve the fluidity of the CPB. However, additional studies are still necessary to better elucidate the effect of the variation in the load mass on the fluidity of CPB.
3.4. Prediction of the SME for CPB
Figure 5, Figure 6, Figure 7 and Figure 8 show that the SME for CPB prepared with tailings T1 and T2 in the Omcan mixer varies with mixing time t (min), mixing speed Ω (rpm), and mixer load mass m (kg). The following regression functions can be used to relate the SME to one of the three parameters while keeping the other two constants (with well-defined values).
- • For CPB prepared with tailings T1:
- • For CPB prared with tailings T2:
These equations provide the starting point for the development of a useful prediction model for the SME based on the three parameters, expressed as SME = f(t, Ω, m). Thus, considering Equations (4)–(6) for T1 and Equations (7)–(9) for T2, the SME can be expressed using the separation of variables method [62,63,64], as follows:
and:
where a1, b1, c1, and d1 and a2, b2, c2, and d2 are model constants for T1 and T2, respectively.
LAB fit curve fitting application [65] was selected to determine model constants of Equations (10) and (11) using data presented in Figure 6, Figure 7 and Figure 8. The non-linear Levenberg-Marquardt curve-fitting method was selected for 300 iterations and a tolerance of 1 × 10⁻⁴. Finally, the SME of CPB prepared with tailings T1 and T2 using the Omcan SP300AT mixer can be predicted by the expressions (12) and (13) for tailings T1 and T2, respectively:
and:
with SME in Wh/kg, t in min, Ω in rpm and m in kg.
To validate these two equations, all measured SME in this study were compared with predicted SME using the two above-presented models. The comparison shown in Figure 9 indicates a fairly good agreement. The mean squared error between measured and predicted SME is 0.005 and 0.026 for tailings T1 and T2, respectively. Strong linear relationships are obtained (determination coefficients R2 of 0.995 and 0.993 for tailings T1 and T2, respectively). Note that the proposed equations are valid only for preparation in the Omcan SP300AT mixer with SME ≤ 3.8 Wh/kg in the case of Equation (12) (for T1) and with SME ≤ 6.2 Wh/kg in the case of Equation (13) (for T2).
As mentioned in the Introduction section, CPB mixtures can be prepared in the laboratory during the recipe optimization phase using an SME corresponding to the field specific energy. Therefore, considering a preset mixing speed and load mass, the proposed empirical equations can be used to determine the laboratory mixing parameters, and particularly the mixing time required to reach the targeted field energy.
3.5. Effect of SME on CPB Consistency
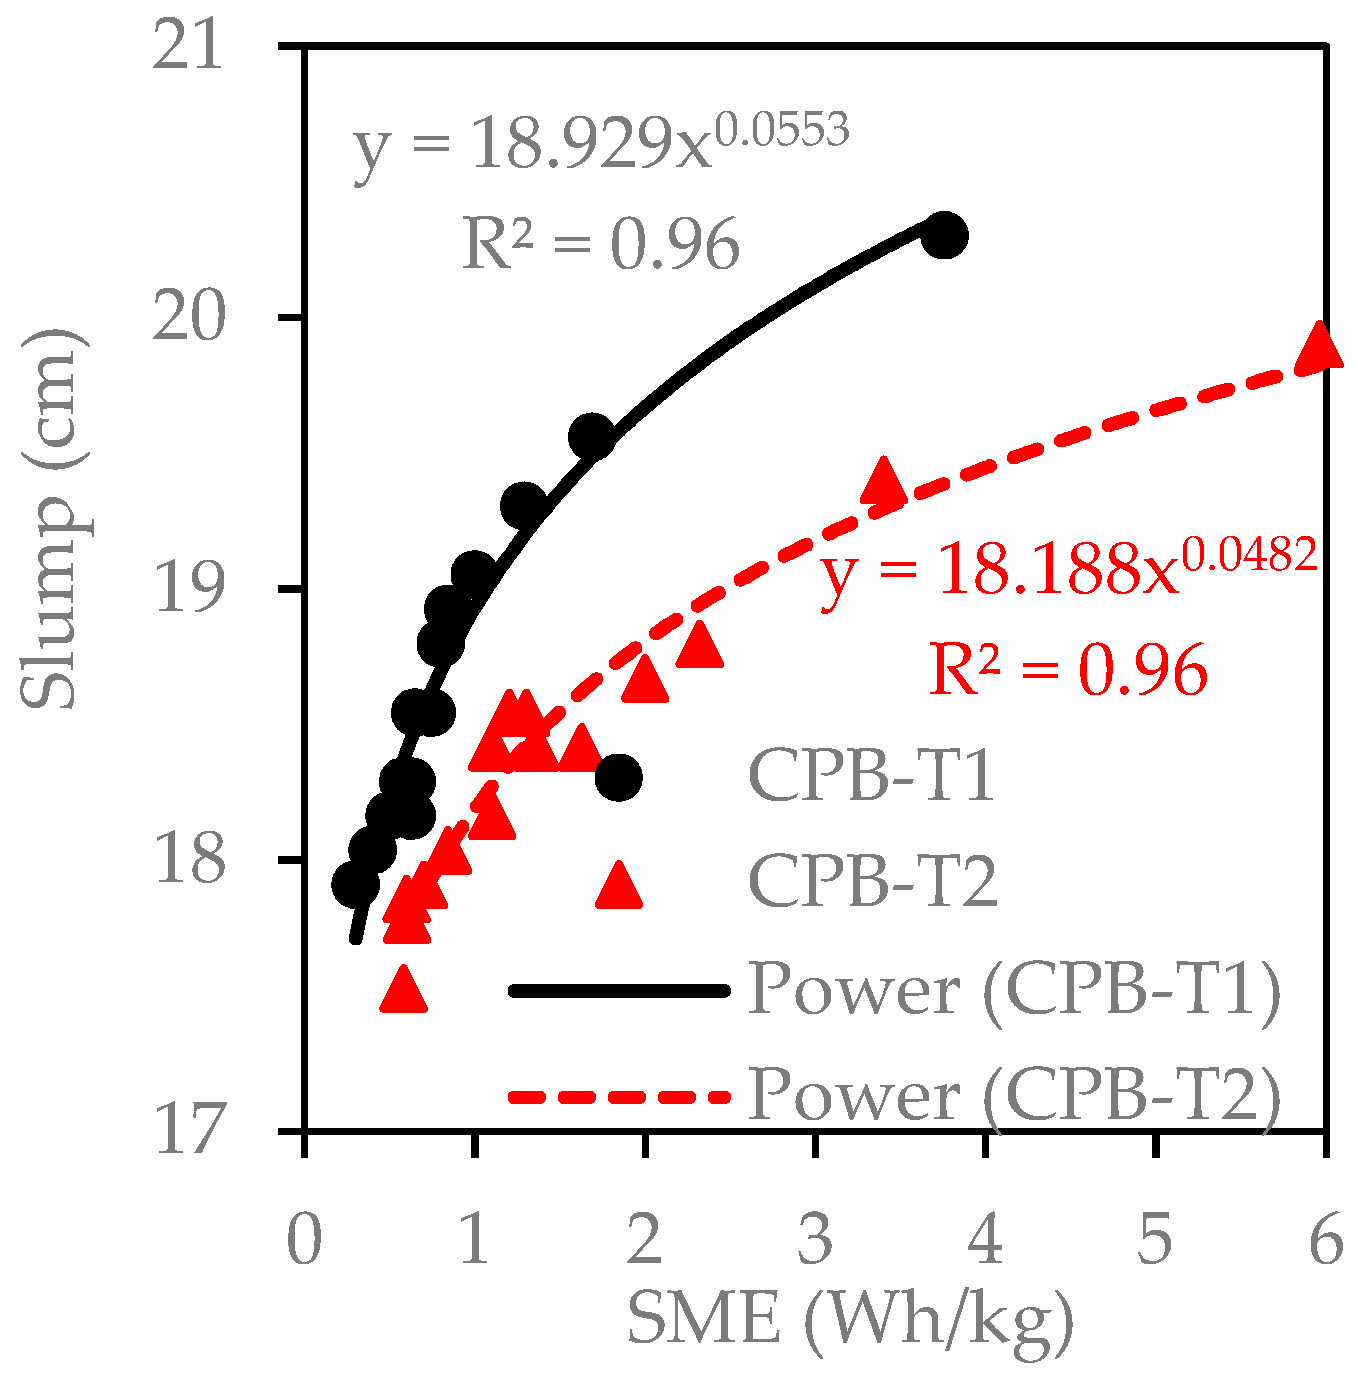
To understand the effect of SME on CPB consistency, Abrams cone slump tests were performed on all CPB recipes presented in Table 5. Figure 6, Figure 7 and Figure 8 presented above, linking the mixing parameters to both the slump and the SME, made it possible to study the influence of the SME on the consistency of the CPB. Figure 10 shows the variation in slump as a function of SME for CPB-T1 and CPB-T2.
In general, slump increases with increasing SME dissipation during mixing. Slump tends to increase significantly for SME below about 2 Wh/kg. Thereafter, the slump increase rate tends to slow slightly with increasing SME. This indicates improved mixture consistency with increasing SME, concurring with results obtained by [33] on cement paste. The increased slump could be explained by progressive dissolution and deflocculation of aggregated non-hydrated binder particles still present in the backfill mass at mixing startup. More energetic mixing would transfer stronger shearing force to the CPB, thereby promoting the break-up of agglomerations of the solid particles in the backfill mixture to render it homogeneous.
However, it should be noted the shearing of the CPB under the mixing action does not always improve its fluidity by increasing the slump. Studies showing loss of fluidity properties associated with more intense shear forces, exceeding a certain threshold value, have been reported in CPB [57,66]. It is often accepted to explain this phenomenon by the rupture of the electrical double layer located at the interface of solid-liquid particles, under the impulse of increasing mixing energy [67,68]. This rupture (total or partial) of the electric double layer leads to the reduction of the repulsive electrostatic forces, making predominant the Van der Waals attractive forces present in the colloidal fraction of the CPB. As result, a progressive formation of agglomerates in the microstructure occurs, which alters the flow properties of the CPB. The results presented in Figure 10 show a less significant increase rate in slump with a trend to reach more or less stable values when the SME is greater than 2 Wh/kg. This trend could be linked to the instability of the electrical double layer. Complementary tests implementing a larger range of SME values than that considered in this study could make it possible to determine a threshold SME associated with the initiation of the loss of consistency in mixed CPB.
The variation in CPB slump as a function of SME depends on the type of tailings used, as shown in Figure 10. Nevertheless, relatively similar trends are observed. However, for a given SME, the slump for tailings T1-based CPB prepared at 75% solids content is higher than the slump for tailings T2-based CPB prepared at 70% solids content. The slump increases by about 2.4 cm (from 17.9 to 20.3 cm) as SME increases from 0.3 to 3.8 Wh/kg for T1-based CPB. In the case of T2-based CPB, the slump increases by approximately 2.4 cm (from 17.5 to 19.9 cm) as SME varies from 0.6 to 6 Wh/kg. These results could be compared to those obtained on the cement pastes. Regardless of the composition of the mixture, it is often assumed that a higher mixing energy is associated with increased fluidity for cement pastes due to a weakening of the internal structure [36,69].
4. Discussion
In the recipe optimization phase, CPB may be prepared in the laboratory using an SME corresponding to the predicted field specific energy. The field SME includes the mixing energy in the paste plant, which can be determined by the procedures described in this study. The pioneering results presented in this study call for further laboratory and field investigations of several other factors that affect the SME, including but not limited temperature, CPB ingredients, and mixer type. These factors are discussed briefly below.
4.1. Effect of CPB Temperature Variation
The internal shearing friction between solid particles in the CPB and the pipe wall induces increased CPB temperature along the pipeline distribution system compared to the CPB temperature after mixing in the paste plant [23,46]. The Non-isothermal pipe flow module in COMSOL Multiphysics® 5.2 was used to predict the CPB temperature change along a distribution system in Nordic conditions [47]. The modeled CPB distribution system had the following characteristics: pipeline diameter of 146.3 mm (~6 inches), flow velocity of 1.04 m/s, air temperature of −50 °C, surface pipeline Section 294 m in length, underground pipeline Section 1036 m in length, permafrost temperature of −6 °C and initial CPB temperature (in the backfill plant) of 10 °C. Internal and external heat exchanges and the thermo-rheological behavior of the CPB were considered for the numerical simulations. They predicted a temperature rise from 10 °C at the surface backfill plant to 14 °C at deposition, i.e., an increase ΔT of +4 °C. CPB temperatures at the surface (in the plant) and underground were compared at two mines A and B [23]. For Mine A, the temperature increase ΔT was about +11.7 and +12.8 for a travelled distance of 3644 m and 3342 m, respectively. For Mine B, the temperature increase ΔT was about +5.0 and +2.8 for a travelled distance of 1145 m and 1679 m, respectively. The observed differences even within a given mine can be explained by the different initial rheological properties and consistency of the CPB samples. However, because the rheological properties of CPB are thermo-dependent [27,46,47,70,71], the deposition temperature of CPB in underground stopes may affect its mechanical strength.
In the laboratory recipe optimization phase, the duplication of the SME to the field specific energy may also consider the effect of the final CPB deposition temperature. This reconciliation of field and lab temperatures constitutes an additional challenge. The temperature of the mixtures investigated here (see Table 5) was measured at the end of mixing. When the mixing time for the first series of CPB mixtures was increased from 5 to 30 min (see Table 5), the temperature varied from about 24.5 °C to about 25.5 °C for both tailings T1 and T2. When the mixing speed was increased from 91 to 280 rpm, the temperature for the second series of CPB mixtures (see Table 5) varied from 24.8 to 25.4 °C for T1 and T2. When the load mass was increased, the temperature for the third series of CPB mixtures (see Table 5) varied from 25 to 26 °C for T1 and T2. Assuming that the CPB ingredients were at room temperature (20–23 °C), the maximum temperature variation for all the mixtures is in the order of 3 to 6 °C.
4.2. Effect of CPB Ingredients, and Mixer Type
The results presented above also apply to the CPB prepared with tailings T1 and T2 at a fixed solids content for the single binder type used (a bend of 80% slag and 20% GU) at a single binder content of 4.5% and for a specific Omcan mixer. Results showed that the two tailings have different mixing capacity due to different mineralogical composition and physicochemical characteristics. This explains the differences observed in the above-presented Equations (12) and (13) for predicting SME. Based on the different parameters involved in these equations, and according to the physical characteristics of the tailings, a single equation could be developed for application to different types of tailings and for a given mixer and for different mixers. Future studies could examine variations in the influential factors related to CPB ingredients (binder type and content, solids content, mixing water). The ambitious challenge that lies ahead is to develop a method for calculating SME that would incorporate the maximum number of variables, for both laboratory and field application. Equations (12) and (13) for predicting SME apply exclusively to the Omcan mixer used in this study. Mixing intensity is affected by many factors, including the mixing time, mixing speed, the type of mixer (planetary rotation, nominal load volume and engine power). Therefore, equations for predicting SME must be developed specifically for each mixer used for laboratory optimization of CPB recipes because mixers may differ in terms of mixing performance.
5. Conclusions
The specific mixing energy (SME) was determined for CPB mixtures prepared using two tailings T1 and T2 sampled from two mining sites located in Abitibi (Québec, Canada). The binder (at 4.5% content) consisted of 20% general use (GU)/Type I Portland cement (CP I) blended with 80% ground granulated blast furnace slag. The main mixer was a Omcan SP300AT. The influence of three mixing parameters (mixing time and speed and mixer load mass) on SME was investigated. SME increased almost linearly with mixing time, and according to a power model that shows an upward opening (parabola shaped) relationship with increasing load mass. The SME results allowed proposing a semi-empirical relationship that can be used to predict SME based on the three above-mentioned mixing parameters, as defined with acceptable precision (mean squared error between measured and predicted SME is 0.005 and 0.026 for CPB made T1 and T2, respectively). These empirical models are valid for SME ≤ 3.8 Wh/kg and SME ≤ 6 Wh/kg for tailings T1 and T2, respectively, and for a given mixer. Results also showed that CPB consistency, assessed in terms of slump determined with Abrams cone, increased with increasing SME, for a positive effect. Thus, the slump increased by about 2.7 cm when SME was increased from 0.3 to 3.8 Wh/kg for CPB prepared with tailings T1. In the case of CPB prepared with tailings T2, the slump increased by approximately 2.5 cm when SME was increased from 0.6 to 6 Wh/kg. Further investigations are required to complement these findings on the effect of SME on CPB properties. Results on the effect of SME on the rheological and mechanical properties of the CPB mixtures investigated in this study are presented in a companion paper [72].
Author Contributions
Conceptualization, M.M., T.B. and R.K.D.; methodology, R.K.D. and M.M.; validation, R.K.D. and M.M.; formal analysis, R.K.D.; investigation, R.K.D.; resources, M.M.; data curation, R.K.D. and M.M; writing—original draft preparation, R.K.D.; writing—review and editing, M.M. and T.B.; visualization, R.K.D. and M.M.; supervision, M.M. and T.B.; project administration, M.M.; funding acquisition, M.M. All authors have read and agreed to the published version of the manuscript.
Funding
This research was funded by the NSERC (Discovery Grants Program–RGPIN-2015-05172 to Mbonimpa) at https://www.nserc-crsng.gc.ca/professors-professeurs/grants-subs/dgigp-psigp_eng.asp.
Acknowledgments
The authors would like to thank Benjamin Aubin (UQAT), who greatly helped with the electrical installation of the wattmeter. The authors would also like to acknowledge the contribution of the copy editor, Margaret McKyes.
Conflicts of Interest
The authors declare no conflict of interest. The funders had no role in the design of the study; in the collection, analyses, or interpretation of data; in the writing of the manuscript, or in the decision to publish the results.
References
- Landriault, D. The present state of paste fill in Canadian underground mining. In Proceedings of the 97th Annual General Meeting of CIM Rock Mechanics and Strata Control, Halifax, NS, Canada, 14–18 March 1995; pp. 229–238. [Google Scholar]
- Benzaazoua, M.; Bois, D.; Belem, T.; Gauthier, P.; Ouellet, S.; Fall, M.; St-Onge, J.-F. Remblais souterrains, évolution des connaissances et de la pratique. In Proceedings of the 20th Colloque Contrôle de Terrains, Association Minière du Québec, Val d’Or, QC, Canada, 22–23 March 2005; p. 23. [Google Scholar]
- Zhang, L.; Wang, H.; Wang, J.; Zhang, J.; Sun, H. Flow characteristics of paste slurry under low atmospheric pressure in high altitude areas. In Proceedings of the 20th International Seminar on Paste and Thickened Tailings, Beijing, China, 15–18 June 2017; pp. 74–86. [Google Scholar]
- Belem, T.; Benzaazoua, M. Predictive models for prefeasibility cemented paste backfill mix design. In Proceedings of the 3rd International Conference on Post-Mining, Nancy, France, 6–8 February 2008; pp. 6–8. [Google Scholar]
- Hassani, F.; Archibald, J. Mine Backfill; Canadian Institute of Mining, Metallurgy and Petroleum: Montreal, QC, Canada, 1998. [Google Scholar]
- Barsotti, C. The evolution of fill mining at the Ontario Division of Inco Metals. In Proceedings of the 12th Canadian Rock Mechanics Symposium, Mining with Backfill, CIM Special, Sudbury, ON, Canada, 23–25 May 1978; pp. 37–41. [Google Scholar]
- Belem, T.; Bussière, B.; Benzaazoua, M. The effect of microstructural evolution on the physical properties of paste backfill. In Proceedings of the Eighth International Conference on Tailings and Mine Waste ’01, Fort Collins, CO, USA, 16–19 January 2001; Balkema: Rotterdam, The Netherlands; pp. 365–374. [Google Scholar]
- Li, L.; Aubertin, M.; Belem, T. Formulation of a three-dimensional analytical solution to evaluate stresses in backfilled vertical narrow openings. Can. Geotech. J. 2005, 42, 1705–1717. [Google Scholar] [CrossRef]
- Belem, T.; Benzaazoua, M.; Bussière, B. Utilisation du remblai en pâte comme support de terrain. Partie I: De sa fabrication à sa mise en place sous terre. In Proceedings of the Symposium International Après-Mines, GISOS, Gisos Ed., Nancy, France, 5–7 February 2003; pp. 5–7. [Google Scholar]
- Belem, T.; El Aatar, O.; Bussière, B.; Benzaazoua, M. Gravity-driven 1-D consolidation of cemented paste backfill in 3-m-high columns. Innov. Infrastruct. Solut. 2016, 1, 37. [Google Scholar] [CrossRef] [Green Version]
- Landriault, D.; Verburg, R.; Cincilla, W.; Welch, D. Paste Technology for Underground Backfill and Surface Tailings Disposal Applications. Short Course Notes; Technical workshop; Canadian Institute of Mining and Metallurgy: Vancouver, BC, Canada, 1997; p. 120. [Google Scholar]
- Klein, K.; Simon, D. Effect of specimen composition on the strength development in cemented paste backfill. Can. Geotech. J. 2006, 43, 310–324. [Google Scholar] [CrossRef]
- Yilmaz, E.; Belem, T.; Benzaazoua, M. Specimen size effect on strength behavior of cemented paste backfills subjected to different placement conditions. Eng. Geol. 2015, 185, 52–62. [Google Scholar] [CrossRef]
- Fall, M.; Célestin, J.; Pokharel, M.; Touré, M. A contribution to understanding the effects of curing temperature on the mechanical properties of mine cemented tailings backfill. Eng. Geol. 2010, 114, 397–413. [Google Scholar] [CrossRef]
- Haiqiang, J.; Fall, M.; Cui, L. Yield stress of cemented paste backfill in sub-zero environments: Experimental results. Miner. Eng. 2016, 92, 141–150. [Google Scholar] [CrossRef]
- Benzaazoua, M.; Belem, T.; Bussière, B.; Ouellet, S. Évolution des propriétés des remblais en pâte: Principaux paramètres d’influence. In AMQ 19th Colloque en Contrôle de Terrain; Association Minière du Québec: Val-d’Or, QC, Canada, 2002. [Google Scholar]
- Boger, D.; Scales, P.; Sofra, F. Rheological Concepts. Paste and Thickened Tailings-A Guide, 2nd ed.; Jewell, R., Fourie, A.B., Eds.; Australian Centre for Geomechanics: Perth, Australia, 2006; pp. 25–37. [Google Scholar]
- Yin, S.; Wu, A.; Hu, K.; Wang, Y.; Zhang, Y. The effect of solid components on the rheological and mechanical properties of cemented paste backfills. Miner. Eng. 2012, 35, 61–66. [Google Scholar] [CrossRef]
- Ouattara, D.; Mbonimpa, M.; Belem, T. Rheological properties of thickened tailings and cemented paste tailings and the effects of mixture characteristics on shear behaviour. In Proceedings of the 63th Canadian Geotechnical Conference, Calgary, AB, Canada, 12–16 September 2010; pp. 118–1185. [Google Scholar]
- Ouattara, D.; Yahia, A.; Mbonimpa, M.; Belem, T. Effects of superplasticizer on rheological properties of cemented paste backfills. Int. J. Miner. Process. 2017, 161, 28–40. [Google Scholar] [CrossRef]
- Ouattara, D.; Mbonimpa, M.; Yahia, A.; Belem, T. Assessment of rheological parameters of high density cemented paste backfill mixtures incorporating superplasticizers. Constr. Build. Mater. 2018, 190, 294–307. [Google Scholar] [CrossRef]
- ASTM-C143. Standard Test Method for Slump of Hydraulic-Cement Concrete; ASTM International: West Conshohocken, PA, USA, 2015; C143. [Google Scholar]
- Creber, K.J.; McGuinness, M.; Kermani, M.F.; Hassani, F.P. Investigation into changes in pastefill properties during pipeline transport. Int. J. Miner. Process. 2017, 163, 35–44. [Google Scholar] [CrossRef]
- Belem, T.; Benzaazoua, M. Design and application of underground mine paste backfill technology. Geotech. Geol. Eng. 2008, 26, 147–174. [Google Scholar]
- Ouattara, D. Étude Expérimentale des Propriétés Rhéologiques et Mécaniques des Remblais Miniers en Pâte Cimentés Incorporant des Superplastifiants. Ph.D. Thesis, Université du Québec en Abitibi-Témiscamingue, Rouyn-Noranda, QC, Canada, 2017. [Google Scholar]
- Belem, T.; El Aatar, O.; Bussière, B.; Benzaazoua, M.; Fall, M.; Yilmaz, E. Characterization of self-weight consolidated paste backfill. In Proceedings of the 9th International Seminar on Paste and Thickened Tailings—Paste, Limerick, Ireland, 3–7 April 2006; pp. 3–7. [Google Scholar]
- Wu, D.; Fall, M.; Cai, S. Coupling temperature, cement hydration and rheological behaviour of fresh cemented paste backfill. Miner. Eng. 2013, 42, 76–87. [Google Scholar] [CrossRef]
- Mitchell, R.J.; Olsen, R.S.; Smith, J.D. Model studies on cemented tailings used in mine backfill. Can. Geotech. J. 1982, 19, 14–28. [Google Scholar] [CrossRef]
- Ouattara, D.; Belem, T.; Mbonimpa, M.; Yahia, A. Effect of superplasticizers on the consistency and unconfined compressive strength of cemented paste backfills. Constr. Build. Mater. 2018, 190, 294–307. [Google Scholar] [CrossRef]
- El Aatar, O.; Belem, T.; Bussière, B.; Benzaazoua, M.; Yilmaz, E. Microstructural properties of column consolidated paste backfill. In Proceedings of the 60th Canadian Geotechnical Conference and the 8th Joint CGS/IAH-CNC Groundwater Conference, Ottawa, ON, Canada, 21–25 October 2007; pp. 21–24. [Google Scholar]
- Wu, D.; Yang, B.; Liu, Y. Transportability and pressure drop of fresh cemented coal gangue-fly ash backfill (CGFB) slurry in pipe loop. Powder Technol. 2015, 284, 218–224. [Google Scholar] [CrossRef]
- Orban, J.; Parcevaux, P.; Guillot, D. Specific mixing energy: A key factor for cement slurry quality. In Proceedings of the SPE Annual Technical Conference and Exhibition, New Orleans, LA, USA, 5–8 October 1986. [Google Scholar]
- Wallevik, J.E.; Wallevik, O.H. Analysis of shear rate inside a concrete truck mixer. Cem. Concr. Res. 2017, 95, 9–17. [Google Scholar] [CrossRef]
- Cazacliu, B.; Dauvergne, M. Malaxage de Bétons Autoplaçants. Influence du Temps de Malaxage et du Type de Malaxeur; Rapport de contrat pour le projet national BAP; Laboratoire Centrale des Ponts et Chaussées: Paris, France, 2002; p. 23. [Google Scholar]
- Kırca, Ö.; Turanlı, L.; Erdoğan, T.Y. Effects of retempering on consistency and compressive strength of concrete subjected to prolonged mixing. Cem. Concr. Res. 2002, 32, 441–445. [Google Scholar] [CrossRef]
- Yang, M.; Jennings, H. Influences of mixing methods on the microstructure and rheological behavior of cement paste. Adv. Cem. Based Mater. 1995, 2, 70–78. [Google Scholar] [CrossRef]
- Dikonda, R.K.; Mbonimpa, M.; Belem, T. Influence de la procédure de malaxage sur les propriétés rhéologiques et mécaniques du remblai en pâte cimenté. In Proceedings of the 71st Canadian Geotechnical Conference: GeoEdmonton 2018, Edmonton, AB, Canada, 23–26 September 2018. [Google Scholar]
- Dikonda, R.K. Influence de L’énergie Spécifique de Malaxage sur les Propriétés Rhéologiques et Mécaniques des Remblais en Pâte Cimentés; Mémoire de maîtrise; École Polytechnique de Montréal: Montréal, QC, Canada, 2018. [Google Scholar]
- Wilson, K.C.; Addie, G.R.; Sellgren, A.; Clift, R. Slurry Transport Using Centrifugal Pumps; Springer Science & Business Media: New York, NY, USA, 2006. [Google Scholar]
- Paterson, A. High density slurry and paste tailings, transport systems. In Proceedings of the International Platinum Conference ‘Platinum Adding Value, Sun City, South Africa, 3–7 October 2004; pp. 159–166. [Google Scholar]
- Belem, T.; Benzaazoua, M.; Bussière, B.; Dagenais, A. Effects of settlement and drainage on strength development within mine paste backfill. In Tailings and Mine Waste; Balkema: Rotterdam, The Netherlands, 2002; pp. 139–148. [Google Scholar]
- Bussiere, B. Colloquium 2004: Hydrogeotechnical properties of hard rock tailings from metal mines and emerging geoenvironmental disposal approaches. Can. Geotech. J. 2007, 44, 1019–1052. [Google Scholar] [CrossRef]
- ASTM-D5550. Standard Test Methods for Specific Gravity of Soil Solids by Water Pycnometer; ASTM International: West Conshohocken, PA, USA, 2006. [Google Scholar]
- Rietveld, H.M. The Rietveld Method; Young, R.A., Ed.; Oxford University Press: Oxford, UK, 1993. [Google Scholar]
- Malusis, M.A.; Evans, J.C.; McLane, M.H.; Woodward, N.R. A miniature cone for measuring the slump of soil-bentonite cutoff wall backfill. Geotech. Test. J. 2008, 31, 373–380. [Google Scholar]
- Kalonji, K.; Mbonimpa, M.; Belem, T.; Benzaazoua, M.; Beya, F.K.; Ouellet, S. Calage d’un modèle numérique de prédiction de l’évolution de la température pendant le transport du remblai en pâte cimenté. In Proceedings of the 69th Canadian Geotechnical Conference: GeoVancouver 2016, Vancouver, BC, Canada, 2–5 October 2016. [Google Scholar]
- Kalonji, K. Étude des Propriétés Rhéologiques et du Transport du Remblai Cimenté en Pâte en Conditions Nordiques; Université du Québec en Abitibi-Témiscamingue: Rouyn-Noranda, QC, Canada, 2016. [Google Scholar]
- Ferraris, C.F. Concrete mixing methods and concrete mixers: State of the art. J. Res. Natl. Inst. Stand. Technol. 2001, 106, 391. [Google Scholar] [CrossRef]
- Varma, M. Effect of Change in Mixing Time of Mixer on Wet Density, Dry Density, Workability and Compressive Strength of M-20 Grade Concrete. Int. J. Eng. Res. Technol. 2016, 5, 71–78. [Google Scholar]
- Cazacliu, B. In-mixer measurements for describing mixture evolution during concrete mixing. Chem. Eng. Res. Des. 2008, 86, 1423–1433. [Google Scholar] [CrossRef]
- Wallevik, J.; Rheocenter, I.; Iceland, I.C. Particle flow interaction theory-thixotropic behavior and structural breakdown. In Proceedings of the 36th Conference on Our World of Concrete and Structures, Singapore, 14–16 August 2011; pp. 14–16. [Google Scholar]
- Gaudin, M.; Sajot, A. Niveaux d’énergie dans un puits de potentiel déformé à bords abrupts. J. Phys. 1969, 30, 857–875. [Google Scholar] [CrossRef]
- Vandanjon, P.-O.; de Larrard, F.; Dehousse, B.; Villain, G.; Maillot, R.; Laplante, P. Homogénéisation des bétons en centrale de fabrication discontinue. Influence du temps de malaxage et du mode d’introduction des additions minérales. Bull.-Lab. Ponts Chaussées 2000, 228, 35–46. [Google Scholar]
- Chopin, D. Malaxage des Bétons à Hautes Performances et des Bétons Auto-Plaçants: Optimisation du Temps de Fabrication; Thèse de Doctorat en Genie Civil; École Centrale de Nantes et Université de Nantes: Nantes, France, 2003. [Google Scholar]
- Han, D.; Ferron, R.D. Influence of high mixing intensity on rheology, hydration, and microstructure of fresh state cement paste. Cem. Concr. Res. 2016, 84, 95–106. [Google Scholar] [CrossRef] [Green Version]
- Dils, J.; De Schutter, G.; Boel, V. Influence of mixing procedure and mixer type on fresh and hardened properties of concrete: A review. Mater. Struct. 2012, 45, 1673–1683. [Google Scholar] [CrossRef]
- Yang, L.; Wang, H.; Li, H.; Zhou, X. Effect of high mixing intensity on rheological properties of cemented paste backfill. Minerals 2019, 9, 240. [Google Scholar] [CrossRef] [Green Version]
- Ramlochan, T.; Grabinsky, M.; Hooton, R. Microstructural and chemical investigations of cemented paste backfills. In Proceedings of the Eleventh Tailings and Mine Waste Conference. Fort Collins, CO, USA, 10–13 October 2004; A.A. Balkema: Leiden, The Netherlands; pp. 293–304. [Google Scholar]
- Fall, M.; Benzaazoua, M.; Ouellet, S. Experimental characterization of the influence of tailings fineness and density on the quality of cemented paste backfill. Miner. Eng. 2005, 18, 41–44. [Google Scholar] [CrossRef]
- Neubauer, C.M.; Yang, M.; Jennings, H.M. Interparticle potential and sedimentation behavior of cement suspensions: Effects of admixtures. Adv. Cem. Based Mater. 1998, 8, 17–27. [Google Scholar] [CrossRef]
- Flatt, R.J.; Martys, N.; Bergström, L. The rheology of cementitious materials. MRS Bull. 2004, 29, 314–318. [Google Scholar] [CrossRef]
- Nehdi, M.; Al Martini, S. Estimating time and temperature dependent yield stress of cement paste using oscillatory rheology and genetic algorithms. Cem. Concr. Res. 2009, 39, 1007–1016. [Google Scholar] [CrossRef]
- Lemelin, M. Généralisation de la Méthode de Séparation des Variables pour les Équations non Linéaires de Klein-Gordon; Mémoire de Maîtrise en Physique; Université du Québec à Trois-Rivières: Trois-Rivières, QC, Canada, 1993. [Google Scholar]
- Chevrette, A. Généralisation de la Méthode de Séparation des Variables pour les Équations non Linéaires de Diffusion Unidimensionnelle; Mémoire de Maîtrise en Mathématiques et Informatique; Université du Québec à Trois-Rivières: Trois-Rivières, QC, Canada, 2000. [Google Scholar]
- Silva, W.P.; Silva, C.M.D.P.S. LAB Fit Curve Fitting Software (Nonlinear Regression and Treatment of Data Program) V 7.2.50. Available online: http://www.labfit.net/ (accessed on 1 June 2021).
- Wang, H.; Yang, L.; Li, H.; Zhou, X.; Wang, X. Using Coupled Rheometer-FBRM to Study Rheological Properties and Microstructure of Cemented Paste Backfill. Adv. Mater. Sci. Eng. 2019, 2019, 6813929. [Google Scholar] [CrossRef] [Green Version]
- Hunter, R.J. Foundations of Colloid Science; Oxford University Press: Oxford, UK, 2001. [Google Scholar]
- Takahashi, K.; Bier, T. Mechanisms of Degradation in Rheological Properties Due to Pumping and Mixing. Adv. Civ. Eng. Mater. 2014, 3, 25–39. [Google Scholar] [CrossRef]
- Raucci, J.; Cecel, R.; Romano, R.; Pileggi, R.; John, V. Effect of mixing method on the mini-slump spread of Portland cement pastes. Rev. IBRACON Estrut. Mater. 2018, 11, 410–431. [Google Scholar] [CrossRef]
- Kalonji, K.; Mbonimpa, M.; Belem, T.; Benzaazoua, M.; Beya, F.K.; Ouellet, S. Preliminary investigation of the effect of temperature and salinity on the rheological properties of fresh cemented paste backfills. In Proceedings of the 68th Canadian Geotechnical Conference and 7th Canadian Permafrost Conference, Geoquebec, QC, Canada, 20–23 September 2015. [Google Scholar]
- Azouz, K.B.; Bekkour, K.; Dupuis, D. Influence of the temperature on the rheological properties of bentonite suspensions in aqueous polymer solutions. Appl. Clay Sci. 2016, 123, 92–98. [Google Scholar] [CrossRef]
- Dikonda, R.K.; Mamert, M.; Tikou, B. Specific mixing energy of cemented paste backfill (Part II): Influence on the rheological and mechanical properties and practical applications. Minerals. under review.
Figure 1.
Grain-size distribution curves (cumulative volume percentage) for tailings T1 and T2.

Figure 2.
Simplified diagram of the mixing energy station.

Figure 3.
Variation in power consumption P0(t) and dissipated energy E0(t) for the empty running Omcan SP300AT mixer rotating at 91, 166, and 282 rpm with respect to running time t.
Figure 3.
Variation in power consumption P0(t) and dissipated energy E0(t) for the empty running Omcan SP300AT mixer rotating at 91, 166, and 282 rpm with respect to running time t.

Figure 4.
Validation of the mixing energy E0 for the empty running Omcan SP300AT mixer: comparison between calculated and measured values.
Figure 4.
Validation of the mixing energy E0 for the empty running Omcan SP300AT mixer: comparison between calculated and measured values.

Figure 5.
Variation in power consumption P(t) and dissipated energy E(t) with respect to running time t for the preparation of mixtures M04 and M20 made with tailings T1 (CPB-T1) and T2 (CPB-T2), respectively (see mixing parameters in Table 4).
Figure 5.
Variation in power consumption P(t) and dissipated energy E(t) with respect to running time t for the preparation of mixtures M04 and M20 made with tailings T1 (CPB-T1) and T2 (CPB-T2), respectively (see mixing parameters in Table 4).

Figure 6.
Influence of mixing time on (a) SME and (b) consistency for CPB-T1 and CPB-T2 mixtures prepared with tailings T1 (M01–M05) and T2 (M13–M17), respectively, using the Omcan SP300AT mixer rotating at 166 rpm.
Figure 6.
Influence of mixing time on (a) SME and (b) consistency for CPB-T1 and CPB-T2 mixtures prepared with tailings T1 (M01–M05) and T2 (M13–M17), respectively, using the Omcan SP300AT mixer rotating at 166 rpm.

Figure 7.
Influence of mixing speed on: (a) SME and (b) consistency for CPB-T1 (M06–M08 and CPB-T2 (M18–M20) at a mixing speed of 91, 166, and 282 rpm for a mixing time of 5 min using the Omcan SP300AT mixer.
Figure 7.
Influence of mixing speed on: (a) SME and (b) consistency for CPB-T1 (M06–M08 and CPB-T2 (M18–M20) at a mixing speed of 91, 166, and 282 rpm for a mixing time of 5 min using the Omcan SP300AT mixer.

Figure 8.
Influence of mixer load mass on: (a) SME and (b) consistency for CPB-T1 (M09–M12) and CPB-T2 (M21–M26) with the Omcan SP300AT mixer rotating at 166 rpm for 5 min.
Figure 8.
Influence of mixer load mass on: (a) SME and (b) consistency for CPB-T1 (M09–M12) and CPB-T2 (M21–M26) with the Omcan SP300AT mixer rotating at 166 rpm for 5 min.

Figure 9.
Comparison between measured and predicted SME for CPB-T1 and CPB-T2 mixtures prepared with tailings T1 and T2, respectively.
Figure 9.
Comparison between measured and predicted SME for CPB-T1 and CPB-T2 mixtures prepared with tailings T1 and T2, respectively.

Figure 10.
Effect of SME on the slump of CPB mixtures prepared with tailings T1 and T2.


Table 1.
Physical characteristics of tailings T1 and T2.
| Physical Characteristics | T1 | T2 |
|---|---|---|
| D10 (µm) | 4.9 | 4.4 |
| D30 (µm) | 15.5 | 11.2 |
| D50 (µm) | 31.9 | 20.9 |
| D60 (µm) | 43.4 | 28.0 |
| D80 (µm) | 80.7 | 53.7 |
| D90 (µm) | 119.8 | 87.9 |
| CU = D60/D10 | 8.9 | 6.4 |
| Cc = (D30)2/(D60 × D10) | 1.1 | 1.0 |
| P20µm (%) | 36.4 | 48.5 |
| P80µm (%) | 79.7 | 88.4 |
| Gs (-) | 3.14 | 2.97 |
| SS (m2/g) | 2.6 | 2.7 |
Table 2.
Chemical composition of the solids content in tailings T1 and T2.
| Element | Al | Ba | Ca | Fe | K | Li | Mg | Mn | Na | S | Ti | Zn |
|---|---|---|---|---|---|---|---|---|---|---|---|---|
| T1 (%) | 12 | 0.07 | 3.24 | 38.78 | 2.44 | 0.03 | 0.71 | 0.23 | 1.23 | 40.64 | 0.42 | 0.24 |
| T2 (%) | 27.46 | 0.24 | 5.43 | 27.58 | 8.99 | 0.04 | 3.72 | 0.28 | 1.93 | 22.73 | 1.35 | 0.26 |
Table 3.
Mineralogical composition of the tested tailings.
| Mineral | T1 (%) | T2 (%) |
|---|---|---|
| Albite NaAlSi3O8 | 12 | 12 |
| Chlorite (Mg,Al)6(Si,Al)4O10(OH)8 | 4 | 9 |
| Corundum Al2O3 | - | 2 |
| Gypsum CaSO4·2H2O | 3 | 7 |
| Muscovite K(Al3Si3O10)(OH)2 | 4 | 10 |
| Pyrite FeS2 | 18 | 11 |
| Quartz SiO2 | 59 | 49 |
Table 4.
Oxide contents in the binder (80% Slag + 20% GU).
| Composition | Al2O3 | CaO | Fe2O | K2O | MgO | MnO | P4O6 | S | SiO2 | TiO2 |
|---|---|---|---|---|---|---|---|---|---|---|
| Binder (%) | 6.52 | 55.5 | 0.93 | 1.33 | 4.36 | 0.38 | 0.39 | 3.45 | 26.07 | 0.37 |
Table 5.
CPB mixtures used to investigate the influence of mixing parameters on SME and CPB properties.
Table 5.
CPB mixtures used to investigate the influence of mixing parameters on SME and CPB properties.
| Mixtures | Load Mass (kg) | Mixing Speed (rpm) | Mixing Time (min) | ||
|---|---|---|---|---|---|
| CPB-T1 | CPB-T2 | T1 | T2 | ||
| Series I: Mixing Time | |||||
| M01 | M13 | 4.7 | 4.2 | 166 | 5 |
| M02 | M14 | 4.7 | 4.2 | 166 | 7 |
| M03 | M15 | 4.7 | 4.2 | 166 | 10 |
| M04 | M16 | 4.7 | 4.2 | 166 | 15 |
| M05 | M17 | 4.7 | 4.2 | 166 | 30 |
| Series II: Mixing Speed | |||||
| M06 | M18 | 4.7 | 4.2 | 91 | 5 |
| M07 | M19 | 4.7 | 4.2 | 166 | 5 |
| M08 | M20 | 4.7 | 4.2 | 282 | 5 |
| Series III: Load Mass | |||||
| M09 | M21 | 4.7 | 3.0 | 166 | 5 |
| M10 | M22 | 6.3 | 4.7 | 166 | 5 |
| M11 | M23 | 9.5 | 6.3 | 166 | 5 |
| M12 | M24 | 12.6 | 8.9 | 166 | 5 |
| - | M25 | - | 11.9 | 166 | 5 |
| - | M26 | - | 15.6 | 166 | 5 |
Publisher’s Note: MDPI stays neutral with regard to jurisdictional claims in published maps and institutional affiliations. |
© 2021 by the authors. Licensee MDPI, Basel, Switzerland. This article is an open access article distributed under the terms and conditions of the Creative Commons Attribution (CC BY) license (https://creativecommons.org/licenses/by/4.0/).
Share and Cite
MDPI and ACS Style
Dikonda, R.K.; Mbonimpa, M.; Belem, T. Specific Mixing Energy of Cemented Paste Backfill, Part I: Laboratory Determination and Influence on the Consistency. Minerals 2021, 11, 1165. https://0-doi-org.brum.beds.ac.uk/10.3390/min11111165
AMA Style
Dikonda RK, Mbonimpa M, Belem T. Specific Mixing Energy of Cemented Paste Backfill, Part I: Laboratory Determination and Influence on the Consistency. Minerals. 2021; 11(11):1165. https://0-doi-org.brum.beds.ac.uk/10.3390/min11111165
Chicago/Turabian StyleDikonda, Reagan Kabanga, Mamert Mbonimpa, and Tikou Belem. 2021. "Specific Mixing Energy of Cemented Paste Backfill, Part I: Laboratory Determination and Influence on the Consistency" Minerals 11, no. 11: 1165. https://0-doi-org.brum.beds.ac.uk/10.3390/min11111165
Note that from the first issue of 2016, this journal uses article numbers instead of page numbers. See further details here.