
A Failure Modes and Effects Analysis Framework for Assessing Geotechnical Risks of Tailings Dam Closure


1
Department of Civil and Environmental Engineering, University of Alberta, 9211 116 Street NW, Edmonton, AB T6G1H9, Canada
2
School of Engineering Safety and Risk Management, University of Alberta, 9211 116 Street NW, Edmonton, AB T6G1H9, Canada
*
Author to whom correspondence should be addressed.
Minerals 2021, 11(11), 1234; https://0-doi-org.brum.beds.ac.uk/10.3390/min11111234
Submission received: 1 October 2021
/
Revised: 27 October 2021
/
Accepted: 3 November 2021
/
Published: 6 November 2021
(This article belongs to the Special Issue Tailings Dams: Design, Characterization, Monitoring, and Risk Assessment)
Abstract
:Tailings dams remain on site following mine closures and must be designed and reclaimed to meet long-term goals, which may include walk-away closure or long-term care and maintenance. The underperformance of these structures can result in significant risks to public and environmental safety, as well as impacts on the future land use and economic activities near the structure. In Alberta, Canada, the expectation is for a tailings dam to be reclaimed and closed so that it can undergo deregistration. To aid in assessing the risks of underperformance during and after closure, a Generalized Failure Modes and Effects Analysis (G-FMEA) framework was developed to assess the long-term geotechnical risks for tailings dams in Alberta, with the goal of assessing the potential success of a tailings dam closure strategy. The G-FMEA is part of an initiative to enhance closure evaluations in Alberta in a collaborative effort between industry, the regulator, and academia. The G-FMEA incorporates the element of time to account for the evolution of the system, which should be applied at the planning stage and updated continually throughout the life of the facility. This paper presents the developed G-FMEA framework for tailings dams in Alberta, including the developed risk matrix framework.
1. Introduction
Historically, tailings dams were designed with the consideration of geotechnical failure modes that could occur during the active life of the mine. Little consideration was given to closure of the facility and the long period afterwards. This approach has resulted in many tailings dams that are in a poor position for closure or have been orphaned all together. This is problematic as the failure of these structures can still occur after the closure of a mine site, such as at the Matachewan Consolidated Mine in Ontario [1]; or when the mine is in a period of care and maintenance, such as at Obed Mountain Coal Mine in Alberta [2]. Regardless of whether the mine is active or not, tailings dams can pose a significant risk to the public and the environment if not properly managed or decommissioned. In the medium-to-long term, after decommissioning, uncertainties associated with the performance of these structures increase, as there is limited information regarding how a tailings dam ages in perpetuity. This knowledge gap poses a significant environmental, public, and financial risk, especially when combined with the serious consequences associated with the failure of tailings dams. As a result, it is vital that risk management practices be developed to assess the risks associated with the long-term behavior. Mitigation strategies should be adopted early in the life of the structure, or as soon as they are practical for active or closed facilities. There is a transition towards integrating sustainable mining practices at the outset of mining. Of note, the Landform Design Institute (LDI) advocates for mining with an end in mind, noting that there will always be residual risks present following the closure of a mine [3]. Managing the long-term residual risks requires a transparent mechanism that includes collaborative design, construction, reclamation, and aftercare [3].
In Alberta, Canada, the mining industry consists primarily of coal and oil sands extraction. The external tailings facilities (ETFs) at these mines are at various points in their lifecycles. With some facilities reclaimed or in the process of being reclaimed, it is important that systems are in place to aid operators in understanding the regulator’s requirements for the process of deregistration. Deregistration is the process where the governmental body in charge of regulating these structures (i.e., Alberta Energy Regulator, AER) assesses a dam to determine if it can be removed from the dam and pond registry and no longer be regulated as a dam; Alberta is making ongoing progress towards this goal. This is evident in the release of the Alberta Dam and Canal Safety Directive (the Directive) and Manual 019: Decommissioning, Closure, and Abandonment of Dams at Energy Projects (Manual 019) [4,5]. Manual 019 indicates that “in closure, a dam operator provides active care and may transition to passive care, depending on site-specific circumstances. As a result, the Directive adopts a number of formal risk-management principles to ensure the long-term care and maintenance of tailings dams after the construction and operation phase has ended” [5].
With the impending closure of a number of external tailings facilities in Alberta, a Generalized Failure Modes Effects and Analysis (G-FMEA) framework was developed to assess the landform design for closure. This assessment should ideally be conducted before mining begins (during permitting) and updated as the project progresses. Ultimately, the goal of the G-FMEA framework is to aid in managing the residual risks associated with ETFs in both a practical and economical way. The residual risks must be acceptable to stakeholders.
In order to complete a comprehensive risk assessment, it may be necessary to conduct various levels of modelling to evaluate the behaviour and/or assess consequences. For example, in operational risk assessments, runout modelling and inundation mapping are important elements of the risk assessment, as noted by Ghahramani et al. [6]. The utility of such assessments for conducting a long-term closure risk assessment for the purposes of deregistration may need to be evaluated in the context of the regulator. For example, the AER (Manual 019) requires flowable tailings to be removed or mitigated for a tailings facility to be deregistered, such that they do not pose an unacceptable risk to dam safety [5]. Similar criteria regarding flowable tailings is outlined by Al-Mamun and Small [7]. While further advancements and an increased confidence in the results of the runout modelling and inundation mapping are useful for understanding the risks associated with flowable tailings, they may not be useful tools within the current deregistration framework. However, they remain useful tools for assessing the long-term risks of tailings facilities where it is not possible to remove the flowable tailings or for orphaned facilities.
The G-FMEA will fit most structures and failure modes but may highlight failure modes that require additional analyses, such as quantitative risk assessments. As such, the G-FMEA is intended to be used as a screening tool for the closure phase of the life cycle of an external tailings facility, where the risks assessed as acceptable require no further analyses and higher risks (or multiplicity of relatively low risk) can trigger more detailed and/or quantitative approaches. The G-FMEA is, therefore, meant to investigate the potential of the facility to be deregistered as a dam by investigating the risk of geotechnical failure. This paper presents the developed G-FMEA framework, including a developed risk matrix framework. The G-FMEA charts developed as part of the framework present the failure modes that are applicable to closure and should not be used to assess dam safety during construction or operation.
2. FMEA Background
FMEA is a top-down risk assessment tool that allows for the systematic identification and analysis of the different failure modes and their associated consequences [8,9]. FMEA aims to identify all potential failure modes, the consequences of these failure modes, the mechanisms of failure, and how the risks associated with the failures can be avoided or controlled [10]. The entire process is based on determining what happens if a specific component or element of the system fails [11]. When extended and applied to a dam, FMEA focuses on developing a clear picture of the dam, including the various components and how they interact in a systematic way [11]. Using this basis, FMEA can be used to evaluate how component failures can lead to overall system failures, the consequences of component and system failures, and the criticality of various components for risk control [11].
FMEA is generally site-specific and considers the site data, construction method, construction materials, and past behaviour of the structure [12]. As a result, it can be a time-consuming, complex process (occasionally even requiring field or laboratory investigations). Despite this, it is proven to be an extremely useful tool as it allows risks to be assessed and managed. As shown by Santos et al., FMEA is effective in demonstrating the potential failure modes of all components of a tailings dam system which then allows for the development of a comprehensive dam monitoring and surveillance system [13]. To conduct an FMEA, the following structure can be used [11]:
- Define the system, including all components.
- Based on component interaction, de-aggregate the system into functional sub-systems.
- Break the sub-systems down into key elements and functions.
- Analyze the failure modes of the different elements.
- Assess the failure effects and consequences of the various elements.
- Summarize the findings.
- Repeat as necessary.
Steps 4 and 5 involve analyzing the failure mode, effects, and consequences of the different elements. This is an important step as it allows the effect of component failure modes on other components of the sub-system and the overall system to be evaluated.
Applying an FMEA to a tailings dam is not a new or revolutionary task; however, the application of an FMEA to assess the risk of a tailings dam over post closure time frames is challenging as a major limitation of an FMEA is the inclusion of time dependence and the depreciation of performance of system components [13]. It is expected that the dam will evolve significantly over time (i.e., clogging of drains, ageing of sands, etc.) [14,15]. Ultimately, the likelihood and consequences of failure are not static and may increase or decrease over time [14,15,16]. Robertson and Shaw note that some risks have a different likelihood or consequences if they occur during operations or post closure [9]. Risk matrices aim to include time through defining the time frame in which the probability of failure (PoF) is valid. This is typically set as an annual PoF, for the duration of the life of the structure. This concept is complex for evaluating closure as PoF is expected to change over long periods of time.
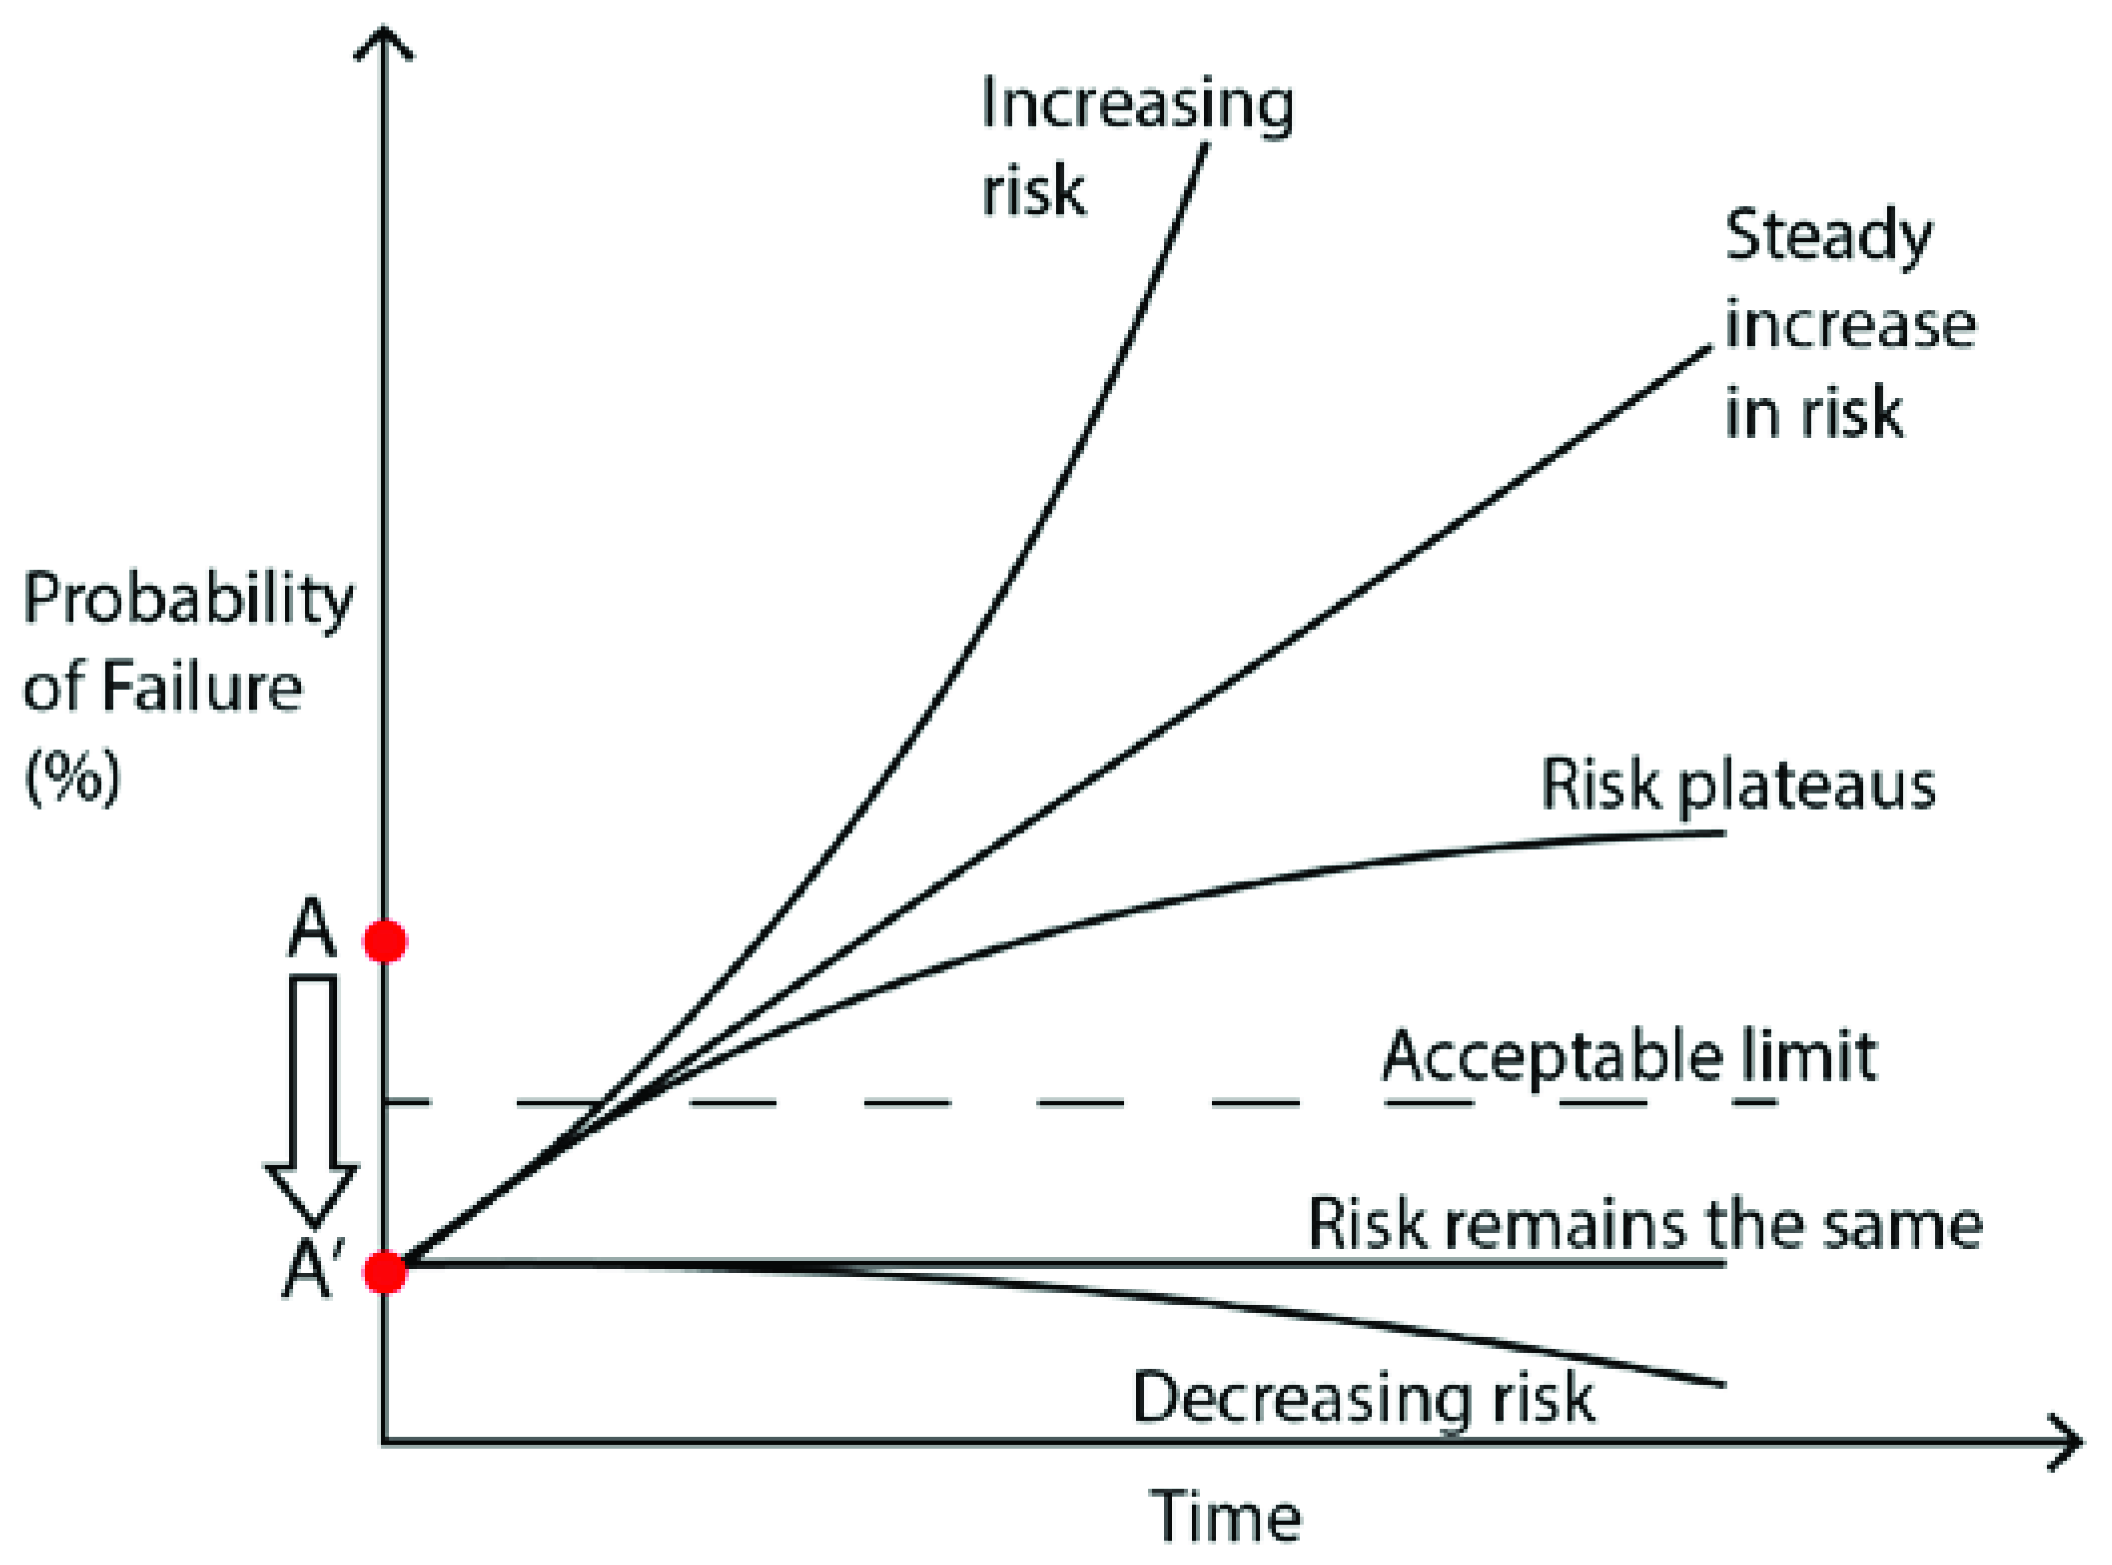
Incorporating time into an FMEA requires an evaluation and consideration of how risk profiles may change over time due to system changes, as shown in Figure 1. Point A represents the state of a system (dam structure) in terms of its PoF. Point A has an associated probability of failure that is above the acceptable limit at time zero. To move from point A to A’ so that the risk meets the acceptable limit would require risk control measures to be implemented. While this satisfies the conditions at time zero, the question remains: What will happen as time progresses and the dam undergoes evolutionary processes? As shown in Figure 1, the risk profile may follow several different trajectories that range from decreasing over time to increasing over time.
The changing risk profiles over time are influenced by the closure plan and considerations of the custodial transfer scenario of the local jurisdiction. In cases where the closure risks are intended to be managed with long-term maintenance, consideration may be required for scenarios where the maintenance may be disrupted for a period of time (for example, by war or another pandemic). The developed G-FMEA considers different temporal scales as a means of accounting for the time dependence, depreciation of system elements, and the associated changing risk profiles over time, as shown in Figure 1.
3. Risk Matrix Background
FMEAs may be qualitative or quantitative in nature and are commonly combined with qualitative risk matrices to estimate the likelihood and consequences of different failure modes. Risk matrices combine the estimates of the likelihood of a negative outcome with estimates of the magnitude of consequences to determine a risk level [9,16,17]. The risk level then determines the level and timing of the required mitigative measures and critical controls to be implemented to reduce the risk level [18]. Risk matrices are often perceived as being simple to interpret and use. However, according to Porter et al. [16], “guidance notes that explain the details of how the matrices were developed and how they were meant to be used for risk assessment, risk communication and risk management are often brief and cryptic”. Ultimately, this lack of guidance can lead to problems with the application of the risk matrix, which is already commonly criticized for being subjective. Risk matrices have been critiqued by a number of authors, as shown in Table 1.
To aid in mitigating the known issues with risk matrices, a number of authors have suggested various improvements, including logarithmic scales [19,27]; probability-consequence diagrams with continuous scales [31]; and following the Cox axioms of weak consistency, betweenness, and consistent colouring [19]. Despite the issues associated with risk matrices, some authors suggest that an important element of using risk matrices is applying them in the appropriate scenarios. Bao et al. suggests that subjectivity is a vital characteristic of risk matrices as they are effective for assessments where data are insufficient and quantitative tools cannot be applied [32]. Baybutt notes that risk matrices should be used to provide “… initial decision guidance, which should be used with caution and the application of common sense. Risk matrices should not be used in isolation to make decisions” [27]. Considering all of this, the risk matrix developed as part of this research is intended to be used as a screening tool, where the risks assessed as acceptable require no further analyses and higher risks (or multiplicity of relatively low risk) could inform where/if quantitative risk assessment techniques need to be used in the further decision-making stages for the closure of a facility.
4. Generalized FMEA Framework
A Generalized FMEA framework was developed, based on the current practice with FMEA, for use by regulators and the industry to assess the long-term risk of the failure of a tailings dam following closure. In order to conduct an FMEA, the definition of tailings dam failure must be clearly laid out. For the purposes of this work, a dual definition will be used for failure, similar to the Ultimate Limit States and Serviceability Limit States used in foundation engineering, as defined in the Canadian Foundation Engineering Manual [34]. Here, failure is defined as:
- Ultimate failure: the collapse of a tailings dam leading to catastrophic failure as defined by the Global Tailings Standard [35]:
- ○
- “A tailings facility failure that results in material disruption to social, environmental and local economic systems. Such failures are a function of the interaction between hazard exposure, vulnerability, and the capacity of people and systems to respond. Catastrophic events typically involve numerous adverse impacts, at different scales and over different timeframes, including loss of life, damage to physical infrastructure or natural assets, and disruption to lives, livelihoods, and social order. Operators may be affected by damage to assets, disruption to operations, financial loss, or negative impact to reputation. Catastrophic failures exceed the capacity of affected people to cope using their own resources, triggering the need for outside assistance in emergency response, restoration and recovery efforts.”
- Serviceability failure: failure to perform as intended.
The goal of performing the G-FMEA is to guide practitioners and regulators through the process of continuing to ask questions in a disciplined manner to prevent ultimate failure. The risk management tool is not intended to be a static tool and should be revisited at specific intervals and triggered by changes in the facility or events of underperformance. A clear trigger protocol needs to be developed for revisiting the G-FMEA. The completed G-FMEA should undergo a robust scrutiny, just like the designs, be accompanied by peer reviews, and assessed by external reviewers or review boards, where applicable. The development of the G-FMEA is assisted by the following:
- Literature reviews related to:
- Tailings dam characteristics in the oil sands and coal industries;
- Tailings dam failure modes;
- Risk assessment tools.
- The input from the regulator and industry stakeholders.
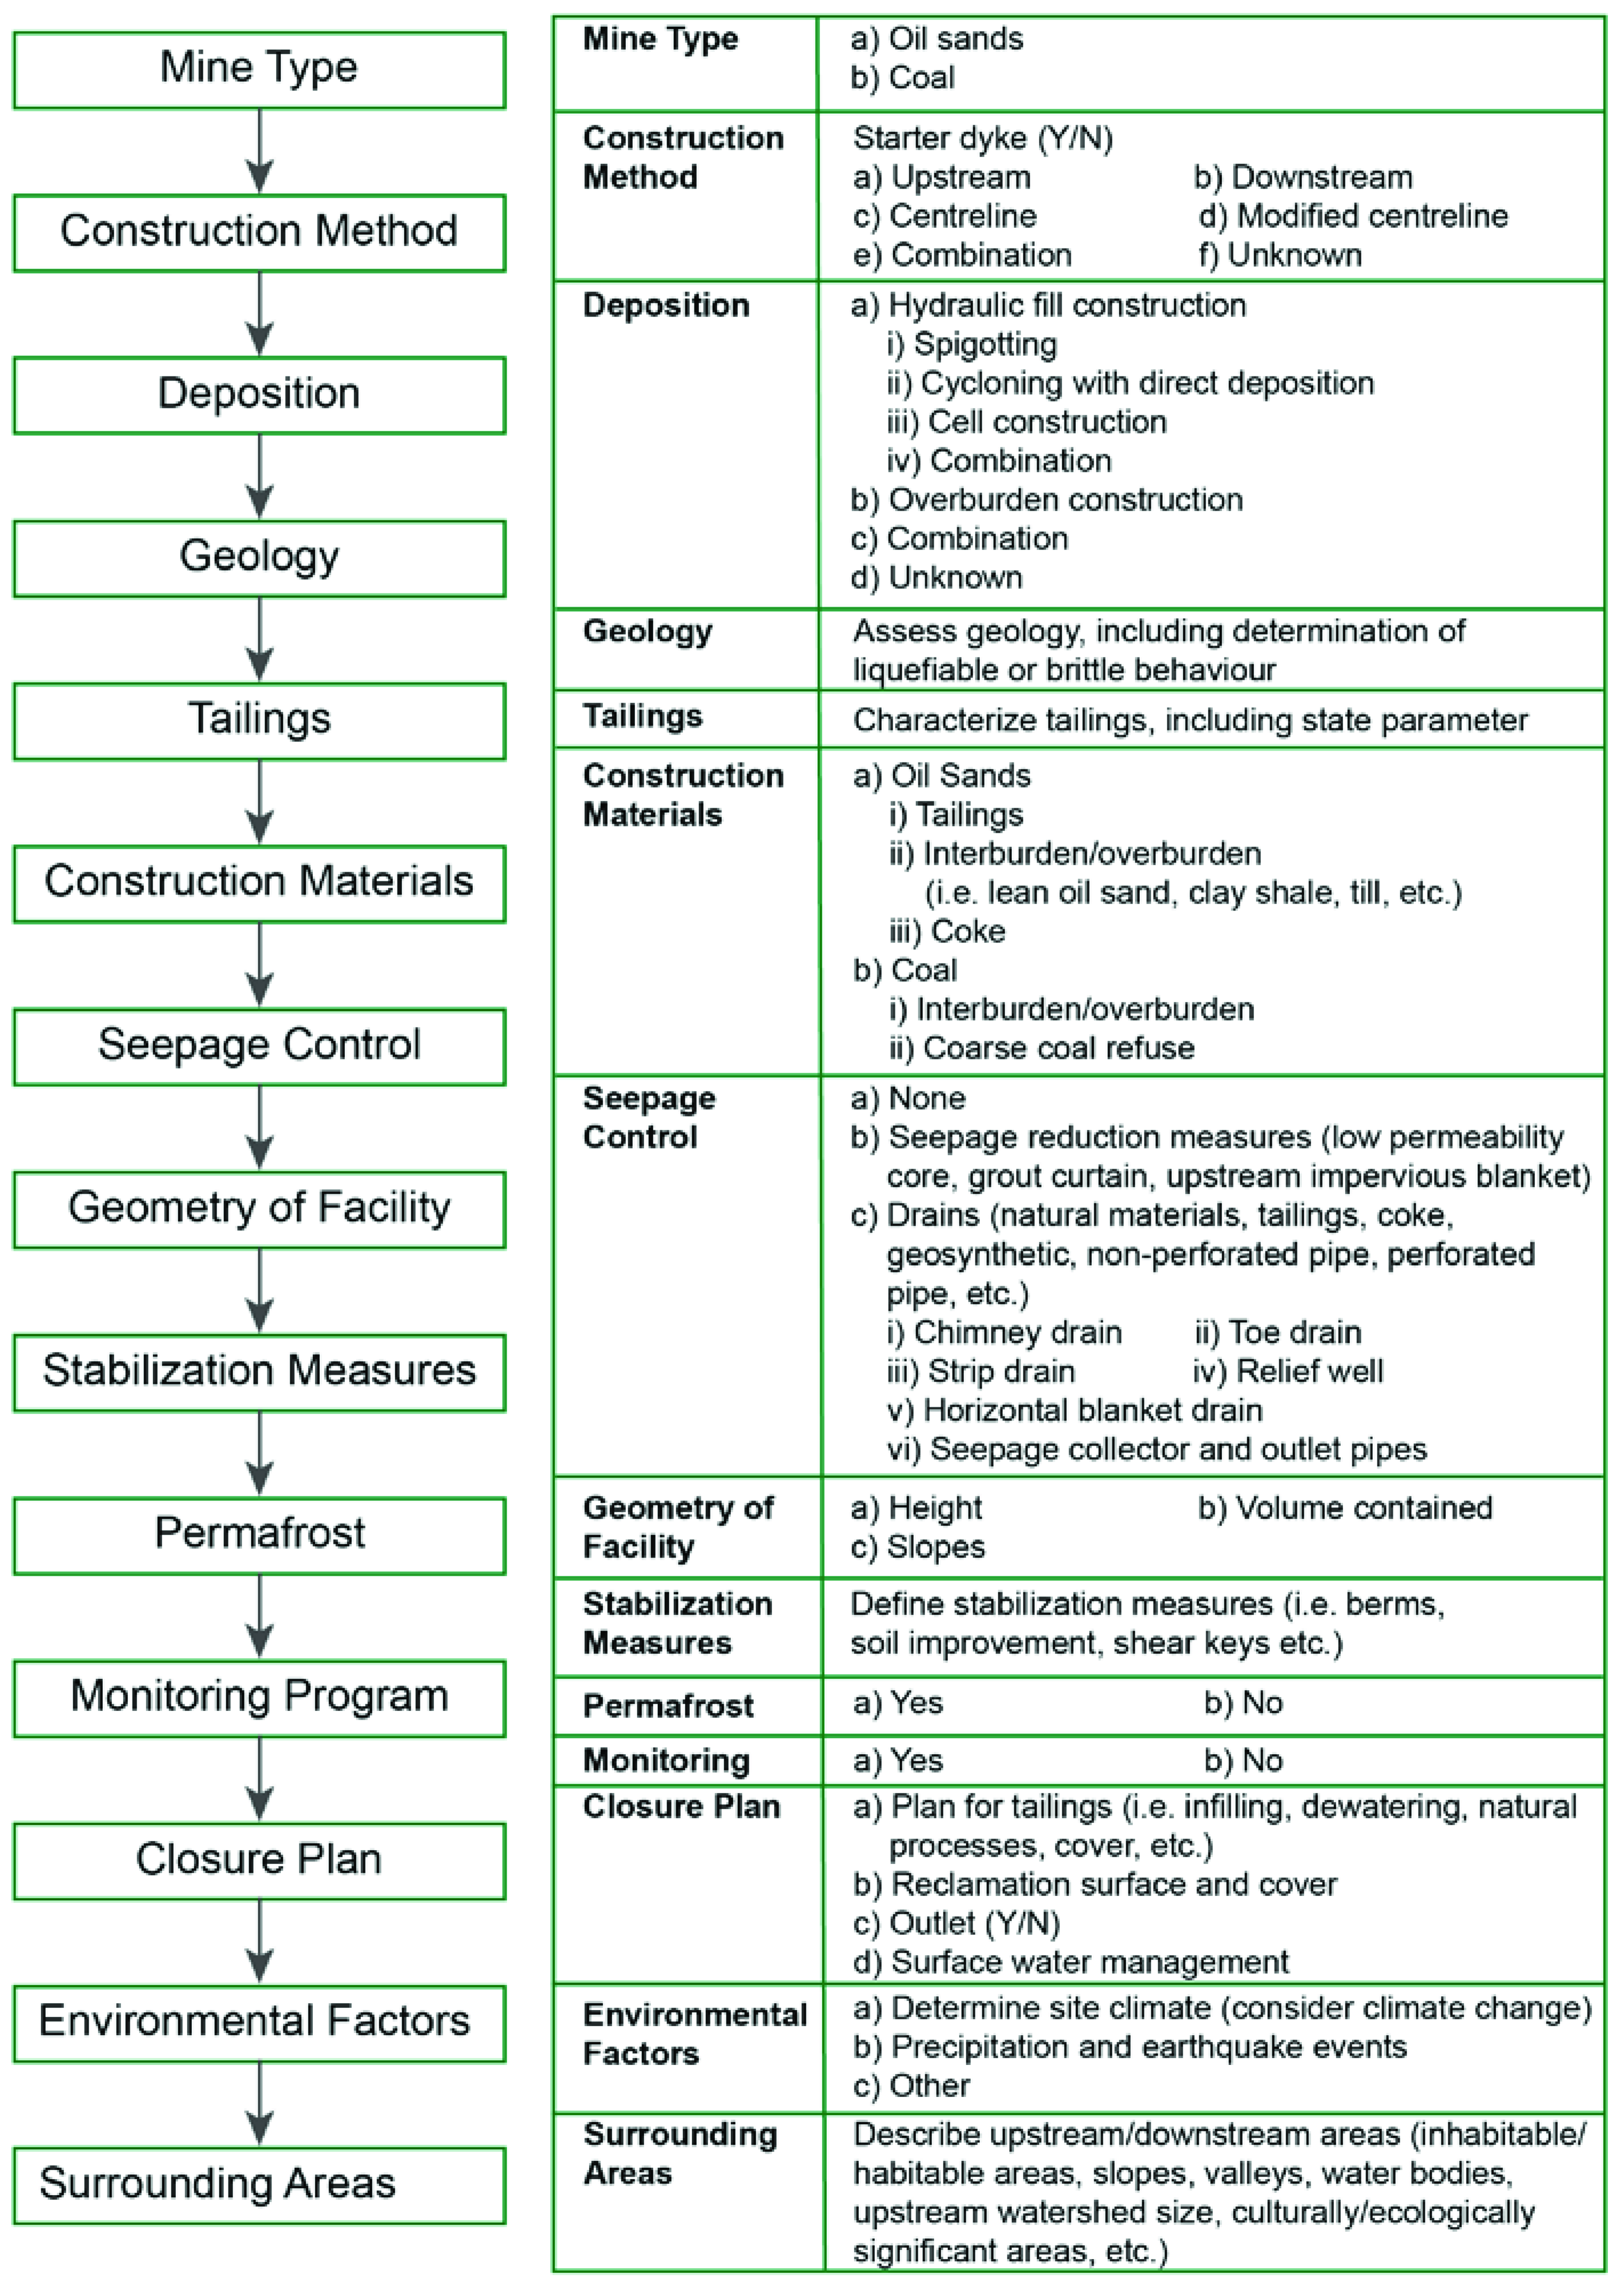
Schafer et al. [14,15] and a detailed literature review were used to develop the overall system definition, which included dam characteristics that impact dam behaviour. The system definition serves as the foundation of the development of the G-FMEA and Ayyub notes that the first step to conducting a system definition is to establish the objectives [8]. This step is essential to providing context and ensuring that the users of the risk framework are asking the same questions when applying the G-FMEA to their sites. The objective question of the G-FMEA is: How should geotechnical risks associated with an external tailings facility in Alberta be managed in the long-term to achieve an acceptable closure plan, such that the facility is able to be deregistered as a dam? All users of the G-FMEA must have an understanding of the objective and intended use of the FMEA.
Following this, the system boundaries can be defined. The system definition is summarized in Figure 2 and shows the characteristics of the dam that should be carefully considered and defined prior to starting the FMEA. The general categories are summarized in the flow chart on the left with details on the general categories in the table on the right.
The system definition serves as the minimum of what should be defined for a tailings dam prior to conducting the FMEA. However, these parameters should be defined comprehensively and may take the form of a fact sheet. This step aids in evaluating and conducting the FMEA.
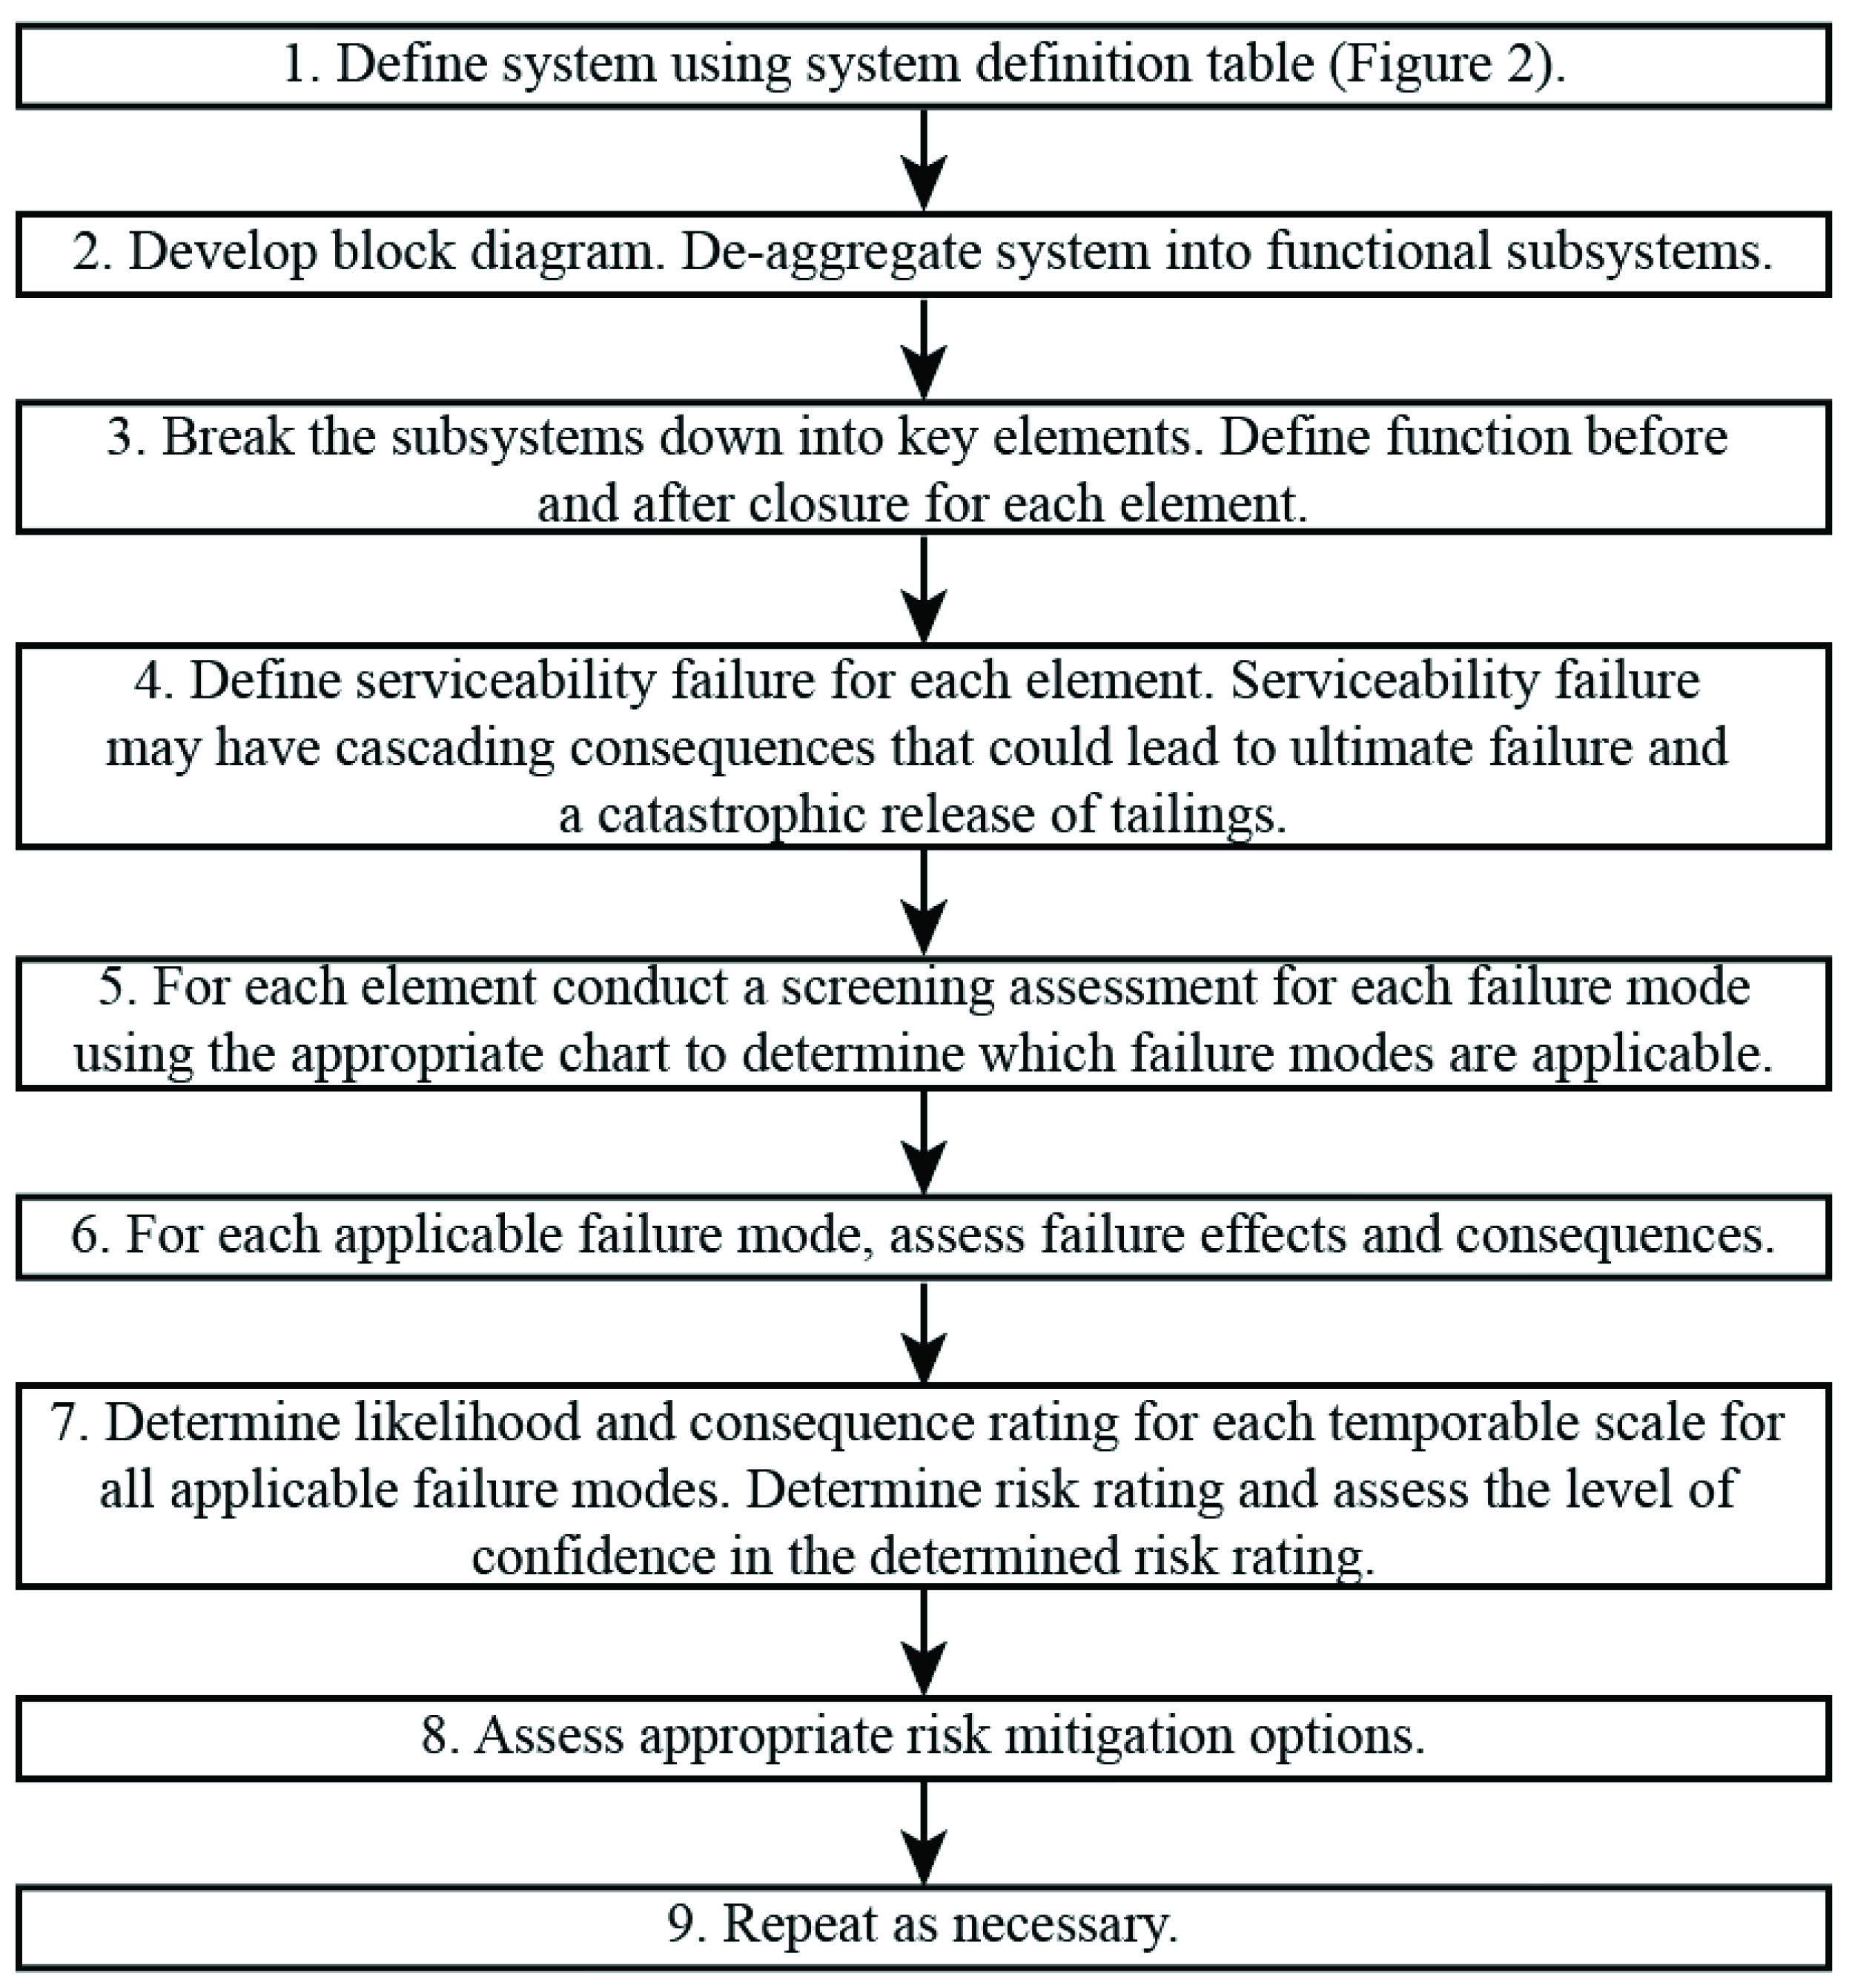
Following the development of the system definition, a hazard mapping exercise was conducted, which focused on identifying potential failure modes, mechanisms, triggers, and hazards. A failure mode is defined as the overarching cause of failure. The failure mechanism is the mechanism by which a hazard leads to a failure mode. This may consist of a series of steps. A trigger is defined as that which initially leads to the failure mechanism. A hazard is defined as a condition with the potential to cause an undesirable consequence. Combined, the system definition and hazard mapping contributes greatly to the development of the G-FMEA. The steps required to use the G-FMEA in practice are outlined in Figure 3. If risk mitigation is required, or the closure plan is altered, the process may need to be repeated. This may require the risk assessor to return to Step 1 to update the system definition if substantial changes are made.
The G-FMEA includes four individual charts for the drainage system, foundation, dam body, and landform, which are provided in Appendix A. An excerpt of the drainage system chart is provided in Table 2. The drainage system and landform chart consider failure modes for a variety of different elements that could be present within a dam. The foundation chart and dam body chart do not provide failure modes for individual elements, since most failure modes are applicable to multiple elements. Each identified foundation element should be evaluated for every failure mode on the foundation list. Similarly, each dam body element must be evaluated for every failure mode on the dam body list.
Failure modes that are not applicable should be screened out prior to completing the risk assessment, as discussed in Step 5. A justification must be recorded for screening out a failure mode and re-evaluated each time the FMEA is revisited. This may include a justification of whether a failure mode is credible or non-credible as defined by the Global Industry Standard on Tailings Management [35]. It is important to note that failure modes that may be credible in the short-term may not be credible in the long-term and vice versa.
While the list of failure modes in Appendix A for the various elements is extensive and reasonably comprehensive, it is recommended as a pre-list of failure modes as no list can be completely comprehensive as there are always additional site-specific hazards. The G-FMEA charts should be applied to a facility using the complete worksheet provided in Appendix B (Table A5).
4.1. Temporal Scales
It is essential that the FMEA for a closed tailings dam considers the element of time (i.e., how the dam evolves). Representing this is not straightforward and can be approached using different methods. The first method would be to complete a series of FMEAs for different points in time considering the different evolutionary processes that may occur. Ultimately, this adds a lot of complexity and may be prohibitively time-intensive. Another route, which is adopted here, is to complete immediate-term, short-term, medium-term, and long-term risk assessments using a risk matrix for each. The determination of the time frames requires consideration of what the overall time frame is for closure. An evaluation of this was carried using the following points: geological context, nuclear repository industry, Uranium Mill Tailings Remedial Action (UMTRA) surface project, the current databases that are relied on in the industry (often for less than 100 years), our ability to forecast the future, and transitions in periods of management.
For the long-term time period, time frames in excess of 10,000 years were deemed to be inappropriate in the mining industry as it is expected that glacial periods in time frames in excess of 10,000 years would change the geology and effectively bury the tailings facilities. The use of these time frames is perhaps better suited for systems such as nuclear waste repositories in tectonically inactive areas. With the consideration of this and the expectation for a tailings dam closure lasting 1000 years [5,36], the maximum time frame selected for the G-FMEA is 1000 years. This is also reflected by the UMTRA project where the facilities are designed to be effective for 1000 years where reasonably achievable with a minimum required performance of 200 years [37,38,39,40]. All risk assessments conducted for the 1000-year time frame should include a careful consideration of the uncertainties associated with the current databases, climate change predictions, and our ability to forecast the future.
The selection of appropriate time frames for the immediate-term, short-term, and medium-term risk assessment was completed with consideration of the phases of the tailings facility following closure. Initially, consideration was given to aligning the different risk assessments with the ‘active care’ and ‘passive care’ phases commonly used in industry. This was ultimately discarded as different organizations describe these phases in different ways, which may ultimately lead to confusion [41,42,43]. To mitigate this, the performance monitoring assessment periods recommended by the International Network for Acid Prevention (INAP) were selected. INAP outlines three specific assessment periods, including the adaptive management period, proactive management period, and reactive management period, which are outlined in Table 3 [44]. The primary difference between the assessment periods is the degree of direct management employed [44]. The focus on management, as opposed to the actions taken during the assessment period, is attractive from a safety management system perspective.
Based on the characteristics associated with the adaptive management period, the immediate-term risk assessment should occur during this phase. The short-term risk assessment may occur during the adaptive management period or the proactive management period, depending on site-specific characteristics.
The selection of a time frame for the medium-term risk assessment involved the consideration of the reactive management period and the time frames outlined by the UMTRA project. The medium-term risk assessment should fall within the reactive management period where direct management efforts (and monitoring) decrease substantially and the facility largely shows that it meets closure objectives. The recommendations for the time frames for the various levels of risk assessment are provided in Table 4. The approximate assessment periods provided are intended as a guideline only and should be based on site-specific considerations. It is expected that the immediate-term and short-term risk assessments would have the most active forms of risk mitigation employed with risk measures, slowly transitioning to more passive methods as the risk assessment moves to medium- and long-term temporal scales. It is also expected that the level of confidence will decrease as the risk assessment moves from immediate-term to long-term scales for some failure modes.
4.2. Risk Matrix Framework
The development of the risk matrix for the G-FMEA involves a consideration of the known pitfalls with risk matrices, as outlined in Table 1; recommendations for improvement from Baybutt and Duijm [25,31]; and the evaluation and consideration of other published risk matrices, including those provided by Brown, Hadjigeorgiou, the Guidelines for Mine Waste Dump and Stockpile Design, Mine Environment Neutral Drainage (MEND), and the Oil Sands Tailings Dam Committee (OSTDC) [17,18,43,45,46]. A number of key observations can be taken from the reviewed published risk matrices, including:
- Clear descriptions of likelihood and consequence ratings are essential. as provided by Griffin and MEND [17,46]. It is common for different risk matrices to use the terms ‘almost certain’, ‘likely’, and ‘possible’ but it is equally common for these to not be accompanied by clear definitions as shown in Brown and Hadjigeorgiou [18,45]. This is problematic as terms such as these are not universally understood to have the same meaning amongst practitioners [47]. This aligns with the critiques in Table 1.
- A level-of-confidence scale (or similar) is recommended to go along with the risk matrix and selected risk rating [17].
- OSTDC determines the consequence rating based on the loss of function of the structure, the degree of human intervention required on the structure after an event occurs, population at risk, and environmental economics [43]. In contrast, a risk matrix designed to assess the risk for an operational facility may consider elements such as health and safety, environment, community, reputation, and legal aspects when assessing the consequences of failure.
While the risk matrix developed by OSTDC provides the best analogue and a useful basis for this work, it cannot be applied directly to the G-FMEA, for the following reasons [43]:
- The G-FMEA presented in this research assesses the individual elements of a dam, not the dam as a whole, which is what the OSTDC [43] risk matrix was developed for. The developed risk matrix must be fit for purpose.
- The OSTDC risk matrix was developed to assess if a facility could be deregistered as a dam [43]. The consequence and likelihood ratings reflect this. In contrast, the risk matrix is used here to assess the risk of failure over time and if a closure plan is adequate to prevent failure to support a facility being deregistered as a dam.
The risk matrix framework is intended as an example of how a qualitative risk assessment method could be combined with the G-FMEA charts to assess a closure plan and includes a likelihood rating table, consequence rating table, and a risk matrix (including details on how to colour code the risk matrix and an example of a colour-coded matrix). The risk matrix to be used for a site should be defined by the industry, regulators, and other stakeholders with considerations of the technical, social, and economic aspects.
4.2.1. Likelihood Rating
The developed likelihood rating shown in Table 5 has seven different categories for likelihood from ‘Close to non-credible’ to ‘Almost certain’, which are defined with considerations of annual probabilities. Qualitative descriptors were developed to provide further context on the annual probabilities. The inclusion of seven likelihood categories is more extensive than many risk matrices, which commonly have five likelihood ratings. A more extensive likelihood rating list was selected due to the time frames associated with the closure and to aid in mitigating centering bias (Table 1). It also serves to cover the full range of likelihoods that may be encountered, which is an essential step to developing a likelihood table [25]. The risk matrix is intended to be applicable from the time that closure works have been completed to 1000 years following the completion of closure works. This means that the risk matrix is not intended to capture failure modes that may occur during the construction of the closure landscape. The risk matrix is also intended to be applied to orphaned facilities, which are defined as facilities with “owners that cannot be found or for which the owner is financially unable or unwilling to carry out the clean up” [48]. These facilities should not be confused with those that undergo abandonment as per the Alberta Dam and Canal Safety Directive [4]. It could be argued that the categories of ‘Almost certain’ and ‘Likely’ should not be applied to a closure scenario as the assumption is that the facility is designed to a standard such that the failure of an element will not occur within a year. While this may be true for many facilities, it is unlikely to be true for all facilities (i.e., orphaned facilities). Furthermore, some failure modes may become more likely when conducting a long-term risk assessment as factors such as degradation and climate change occur. The likelihood of occurrence is often described in terms of the probability of failure. While this is an important way of evaluating the likelihood, it is valuable to describe the likelihood categories using qualitative descriptors to anchor the probabilities [25]. Further, humans are notoriously poor at estimating the probability of extreme events [49]. As such, providing qualitative guidance for assessing the likelihood of a failure mode would be useful. Table 5 describes the likelihood categories in terms of the annualized probability and provides a qualitative interpretation. The quantitative interpretation guidance for the example risk matrix considers that each rating is a range of probabilities. Anchor values can also be adopted, if preferred, as long as it is clear to the users that the anchor values are a point approximation of this range of probabilities.
4.2.2. Consequence Rating
The consequence rating shown in Table 6 has five categories that range from ‘Slight’ to ‘Severe’. The consequence rating is selected based on:
- The degree of the consequence of failure of an element on the rest of the system.
- ○
- This involves an assessment regarding if the failure will result in cascading consequences to other elements.
- The degree of human intervention (post failure) required.
- ○
- It is important to note the degree of human intervention required in response to a failure as the ultimate goal is to reach a state of minimal or no human intervention. In cases where this is not possible, this may suggest a careful evaluation of the custodial transfer scenario for that facility.
- Community.
- ○
- The impact on the community should be assessed using input from the relevant stakeholders. This is difficult to evaluate in light of the time frames associated with closure. Our ability to predict downstream and upstream populations in the future is limited by our short-term knowledge; however, a consideration can be made of the likelihood that the affected area could be inhabited in the future (i.e., is the mine located in inhospitable terrain or in an area that is desirable for development?). This would allow baseline assumptions to be made about the future community impact. A key step to defining the impact on a community is identifying the community. As defined by the Impact and Benefit Agreement (IBA) Community Toolkit [50], this involves answering the questions: “Who is the community? How is the geographic, ethnic, or scope of community defined? Who legitimately represents the community? Is it simply representatives from local community organizations, or is it necessary to reach out to more diverse groups to ensure all elements are consulted? The definition of “community” should be inclusive enough to promote equity and avoid future conflict resulting from lack of inclusion” [50]. The community consequence rating provided in Table 6 is provided as a guideline only and requires input from the relevant stakeholders to explicitly define the community impact. This should be accomplished using a meaningful engagement as defined by the Global Tailings Standard [35]. Defining the consequence rating for the community may involve a consideration of health (including fatalities), loss of access/destruction of traditional lands, housing, destruction/damage of farmland, harm to livestock, damage to water or soil resources, impacts to trapping and fishing, the loss of animals, overall cultural impact, and employment. It is critical that the impact on all valued components (and their condition following a failure) to the relevant stakeholders are considered. A valued component is that which is considered important by the community [50]. It should be noted that Impact and Benefit Agreements developed between the mining companies and Aboriginal communities may include agreement provisions to account for catastrophic failures and losses and should be consulted when assessing the consequences of a dam failure to the community [50].
- Environment.
- ○
- The environmental impact must be assessed with a consideration of the impacted land (both surrounding the facility and in the facility itself, with respect to its post mining land use) and waterbodies and the toxicity of the tailings. The Canadian Dam Association (CDA) developed a Working Group to revamp their environmental classification system, noting that the existing system lacked a clear scientific basis and used vague criteria that was open to interpretation based on personal beliefs and principles [51]. Nikl et al. provides a summary of the draft environmental consequence classification system [51]. The framework considers three variables: ecological impact, the intrinsic hazards of contents, and the duration of the impact, to determine the consequence category (low, significant, high, and very high) using a matrix and dial combination method approach [51]. The consequence classification is intended to assess the environmental consequences from a global tailings dam failure (i.e., ultimate failure in this case). In contrast, the risk matrix and G-FMEA is intended to assess the failure modes of individual elements; however, the principles and concepts from Nikl et al. can still be used to support the environmental consequence category [51]. As such, the methodology used by Nikl et al. is adapted to fit within the consequence rating framework [51]. The goal of a closure plan is for the facility to remain safe and sustain a particular land use. Consequently, the environment category should be assessed with a consideration of the impact on the post mining land use, in addition to the surrounding environment. It is recognized that post mining land uses may change over time as the closure plan develops [52]. As the agreed post-mining land use changes, hazards should be re-evaluated. The most serious consequence associated with the post mining land use is when the promised land use is destroyed leaving the land sterilized. In such a situation, the facility may be fenced off to prevent all access to the site. This situation may also lead to downstream effects where additional land is sterilized. Ultimately, this would yield a severe consequence rating.
Fatalities were included in the consequence rating table in the ‘Severe’ consequence rating in the community column. The inclusion of fatalities in risk decisions can be a contentious issue as various stakeholders may have different risk tolerances for fatalities, especially with regard to voluntary versus involuntary risks. It could be argued that fatalities should be included throughout the risk matrix. For example, one fatality could classify a moderate risk rating, 10–100 fatalities could classify a major risk rating, and greater than 100 fatalities could classify a severe risk rating. Including fatalities only in the ‘Severe’ consequence rating is out of step with the risk tolerances for other industries and fails to reflect the reality that multiple-fatality events are more consequential than single-fatality events (e.g., road vs. air accidents). However, this goes against the Global Industry Standard on Tailings Management, which has a goal of zero harm to people and the environment with zero tolerance for human fatalities [35]. Considering this and the overall goals of the closure design, the current consequence rating table classifies one fatality as ‘Severe’. This may be adapted through a meaningful engagement with stakeholders, if appropriate.
The approximate time frames for the environment and community categories are provided: short-term (<5 years), medium-term (5–25 years), and long-term (>25 years). These time frames are intended as guidance and may be amended with the input of stakeholders. Depending on the risk tolerance of the stakeholders, it may be necessary to reduce these time frames.
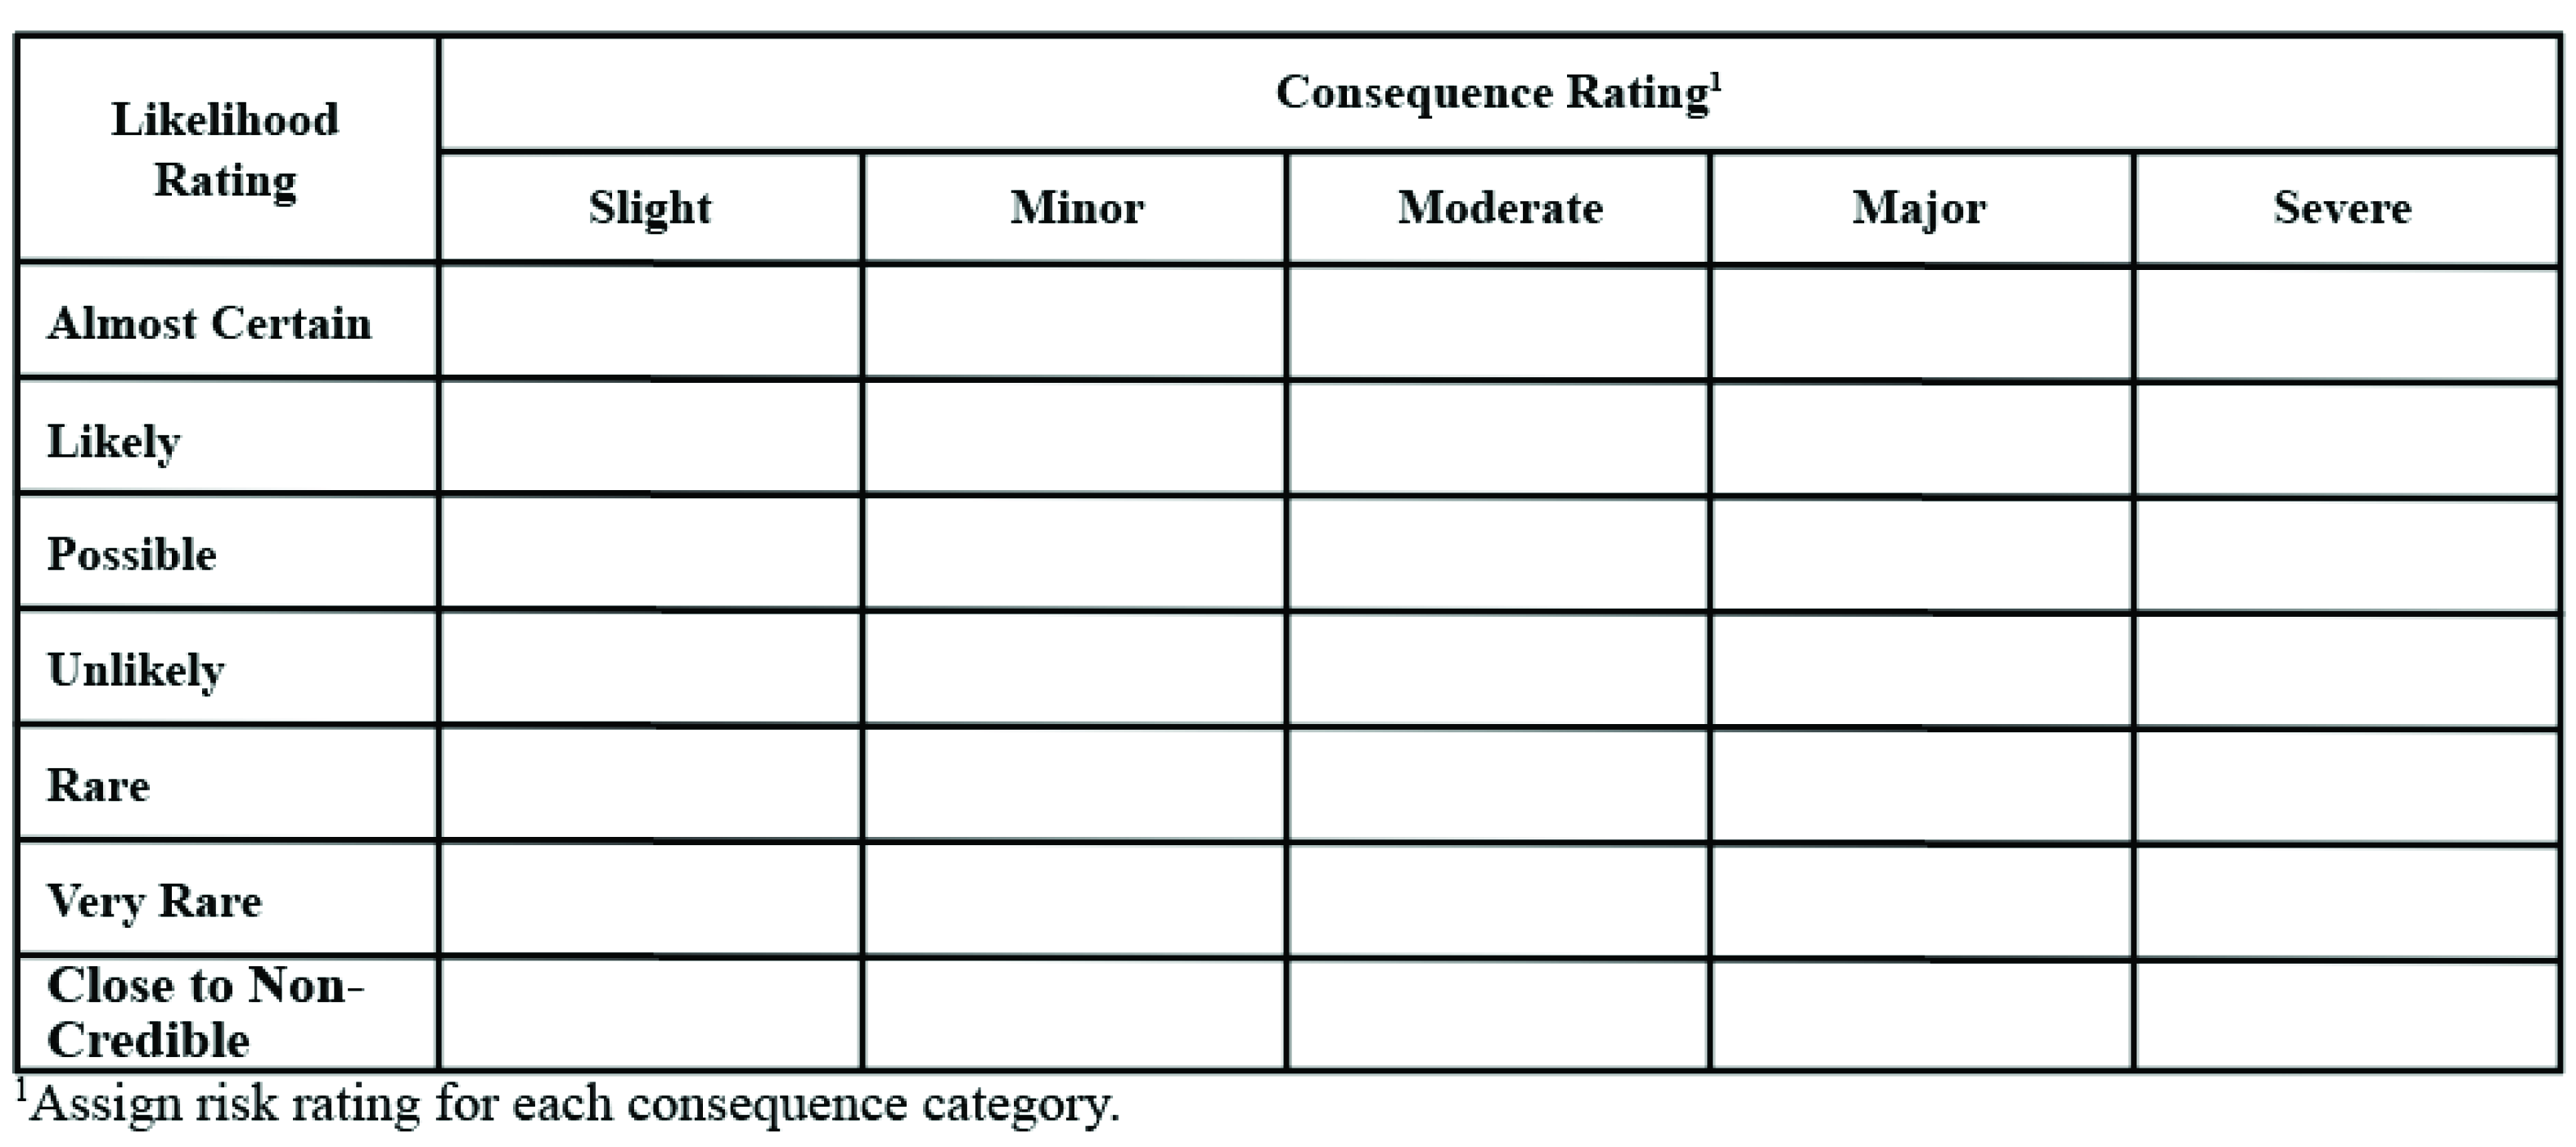
4.2.3. Risk Matrix and Rating
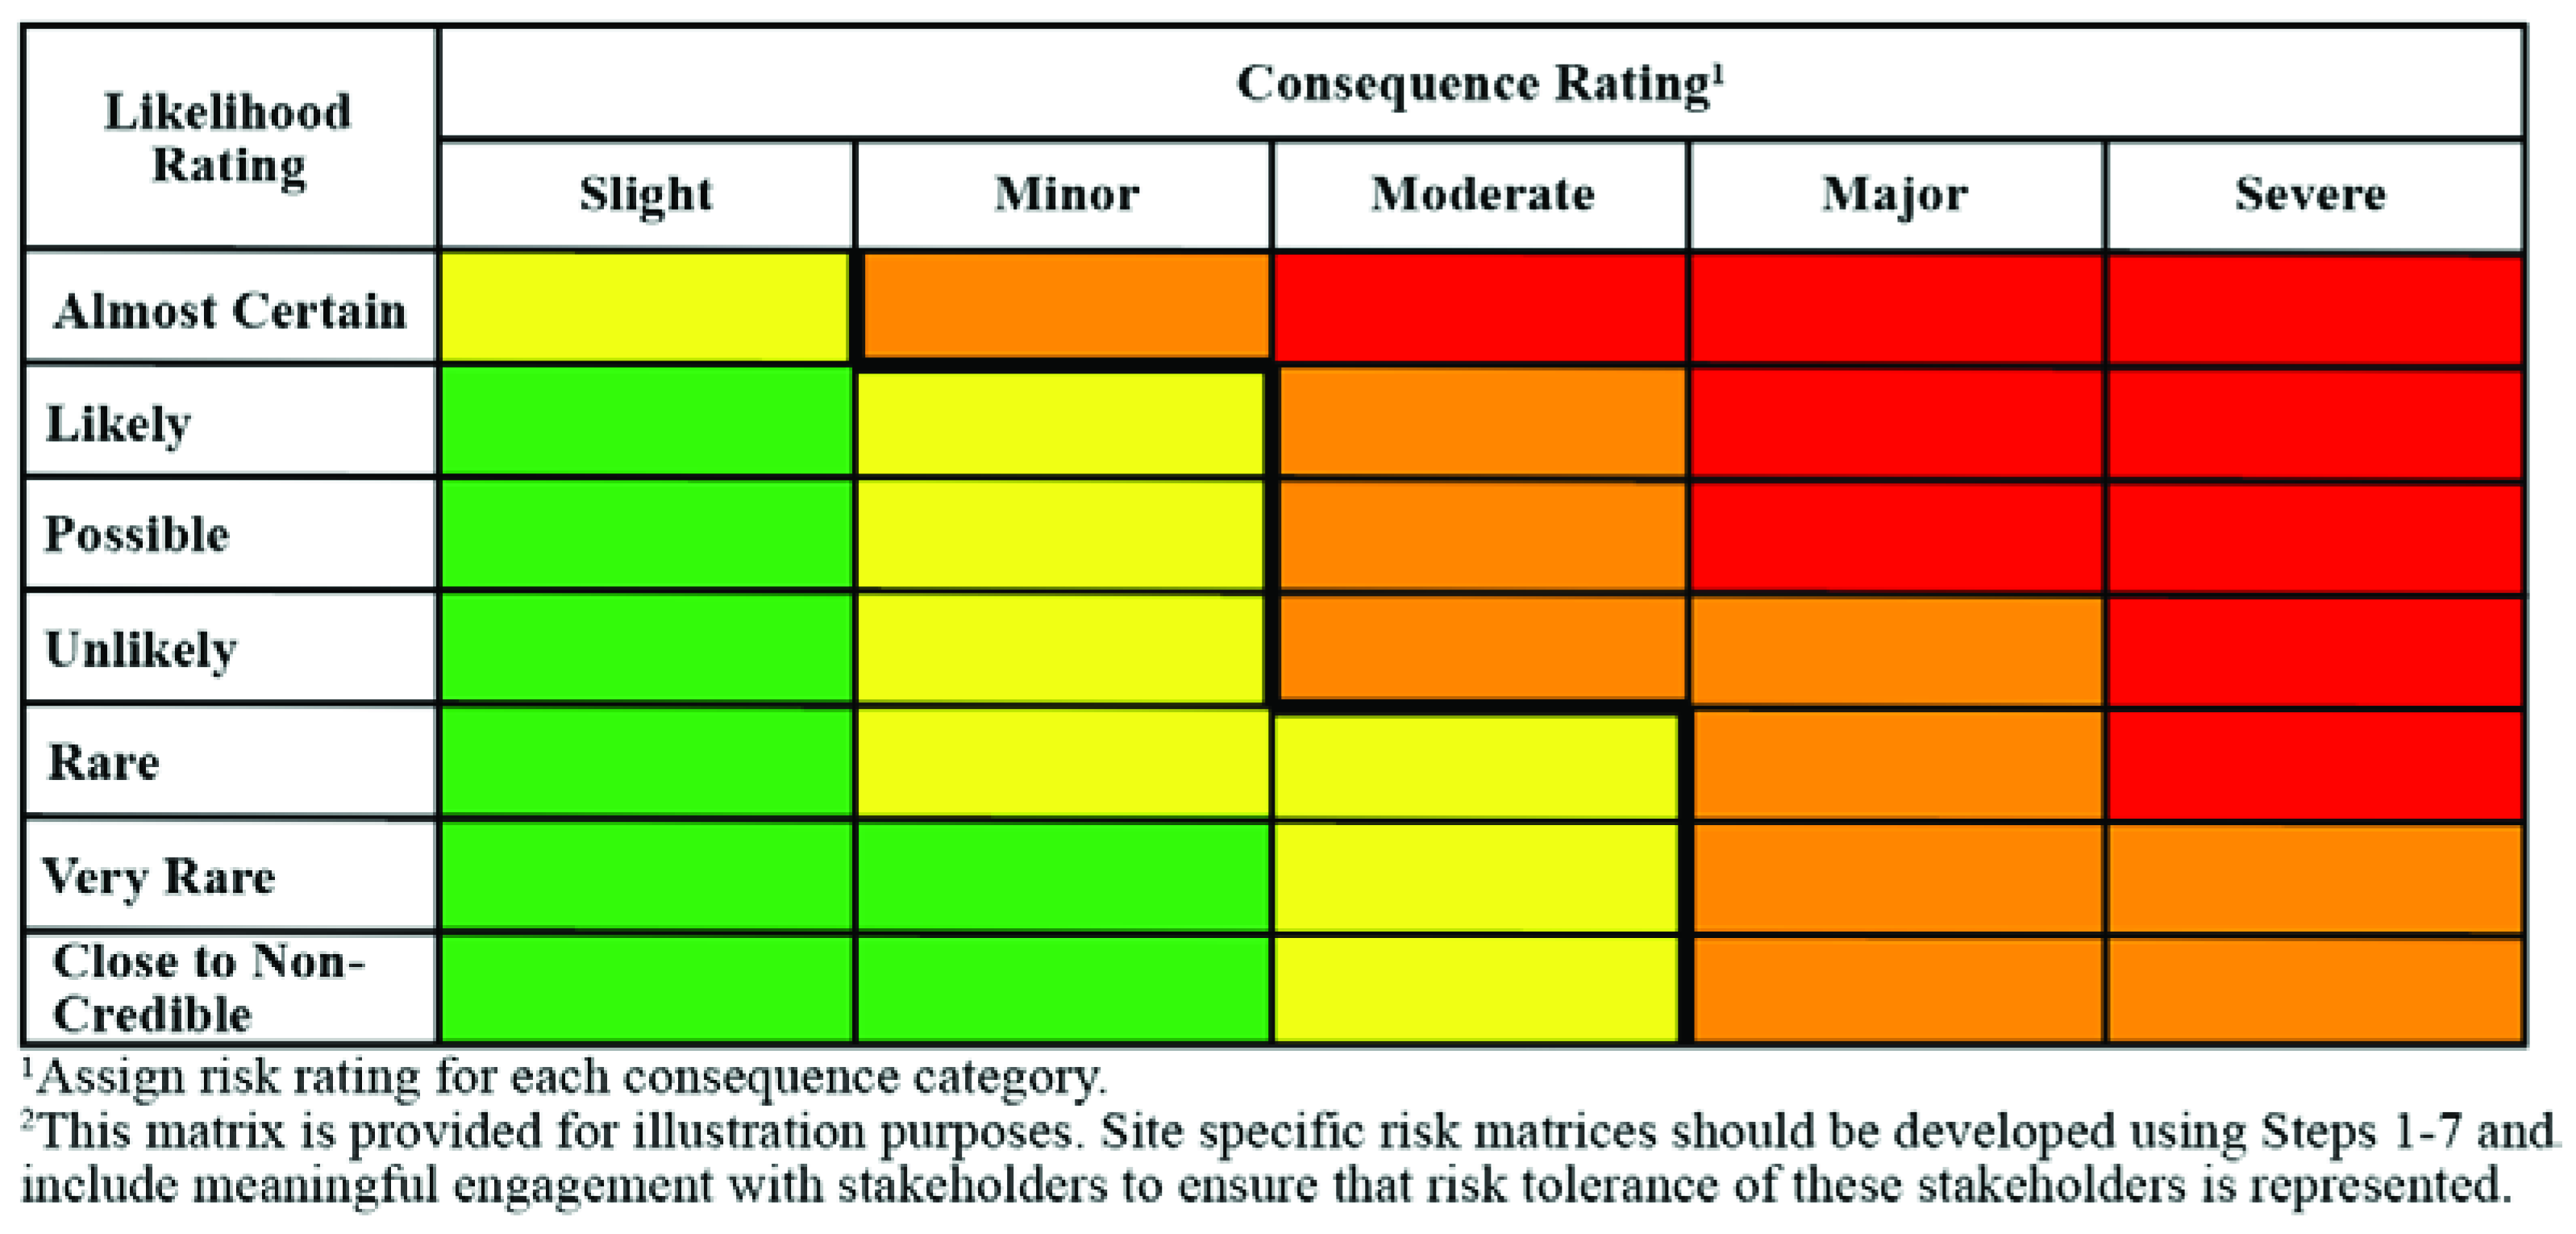
The seven likelihood ratings and five consequence ratings can be combined to form a risk matrix, as shown in Figure 4. The challenging part of finalizing the risk matrix lies in determining the assigned risk category for a given likelihood and consequence rating. The risk categories for the G-FMEA are presented in Table 7. The risk categories were developed with the consideration of the suitability of the closure design to prevent failure such that a facility could be deregistered as a dam. This resulted in four risk categories from ‘Low’ to ‘Extreme’. As the risk category increases, the level of the required risk mitigation increases as the closure plan is assessed as being inappropriate in preventing serviceability failure of a particular element.
It is common practice for risks to be managed using the ALARP principle: As Low As Reasonably Practicable (ALARP). In ALARP, all risk reduction measures should be employed as long as the cost of implementing them is reasonably practicable with a consideration of cost effectiveness [53]. In Table 7, the high-risk category is defined with consideration of the principle of ALARP. In the high-risk category, the risks are undesirable and must be reduced using ALARP. If the risk category cannot be reduced using ALARP, the closure plan should be altered to accommodate risk mitigation.
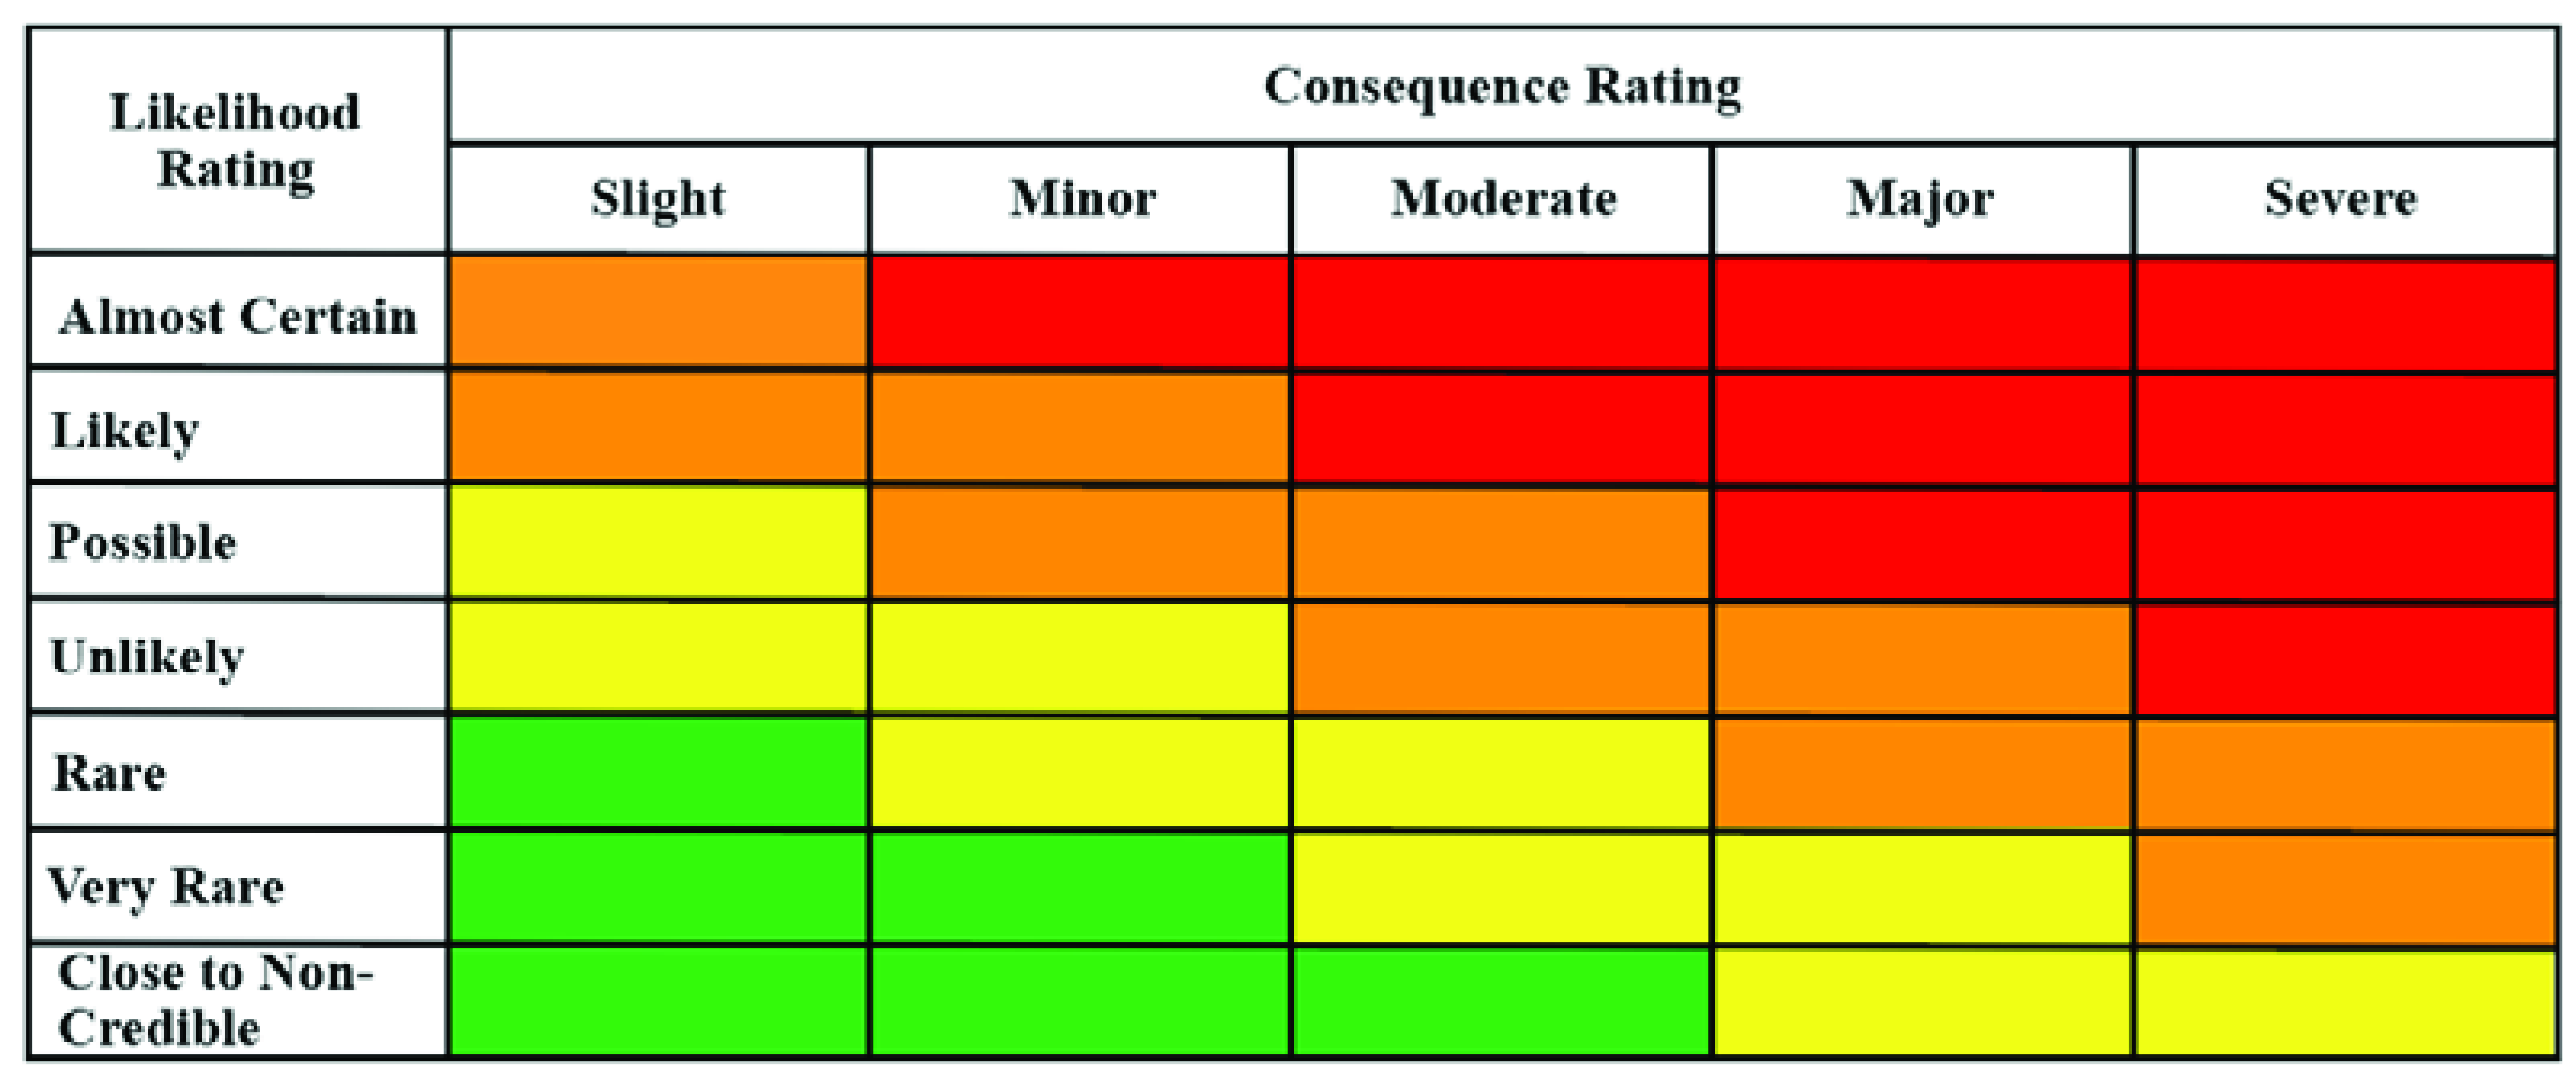
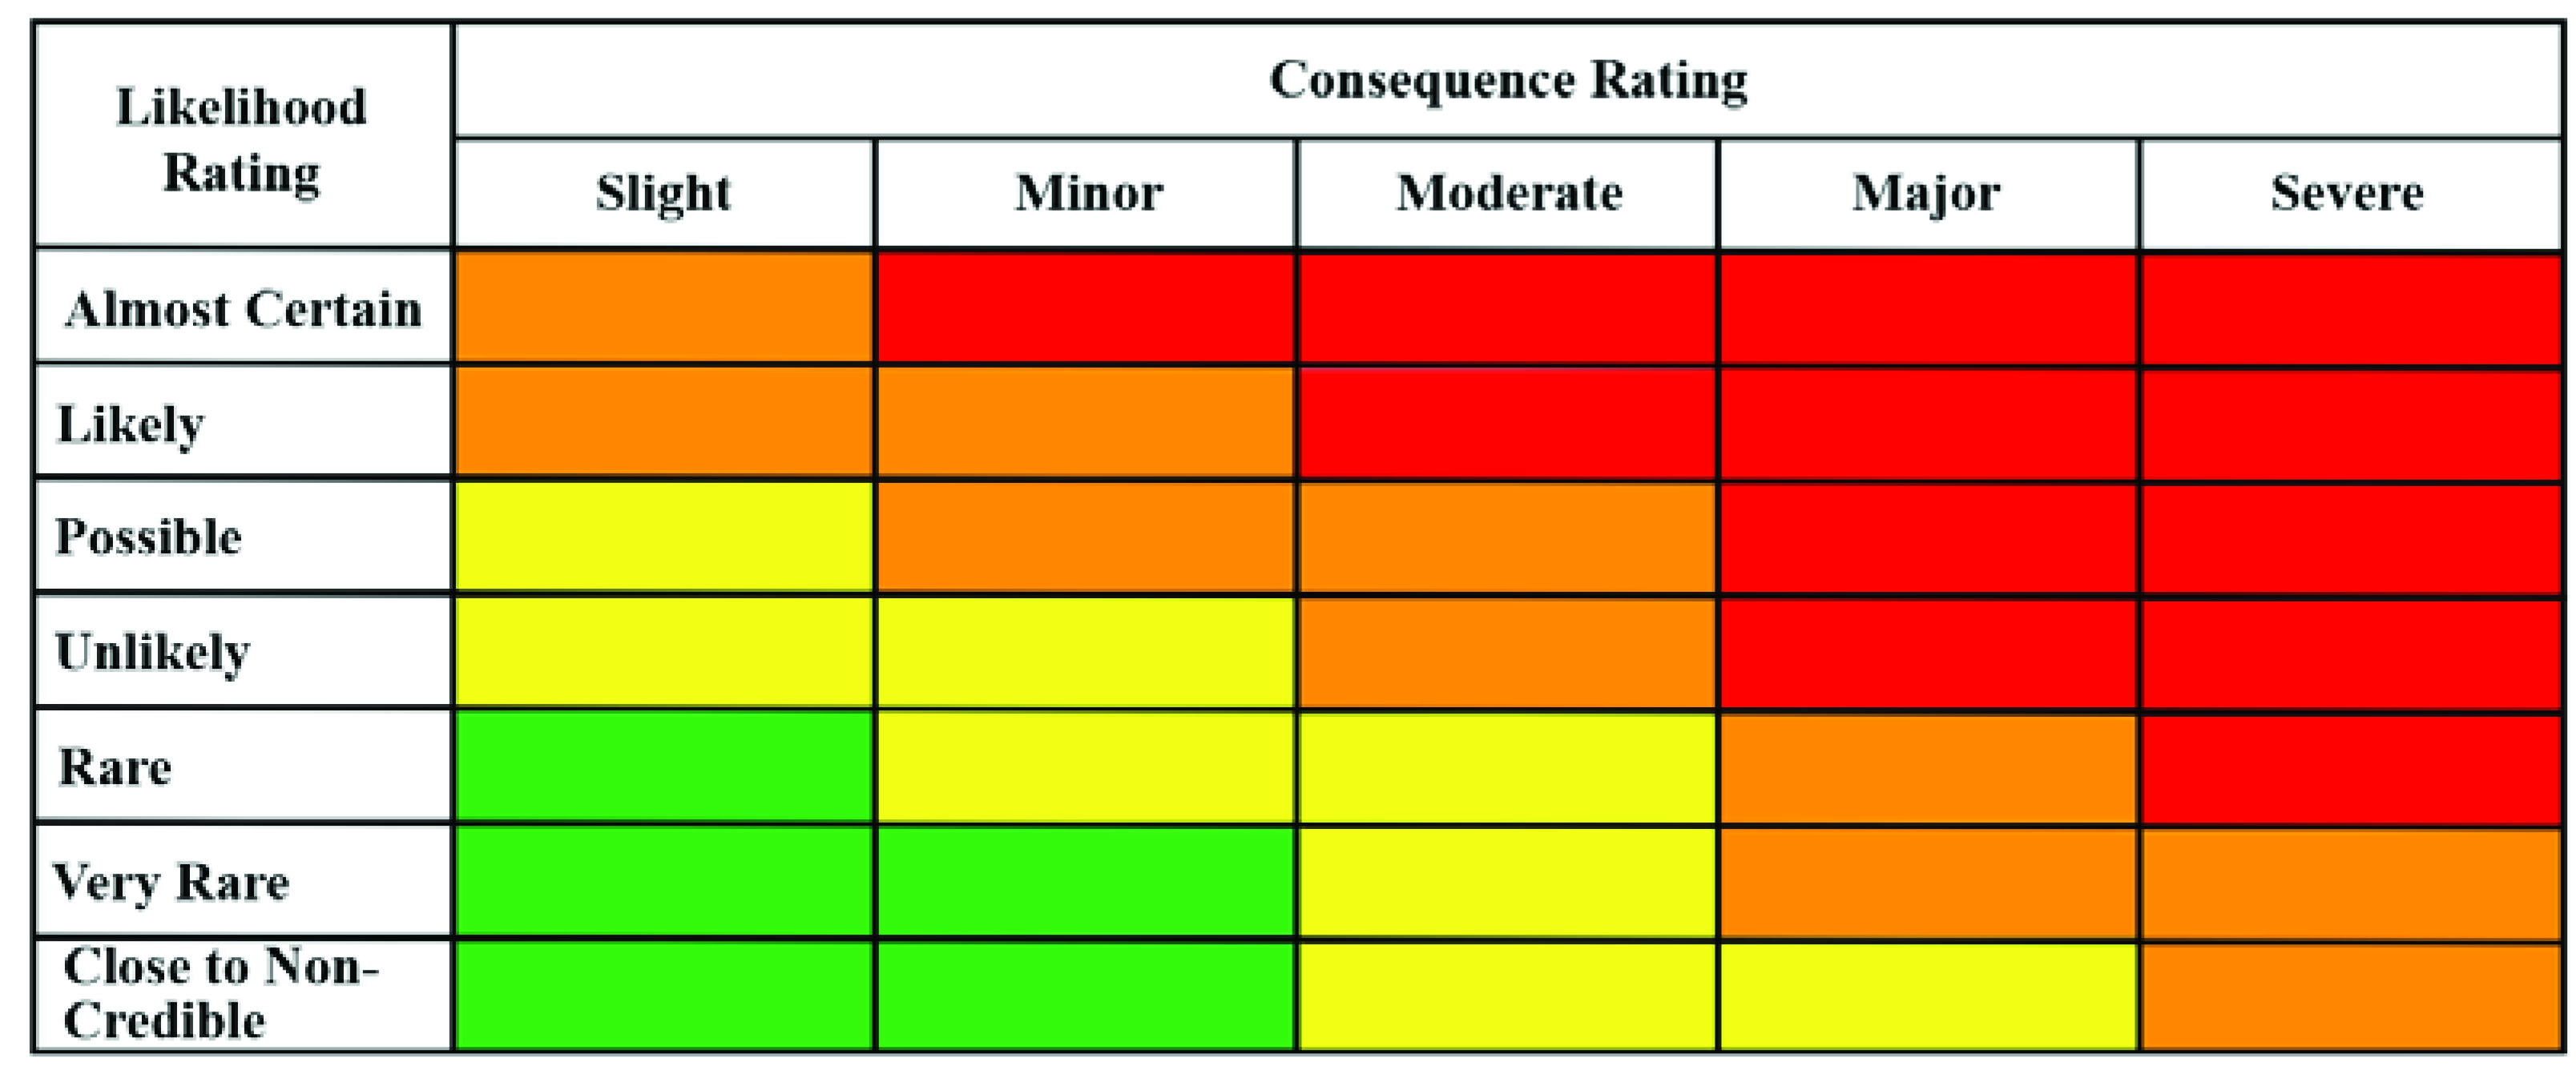
Once the risk categories are developed, they can be applied to the risk matrix to develop a colour-coded ‘heat map’ based on the combination of the likelihood rating and consequence rating. The risk matrix is not colour-coded or populated with risk ratings as this defines risk tolerance. This step should be completed with the input of all relevant stakeholders (i.e., industry, regulator, the public). However, an example of the colour-coded risk matrix is provided in Figure 5. The colour-coded matrix presented in Figure 5 demonstrates major hazard aversion and presents a threshold line that is suggested to be used to trigger a more detailed quantitative analysis. The framework for attaining the colour-coded matrix is provided in this section.
Minimal guidance is provided in the literature on how to colour code a risk matrix. Ayyub indicates that colour coding a risk matrix involves shading each box depending on a “subjectively assessed risk level” [8]. IEC provides more guidance on assigning risk categories to the risk matrix, indicating that assigning risk categories should depend on the definitions of the likelihood and consequence tables [23]. Using these definitions, the risk matrix can have risk categories assigned to provide extra weight to the consequences or likelihoods, or it may be symmetrical [23]. Oboni suggests that a risk matrix cannot be symmetrical as this typically indicates an incorrect prioritization of risks [54]. Risk matrices should be coloured with consideration of what the cells tell the user.
The developed risk matrix for this research helps to assess if the risks associated with decommissioning an ETF are acceptable or where/if a more detailed analysis is required, and could be applied throughout a tailings facility’s life. In light of this, an alternative way to use the developed risk matrix is to work with a “threshold”. Any hazard categorized with a risk higher than the defined threshold (orange in Figure 5) requires a more detailed quantitative risk assessment method, which may require a more in-depth investigation, design, or modelling to be completed. This is an important step to aid in mitigating issues associated with upper severity limits [25].
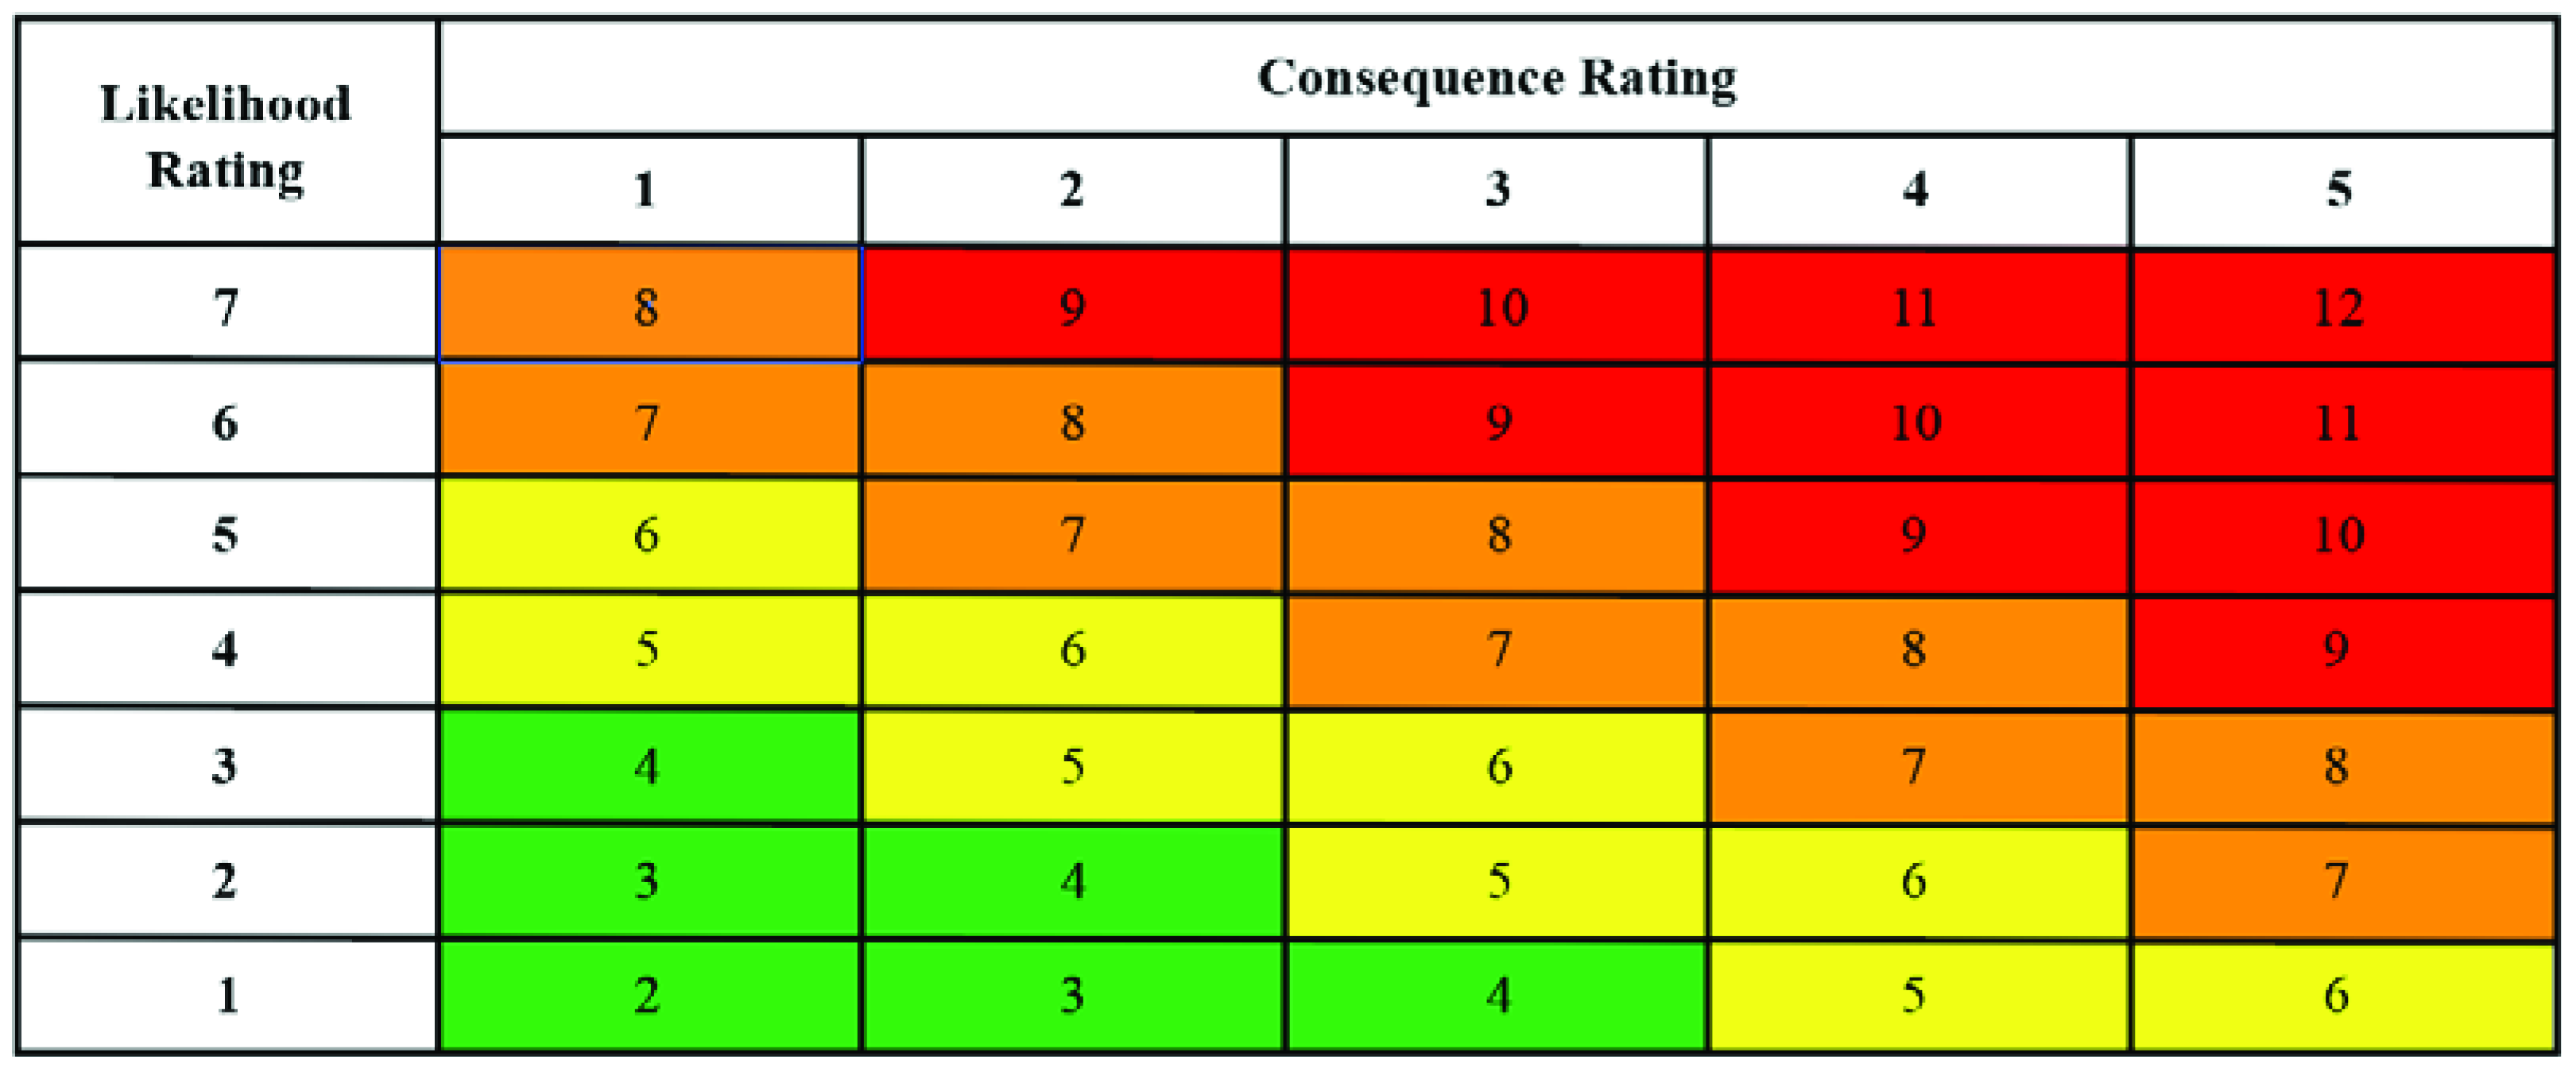
The framework for developing the example risk matrix was developed with a consideration of the tool being used as a screening method; guidance provided by Baybutt [25], Duijm [31], and Levine [29]; and a consideration of the known pitfalls that can be associated with risk matrices, as discussed in Table 1. The development of the example risk matrix in Figure 5 was accomplished using the following steps, and may be used as guidance for colour coding the risk matrix for a specific site (see Figure 4). Appendix C shows how Figure 5 was developed using the following steps.
- Develop iso-contours of equal risk based on the estimated quantitative consequence measure and the provided likelihoods (Likelihood = Risk/Consequence). Assuming that the consequence quantitative measure is an order of magnitude between categories, the consequence and likelihood iso-contours should be plotted in log-log space. Plot the iso-contours on the risk matrix. Assign the risk categories to the iso-contours of equal risk and use these to develop an initial colour-coded risk matrix. This step serves as a starting point for colour coding the risk matrix. Any available known acceptance criteria can be used as an initial starting point for this exercise. Decisions will need to be made about the cells that have an iso-contour cutting through them (i.e., do you assign the higher or lower risk category?). This exercise demonstrates a known issue with risk matrices where risk is represented as categorical, rather than on a continuum, and hazards are binned into these categories.
- A note from Baybutt [25]: When consequences and likelihood categories differ by orders of magnitude, they are represented in log-log space. Practically, this means that high consequence-low likelihood events (negatively correlated) have the most uncertain risks in these type of rating schemes. This is especially problematic as these events already have a lot of inherent uncertainty. Ultimately, it is not possible to increase the precision of these events on a risk matrix. This concept of uncertainty related to these types of events supports the idea of using a threshold value on the risk matrix to trigger more extensive risk analysis.
- Assess the initial colour-coded risk matrix against the Cox axioms for a well-defined risk matrix [19]. This step is simply a logical ‘check’. Duijm recommends that a key to using the risk matrix is to recognize that the colouring of the risk matrix is a risk definition in its own right (and cannot be separately and stringently defined as Risk = probability × consequence) as it expresses a subjective risk perception (i.e., major hazard aversion), which is an important element of risk decisions [31]. Duijm notes that, when no reference is made to an external risk definition, then “the colouring of the matrix itself is the only relevant risk definition, then the axioms of weak consistency and consistent colouring are trivial” [31]. If a quantitative definition of risk is desired by stakeholders, then the Cox axioms should be satisfied [19]. Cox axioms can be summarized as [19]:
- Weak consistency, where each hazard in the red category represents a higher risk than the hazards in the green category.
- Betweenness, where every positively sloped line segment that starts in a green cell and ends in a red cell must pass through an intermediate risk category.
- Consistent colouring, where hazards with an approximately equal risk have the same colour.
- Assess if the Levine lettering scheme is more appropriate for your risk analysis goals [29]. In the study by Levine, logarithmic axes are used for the consequence and likelihood axes [29]. Straight line iso-contours of equal risk are drawn. Instead of using colours, the different areas are labelled A, B, C, D, E, F, and G (each line represents a new letter). This method results in a matrix that is somewhat unintuitive, but this prevents risk matrix users from making assumptions about the risks based on the colouring scheme. When a risk matrix is constructed in this manner, the following conclusions can be drawn:
- Risks in one letter category can only be distinguished from risks in another category if they are more than one letter apart (i.e., C > A, D > B).
- Risks in categories that are zero or one letter apart are not able to be distinguished from one another (i.e., it is not known if C > B or B > C).
- As noted by Duijm, another way to develop risk scores and colouring is by using basic arithmetic (multiplication and addition) based on ordinal numbers assigned to each consequence and probability category [31]. When the categories are essentially linearly spaced, then the multiplication of the ordinal numbers is an appropriate way of defining the risk score. When the categories are essentially logarithmically spaced, the addition of the ordinal numbers is desired. Apply the appropriate mathematical operations and compare to the risk matrix developed in Step 3.
- Assess if major hazard aversion is required and apply as necessary. Hazard aversion is the concept of low-probability–high-consequence events being assigned a higher risk than a high-probability–low-consequence event, even if the expected loss is mathematically the same [31]. This concept is used in scenarios where low-probability–high-consequence events are of greater concern and may require different decisions [25].
- Conduct “logic checks” by stress testing the risk matrix with different scenarios. Focus on what the risk matrix is telling the user. Adjust the colour scheme as needed and repeat. This is an important step as the risk matrix may be developed using one quantitative measure. As such, it must be assessed to determine if it is applicable across the different consequence categories.
4.2.4. Limitations of the Risk Matrix Framework
As noted in Table 1, a common issue related to risk matrices is their inability to aggregate risks, both in general and from multiple consequence categories. With regard to aggregating risks, as noted by IEC “one cannot define that a particular number of low risks or a low risk identified a particular number of times is equivalent to a medium risk” [23]. This is an important limitation of risk matrices, and one that risk users must be cognizant of. Therefore, sound engineering judgement is required for evaluating the results of the matrix where multiple low-risk failure modes are present. Once the assessment is complete, a careful evaluation of the results must be completed. All hazards that receive a risk rating of red or orange need to undergo further analyses and may need additional controls. If a scenario occurs where all the hazards are green (or green and yellow), the organization should evaluate if the aggregation of them represents an intolerable risk. In that case, the quantified descriptions in the likelihood matrix can help with the aggregation of likelihood.
Next, it is common practice for a hazard to be assigned a risk level based on the most severe consequence. Caution should be employed with this practice, and if practitioners choose to use this methodology, it must be clearly declared. Instead, it is recommended that risk ratings are assigned for each consequence category (i.e., consequence of failure of an element on the rest of the system, degree of human intervention required, environment, and community). This is largely due to the inability of risk matrices to aggregate the risk from multiple consequence dimensions, meaning that the consequences should not be directly compared (as noted in Table 1). Therefore, a careful consideration is needed when determining a final risk rating for the hazard.
One final issue that must be addressed is related to the correlated risk. The G-FMEA involves breaking the system down into its individual components. It is possible that one hazard may become a trigger for another hazard. Risk matrix users must be aware of the correlated risks and note them explicitly in the reporting of results, along with how they were considered in the study.
Given the time frames associated with closure, it is recommended that a level of confidence regarding the risk estimates is provided. There are uncertainties associated with assessing the likelihood and consequence ratings, which may be associated with a lack of data, lack of system understanding, uncertain future operating conditions or uncertain maintenance, and regional development post closure [9]. As the time frames associated with the G-FMEA may extend to 1000 years, it is expected that the level of confidence may decrease as the temporal scale increases. A level of confidence framework is currently being developed at the University of Alberta to accompany the G-FMEA.
5. Summary and Conclusions
Tailings dams can pose a significant risk to the public and the environment following closure. To prevent the failure of these large structures after mining, their long-term behavior must be understood and incorporated into the closure design, ideally from the conception of the project and initial design. Challenges lie in the limited information available regarding how these structures age over time and the forecasting, loading, and environmental scenarios over long-term periods (weather events, seismicity, human activity, etc.). A G-FMEA framework was developed to aid in assessing the potential success of a tailings dam closure strategy for external tailings facilities in Alberta, Canada. The goal of the G-FMEA was to reduce the future risk of geotechnical failure on the environment and the public to a degree that is both practical and economical. The G-FMEA can be used to assess the closure risks at the onset of mining if adopted early in the design process, which allows meaningful changes to be made to reduce the long-term risks from operational design decisions and ultimately support the goal of deregistration. In many cases, this is not possible as the tailings facility may be further into its life cycle (as is the case at many Alberta tailings facilities).
While this geotechnical risk management tool was developed with Alberta in mind, it does have global significance and could be easily adapted to other jurisdictions or organizations (i.e., to account for the different types of mines present in other parts of Canada or the world). Furthermore, the G-FMEA may be adapted for in-pit facilities with perimeter dykes (as desired) by updating the G-FMEA tables to account for failure modes applicable to these types of facilities. The current G-FMEA tables were developed with a consideration of external tailings facilities at oil sands and coal mines in Alberta. Differences in physiographic regions, seismic regions, expected climate change, etc., could lead to other failure modes that should be included in the G-FMEA tables.
The G-FMEA requires that the dam be broken down into the individual elements. Each element should be analyzed using the G-FMEA framework, which includes four individual charts for the drainage system, foundation, dam body, and landform. The G-FMEA is accompanied by a developed risk matrix, including a likelihood rating table, consequence rating table, and final risk matrix. The risk matrix framework is intended as an example of how a qualitative risk assessment method could be combined with the G-FMEA charts to assess a closure plan. It is recommended that the risk matrix to be used for a site should be defined by industry and regulators with considerations of technical, social, and economic aspects. Guidelines are provided on how to colour code the risk matrix. It is recommended that the risk matrix be accompanied by a level of confidence rating, which is currently being developed at the University of Alberta.
This risk management tool is timely and necessary in Alberta as many tailings facilities approach closure. It provides a systematic method for assessing the post closure risks associated with tailings facilities, so that they can be managed, and, ultimately, aims to develop actionable tools consistent with the Global Industry Standard on Tailings Management. The G-FMEA framework aids in satisfying the risk management requirements required by the Alberta Energy Regulator for the closure of a tailings dam to support these facilities being deregistered as dams.
Author Contributions
Development of G-FMEA framework, including the G-FMEA tables, and risk matrix methodology, H.L.S.; writing—original draft preparation, H.L.S.; writing—review and editing, N.A.B. and R.M.; project administration, N.A.B.; supervision, N.A.B. and R.M. All authors have read and agreed to the published version of the manuscript.
Funding
This research was funded by the Vanier Banting Secretariat and the Alberta Energy Regulator (Service Agreement: 17SA-OP010).
Data Availability Statement
Not applicable.
Acknowledgments
The authors would like to thank Tim Eaton (Alberta Energy Regulator), Scott Martens (Canadian Natural Resources Ltd.), and Gord McKenna (McKenna Geotechnical Inc.) for their ongoing support throughout this research.
Conflicts of Interest
The authors declare no conflict of interest. The funders had no role in the design of the study; in the collection, analyses, or interpretation of data; in the writing of the manuscript, or in the decision to publish the results.
Appendix A. G-FMEA Charts

Table A1.
Drain FMEA.
| Element | Failure Mode Description | Potential Trigger/Cause | Screening Assessment of Failure Mode | Failure Effects |
|---|---|---|---|---|
| Perimeter ditch | Blockage (partial or full) | Sedimentation, sloughing/slope failure of walls, beaver dam, continuous build up of ice (icing) | Is there erosion protection in place? What is the slope of the ditch? Is it sufficient to keep particles suspended? What is the slope of the side slopes? What is the strength of the material? Have there been failures in this material before? Are there beavers in the area? Is the mine located in an area that could experience icing? | Rise in phreatic surface, increase in seepage, pond on reclamation surface, internal erosion, global instability, flooding, blockage of drain outlets, toe erosion, discharge of process affected water to the environment |
| Reduction in cross-sectional area | Sloughing/slope failure of walls, excessive vegetation | What is the slope of the side slopes? What is the strength of the material? Have there been failures in this material before? Will the ditch regularly have water running through it or will it stay dry for a portion of the year? Are there deterrents in place to prevent the growth of vegetation? | Rise in phreatic surface, increase in seepage, pond on reclamation surface, internal erosion, global instability, reduced capacity, erosion, potential flooding, blockage of drain outlets, toe erosion, discharge of process affected water to the environment | |
| Change in slope | Erosion, differential settlement | Is there erosion protection in place? Does the material have the potential to consolidate or settle over time? Is it a cut into natural ground or is the material placed? | Change to water discharge velocity, creation of secondary channels, localized areas of erosion, instability of dam | |
| Sand channel buoyancy | Freezing conditions in channels composed of sand | Are the drainage channels constructed of sand? Could the channel experience freezing? | Rise in phreatic surface, increase in seepage, pond on reclamation surface, internal erosion, global instability, reduced capacity, erosion, potential flooding, blockage of drain outlets, toe erosion, discharge of process affected water to the environment | |
| Pipes (perforated and non perforated) | Breakage of pipe | Break in pipe, buckling, physical degradation | Is the pipe capable of breaking, buckling, and/or physically degrading over time? | Lack of control of phreatic surface (potential rise in phreatic surface), increase in seepage, pond on reclamation surface, internal erosion, global instability, release of water into downstream shell, erosion on downstream slope |
| Pipe clogging | Biological, chemical, particulate clogging | Is chemical, biological, or sediment clogging possible? | Lack of control of phreatic surface (potential rise in phreatic surface), increase in seepage, pond on reclamation surface, internal erosion, global instability, release of water into downstream shell, erosion on downstream slope | |
| Clogging surround (woven sock or sand and gravel bed) | Biological, chemical, or particulate clogging | Is it possible for the material surrounding the pipe to become clogged? | Lack of control of phreatic surface (potential rise in phreatic surface), increase in seepage, pond on reclamation surface, internal erosion, global instability, release of water into downstream shell, erosion on downstream slope | |
| Blockage at outlet | Blockage from perimeter channel or other (snow, debris, etc.) | Is the pipe outlet close enough to the base of the perimeter channel that it could become blocked? | Lack of control of phreatic surface (potential rise in phreatic surface), increase in seepage, pond on reclamation surface, internal erosion, global instability | |
| Breakage of connection between a drain and outlet pipe | Overloading, degradation of connection, poor installation | How are the drain and outtake connected? | Lack of control of phreatic surface (potential rise in phreatic surface), increase in seepage, pond on reclamation surface, internal erosion, global instability, release of water into downstream shell, erosion on downstream slope | |
| Granular materials | Erosion from flowing water | Increase in seepage gradients, development of preferential flow paths adjacent to drain (i.e., burrowing from animals, cracks) | Could cracks develop along drains? Is the site known for having issues with burrowing animals? Is the material erodible? | Decreased capacity of drain resulting in failure, lack of control of phreatic surface (potential rise in phreatic surface), increase in seepage, pond on reclamation surface, internal erosion, global instability, erosion on downstream slope |
| Clogging | Biological, chemical, particulate clogging | Is chemical, biological, or sediment clogging possible? What is the grain size distribution? | Lack of control of phreatic surface (potential rise in phreatic surface), increase in seepage, pond on reclamation surface, internal erosion, global instability, release of water into downstream shell, erosion on downstream slope | |
| Failure to meet drain criteria | Change in material properties, including permeability due to aging, change in gradation due to movement with seepage, weathering/degradation | To what extent is aging and weathering/degradation of the material possible? | Lack of control of phreatic surface (potential rise in phreatic surface), increase in seepage, pond on reclamation surface, internal erosion, global instability, release of water into downstream shell, erosion on downstream slope | |
| Obstruction of drainage at outlet | Snow and ice blocking outlet | Will an obstruction prevent the drain from performing as intended? Is the outlet protected from a blockage? | Lack of control of phreatic surface (potential rise in phreatic surface), increase in seepage, pond on reclamation surface, internal erosion, global instability, release of water into downstream shell, erosion on downstream slope | |
| Deformation leading to reduction in drain capacity | Slow and continuous deformation under long-lasting shear and pressure forces from consolidation of overlying material | How much deformation is expected over time as the materials above the drain consolidate and settle? Has the impact on the drain been considered? | Lack of control of phreatic surface (potential rise in phreatic surface), increase in seepage, pond on reclamation surface, internal erosion, global instability, release of water into downstream shell, erosion on downstream slope | |
| Crushing/breakage of granular drain | Overloading drain, settlement of the dam | How much settlement is expected to occur over time? Was settlement accounted for in the design? Will the drain continued to be loaded? | Lack of control of phreatic surface (potential rise in phreatic surface), increase in seepage, pond on reclamation surface, internal erosion, global instability, release of water into downstream shell, erosion on downstream slope | |
| Geosynthetics | Aging | Degradation of geosynthetic over time (temperature, oxidation, hydrolytic, chemical, biological, radioactive, etc.) | Is the geosynthetic capable of aging in the given time frame? Have sufficient tests been performed to investigate this? | Brittle rupture of geosynthetic, lack of control of phreatic surface (potential rise in phreatic surface), increase in seepage, pond on reclamation surface, internal erosion, global instability, release of water into downstream shell, erosion on downstream slope |
| Creep deformation | Slow and continuous deformation under long-lasting shear and pressure forces from consolidation of overlying material | How much deformation is expected over time as the materials above the geotextile consolidate and settle? Has the impact on the geosynthetic been considered? | Reduction in thickness leading to reduction in drain capacity or shear failure of drain if in-place deformation reaches a critical value, lack of control of phreatic surface (potential rise in phreatic surface), increase in seepage, pond on reclamation surface, internal erosion, global instability, release of water into downstream shell, erosion on downstream slope | |
| Clogging | Biological, chemical, particulate clogging | Are there dispersive soils present? Are there ferrous soils? Does the permeant contain oily waters or sludge? Is there turbid water with high suspended solids? Is there potential for chemical precipitation or biological growth? What is the end land use (does it involve agriculture or sewage systems that could result in clogging)? Is sediment capable of clogging the drain? What is the grain size distribution? | Lack of control of phreatic surface (potential rise in phreatic surface), increase in seepage, pond on reclamation surface, internal erosion, global instability, release of water into downstream shell, erosion on downstream slope | |
| Blockage | Intrusion of adjacent materials (i.e., geotextile), blockage of downstream or exit surface caused by sedimentation, vegetation, etc. | Does the downstream or exit surface of the geosynthetic have the potential to be blocked and prevent drainage from sediment, vegetation, ice, snow, etc.? Could adjacent materials impede movement of water to the geosynthetic? | Lack of control of phreatic surface (potential rise in phreatic surface), increase in seepage, pond on reclamation surface, internal erosion, global instability, release of water into downstream shell, erosion on downstream slope | |
| Blinding where fine-grained soils are prevented from entering the geotextile, which creates a filter cake | Formation of a filter cake at the interface of the geosynthetic from coarse particles being retained by the geotextile and intercepting fine particles migrating from the soil | Is the geosynthetic in intimate contact with the soil? Have all appropriate filter criterion been followed during design? | Lack of control of phreatic surface (potential rise in phreatic surface), increase in seepage, pond on reclamation surface, internal erosion, global instability, release of water into downstream shell, erosion on downstream slope | |
| Low permeability cores | Hydraulic fracture | Decrease in total stress (i.e., differential settlement, arching in narrow cores), increase in porewater pressure | Is there a narrow core? Is there the potential for excessive differential settlement that could lead to a decrease in total stress? Is there the potential for an increase in porewater pressure? Is there an effective downstream filter to prevent internal erosion of the core? | Cracking, internal erosion, global instability |
| Internal erosion in dam from suffusion | High hydraulic gradients, design/construction defect, presence of widely gap-graded or non-plastic gap-graded soils | Is the material widely gap-graded or gap-graded non plastic? Is there an effective downstream filter to prevent internal erosion of the core? | Global instability, seepage on the downstream slope, settlement of the crest, permeability may increase as erosion progresses or decrease if clogging occurs | |
| Internal erosion in dam from concentrated leak | Cracks from vertical deformation in foundation, starter dyke, or other tailings materials or differential settlement; tunnels created by burrowing animals; hydraulic fracture; high hydraulic gradient; design/construction defects | Is there a crack or gap that could allow for a concentrated leak to develop? Is there an effective downstream filter to prevent internal erosion of the core? | Global instability, development of a pipe | |
| Internal erosion in dam from contact erosion | Parallel flow in coarser layer to the interface between the coarse-grained and fine-grained soil, high hydraulic gradients, design/construction defects | Is there a contact between a coarse and fine-grained soil? Is there a filter in place? Is there an effective downstream filter to prevent internal erosion of the core? Is there an effective downstream filter to prevent internal erosion of the core? | Global instability, static liquefaction, settlement of the crest, loss of stability or unravelling, eroded material can clog the permeable layer and increase the porewater pressure (could result in hydraulic fracture and uplift of the downstream toe or a rise in the phreatic surface), development of a pipe | |
| Shear failure from changing shear strength | Degradation/weathering, porewater pressure change, change in permeability over time, failure of drains, progressive failure of strain softening materials, brittle failure of contractive materials | Is there potential for weathering or degradation of materials? Does the porewater pressure rely on drain performance? Could drains fail over time? Are the materials strain softening or brittle? Is there an effective downstream filter to prevent internal erosion of the core? | Slumping of downstream slope, translational slide, rotational slide | |
| Shear failure from changing shear stress | Loading/unloading crest, toe, upstream, or downstream; surface erosion of downstream slope; excessive and uncontrolled seepage through foundation resulting in erosion of toe; subsurface stress changes (geothermal development, in situ oil or gas production, wastewater injection, etc.) | Is there potential for anthropogenic contributions (i.e., excavations or construction)? Erodibility of material? Is there an effective downstream filter to prevent internal erosion of the core? | Slumping of downstream slope, translational slide, rotational slide | |
| Vertical deformation (differential or otherwise) from consolidation | Consolidation/settlement | Does the material have the potential to consolidate? How much consolidation has occurred already? How much is expected to occur? Is there an effective downstream filter to prevent internal erosion of the core? | Release of pore water and loss of height (potential for pond to develop on reclamation surface), development of cracks above starter dyke, internal erosion, overtopping |
Table A2.
Foundation FMEA.
| Failure Mode Description | Potential Trigger/Cause | Screening Assessment of Failure Mode | Failure Effects |
|---|---|---|---|
| Heave (seepage forces create zero effective stress condition) | Embankment loading, excessive rainfall, embankment seepage | What are the current hydraulic gradients and maximum possible due to geometry? What are the materials present? Are there cohesionless soils confined by an overlying lower permeability layer? | Global instability |
| Vertical deformation from collapse of karst formation | Collapse of karst formation | Is there karst present in the foundation? | Cracking (transverse cracks - perpendicular to dam crest are larger problems than longitudinal cracks) in dam, internal erosion in dam, crest subsidence |
| Vertical deformation caused by settlement of material | Consolidation | Will the materials in the foundation consolidate over time? How much consolidation has already occurred? Does the material have the potential to collapse? | Cracking (transverse cracks - perpendicular to dam crest are larger problems than longitudinal cracks) in dam, internal erosion in dam, crest subsidence |
| Excessive/uncontrolled seepage through foundation or foundation/dam contact | Excessive rainfall | Is there potential for seepage through the foundation? What is the permeability of the materials? | Erosion of downstream toe, increase in porewater pressure in dam, global instability |
| Shear failure along pre-existing shear plane from changing shear stress | Loading/unloading of foundation, earthquake, subsurface stress changes (geothermal development, in situ oil or gas production, wastewater injection, etc.) | Are there pre-existing shear planes? Is there the potential for anthropogenic loading or unloading events? Is the material erodible? | Slumping of downstream slope, translational slide, rotational slide, static liquefaction |
| Shear failure along new shear plane from changing shear stress | Loading/unloading of foundation, earthquake, subsurface stress changes (geothermal development, in situ oil or gas production, wastewater injection, etc.) | Is there the potential for anthropogenic loading or unloading events? Is the material erodible? | Slumping of downstream slope, translational slide, rotational slide, static liquefaction |
| Shear failure along pre-existing shear plane from changing shear strength | Degradation/weathering, porewater pressure change, progressive failure of strain softening materials, brittle failure of contractive materials | Are there pre-existing shear planes? Is there the potential for degradation or weathering of the material? Is the material strain softening or brittle? | Slumping of downstream slope, translational slide, rotational slide, static liquefaction |
| Shear failure along new shear plane from changing shear strength | Degradation/weathering, porewater pressure change, progressive failure of strain softening materials, brittle failure of contractive materials | Is there the potential for degradation or weathering of the material? Is the material strain softening or brittle? | Slumping of downstream slope, translational slide, rotational slide, static liquefaction |
| Internal erosion in foundation or dam/foundation contact from global backward erosion | Failure of soil above or around a backward erosion pipe to hold a roof, heave, high hydraulic gradients, design/construction defect, presence of non-plastic soils in the foundation | Are there non-plastic soils in the foundation? | Static liquefaction, global instability, unravelling/sloughing of downstream face, sub vertical cavities |
| Internal erosion in foundation or dam/foundation contact from backward erosion piping | Heave, high hydraulic gradients, design/construction defect, presence of non-plastic soils that are capable of holding a roof | Are there non-plastic soils in the foundation and soils capable of ’holding a roof’? | Enlargement of pipe, global instability, static liquefaction |
| Internal erosion in foundation or dam/foundation contact from contact erosion | Parallel flow in coarser layer to the interface between the coarse-grained and fine-grained soil, high hydraulic gradients, design/construction defect | Is there a contact between a coarse-grained and a fine-grained soil? Is the geometrical and hydraulic condition for contact erosion met? | Global instability, static liquefaction, settlement of the crest, loss of stability or unravelling, eroded material can clog the permeable layer and increase the porewater pressure (could result in hydraulic fracture and uplift of the downstream toe or a rise in the phreatic surface), development of a pipe |
| Internal erosion in foundation or dam/foundation contact from suffusion | High hydraulic gradients, design/construction defect, presence of widely gap-graded or non-plastic gap-graded soils | Is the material widely gap-graded or gap-graded non plastic? | Global instability, seepage on the downstream slope, settlement of the crest, permeability may increase as erosion progresses or decrease if clogging occurs |
| Internal erosion in foundation or dam/foundation contact from concentrated leak | Fracture in foundation soil, hydraulic fracture, high hydraulic gradient, cracks at dam/foundation contact from vertical deformation in foundation or poor construction practices or differential settlement, design/construction defects | Is there a crack or gap that could allow for a concentrated leak to develop? | Global instability, development of a pipe |
| Thawing of foundation permafrost | Climate change | Is there permafrost in the foundation? | Cracking (transverse cracks - perpendicular to dam crest are larger problems than longitudinal cracks) in dam, piping in dam, crest subsidence |
Table A3.
Dam body FMEA.
| Failure Mode Description | Potential Trigger/Cause | Screening Assessment of Failure Mode | Failure Effects |
|---|---|---|---|
| Destruction of vegetation | Suffocation by eroded material, forest fires, pests and disease, climate change, large storm event, anthropogenic contributions, surface erosion on downstream slope, evolution of vegetation over time due to climate change | Does the resistance to erosion rely on the vegetation? Is the area susceptible to forest fires? Are there pests/disease that could lead to vegetation destruction? What is the downstream slope? Is the area remote? Are there surrounding communities that could lead to destruction of vegetation (i.e., recreational vehicles)? | Increase in surface erosion, instability of downstream slope, global instability, change in overall evapotranspiration and water balance impacts (infiltration versus runoff) |
| Internal erosion in dam from suffusion | High hydraulic gradients, design/construction defect, presence of widely gap-graded or non-plastic, gap-graded soils | Is the material widely gap-graded or gap-graded non plastic? | Global instability, seepage on the downstream slope, settlement of the crest, permeability may increase as erosion progresses or decrease if clogging occurs |
| Internal erosion in dam from concentrated leak | Cracks from vertical deformation in foundation, starter dyke, or other tailings materials or differential settlement; tunnels created by burrowing animals; hydraulic fracture; high hydraulic gradient; design/construction defects | Is there a crack or gap that could allow for a concentrated leak to develop? | Global instability, development of a pipe |
| Internal erosion in dam from contact erosion | Parallel flow in coarser layer to the interface between the coarse-grained and fine-grained soil, high hydraulic gradients, design/construction defects | Is there a contact between a coarse and fine-grained soil? Is there a filter in place? | Global instability, static liquefaction, settlement of the crest, loss of stability or unravelling, eroded material can clog the permeable layer and increase the porewater pressure (could result in hydraulic fracture and uplift of the downstream toe or a rise in the phreatic surface), development of a pipe |
| Dynamic liquefaction | Earthquakes, induced seismicity, construction traffic, blasting | Seismic events in area? Induced seismicity? Density of material (contractive or dilative)? Saturated or unsaturated? Hydraulically placed or compacted? | Global instability, local slumps, crest drops |
| Shear failure from changing shear strength | Degradation/weathering, porewater pressure change, change in permeability over time, failure of drains, progressive failure of strain softening materials, brittle failure of contractive materials | Is there potential for weathering or degradation of materials? Does the porewater pressure rely on drain performance? Could drains fail over time? Are the materials strain softening or brittle? | Slumping of downstream slope, translational slide, rotational slide |
| Shear failure from changing shear stress | Loading/unloading crest, toe, upstream, or downstream; surface erosion of downstream slope; excessive and uncontrolled seepage through foundation resulting in erosion of toe; earthquake; subsurface stress changes (geothermal development, in situ oil or gas production, wastewater injection, etc.) | Is there potential for anthropogenic contributions (i.e., excavations or construction)? Erodibility of material? | Slumping of downstream slope, translational slide, rotational slide |
| Static liquefaction from changing mean effective stress | Change in pore pressures caused by a phreatic surface change (i.e., failure of drainage system) | Density of material (contractive or dilative)? Saturated or unsaturated? Hydraulically placed or compacted? Does control of the phreatic surface rely on drain function? Could drains become clogged or fail in the future? | Global instability |
| Static liquefaction from changing shear stress | Loading/unloading; overloading, including increasing the load, construction activities at the crest, fill placement at toe; over steepening of downstream slope or toe (slumping of downstream slope from shear failure), including erosion or excavation of toe; foundation shear; shear in starter dyke; shear in other tailings materials; excessive and uncontrolled seepage through foundation resulting in erosion of toe; subsurface stress changes (geothermal development, in situ oil or gas production, wastewater injection, etc.) | Density of material (contractive or dilative)? Hydraulically placed or compacted? Saturated or unsaturated? Is there a likelihood for anthropogenic contributions in the future (i.e., unexpected construction)? Is the site remote? What is the material of the downstream slope? Is there a nearby river? | Global instability |
| Static liquefaction from changing shear stress and mean effective stress | Lateral extrusion | Density of material (contractive or dilative)? Hydraulically placed or compacted? Saturated or unsaturated? Weak layers interbedded in tailings? Could the tailings ’squish’ out like toothpaste during loading? | Global instability |
| Static liquefaction from long-term change in material properties resulting in changing shear strength | Changing shear strength caused by degradation/weathering, progressive failure, porewater pressure change, failure of drains | Density of material (contractive or dilative)? Hydraulically placed or compacted? Saturated or unsaturated? To what extent could weathering or degradation of the material occur? Will it result in an increase or decrease in strength? Will a change in the phreatic surface impact the strength of the material? | Global instability |
| Surface erosion from spring sapping (headward erosion of gullies due to concentration of seepage forces at the locus of the gully which accentuates erosion) | Destruction of vegetation, increased seepage on downstream slope from failure of drainage system, increased seepage from internal erosion of starter dyke or tailings deposits) | Is the material susceptible to erosion? Is there a vegetative cover or erosion protection? Will seepage daylight on the downstream slope? | Slope failures (shallow surficial movement, slumps), change in downstream slope angle, blockage in perimeter channel with sediment, development of negative drainage, development of large erosion scarps |
| Surface erosion from wind and overland flow resulting in rills, gullies, or sheet erosion | Destruction of vegetation, rainfall, melting of snow, wind, increased seepage on downstream slope from failure of drainage system, increased seepage from internal erosion in embankment | Is the material susceptible to erosion? Is there a vegetative cover or erosion protection? | Slope failures (shallow surficial movement, slumps), change in downstream slope angle, blockage in perimeter channel with sediment, development of negative drainage, development of large erosion scarps |
| Toe erosion | Flow action from perimeter ditch or nearby river, release of a dam from a beaver, flood event, river changing course over time, destruction of vegetation, excessive and uncontrolled seepage through foundation, excessive erosion from internal erosion | Is the material susceptible to erosion? Is there a vegetative cover or erosion protection? Is there a nearby perimeter ditch or river? Is there known animal activity in the area? | Slope failures (shallow surficial movement, slumps), change in downstream slope angle, blockage in perimeter channel with sediment, development of negative drainage, development of large erosion scarps, beaver bafflers |
| Vertical deformation (differential or otherwise) from consolidation | Consolidation/settlement | Does the material have the potential to consolidate? How much consolidation has occurred already? How much is expected to occur? | Release of pore water and loss of height (potential for pond to develop on reclamation surface), development of cracks above starter dyke, internal erosion, overtopping |
Table A4.
Landform FMEA.
| Item/Functional Identification | Failure Mode Description | Potential Trigger/Cause | Screening Assessment of Failure Mode | Failure Effects-End Effects |
|---|---|---|---|---|
| Cap | Excessive settlement | Consolidation | Does the material have the potential to settle over time? | Formation of ponds on reclamation surface, overtopping, piping (increase in seepage forces and gradients), infiltration of previously unsaturated tailings that could increase vulnerability to liquefaction for materials previously considered "not flowable" |
| Differential settlement | Consolidation, poor construction practices | Does the material have the potential to settle over time? Are there areas that have the potential to settle more that others? | Formation of ponds on reclamation surface, failure to direct surface water runoff towards drainage channels, development of cracks, formation of preferential flow paths, localized depressions, infiltration of previously unsaturated tailings that could increase vulnerability to liquefaction for materials previously considered "not flowable" | |
| Infilled material | Excessive settlement | Consolidation | Does the material have the potential to settle over time? | Formation of ponds on reclamation surface, overtopping, piping (increase in seepage forces and gradients) |
| Differential settlement | Consolidation, poor construction practices | Are there areas that have the potential to settle more than others? | Formation of ponds on reclamation surface, overtopping, piping (increase in seepage forces and gradients), failure of drainage channels to behave as intended, localized depressions | |
| Hummocks | Shear failure from changing shear stress | Loading/unloading crest, toe, slopes; surface erosion; failure of underlying underlying material to support hummock | Is there potential for anthropogenic contributions (i.e., excavations or construction)? Erodibility of material? | Slumping, translational slide, rotational slide, blockage of drainage channels |
| Shear failure from changing shear strength | Degradation/weathering, porewater pressure change, change in permeability over time, failure of drains, progressive failure of strain softening materials, brittle failure of contractive materials | Is there potential for weathering or degradation of materials? Are the materials strain softening or brittle? | Slumping of slopes, translational slide, rotational slide, blockage of drainage channels | |
| Surface erosion from wind and overland flow resulting in rills, gullies, or sheet erosion | Destruction of vegetation, rainfall, melting of snow, wind | Is the material susceptible to erosion? Is there a vegetative cover or erosion protection? | Slope failures (shallow surficial movement, slumps), change in downstream slope angle, blockage in drainage channel with sediment, development of negative drainage, development of large erosion scarps | |
| Drainage channels | Washout of erosion protection (riprap) | Precipitation event larger than design events (including extreme or repeat events) | What precipitation event are the channels designed for? What is the chance of exceedance over 1000 years? How susceptible are the underlying materials to erosion? Was the erosion protection properly designed and constructed? | Excessive erosion (erosion gullies, etc.), change in slope of drainage channels, erosion and release of materials underlying drainage channels |
| Blockage (complete or partial) | Debris, beaver dam, icing, sedimentation, slumping from slope failure, ingress of vegetation, slope failure/excessive erosion from nearby hummock | Are there beavers in the area? Is there a chance for a slope failure? Could debris be carried downstream and deposited in the channels resulting in a complete or partial blockage? Is the mine located in an area that could experience icing? | Formation of a pond upstream of the drainage channel, blockage breakthrough resulting in flooding, overtopping from pond formation, revert back to a pond, piping through dam (increase in seepage forces and gradient) | |
| Sand channel buoyancy | Freezing conditions in channels composed of sand | Are the drainage channels constructed of sand? Could the channel experience freezing? | Flooding | |
| Erosion control failure | Improper design/construction, differential settlement | Do the drainage channels rely on erosion control for stability? Is there the chance for differential settlement of the channel? | Excessive erosion (erosion gullies, etc.), change in slope of drainage channel, erosion and release of materials underlying drainage channel, formation of secondary channel | |
| Outlet | Washout of erosion protection (riprap) | Precipitation event larger than design event (including extreme or repeat events), flood following sand channel buoyancy event in drainage channel | What precipitation event is the outlet designed for? What is the chance of exceedance over 1000 years? How susceptible are the underlying materials to erosion? Was the erosion protection properly designed and constructed? | Excessive erosion (erosion gullies, etc.), change in slope of outlet, erosion and release of materials underlying outlet |
| Blockage (complete or partial) | Debris, beaver dam, icing, sedimentation, slumping from slope failure, ingress of vegetation, increase in depositional material due to failure of erosion protection in drainage channels upstream | Are there beavers in the area? Is there a chance for a slope failure? Could debris be carried downstream and deposited in the outlet resulting in a complete or partial blockage? Is the mine located in an area that could experience icing? | Formation of a pond upstream of the outlet, blockage breakthrough resulting in flooding, overtopping from pond formation, revert back to a pond, piping through dam (increase in seepage forces and gradient) | |
| Sand channel buoyancy | Freezing conditions in channels composed of sand | Is the outlet constructed of sand? Could the channel experience freezing? | Flooding | |
| Erosion control failure | Improper design/construction, differential settlement | Does the outlet rely on erosion control for stability? Is there the chance for differential settlement of the channel? | Excessive erosion (erosion gullies, etc.), change in slope of outlet, erosion and release of materials underlying outlet, formation of secondary channel | |
| Vegetative cover | Destruction of vegetation | Suffocation by eroded material, forest fires, pests and disease, climate change, large storm event, anthropogenic contributions | Does the resistance to erosion rely on the vegetation? Is the area susceptible to forest fires? Are there pests/disease that could lead to vegetation destruction? Is the area remote? Are there surrounding communities that could lead to destruction of vegetation (i.e., recreational vehicles)? | Increase in surface erosion, deposition of material in drainage channels that could lead to a blockage via sedimentation, development of negative drainage on reclamation surface, ponding of water near dam crest, internal erosion (increase in seepage forces and hydraulic gradient) |
| Tailings | Excessive settlement | Consolidation | Does the material have the potential to settle over time? | Formation of ponds on reclamation surface, overtopping, piping (increase in seepage forces and gradients) |
| Differential settlement | Consolidation, different material properties/infilling techniques, etc. | Are there areas that have the potential to settle more than others? | Formation of ponds on reclamation surface, overtopping, piping (increase in seepage forces and gradients), failure of drainage channels to behave as intended, localized depressions |
Appendix B. FMEA Worksheet
Table A5.
G-FMEA worksheet.
| Element | Failure mode identification | Failure mode description | Potential trigger/cause | Screening assessment of failure mode | Is this failure mode applicable? | If yes, is there sufficient data to evaluate the risk? List any resource gaps. | Failure effects | Immediate-term/Short-term/Medium-term/Long-term Assessment * | ||||||||||||||
| Likelihood | Consequences | Risk Rating | Level of Confidence | Controls | Remarks | |||||||||||||||||
| Element failure consequence | Human intervention | Environment | Community | Element failure consequence | Human intervention | Environment | Community | Element failure consequence | Human intervention | Environment | Community | |||||||||||
* Likelihood rating, consequence rating, risk rating, level of confidence, and controls must be determined for each failure mode for the short-term assessment, medium-term assessment, and long-term assessment.
Appendix C. Risk Matrix Development
The steps to colour code the risk matrix outlined in Section 4.2.3 are described here with the associated development of the example risk matrix in Figure 5 used for illustration purposes.
- In order to develop the iso-contours of equal risk, quantitative values from 0.01 to 10,000 were assigned to the consequence categories and assumed to have an order of magnitude increase between the categories. For individual projects, site-specific consequences could be considered here where there are known magnitudes of the consequences (i.e., financial impacts of environmental consequences). Iso-contours of equal risk were developed based on the estimated quantitative consequence measure and the provided likelihoods using the definition (Likelihood = Risk/Consequence). The iso-contours are shown in Figure A1, which show the annualized probability plotted against the consequences. It is important to remember that this is an estimation technique only and serves as a first-order step for colour coding the matrix. It is desirable to use quantitative measures of the consequences that extend across the full range of categories. Risk categories were then assigned to the iso-contours of equal risk (Table A6). This was used to colour code the initial risk matrix shown in Figure A2. Cells that had an iso-contour cutting through them were assigned to the higher risk category.
Figure A1.
Iso-contours of equal risk.

Table A6.
Assigned risk categories to iso-contour risk levels.
| Risk Category | Risk Level |
|---|---|
| Red | >1 × 10⁻¹ |
| Orange | >1 × 10⁻³ |
| Yellow | >1 × 10⁻⁵ |
| Green | >1 × 10⁻⁷ |
Figure A2.
Initial colour-coded risk matrix with consideration of iso-contours.

- 3.
- The initial colour-coded risk matrix was assessed to determine if it satisfied the Cox axioms (weak consistency, betweenness, and consistent colouring).
- 4.
- The risk matrix was assessed using the Levine lettering scheme [29]. For this, logarithmic axes were used for the consequence and likelihood axes and straight-line iso-contours of equal risk were drawn (similar to Figure A1). Following this, each area was labelled with a letter as opposed to a colour, as shown in Figure A3 (each line represents a new letter). Levines method results in a matrix that is somewhat unintuitive, but this prevents risk matrix users from making assumptions about risks based on the colouring scheme. When a risk matrix is constructed in this manner, the following conclusions can be drawn:
- Risks in one letter category can only be distinguished from risks in another category if they are more than one letter apart (i.e., C > A, D > B).
- Risks in categories that are zero or one letter distant are not able to be distinguished from another (i.e., it is not known if C > B or B > C).
Figure A3.
Risk matrix based on Levine [29].
Figure A3.
Risk matrix based on Levine [29].

- 5.
- As noted by Duijm, another way to develop risk scores and colouring is by using basic arithmetic (multiplication and addition) based on ordinal numbers assigned to each consequence and probability category [31]. As the categories were logarithmically spaced, the addition of the ordinal numbers was used, as shown in Figure A4. For this example, this results in a risk matrix that is colour-coded in the same way as Figure A2.
Figure A4.
Colour-coded risk matrix based on addition of ordinal pairs.

- 6.
Figure A5.
Colour-coded risk matrix following application of hazard aversion.

- 7.
- Following the application of major hazard aversion, the risk matrix was stress tested by evaluating its performance in different scenarios and evaluating what the risk matrix told the user. The evaluation showed that the yielded risk ratings from Figure A5 for the ‘Slight’ and ‘Minor’ consequence rating columns were too high. Some amendments were made to the risk matrix and it was stress tested again. This resulted in the final example risk matrix in Figure A6.
Figure A6.
Example colour-coded risk matrix.

References
- Baker, F.; Cook, D.; Deem, J.; Letient, H.; Walsh, H. Matachewan Mines Tailings Dam from Failure to Rehabilitation. In Proceedings of the 1996 CDA Annual Conference, Niagra Falls, ON, Canada, 6–10 October 1996. [Google Scholar]
- Provincial Court of Alberta. Agreed Statement of Facts, Docket No, Agreed Statement of Facts, Docket No. 151258456P1 &160061354P1; Provincial Court of Alberta, 2017; Available online: http://www1.aer.ca/compliancedashboard/enforcement/201706-04_AgreedStatementofFacts_PrairieMines_Obed_2013-006.pdf (accessed on 6 November 2021).
- LDI. Mining with the End in Mind: Landform Design for Sustainable Mining. Position Paper 2021-01; Landform Design Institute (LDI): Delta, BC, Canada, 2021. [Google Scholar]
- Government of Alberta. Alberta Dam and Canal Safety Directive, AEP Water Conservation 2018 No.3; Government of Alberta: Edmonton, AB, Canada, 2018.
- AER. Manual 019 Decommissioning, Closure, and Abandonment of Dams at Energy Projects; Alberta Energy Regulator (AER): Calgary, AB, Canada, 2020. [Google Scholar]
- Ghahramani, N.; Mitchell, A.; Rana, N.M.; McDougall, S.; Evans, S.G.; Take, W.A. Tailings-flow runout analysis: Examining the applicability of a semi-physical area–volume relationship using a novel database. Nat. Hazards Earth Syst. Sci. 2020, 20, 3425–3438. [Google Scholar] [CrossRef]
- Al-Mamun, M.; Small, A. Revision of Guidance of Landforms in CDA Minings Dams Bulletin-A Companion Paper with Additional Details. In Proceedings of the 2018 CDA Annual Conference, Quebec City, QC, Canada, 13–19 October 2018. [Google Scholar]
- Ayyub, B.M. Risk Analysis in Engineering and Economics, 2nd ed.; CRC Press: Boca Raton, FL, USA, 2014; ISBN 978-1-4665-1826-1. [Google Scholar]
- Robertson, A.; Shaw, S. Mine Closure; Info Mine E-Book: Vancouver, BC, Canada, 2006. [Google Scholar]
- Valis, D.; Koucky, M. Selected Overview of Risk Assessment Techniques. Probl. Eksploat. 2009, 4, 19–32. [Google Scholar]
- Hartford, D.N.D.; Baecher, G.B. Risk and Uncertainty in Dam Safety; Thomas Telford Publishing: London, UK, 2004; ISBN 9780727740397. [Google Scholar]
- Kupper, A.G.; Hurndall, B.; Morgenstern, N.; Sobkowicz, J.; Abeda, W.; Baldwin, G.; Cameron, R.; Eenkooren, N.; Grapel, C.; Martens, S.; et al. De-Licensing Oil Sands Tailings Dams-When Is a Dam No Longer a Dam? In Proceedings of the 17th International Conference on Tailings and Mine Waste, Banff, AB, Canada, 3–6 November 2013. [Google Scholar]
- Dos Santos, R.N.C.; Caldeira, L.M.M.S.; Serra, J.P.B.; Dos Santos, R.C. FMEA of a tailings dam. Georisk: Assess. Manag. Risk Eng. Syst. Geohazards 2012, 6, 89–104. [Google Scholar] [CrossRef]
- Schafer, H.L.; Macciotta, R.; Beier, N.A. Tailings dam closure scenarios, risk communication, monitoring, and surveillance in Alberta. CIM J. 2020, 11, 80–90. [Google Scholar] [CrossRef]
- Schafer, H.L.; Beier, N.A.; Macciotta, R. Closure and the Long-Term Behaviour of Tailings Dams: Using Industry Experience to Fill in the Gaps. In Proceedings of the 72nd Canadian Geotechnical Conference, St. John’s, NL, Canada, 29 September–2 October 2019. [Google Scholar]
- Porter, M.; Lato, M.; Quinn, P.; Whittall, J. Challenges with Use of Risk Matrices for Geohazard Risk Management for Resource Development Projects. In Proceedings of the First International Conference on Mining Geomechanical Risk, Perth, WA, Australia, 9–11 April 2019; Australian Centre for Geomechanics: Crawley, WA, Australian; pp. 71–84. [Google Scholar]
- MEND. Cold Regions Cover System Design Technical Guidance Document, MEND Report 1.61.5c; Mine Environment Neutral Drainage (MEND) Program: 2012. Available online: http://mend-nedem.org/wp-content/uploads/2013/01/1.61.5c.pdf (accessed on 6 November 2021).
- Brown, B.S. What Are the Real Risks for Tailings Facilities? In Proceedings of the First International Conference on Mining Geomechanical Risk, Perth, WA, Australia, 9–11 April 2019; Australian Centre for Geomechanics: Crawley, WA, Australia; pp. 21–30. [Google Scholar]
- (Tony)Cox, L.A. What’s Wrong with Risk Matrices? Risk Anal. 2008, 28, 497–512. [Google Scholar] [CrossRef]
- Pickering, A.; Cowley, S.P. Risk Matrices: Implied Accuracy and False Assumptions. J. Health Saf. Res. Pract. 2010, 2, 11–18. [Google Scholar]
- Ball, D.J.; Watt, J. Further Thoughts on the Utility of Risk Matrices. Risk Anal. 2013, 33, 2068–2078. [Google Scholar] [CrossRef]
- Monat, J.P.; Doremus, S. Alternatives to Heat Map Risk Matrices for Project Risk Prioritization. J. Mod. Proj. Manag. 2018, 6, 104–113. [Google Scholar] [CrossRef]
- IEC. IEC/ISO 31010 Risk Management-Risk Assessment Techniques; International Electrotechnical Commission (IEC): Geneva, Switzerland, 2009. [Google Scholar]
- Center for Security Studies. Visualizing Risk: The Use of Graphical Elements in Risk Analysis and Communications; Center for Security Studies: Zurich, Switzerland, 2012. [Google Scholar]
- Baybutt, P. Guidelines for designing risk matrices. Process. Saf. Prog. 2017, 37, 49–55. [Google Scholar] [CrossRef]
- Thomas, P.; Bratvold, R.B.; Eric, B.J. The Risk of Using Risk Matrices. SPE Econ. Manag. 2014, 6, 56–66. [Google Scholar] [CrossRef]
- Baybutt, P. Designing risk matrices to avoid risk ranking reversal errors. Process. Saf. Prog. 2015, 35, 41–46. [Google Scholar] [CrossRef]
- Oboni, C.; Oboni, F. Is It True that PIGs Fly When Evaluating Risks of Tailings Management Systems? In Proceedings of the 16th International Conference on Tailings and Mine Waste, Keystone, CO, USA, 14–17 October 2012; pp. 95–105. [Google Scholar]
- Levine, E. Improving risk matrices: The advantages of logarithmically scaled axes. J. Risk Res. 2012, 15, 209–222. [Google Scholar] [CrossRef]
- Smith, E.D.; Siefert, W.T.; Drain, D. Risk matrix input data biases. Syst. Eng. 2008, 12, 344–360. [Google Scholar] [CrossRef]
- Duijm, N.J. Recommendations on the use and design of risk matrices. Saf. Sci. 2015, 76, 21–31. [Google Scholar] [CrossRef] [Green Version]
- Bao, C.; Li, J.; Wu, D. A fuzzy mapping framework for risk aggregation based on risk matrices. J. Risk Res. 2016, 21, 539–561. [Google Scholar] [CrossRef]
- Oboni, F.; Oboni, C. Tailings Dam Management for the Twenty-First Century; Springer Nature Switzerland AG: Cham, Switzerland, 2020; ISBN 978-3-030-19447-5. [Google Scholar]
- Canadian Geotechnical Society. Canadian Foundation Engineering Manual, 4th ed.; Canadian Geotechnical Society: Richmond, BC, Canada, 2006; ISBN 9780920505281. [Google Scholar]
- Global Tailings Review. Global Industry Standard on Tailings Management; International Council on Mining and Metals: London, UK; United Nations Environment Programme: Nairobi, Kenya; Principles of Responsible Investment: London, UK, 2020. [Google Scholar]
- ICOLD. Internal Erosion of Existing Dams, Levees and Dikes, and Their Foundations; International Commission on Large Dams (ICOLD): Paris, France, 2017; Volume Bulletin 164. [Google Scholar]
- Task Committee on Low-Level Radioactive Waste Management of the Technical Committee on Nuclear Effects Management of Inactive Uranium Mill Tailings. J. Environ. Eng. 1986, 112, 490–537. [CrossRef]
- DOE Lakeview Oregon Final Completion Report Volume 1; Department of Energy (DOE) Albuquerque Operations Office: Albuquerque, NM, USA, 1991.
- Mathes, D.E. Lessons-Learned from the 20-Year Uranium Mill Tailings Remedial Action Surface Project. In Proceedings of the Waste Management, Tuscon, AZ, USA, 28 February–4 March 1999. [Google Scholar]
- IAEA. The Long Term Stabilization of Uranium Mill Tailings; International Atomic Energy Agency (IAEA): Vienna, Austria, 2004. [Google Scholar]
- ICOLD. Tailings Dam Committee Sustainable Design and Post-Closure Performance of Tailings Dams; International Committee on Large Dams (ICOLD): Paris, France, 2013; Volume Bulletin 153. [Google Scholar]
- CDA. Application of Dam Safety Guidelines to Mining Dams; Canadian Dam Association (CDA): Markham, ON, Canada, 2014. [Google Scholar]
- OSTDC. De-Licensing of Oil Sands Tailings Dams. In Technical Guidance Document; Oil Sands Tailings Dam Committee (OSTDC). 2014. Available online: https://era.library.ualberta.ca/items/8131d11c-4402-4bed-b0ab-0d3833b95af6/view/7165e9fb-e003-4ce6-8a92-efaf8355ec2b/2014-2003-2028-20--20Report-20--20Oil-20Sands-20Dams-20De-Licensing-20Technical-20Guide.pdf (accessed on 6 November 2021).
- INAP. Global Cover System Design Technical Guidance Document; International Network for Acid Prevention (INAP). 2017. Available online: https://www.inap.com.au/wp-content/uploads/global-cover-system-design.pdf (accessed on 6 November 2021).
- Hadjigeorgiou, J. Understanding, Managing and Communicating Geomechanical Mining Risk. In Proceedings of the First International Conference on Mining Geomechanical Risk, Australian Centre for Geomechanics, Perth, WA, Australia, 9–11 April 2019; pp. 3–20. [Google Scholar]
- Griffin, B. Risk Assessment. In Guidelines for Mine Waste Dump and Stockpile Design; Hawley, M., Cunning, J., Eds.; CSIRO Publishing: Clayton South, VIC, Australia, 2017; pp. 187–195. [Google Scholar]
- Reagan, R.T.; Mosteller, F.; Youtz, C. Quantitative meanings of verbal probability expressions. J. Appl. Psychol. 1989, 74, 433–442. [Google Scholar] [CrossRef] [PubMed]
- NOAMI. The Policy Framework in Canada for Mine Closure and Management of Long-Term Liabilities: A Guidance Document; National Orphaned/Abandoned Mines Initiative (NOAMI): Ottawa, ON, Canada, 2010. [Google Scholar]
- Slovic, P.; Weber, E.U. Perception of Risk Posed by Extreme Events. In Proceedings of the Risk Management Strategies in an Uncertain World, Palisades, New York, NY, USA, 12–13 April 2002. [Google Scholar]
- Gibson, G.; O’Faircheallaigh, C. IBA Community Toolkit: Negotiation and Implementation of Impact and Benefit Agreements; Walter & Duncan Gordon Foundation: Toronto, ON, Canada, 2015. [Google Scholar]
- Nikl, L.; Steele, J.; Robertson, L.; Davidson, S.; Schryburt, R. Environmental Consequence Classification of Mine Dam Failures: Updating the Canadian Classification System. In Proceedings of the ASDSO 2018 Dam Safety Conference, Association of State Dam Safety Officials, Seattle, Washington, DC, USA, 9–13 September 2018. [Google Scholar]
- Department of Mines and Petroleum. Environmental Protection Authority Guidelines for Preparing Mine Closure Plans; Government of Western Australia: Perth, WA, Australia, 2015.
- Aven, T. Risk assessment and risk management: Review of recent advances on their foundation. Eur. J. Oper. Res. 2016, 253, 1–13. [Google Scholar] [CrossRef] [Green Version]
- Oboni, F.; Oboni, C. The Long Shadow of Human-Generated Geohazards: Risks and Crises. In Geohazards Caused by Human Activity; Faris, A., Ed.; InTech: Rijeka, Croatia, 2016; pp. 107–140. ISBN 978-953-51-2802-1. [Google Scholar]
Figure 1.
Changing probability of failure with time due to system changes.

Figure 2.
System definition of oil sand and coal mines in Alberta, Canada.

Figure 3.
G-FMEA steps.

Figure 4.
Risk matrix.

Figure 5.
Example risk matrix considering major hazard aversion and threshold for quantitative analysis.
Figure 5.
Example risk matrix considering major hazard aversion and threshold for quantitative analysis.

Table 1.
Risk matrix issues, references, and associated comments related to the G-FMEA.
| Issue | References | Comments related to the G-FMEA |
|---|---|---|
| Subjective nature (not as simple and transparent as it would seem). | [8,19,20,21,22,23] | Quantitative data should be used as often as possible with supporting verbal descriptions and quantitative descriptors (ranges or anchor points to the definition of categories). The risk assessment should be accompanied by a description of the risk assessor, including their risk tolerances. |
| Can lead to incorrect risk prioritization. | [21,22,24,25] | The risk matrix does not focus on risk prioritization, but is intended as a screening tool to assess the closure design. |
| Can shut down conversations about risk instead of opening them up due to the pre-defined colour coding scheme determining risk prioritization. | [24] | The risk matrix is designed to determine if a closure design is adequate and is a screening tool. It involves input from stakeholders to determine the consequence ratings and is intended to open up dialogue. |
| Ranking reversal: where quantitatively smaller risks are assigned qualitatively higher rating levels than some quantitatively larger risks due to incorrect risk prioritization. | [19,20,26,27] | The risk matrix does not focus on risk prioritization, but is intended as a screening tool to assess the closure design. |
| Does not account for different risk tolerances of the individual conducting the risk assessment. | [22,28] | The risk assessor‘s background should be listed with the completed risk assessment. |
| Range compression where risks with very different likelihoods and consequences are grouped together. Risk matrices with too many categories may give false resolutions. | [19,26,28,29] | The number of risk categories should be developed with consideration of range compression. |
| Centering bias can be an issue where individuals have the tendency to avoid extreme values or statements when presented with a choice. This can exacerbate range compression. | [26,30] | An extra category can be added to both sides of the expected range for the consequences and likelihoods, as suggested by Duijm [31]. |
| Category definition bias where different definitions exist for a given likelihood or consequence descriptor. | [26,31] | Clear definitions must be provided for the consequences and likelihoods categories. |
| Risk matrix can be misleading as it implies that risk is categorical as opposed to a position on a risk continuum. | [20] | The risk matrix should be accompanied by a clear definition of risk and associated discussion on the risk continuum. |
| Ambiguity of the consequence definition. There are different definitions used in practice for the consequence which can lead to issues if not clearly defined (worst case, most likely, a number of alternate discrete outcomes). | [31] | The consequence category must be clearly defined. |
| Risk matrices cannot provide aggregate measures of risk (i.e., total risk). | [23,27,32] | The goal of this risk matrix is to serve as a screening tool and is not intended to provide an indication of total risk. |
| Risk matrices are unable to aggregate risk from multiple consequence dimensions. This means that different types of consequences should not be directly compared (i.e., impact on the environment, human life). In practice, a hazard is often assigned a risk level based on the most severe consequence. This is misleading. | [23,31,33] | A risk rating should be assigned for each consequence category for a hazard. |
| Corporate-wide risk matrices are intended to be used as a way of standardizing risk assessment and risk acceptance criteria across a company. This is problematic as risk tolerance may vary throughout a company. | [31] | Corporate-wide risk matrices should not be used with the Generalized FMEA. |
Table 2.
Excerpt from drainage element G-FMEA chart.
| Element | Failure Mode Description | Potential Trigger/Cause | Screening Assessment of Failure Mode | Failure Effects |
|---|---|---|---|---|
| Perimeter Ditch | Blockage (partial or full) | Sedimentation, sloughing/slope failure of walls, beaver dam, continuous build up of ice (icing) | Is there erosion protection in place? What is the slope of the ditch? Is it sufficient to keep particles suspended? What is the slope of the side slopes? What is the strength of material? Have there been failures in this material before? Are there beavers in the area? Is the mine located in an area that could experience icing? | Rise in phreatic surface, increase in seepage, pond on reclamation surface, internal erosion, global instability, flooding, blockage of drain outlets, toe erosion, discharge of process affected water to the environment |
| Reduction in cross-sectional area | Sloughing/slope failure of walls, excessive vegetation | What is the slope of the side slopes? What is the strength of material? Have there been failures in this material before? Will the ditch regularly have water running through it or will it stay dry for a portion of the year? Are there deterrents in place to prevent the growth of vegetation? | Rise in phreatic surface, increase in seepage, pond on reclamation surface, internal erosion, global instability, reduced capacity, erosion, potential flooding, blockage of drain outlets, toe erosion, discharge of process affected water to the environment | |
| Change in slope | Erosion, differential settlement | Is there erosion protection in place? Does the material have the potential to consolidate or settle over time? Is it a cut into natural ground or is the material placed? | Change to water discharge velocity, creation of secondary channels, localized areas of erosion, instability of dam |
Table 3.
Assessment periods [44].
Table 3.
Assessment periods [44].
| Assessment Period | Definition |
|---|---|
| Adaptive Management | Occurs following closure activities when the closed facility may be at its greatest risk of failure prior to reaching equilibrium. The operator has the greatest capacity to respond. This period may be defined explicitly by the regulator, using accumulated knowledge, or using a site-specific scientific basis. |
| Proactive Management | Occurs as personnel and equipment are reduced. Involves a regular fixed frequency monitoring and maintenance schedule to confirm that the landform is trending along the designed trajectory. It is expected that the frequency will be less than during the adaptive management period. |
| Reactive Management | Issues are rectified strictly on a reaction basis, once a trigger event occurs. There should be a clear plan in place that outlines what the trigger events are and how they will be managed. Monitoring may occur in response to events such as fires, floods, earthquakes, and other extreme events. |
Table 4.
Time frames for various levels of risk assessment.
| Risk Assessment | Conditions | Approximate Assessment Period 1 |
|---|---|---|
| Immediate-term | Should fall within the projected adaptive management period | 0–10 years |
| Short-term | Should fall within the projected adaptive or proactive management period | 10–50 years |
| Medium-term | Should fall within the projected reactive management period | 50–200 years |
| Long-term | - | 1000 years |
1 Assessment period time frames depend on site-specific considerations. Intended as a guideline.
Table 5.
Likelihood rating.
| Likelihood Rating | Qualitative Interpretation Guidance 1 | Quantitative Interpretation Guidance | Annualized Probability of Occurrence |
|---|---|---|---|
| Almost certain | Almost certain that an incident will occur given the circumstances. Very high probability of one or more occurrences per year. | Higher than 10% probability in a year | p ≥ 0.1 |
| Likely | High likelihood. Commonly observed at similar facilities. | Higher than 10% probability in 10 years | p ≥ 0.01 |
| Possible | Has occurred a number of times within the industry and at least once at the site (or similar facilities in the region). | Higher than 1% probability in 10 years | p ≥ 0.001 |
| Unlikely | Has occurred before within the industry, but not at the site. | Less than a 1% probability in 10 years | p < 0.001 |
| Rare | Low likelihood of occurrence, but not impossible. Has not occurred at the site but has occurred in industry. | Less than a 1% probability in 100 years | p < 0.0001 |
| Very rare | Very low likelihood of occurrence, but not impossible. Occurrence cannot be deemed non-credible | Less than a 1% probability in 1000 years | p < 0.00001 |
| Close to non-credible | Extremely remote likelihood of occurrence. Although the mechanisms are technically plausible for the occurrence, it is seen as near non-credible. | Less than a 1% probability in 10,000 years | p < 0.000001 |
1 Industry encompasses the mining industry as a whole.
Table 6.
Consequence rating.
| Consequence Rating 1 | Consequence of Failure of Element on the Rest of the System | Degree of Human Intervention Required | Environment | Community |
|---|---|---|---|---|
| Slight | Failure of element does not have cascading consequences. | Structural integrity maintained. No intervention or maintenance required. | No movement of tailings beyond the structure footprint. | No impact on local community. |
| Minor | Failure of element may have cascading consequences that do not result in global failure. | Structural integrity maintained. Minor or localized intervention or maintenance required. | Released tailings are not toxic 2, and/or minimal loss of habitat (<5%) of species of special interest 3, and/or acceptable restoration of water bodies and environment feasible in a short time frame (<5 years). | Impact 4 on local community for less than 1 year. |
| Moderate | Failure of element has cascading consequences that do not result in global failure. | Intervention or maintenance required to limit impact of cascading consequences. | Released tailings are not toxic 2, and/or moderate loss of habitat (5–20%) of species of special interest 3, and/or acceptable restoration of water bodies and environment feasible in a short time frame (<5 years). | Short-term (<5 years) impact 4 on local community. |
| Major | Global failure of tailings dam with minor release of tailings. | Intervention or maintenance required to maintain function of structure as a whole. | Released tailings are toxic 2, and/or significant loss of habitat (20–50%) of species of special interest 3, and/or acceptable restoration of water bodies and environment feasible in a moderate time frame (5–25 years). | Medium-term (5–25 years) impact 4 on local community. |
| Severe | Global failure of tailings dam with catastrophic release of tailings. | Structural repair not possible. | Released tailings are toxic 2, and/or very significant loss of habitat (>50%) of species of special interest 3, and/or acceptable restoration of water bodies and environment unlikely within an extended time frame (>25 years). | Long-term (>25 years) impact 4 on local community. Fatalities. |
Notes: 1 Assigned consequence should reflect the most likely outcome. If assigning consequence with consideration of the worst case or a combination of discrete outcomes, this must be declared. 2 Toxicity assessment of tailings should consider an assessment of the fluids and solids (leaching potential, acidity, radioactivity). 3 Species of special interest is defined as a species that lives in the inundation area that would be greatly impacted by habitat loss (preferable to select a species that is provincially or federally listed). 4 Community impacts must be determined through meaningful engagement with stakeholders and may include a consideration of health, loss of access/destruction of traditional lands, housing, destruction/damage of farmland, harm to livestock, damage to water or soil resources, impacts to trapping and fishing, loss of animals, overall cultural impact, and employment. Reputation, legal aspects, and economics are not considered in this consequence table as they are considered site- and corporation-specific. It may be necessary to assess these aspects on a site-specific basis.
Table 7.
Risk category.
| Risk Category | Description of Risk Category |
|---|---|
| Low | Risk minimal. Monitor risks. Acceptable closure plan. |
| Moderate | Risk tolerable with controls. Assess risk mitigation options and monitor these risks. Minor re-design of closure plan may be required to accommodate risk mitigation. |
| High | Risk undesirable. Risk mitigation should be employed to ALARP to reduce risk category. Closure plan may require alteration to accommodate risk mitigation. |
| Extreme | Risk intolerable. Risk mitigation required immediately to reduce risk category. Requires more detailed risk analysis. Closure plan requires alteration. |
Publisher’s Note: MDPI stays neutral with regard to jurisdictional claims in published maps and institutional affiliations. |
© 2021 by the authors. Licensee MDPI, Basel, Switzerland. This article is an open access article distributed under the terms and conditions of the Creative Commons Attribution (CC BY) license (https://creativecommons.org/licenses/by/4.0/).
Share and Cite
MDPI and ACS Style
Schafer, H.L.; Beier, N.A.; Macciotta, R. A Failure Modes and Effects Analysis Framework for Assessing Geotechnical Risks of Tailings Dam Closure. Minerals 2021, 11, 1234. https://0-doi-org.brum.beds.ac.uk/10.3390/min11111234
AMA Style
Schafer HL, Beier NA, Macciotta R. A Failure Modes and Effects Analysis Framework for Assessing Geotechnical Risks of Tailings Dam Closure. Minerals. 2021; 11(11):1234. https://0-doi-org.brum.beds.ac.uk/10.3390/min11111234
Chicago/Turabian StyleSchafer, Haley L., Nicholas A. Beier, and Renato Macciotta. 2021. "A Failure Modes and Effects Analysis Framework for Assessing Geotechnical Risks of Tailings Dam Closure" Minerals 11, no. 11: 1234. https://0-doi-org.brum.beds.ac.uk/10.3390/min11111234
Note that from the first issue of 2016, this journal uses article numbers instead of page numbers. See further details here.