Article

Experimental Stand for Sorting Components Dismantled from Printed Circuit Boards

Department of Electronics and Measurements, Technical University of Cluj-Napoca, 400027 Cluj, Romania
*
Author to whom correspondence should be addressed.
Submission received: 15 October 2021 / Revised: 17 November 2021 / Accepted: 17 November 2021 / Published: 20 November 2021

Abstract

:
There is nothing new about the fact that higher concentrations (up to 50 times) of valuable materials can be found in e-waste, compared to mined ores. Moreover, the constant accumulation of excessive amounts of waste equipment has a negative impact on the environment. The components found in electronic equipment may contain hazardous materials or materials that could be recycled and reintroduced into production processes, thus reducing the carbon footprint created by waste electrical and electronics equipment (WEEE). Sustainable e-waste recycling requires high-value, integrated recovery systems. By implementing a two-stage experimental sorting stand, this paper proposes an efficient and fast sorting method that can be industrially scaled up to reduce the time, energy and costs needed to sort electronic waste (e-waste). The sorting equipment is in fact an ensemble of sensors consisting of cameras, color sensors, proximity sensors, metal detectors and a hyperspectral camera. The first stage of the system sorts the components based on the materials’ spectral signature by using hyperspectral image (HSI) processing and, with the help of a robotic arm, removes the marked components from the conveyor belt. The second stage of the sorting stand uses a contour vision camera to detect specific shapes of the components to be sorted with the help of pneumatic actuators. The experimental sorting stand is able to distinguish up to five types of components with an efficiency of 89%.

1. Introduction

Electronic devices are already well integrated into every aspect of our lives, ranging from common appliances and portable gadgets to smart devices. Meanwhile, the replacement intervals of electronic devices are getting shorter. Often, many products will be thrown away once their batteries die, being quickly replaced with new devices. The increasing rate at which people are replacing their electronic devices is becoming more alarming by the day. Therefore, it is very important to have the means to obtain and recycle the materials from electronic waste (e-waste), to help conserve and limit the extraction of natural resources worldwide. The objective is to recover and reinsert all materials into the production process, with minimal energy consumption through non-polluting technologies, thereby ensuring reduced quantities of secondary waste and minimal environmental impact [1].
A printed circuit board (PCB) taken out of different electronic devices contains, in general, metallic or plastic screws, metallic or plastic frames, heat sinks, Al capacitors, Cu inductors, small capacitors and integrated circuit chips. Last but not least, it can contain precious metals (the surface of Au plates) on the pin connectors or terminals [2]. In addition, a considerable amount of hazardous materials (lead, cadmium, mercury, fire retardants, etc.) can be found in PCB waste too. These materials can provoke a significant negative impact on the Earth’s ecosystem [3,4,5] if they are not recovered and recycled.
To diminish the effects of the growing amount of WEEE, the European Parliament introduced Directive 2002/96/EC in 2003 [6]. This directive seeks to preserve, protect and improve the quality of the environment, protect human health and utilize natural resources prudently and rationally. Since then, the directives have changed multiple times, and the latest one, Directive 2012/19/EU [7], which is still in force, has also implemented a minimum recovery target for WEEE products. According to [8], currently, the generated amount of WEEE continues to grow at an alarming rate towards 12 million tons, although the exact amount is unknown.
For successful separation of e-waste components, a preprocessing stage is crucial. During this stage, the products are dismantled manually or mechanically to extract only the electronic components (PCBs, motors, displays, batteries, etc.).
Different types of sorting and recycling stations are available around the world, and each of these has its own method for dismantling and sorting WEEE. One of these sorting methods is based on optical analysis and machine vision. This method can be used to easily recognize different types of materials with a higher accuracy. Many of these technologies can be applied to properly classify plastic or metal materials [9,10,11,12]. The technologies that are most relevant for this include different spectroscopy-based approaches including short-wave infrared (SWIR) [13,14], near-infrared (NIR) [15,16,17,18], Raman spectroscopy [19] and laser-induced breakdown spectroscopy (LIBS) [20]. Comparing NIR spectroscopy to other spectroscopy technologies, one of its major advantages is constituted by the rapid sample detection and low-cost implementation on an automatic sorting system.
Hyperspectral imaging (HSI) can be used for both automatic target detection and analytical composition identification. Data obtained from hyperspectral imaging systems are named datacubes or hypercubes. These three-dimensional datasets contain a two-dimensional spatial array of vectors which represent the spectrum of each pixel caught by the imaging system. By using HSI systems, materials can be processed easily without the need of sample preparation. Further, no hazardous chemicals are involved. It is a non-invasive technology [21,22,23,24], and high imaging speeds can be achieved. Although HSI has several advantages, it also comes with some disadvantages. One of the first disadvantages is that because of the multiple spectral information collected per pixel, the data sizes that a hypercube can reach are significantly high, meaning that the processing time needed for different computations will also be high. Another known problem for HSI is multicollinearity, which necessitates further data processing such as principal component regression (PCR) and partial least squares (PLS) [25,26]. Because not all wavelengths are useful when scanning materials, depending on the type of hyperspectral camera used, the user can define the specific wavelengths to be acquired, thus speeding up the scanning and classification process [27].
This paper focuses on waste pre-treatment, especially the sorting of different components (polymers, ceramics, metals) for subsequent recycling activities. The metal content on a PCB is around 28% and can consist of copper, lead, nickel, silver, platinum and gold [28]. The proposed experimental stand was developed to sort different types of components remaining after the dismantlement of PCBs coming from personal computers (Figure 1) [29]. The dismantlement process is a combination of chemical and mechanical technologies [30,31,32], which were performed on PCBs to obtain a number of sample materials used to test this experimental stand. In order to correctly separate each PCB component, they need to be classified and sorted into different types of categories [33,34]. The experimental stand is based on an ensemble of sensors that allow for the identification of the waste components, composition and shape. The experimental stand is composed of two conveyor belts on which the components travel to be identified and sorted. In this study, on the first conveyor belt, an NIR camera was used to detect silicon chips, while on the second conveyor belt, a contour vision sensor was trained to detect specific components to be sorted [35].
The introduction of technology-based sorting systems has multiple advantages when comparing different types of recycling technologies. The introduction of sensor-based sorting systems decreases the costs of energy and water consumption, while the production, efficiency and reliability of the recycling technologies are increased significantly.

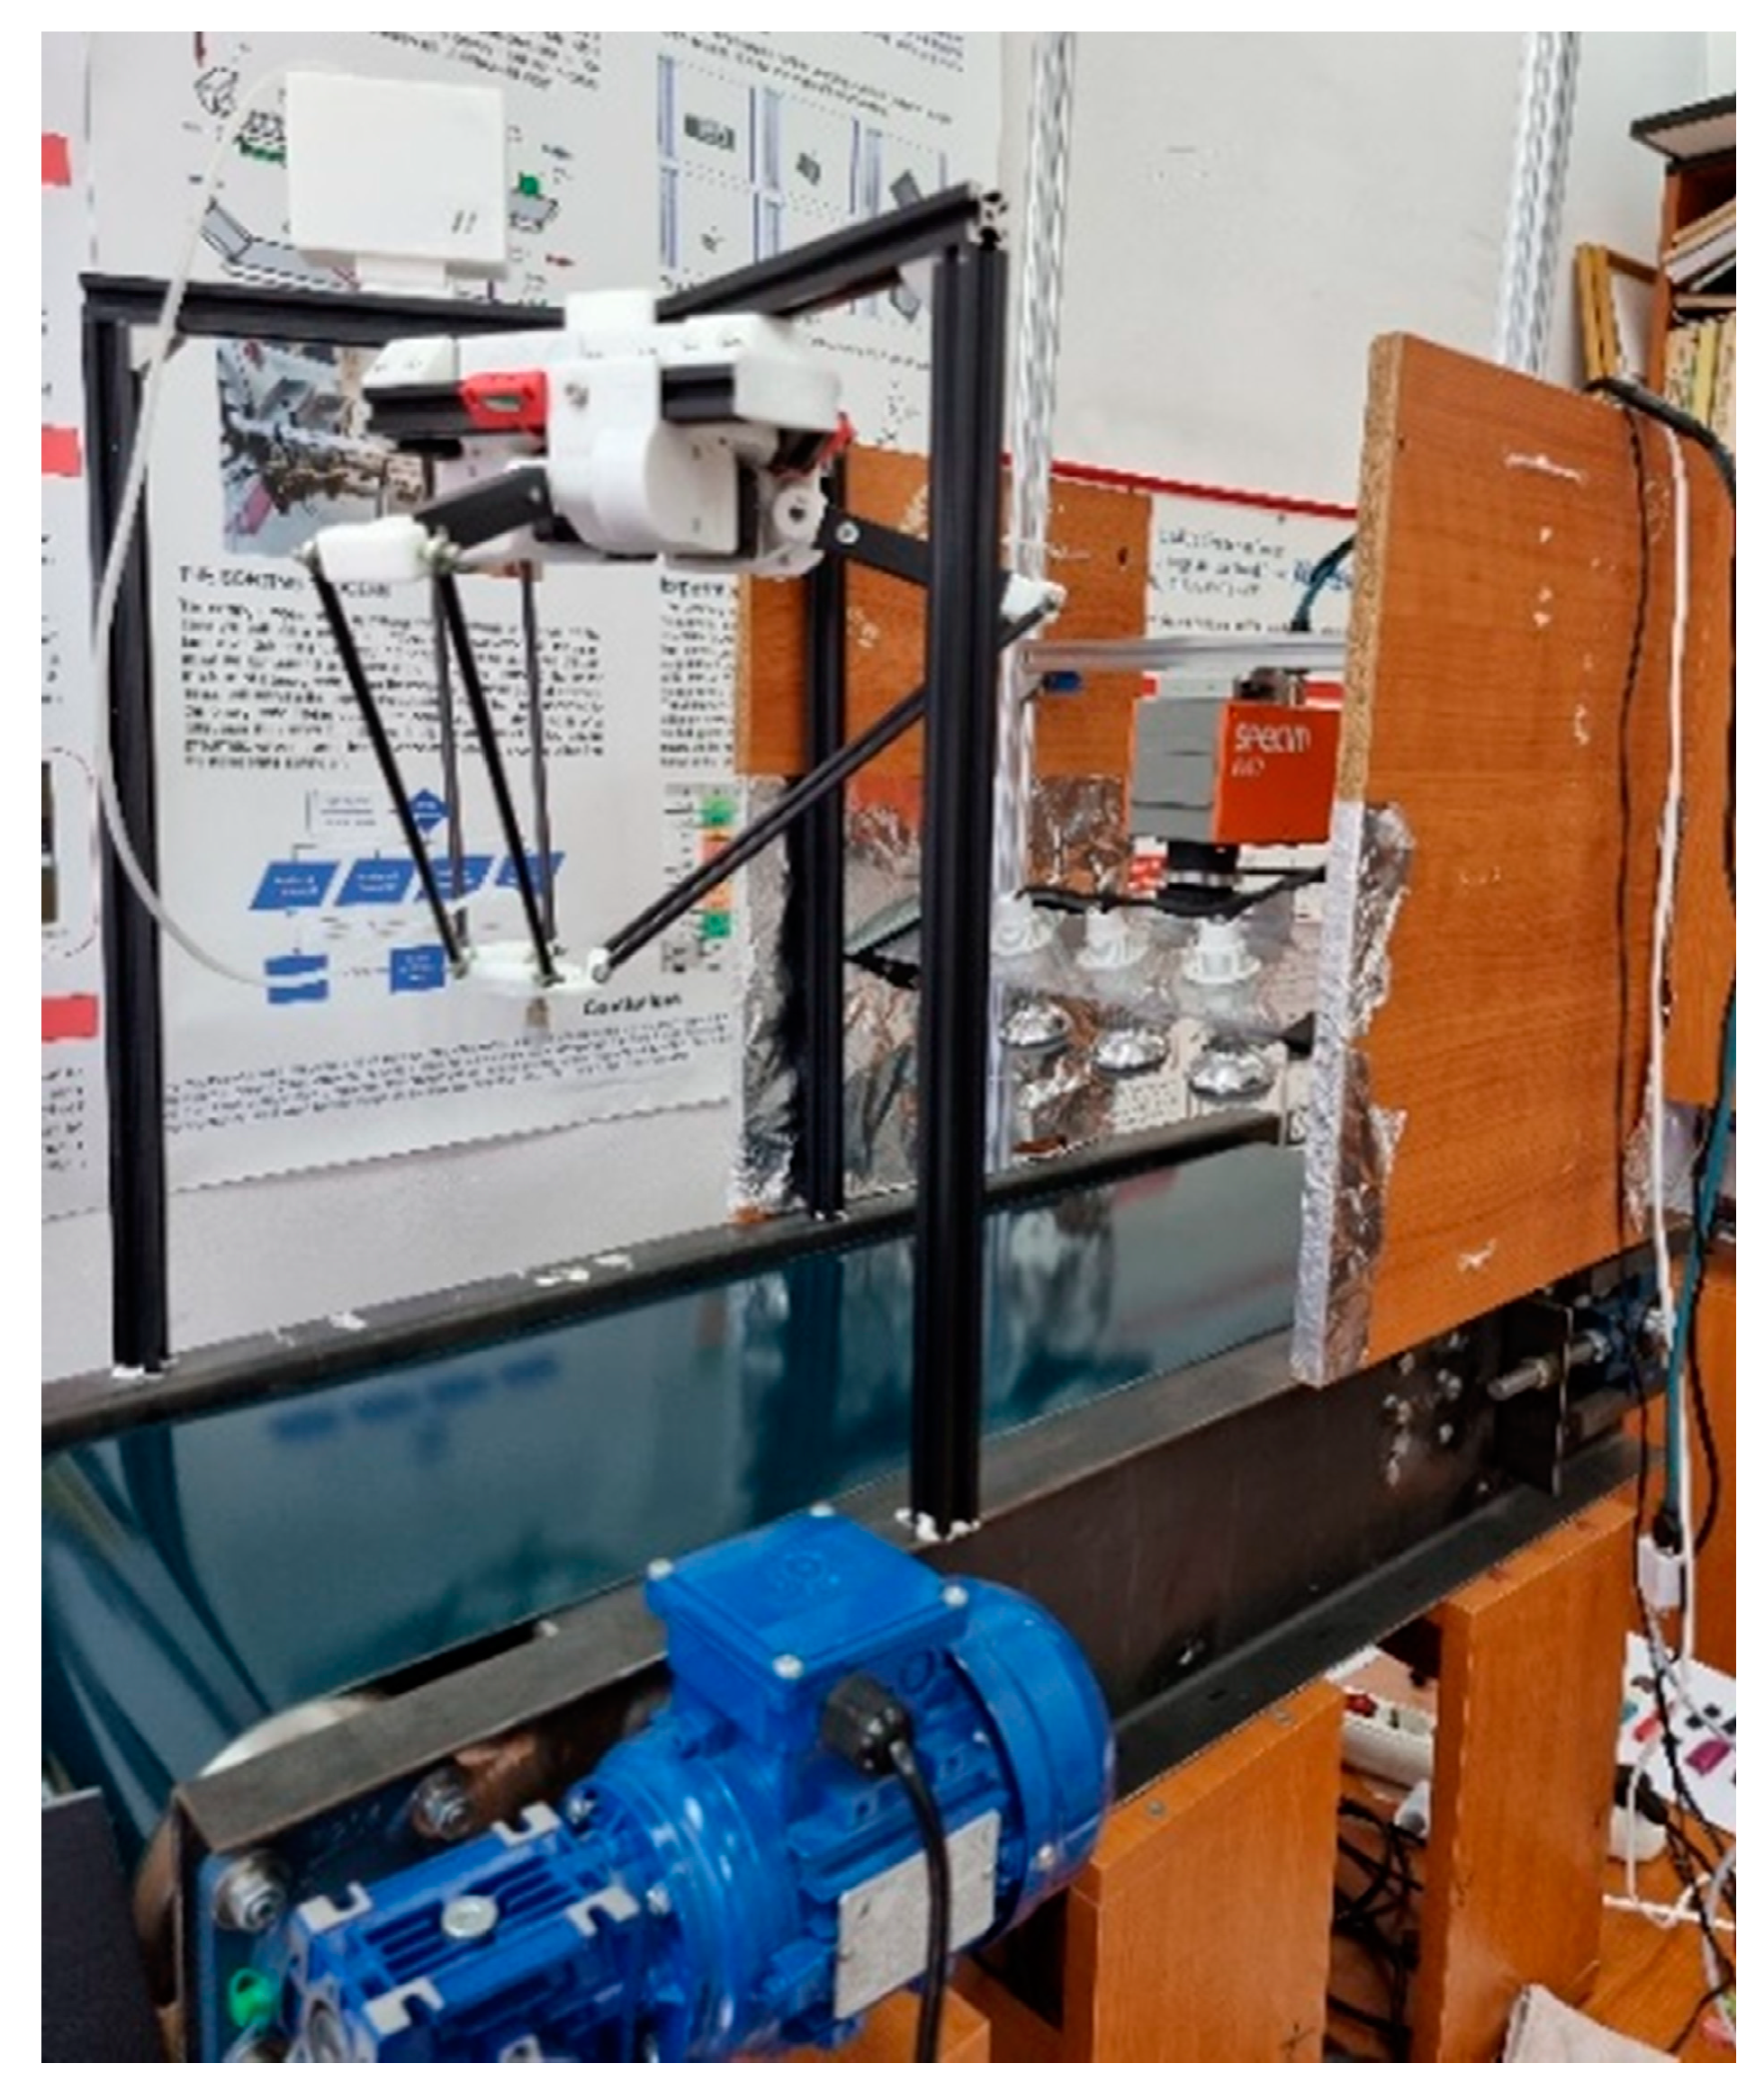
2. Materials and Methods

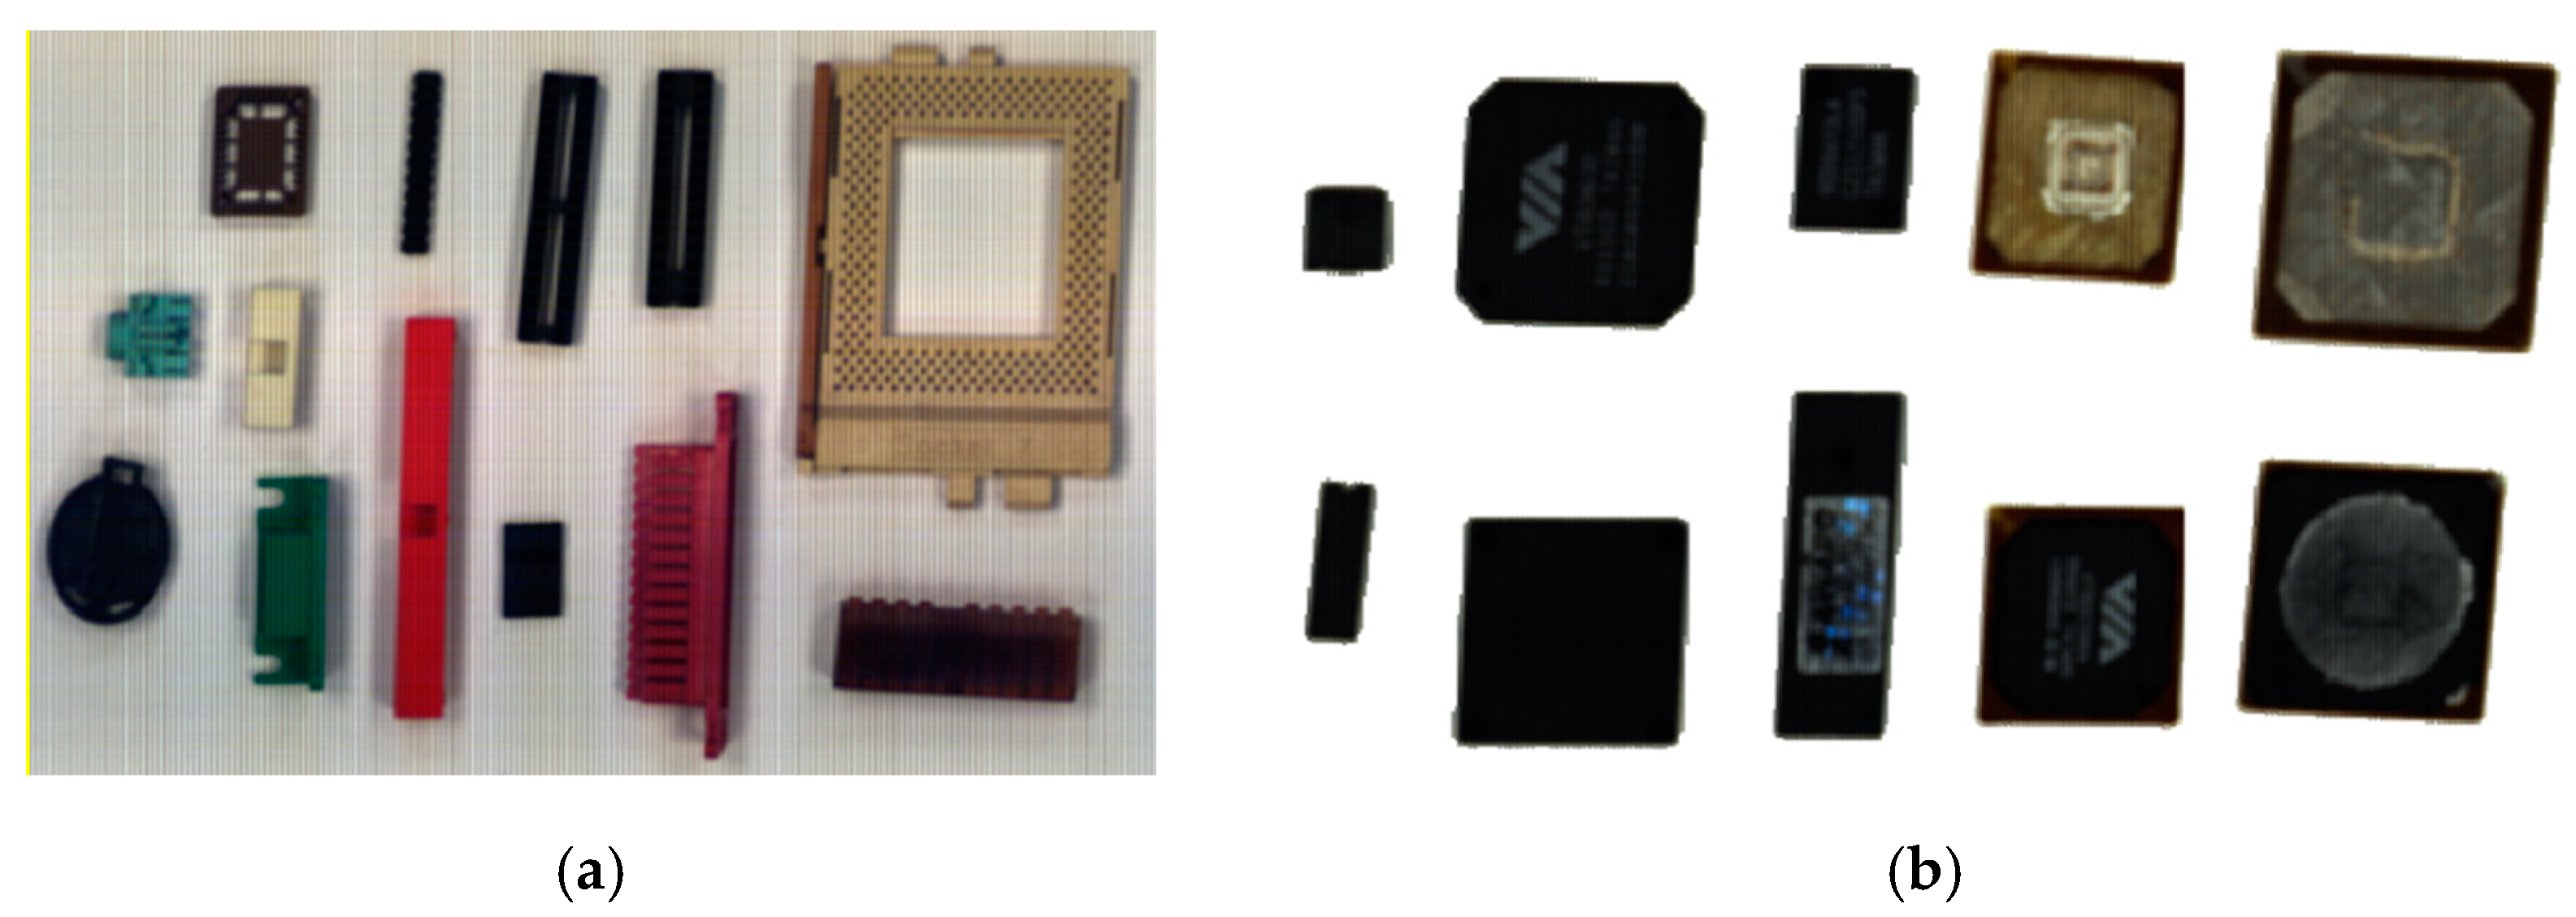
2.1. An Overview of the Sampled Materials

Several sample materials were chosen from the results of dismantlement processes (mechanical and chemical) of end-of-life personal computer PCBs. They were scanned with the help of a hyperspectral camera (Figure 2) to examine the spectral signature of each object, thus creating a reference sample database. Using the spectral signature database thus created, the experimental stand could be easily reconfigured to sort other objects.
The hyperspectral signatures were extracted from the image by applying a noise filter and running a principal component analysis (PCA) (Figure 3) so that the objects could be classified.

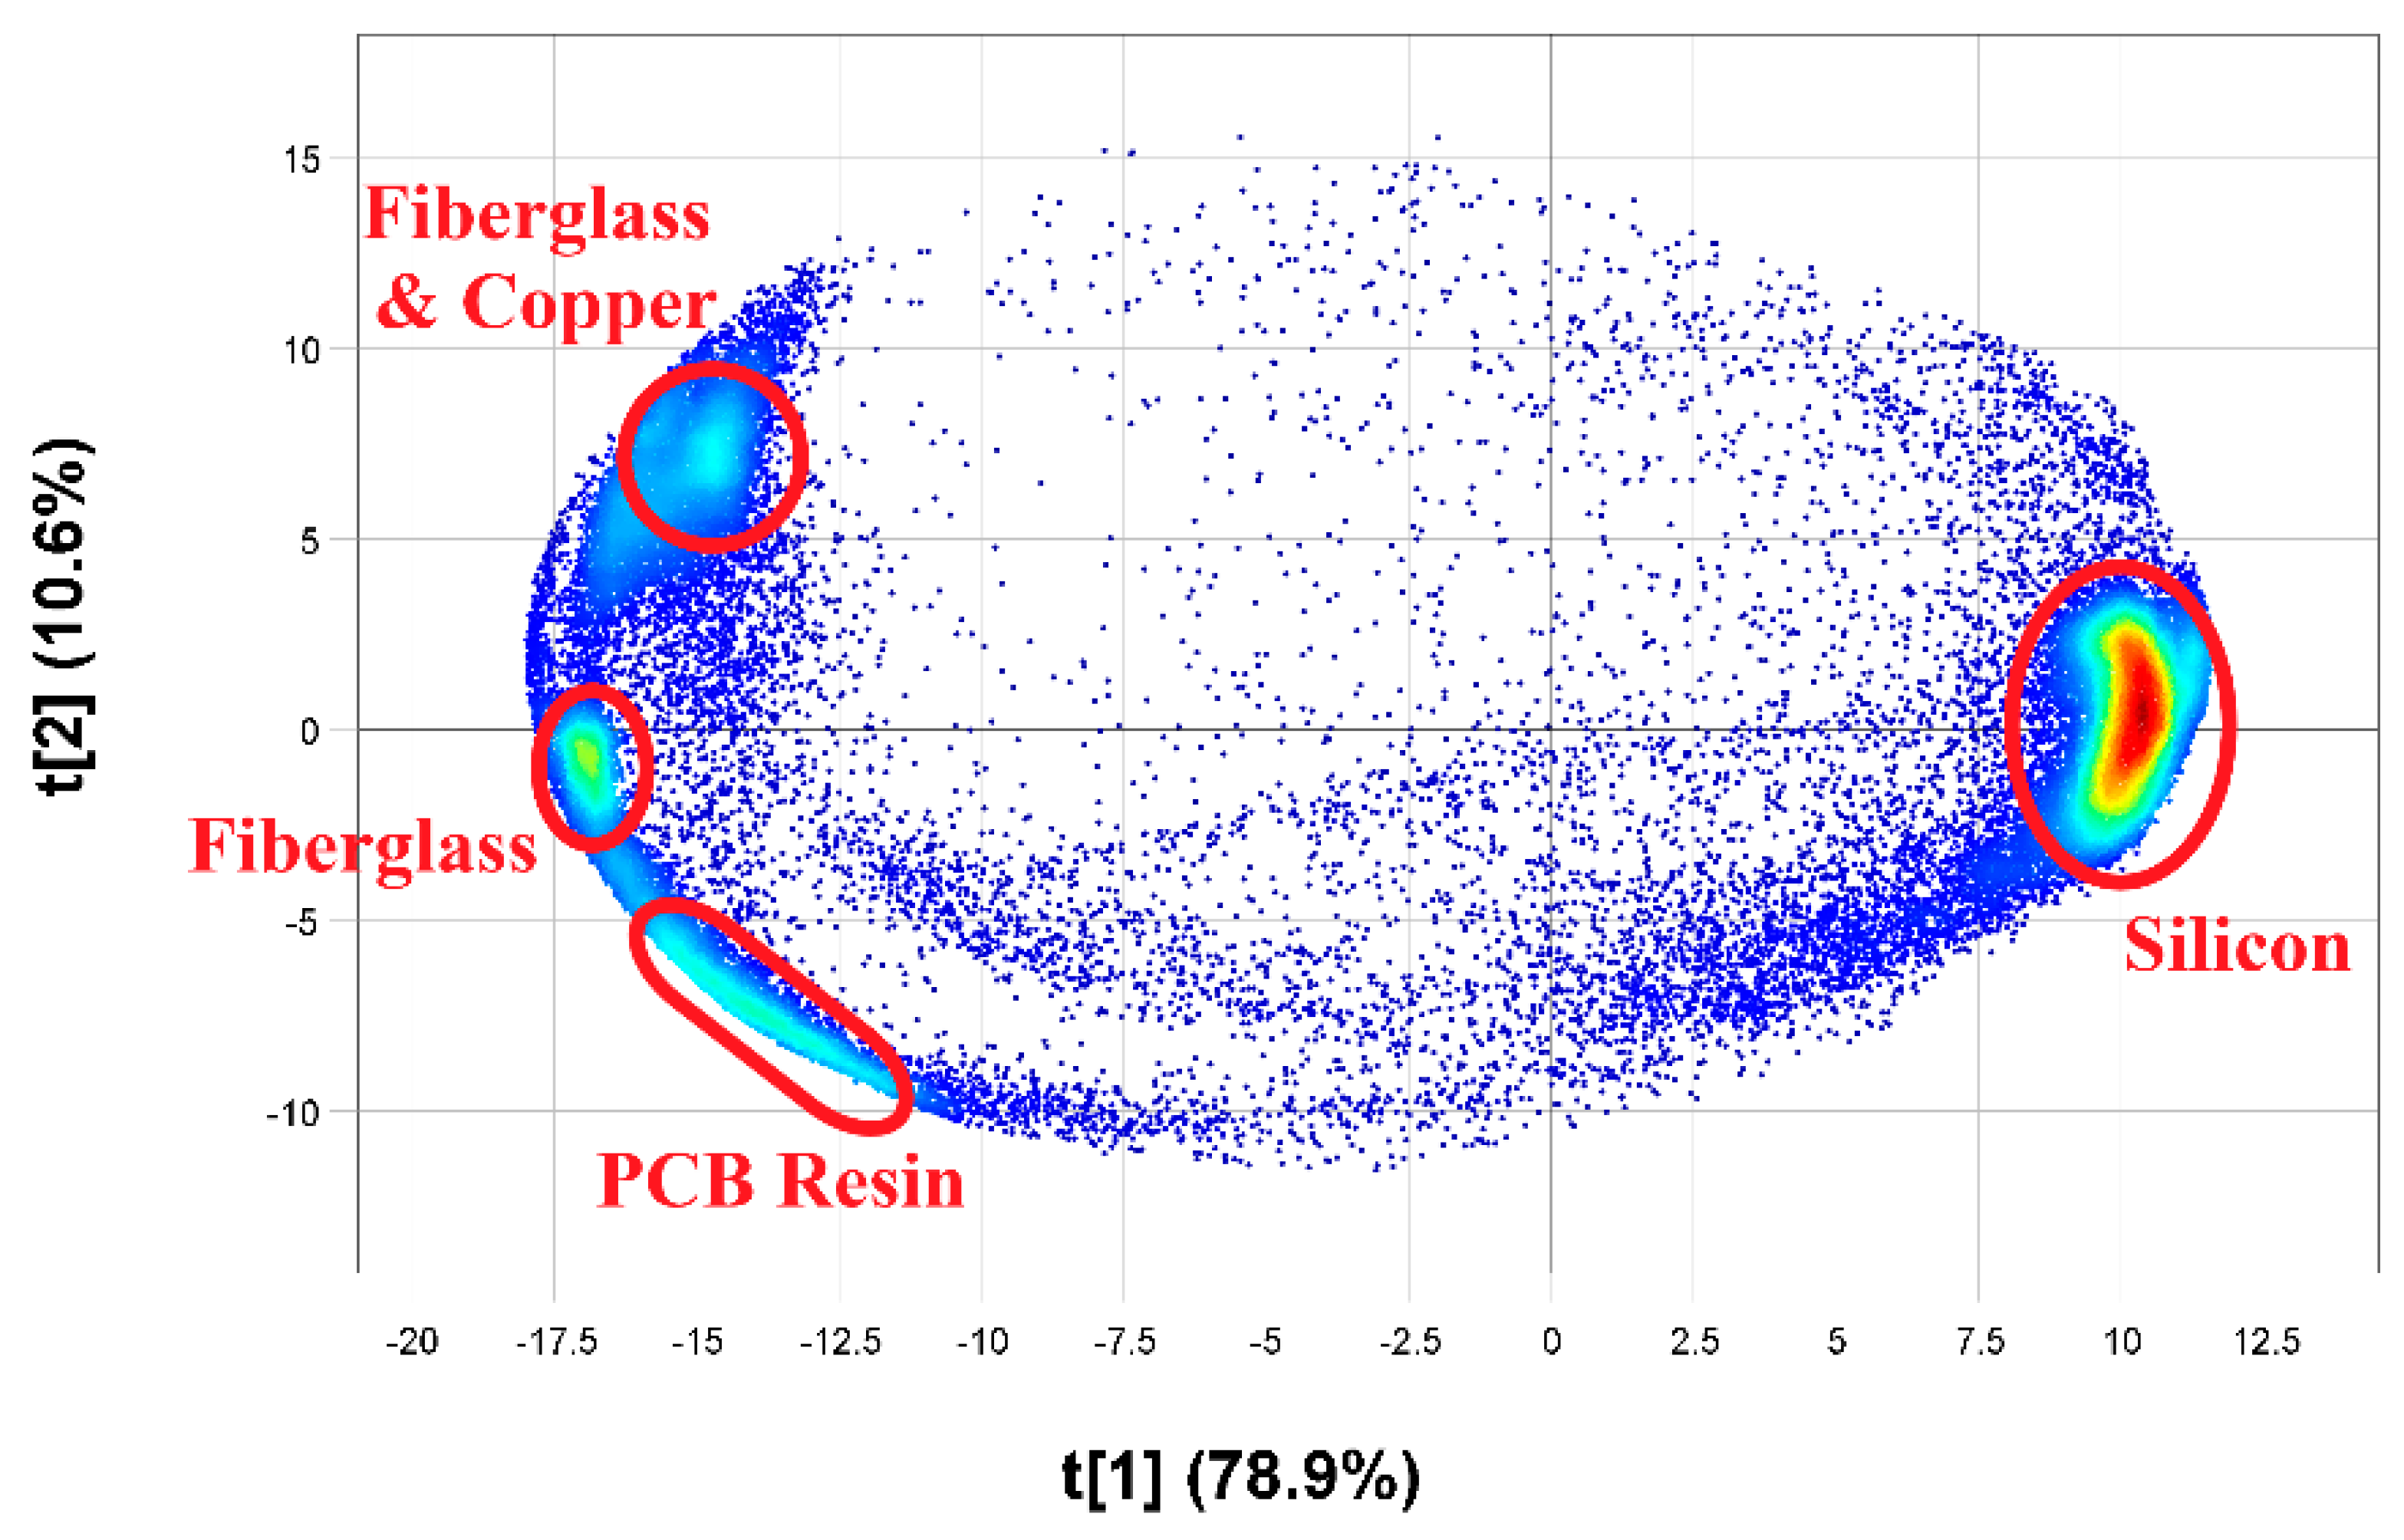
2.2. Data Acquisition of HSI

The acquisition of hyperspectral images was realized with the help of an NIR camera with wavelength spectra variation from 400 to 1000 nm. The system is based on a push-broom acquisition architecture, with a field of view of 240 mm, a pixel resolution of 1024 spatial pixels and two halogen line illumination units. The calibration of the hypercube was set up with the help of a white and black reference target. Depending on the number of wavelengths analyzed, the camera has a frame rate of 200 to 9900 Hz. The sample data were acquired with 224 bands at a frame rate of 210 Hz.

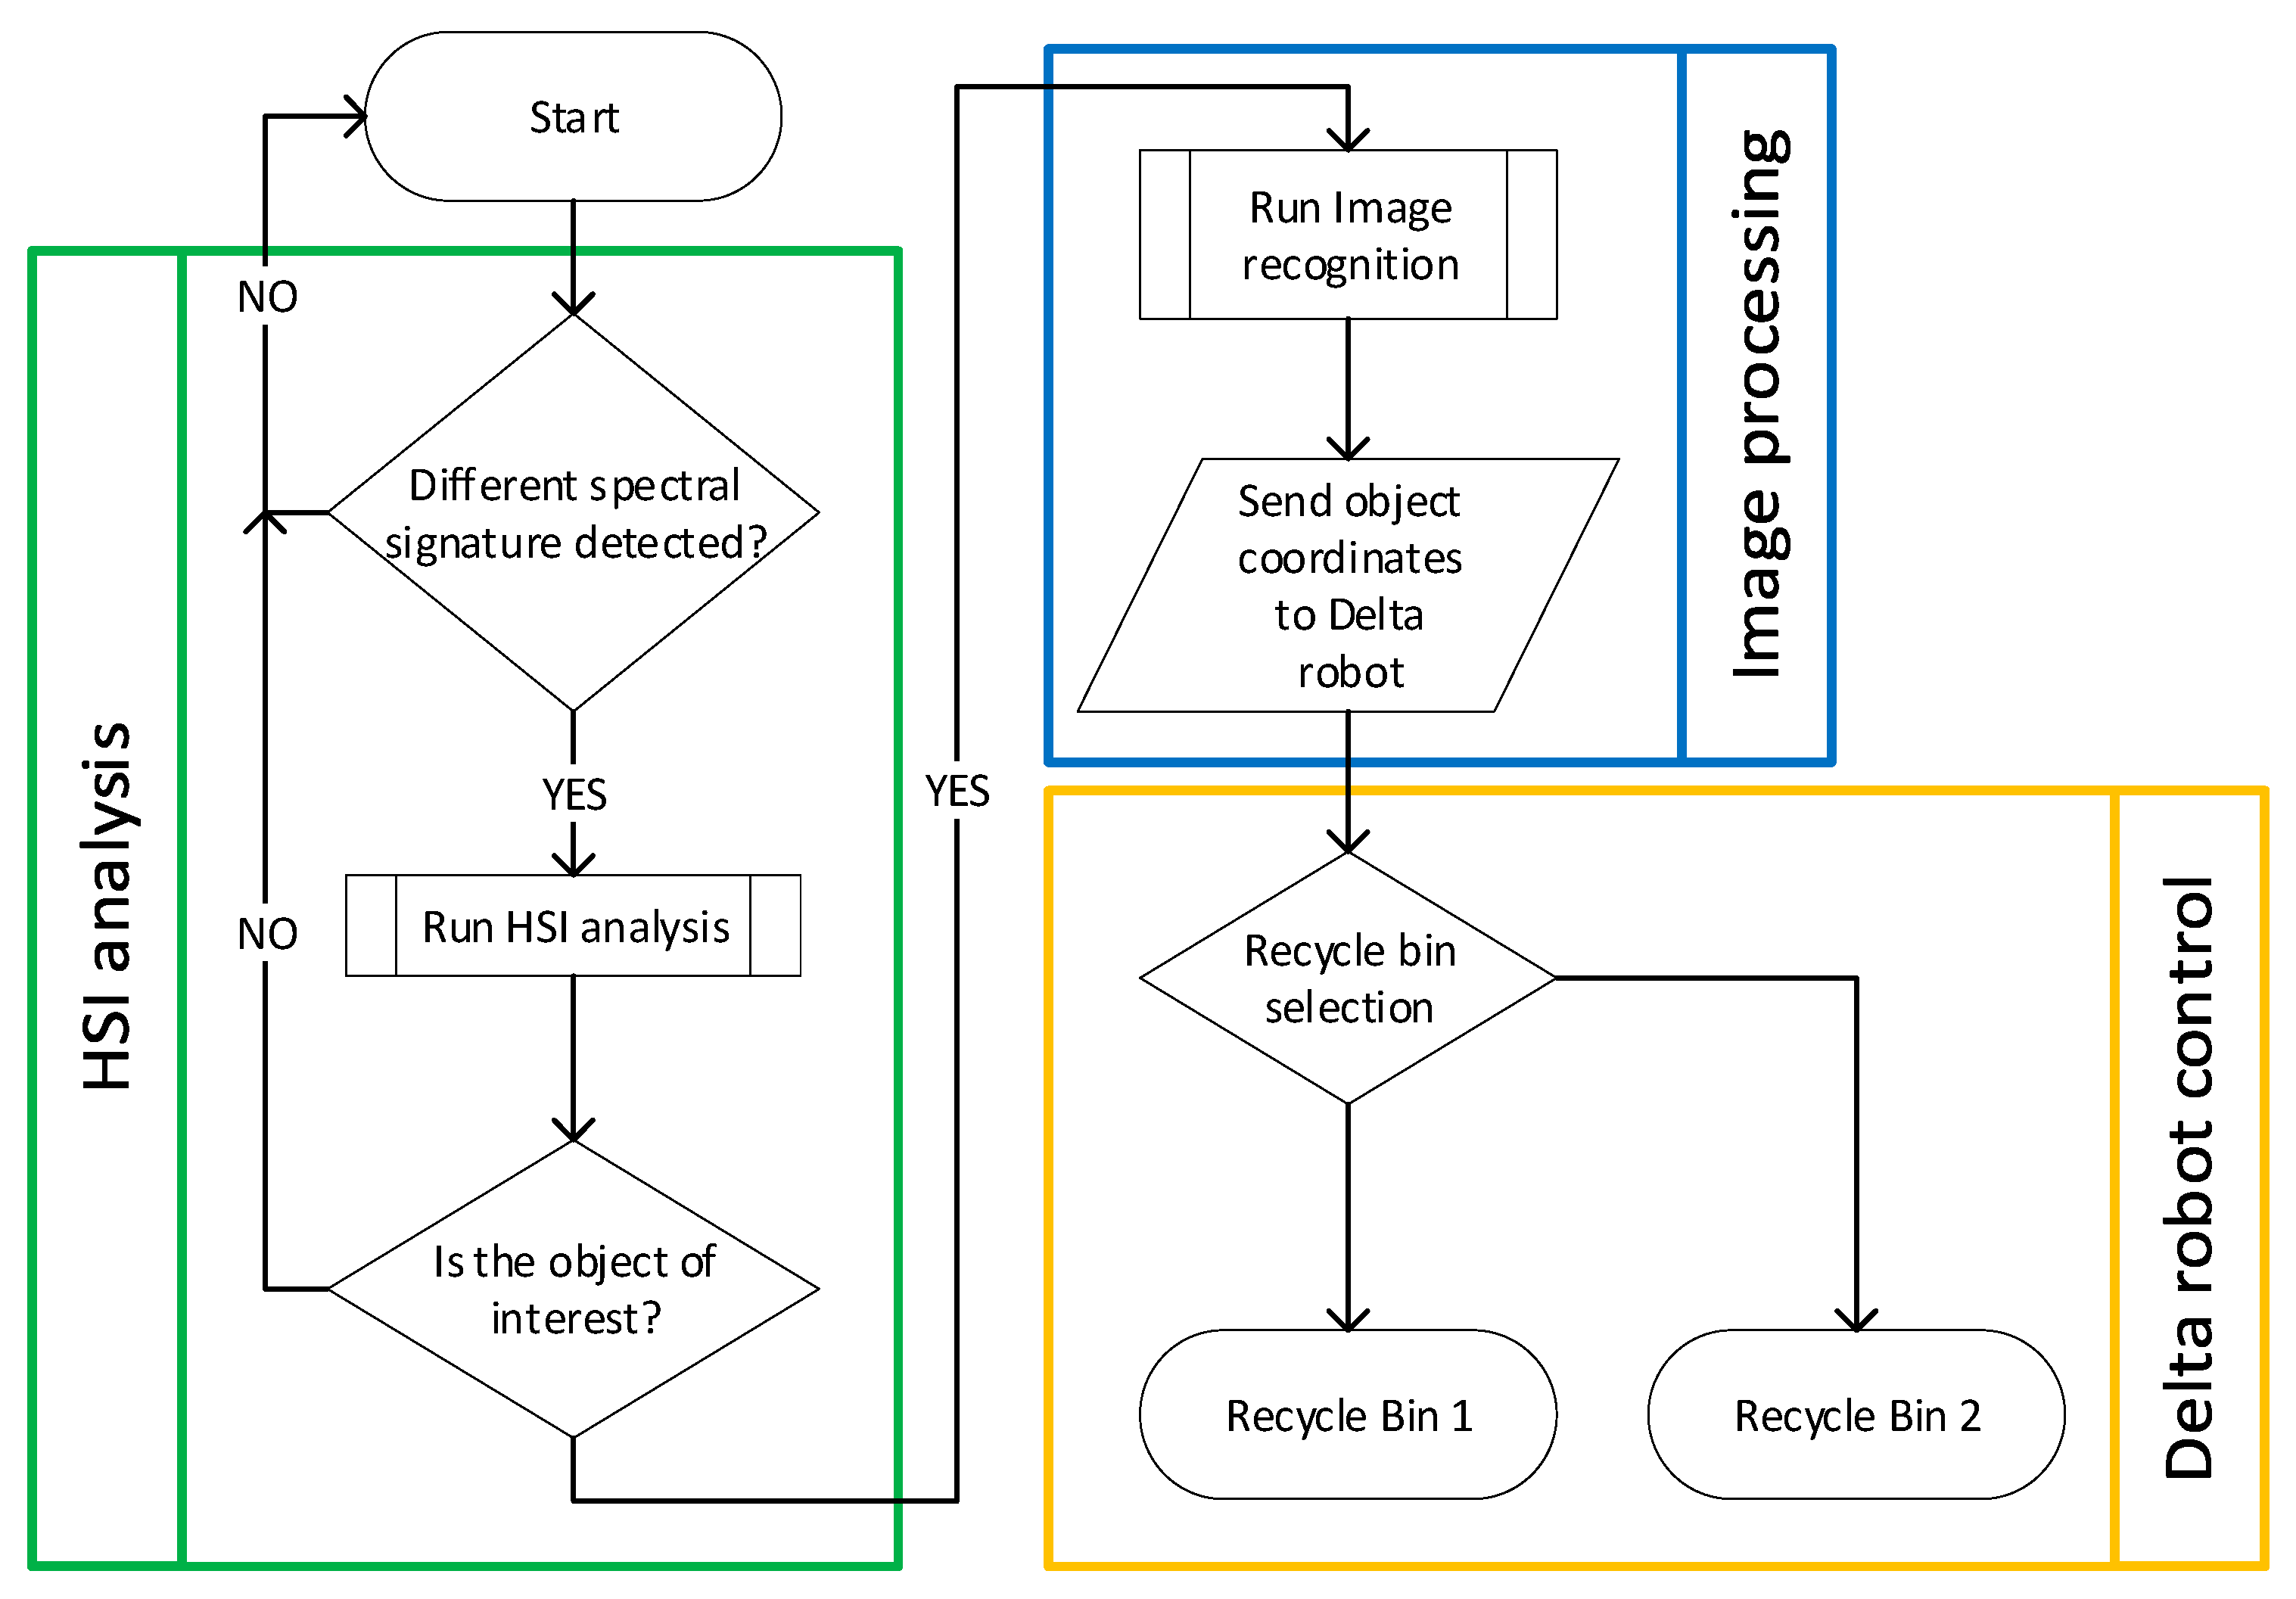
2.3. Data Processing with LabVIEW

Laboratory Virtual Instrument Engineering Workbench (LabVIEW) is a graphical programming language used to create different types of applications with the help of add-ons [36]. There are many advantages to using LabVIEW, one of which is the ability to connect to different third-party hardware (for example, a hyperspectral camera). To control the experimental sorting stand’s first stage, a total number of 2 VIs were created. With the help of the first VI, the hyperspectral images were acquired, filtered and processed to recognize the objects of interest. By implementing the above-mentioned functions in one VI, the speed of the algorithm increased. The second implemented VI was used to control the Delta robot on a serial communication protocol.

2.4. The First Stage of Sorting

The first stage of the experimental sorting stand is based on hyperspectral image analysis. The stand consists of a conveyor belt; an asynchronous motor; a Mitsubishi Electric S500 inverter; a FX10e hyperspectral camera from Specim; a halogen lighting system; and a Delta robot with a vacuum suction cup attachment (Figure 4).
The conveyor belt carries the objects for sorting, driven by the asynchronous motor controlled in frequency by the inverter. The halogen lighting system is focused under the hyperspectral camera’s field of vision (FOV) to ensure the necessary amount of light for the measurements, and the Delta robot with the vacuum suction cup is used to remove the objects from the conveyor belt.
In this stage of the sorting process, an operator places the objects to be sorted on the front end of the conveyor belt. The objects will start their travel under the hyperspectral camera first. The created analysis software will continuously scan the conveyor band, and in case it detects any spectral signature other than the conveyor belt itself, it will start to process the read spectral image. If the detected spectral signature matches one of the two objects set for sorting in the first stage, it will also determine the center of mass of the object. After the analysis process, the VI will send the X and Y coordinates for the detected object to the Delta robot to pick it up and place it in the appropriate recycle bin. The flow chart of the HSI analysis software can be viewed in Figure 5.

2.4.1. HSI Acquisition and Analysis Using LabVIEW

To establish a fast and secure connection with the FX10e hyperspectral camera, the Gigabit Ethernet (GigE) vision interface standard was used, which provided a high-speed data transmission rate (up to 900 Mbps) [37]. The high-speed transmission rate allowed the system to execute the operations in real time, thus speeding up the sorting process. Before the images were processed in real time, an ensemble image of the objects was preprocessed with the help of Evience, a Prediktera software package for hyperspectral image processing [38]. With the help of this step, the specific spectral signature of each object was pre-defined in a small database. The ensemble image taken from the hyperspectral camera was preprocessed by removing the noise with a spectral low-pass filter. After the first filtering process, a standard normal variate (SNV) was applied to the image, reducing the scattering effect in the spectral data. Principal component analysis (PCA) was applied to the preprocessed image to provide a decomposition of the acquired data into a linear combination of the original principal component (PCo) and the spectra variations. The PCo was used to deduce the characteristics and grouping of the samples taken (Figure 6).
Once the PCA study was realized and all the identified groupings were classified, a partial least squares discriminant analysis (PLS-DA) model was built for each processing set, thus testing if the identified spectral signatures are reliable (Figure 7). A total of 4 categories were created for different types of silicon chips; these included fiberglass, resin, silicon and a mixture of fiberglass and copper.
A sorting algorithm, which compares the acquired hyperspectral images from the FX10e camera with the spectral signature reference database, was implemented in LabVIEW. During the sorting process, the spectral signature of the passing object is compared with the reference database, by searching for the specific wavelength and reflectance value stored within the reference spectral signatures. This comparison decides if an object is to be sorted or not.

2.4.2. Control of the Delta X Robot with LabVIEW

A Delta-style robot was chosen to remove the objects from the conveyor belt because of its high speed and precision. The robot used for the experimental sorting stand is a Delta X, an open-source robot.
In order to control the Delta robot, a virtual prototype was firstly designed in SolidWorks, and a graphical programming algorithm was created using LabVIEW (Figure 8). The communication protocol was established via serial communication and by using a LabVIEW add-on named VISA. With the help of the VISA add-on, the communication between a workstation and the Delta robot’s central processing unit was established. The Delta robot uses the G-code language to execute the commands sent on a serial communication. To create a G-code command, a specifically formatted code had to be created. The message format is “G01 Xa Yb Zc”, where G01 is the command to move the robotic arm, and a, b and c are the coordinates resulting from the image processing (Figure 9). At the same time, the Delta robot was equipped with a suction cup to grab the necessary components. The vacuum unit can be turned on or off with two G-code commands, M03 and M05.

2.5. The Second Stage of Sorting

The second stage of the experimental sorting stand is based on a contour vision sensor. The stand (Figure 10) was constructed by using a caterpillar conveyor belt, an AC asynchronous motor controlled by a variable frequency drive (VFD), a contour vision sensor (O2D220) from IFM Electronics, an LED lighting ring with a variable color temperature and light intensity, a proximity and color sensor, four electro-pneumatic valves with directional air flow control and a programmable logic controller (PLC), Mitsubishi FX3G.
The sorting process (Figure 11) continues when an unrecognized object from the first stage passes along onto the second conveyor belt. As the component passes under the vision sensor, the algorithm will start the recognition process. The onboard recognition software of the contour vision camera can take up to 1.2 s to recognize an object, depending on the lighting conditions and the number of stored objects in its memory. The necessary data for object recognition are stored on the sensor’s nonvolatile memory. Each object programmed into the memory of the sensor has a corresponding four-digit binary code, set by the user, with each of the digits corresponding to a digital output pin. Once the vision sensor recognizes an object, it will activate the corresponding digital output ports of the sensor, which, on their end, are connected to the PLC’s digital input ports. As the PLC receives the signaling code, it will activate one of the four electro-pneumatic valves with a delay, thus removing the identified object from the conveyor belt into the appropriate sorting bin.

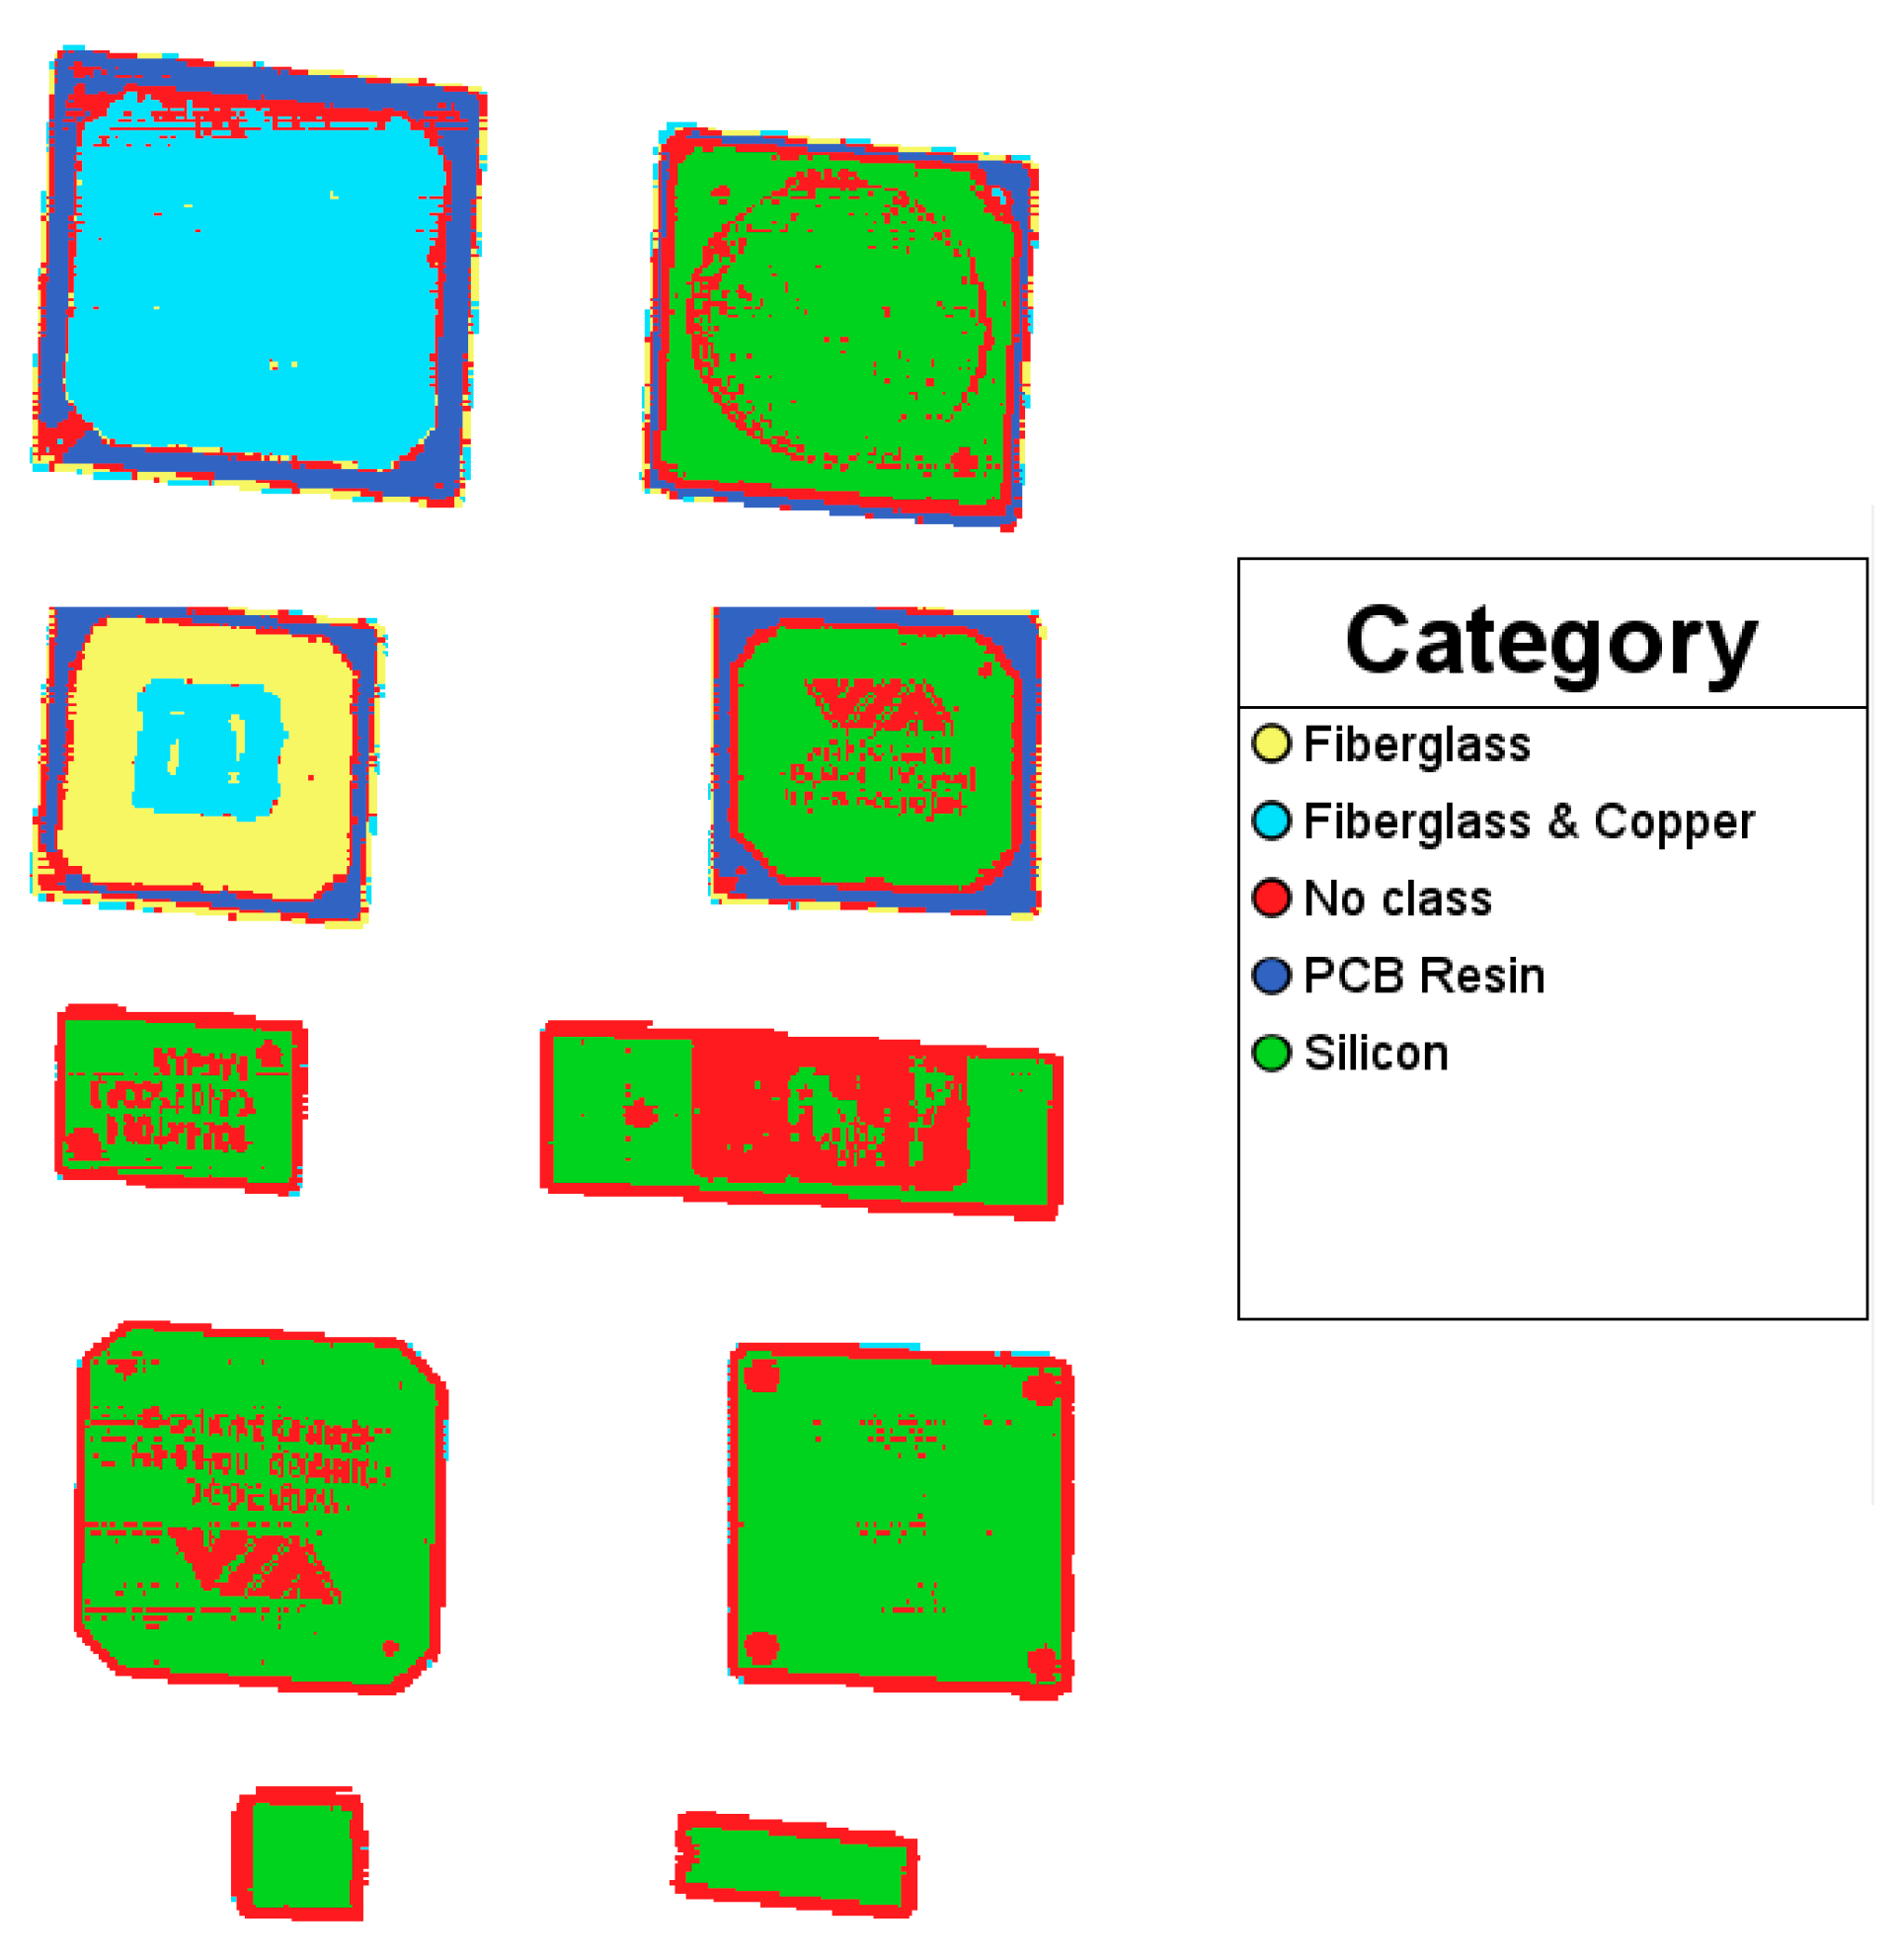
2.5.1. Contour Vision Sensor Algorithm

The contour vision sensor utilizes a specific contour detection algorithm to correctly determine the edges of the analyzed components. To identify the objects correctly, the sensor must be manually focused and set in such a manner that the object itself will occupy at least 5% of the sensor’s field of view. The evaluation algorithm was accomplished by taking into consideration the processing time, the accuracy of contour tracing, data file size and the capability of the algorithm to correctly rebuild and enlarge the saved contour data. The contour vision sensor model O2D220 from IFM uses the incident light or backlight to detect the image of a component and compares it to the several reference models saved in the nonvolatile memory of the sensor [39]. Based on the orientation, tolerance and the degree of conformity of the object, it will be classified as a “pass” or a “fail” (Figure 12). For a better understanding of the backlight detection algorithm, in case the luminosity difference between the key object (in the foreground) and the background is high, background images will be generated. When the object is in front of the sensor, this will reflect light back to it, thus producing the difference between the object and background. After running the background detection algorithm, the user can improve the detected edges and aid the software to recognize the object with a higher accuracy. Depending on the light conditions and the preferred image quality, the user can choose to use the inbuilt infrared light of the sensor which operates at a wavelength of 880 nm, or an external light source. For the proposed experimental sorting stand, an external light source is used which consists of an LED lighting ring placed around the camera and set to a color temperature of 3200 K and a light intensity of 77%; therefore, the image has a well-balanced contrast and is not over-exposed.

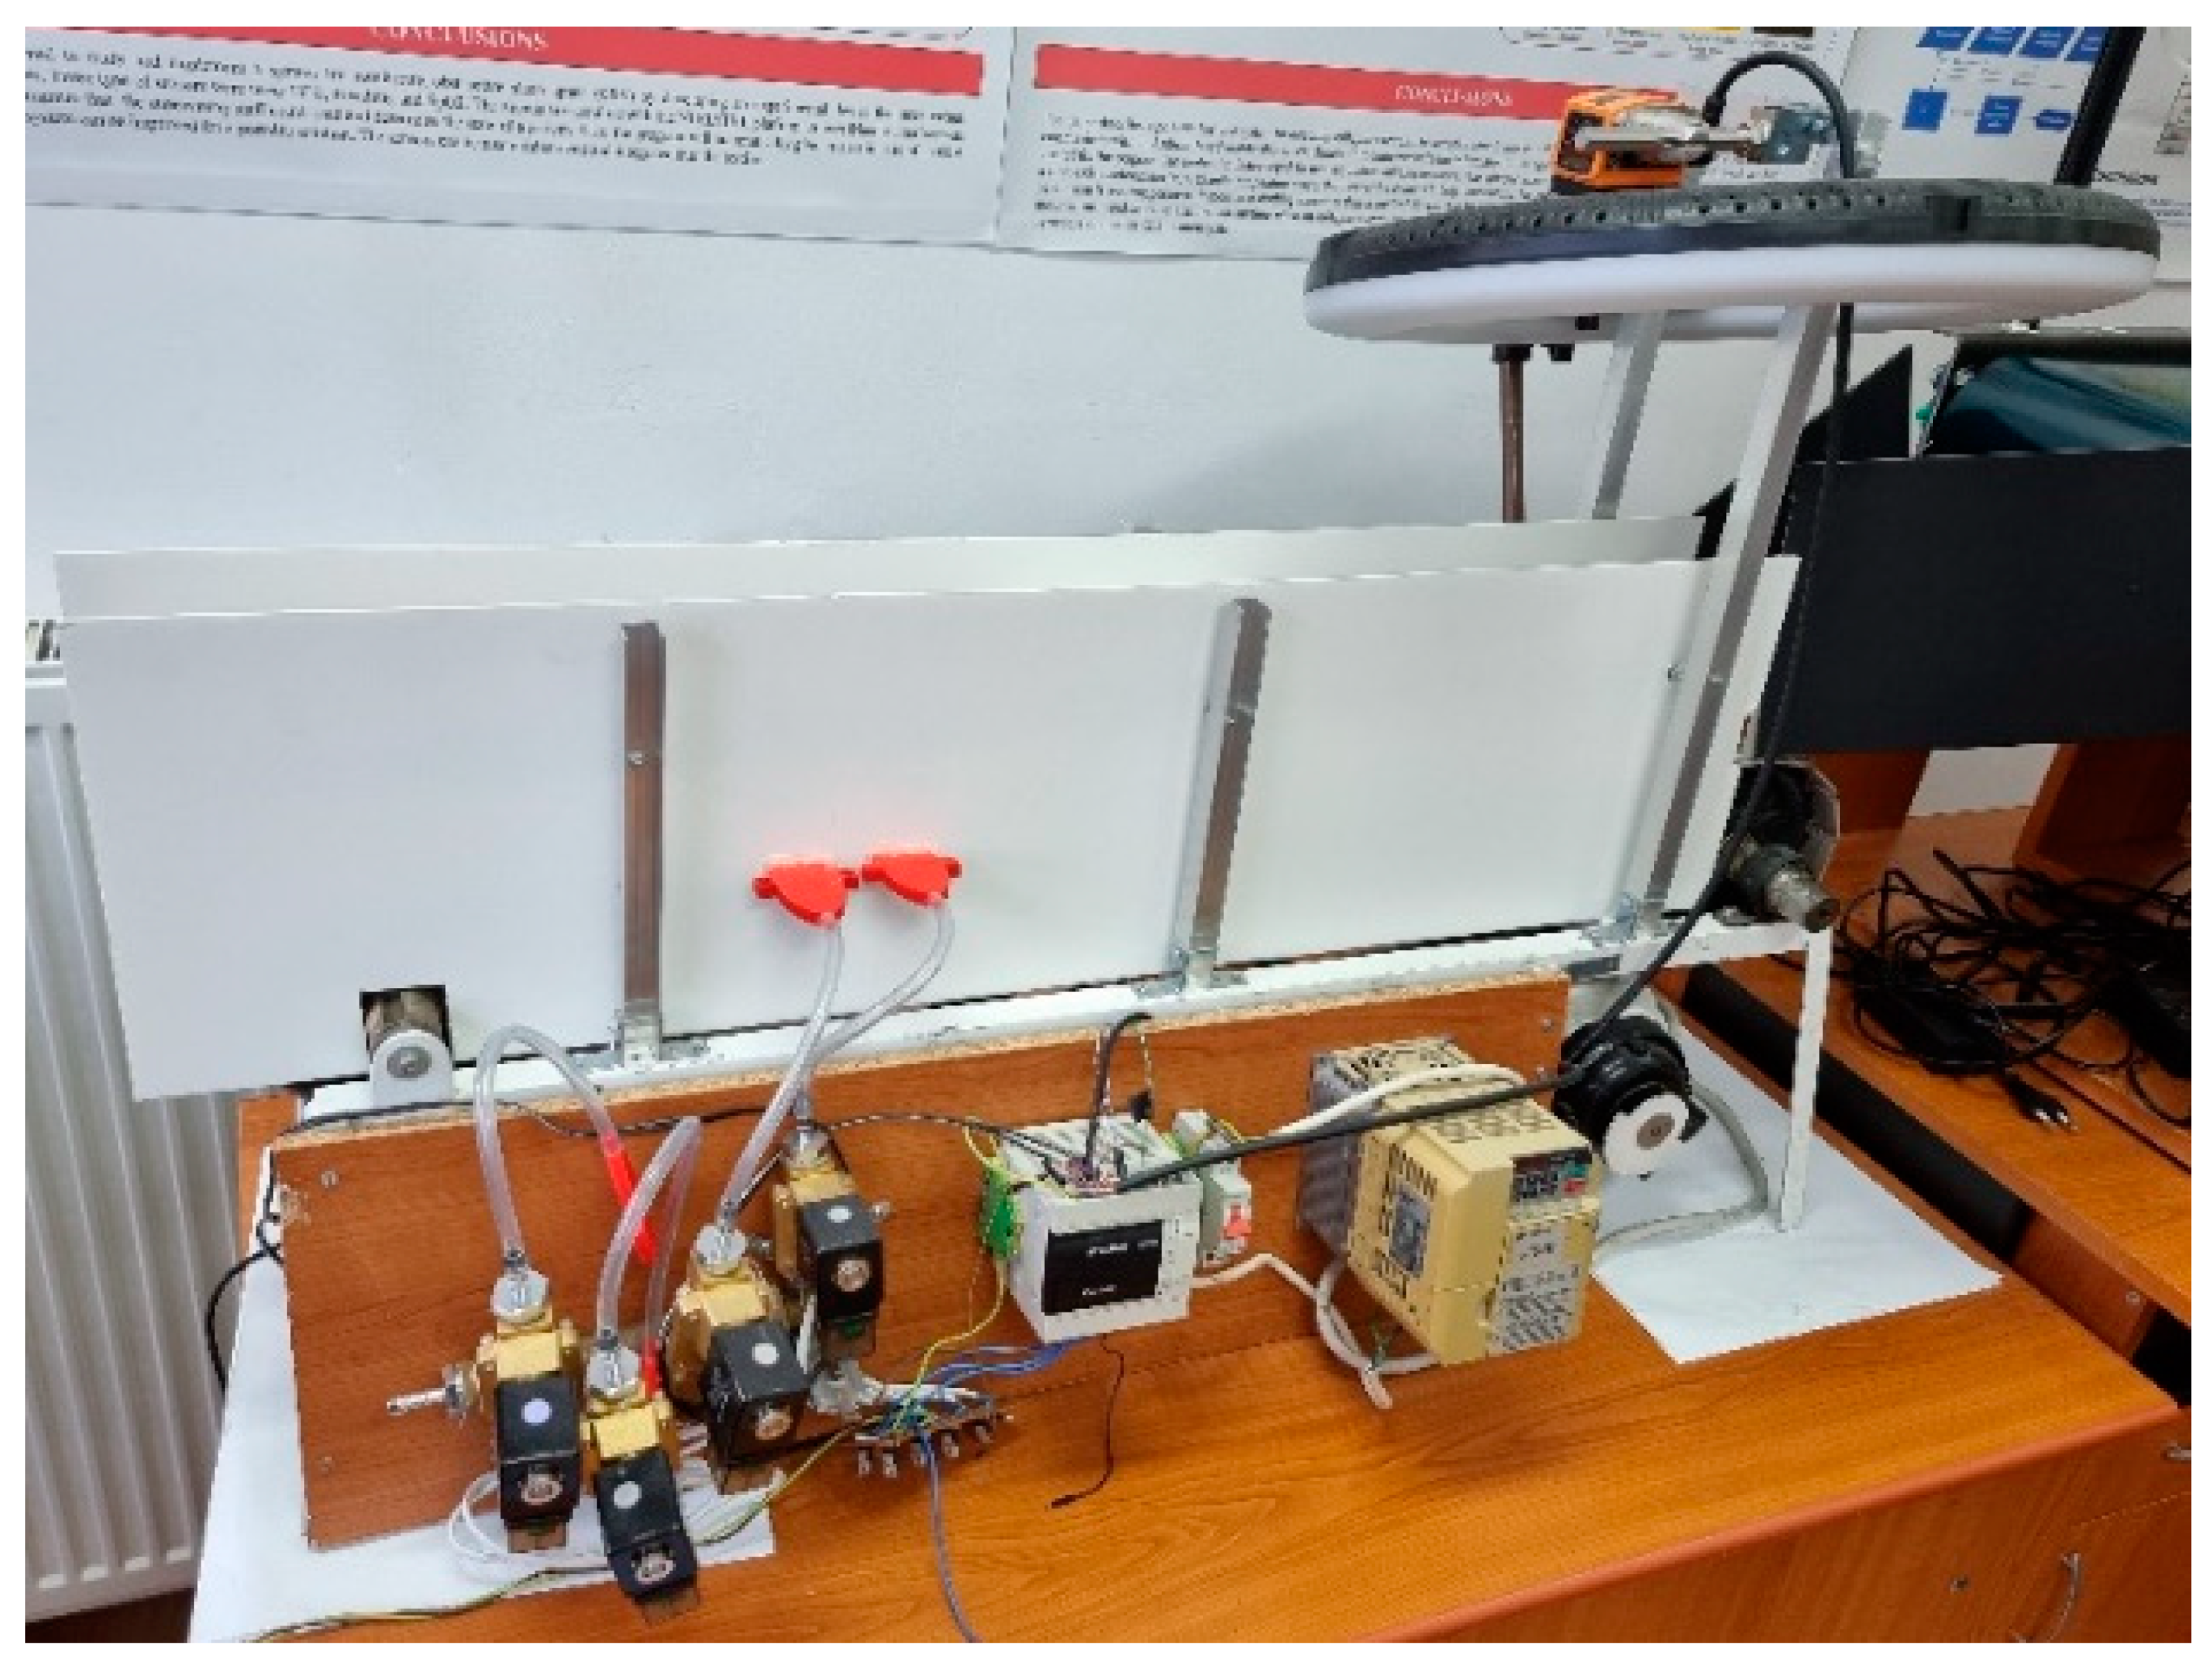
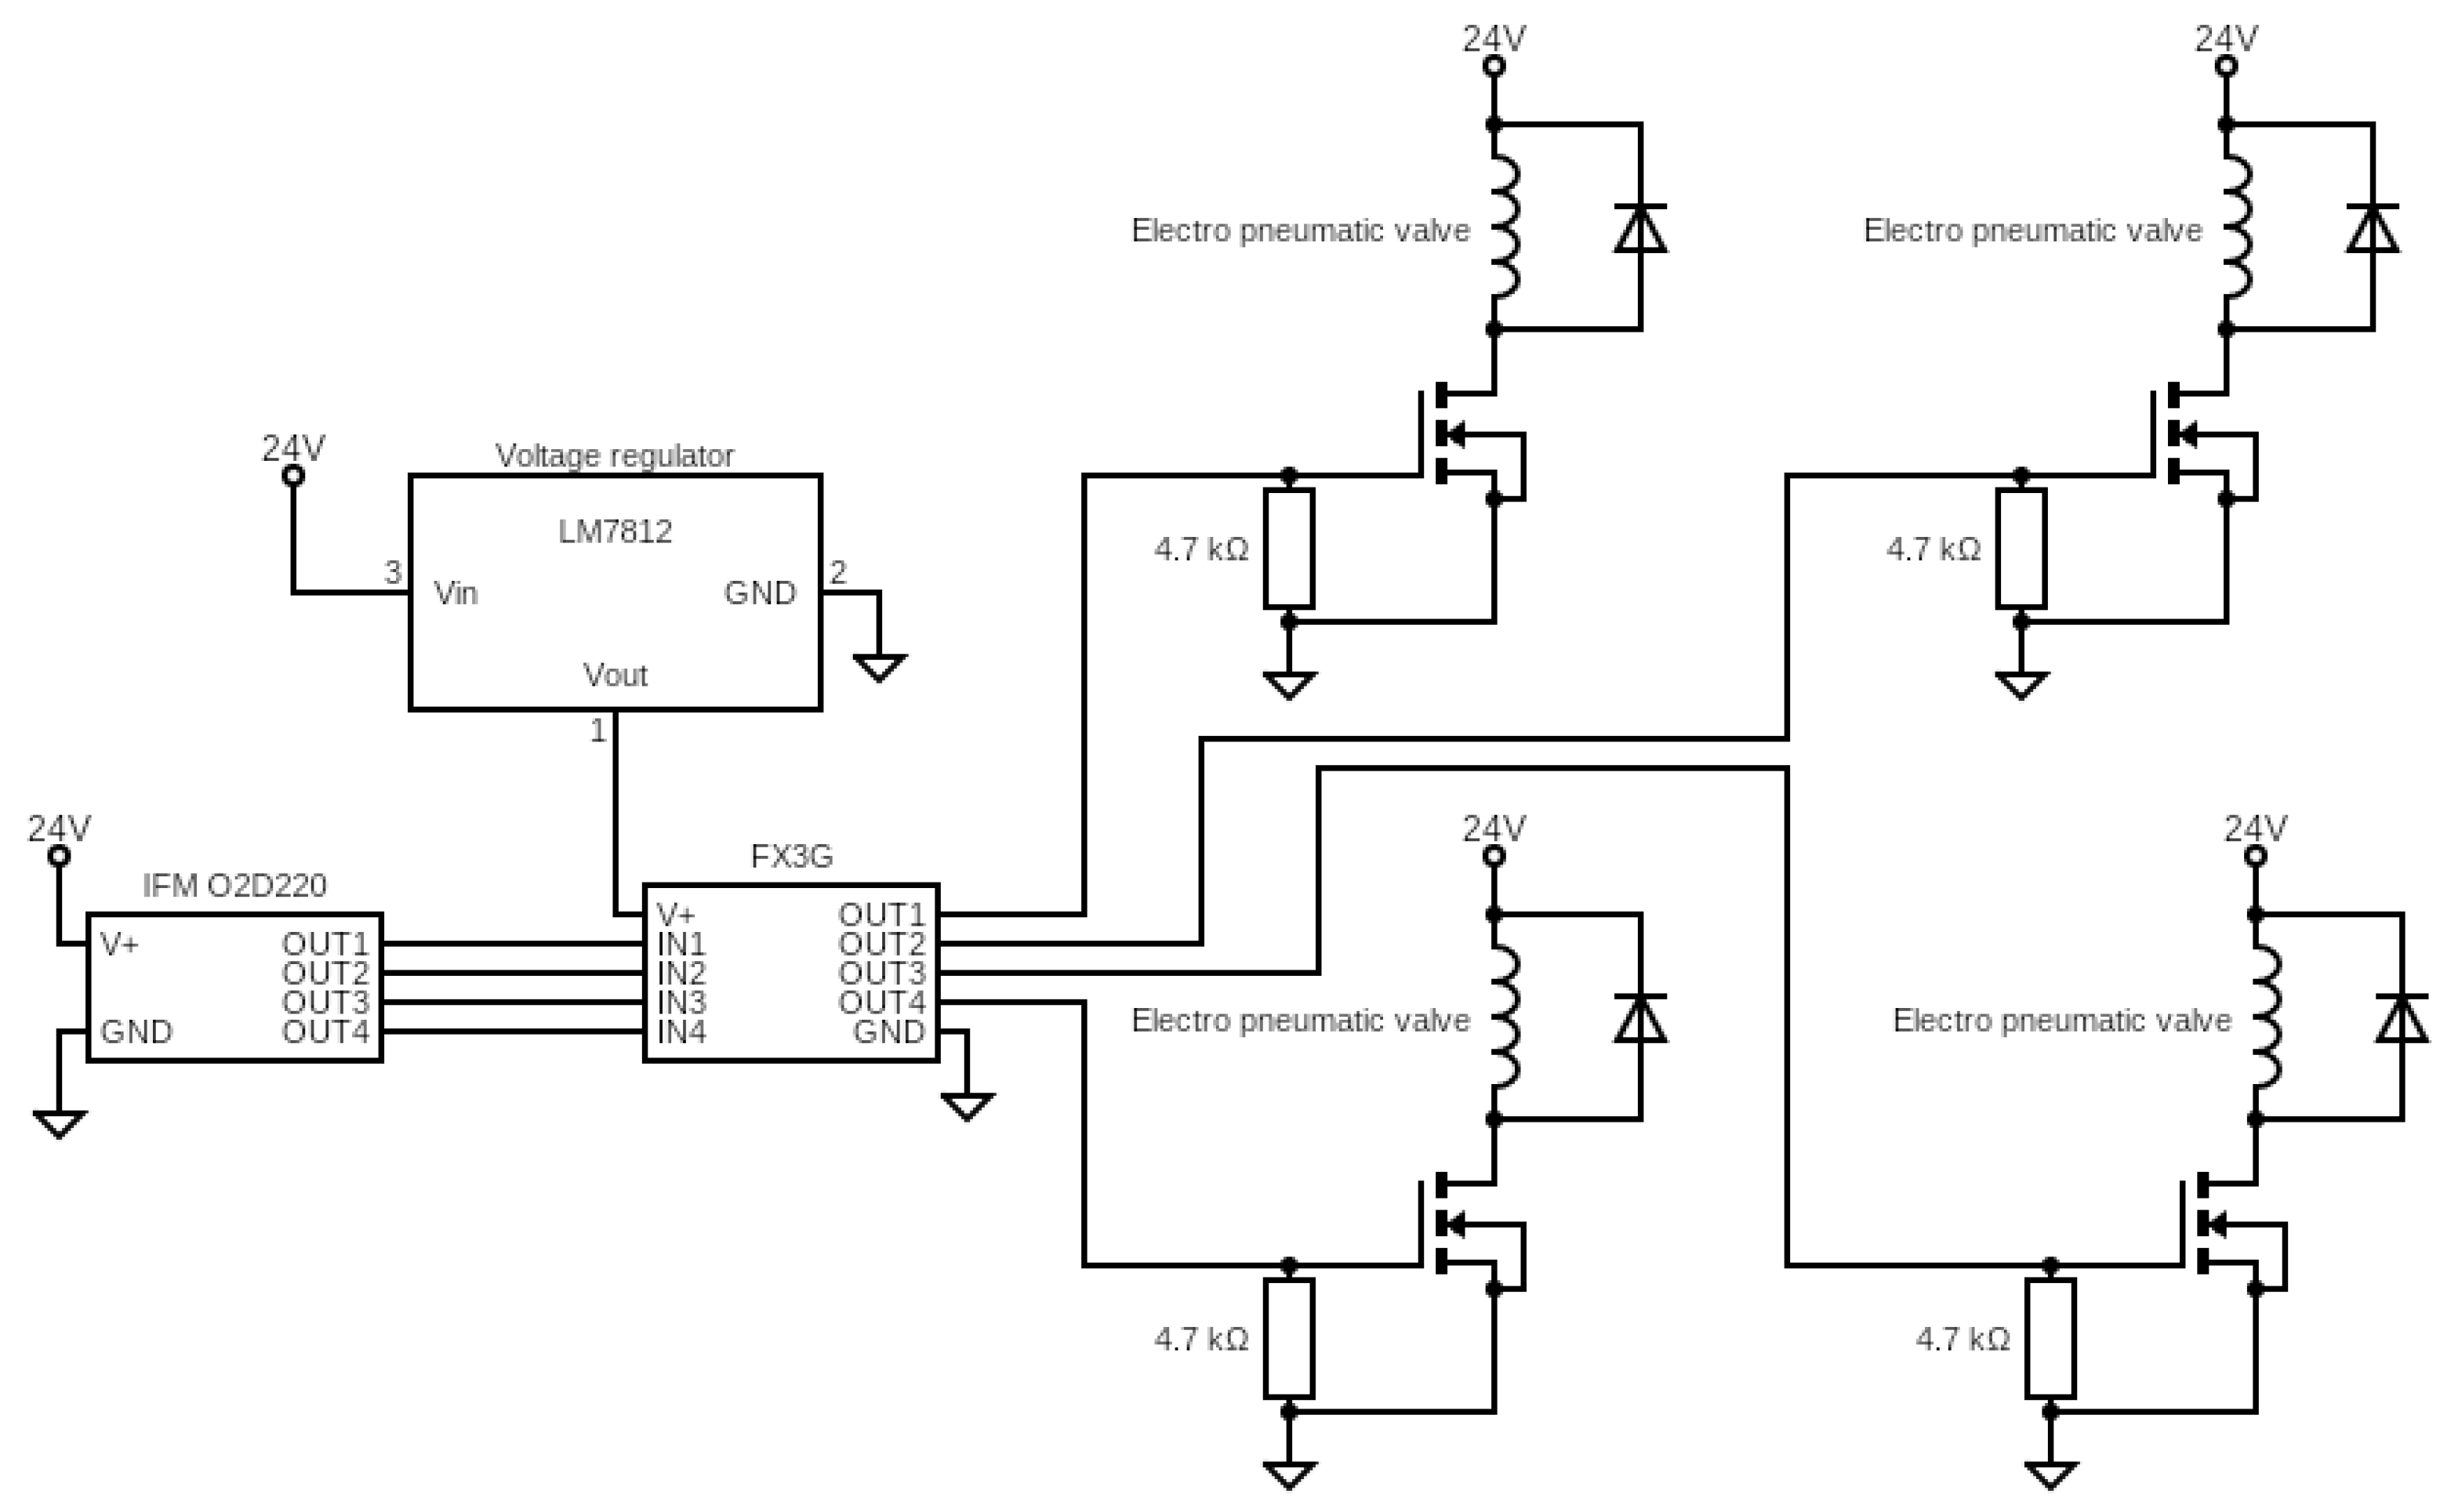
2.5.2. PLC Control System

The PLC unit and the electro-pneumatic valves use a DC voltage source of 24 V. To control the electro-pneumatic valves, each of them was connected to a MOSFET transistor. The gate of the MOSFET transistor was connected to the PLC’s digital outputs lines. As soon as one of the PLC’s outputs is activated (has a HIGH value), the current will pass through the MOSFET, therefore opening the electro-pneumatic valve. Because an electro-pneumatic valve has a coil in it, a flywheel diode was placed in parallel to protect the MOSFET from any self-generated back-electromotive force. (Figure 13)
The PLC unit was programmed using a ladder logic diagram. The digital outputs of the PLC are controlled by a sequence of instructions. At first, the inputs coming from the vision sensor will be stored in a register, and afterwards, the stored value will be compared to the memorized data, which will activate one of the digital outputs of the PLC and actuate one of the electro-pneumatic valves.

3. Results and Discussions

The first conveyor belt was programmed with the help of a LabVIEW algorithm to detect and sort two categorized materials (silicon chips and silicon chips with resin). The objects to be sorted are loaded on the front of the conveyor belt, and while they travel along the conveyor, the created algorithm will determine which objects need to be sorted at this stage.
Two different sorting bins were placed in the work area of the Delta robot, one for simple silicon chips and another one for silicon chips which also contain resin residue. The Delta robot has a maximum working speed of 0.7 m/s, allowing the conveyor belt to move at a higher speed.
To optimize the speed of the system, only specific spectral lengths were chosen to be read and analyzed (Table 1). This way, the algorithm can determine if the scanned object is to be sorted or not in a faster manner. By reducing the number of spectral wavelengths scanned from 224 bands to 80 bands, the processing speed of the software was increased by 64%. The total amount of time needed to read the hyperspectral images and process them after the optimization takes about an average of 438 ms. The reduction in the number of wavelengths read ensures that the hyperspectral camera will not pick up any other types of materials that are not intended for processing (finer particles of dirt and dust). In addition, to help avoid the processing of any unwanted smaller particles, the implemented image processing algorithm uses a particle filter to remove small pixel spots from the image. By increasing the processing speed, both the conveyor belt speed and the hyperspectral camera speed could also be increased. The best values obtained for processing were 170 frames per second for the hyperspectral camera and a speed of 0.061 m/s for the conveyor belt. These settings of the system obtained the best possible results.
The second conveyor belt controlled by a PLC sorts the objects coming from the first sorting stage with the help of a contour vision sensor. The second stage of sorting has in total three sorting bins. One is for components containing fiber glass, one is for silicon components which are too small for the robotic arm to handle and the third is for plastic components.
For a more accurate sorting, the second conveyor belt speed was maintained at an approximate speed of 0.066 m/s, which assured that the contour vision sensor would detect the objects moving underneath it. If the vision sensor matches the shape of the object to one from its internal database with a minimum match percentile of 80%, it will declare it as a pass, and the PLC algorithm will decide which of the electro-pneumatic valves will be triggered.
The experimental sorting stand was calibrated to sort a total of five different WEEE categories disassembled from old personal computer units. The categories included were small and large silicon chips, fiberglass, silicon chips with resin residue and plastic components. To calibrate the sorting stand, every variant of the components was individually registered and processed for testing. The registered components were tested at least 10 times to ensure a minimum recognition rate of 80% (2 out of 10 could fail). Following the calibration process, the experimental stand was tested using all the components available. These were run through the sorting process 10 times to obtain the average accuracy of the experimental sorting stand. All the components were placed randomly on the conveyor belt for each case studied. After the sorting process finished for a case, each sorting bin was evaluated to see if it contained the correct number of components. If a sorting bin did not contain all the components intended, the percentage for that category was reduced. After passing through 10 cases, the overall accuracy of the experimental sorting stand was 89% (Table 2).

4. Conclusions

The implemented two-stage experimental sorting stand was able to differentiate a total of five waste electrical and electronics equipment materials taken from discarded personal computer mother boards, with the help of a hyperspectral camera and a contour vision sensor. All the components from the PCs’ motherboards were the result of a previous different chemical process. A standalone LabVIEW application was developed for the first stage of sorting. The application recognizes two different types of materials to be sorted in the appropriate sorting bin with the help of a hyperspectral camera. A second application was created for a PLC unit used for the second stage of sorting; this includes a contour vision sensor that recognizes different contoured objects to be sorted in two different sorting bins. After the sorting stages, a fifth sorting bin collects the remaining plastic components. A total of two applications were created and optimized in the implementation stage.
The presented results were achieved under specific laboratory conditions. Because of the sensitivity of the hyperspectral camera to different types of light sources, a dark room was used to analyze the studied materials.
As a future improvement, the experimental stand could be built inside a black chamber; thus, no external light could infiltrate and damage the readings of the hyperspectral camera. Another improvement could be achieved by introducing a monitoring system to oversee the sorting process in real time from a distance.
The created algorithm can easily be modified to detect other types of materials. To improve the speed of the system, the algorithms could be implemented directly on a field-programmable gate array (FPGA), thus raising the stability, the efficiency and—most importantly—the analysis and sorting speed.
The proposed experimental stand could be easily scaled up to industrial scale. With this type of implementation, a wider variety of components could be sorted as a function of the recycling plant’s requirements. Such an approach has high potential for reducing the manipulation costs of discarded electronics and sorted materials.

Author Contributions

Conceptualization, L.R., H.R. and M.P.; methodology, H.R. and L.R.; software, L.R., H.R., R.C. and R.R.; validation, H.R., M.P., L.G. and F.D.; formal analysis, M.P. and H.R.; investigation, F.D. and R.C.; resources, M.P. and H.R.; data curation, L.G., F.D., H.R., R.C., R.R. and L.R.; writing—original draft preparation, L.R.; writing—review and editing, H.R. and M.P.; visualization, L.G., F.D., H.R., R.C., R.R. and L.R.; supervision, M.P. and H.R.; project administration, M.P.; funding acquisition, M.P. All authors have read and agreed to the published version of the manuscript.

Funding

This research was funded by the Romanian Ministry of Research and Innovation, CCCDI-UEFISCDI grant number PN-III-P1-1.2-PCCDI-2017-0652/84PCCDI/2018 within PNCDI III.

Acknowledgments

This work was supported by a grant of the Romanian Ministry of Research and Innovation, CCCDI-UEFISCDI, project number PN-III-P1-1.2-PCCDI-2017-0652/84PCCDI/2018, within PNCDI III.

Conflicts of Interest

The authors declare no conflict of interest.

References

  1. Perkins, D.N.; Drisse, M.-N.B.; Nxele, T.; Sly, P.D. E-Waste: A Global Hazard. Ann. Glob. Heal. 2014, 80, 286–295. [Google Scholar] [CrossRef]
  2. Vermeșan, H.; Tiuc, A.-E.; Purcar, M. Advanced recovery techniques of waste materials from IT and telecommunication equipment Printed Circuit Boards. Sustainability 2019, 12, 74. [Google Scholar] [CrossRef] [Green Version]
  3. Hilty, L.M. Electronic waste—An emerging risk? Environ. Impact Assess. Rev. 2005, 25, 431–435. [Google Scholar] [CrossRef]
  4. Widmer, R.; Oswald-Krapf, H.; Sinha-Khetriwal, D.; Schnellmann, M.; Böni, H. Global perspectives on e-waste. Environ. Impact Assess. Rev. 2005, 25, 436–458. [Google Scholar] [CrossRef]
  5. He, W.; Li, G.; Ma, X.; Wang, H.; Huang, J.; Xu, M.; Huang, C. WEEE recovery strategies and the WEEE treatment status in China. J. Hazard. Mater. 2006, 136, 502–512. [Google Scholar] [CrossRef]
  6. EUR-Lex-32002L0096-EN-EUR-Lex. Available online: https://eur-lex.europa.eu/legal-content/EN/TXT/?uri=celex%3A32002L0096 (accessed on 18 August 2021).
  7. EUR-Lex-02012L0019-20180704-EN-EUR-Lex. Available online: https://eur-lex.europa.eu/legal-content/EN/TXT/?uri=CELEX%3A02012L0019-20180704 (accessed on 18 August 2021).
  8. Ongondo, F.; Williams, I.; Cherrett, T. How are WEEE doing? A global review of the management of electrical and electronic wastes. Waste Manag. 2011, 31, 714–730. [Google Scholar] [CrossRef]
  9. Candiani, G.; Picone, N.; Pompilio, L.; Pepe, M.; Colledani, M. Characterization of Fine Metal Particles Derived from Shredded WEEE Using a Hyperspectral Image System: Preliminary Results. Sensors 2017, 17, 1117. [Google Scholar] [CrossRef] [Green Version]
  10. Tehrani, A.; Karbasi, H. A novel integration of hyper-spectral imaging and neural networks to process waste electrical and electronic plastics. In Proceedings of the 2017 IEEE Conference on Technologies for Sustainability (SusTech), Phoenix, AZ, USA, 12–14 November 2017; pp. 1–5. [Google Scholar]
  11. Picón, A.; Ghita, O.; Bereciartua, A.; Echazarra, J.; Whelan, P.F.; Iriondo, P. Real-time hyperspectral processing for automatic nonferrous material sorting. J. Electron. Imaging 2012, 21, 013018. [Google Scholar] [CrossRef] [Green Version]
  12. Bigum, M.; Brogaard, L.K.-S.; Christensen, T.H. Metal recovery from high-grade WEEE: A life cycle assessment. J. Hazard. Mater. 2012, 207-208, 8–14. [Google Scholar] [CrossRef]
  13. Bonifazi, G.; Capobianco, G.; Palmieri, R.; Serranti, S. Hyperspectral Imaging Applied to the Waste Recycling Sector. Available online: www.spectroscopyeurope.com (accessed on 18 August 2021).
  14. Fiore, L.; Bonifazi, G.; Hennebert, P.; Serranti, S. Development of a selection system based on hyperspectral imaging for plastic waste with brominated flame retardants. Environ. Eng. Manag. J. 2020, 19, 1755–1763. [Google Scholar] [CrossRef]
  15. Bonifazi, G.; Gasbarrone, R.; Palmieri, R.; Serranti, S. Near infrared hyperspectral imaging-based approach for end-of-life flat monitors recycling. At-Automatisierungstechnik 2020, 68, 265–276. [Google Scholar] [CrossRef]
  16. Maisel, F.; Chancerel, P.; Dimitrova, G.; Emmerich, J.; Nissen, N.F.; Schneider-Ramelow, M. Preparing WEEE plastics for recycling—How optimal particle sizes in pre-processing can improve the separation efficiency of high quality plastics. Resour. Conserv. Recycl. 2020, 154, 104619. [Google Scholar] [CrossRef]
  17. Wu, X.; Li, J.; Yao, L.; Xu, Z. Auto-sorting commonly recovered plastics from waste household appliances and electronics using near-infrared spectroscopy. J. Clean. Prod. 2020, 246, 118732. [Google Scholar] [CrossRef]
  18. Wagner, F.; Peeters, J.; De Keyzer, J.; Janssens, K.; Duflou, J.; Dewulf, W. Towards a more circular economy for WEEE plastics—Part B: Assessment of the technical feasibility of recycling strategies. Waste Manag. 2019, 96, 206–214. [Google Scholar] [CrossRef] [PubMed]
  19. Gao, X.; Heinemann, P.H.; Irudayaraj, J. Non-destructive apple bruise on-line test and classification with Raman spectroscopy. In Proceedings of the 2003 ASAE Annual Meeting, Las Vegas, NV, USA, 27–30 July 2003. [Google Scholar] [CrossRef]
  20. Anzano, J.; Casanova, M.-E.; Bermúdez, M.-S.; Lasheras, R.-J. Rapid characterization of plastics using laser-induced plasma spectroscopy (LIPS). Polym. Test. 2006, 25, 623–627. [Google Scholar] [CrossRef]
  21. Carlomagno, G.; Capozzo, L.; Attolico, G.; Distante, A. Non-destructive grading of peaches by near-infrared spectrometry. Infrared Phys. Technol. 2004, 46, 23–29. [Google Scholar] [CrossRef]
  22. ElMasry, G.; Wang, N.; El-Sayed, A.; Ngadi, M. Hyperspectral imaging for nondestructive determination of some quality attributes for strawberry. J. Food Eng. 2007, 81, 98–107. [Google Scholar] [CrossRef]
  23. Lammertyn, J.; Peirs, A.; De Baerdemaeker, J.; Nicolaı, B. Light penetration properties of NIR radiation in fruit with respect to non-destructive quality assessment. Postharvest Biol. Technol. 2000, 18, 121–132. [Google Scholar] [CrossRef]
  24. Shaw, G.; Manolakis, D. Signal processing for hyperspectral image exploitation. IEEE Signal Process. Mag. 2002, 19, 12–16. [Google Scholar] [CrossRef]
  25. Yun, Y.-H.; Li, H.-D.; Deng, B.-C.; Cao, D.-S. An overview of variable selection methods in multivariate analysis of near-infrared spectra. TrAC Trends Anal. Chem. 2019, 113, 102–115. [Google Scholar] [CrossRef]
  26. Chong, I.-G.; Jun, C.-H. Performance of some variable selection methods when multicollinearity is present. Chemom. Intell. Lab. Syst. 2005, 78, 103–112. [Google Scholar] [CrossRef]
  27. Xing, J.; Ngadi, M.; Wang, N.; De Baerdemaeker, J. Wavelength Selection for Surface Defects Detection on Tomatoes by Means of a Hyperspectral Imaging System. In Proceedings of the 2006 ASABE Annual International Meeting, Portland, Oregon, 9–12 July 2006. [Google Scholar] [CrossRef]
  28. Chen, Z.; Yang, M.; Shi, Q.; Kuang, X.; Qi, H.J.; Wang, T. Recycling Waste Circuit Board Efficiently and Environmentally Friendly through Small-Molecule Assisted Dissolution. Sci. Rep. 2019, 9, 1–9. [Google Scholar] [CrossRef] [PubMed]
  29. Laura, G.; Marius, P.; Claudia, C.; Rodica, H.; Laszlo, R. Research and innovation project based on recovery of the components and materials from IT and telecommunication waste. In Proceedings of the 2021 30th Annual Conference of the European Association for Education in Electrical and Information Engineering (EAEEIE), Prague, Czech Republic, 1–4 September 2021; pp. 1–5. [Google Scholar] [CrossRef]
  30. Varvara, S.; Dorneanu, S.-A.; Okos, A.; Muresan, L.M.; Bostan, R.; Popa, M.; Marconi, D.; Ilea, P. Dissolution of Metals in Different Bromide-Based Systems: Electrochemical Measurements and Spectroscopic Investigations. Materials 2020, 13, 3630. [Google Scholar] [CrossRef]
  31. Cazan, S.; Chirita, D.; Stamate, C.; Irimia, D.; Burlacu, A.; Doroftei, I. Dismantling strategy for capacitors placed on printed circuits boards: Challenges and preliminary results. IOP Conf. Series: Mater. Sci. Eng. 2020, 997, 012071. [Google Scholar] [CrossRef]
  32. Miha, J. Determination of metallic impurities in the copper deposit obtained by electroextraction from solution resulted in the recycling of Waste Printed Circuit Board. In Proceedings of the 46th International Conference of the Slovak Society of Chemical Engineering, High Tatras, Slovakia, 20–23 May 2019. [Google Scholar]
  33. Liu, Y.; Windham, W.R.; Lawrence, K.C.; Park, B. Simple algorithms for the classification of visible/near-infrared and hyperspectral imaging spectra of chicken skins, feces, and fecal contaminated skins. Appl. Spectrosc. 2003, 57, 1609–1612. [Google Scholar] [CrossRef]
  34. Picon, A.; Ghita, O.; Whelan, P.; Iriondo, P. Fuzzy Spectral and Spatial Feature Integration for Classification of Nonferrous Materials in Hyperspectral Data. IEEE Trans. Ind. Inform. 2009, 5, 483–494. [Google Scholar] [CrossRef]
  35. Laszlo, R.; Holonec, R.; Copindean, R.; Dragan, F. Sorting System for e-Waste Recycling using Contour Vision Sensors. In Proceedings of the 2019 8th International Conference on Modern Power Systems (MPS), Cluj, Romania, 21–23 May 2019; pp. 1–4. [Google Scholar]
  36. What is LabVIEW?-NI. Available online: https://www.ni.com/ro-ro/shop/labview.html (accessed on 15 October 2021).
  37. Specim FX10-Specim. Available online: https://www.specim.fi/products/specim-fx10/ (accessed on 15 October 2021).
  38. What is EVINCE? Available online: www.prediktera.com (accessed on 15 October 2021).
  39. O2D220—Object Recognition Sensor—Ifm Electronic. Available online: https://www.ifm.com/de/en/product/O2D220 (accessed on 15 October 2021).
Figure 1. Remaining components after the dismantlement process of PCBs. (a) Personal Computer Motherboard; (b) Components remaining after the dismantlement process of a motherboard.
Minerals 11 01292 g001
Figure 2. Scanned image of analyzed objects. (a) Hyperspectral image of the plastic components from a PC Motherboard; (b) Hyperspectral image of Integrated circuits found on a PC Motherboard.
Minerals 11 01292 g002
Figure 3. PCA model image of sorted objects. (a) PCA model of the used plastic components; (b) PCA model of the used integrated circuits.
Minerals 11 01292 g003
Figure 4. The first stage of the experimental sorting stand.
Minerals 11 01292 g004
Figure 5. Flow chart diagram of the HSI analysis software.
Minerals 11 01292 g005
Figure 6. PCA score plots of the first two principal components, t1 and t2.
Minerals 11 01292 g006
Figure 7. PLS-DA category model of the identified objects.
Minerals 11 01292 g007
Figure 8. Delta X robotic arm designed in SolidWorks (left image); real robot (right image).
Minerals 11 01292 g008
Figure 9. Communication and control software for the Delta X robot.
Minerals 11 01292 g009
Figure 10. The second stage of the experimental sorting stand.
Minerals 11 01292 g010
Figure 11. Flow chart diagram of the second experimental sorting stage.
Minerals 11 01292 g011
Figure 12. Sorting algorithm result for a component.
Minerals 11 01292 g012
Figure 13. Circuit diagram of the second sorting stage.
Minerals 11 01292 g013
Table 1. Hyperspectral image detection and processing.
Hyperspectral Camera ImageMaterial Signature IdentificationImage Processing Algorithms
Minerals 11 01292 i001 Minerals 11 01292 i002-Spectral band: 115
-λ = 701,81 nm
-Auto threshold (inter-variance)
-Morphology
Minerals 11 01292 i003Spectral band: 180
-λ = 880,58 nm
-Threshold
-Morphology
-Particle filter
Minerals 11 01292 i004Spectral band: 180
-λ = 880,58 nm
-Low-pass filter
-Threshold
-Particle filter
Minerals 11 01292 i005Spectral band: 180
-λ = 880,58 nm
-Low-pass filter
-Threshold
-Morphology
-Particle filter
Table 2. Efficiency table of the sorting stages.
Case Number Stage 1Stage 2
Large Silicon ChipsSilicon Chips with ResinFiber GlassSmall Silicon Chips
Case I70%70%90%60%
Case II80%90%90%70%
Case III90%80%100%90%
Case IV70%90%90%90%
Case V80%80%100%100%
Case VI100%90%80%100%
Case VII90%80%90%70%
Case VIII100%90%100%100%
Case IX100%100%100%80%
Case X100%100%100%90%
Average 88%87%94%85%
Publisher’s Note: MDPI stays neutral with regard to jurisdictional claims in published maps and institutional affiliations.

