Article

Improvement in pH and Total Iron Concentration of Acid Mine Drainage after Backfilling: A Case Study of an Underground Abandoned Mine in Japan

1
Division of Sustainable Resources Engineering, Graduate School of Engineering, Hokkaido University, Sapporo 060-8628, Japan
2
Mitsubishi Materials Corporation, 3-2-3, Marunouchi, Chiyoda-ku, Tokyo 100-8117, Japan
3
Faculty of Engineering, Hokkaido University, Sapporo 060-8628, Japan
4
Oyo Corporation, 2-10-9, Daitakubo, Minami-ku, Saitama-shi, Saitama 336-0015, Japan
5
Japan Oil, Gas and Metals National Corporation (JOGMEC), 2-10-1, Toranomon, Minato-ku, Tokyo 105-0001, Japan
*
Author to whom correspondence should be addressed.
Submission received: 16 October 2021 / Revised: 15 November 2021 / Accepted: 20 November 2021 / Published: 22 November 2021
(This article belongs to the Special Issue Environmental Geochemistry in the Mining Environment)

Abstract

:
If the excavated underground veins are not backfilled, they may be a factor in the continued outflow of acid mine drainage (AMD). The flow rate of AMD can be reduced by backfilling underground drifts from abandoned mines. In addition, the quality of AMD may be improved as the flow rate of AMD reduces. In this paper, the quality of the AMD after backfilling was evaluated by a three-dimensional geochemical analysis model when the groundwater level was recovered after backfilling. The measured dissolved iron (Fe) and sulfate ion (SO42−) concentrations and pH before backfilling the drift were reproduced by the calibration of the simulation. Using the calibrated model, the pH at the outlet of the drift was changed from about pH 3 before backfilling to about pH 4 to 5 after backfilling. When calcite was contained in the filling materials of the drift, the pH approached neutral. However, when gypsum was formed, the neutralization was inhibited. The Fe concentration discharged from the drift was calculated at approximately 0.002 mol/L before backfilling. The total Fe concentration was calculated at 0.0004 mol/L or less after backfilling, and the dissolved Fe concentration decreased by several orders of magnitude after backfilling. A geochemical model quantitatively evaluated the improvement in water quality after backfilling the drifts. This method can be applied to the other abandoned mines with similar hydrogeological conditions.

1. Introduction

Acid mine drainage (AMD) has been generated at many active, closed, and abandoned mines throughout the world. In Japan, countermeasures against AMD have been taken at 70 closed mines in the AMD treatment project in FY2018, and the government has spent about 2.2 billion yen on the countermeasures [1]. Thus, it is an urgent issue that the quantity and quality of AMD should be mitigated.
At two mines, the flow rate of AMD increased due to the inflow of rainwater via inclined drifts and shafts [2,3]. However, there are several methods for reducing the flow rate of AMD by covering the ground surface with a low-permeable layer or backfilling the excavated area [4,5,6,7,8,9,10]. For example, the flow rate of AMD in a closed mine was reduced by up to 61% regardless of the rainfall intensity if the excavated area was backfilled with low-permeable material [8]. At the other mines, the AMD decreased by 30% on high rainfall days after backfilling the drift [11].
In addition to the reduction on the AMD flow rate, there are reports on the maintenance through drift backfilling [12] and drift backfilling to prevent the subsidence and collapse [13]. However, there are few papers related to improving the quality of AMD in abandoned and closed mines by backfilling the underground space.
A closed mine in the Tohoku region, Japan was selected in this paper, because the change in the groundwater flow around the mine by backfilling the old drift was evaluated to propose appropriate countermeasures against reducing the amount of AMD [11]. However, the improvement of the AMD quality has not been evaluated. In this paper, the quality of AMD released from the mine before and after backfilling the drift was compared. A three-dimensional geochemical reaction model incorporating the groundwater flow evaluated in the previous paper [11] was created. After comparing the measured data of groundwater quality (pH, total iron (T-Fe) concentration, and sulfate ion (SO42−) concentration) with the calculated ones, whether the quality of AMD was improved or not was evaluated when backfilling the old drift. It is important to see if a backfilling drift is effective not only in reducing flow rate of AMD but also in improving the quality of AMD.

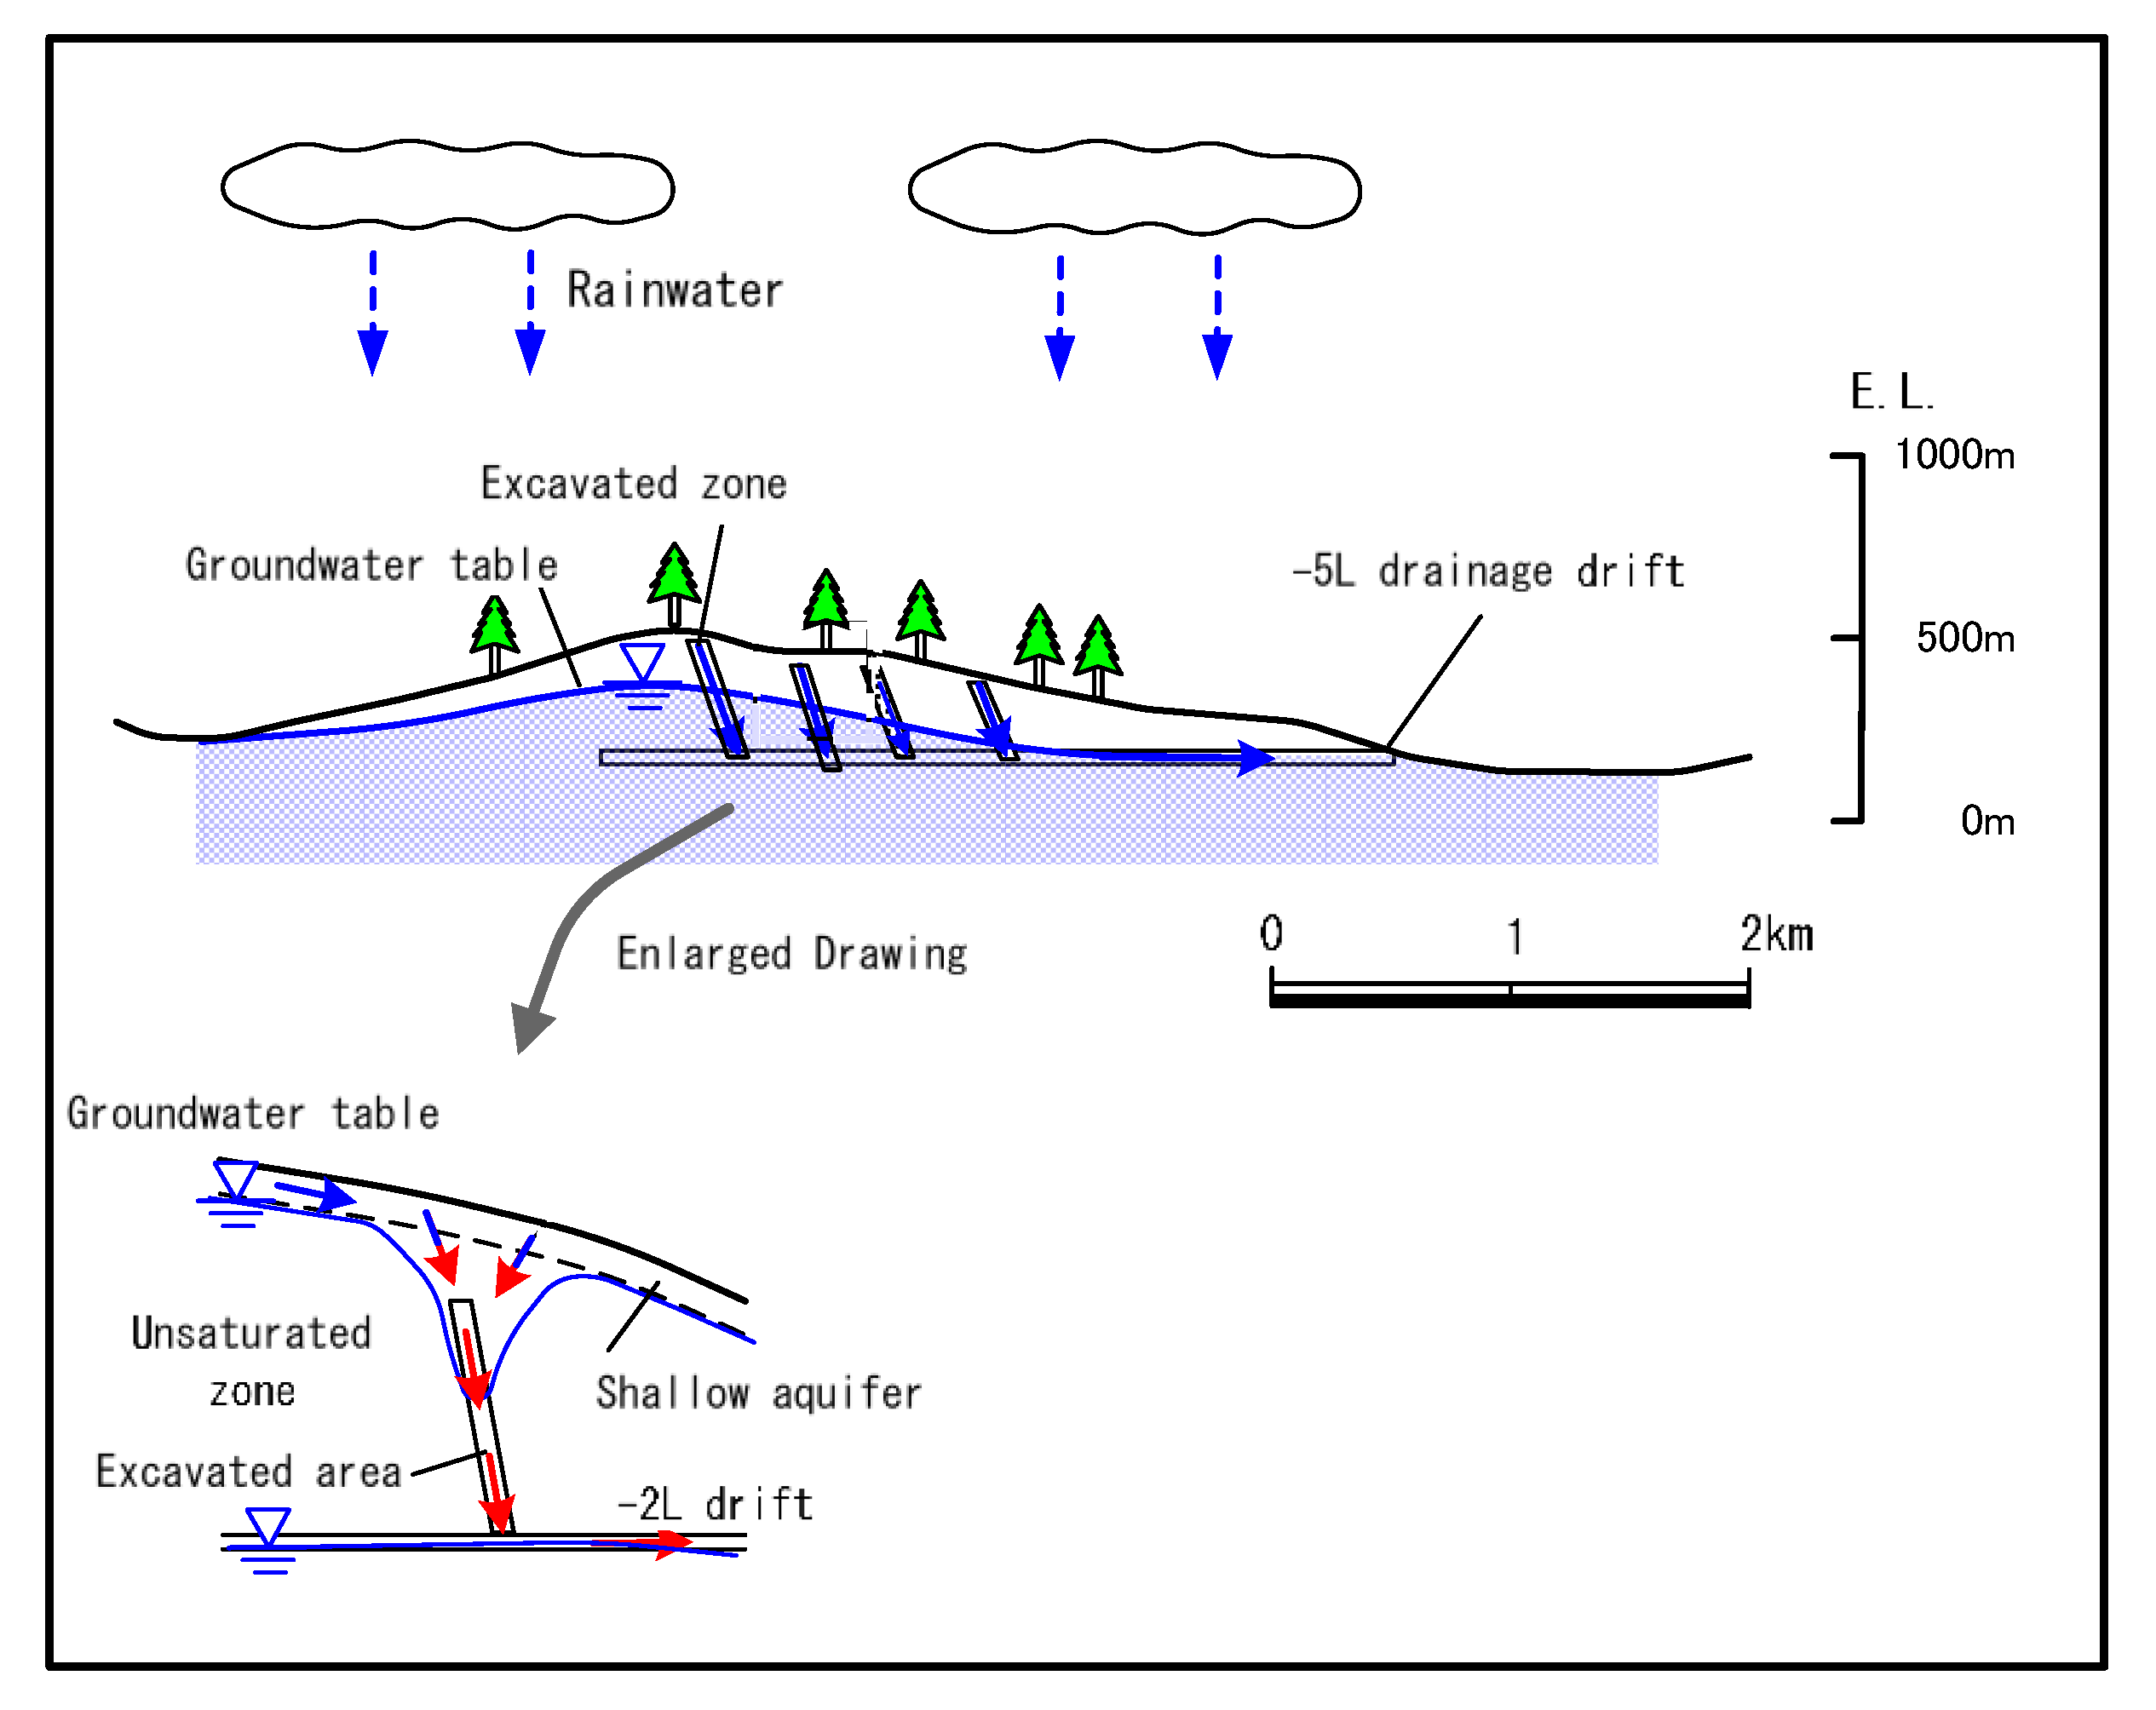
2. Geology and Hydrology of the Study Area

The site of this study is a closed mine in the Tohoku region, Japan, as shown in Figure 1. The base rock mostly consists of pre-Neogene granite, and Neogene tuff, andesite, and rhyolite were deposited on the granite basement. They erupted and deposited on the granite in the marine. The type of mine is a vein-type deposit formed in faults and fractures in the Neogene strata [14,15]. The vein minerals consist of pyrite (Py), chalcopyrite, sphalerite, and galena as the ore minerals and hematite, marcasite, native copper, and electrum as the minor minerals [14]. Quartz, chlorite, and others are major minerals in gangue and altered rocks [14], and cuprite and others are secondary minerals [14].
The recorded development of this mine was after the Keicho era (1596–1614), and after the operation, it closed in May 1978 [16]. Mining was carried out by the shrinkage method at the beginning of the operation, because the host rock of the Neogene strata was solid and because the veins in the Neogene strata were inclined with slopes of 70–90°. Since the mine produced sludge formed by AMD neutralization, backfilling the formed sludge mixed with cement (sandy slime) into the excavated underground space was adopted to prevent collapses of the underground space. This is due to the brittleness of the host rock with the progress of the operation. The Fe concentration, which was 0.03–1 mg/L one year after the closing of the mine, was high in the tailing ponds and low in the rivers [17].
The distribution of the mined areas was recorded in the pit map created during the operating period when two drifts were excavated at a depth of 60 and 150 m from the ground surface (the −2 L and −5 L levels, respectively), as shown in Figure 1. The −5 L level drift is used as the drainage of the AMD to the mine mouth. The rainwater passes through the Neogene layer, and the groundwater originating from rainwater is collected in the old drifts (the −2 L and −5 L levels) excavated in the same layer (Figure 2).

3. Materials and Methods

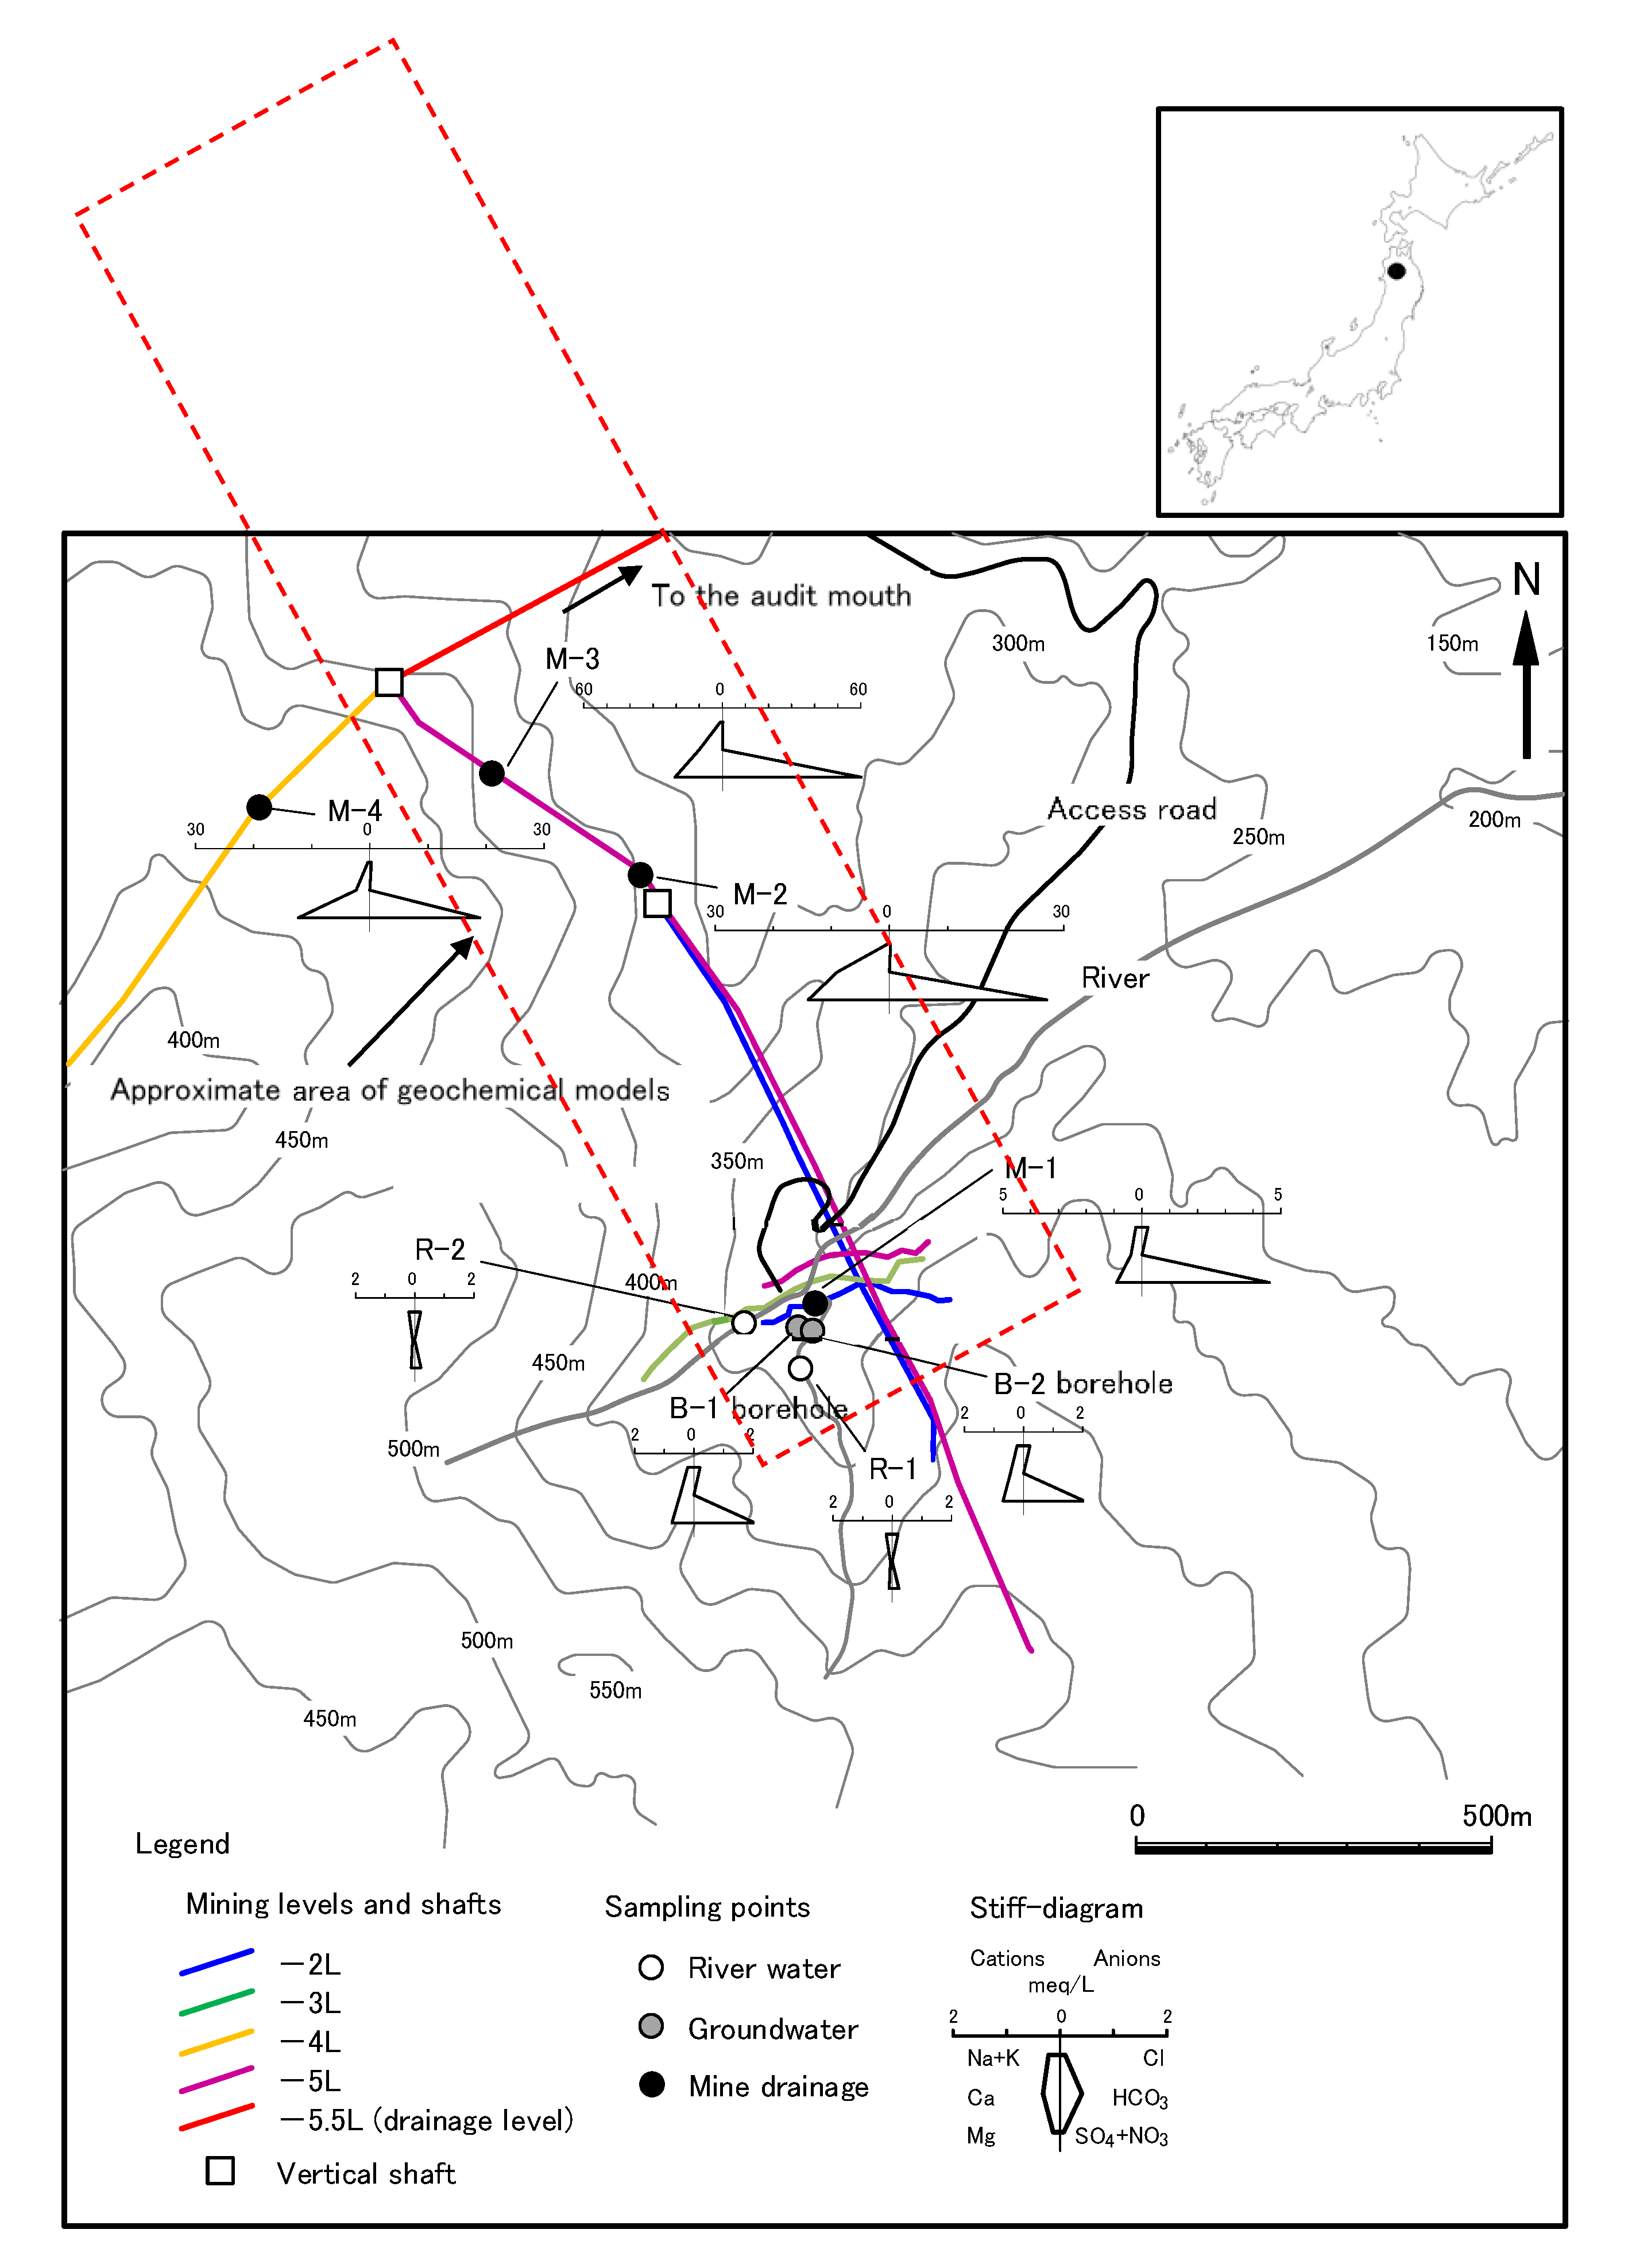
3.1. Sampling Location and Analysis

River water (R-1 and R-2) was collected as surface water before reaction with rocks, and shallow groundwater (B-1 and B-2) was located between the ground surface and the underground drift. The AMD (M-1, M-2, M-3, and M-4) samples in the drift were collected after the reaction with rocks. The water sampling location is shown in Figure 1. Eight water samples were taken on 24 and 26 November in 2014. The river water samples (R-1 and R-2) were taken on the surface. The groundwater samples (B-1 and B-2) were collected shallower than the −2 L level drift. The B-1 sample was taken using a bailer from a borehole with a strainer installed at G.L. −46.0 to −51.5 m. The B-2 sample was taken using a bailer from a borehole with a strainer installed at G.L. −2.0 to −15.2 m. After excavating a borehole, the recovery of groundwater in the −2 L level drift to a depth of about 20–30 cm was confirmed, and then, the AMD in the −2 L level drift (M-1) was collected with a bailer. The other AMD in the drift (M-2, M-3, and M-4) were sampled with bottles after walking into the −4 L or −5 L level drifts.
After measuring the temperature, pH, electrical conductivity (EC), and oxidation-reduction potential (ORP) of the samples, the collected samples were transferred to two 100-mL polyethylene bottles that had been acid-washed and co-washed with the same sample in advance. The pH was measured using KS701 manufactured by Shindengen Electric Manufacturing Co., Chiyoda-ku, Tokyo, the EC and water temperature were measured using B-173 manufactured by HORIBA Advanced Techno Co., Kyoto-hu, Japan, and the ORP was measured using RM-12P manufactured by DKK-TOA Co., Shinjuku-ku, Tokyo. The bicarbonate ion (HCO3) concentration was calculated from the M-alkalinity by titration with a hydrochloric acid (HCl) solution of 0.01 M (mol/L). the major anions, Cl, SO42−, and NO3, were measured by an ion chromatograph (DX-120 manufactured by Dionex, Sunnyvale, CA, USA), and the major cations Na+, K+, Ca2+, and Mg2+; total iron (T-Fe); and Pb concentrations were measured by ICP–MS (Agilent 7700X manufactured by Agilent Technologies, Santa Clara, CA, USA).

3.2. Properties of Rock Sample

The B-1 borehole is located above the old drifts, as shown in Figure 1. The rainwater into the old drifts passes through the area including the B-1 borehole. This means that the rainwater reacts with the rocks around the B-1 borehole. Thus, the core of B-1 seems one of the representative rocks that reacts with rainwater.
The mineralogical properties of the bored core at the depth from G.L. −9.00 to −9.07 m of B-1 borehole were analyzed by X-ray diffraction (XRD). XRD6000 (Shimadzu Corporation, Kyoto-hu, Japan) was used for the analysis. The cored specimen of tuff breccia, which constitutes the Neogene layer, is located in the upper part of the mining area, and iron (hydr)oxide adheres to the high-angle (inclinations 60° and 90°) cracks. Yokoyama et al. [18] described the chemical composition of the rock around the mine.

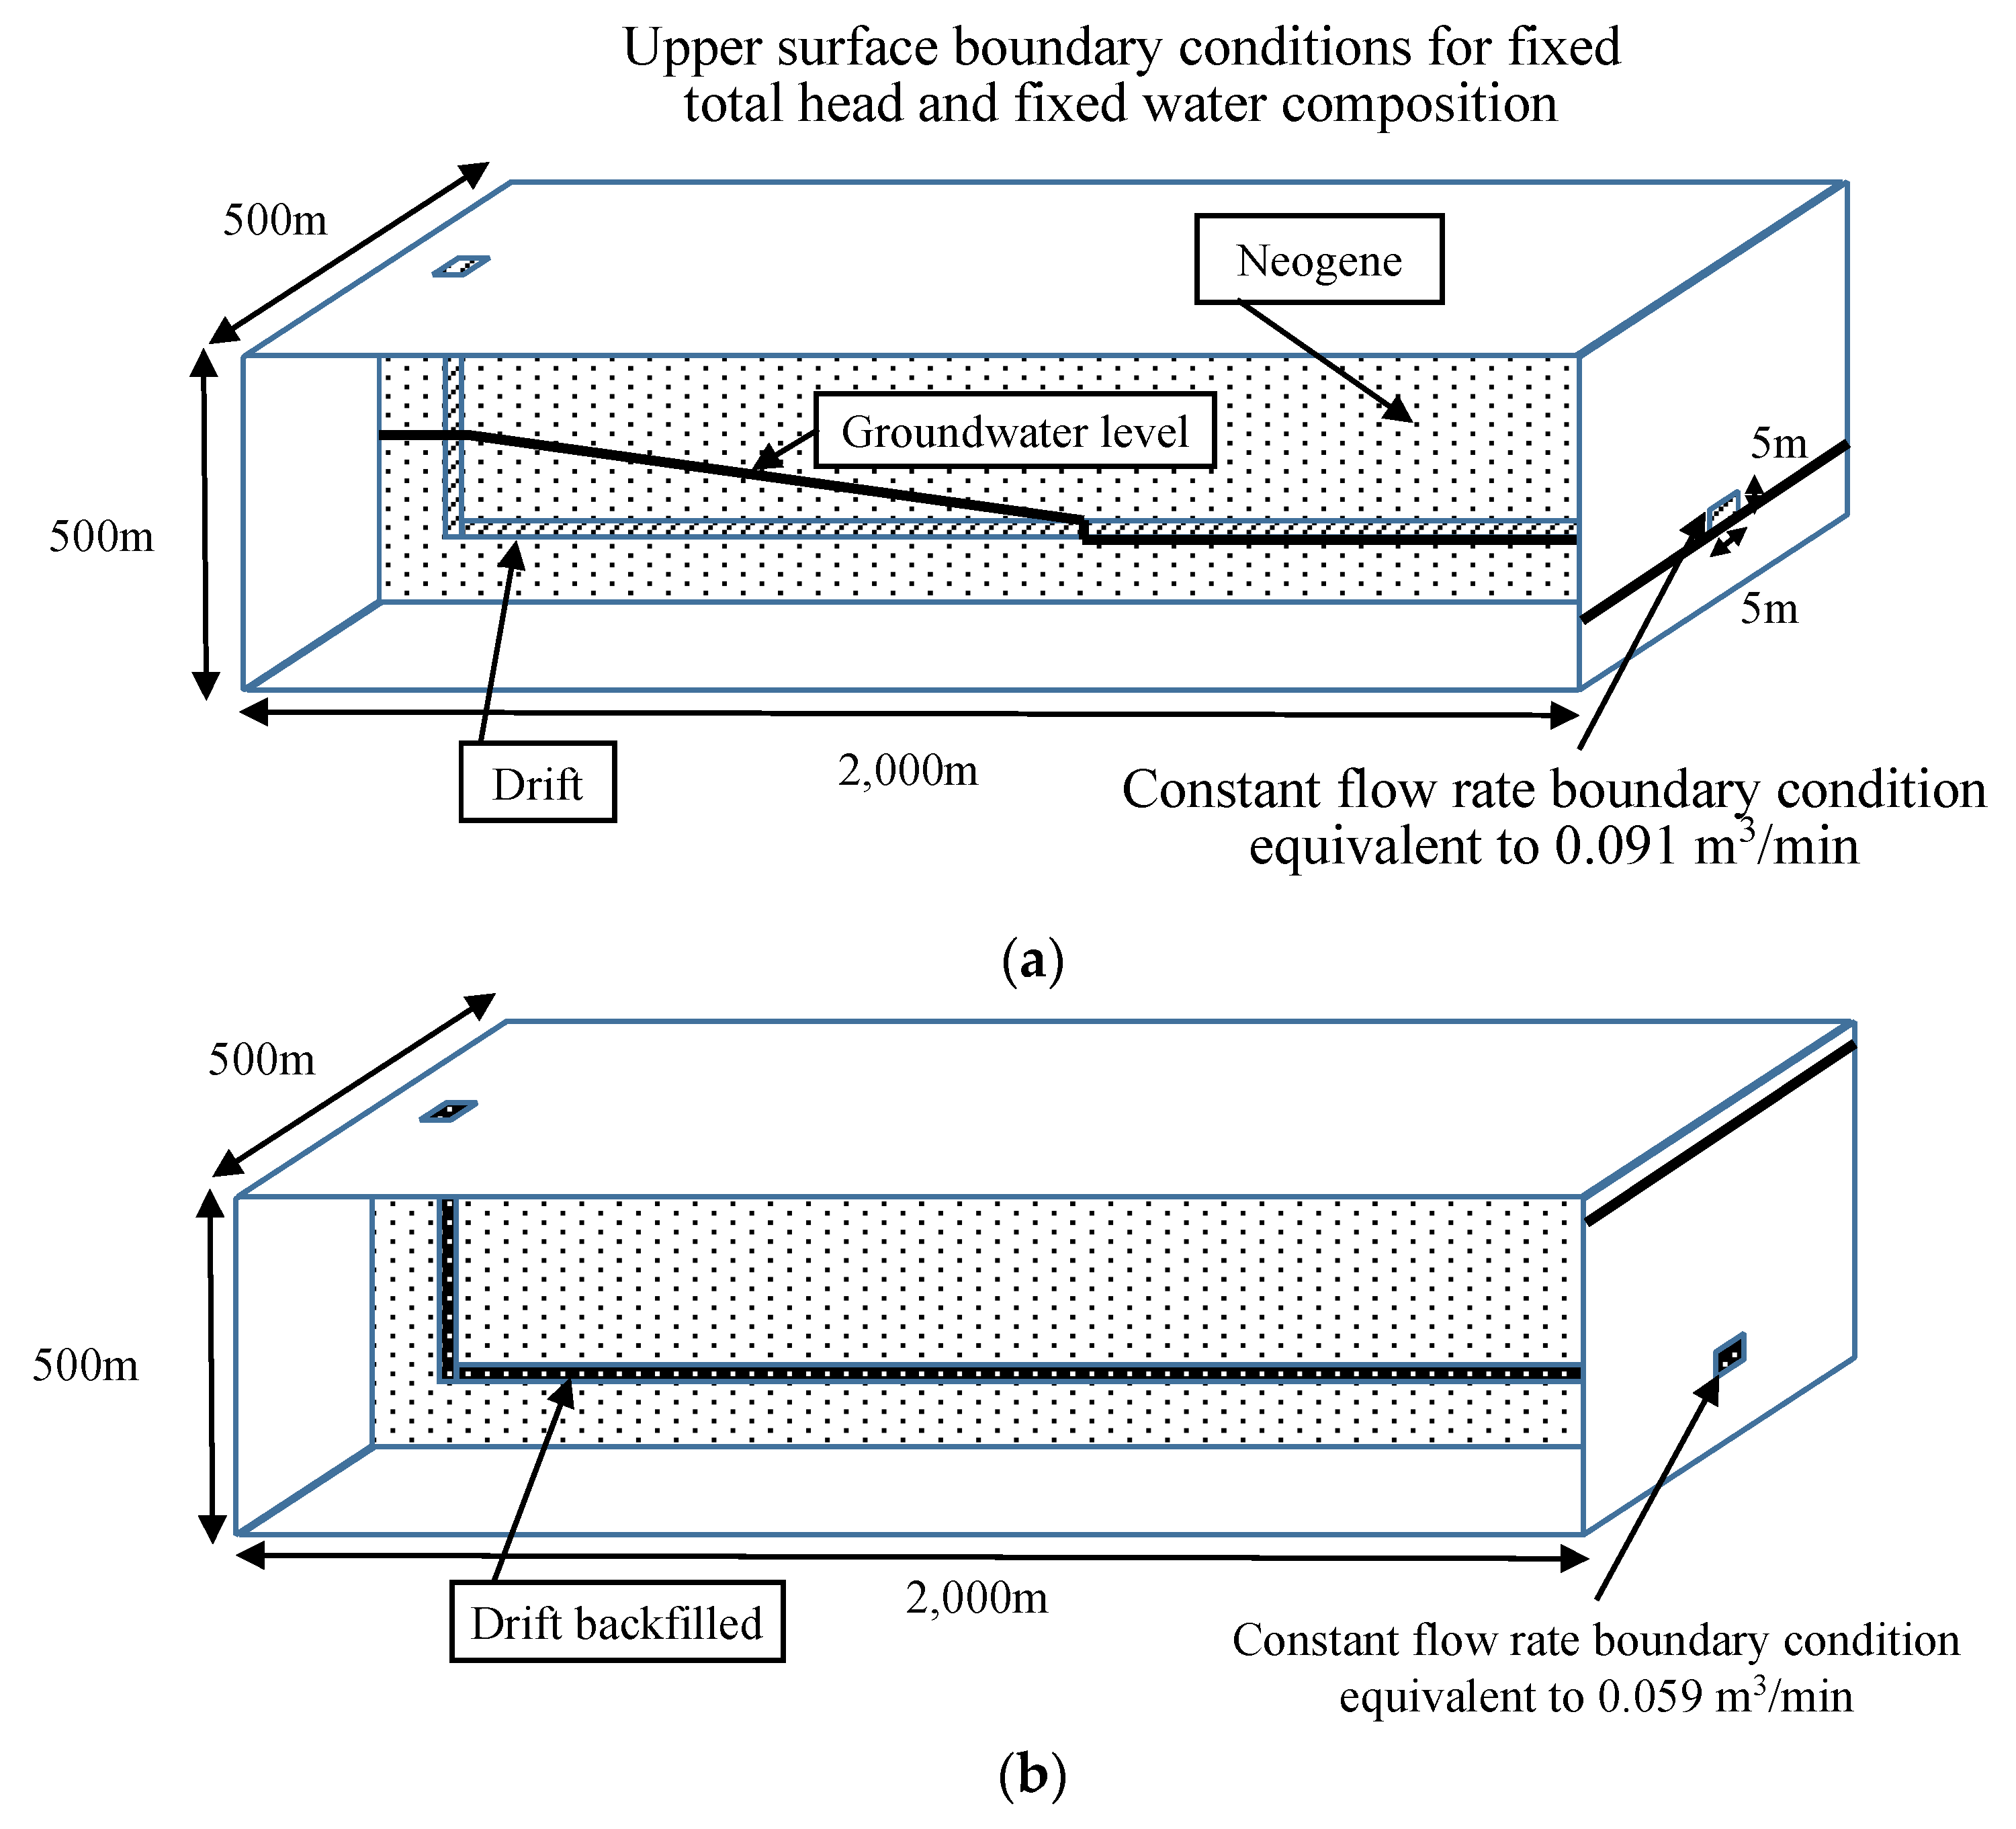
3.3. Geochemical Simulation

A three-dimensional geochemical analysis was carried out in three cases: (1) before backfilling the old drift, (2) after backfilling the old drift, and (3) after backfilling the old drift with calcite, as listed in Table 1. Case 1 was created to reproduce the present quality of AMD. Improvements in the quality of AMD after backfilling the underground space were estimated in cases 2 and 3. In case 3, the pH-buffering capacity of the filling material was evaluated, because the filling material contained calcite. The geochemical reactions between groundwater and Neogene rocks were considered using the geochemical simulation code of PHAST [19]. PHAST simulates solute transport and geochemical reactions in the three-dimensional groundwater flow. PHAST consists of PHREEQC and HST3D. The geochemical reactions are simulated with PHREEQC [20]. The flow and transport are calculated by HST3D [21]. Firstly, the flow velocities are calculated. Then, the solutes are transported. Finally, the geochemical reactions are calculated. These steps are repeated until the end of the simulation.
Groundwater percolates the mining area and then flows down to the −5 L drift via the −2 L drift and a shaft connecting the upper drift and lower one. This unsaturated flow occurs around the −2 L tunnel.
The conceptual model is shown in Figure 3, together with some boundary conditions for the groundwater flow. The area around the shaft was modeled by considering that the rainwater recharge from the shaft was the main source of AMD. The boundary of the model is shown in Figure 1 by the red dotted line. The drift reaches straight to the audit mouth. The boundary conditions are shown in Table 2. Although the groundwater level before backfilling the drift was low, the simulated results of the groundwater level rose with backfilling the drift [11]. The AMD flow rate of 0.091 m3/min measured at the audit mouth throughout August 2014 [11] was set as the annual constant flow rate at the audit mouth. Above the groundwater level, there is an unsaturated zone that is in contact with the atmosphere. Therefore, the dissolved oxygen concentration of the groundwater in the unsaturated zone was assumed to be in equilibrium with the atmospheric oxygen, and the degree of saturation equals 100%.
For the groundwater flow, the total head in all areas of the model was zero as an initial condition. As the initial condition for the geochemical simulation, the composition of river water (R-1 in Table 6) was assumed to be distributed in all regions of the model. The initial mineral composition was considered by the results of XRD.
Table 3 shows the porosity and the hydraulic conductivity of the geological media. The hydraulic conductivity of Neogene (tuff breccia) was measured by the water injection method during boring, and the measured value was 9.2 × 10⁻⁹ m/s [11]. The groundwater level and the flow rate of AMD from the drift were well-interpreted by the groundwater flow simulation with the hydraulic conductivity [11]. The porosity of tuff breccia was evaluated at 3.6% [22]. The initial amounts of the minerals in the geochemical model were determined based on the results of XRD. Table 4 shows the initial and secondary formed minerals in the geochemical analysis model. The initial mineral is gradually dissolved in groundwater, and when the degree of saturation of a certain mineral becomes positive, the supersaturated secondary mineral will precipitate in the porosity.
Table 5 shows chemical reactions, equilibrium constants of dissolution and precipitation, and kinetic parameters in the geochemical analysis model. The dissolution kinetics of pyrite, clinochlore, and calcite were considered in the model.
When groundwater percolates the mining area in the recharge area, it reacts with sulfide minerals such as pyrite in the unsaturated zone (the following Reactions (1)–(4) [23]) to acidify the groundwater and increase the concentration of SO42−. Acidification promotes the release of heavy metals such as Fe, copper (Cu), and zinc (Zn).
FeS2(s) + 7/2O2 + H2O = Fe2+ + 2SO42− +2H+
Fe2+ + 1/4O2 + H+ = Fe3+ + 1/2H2O
Fe3+ + 3H2O = Fe(OH)3(s) + 3H+
FeS2(s) + 14Fe3+ + 8H2O = 15Fe2+ + 2SO42− + 16H+
When calcite coexists, it is dissolves into the AMD, according to Reaction (5), and H+ is consumed, i.e., the pH increases.
CaCO3 + H+ = Ca2+ + HCO3
Table 3. Hydraulic conductivity and porosity.
MaterialsHydraulic ConductivityPorosity
Neogene9.2 × 10−9 m/s [11]0.036 [22]
Drift (before backfilling)1 × 10⁻³ m/s
(The hydraulic conductivity was set to be significantly larger than that of the surrounding Neogene.)
0.80
(Although the porosity in the old drift has not been measured, the wall surface has collapsed in some places, so 0.8 was assumed.)
Drift (after backfilling)1 × 10⁻³ m/s
(Since the groundwater flow field after backfilling is controlled by the flow rate with the same boundary conditions, the hydraulic conductivity was set to be the same as before backfilling.)
0.15
(Since there was no reference value of porosity after backfilling, the porosity in mortar [24] was used here.)
Table 4. Minerals considered in the geochemical calculations.
Initial minerals in the Neogene in cases 1, 2-1 and 2-2Pyrite10 wt% (Percentage estimated by the results of XRD)
Clinochlore (Chlorite identified by XRD is modeled.)5 wt% (same as above)
Initial mineral in drift after backfilling in case 2-2Calcite65.5% [25]
Secondary minerals that appear when supersaturated in cases 1, 2-1 and 2-2Fe(OH)3-
Table 5. Modeled reactions and parameters.
MineralsReactionsLog of Equilibrium ConstantKinetic Parameters 1
k
(mol/(m2·s))
n
Initial minerals (Neogene)PyriteFeS2 + H2O = 0.25H+ + 0.25SO42− + Fe2+ + 1.75HS−24.65342
ClinochloreMg5Al2Si3O10(OH)8 + 16H+ = 2Al3+ + 3SiO2 + 5Mg2+ + 12H2O67.239110−11.11 [26]0.5 [26]
Initial mineral (drift after backfilling)CalciteCaCO3 + H+ = Ca2+ + HCO31.848710−0.3 [26]1 [26]
Secondary mineral that appear if supersaturatedFe(OH)3Fe(OH)3 + 3H+ = Fe3+ + 3H2O5.6556Reactions reaching equilibrium
1 The rate equation is from Lasaga (1984) [27]. Rate = k A (aH+)n(1 − Q/K), where Rate is the mineral reaction rate, k is the rate constant, A is the mineral surface area, (aH+)n is the dependence of the mineral dissolution rate on the activity of H+, Q is the ion activity product, and K is the equilibrium constant. 2 Equation in the case of oxygen present is Rate = 6.3 × 10⁻⁴ × m(Fe3+)0.92 × (1 + m(Fe2+)/10−6)−0.43. Equation in the case without oxygen is Rate = 1.9 × 10⁻⁶ × m(Fe3+)0.28 × (1 + m(Fe2+)/10−6)−0.52 × m(H+)−0.3. Here, m(Fe2+), m(Fe3+), and m(H+) are the molality of Fe2+, Fe3+, and H+ [28].

4. Results

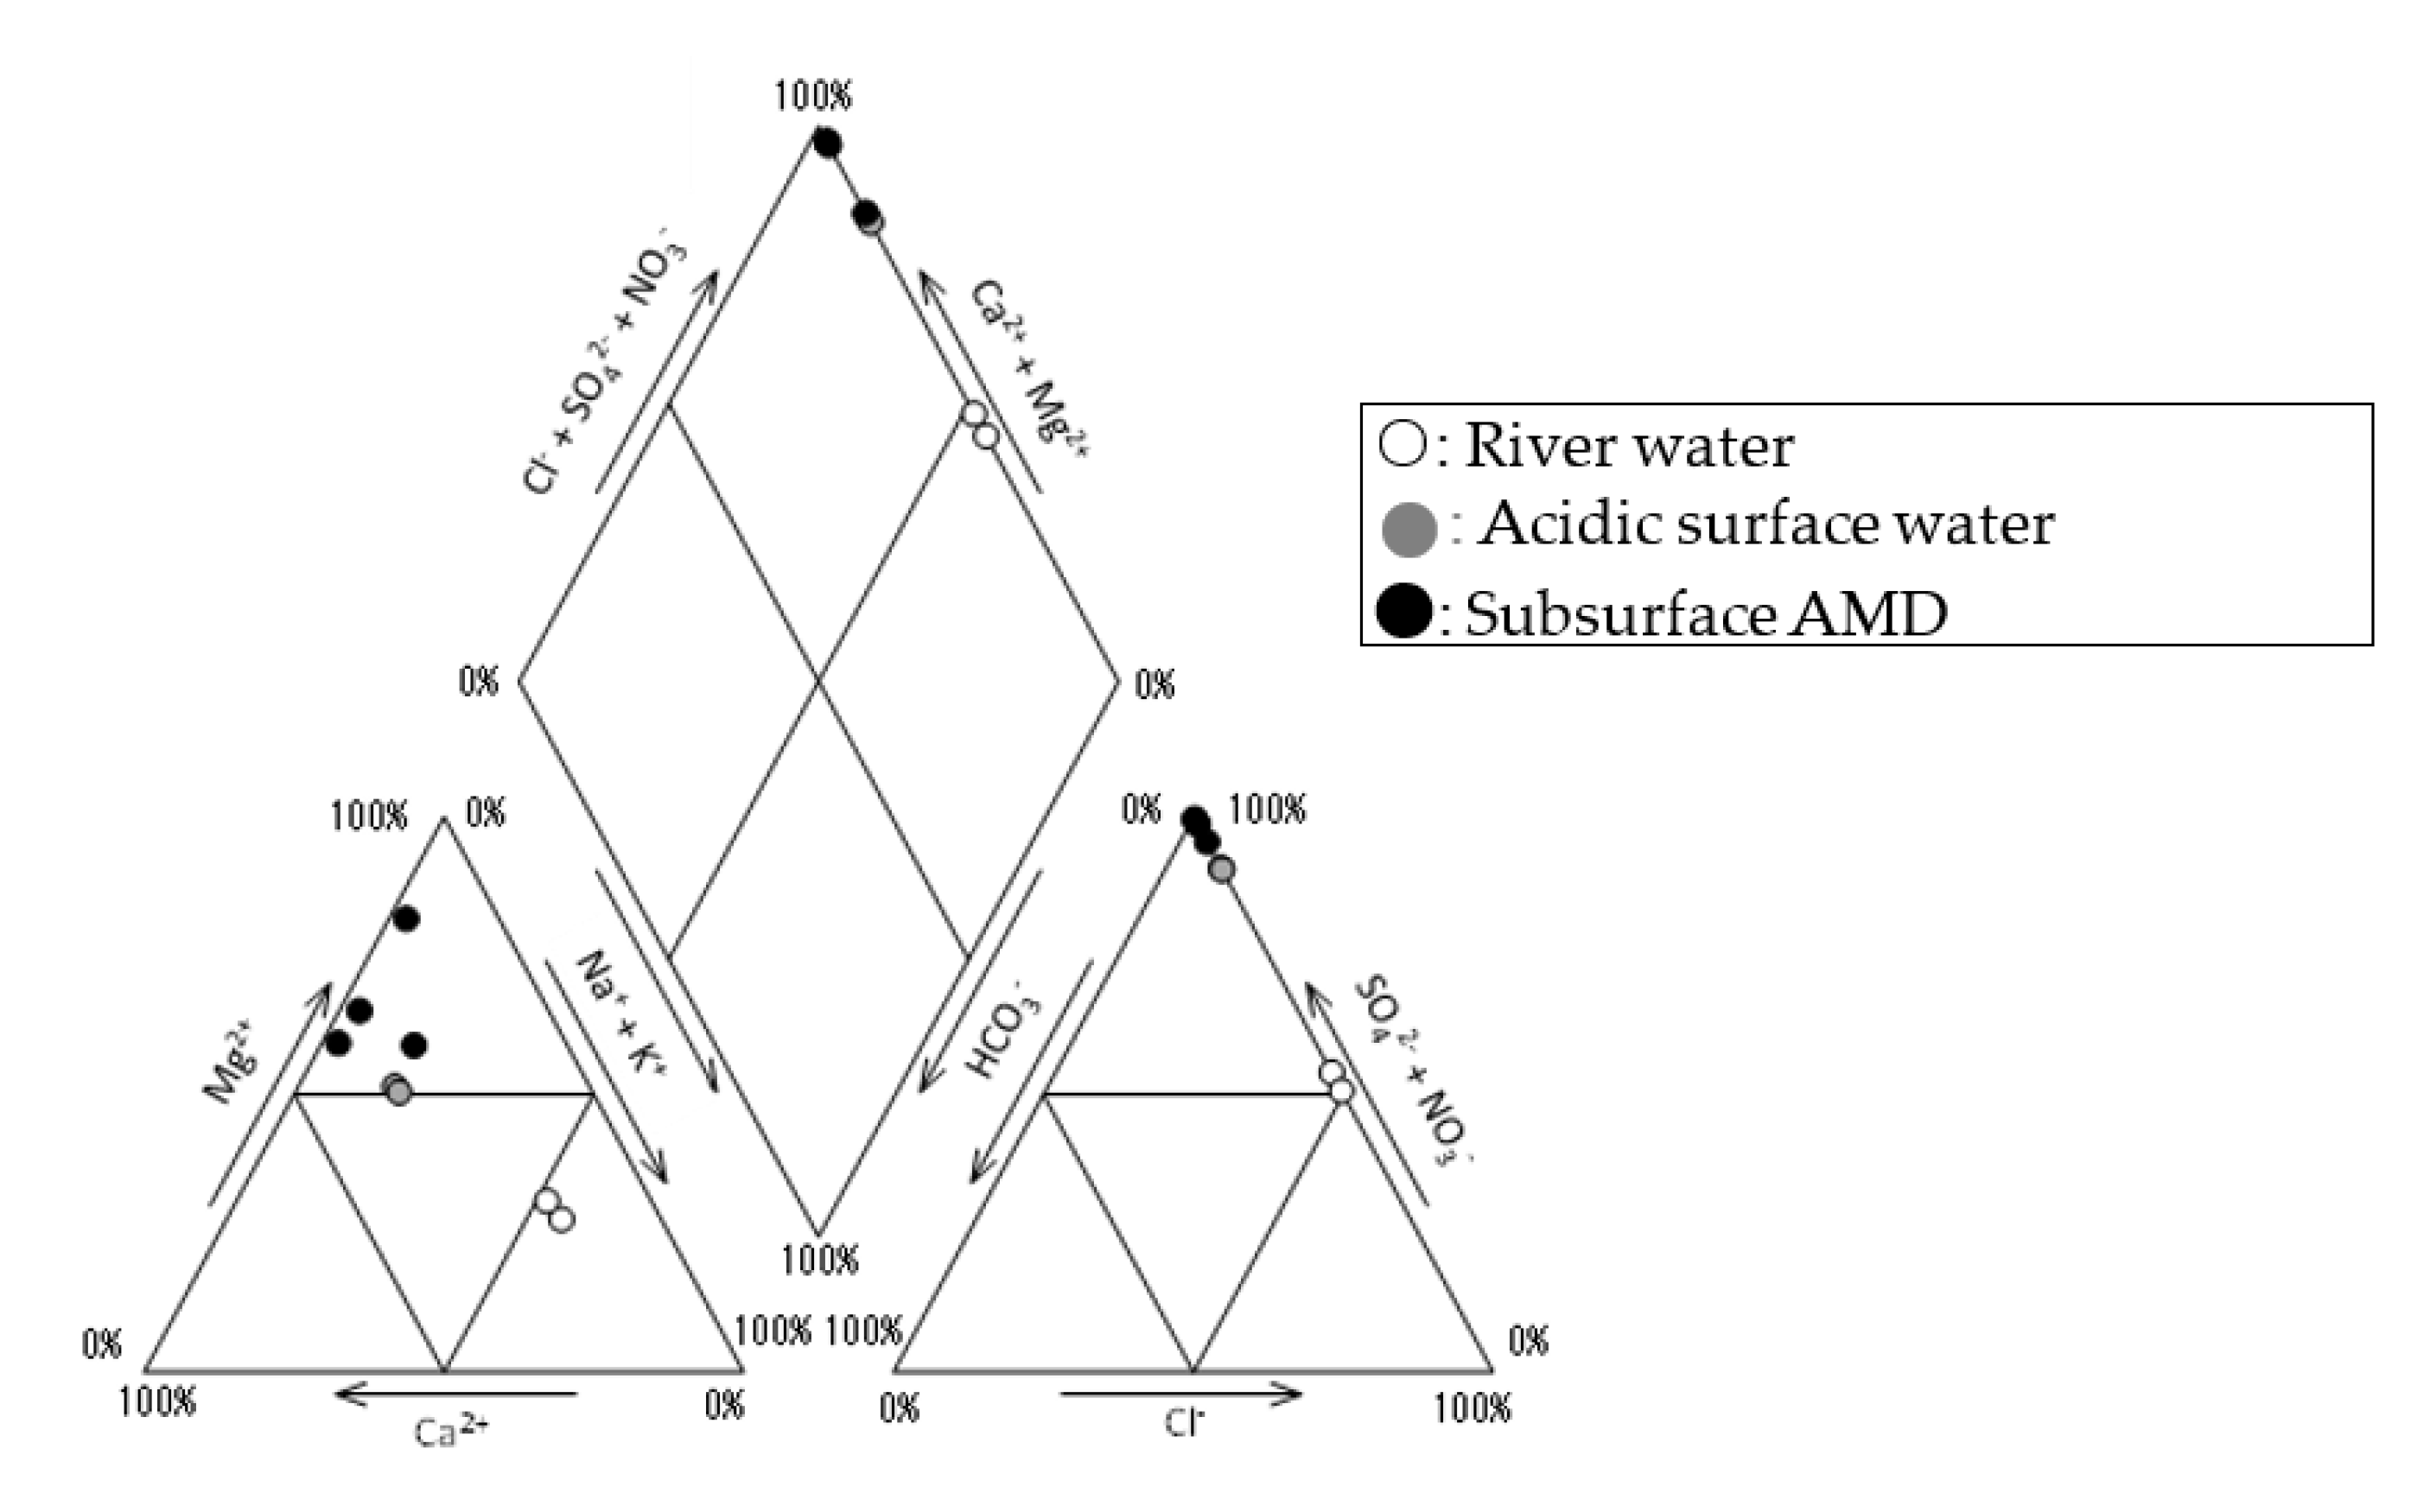
4.1. Quality of the Water Samples

The quality of the river, groundwater, and mine water samples is listed in Table 6. The stiff diagram is shown in Figure 1, whereas the Piper diagram is shown in Figure 4. The river water samples (R-1 and R-2) were in the range of pH 4.2–4.9, EC 6.5–9.0 mS/m, ORP +329 to +388 mV, and temperature 13.1–13.8 ° C. The main component of the cation was Na+ and that of the anion was SO42−. The river water had a Na-SO4 type, and the T-Fe concentration ranged from 0.05 to 0.15 mg/L. The Pb concentration ranged from <0.01 to 0.02 mg/L.
The deep groundwater (B-1) and shallow groundwater (B-2) were the groundwater in their boreholes, both of which had a lower pH (3.5–3.7) than those of river water and exhibited a Mg-SO4 type. The T-Fe concentration was 4.6–4.8 mg/L, which was higher than those of river water. The Pb concentration was 0.08–0.34 mg/L, which was higher than those of river water.
The pH of the groundwater samples in the drifts (M-1, M-2, M-3, and M-4) ranged from 3.3 to 3.9, the EC 46–375 mS/m, the ORP +301 to +523 mV, and the temperature 9.8–15.0 ° C. The M-1 sample from the −2L level drift had lower SO42− than the other mine waters (M-2, M-3, and M-4). The maximum concentration of T-Fe in the groundwater was 610 mg/L, and the Pb concentration was 0.22–0.58 mg/L.

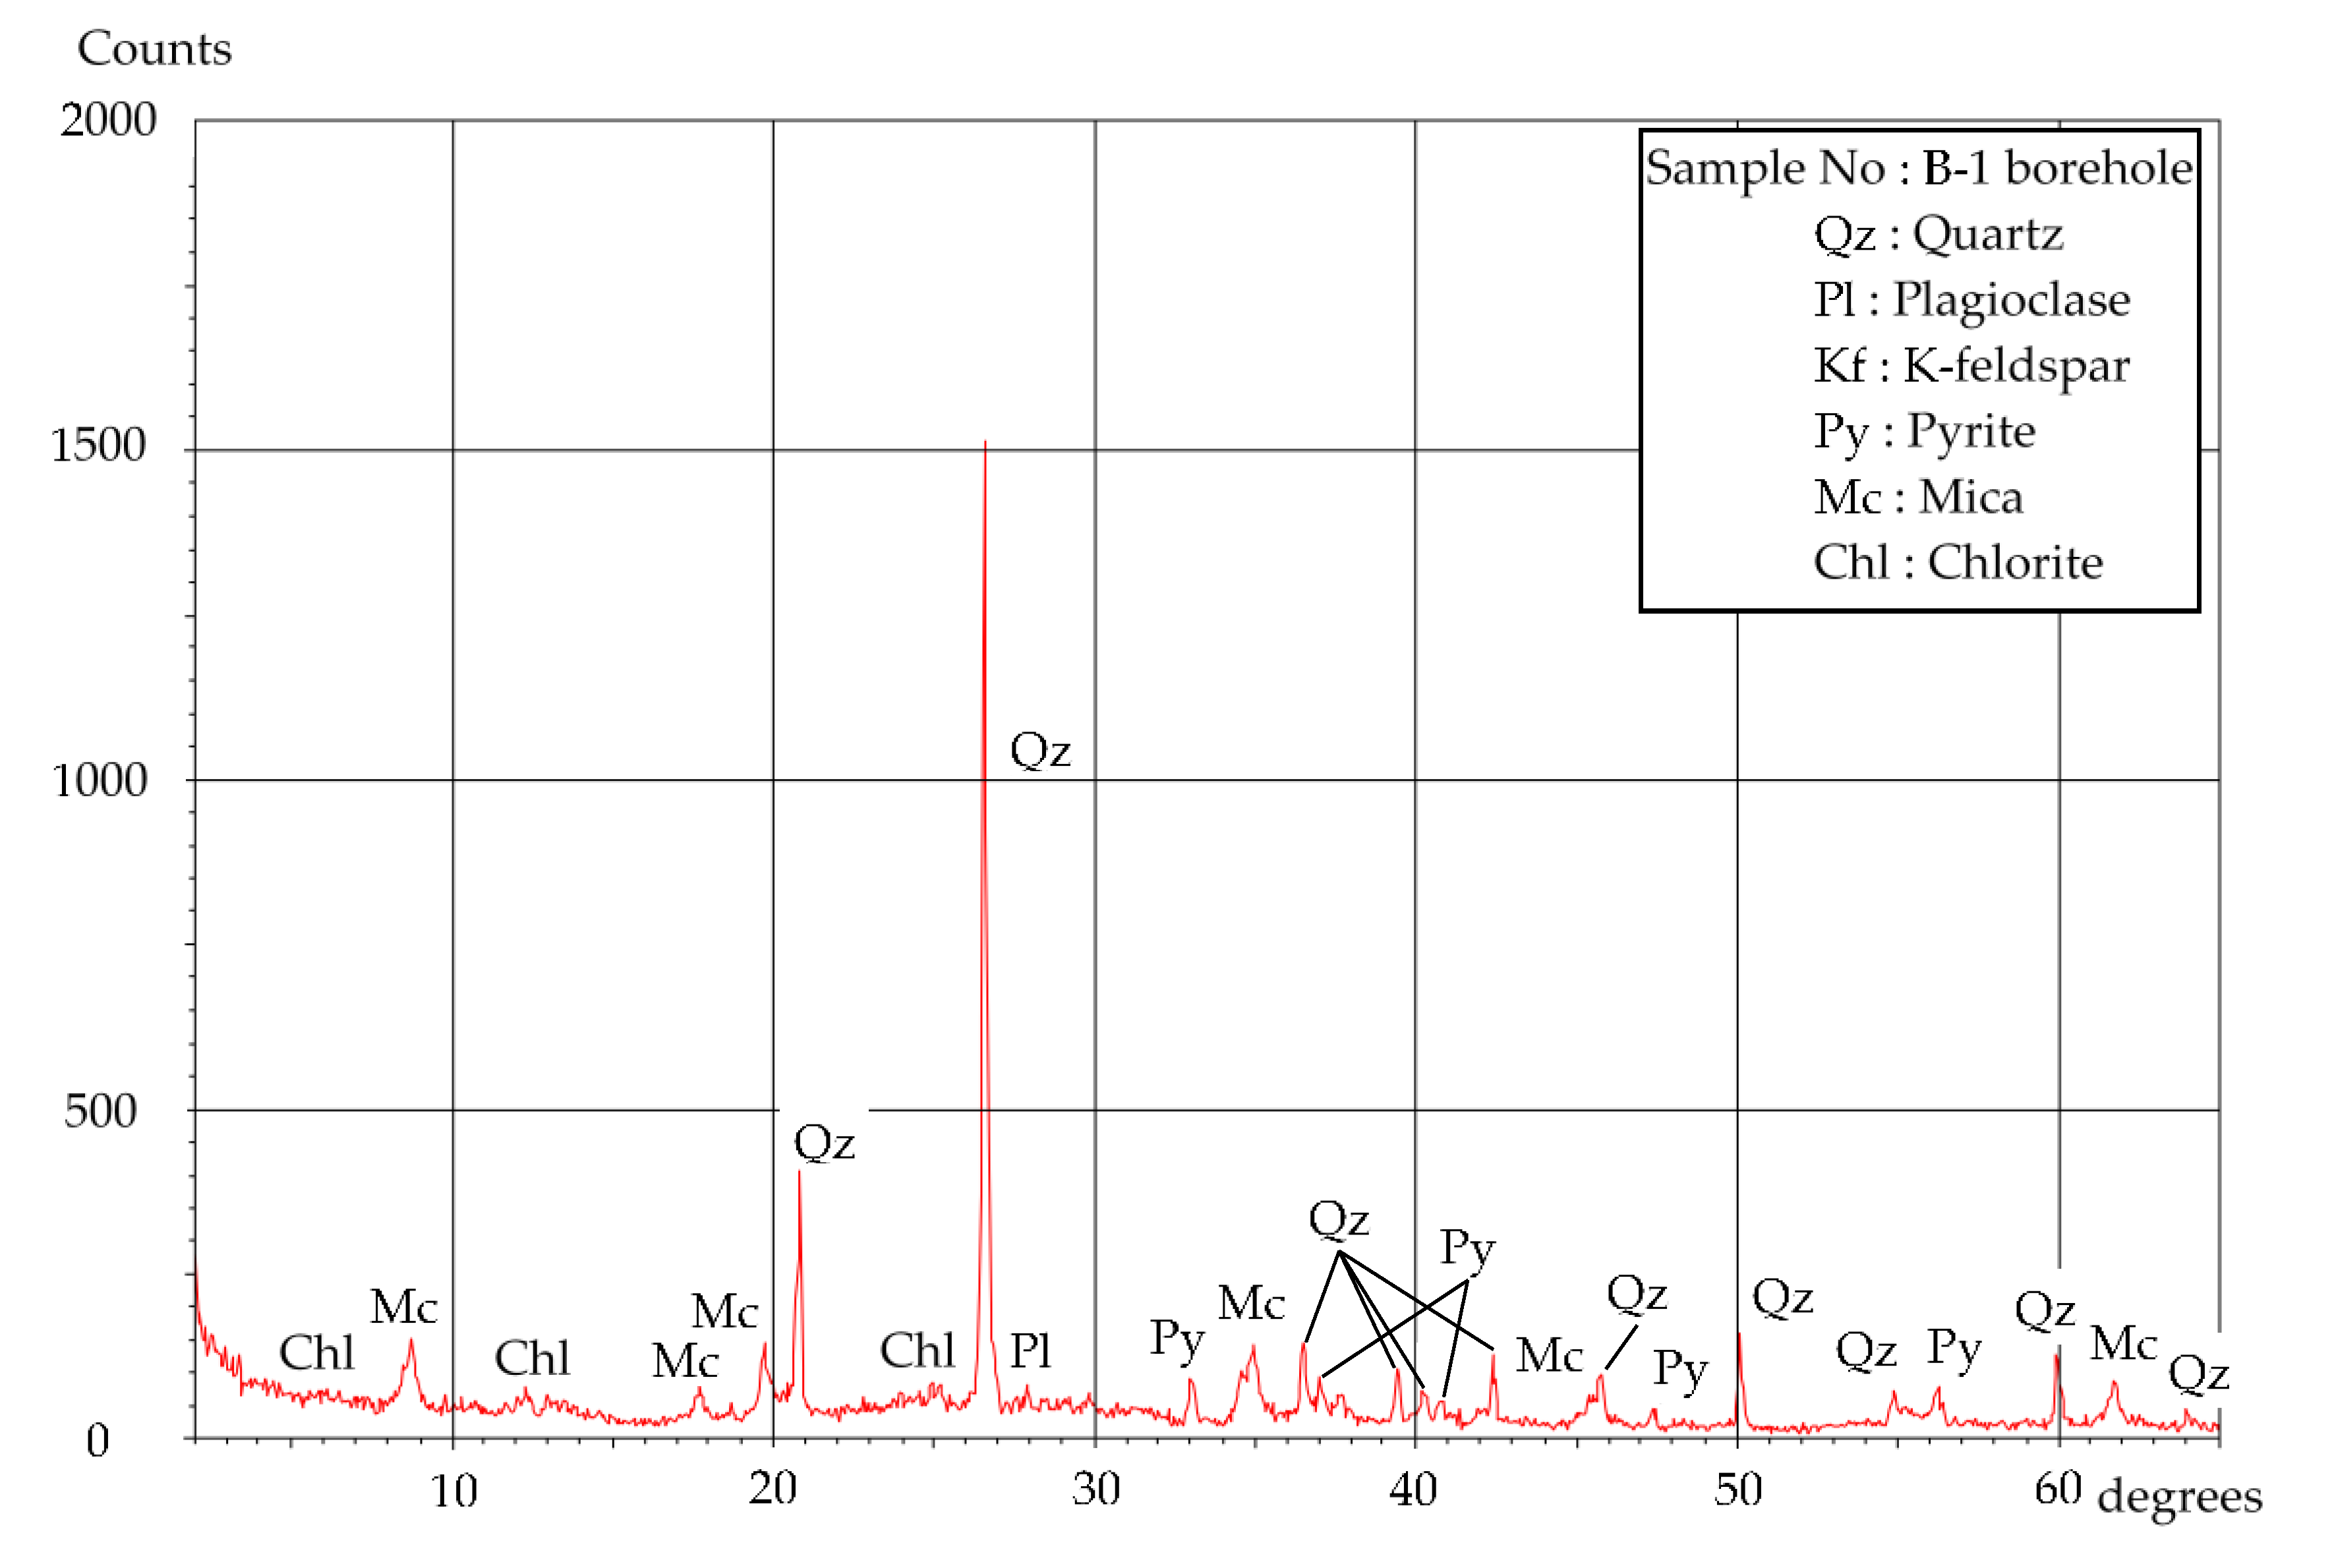
4.2. Mineral Composition

According to the results of XRD, most of the detected minerals were quartz (Qz), and small amounts of pyrite, mica (Mc), and chlorite (Chl) were detected (Table 7 and Figure 5). Pyrite, which causes the acidification of groundwater, was modeled in the geochemical reactions. Chlorite was a group of sheet silicate minerals and was modeled as clinochlore, which was one of the endmembers of chlorite [29].

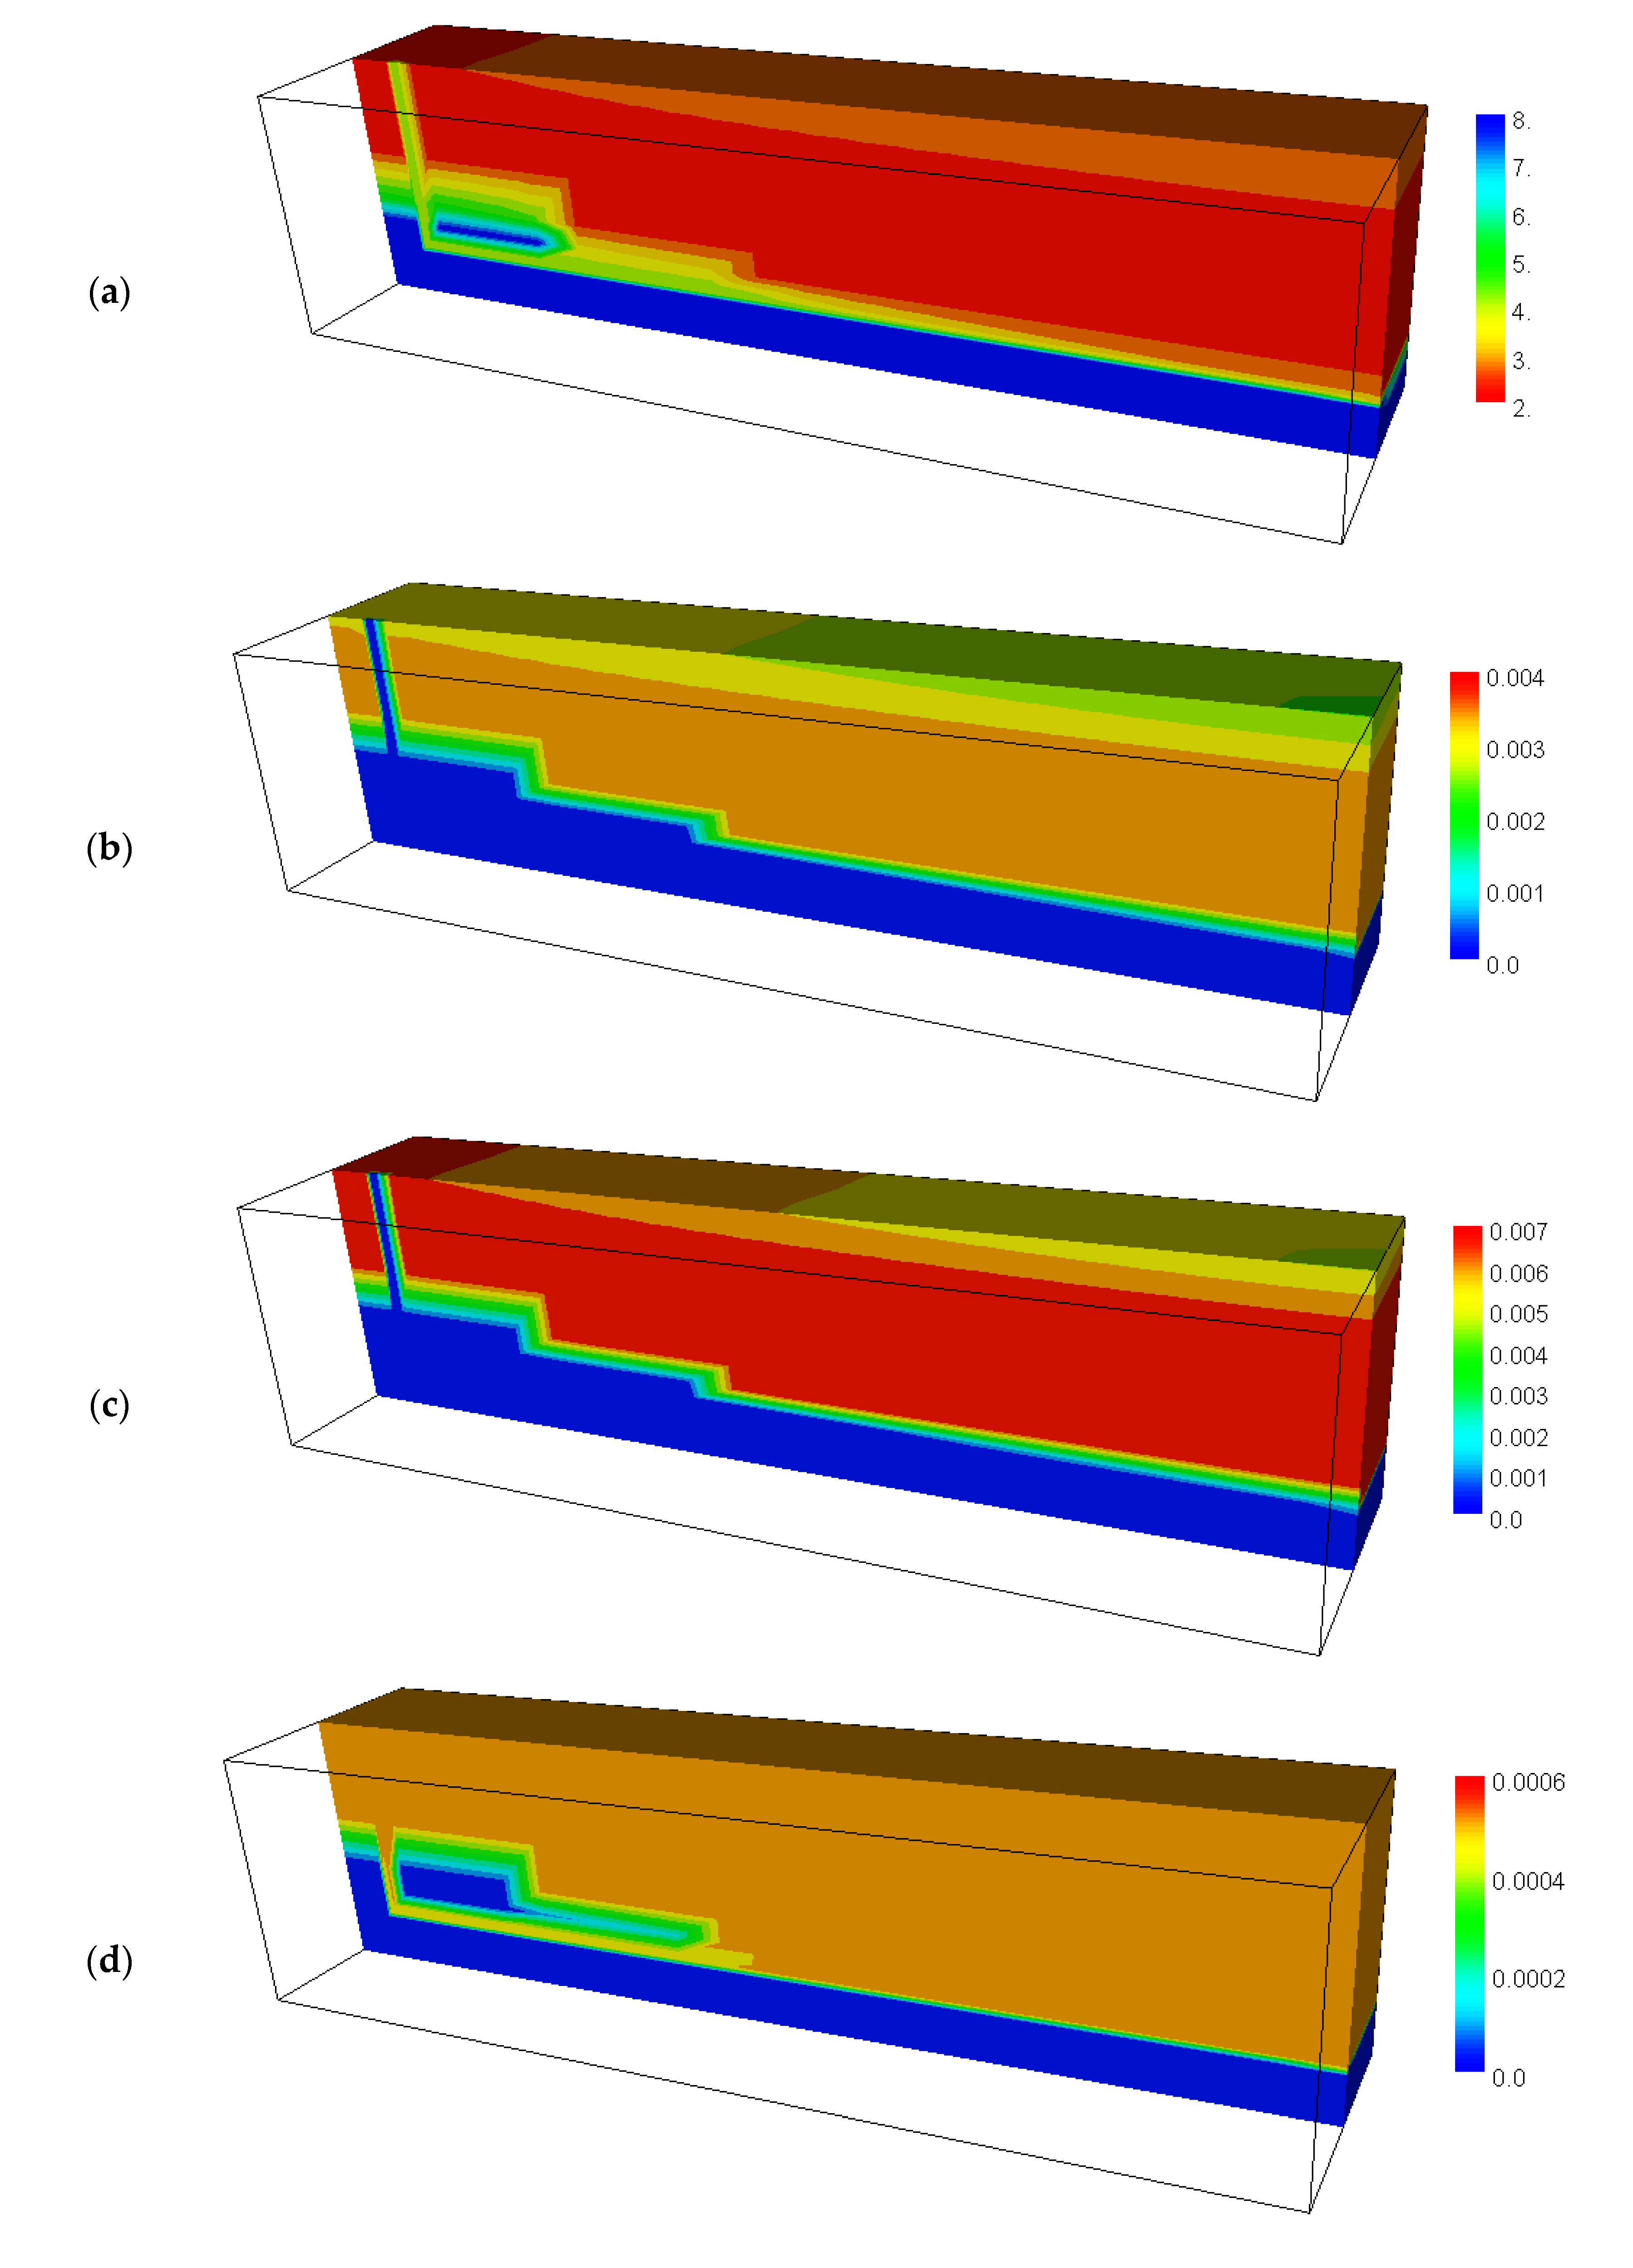
4.3. Calculated Results before Backfilling the Drift

According to the results of the groundwater flow simulation, groundwater flowed through the highly permeable shaft and horizontal drift at a high velocity and reached the audit mouth of the drift.
The results of the geochemical simulation showed that rainwater infiltrating from the surface became acidic as it reached the deeper layer. The groundwater was neutral in the deeper layer than the horizontal drift not in contact with atmospheric oxygen. The pH of the inside of the shaft was kept neutral, because rainwater was supplied at a high rate. Figure 6 shows the results of distribution of the pH, T-Fe concentration, SO42− concentration, and dissolved oxygen concentration at t = 50 years. The simulated distribution of pH was almost constant after 50 years.
The calculated pH at the audit mouth of the drift shown in Figure 6a was approximately 4, which was almost the same as the measured pH of 3.3–3.9 at the mining levels (Table 6). The distribution of T-Fe concentration in groundwater is shown in Figure 6b. The Fe concentration discharged from the drift was calculated at approximately 0.002 mol/L (approximately 110 mg/L). The measured values ranged from 22 mg/L to 610 mg/L (Table 6), and the calculated concentration agreed with the measured ones. The distribution of SO42− concentration of groundwater is shown in Figure 6c. The SO42− concentration at the audit mouth of the drift ranged from 0.003 mol/L to 0.005 mol/L (about 290–490 mg/L), which closely coincided with the measured range between 220 and 2900 mg/L. The SO42− was high in the region where the T-Fe concentration was high, and the calculated results also showed that the concentrations of both T-Fe and SO42− increased with the dissolution of pyrite. The pH was acidic in the region in contact with the atmosphere and oxidizing groundwater. These indicate that pyrite in the rock is oxidized by atmospheric and dissolved oxygen, leading to acidic groundwater. The distribution of the dissolved oxygen concentration in the groundwater was high in the area where highly acidic groundwater was distributed (Figure 6d). Higher dissolved oxygen and higher pH were distributed in the same area, because the dissolution of pyrite is promoted when the redox potential of the groundwater is high [30]. These results indicate that the geochemical model used in this study reproduced the measured quality of AMD.

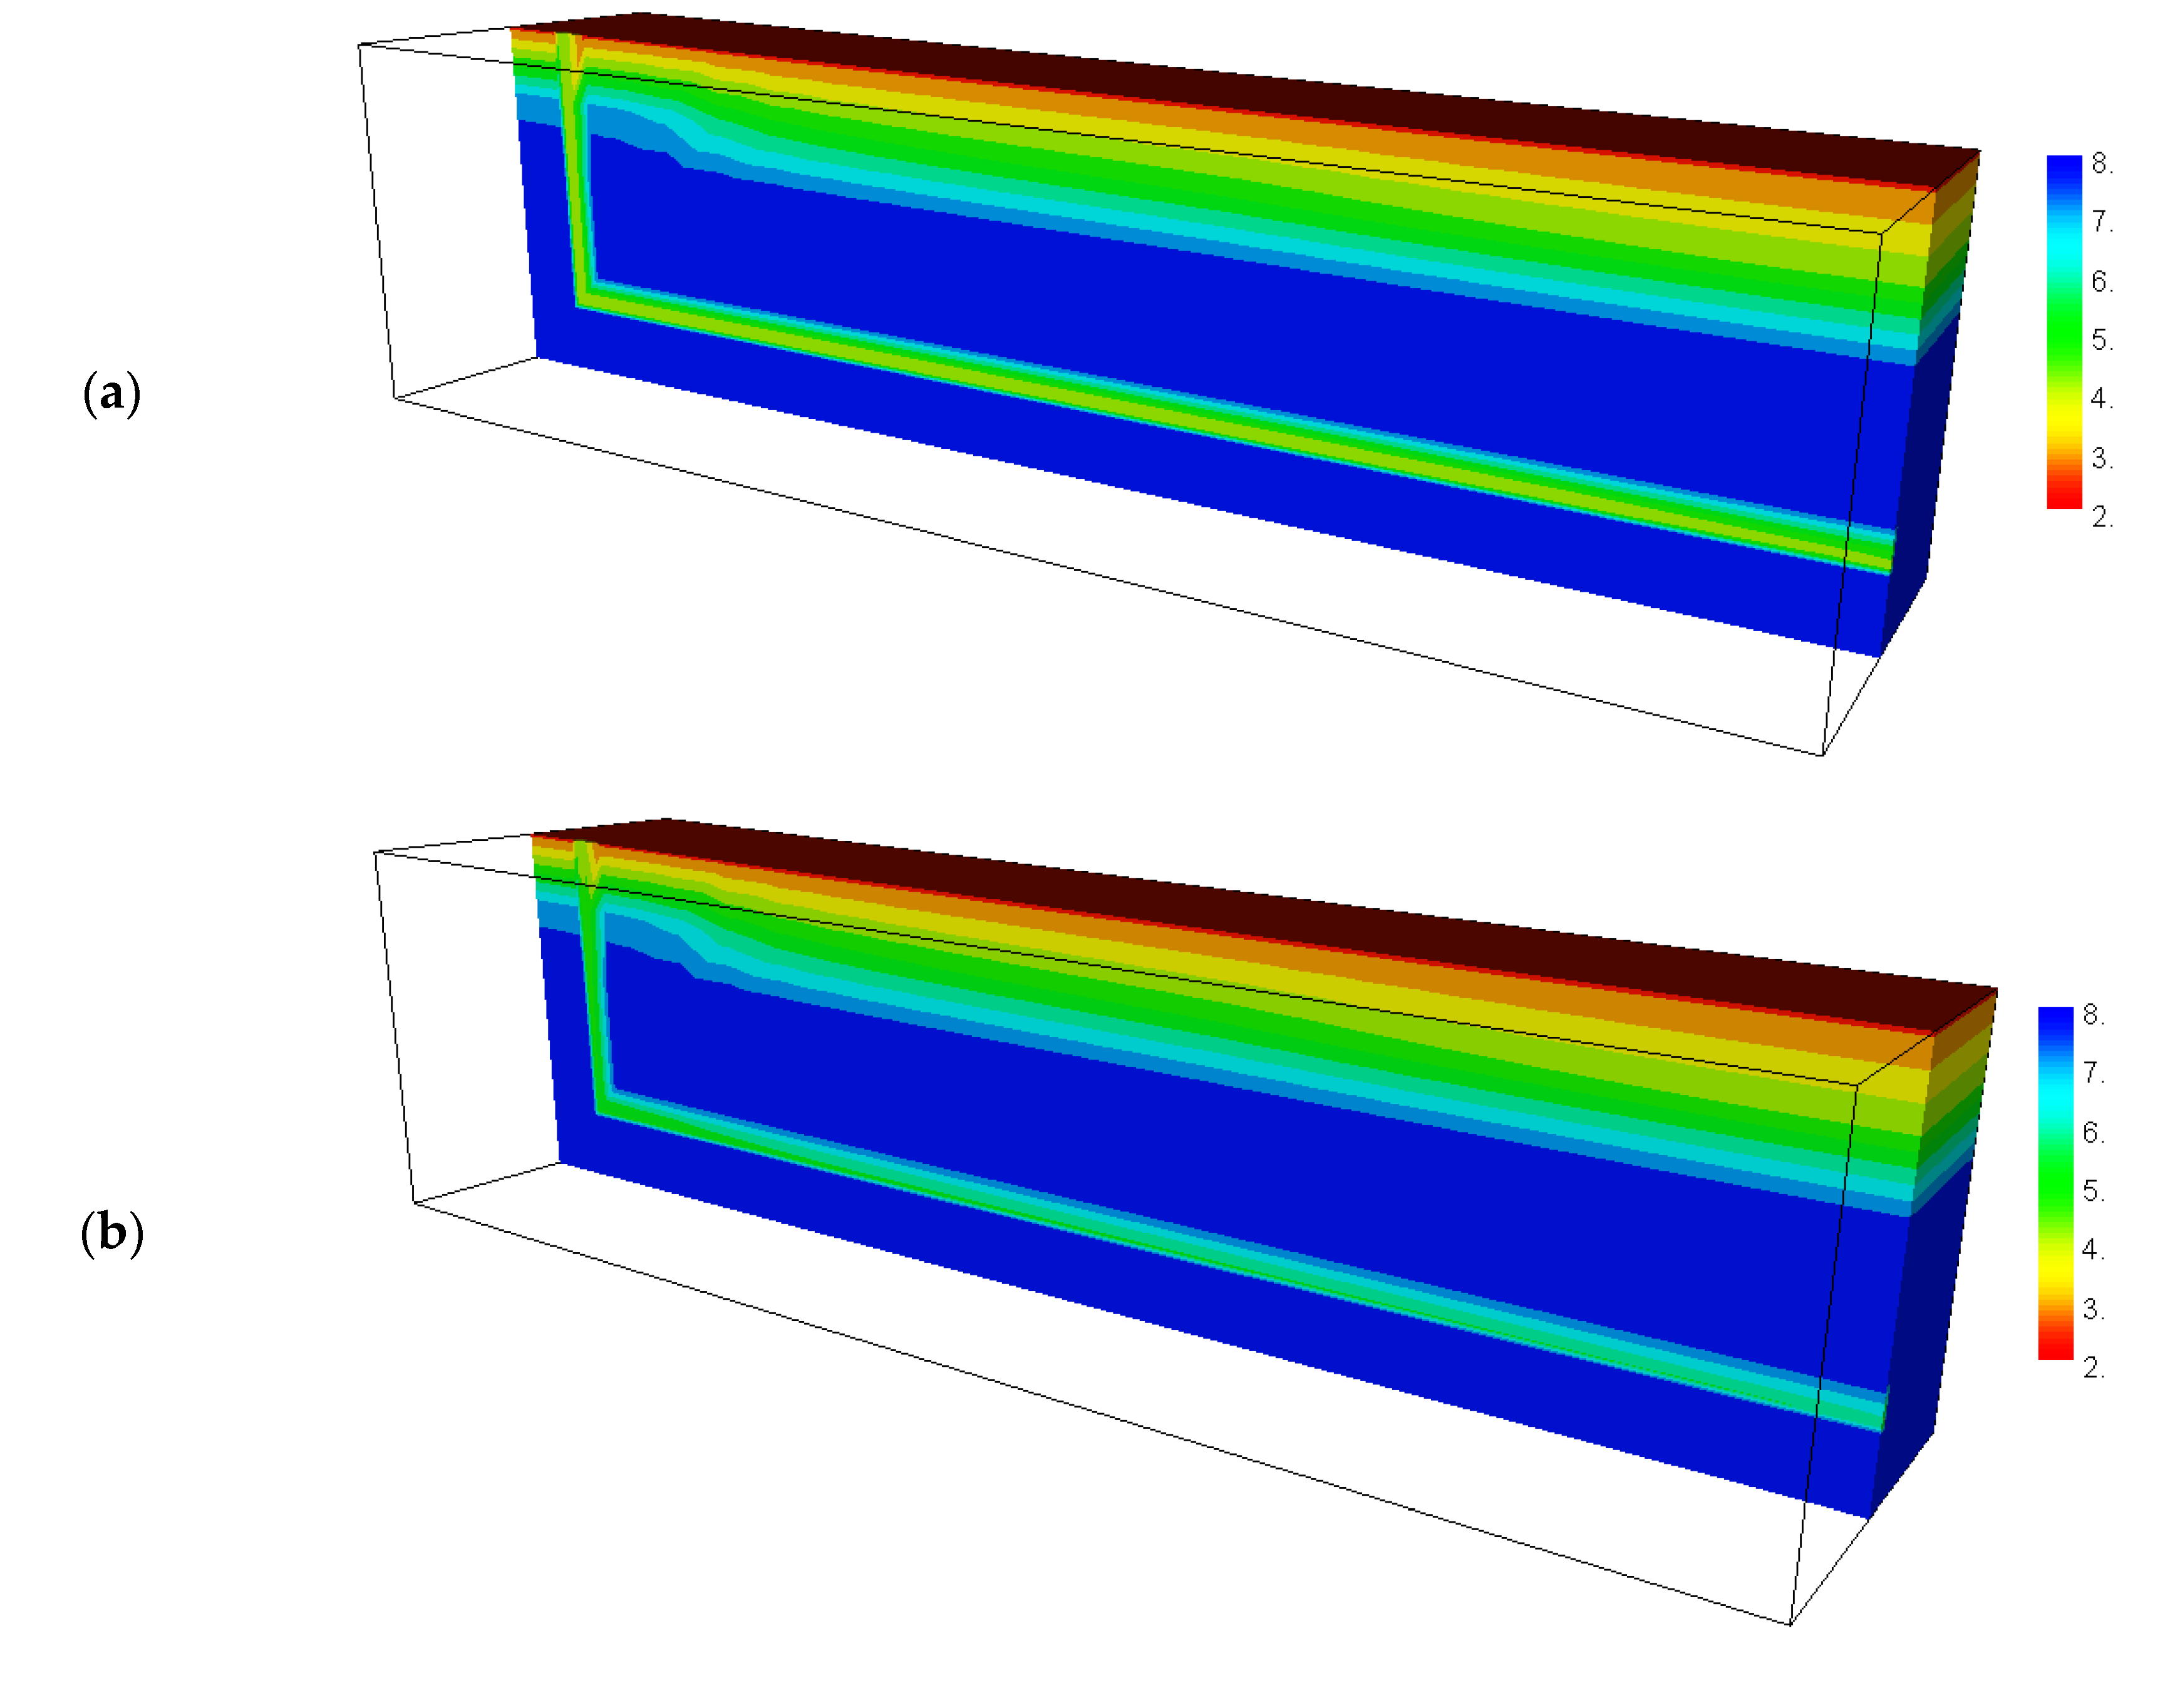
4.4. Calculated Results after Backfilling the Drift

Similar to the groundwater flow before backfilling, rainwater infiltrating from the ground surface percolated through the shaft and horizontal drift. Groundwater flowed out to the audit mouth of the drift. The groundwater flow, excluding the shaft and horizontal drift, was slow.
Figure 7 shows the results of the distribution of the pH and T-Fe concentration at t = 50 years. Since oxygen supplied from the atmosphere was limited in the shallow layer, groundwater was acidified only near the surface, as shown in Figure 7a. The acidified groundwater flowed from the surface to the deeper layer via the shaft and horizontal drift, where the groundwater flow velocity was high. The simulated distribution of pH was almost constant after 50 years.
In the calculations after backfilling, the pH of groundwater from the drift changed higher between 4 and 5 compared to the pH 3.3–3.8 before backfilling (Figure 7a). Assuming that the old drift was filled with neutralized sediment-containing calcite, the pH changed to about pH 6 (Figure 7b). However, when gypsum is produced by a calcite neutralization reaction [31,32], the neutralization reaction is inhibited by gypsum. Thus, in this calculation, the effect of gypsum formation on the calcite dissolution was ignored, because the groundwater flow rate was high in the backfilled drift. The distribution of the T-Fe concentration is shown in Figure 7c,d. Near the audit mouth of the drift, the T-Fe concentration was 0.0004 mol/L or less in case 2-1 and 0.0004 mol/L or less in case 2-2, both of which were much lower than those before backfilling.

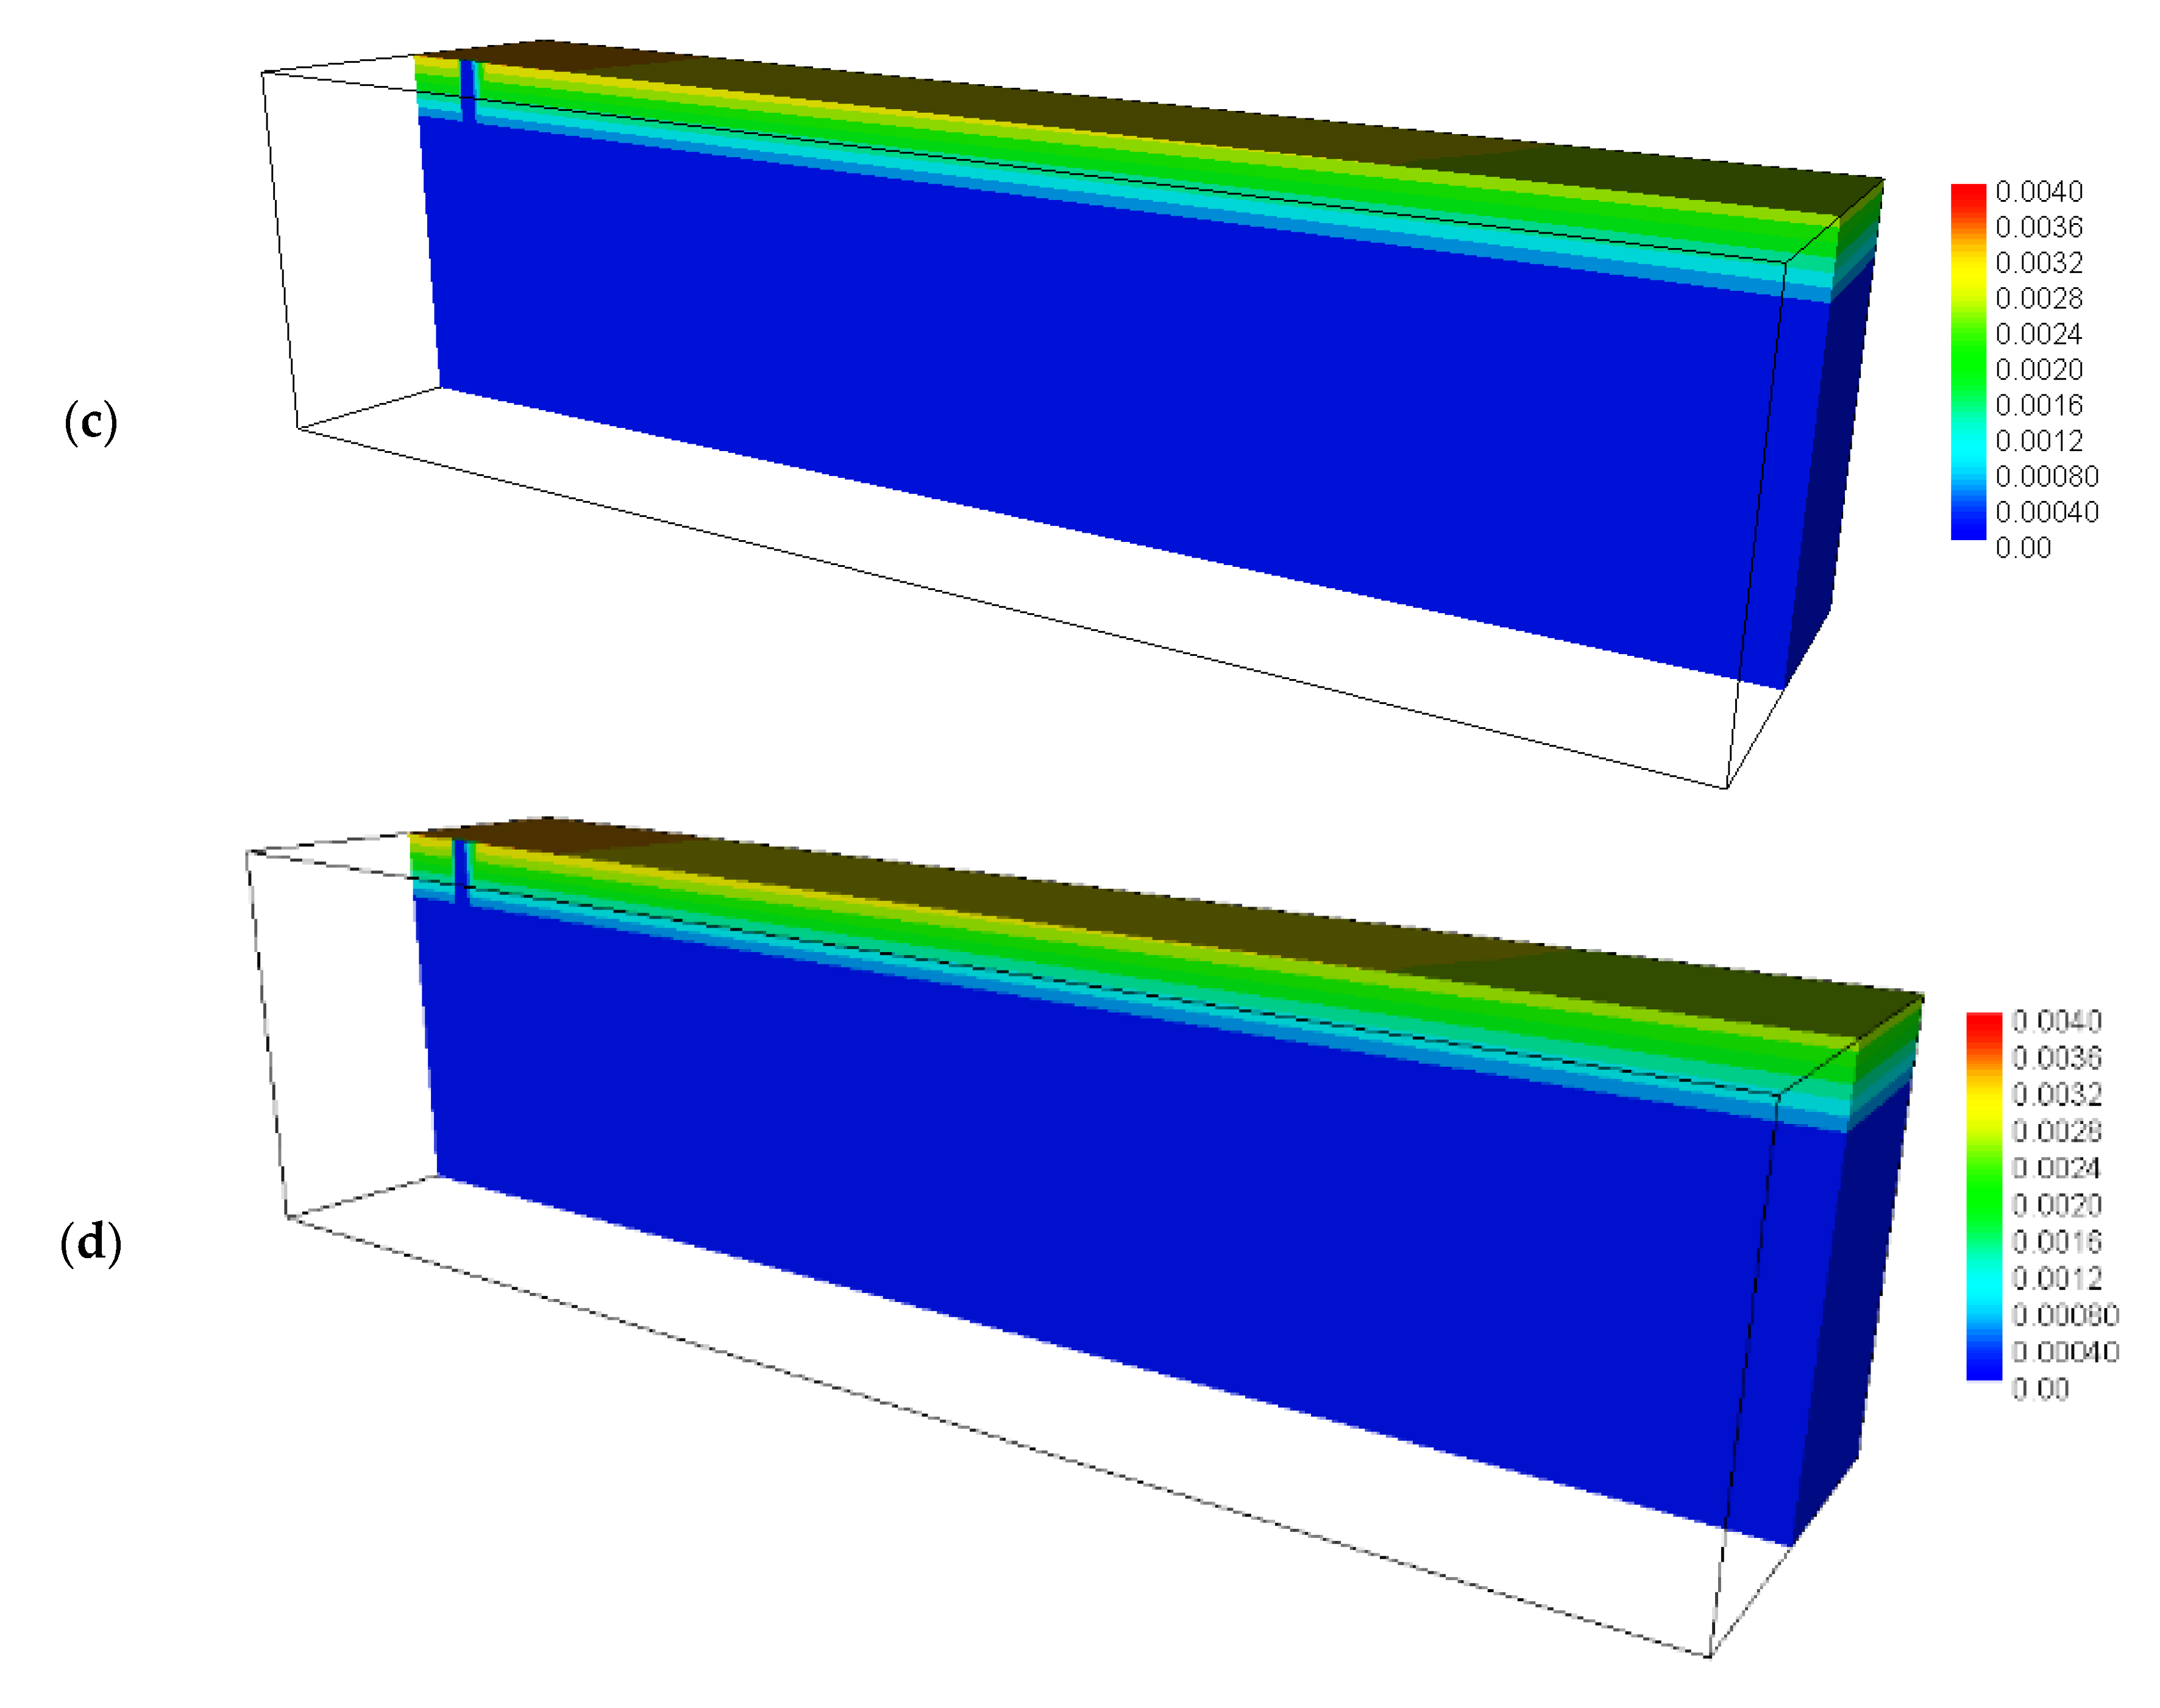
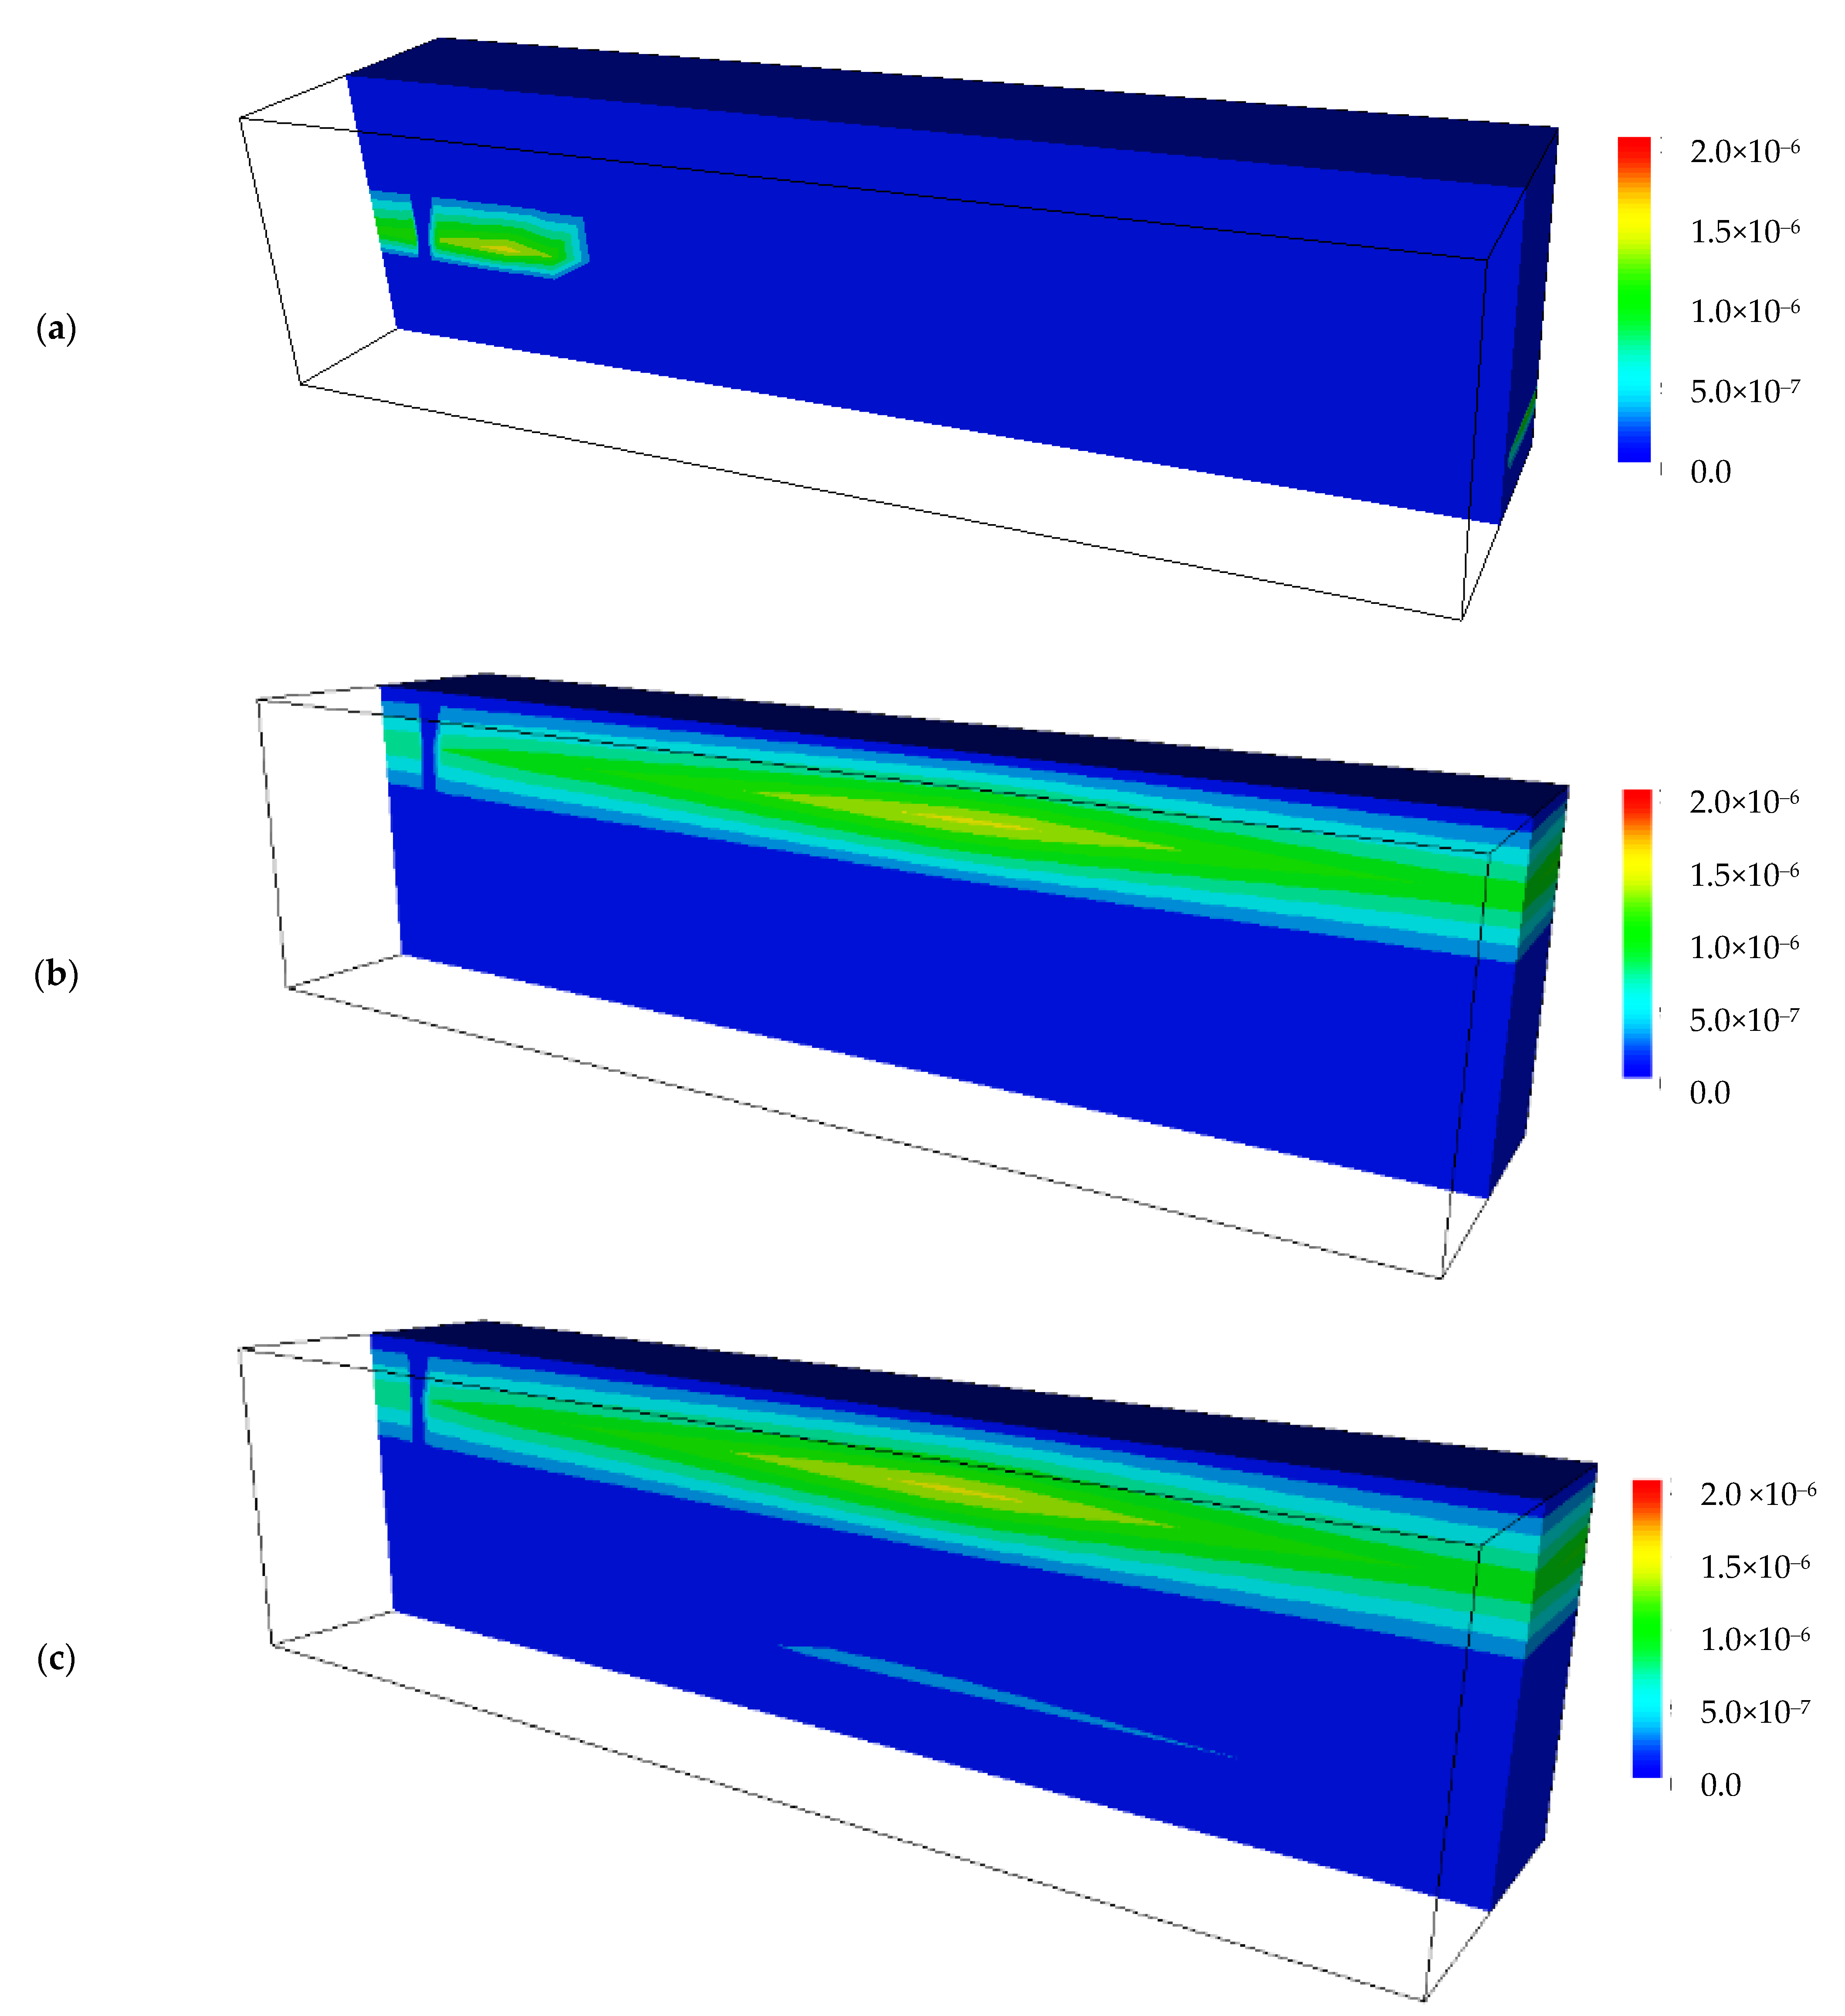
4.5. Calculated Results of the Secondary Minerals before and after Backfilling the Drift

In abandoned or closed mines, with the dissolution of pyrite—in particular, in the unsaturated zone—the groundwater becomes acidic. The iron concentration in the groundwater increases with the acidification. According to the results of the geochemical calculations before backfilling (Figure 8a), the Fe dissolved in the groundwater was precipitated as iron hydroxide (Fe(OH)3) when the pH of the groundwater was almost neutral (Figure 8) around the vertical drift. The groundwater level was recovered after the old drifts were backfilled. When the unsaturated zone before backfilling was submerged and became saturated, oxygen was no longer supplied from the ground surface. Thus, oxygen was supplied only from the ground surface, and the pH became acidic only in the shallow layer as pyrite was dissolved (Figure 7a,b). Then, Fe dissolved in groundwater was precipitated as Fe(OH)3 at the deeper layers (Figure 8b,c). The precipitation of Fe as Fe(OH)3 resulted in a lower T-Fe concentration in the groundwater, which reduced the burden of AMD treatment.
A reddish-brown iron (hydr)oxide was precipitated along the cracks in the drilled core. After backfilling the drift, iron hydr(oxide) was considered to precipitate over a wide area, as inferred from the geochemical simulation results (Figure 8).

5. Discussion

The Fe concentration discharged from the drift was calculated at approximately 0.002 mol/L (approximately 110 mg/L), as shown in Figure 6. Multiplying the flow rate of 0.091 m3/min at the audit mouth, the total Fe discharged from the mine was 5.26 tons/year. The T-Fe concentration after backfilling the drift was 0.0004 mol/L (22 mg/L) or less in case 2-1 and case 2-2 (Figure 7). Multiplied by 0.059 m3/min after backfilling, the total Fe discharged was 0.68 tons/year. After backfilling the drift, the load of Fe was reduced to less than one-seventh. This leads to a reduction in the load on the treatment facilities for AMD.
The correlation coefficient between T-Fe and Pb was calculated for seven samples of Table 6, excluding R-2, which contained Pb less than the detection limit. The correlation coefficient between the measured concentrations of T-Fe and Pb was 0.74, and the tendency of a high concentration in the drift was similar. It could be inferred that galena was dissolved just as pyrite was in contact with dissolved oxygen to promote dissolution. Therefore, if the supply of oxygen from the atmosphere was cut off after the groundwater level returned to the original level before excavation, it could be expected that the concentration of Pb would decrease, as well as T-Fe. It was reported that the coprecipitation or sorption of Pb on Fe precipitates could control the concentration of Pb in the liquid phase [33]. A decrease in the dissolved concentration of Pb could be expected by promoting the precipitation of Fe.

6. Conclusions

Geochemical calculations were carried out coupled with the results of the groundwater flow simulation in which the groundwater level was recovered due to backfilling the drift. As the groundwater level rose, the supply of dissolved oxygen was reduced. As a result, the dissolution of pyrite contained in the rocks was restricted by geochemical calculations.
The effects of backfilling the drift resulted in not only reducing the flow rate of AMD but also improving the quality of AMD. The geochemical calculations showed that pH 3 to 4 of AMD before backfilling increased to pH 4 to 5. As the pH of the groundwater approached neutral, the precipitation of Fe(OH)3 occurred, and the Fe concentration also decreased. In addition, the quality of AMD was further improved in pH 5 to 6 when calcite was added in the drift filling. If the supply of oxygen from the atmosphere was cut off, it was expected that the dissolution of galena would not occur, and the concentration of Pb would decrease.
From the results of the geochemical calculations, the reduction of the burden of AMD was evaluated quantitatively. After backfilling the drift, the load of Fe was reduced to less than one-seventh. Therefore, it is effective in applying geochemical models to abandoned and closed mines to evaluate the effects of backfilling underground spaces on AMD.

Author Contributions

Conceptualization, K.Y. and S.T.; software, K.Y. and S.T.; validation, K.Y., S.T. and S.Y.; investigation, M.E.; writing—original draft preparation, K.Y. and S.T.; writing—review and editing, T.I.; visualization, K.Y. and S.T.; and supervision, M.S. All authors have read and agreed to the published version of the manuscript.

Funding

This work was supported in part by the development of advanced technology for the mine drainage treatment from 2012 to 2014 of the Ministry of Economy, Trade, and Industry.

Acknowledgments

The authors wish to thank the editor and anonymous reviewers for their constructive comments that improved this manuscript. We would also like to thank the staffs of Mitsubishi Materials Corporation, Eco-Management Corporation, and Mitsubishi Materials Techno Corporation for their help, advice, and cooperation during this study.

Conflicts of Interest

The authors declare no conflict of interest. The funders had no role in the design of the study; in the collection, analyses, or interpretation of the data; in the writing of the manuscript; or in the decision to publish the results.

References

  1. JUDGIT! Available online: https://judgit.net/projects/3758 (accessed on 1 May 2021).
  2. Konno, Y.; Ikeda, H.; Sakata, T. Pollution control of Acid Mine Drainage at Matsuo sulphur-pyrite Mine. J. Min. Inst. Jpn. 1984, 100, 1031–1038. [Google Scholar] [CrossRef] [Green Version]
  3. Kosaka, K.; Noyori, K. About mine drainage treatment at Taishu mine. J. Min. Metall. Inst. Jpn. 1982, 98, 344–349. [Google Scholar]
  4. Razowska, L. Changes of groundwater chemistry caused by the flooding of iron mines (Czestochowa Region, Southern Poland). J. Hydrol. 2001, 244, 17–32. [Google Scholar] [CrossRef]
  5. Tomiyama, S.; Ueda, A.; Ii, H.; Nakamura, Y.; Koizumi, Y.; Saito, K. Sources and flow system of groundwater in the Hosokura mine, Miyagi prefecture, using geochemical method and numerical simulation. J. MMIJ 2010, 126, 31–37. [Google Scholar] [CrossRef] [Green Version]
  6. Tomiyama, S.; Igarashi, T.; Ii, H.; Takano, H. Sources and flow system of groundwater in the Shimokawa mine, north Hokkaido, using geochemical method and numerical simulation. J. MMIJ 2016, 132, 80–88. [Google Scholar] [CrossRef] [Green Version]
  7. Tomiyama, S.; Igarashi, T.; Tabelin, C.B.; Tangviroon, P.; Ii, H. Acid mine drainage sources and hydrogeochemistry at the Yatani mine, Yamagata, Japan: A geochemical and isotopic study. J. Contam. Hydrol. 2019, 225, 103502. [Google Scholar] [CrossRef] [PubMed]
  8. Tomiyama, S.; Igarashi, T.; Tabelin, C.B.; Tangviroon, P.; Ii, H. Modeling of the groundwater flow system in excavated areas of an abandoned mine. J. Contam. Hydrol. 2020, 230, 103617. [Google Scholar] [CrossRef]
  9. Tomiyama, S.; Ii, H.; Koizumi, Y.; Metsugi, H. Modeling of groundwater recharge and discharge in Tomitaka mine, Miyazaki Prefecture. J. Groundw. Hydol. 2010, 52, 261–274. [Google Scholar] [CrossRef] [Green Version]
  10. Tokoro, C.; Fukaki, K.; Kadokura, M.; Fuchida, S. Forecast of AMD quantity by a series tank model in three stages: Case studies in two closed Japanese mines. Minerals 2020, 10, 430. [Google Scholar] [CrossRef]
  11. Yamaguchi, K.; Tomiyama, S.; Igarashi, T.; Yamagata, S.; Ebato, M.; Sakoda, M. Effects of Backfilling Excavated Underground Space on Reducing Acid Mine Drainage in an Abandoned Mine. Minerals 2020, 10, 777. [Google Scholar] [CrossRef]
  12. Shen, B.; Poulsen, B.; Luo, X.; Qin, J.; Thiruvenkatachari, R.; Duan, Y. Remediation and monitoring of abandoned mines. Int. J. Min. Sci. Technol. 2017, 27, 803–811. [Google Scholar] [CrossRef]
  13. Sheshpari, M. A Review of Underground Mine Backfilling Methods with Emphasis on Cemented Paste Backfill. EJGE 2015, 20, 5183–5208. [Google Scholar]
  14. Arribas, A.; Mizuta, T. Potential for Porphyry Copper Deposits in Northern Tohoku (or the Exploration Potential for Base and Precious Metal Deposits in Japan 2020). Resour. Geol. 2018, 68, 144–163. [Google Scholar] [CrossRef] [Green Version]
  15. Shimizu, H.; Matsunaga, E. Observations on the Tanosawa veins at the Osarizawa mine. Min. Geol. 1964, 14, 126–133. [Google Scholar]
  16. Saito, S. The Changes of a Community with the Decline of its Mining Industry—A Case of the Osarizawa Mining Industry Ltd. Ann. Tohoku Geogr. Assoc. 1979, 31, 1–7. [Google Scholar]
  17. Machinda, K.; Sugawara, K.; Nakamura, K. Effect of Various Metals on Human Body in Mine and the Districts (1) Regional variation of metals in stream water and drinking water. Jpn. J. Health Hum. Ecol. 1983, 49, 16–26. [Google Scholar] [CrossRef]
  18. Yokoyama, K.; Takeuchi, S.; Nakai, I.; Tsutsumi, Y.; Sano, T.; Shigeoka, M.; Miyawaki, R.; Matsubara, S. Chemical compositions of electrum grains in ore and placer deposits in the Japanese islands. Natl. Mus. Nat. Sci. Monogr. 2011, 42, 1–80. [Google Scholar]
  19. Parkhurst, D.L.; Kipp, K.L.; Charlton, S.R. PHAST Version 2—A Program for Simulating Groundwater Flow, Solute Transport, and Multicomponent Geochemical Reactions; U.S. Geological Survey: Denver, CO, USA, 2010; 235p.
  20. Parkhurst, D.L.; Appelo, C.A.J. User’s Guide to PHREEQC (Version 2)—A Computer Program for Speciation, Batch-Reaction, One-Dimensional Transport, and Inverse Geochemical Calculations; Water-Resources Investigations Report 99-4259; U.S. Geological Survey: Denver, CO, USA, 1999; 312p.
  21. Kipp, K.L. Guide to the Revised Heat and Solute Transport Simulator HST3D—Version 2; Water-Resources Investigations Report 97-4157; U.S. Geological Survey: Denver, CO, USA, 1997; 149p.
  22. Kojima, K.; Nakao, K. Basics and Practices of Geological Technology; Kajima Institute Publishing Co., Ltd.: Tokyo, Japan, 1995; 391p. [Google Scholar]
  23. Stumm, W.; Morgan, J.J. Aquatic Chemistry, 3rd ed.; Wiley: New York, NY, USA, 1995; pp. 690–691. [Google Scholar]
  24. Sugiyama, T.; Shimizu, S.; Ritthichauy, W.; Tsuji, Y. Determination of Pore Structure Characteristic of Mortar Using a Steady State Migration Test. Proc. JSCE 2004, 2004, 227–238. [Google Scholar] [CrossRef] [Green Version]
  25. Ito, K.; Fukushi, K.; Hashimoto, K.; Tanaka, C.; Ikeda, H.; Sato, T.; Yoneda, T. A Novel Remediation Method for Arsenic Bearing Acid Mine Drainage Learnt from Natural Attenuation Process. J. MMIJ 2008, 124, 519–528. [Google Scholar] [CrossRef]
  26. U.S. Geological Survey. A Compilation of Rate Parameters of Water-Mineral Interaction Kinetics for Application to Geological Modeling; U.S. Geological Survey: Denver, CO, USA, 2004; 64p.
  27. Lasaga, A.C. Chemical Kinetics of Water-Rock Interactions. J. Geophys. Res. 1984, 89, 4009–4025. [Google Scholar] [CrossRef]
  28. Williamson, M.A.; Rimstidt, J.D. The kinetics and electrochemical rate-determining step of aqueous pyrite oxidation. Geochim. Cosmochim. Acta 1994, 58, 5443–5454. [Google Scholar] [CrossRef]
  29. Brigatti, M.F.; Galán, E.; Theng, B.K.G. Chapter 2—Structure and Mineralogy of Clay Minerals. In Developments in Clay Science; Elsevier: Amsterdam, The Netherlands, 2013; Volume 5, pp. 21–81. [Google Scholar]
  30. Chandra, A.P.; Gerson, A.R. The mechanisms of pyrite oxidation and leaching: A fundamental perspective. Surf. Sci. Rep. 2010, 65, 293–315. [Google Scholar] [CrossRef]
  31. Herrera, P.S.; Uchiyama, H.; Igarashi, T.; Asakura, K.; Ochi, Y.; Ishizuka, F.; Kawada, S. Acid mine drainage treatment through a two-step neutralization ferrite-formation process in northern Japan: Physical and chemical characterization of the sludge. Miner. Eng. 2007, 20, 1309–1314. [Google Scholar] [CrossRef]
  32. Igarashi, T.; Herrera, S.P.; Uchiyama, H.; Miyamae, H.; Iyatomi, N.; Hashimoto, K.; Tabelin, C.B. The two-step neutralization ferrite-formation process for sustainable acid mine drainage treatment: Removal of copper, zinc and arsenic, and the influence of coexisting ions on ferritization. Sci. Total Environ. 2020, 715, 136877. [Google Scholar] [CrossRef] [PubMed]
  33. González, R.M.; Cánovas, C.R.; Olías, M.; Macías, F. Seasonal variability of extremely metal rich acid mine drainages from the Tharsis mines (SW Spain). Environ. Pollut. 2020, 259, 113829. [Google Scholar] [CrossRef]
Figure 1. Location of the mine and sampling points with a Stiff diagram.
Minerals 11 01297 g001
Figure 2. Illustration of the groundwater flow regime.
Minerals 11 01297 g002
Figure 3. Geochemical reaction model (The cross-sections of the center of the 3D models are shown.): (a) before backfilling and (b) after backfilling.
Minerals 11 01297 g003
Figure 4. A Piper diagram showing the hydrochemical facies of the water samples.
Minerals 11 01297 g004
Figure 5. X-ray diffraction spectrum of the B-1 borehole.
Minerals 11 01297 g005
Figure 6. Distribution of pH (a), total iron concentration (mol/L) (b), sulfate ion concentration (mol/L) (c), and dissolved oxygen concentration before backfilling (mol/L as the oxygen atom) (d) (calculated results of case 1).
Minerals 11 01297 g006
Figure 7. Distribution of the pH and total iron concentration after backfilling at t = 50 years (case 2-1 and case 2-2): (a) pH (case 2-1), (b) pH (case 2-2), (c) total iron concentration (mol/L) (case 2-1), and (d) total iron concentration (mol/L) (case 2-2).
Minerals 11 01297 g007aMinerals 11 01297 g007b
Figure 8. Distribution of precipitated Fe(OH)3 (mol/L) at t = 50 years: (a) case 1, (b) case 2-1, and (c) case 2-2.
Minerals 11 01297 g008
Table 1. Simulation cases.
CaseTargetContent
1Reproducing current quality of AMDBefore backfilling
2-1Estimating improved quality of AMDAfter backfilling
2-2Same as aboveAfter backfilling with calcite
Table 2. Boundary conditions of the groundwater flow and geochemical calculations.
BoundaryGroundwater Flow CalculationGeochemical Calculations
Upper surfaceTotal head fixedFixed composition of river water (R-1 in Table 6) in equilibrium with atmospheric CO2
The exit of the mine where AMD is released (5 m × 5 m)Fixed flow rate (before backfilling: 0.091 m3/min; after backfilling: 0.059 m3/min) [11]same as above
Side and bottom surfacesImpermeableZero concentration gradient
Table 6. Chemical compositions of the water samples.
Sample NoLocalitypH 1EC
(mS/m) 1
ORP
(mV) 1
Temp
(°C) 1
Chemical Composition (mg/L) 1
Na+K+Ca2+Mg2+ClHCO3SO42−NO3T-FePb
R-1River4.2 ± 0.19.0 ± 0.7388 ± 3613.8 ± 5.24.5 ± 0.30.5 ± 0.01.5 ± 0.21.3 ± 0.06.9 ± 0.2<511 ± 0.71.4 ± 0.10.15 ± 0.110.02 ± 0.01
R-2River4.9 ± 0.26.5 ± 0.4329 ± 3113.1 ± 4.34.6 ± 0.10.3 ± 0.11.6 ± 0.21.6 ± 0.17.4 ± 0.1<511 ± 0.70.2 ± 0.00.05 ± 0.04<0.01
B-1Deep depth well
(GL– 46.0~51.5 m)
3.53353010.34.80.99.49.07.5<51000.14.60.08
B-2Shallow depth well
(GL– 2.0~15.2 m)
3.7375049.75.00.88.98.47.7<599<0.14.80.34
M-1Mining level (−2 L)3.3465239.85.00.97.9117.8<52200.73000.58
M-2Mining level (−5 L)3.6 ± 0.1233 ± 8404 ± 2612.6 ± 0.59.7 ± 0.28.7 ± 0.5200 ± 28180 ± 146.9 ± 0.4<51250 ± 71<0.122 ± 150.38 ± 0.01
M-3Mining level (−5 L)3.9 ± 0.1375 ± 45301 ± 715.0 ± 0.3199.62002507.3<52900<0.1610 ± 240.55 ± 0.04
M-4Mining level (−4 L)3.5 ± 0.2190 ± 10407 ± 2512.5 ± 0.37.8 ± 0.23.5 ± 0.549 ± 2160 ± 1410 ± 1<5890 ± 28<0.127 ± 60.22 ± 0.01
1 Data are expressed in average ± standard deviation.
Table 7. X-ray diffraction results.
Sample NoDepthQz 1PlKfPyMcChl
B-1 boreholeGL −9.00~−9.07 m2 ++
1 Qz: Quartz, Pl: Plagioclase, Kf: K-feldspar, Py: Pyrite, Mc: Mica, and Chl: Chlorite. 2 ◎: very large amount, +: small amount, and −: trace amount.
Publisher’s Note: MDPI stays neutral with regard to jurisdictional claims in published maps and institutional affiliations.

