
Incorporating Kinetic Modeling in the Development Stages of Hard Rock Mine Projects
by
 and
and
Youssef Toubri
1,*, 
Denys Vermette
2,
Isabelle Demers
1,
Nicholas Beier
3 and
Mostafa Benzaazoua
4
1
Research Institute on Mines and Environment, Université du Québec en Abitibi-Témiscamingue, Rouyn-Noranda, QC J9X 5E4, Canada
2
IOS Services Géoscientifiques, Val-d’Or, QC J9P 7H1, Canada
3
Civil and Environmental Engineering Department, University of Alberta, Edmonton, AB T6G 1H9, Canada
4
Mining Environment & Circular Economy, Mohammed VI Polytechnic University (UM6P), Ben Guerir 43150, Morocco
*
Author to whom correspondence should be addressed.
Minerals 2021, 11(12), 1306; https://0-doi-org.brum.beds.ac.uk/10.3390/min11121306
Submission received: 3 November 2021
/
Revised: 18 November 2021
/
Accepted: 21 November 2021
/
Published: 24 November 2021
(This article belongs to the Special Issue Environmental Geochemistry in the Mining Environment)
Abstract
:Weathering cell test, designed specifically to overcome material-limited constraints, yields prompt and efficient experimental assessment during the development stages of mining projects. However, it has barely benefited from geochemical modeling tools despite their ease of use. Accordingly, this paper aims to strengthen the upstream geochemical assessment via parametric analysis that simulates the effect of various mineral assemblages on leachate quality recovered from weathering cells. The main objective is to simulate the pH in presence of silicate neutralizing minerals and Mn release from carbonates based upon minimal characterization data. The public domain code PHREEQC was used for geochemical kinetic modeling of four weathering cells. The kinetic model utilized a water film concept to simulate diffusion of chemical elements from mineral surfaces to the pore water. The obtained results suggest that the presence of the silicate neutralizing minerals slightly affects the Mn release from carbonates. Furthermore, plagioclases could supply a significant neutralization potential when they predominate the mineral assemblage. Finally, coupling weathering cell test and parametric analyses illuminate the pH evolution for various mineral proportion scenarios.
1. Introduction
Mining and quarrying activities produce substantial volumes of solid waste deposited in above-ground containment facilities, which receive up to 90% of the extracted ore [1,2]. Based on the site-specific cut-off grade, the remnant lean grades and the final solid waste from ore processing are categorized as waste rock and tailings respectively, e.g., [3,4]. The sparse sulphide minerals in solid waste, previously sequestered in a reducing environment, are inevitably exposed to oxidizing conditions. Atmospheric oxygen and through-flowing water trigger oxidation of sulphides such as pyrite and pyrrhotite, resulting in potentially contaminated effluents. This naturally occurring phenomenon has aroused growing interest and is termed acid mine drainage (AMD) or contaminated neutral drainage (CND), depending on the neutralizing potential [5,6,7,8,9,10,11,12,13,14,15,16,17,18,19,20]. Other sources of contamination in the mine framework are also present, e.g., [21,22,23]. Sulphide oxidation and the subsequent effluent result in water quality exceedances in terms of metals and oxyanions concentrations as well as low pH in the case of AMD. Mine drainage is a worldwide ecological-security threat with the ability to toxify freshwaters and impair life forms and their support systems. Research endeavors adopted by governments, the mining industry, universities, and research establishments focus on assessment, prevention, and treatment of AMD and CND to safeguard ecosystems neighboring mine facilities [24,25,26,27,28,29,30,31,32,33,34,35,36,37,38,39,40,41,42].
Forecasting water quality through simulations of coupled physical and geochemical processes using well-vetted programs is a worthwhile endeavor to set proactive measures [43,44,45]. Calibrated numerical models via laboratory and/or field tests that provide long-term predictions and/or parametric analysis of water quality have been used extensively to assess the geochemical behavior of mine solid waste as well as the performance of reclamation scenarios [46,47,48,49,50,51,52,53,54]. For instance, Wunderly et al. [55] established the PYROX model to simulate diffusion-controlled oxidation of pyrite. Romano et al. [56] utilized PYROX to perform a comparative survey of different reclamation scenarios. Graupner et al. [57] also investigated PYROX capabilities to predict mining impact on groundwater. Molson et al. [51] assessed design strategies intended to minimize AMD from waste rock using HYDRUS and POLYMIN. Both codes were extensively used and investigated for a wide range of problems [47,48,51,58,59,60,61,62,63]. In this respect, the MIN3P model [64,65,66,67,68] has proven to be an effective and versatile numerical tool to simulate kinetically controlled and transport-controlled reactions. Kalonji-Kabambi et al. [49] used the MIN3P model to simulate the geochemical behavior of uncovered and covered highly reactive tailings. Pabst et al. [54] used MIN3P to evaluate the hydro-geochemical behavior of covered pre-oxidized tailings. Although they provide many benefits, most of the geochemical modeling case studies are carried out during the operation and closure stages of the mine life cycle as they tackle design strategies and the performance of reclamation scenarios. The development stage of a mining project has received very little benefit from geochemical modeling tools because of the lack of in situ waste materials and the data-intensive nature of the programs being used. A geochemical assessment during the upstream stages of a mining project provides a proactive way to identify environmental risks and mitigate them during operation and closure stages. Advanced exploration, preliminary economic assessment, and feasibility study stages are globally referred to as the upstream stages of a mining project, during which deposit definition and preliminary environmental and operational data are gathered. As the upstream stage benefits from specific kinetic testing and suited management approaches [69,70,71,72,73], it should be further expanded through geochemical modeling tools.
This research is intended to underpin the geochemical assessment of solid waste through a numerical modeling method that complies with the upstream stage constraints. In this regard, simulations of weathering cell tests to be performed during material-limited stages (exploration, feasibility stages) were used to forecast scenarios that may stem from various mineral assemblages. Conservative reasoning and worse case scenarios were adopted herein to (i) address shortcomings related to material availability, and (ii) avoid underestimations of the geochemical response of solid waste. Adding a protective margin throughout the development stage is advisable to refine risk identification. This study aims to (i) simulate weathering cells designed specifically for the upstream stage, and (ii) introduce a straightforward geochemical screening tool that expands the geochemical assessment from the interpretation of experimental results to parametric analysis throughout the development stage. PHREEQC is the modeling engine used for this study; it is a public domain code broadly used for speciation, batch-reaction, one-dimensional transport, and inverse geochemical calculation [74]. However, it also encompasses other advanced capabilities such as solid solutions, surface complexation, and kinetics. PHREEQC was chosen mainly because of its flexible interface that allows the implementation of time-dependent equations that could be solved using integration routines incorporated in the program. Unlike many other public codes, PHREEQC enables coupling of kinetics and 1D transport. Moreover, a wide range of geochemical databases are included in PHREEQC. Nicholson et al. [52] employed PHREEQC kinetics and 1D transport keyword blocks to simulate metal leaching from acid-generating waste rock at a uranium mine. Labus and Grmela [75] set up 1D kinetic-based model in PHREEQC to simulate pyrite oxidation within coal waste piles. Similarly, Embile et al. [76] introduced locally measured dissolution rates of pyrrhotite and forsterite in PHREEQC to simulate long-term kinetic tests of a milling waste. Likewise, PHREEQC was utilized in the present study to simulate kinetically controlled reactions; contrary to the aforementioned examples, this study involves a multi-mineral composition in the kinetics keyword block.
The Akasaba West mining project was selected for this modeling study because it is in the early development stages. Vermette [77] developed a staged geo-environmental protocol for the Akasaba West project based on static and weathering cell tests as well as mineralogy using materials from drill core surveys. Those findings recommended mine waste classification into geo-environmental domains in order to prevent future environmental liabilities [77]. A geo-environmental domain includes lithologies with nearly the same geochemical behavior. This research focuses first on the assessment of the geochemical behavior of each suggested geo-environmental domain based on classification as well as the overall lithological units mixed. Secondly, simulation of the experimental results using PHREEQC is presented in order to perform parametric analyses. The expected outcome is to supply mine managers with a straightforward screening method complying with data-limited and material-restricted situations to effectively simulate the pH of kinetically controlled reactions along the development stage of a mine life cycle.
2. Materials and Methods
2.1. Geological Background
Agnico Eagle Ltd. owns the Akasaba West Au-Cu deposit located in the Abitibi-Témiscamingue region, approximately 15 km east of Val d’Or in Quebec, Canada. The geological field of Akasaba West site belongs to Héva Formation of the Louvicourt District, consisting of volcanic and volcanoclastic rocks [77]. The volcanism event is mainly expressed by the presence of basalt, dacite, and quartz-feldspar bearing porphyry rocks. Dyke and sill swarms cross-cut volcanic and volcanoclastic outcrops [77]. Low pressure-low temperature metamorphic events resulted in low-grade greenschist facies. Exploration investigations in this region resulted in the discovery of a gold—copper deposit. The mineralization style consists of thinly disseminated sulphides hosted in moderately to strongly altered basalts, andesite, volcanoclastic dacite, and trachyandesite [77]. Geological descriptions from diamond drill core characterization suggest that the ore is characterized by <5% pyrite occurring as disseminations and locally as clusters, veinlets, or thin massive sulphide lenses. The Akasaba West Au-Cu deposit will yield 5.12 Mt of ore containing 0.87 ppm Au and 0.49% Cu. Up to 7.62 Mt of waste rock will be stored in above-ground facilities.
2.2. Sample Preparation and Characterization
Prior to this study, materials from drill core surveys underwent interval sampling of 3 m. Afterwards, Vermette [77] led a staged geo-environmental protocol and identified seven lithogeochemical units spanning the extent of the future open pit. Throughout the protocol, a selection process of samples was set up according to geometallurgical directives. The final stage of the selection process provided 86 samples allocated to seven litho-geochemical units (known as geometallurgical units). The number of samples per unit was dictated by the lithology prevalence in drill cores logging. Static and kinetic tests as well as mineralogical characterization were undertaken to classify the litho-geochemical units into a set of units with nearly the same geochemical behavior; named geo-environmental domains. Accordingly, Vermette [77] proposed a waste disposal plan based on mine waste sorting into three geo-environmental domains (mafic domain, dacite domain, and intermediate domain). This classification was determined from the individual geochemical assessment of each litho-geochemical unit. In the present study, a composite sample from each geo-environmental domain was prepared to assess the aforementioned disposal scenario. Furthermore, a fourth composite sample encompassing all units was evaluated to compare sorted and unsorted materials and to gain insights about the whole geochemical behavior of the solid waste in the case of mixed disposal. The blending proportions originated from the number of samples that represent each lithology. Blending and homogenization were accomplished under dry conditions. Figure 1 displays the blending proportions for each composite sample.
In previous works, kinetic assessment was undertaken on 11 ground drill core samples from Akasaba West with D50 ranging from 370 to 560 μm; all leachates maintained neutral to slightly alkaline pH values [77]. In the present study, the drill core samples were ground to less than 100 μm to deliberately expose thinly disseminated sulphides to favor optimal reaction conditions with the chosen kinetic test apparatus [36,78]. The specific gravity (Gs) of the homogenized composite samples was measured with a Micromeritics Helium Pycnometer (Quantachrome corporation, Unité de Recherche et de Service en Technologie Minérale URSTM, Rouyn-Noranda, QC, Canada). The specific surface area (Ss) was determined with a Micromeritics surface area analyzer (Quantachrome corporation, URSTM, Rouyn-Noranda, QC, Canada) using the BET (Brunauer, Emmett et Teller) method [79]. The geometric surface area (SGeo) was calculated using the method of Chapuis and Aubertin [80] to compute the roughness factor. The grain size distribution was gauged using a Malvern Mastersizer laser particle size analyzer (Malvern instruments Ltd, URSTM, Rouyn-Noranda, QC, Canada). Chemical analyses were conducted using acid digestion (HNO3-Br2-HF-HCl) followed by ICP-AES (inductively coupled plasma-atomic emission spectrometry, (PerkinElmer, URSTM, Rouyn-Noranda, QC, Canada) analysis of the digests using a PerkinElmer OPTIMA 3100 RL. An ELTRA CS-2000 induction furnace coupled with an infrared analyzer (ELTRA Elemental Analyzers, URSTM, Rouyn-Noranda, QC, Canada) for carbon dioxide and sulphur dioxide detection analyzed the sulphur (Stotal) and inorganic carbon (Ctotal) contents. The Ctotal was determined after calcination of the solids for 16 h at 375 °C in a muffle furnace (Nabertherm HTCT 01/16) and then combustion in the induction furnace at 1360 °C. Stotal is expected to correspond to sulphide sulphur given the fresh state of the solids preserved in dry conditions before handling. The acid–base accounting (ABA) was conducted following the protocol described by Lawrence and Wang [81] and modified by Bouzahzah et al. [82]. Lawrence and Wang [81] modified the method of Sobek [83] to determine the neutralization potential (NP) by adding HCl followed by back titration to an endpoint pH of 8.3 at ambient temperature. The NP was quantified after one week of acid digestion to stimulate low-reactive neutralizing minerals as suggested by Bouzahzah et al. [82]. The NP was also estimated based on the Ctotal content as shown in Equation (1) assuming that Ctotal stems from carbonates (CNP) [84]. Similarly, the acidic potential (AP) was calculated by assuming that all the sulphide sulphur belongs to pyrite that will oxidize and generate acidity, as expressed by equation (2) [84]. Thereafter, the net neutralization potential (NNP in kg CaCO3/t; NNP = NP−AP) and the NP/AP ratio were computed for interpretation [25,38,70,84].
CNP denotes carbonate neutralizing potential in kg CaCO3/t and AP is the acidic potential (kg CaCO3/t).
CNP = 83.33 × %Ctotal
AP = 31.25 × %Stotal
The mineralogical composition was investigated using an X-ray diffractometer (XRD; Bruker AXS D8 ADVANCE, URSTM, Rouyn-Noranda, QC, Canada). The XRD analyses were conducted on dried and micronized samples at room temperature. Bruker AXS equipment as well as EVA and TOPAS software packages interacted throughout the data compilation to yield mineralogical identification and semi-quantification based on reconciliation with chemical results, allowing a detection limit of less than 1 wt.%. The mineralogical composition and quantification were refined using a scanning electron microscope (SEM) equipped with energy dispersive X-ray spectroscopy probe (EDS; HITACHI S-3500N, detection limit around 1000 ppm, HITACHI High-Tech, URSTM, Rouyn-Noranda, QC, Canada). The aforementioned geological setting and previous surveys from Vermette [77] stressed that the future mine wastes from the Akasaba West open pit are expected to contain low weight proportion of calcite. Therefore, the mineralogical scrutiny with SEM-EDS had a particular focus on identifying and quantifying silicate and sulphide minerals, as they are the foremost source of neutralization and acid generation, respectively. The SEM-EDS analyses covered a range of 210–266 probed points distributed over 8 or 9 different bands on each polished section.
2.3. Weathering Cell Test
A weathering cell is a miniature version of a humidity cell. It consists of a leaching device that enables reaction rates comparable to those of humidity cells [71]. However, weathering cells are slightly more aggressive than humidity cells [28]. Plante et al. [42] reported a liquid to solid ratio for weathering cells that ranges from 5000 to 10,000 L/m3/week versus 2000 L/m3/week for humidity cells. The weathering cell concept was first developed by Cruz et al. [71] to assess pyrite oxidation by leaching 20 g of pyrite with 15 mL of leaching solution. Thereafter, the test was adjusted by increasing the sample mass to 67 g and maintaining the same liquid to solid ratio used by Cruz et al. [28,71,84,85]. Weathering cell testing is a cost-effective method largely used during the upstream geochemical assessment for its ease of implementation and limited manipulation requirements; more importantly, weathering cells cope with material-restrained situations. Moreover, Jouini et al. [38] and Park et al. [86] demonstrated the effectiveness of weathering cell tests even for downstream framework. In this respect, weathering cells were selected to illuminate the differences in metal leaching between the mixed scenario and the geo-environmental domains partitioning.
Four weathering cells were implemented: D1, D2, D3, and T1. These samples encompass the mafic domain, the dacite domain, the intermediate domain, and the three mixed domains, respectively. The leaching device was a Buchner funnel measuring 100 mm in diameter and containing 67 g of sample (dry mass). The sample was placed upon two nylon membrane filters (Whatman 0.45 μm) that were sealed with silica grease along their circumference. The filters prevent the loss of fine-grained particles that could escape through Buchner perforations during the flushes. The silica grease hinders undesirable seepage and enables water retention inside the Buchner funnel. A 250 mL receiving flask was placed under each funnel to recover the filtrate (see supplementary materials). Each sample was flushed with 50 mL of deionized water on the first day, followed by two days of exposure to the ambient air. On the fourth day, samples were flushed again with the same volume of the leach solution and exposed to the ambient air for the rest of the seven-day leaching cycle. The leachates were recovered after 4 ± 0.5 h of retention by applying suction (with a vacuum pump) on the filtering flask. The obtained solutions were weighed and analyzed for electrical conductivity, Eh, and pH. The filtrates obtained using a 0.45 μm nylon filter (Whatman) were analyzed for the main dissolved elements. To ensure sample preservation, the filtrates were acidified to 2% HNO3 prior to ICP-AES chemical analysis.
2.4. The Conceptual Model
Weathering cell tests provide a highly oxidizing environment where atmospheric oxygen and water are not transport-limited throughout the test duration. Therefore, the effluent quality stems mainly from the inherent mineral reactivity and the available reactive surfaces. Oxidation and dissolution reactions under such conditions are kinetically controlled. The conceptual model relies on oxidation and dissolution rates of the sulphides and the gangue minerals, respectively. In accordance with the mineralogical characterization results, a kinetic reactivity rate for each mineral was selected from the literature based upon experimental conditions. The kinetics should be coupled with equilibrium and transport processes deemed relevant to the system. The incoming leach solution as well as the pore water of the system were considered to be in equilibrium with oxygen and carbon dioxide. These equilibrium reactions allowed no restriction in oxygen supply; thus, gas transport problems were precluded, which is in line with PHREEQC limitations [74]. This equilibrium component allowed the modeling of kinetically controlled reactions [87,88]. Transport processes were embedded along the 1D discretized length of the system. The advective transport was intended to simulate leach solution advection as a function of the residence time and volumetric flow. The residence time would relate kinetic reactions to advective transport in order to control the time span of the water–rock interactions. The diffusive transport herein considers diffusion of dissolved species from the particle surfaces to the pore water. In this regard, the conceptual model assumed that a thin water film surrounded the particle surfaces, that kinetic reactions occurred within the water film, and that the products that were subsequently released were transferred to the bulk solution through a diffusion boundary. An oxygen reservoir was implemented within the water film to trigger and maintain sulphide oxidation (Figure 2). This modeling approach assumed that weathering rate laws for monomineralic samples can be utilized for mixtures of minerals (pyrite, carbonates, and silicates) evenly distributed over the uniform sample size distribution obtained after grinding [79,80]. Opting for specific rates from literature aimed to (i) assess their reliability for a mixture of minerals and their relevance for the weathering cell test, and (ii) provide prompt scoping surveys during data-limited situations.
Plante [89] stressed that weathering cells are less prone to precipitation of secondary phases due to the high liquid to solid ratio as well as the thickness of the solid bed sample. Furthermore, previous kinetic testing undertaken by Vermette [77] reported low ionic strength and negative saturation indices throughout the geochemical assessment of the separate lithologies. Accordingly, the conceptual model precluded any retention process. This assumption abides by the conservative reasoning adopted herein to avoid underestimation of the contamination potential.
2.4.1. Abiotic Kinetic Rates
Pyrite is ubiquitous in Akasaba West ore and host rock, representing a potential source of AMD. Pyrite was detected in all geo-environmental domains [77]. The specific rate of pyrite oxidation determined by Jerz and Rimstidt [90] was chosen for the present study:
where p is the partial pressure of oxygen (atm) and t is time (s). Two main reasons warranted the use of the aforementioned specific rate in this study: (i) Jerz and Rimstidt [90] established the specific rate formula for pyrite oxidation in unsaturated medium, which is in line with the experimental approach herein. In addition to the open system approach, using a specific rate of pyrite oxidation under unsaturated conditions will aid to overcome PHREEQC limitations. (ii) The specific rate from Jerz and Rimstidt [90] considers pyrite aging attributed to the formation of a solution film on pyrite surfaces as oxidation progresses. Including the aging effect on pyrite reactivity is relevant for the actual framework as kinetic tests are usually undertaken for a considerable time span. It is worth mentioning that the specific rate delineates direct oxidation of pyrite that is relevant for fresh samples under kinetic testing.
The gangue minerals consisted mostly of silicates and minimal crystals of calcite (Table 1). To simulate gangue mineral dissolution in the KINETIC keyword block of PHREEQC the generic form of the rate expressions developed by Chou and Wollast [91] and Casey and Ludwig [92] and adopted by Palandri and Kharaka [93] was implemented for each gangue mineral (see supplementary materials). Minteq.v4 database of PHREEQC was used.
2.4.2. Diffusive Transport from the Film to the Pore Water
Diffusion from the water film to the bulk solution along the sample height was simulated using diffusive transport in the TRANSPORT data block using a single diffusion coefficient for all chemical species [97]. Parkhurst and Appelo [74] included dual porosity modeling in the TRANSPORT data block to simulate diffusion between closed and interconnected porosity (named immobile and mobile cells in PHREEQC). Tiruta-Barna [98] repurposed the Stagnant_cells modeling capability of the TRANSPORT data block for diffusion simulation in dynamic leaching tests. The same repurposing reasoning was suggested herein to bridge kinetics and transport. Regarding the drying wetting/cycles, the advection time-step was at 2.5 days which constitutes the drying period. During this period, the water retained by capillarity is reacting with minerals using immobile cell capability of PHREEQC. The Stagnant_cells capability of PHREEQC links immobile and mobile cells via diffusion. Therefore, chemical products emanating from kinetic reactions that occurred in the immobile cell were transported via diffusion to mobile cells. Based upon various discretization tests ranging from 5 to 100 cells, 30 diffusion-linked cells was determined to be an optimal 1D discretization where the first mobile cell is a transfer cell mediating kinetics and diffusive transport. The longitudinal dispersivity was estimated using Equation (4) from Neuman [99], then PHREEQC internally computed the hydrodynamic dispersion coefficient DL to perform calculations of the diffusion term.
where L is the sample height (m).
2.5. Calibration and Parameter Fitting
Model calibration was carried out by matching the model results to kinetic testing data from the D2 weathering cell. The D1, D3, and T1 weathering cells were used as benchmarking cases. The main calibration parameters used to fit the experimental results were the reactive surface area and the effective diffusion coefficient (De) between the film and the pore water. Furthermore, Mn was included in the system as trace element in calcite according to previous work [77]. The parameter used to calibrate Mn release was the stoichiometric coefficient of Mn within calcite. To perform the stoichiometric coefficient calibration, the fitting operation was undertaken using PHREEPLOT. The non-linear least squares (nlls) method was used in PHREEPLOT. The fineness of fit was assessed based upon the weighted sum of the residuals [100]. The outcome was used to perform a parametric analysis to scope Mn leaching scenarios and highlight conditions under which CND or even AMD prevails.
3. Results and Discussion
3.1. Experimental Datasets
3.1.1. Characterization Results
Characterization results are summarized in Table 2 and Table 3 and Figure 3 and Figure 4. The grain-size distribution of the composite samples is typical of the grain size of non-segregated tailings, compiled and classified by Bussière [29] as sandy silts of low plasticity (ML). Specific gravity (Gs) values were subject to slight variations owing to high-density mineral content such as titanite, magnetite, and pyrite (Table 2). Likewise, the specific surface area (Ss) was affected by the presence of some phyllosilicates well known for their high specific surface [25]. Roughness factors computed based on geometric specific surface areas were 2.7, 4.24, 3.5, and 3.66 for D1, D2, D3, and T1, respectively.
The Al content confirmed that the samples were rich in aluminosilicates. The Fe content mainly originated from iron oxides such as magnetite, while iron-bearing sulphides provided a small contribution to the total iron grade as indicated by the sulfur content (Stotal). As no graphite was associated with the Akasaba West deposit, the inorganic carbon content (Ctotal) ascertained that all composite samples were carbonate-poor materials with barely significant differences. However, SEM-EDS investigations highlighted that calcite contained traces of Mn within its crystalline lattice. Calcium exhibited high grades ascribed to epidote that pertains to the greenschist facies mineral assemblage. Figure 4 emphasizes the felsic composition of the Akasaba West host rock with albite contents predominating the mineral assemblage.
Regarding ABA, the NP after one week of acid digestion was twofold higher than the CNP and the NP measured after 24 h of acid digestion. Therefore, sufficient time was needed for slow-reacting silicates to neutralize acidity and shift samples from the uncertainty zone to the non-acid generating zone (Figure 3). Accordingly, it is recommended to undertake a one-week acid digestion for silicate rich materials. Nonetheless, kinetic testing is required to investigate the reliability of the neutralization potential of the silicates and to quantify the prerequisite lag time to neutralize the sample inherent acidity produced during leaching cycles.
3.1.2. Weathering Cells Results
For modeling purposes, the accuracy of the chemical analysis was assessed to discern experimental uncertainties through the comparison of calculated and measured electrical conductivity as suggested by Appelo and Postma [101]. The calculated electrical conductivity was based upon measured molarity and molar conductivity in water at 25 °C reported in the literature for each major ion [101]. The correlation coefficients between the calculated and the measured electrical conductivity ranged from 0.9 to 0.98 and the highest root mean square deviation (RMSD) was 10.36% (see supplementary materials). RMSD values provide some insights into experimental uncertainties related to equipment and/or manipulations. These uncertainties should be maintained as low as possible before delving into modeling. In the present study, the RMSD values were considered low enough for model calibration purposes.
The electrical conductivity was as high as 1.5 mS/cm during the first leaching cycle and progressively decreased towards the end of the kinetic tests (189 days). This could be interpreted as decrease in metal release. Neutral to slightly alkaline pH values were maintained throughout the duration of the test for the D1, D3, and T1 weathering cells (Figures 6–8). Meanwhile, the D2 weathering cell released acidic leachates during the first 14 days of the test; the pH ranged between 3.8 and 3.9 (Figure 5). Subsequently, the pH gradually increased to 8 by the 26th day. Sulfate concentrations SO42− measured in the leachate from D2 started at 447 mg/L and gradually decreased to 6 mg/L after 100 days. Likewise, the Fe concentration in the D2 leachate reached 3.74 mg/L and decreased to the detection limit after 40 days (Figure 5). Sulfate concentrations in the D1, D3, and T1 leachates started at 100.2, 167.1, and 303 mg/L, respectively, and exhibited the same tendency as D2. Despite the content of iron-bearing sulphides in D1 and D3, Fe was below the detection limit in the leachates or sporadically released over the course of few leaching cycles. Leachates from all weathering cells displayed sporadic Cu release with low concentrations ranging from 0.003 to 0.09 mg/L. Manganese exhibited a distinctive evolution, with concentrations in the D2 leachate decreasing from 0.2 to 0.01 mg/L after 100 days; thereafter, it gradually increased to 0.045 mg/L by the end of the test (Figure 5). The same Mn evolution was observed in the other weathering cells, though with lower concentrations at the beginning of the test and a more abrupt increase beyond the 100th day.
At the weathering cell scale, the classification scenario showed no substantial benefits in terms of water quality. Kinetic testing results suggest that the four weathering cells contain a sufficient proportion of neutralizing minerals to prevent AMD prevalence. Nonetheless, the risk of Mn contaminated neutral drainage is conspicuous in the four weathering cells, though at variable magnitudes. The D2 weathering cell released the highest Mn concentrations; as it shifted from AMD to CND, the acidic conditions accelerated the dissolution of Mn-bearing calcite. Even though the observed concentrations did not exceed 1 mg/L, which would threaten freshwater organisms according to World Health Organization (WHO) [102], Mn should be carefully monitored throughout the Akasaba West lifetime. Furthermore, the assessment of the classification scenario should be undertaken at larger experimental scales during the upstream stages of the operation phase to confirm the laboratory tests.
3.2. Modeling Results
Kinetic testing results from the D2 weathering cell were chosen to perform model calibration because the D2 sample exhibited the highest roughness factor that could underline the model sensitivity to SGeo versus Ss. More importantly the D2 weathering cell illustrates a transition from AMD to CND. The remaining weathering cells were used as benchmarking cases to highlight the model reliability and limitations.
3.2.1. Model Calibration
Figure 5 compiles the D2 kinetic modeling and testing results. Generally, a good agreement between the kinetic test data and the PHREEQC model was obtained using De = 8.10−11 m2/s for chemicals diffusing from the grain surface to the bulk solution. The obtained value of De within the water film was roughly one order of magnitude lower than the diffusion of ions in free water. Furthermore, differences between Ss model and SGeo model were scarcely significant. The calibration effort was focused on the specific surface area of albite to alleviate the Na-related discrepancy. Although the BET-based surface area of albite was reduced from 5.31 to 2 m2/dm3, the Na-Ss model was still prone to deviation from experimental results as time progressed (Figure 5). The Na-related discrepancy was substantially decreased using the albite geometric-based surface area (1.63 m2/dm3) (Figure 5).
Three main controlling factors could elucidate the Na discrepancy:
- (i)
- The active surface area of albite was at least fourfold smaller than the BET-based surface area, suggesting relatively low concentrations of Na compared to the model; however, there was no noteworthy deviation of modeled Na from the experimental results at acidic to neutral pH values (before day 50).
- (ii)
- The albite rate used in PHREEQC under subalkaline conditions (after day 50) expedited albite dissolution, thus yielding a high Na release rate compared to the kinetic test outcomes.
- (iii)
- The release rate of Na was substantially slower than the dissolution rate of albite; nevertheless, plagioclase dissolution has been known to entail preferential release of Na-Ca resulting in a Na-Ca poor thin layer at the plagioclase surface [89]. Therefore, the aforementioned factor is precluded, and the first two controlling factors may have occurred jointly to explain the geochemical behavior of Na.
Neither Ss model nor SGeo model captured the increase in Mg concentration between the 10th and 50th day of the test. The calibration effort based upon specific surface areas and molar contents of the identified Mg-bearing minerals failed to improve the fit to the Mg experimental data. Presumably, an Mg-bearing mineral was not detected among the mineral phases or preferential release of Mg occurred at the surface of the Mg-bearing minerals. In contrast, the K, Al, and Ca modeling results provide a good fit to the kinetic test data (Figure 5).
The nlls method of PHREEPLOT yielded a good fit of the Mn experimental data when using a stoichiometric coefficient of Mn that ranged between 0.00039 and 0.0015 for 1 mole of calcite. For instance, using a stoichiometric coefficient of 0.0006, D2 PHREEPLOT fitting yielded a correlation coefficient of 0.84 between kinetic data and model results and an RMSD of 0.014. Mn lixiviation is directly related to the carbon dioxide (CO2) partial pressure and pH that steer the calcite dissolution rate. The effect of CO2 partial pressure during the kinetic test was assumed to be constant and proportional to the atmospheric pressure; however, we expect that a setting with biotic activity and/or organic matter degradation could increase Mn lixiviation due to an increase in CO2 partial pressure within medium pores. The weathering cell setting displays the effect of sulphide oxidation on Mn lixiviation (Figure 5); throughout the first 50 days of the test, the Mn concentration dropped as pH values rose because calcite dissolution slowed at neutral and subalkaline conditions. This period reflects the delay needed for preponderant albite (15.6% wt) and disseminated calcite (1–1.8%) to fully neutralize acidity emanating mainly from 4.5% wt of pyrite. After the 50th day any produced acidity was promptly counteracted, thereby maintaining a relatively high pH and a low dissolution rate of calcite, thus reducing the extent of Mn lixiviation. The effect of pyrite content on Mn lixiviation will be further probed in the following sections.
3.2.2. Model Benchmarking
(i) D1 Weathering Cell
Based on the calibration insights, the kinetic modeling approach was carried out to simulate the D1, D3, and T1 kinetic testing results as benchmarking proxies to delineate the reliability and limitations of the model. Figure 6 portrays testing and modeling results for the D1 weathering cell. With a higher plagioclase content (25.8% wt) and lower pyrite grade (0.8% wt) compared to the D2 mineral assemblage (18.2% wt plagioclase versus 4.5% wt pyrite), measured and simulated leachate pH values oscillated between 7 and 8 throughout the test duration. The mineral assemblage of D1 hindered neutralization delay and maintained neutral to subalkaline conditions throughout the full test duration. Therefore, abiding by these mineralogical proportions, silicate neutralizing minerals are deemed reliable to prevent acid generation.
On the first day, the simulated pH curve underwent a slight drop, reflecting pore water equilibrium with atmospheric CO2, and promptly increased to 8 after seven days. This behavior is regarded as an artifact of the model as the first leachate results were used as the initial pore water composition, which was in equilibrium with atmospheric O2 and CO2 throughout the simulation. However, the simulated pH curve displays a good agreement with the experimental results.
The experimental sulfate concentrations indicated that the oxidation-neutralization process mainly occurred during the first 100 days of the test. The simulated SO42− curve underestimated sulfate concentrations between the 20th and the 50th day. Nonetheless, the general trend was correlative with the experimental data. At odds with SO42−, Fe was sporadically released or below the detection limit, thereby contradicting the oxidation implications. A geochemical retention mechanism of Fe was suspected to occur; this mechanism will be ascertained based upon modeling results from weathering cells with a higher pyrite content (D3 and T1).
Simulated Ca and Na concentrations conformed to the testing results displaying tolerable differences. In contrast, the Mg and K modeling results exhibited only modest agreement with the testing data. The simulated Al curve roughly followed the experimental data trend (Figure 7). The experimental Al concentrations from the D1 weathering cell were noticeably lower than those from the D2 weathering cell indicating that the aluminosilicate dissolution rate was considerably decreased under subalkaline conditions.
Nonetheless, the Na concentrations were only twofold lower than the D2 results; this probably suggests preferential release of Na over Al from plagioclase surfaces. In this respect, Hellmann [103] demonstrated preferential release of Na with respect to Al and Si from albite leached layers over a wide range of pH values and temperatures. Accordingly, the Na-depleted leached layers are 1500 and 1200 Å thick at acid and basic pH conditions, respectively [103].
Simulated Mn concentrations completely deviated from the experimental data after the 110th day. The model was not able to capture the Mn evolution in the presence of mineral proportions as low as 0.4% wt of calcite and 0.8% wt of pyrite. The simulated Mn behavior was slightly improved when the pyrite content was increased to 3% wt (Figure 6). In addition to the simulated kinetic processes, perhaps other geochemical processes such as sorption and/or coprecipitation occurred and were overlooked within the PHREEQC model. Plante et al. [17] demonstrated that plagioclase controlled Ni mobility through sorption in waste rock piles of the Tio mine. More recently, Reczek et al. [104] and Trach et al. [105] stated that volcanic tuff and basalt effectively adsorb Mn. Therefore, the next step of the geochemical assessment of Akasaba West materials should involve sorption experiments to investigate the effect of the sorption capacity of plagioclase on water quality.
(ii) D3 Weathering Cell
Water quality from testing data and the PHREEQC model of the D3 weathering cell presented similar features as the D1 outcomes. However, the D3 mineralogical proportions were substantially different; in the presence of 26% wt of albite and 1.9% wt of calcite, the neutralization potential counteracted the overall acidity stemming from oxidation of up to 8.1% wt of pyrite. Unlike the simulated response that predicted iron and sulfate release emanating from the oxidation-neutralization process, measured Fe concentrations were generally below the detection limit throughout the test duration emphasizing the occurrence of Fe-bearing secondary minerals and/or Fe sorption on plagioclase surfaces that could affect both iron and manganese mobility (Figure 7).
Due to the high albite content, the PHREEQC model predicted high Na concentrations as leaching progressed and deviated from the experimental results on the 30th day. Sodium results from the D3 weathering cell support the Na controlling factor discussed earlier; the dissolution rate of albite used in PHREEQC seemed to overestimate the albite-weathering rate in subalkaline conditions.
Regarding Mn, the model roughly captured the experimental evolution. The pyrite content in D3 was higher compared to D1. The high sulphide content triggered neutralization potential of calcite and involved high Mn lixiviation; nonetheless, as long as the pH remained neutral to subalkaline the calcite dissolution rate was limited. As a result, the Mn concentrations observed in D3 were much lower than those observed in D2. Silicate neutralizing minerals, specifically albite, effectively contributed maintaining high pH values; therefore, their neutralization potential slightly attenuated Mn lixiviation.
(iii) T1 Weathering Cell
Modeling and testing results for the T1 weathering cell were in good agreement and supported the aforementioned insights (Figure 8). In summary, the modeling approach showed a good agreement with the experimental data for the four weathering cells. However, benchmarking proxies underlined two main model limitations: (i) the model did not properly capture the Mn evolution when calcite and pyrite contents were as low as 0.4% wt and 0.8% wt, respectively; and (ii) the model did not incorporate sorption kinetics of iron and manganese on plagioclase surfaces as well as coprecipitation kinetics.
Nonetheless, the model capabilities complied with the conservative modeling reasoning adopted along the upstream scoping assessment studies, which overlooks geochemical retention processes in order to approach the overall leaching potential. Finally, the kinetic model captured the pH evolution in presence of silicates which was the main objective of this modeling approach.
3.3. Parametric Analysis
The parametric analysis performed herein was based on a what-if scenarios approach to lead an upstream scoping assessment. This scoping survey aimed to envision probable worse case scenarios linked to variations of mineralogical composition and water retention time. Worse case scenarios denote cases where water quality deteriorates.
3.3.1. Mineral Assemblages
Through fixing the sulphide contents (4.2% wt of pyrite and 1.9% of chalcopyrite [106]), different neutralizing mineral assemblages were assessed to stress the effectiveness of albite neutralization. The first scenario set forth a sulphide assemblage with no neutralizing minerals. The second set of scenarios included albite as the sole neutralizing mineral present at different proportions (5, 10, 18.8 and 30% wt). The third scenario involved 18.8% wt albite and 1.1% calcite. The last scenario involved the complete mineral assemblage of T1.
The parametric analysis results are shown in Figure 9. From an initial pH of 8.16, the pH values dropped to 2.78 in the presence of sulphides (pyrite and chalcopyrite) with no neutralizing minerals. The pH remained acidic throughout the simulation time, whereas Fe and SO42− reached their maximum concentrations after 139 days, with concentrations of 93.1 and 322 mg/L, respectively. In this scenario, Cu exceeded 10 mg/L after 50 days. After adding 5% wt of albite, the pH started to increase from 3 on the 80th day to 4.89 on the 189th day. The maximum concentrations reached for Fe and SO42− were slightly lowered compared to the first scenario (253 and 73 mg/L, respectively). Water quality was further improved in the presence of 10% wt of albite; the pH attained a value of 5 after 86 days. Iron, SO42−, and Cu concentrations were 71.3, 246, and 8.66 mg/L, respectively, after 150 days. The neutralization delay was further curtailed in the presence of 30% wt of albite, thereby achieving circumneutral pH after 65 days. In this scenario, Fe, SO42−, and Cu concentrations after 150 days were 68.8, 238, and 2.76 mg/L, respectively.
According to the parametric analysis, the neutralization delay in the presence of 18.8% wt of albite was 128 days (pH reaches 6); adding 1.1% wt calcite to the mineral assemblage shifted the pH to 8 and suppressed the neutralization delay. On the other hand, including the remnant silicate neutralizing minerals (epidote, chlorite, amphibole, etc.) in the simulation did not result in a perceptible increase in pH. Nonetheless, their contribution manifested in Mn leaching; their neutralization potential withdrew a certain amount of acidity from the system. Consequently, the pH-dependent dissolution rate of calcite was slightly decreased along with the Mn leaching rate. The concentration of Mn after 50 days decreased from 0.2 to 0.13 mg/L in the presence of the complete silicate assemblage (Figure 9). Iron, SO42−, and Mn exhibited an arc-shaped evolution; this was caused by the pyrite aging effect expressed in the oxidation rate reported by Jerz and Rimstidt [77]. This behavior stresses that Mn release from calcite also relates to pyrite prevalence. The interactions between Mn-stimulating (sulphides) and Mn-hindering (silicates) components of the system determined the magnitude of Mn leaching.
3.3.2. Various Residence Times
This parametric analysis underlines the effect of residence time on water quality. Neutral flowing water leaching 4.2% wt pyrite at different volumetric flows (L/s) was simulated. Figure 10 features the outcomes from 10 simulated residence times (7 h, 48 h, 10 days, 30 days, 60 days, 100 days, 200 days, 500 days, 1000 days, and 2000 days). The range of values encompassed highly mobile and extremely slow-flowing water scenarios.
As the residence time increased, water quality worsened due to longer water–mineral interactions. Systems with a residence time less than 30 days disposed of acidity after a lag time. For instance, the system with 30 days of residence time recovered its circumneutral pH after 60 days. Residence times greater than 30 days generated acid leachates highly concentrated in Fe and sulfate throughout the simulation. A residence time of 100 days produced leachate with pH = 3.66, 20.03 mg/L sulfate, and 5.91 mg/L Fe after a simulation time of 150 days. Iron concentrations were as high as 73 mg/L in pores with extremely slow-flowing water. These outcomes indicate the impact of flow heterogeneity on water quality. The parametric analysis simulated different weathering cells with different flow conditions; however, at larger scales these heterogeneities could coexist in the same waste facility and jointly contribute to determining water quality at the effluent stream [48]. Conducting such parametric analyses at the upstream stage could assist in risk identification and mitigation throughout the upcoming stages.
4. Conclusions
Preliminary kinetic testing during the development stage of hard rock mine projects is of great importance to underline the geochemical behavior of the host rock. Weathering cell tests are often used for the aforementioned purpose. The present study simulates the kinetically controlled reactions occurring in four weathering cells using a film diffusion model implemented in PHREEQC. Results from the presented kinetic modeling approach using PHREEQC exhibited a good agreement with weathering cell data. The PHREEQC capabilities coupled to the literature rate laws proved to be reliable to simulate weathering cells set up to perform inceptive assessment modeling. The main objective of simulating the pH using kinetic modeling of weathering cell tests was fulfilled. However, the model presented herein does not include geochemical retention processes such as coprecipitation and sorption. These retention processes reduce the total dissolved concentrations and do not partake in the conservative reasoning that should be used during development stages. Being cognizant of these limitations, the PHREEQC kinetic model does not conform to design purposes related to mine reclamation. However, it complies with the upstream scoping studies along the development stage, which has barely benefited from geochemical modeling tools. The main asset of the present kinetic model is the ability to simulate various scenarios for upstream risk identification based upon restricted data sets and conservative modeling reasoning. In this regard, the input data sets consist of the usual mineralogical characterization, weathering cell tests, and literature rate laws, thereby abiding by two main constraints that steer the development stage: material availability and assessment cost. In terms of practical implications, this upstream modeling attempt was mainly performed to be combined with 3D geological modeling and stochastic simulation in order to undertake in situ upstream classification of the host rock and the ore body based on the pH that could be generated if a given mineral assemblage within the ore body is weathered under kinetically controlled conditions. This classification will be performed before mining in order to sort mine waste depending on their geochemical risk.
Supplementary Materials
The following are available online at https://0-www-mdpi-com.brum.beds.ac.uk/article/10.3390/min11121306/s1. Figure S1: The geological framework of Akasaba West project. Figure S2: The experimental setup of weathering cell test. Figure S3: Comparison of calculated and measured electrical conductivity.
Author Contributions
Conceptualization, Y.T. and I.D.; methodology, Y.T., I.D. and D.V.; software, Y.T.; validation, D.V., N.B. and M.B.; formal analysis, Y.T., M.B. and I.D.; investigation, M.B.; resources, I.D.; data curation, Y.T. and D.V.; writing—original draft preparation, Y.T.; writing—review and editing, I.D., D.V., N.B. and M.B.; visualization, Y.T.; supervision, I.D. and N.B.; project administration, I.D.; funding acquisition, I.D. and N.B. All authors have read and agreed to the published version of the manuscript.
Funding
Funding for this study was provided by NSERC TERRE-NET program (NSERC-TERRE-NET 479708-2015), led by D. Blowes (University of Waterloo).
Data Availability Statement
All data generated or analyzed during this study are included in this manuscript.
Acknowledgments
The authors thank the staff of Akasaba West project for their support and contributions and the Unité de Recherche et Service en Technologie Minérale (URSTM) staff for their assistance in the laboratory. The authors are grateful for the insights and suggestions from J. Mahoney, D. Parkhurst, and D. Kinniburgh during the formulation of the PHREEQC and PHREEPLOT models used in this work.
Conflicts of Interest
The authors declare that they have no conflict of interest. The funders had no role in the design of the study; in the collection, analyses, or interpretation of data; in the writing of the manuscript, or in the decision to publish the results.
References
- Mudd, G. Global trends in gold mining: Towards quantifying environmental and resource sustainability. Resour. Policy 2007, 32, 42–56. [Google Scholar] [CrossRef]
- Yilmaz, E. Advances in reducing large volumes of environmentally harmful mine waste rocks and tailings. Gospod. Surowcami Miner. 2011, 27, 89–112. [Google Scholar]
- Park, I.; Tabelin, C.B.; Jeon, S.; Li, X.; Seno, K.; Ito, M.; Hiroyoshi, N. A review of recent strategies for acid mine drainage prevention and mine tailings recycling. Chemosphere 2019, 219, 588–606. [Google Scholar] [CrossRef]
- Tabelin, C.B.; Park, I.; Phengsaart, T.; Jeon, S.; Villacorte-Tabelin, M.; Alonzo, D.; Yoo, K.; Ito, M.; Hiroyoshi, N. Copper and critical metals production from porphyry ores and E-wastes: A review of resource availability, processing/recycling challenges, socio-environmental aspects, and sustainability issues. Resour. Conserv. Recycl. 2021, 170, 105610. [Google Scholar] [CrossRef]
- Akcil, A.; Koldas, S. Acid Mine Drainage (AMD): Causes, treatment and case studies. J. Clean. Prod. 2006, 14, 1139–1145. [Google Scholar] [CrossRef]
- Barfoud, L.; Pabst, T.; Zagury, G.J.; Plante, B. Effect of Dissolved Oxygen on The Oxidation of Saturated Mine Tailings. In Proceedings of the Geo-Environmental Engineering 2019, Concordia University, Montreal, QC, Canada, 30–31 May 2019. [Google Scholar]
- Blowes, D.; Ptacek, C.; Jambor, J.; Weisener, C. The geochemistry of acid mine drainage. Treatise Geochem. 2003, 9, 612. [Google Scholar]
- Evangelou, V.P.; Zhang, Y.L. A review: Pyrite oxidation mechanisms and acid mine drainage prevention. Crit. Rev. Environ. Sci. Technol. 1995, 25, 141–199. [Google Scholar] [CrossRef]
- Heikkinen, P.M.; Räisänen, M.L.; Johnson, R.H. Geochemical Characterisation of Seepage and Drainage Water Quality from Two Sulphide Mine Tailings Impoundments: Acid Mine Drainage versus Neutral Mine Drainage. Mine Water Environ. 2008, 28, 30–49. [Google Scholar] [CrossRef]
- Kleinmann, R.L.P.; Crerar, D.; Pacelli, R. Biogeochemistry of acid mine drainage and a method to control acid formation. Min. Eng. 1981, 33. Available online: https://www.osti.gov/biblio/6306683-biogeochemistry-acid-mine-drainage-method-control-acid-formation (accessed on 1 November 2021).
- Moses, C.O.; Nordstrom, D.K.; Herman, J.S.; Mills, A.L. Aqueous pyrite oxidation by dissolved oxygen and by ferric iron. Geochim. Et Cosmochim. Acta 1987, 51, 1561–1571. [Google Scholar] [CrossRef]
- Nicholson, R.V.; Gillham, R.W.; Reardon, E.J. Pyrite oxidation in carbonate-buffered solution: 1. Experimental kinetics. Geochim. Et Cosmochim. Acta 1988, 52, 1077–1085. [Google Scholar] [CrossRef]
- Nicholson, R.V.; Scharer, J.M. Laboratory Studies of Pyrrhotite Oxidation Kinetics; American Chemical Society (ACS): Washington, DC, USA, 1993; pp. 14–30. [Google Scholar]
- Nordstrom, D.K.; Alpers, C.N.; Ptacek, C.J.; Blowes, D.W. Negative pH and Extremely Acidic Mine Waters from Iron Mountain, California. Environ. Sci. Technol. 2000, 34, 254–258. [Google Scholar] [CrossRef] [Green Version]
- Nordstrom, D.K. Aqueous Pyrite Oxidation and the Consequent Formation of Secondary Iron Minerals; Wiley: Hoboken, NJ, USA, 2015; pp. 37–56. [Google Scholar]
- Nordstrom, D.K.; Alpers, C. Negative pH, efflorescent mineralogy, and consequences for environmental restoration at the Iron Mountain Superfund site, California. Proc. Natl. Acad. Sci. USA 1999, 96, 3455–3462. [Google Scholar] [CrossRef] [Green Version]
- Plante, B.; Benzaazoua, M.; Bussière, B.; Biesinger, M.; Pratt, A. Study of Ni sorption onto Tio mine waste rock surfaces. Appl. Geochem. 2010, 25, 1830–1844. [Google Scholar] [CrossRef]
- Singer, P.C.; Stumm, W. Acidic Mine Drainage: The Rate-Determining Step. Science 1970, 167, 1121–1123. [Google Scholar] [CrossRef] [PubMed]
- Weisener, C.; Weber, P. Preferential oxidation of pyrite as a function of morphology and relict texture. N. Z. J. Geol. Geophys. 2010, 53, 167–176. [Google Scholar] [CrossRef] [Green Version]
- Wiersma, C.; Rimstidt, J. Rates of reaction of pyrite and marcasite with ferric iron at pH 2. Geochim. Et Cosmochim. Acta 1984, 48, 85–92. [Google Scholar] [CrossRef]
- Ho, G.D.; Tabelin, C.B.; Tangviroon, P.; Tamamura, S.; Igarashi, T. Effects of cement addition on arsenic leaching from soils excavated from projects employing shield-tunneling method. Geoderma 2021, 385, 114896. [Google Scholar] [CrossRef]
- Tabelin, C.B.; Igarashi, T.; Villacorte-Tabelin, M.; Park, I.; Opiso, E.M.; Ito, M.; Hiroyoshi, N. Arsenic, selenium, boron, lead, cadmium, copper, and zinc in naturally contaminated rocks: A review of their sources, modes of enrichment, mechanisms of release, and mitigation strategies. Sci. Total. Environ. 2018, 645, 1522–1553. [Google Scholar] [CrossRef]
- Tamoto, S.; Tabelin, C.B.; Igarashi, T.; Ito, M.; Hiroyoshi, N. Short and long term release mechanisms of arsenic, selenium and boron from a tunnel-excavated sedimentary rock under in situ conditions. J. Contam. Hydrol. 2015, 175, 60–71. [Google Scholar] [CrossRef]
- Aubertin, M.; Aachib, M.; Monzon, M.; Joanes, A.; Bussière, B.; Chapuis, R. Étude de laboratoire sur l’efficacité des barrières de recouvrement construites à partir de résidus miniers. Mine Environ. Neutral Drain. Rep. 1997, 2, 107. [Google Scholar]
- Benzaazoua, M.; Dagenais, A.-M.; Archambault, M. Kinetic tests comparison and interpretation for prediction of the Joutel tailings acid generation potential. Environ. Earth Sci. 2004, 46, 1086–1101. [Google Scholar] [CrossRef]
- Benzaazoua, M.; Bussière, B.; Demers, I.; Aubertin, M.; Fried, É.; Blier, A. Integrated mine tailings management by combining environmental desulphurization and cemented paste backfill: Application to mine Doyon, Quebec, Canada. Miner. Eng. 2008, 21, 330–340. [Google Scholar] [CrossRef]
- Benzaazoua, M.; Bussière, B.; Kongolo, M.; McLaughlin, J.; Marion, P. Environmental desulphurization of four Canadian mine tailings using froth flotation. Int. J. Miner. Process. 2000, 60, 57–74. [Google Scholar] [CrossRef]
- Bouzahzah, H.; Benzaazoua, M.; Bussiere, B.; Plante, B. Prediction of Acid Mine Drainage: Importance of Mineralogy and the Test Protocols for Static and Kinetic Tests. Mine Water Environ. 2013, 33, 54–65. [Google Scholar] [CrossRef]
- Bussière, B. Hydrogeotechnical properties of hard rock tailings from metal mines and emerging geoenvironmental disposal approaches. Can. Geotech. J. 2007, 44, 1019–1052. [Google Scholar] [CrossRef]
- Bussière, B.; Aubertin, M.; Mbonimpa, M.; Molson, J.; Chapuis, R.P. Field experimental cells to evaluate the hydrogeological behaviour of oxygen barriers made of silty materials. Can. Geotech. J. 2007, 44, 245–265. [Google Scholar] [CrossRef]
- Demers, I.; Bouda, M.; Mbonimpa, M.; Benzaazoua, M.; Bois, D.; Gagnon, M. Valorization of acid mine drainage treatment sludge as remediation component to control acid generation from mine wastes, part 2: Field experimentation. Miner. Eng. 2015, 76, 117–125. [Google Scholar] [CrossRef]
- Demers, I.; Bussière, B.; Benzaazoua, M.; Mbonimpa, M.; Blier, A. Column test investigation on the performance of monolayer covers made of desulphurized tailings to prevent acid mine drainage. Miner. Eng. 2008, 21, 317–329. [Google Scholar] [CrossRef]
- Demers, I.; Bussière, B.; Mbonimpa, M.; Benzaazoua, M. Oxygen diffusion and consumption in low-sulphide tailings covers. Can. Geotech. J. 2009, 46, 454–469. [Google Scholar] [CrossRef]
- Demers, I.; Mbonimpa, M.; Benzaazoua, M.; Bouda, M.; Awoh, S.; Lortie, S.; Gagnon, M. Use of acid mine drainage treatment sludge by combination with a natural soil as an oxygen barrier cover for mine waste reclamation: Laboratory column tests and intermediate scale field tests. Miner. Eng. 2017, 107, 43–52. [Google Scholar] [CrossRef]
- Elghali, A.; Benzaazoua, M.; Bouzahzah, H.; Bussière, B.; Villarraga-Gómez, H. Determination of the available acid-generating potential of waste rock, part I: Mineralogical approach. Appl. Geochem. 2018, 99, 31–41. [Google Scholar] [CrossRef]
- Elghali, A.; Benzaazoua, M.; Bussière, B.; Bouzahzah, H. Determination of the available acid-generating potential of waste rock, part II: Waste management involvement. Appl. Geochem. 2019, 100, 316–325. [Google Scholar] [CrossRef]
- Jouini, M.; Neculita, C.M.; Genty, T.; Benzaazoua, M. Environmental behavior of metal-rich residues from the passive treatment of acid mine drainage. Sci. Total Environ. 2020, 712, 136541. [Google Scholar] [CrossRef]
- Jouini, M.; Rakotonimaro, T.V.; Neculita, C.M.; Genty, T.; Benzaazoua, M. Prediction of the environmental behavior of residues from the passive treatment of acid mine drainage. Appl. Geochem. 2019, 110, 104421. [Google Scholar] [CrossRef]
- Michaud, M.L.; Plante, B.; Bussière, B.; Benzaazoua, M.; Leroux, J. Development of a modified kinetic test using EDTA and citric acid for the prediction of contaminated neutral drainage. J. Geochem. Explor. 2017, 181, 58–68. [Google Scholar] [CrossRef]
- Ouangrawa, M.; Aubertin, M.; Molson, J.W.; Bussière, B.; Zagury, G.J. Preventing Acid Mine Drainage with an Elevated Water Table: Long-Term Column Experiments and Parameter Analysis. Water Air Soil Pollut. 2010, 213, 437–458. [Google Scholar] [CrossRef]
- Parbhakar-Fox, A.K.; Edraki, M.; Walters, S.; Bradshaw, D. Development of a textural index for the prediction of acid rock drainage. Miner. Eng. 2011, 24, 1277–1287. [Google Scholar] [CrossRef]
- Plante, B.; Bussière, B.; Benzaazoua, M. Lab to field scale effects on contaminated neutral drainage prediction from the Tio mine waste rocks. J. Geochem. Explor. 2014, 137, 37–47. [Google Scholar] [CrossRef]
- Nordstrom, D.K.; Blowes, D.W.; Ptacek, C.J. Hydrogeochemistry and microbiology of mine drainage: An update. Appl. Geochem. 2015, 57, 3–16. [Google Scholar] [CrossRef]
- Tabelin, C.B.; Veerawattananun, S.; Ito, M.; Hiroyoshi, N.; Igarashi, T. Pyrite oxidation in the presence of hematite and alumina: I. Batch leaching experiments and kinetic modeling calculations. Sci. Total Environ. 2017, 580, 687–698. [Google Scholar] [CrossRef]
- Tabelin, C.; Veerawattananun, S.; Ito, M.; Hiroyoshi, N.; Igarashi, T. Pyrite oxidation in the presence of hematite and alumina: II. Effects on the cathodic and anodic half-cell reactions. Sci. Total Environ. 2017, 581, 126–135. [Google Scholar] [CrossRef]
- Demers, I.; Molson, J.; Bussière, B.; Laflamme, D. Numerical modeling of contaminated neutral drainage from a waste-rock field test cell. Appl. Geochem. 2013, 33, 346–356. [Google Scholar] [CrossRef]
- Fala, O.; Aubertin, M.; Molson, J.; Bussière, B.; Wilson, G.; Chapuis, R.; Martin, V. Numerical modelling of unsaturated flow in uniform and heterogeneous waste rock piles. In Proceedings of the Sixth International Conference on Acid Rock Drainage (ICARD), Cairns, Australia, 12–18 July 2003; Publication Series. Australasian Institute of Mining and Metallurgy: Carlton, Australia; pp. 895–902. [Google Scholar]
- Fala, O.; Molson, J.; Aubertin, M.; Dawood, I.; Bussière, B.; Chapuis, R. A numerical modelling approach to assess long-term unsaturated flow and geochemical transport in a waste rock pile. Int. J. Min. Reclam. Environ. 2012, 27, 38–55. [Google Scholar] [CrossRef]
- Kalonji-Kabambi, A.; Demers, I.; Bussière, B. Reactive transport modeling of the geochemical behavior of highly reactive tailings in different environmental conditions. Appl. Geochem. 2020, 122, 104761. [Google Scholar] [CrossRef]
- Molson, J.; Aubertin, M.; Bussière, B.; Benzaazoua, M. Geochemical transport modelling of drainage from experimental mine tailings cells covered by capillary barriers. Appl. Geochem. 2008, 23, 1–24. [Google Scholar] [CrossRef]
- Molson, J.; Fala, O.; Aubertin, M.; Bussière, B. Numerical simulations of pyrite oxidation and acid mine drainage in unsaturated waste rock piles. J. Contam. Hydrol. 2005, 78, 343–371. [Google Scholar] [CrossRef]
- Nicholson, R.V.; Rinker, M.J.; Acott, G.; Venhuis, M.A. Integration of field data and a geochemical transport model to assess mitigation strategies for an acid-generating mine rock pile at a uranium mine. In Proceedings of the Mining and the Environment Conference, Sudbury, ON, Canada, 25 May 2003. [Google Scholar]
- Pabst, T.; Bussière, B.; Aubertin, M.; Molson, J. Comparative performance of cover systems to prevent acid mine drainage from pre-oxidized tailings: A numerical hydro-geochemical assessment. J. Contam. Hydrol. 2018, 214, 39–53. [Google Scholar] [CrossRef]
- Pabst, T.; Molson, J.; Aubertin, M.; Bussière, B. Reactive transport modelling of the hydro-geochemical behaviour of partially oxidized acid-generating mine tailings with a monolayer cover. Appl. Geochem. 2017, 78, 219–233. [Google Scholar] [CrossRef]
- Wunderly, M.D.; Frind, E.O.; Blowes, D.W.; Ptacek, C.J. Sulfide mineral oxidation and subsequent reactive transport of oxidation products in mine tailings impoundments: A numerical model. Water Resour. Res. 1996, 32, 3173–3187. [Google Scholar] [CrossRef]
- Romano, C.G.; Mayer, K.U.; Jones, D.R.; Ellerbroek, D.A.; Blowes, D.W. Effectiveness of various cover scenarios on the rate of sulfide oxidation of mine tailings. J. Hydrol. 2003, 271, 171–187. [Google Scholar] [CrossRef]
- Graupner, B.J.; Koch, C.; Prommer, H. Prediction of diffuse sulfate emissions from a former mining district and associated groundwater discharges to surface waters. J. Hydrol. 2014, 513, 169–178. [Google Scholar] [CrossRef]
- Abbasi, F.; Feyen, J.; van Genuchten, M. Two-dimensional simulation of water flow and solute transport below furrows: Model calibration and validation. J. Hydrol. 2004, 290, 63–79. [Google Scholar] [CrossRef]
- Fala, O.; Molson, J.; Aubertin, M.; Bussière, B.; Chapuis, R.P. Numerical Simulations of Long Term Unsaturated Flow and ACID Mine Drainage at Waste Rock Piles. J. Am. Soc. Min. Reclam. 2006, 2006, 582–597. [Google Scholar] [CrossRef]
- Kandelous, M.M.; Šimůnek, J. Numerical simulations of water movement in a subsurface drip irrigation system under field and laboratory conditions using HYDRUS-2D. Agric. Water Manag. 2010, 97, 1070–1076. [Google Scholar] [CrossRef]
- Šimůnek, J.; van Genuchten, M.T.; Šejna, M. Development and Applications of the HYDRUS and STANMOD Software Packages and Related Codes. Vadose Zone J. 2008, 7, 587–600. [Google Scholar] [CrossRef] [Green Version]
- Šimůnek, J.; Van Genuchten, M.T.; Šejna, M. The HYDRUS software package for simulating the two-and three-dimensional movement of water, heat, and multiple solutes in variably-saturated porous media. Tech. Man. Version 2012, 2, 258. [Google Scholar]
- Šimůnek, J.; Van Genuchten, M.T.; Šejna, M. Recent developments and applications of the HYDRUS computer software packages. Vadose Zone J. 2016, 15, vzj2016-04. [Google Scholar] [CrossRef] [Green Version]
- Mayer, K.U.; Frind, E.O.; Blowes, D.W. Multicomponent reactive transport modeling in variably saturated porous media using a generalized formulation for kinetically controlled reactions. Water Resour. Res. 2002, 38, 13-1–13-21. [Google Scholar] [CrossRef]
- Brookfield, A.; Blowes, D.; Mayer, K.U. Integration of field measurements and reactive transport modelling to evaluate contaminant transport at a sulfide mine tailings impoundment. J. Contam. Hydrol. 2006, 88, 1–22. [Google Scholar] [CrossRef]
- Jurjovec, J.; Blowes, D.W.; Ptacek, C.J.; Mayer, K.U. Multicomponent reactive transport modeling of acid neutralization reactions in mine tailings. Water Resour. Res. 2004, 40, 40. [Google Scholar] [CrossRef] [Green Version]
- Mayer, K.; Amos, R.; Molins, S.; Gerard, F. Reactive Transport Modeling in Variably Saturated Media with MIN3P: Basic Model Formulation and Model Enhancements; Bentham Science Publishers: Sharjah, United Arab Emirates, 2012; Volume 26. [Google Scholar]
- Ouangrawa, M.; Molson, J.; Aubertin, M.; Bussière, B.; Zagury, G. Reactive transport modelling of mine tailings columns with capillarity-induced high water saturation for preventing sulfide oxidation. Appl. Geochem. 2009, 24, 1312–1323. [Google Scholar] [CrossRef]
- Amar, H.; Benzaazoua, M.; Elghali, A.; Bussière, B.; Duclos, M. Upstream environmental desulphurisation and valorisation of waste rocks as a sustainable AMD management approach. J. Geochem. Explor. 2020, 215, 106555. [Google Scholar] [CrossRef]
- Bouzahzah, H. Modification et Amélioration des Tests Statiques et Cinétiques Pour Une Prédiction Fiable du Drainage Minier Acide; Université du Québec en Abitibi-Témiscamingue: Quebec, QC, Canada, 2013. [Google Scholar]
- Cruz, R.; Bertrand, V.; Monroy, M.; González, I. Effect of sulfide impurities on the reactivity of pyrite and pyritic concentrates: A multi-tool approach. Appl. Geochem. 2001, 16, 803–819. [Google Scholar] [CrossRef]
- Toubri, Y.; Demers, I.; Poirier, A.; Pépin, G.; Gosselin, M.-C.; Beier, N.A. Merging 3D geological modeling and stochastic simulation to foster waste rock upstream management. J. Geochem. Explor. 2021, 224, 106739. [Google Scholar] [CrossRef]
- Villeneuve, M.; Bussière, B.; Benzaazoua, M.; Aubertin, M. Assessment of interpretation methods for kinetic tests performed on tailings having a low acid generating potential. In Proceedings of the Securing the Future and 8th ICARD, Skelleftea, Sweden, 23–26 June 2009. [Google Scholar]
- Parkhurst, D.L.; Appelo, C. User’s guide to PHREEQC (Version 2): A computer program for speciation, batch-reaction, one-dimensional transport, and inverse geochemical calculations. Water-Resour. Investig. Rep. 1999, 99, 312. [Google Scholar]
- Labus, K.; Grmela, A. A model of water chemistry forming in effect of pyrite oxidation in a coal mining waste pile. PODZEMNÁ VODA 2006, 1, 50–55. [Google Scholar]
- Embile, R.F., Jr.; Walder, I.F.; Mahoney, J.J. Multicomponent reactive transport modeling of effluent chemistry using locally obtained mineral dissolution rates of forsterite and pyrrhotite from a mine tailings deposit. Adv. Water Resour. 2019, 128, 87–96. [Google Scholar] [CrossRef]
- Vermette, D. Approche de Caractérisation Géoenvironnementale Axée Sur L’utilisation des Concepts Géométallurgiques; Université du Québec en Abitibi-Témiscamingue: Quebec, QC, Canada, 2018. [Google Scholar]
- Amar, H.; Benzaazoua, M.; Edahbi, M.; Villeneuve, M.; Joly, M.-A.; Elghali, A. Reprocessing feasibility of polymetallic waste rock for cleaner and sustainable mining. J. Geochem. Explor. 2021, 220, 106683. [Google Scholar] [CrossRef]
- Brunauer, S.; Emmett, P.H.; Teller, E. Adsorption of Gases in Multimolecular Layers. J. Am. Chem. Soc. 1938, 60, 309–319. [Google Scholar] [CrossRef]
- Chapuis, R.P.; Aubertin, M. On the use of the Kozeny–Carman equation to predict the hydraulic conductivity of soils. Can. Geotech. J. 2003, 40, 616–628. [Google Scholar] [CrossRef]
- Lawrence, R.W.; Wang, Y. Determination of neutralization potential in the prediction of acid rock drainage. In Proceedings of the 4th International Conference on Acid Rock Drainage, Vancouver, BC, Canada, 1 June 1997; pp. 449–464. [Google Scholar]
- Bouzahzah, H.; Benzaazoua, M.; Plante, B.; Bussiere, B. A quantitative approach for the estimation of the “fizz rating” parameter in the acid-base accounting tests: A new adaptations of the Sobek test. J. Geochem. Explor. 2015, 153, 53–65. [Google Scholar] [CrossRef]
- Sobek, A.A. Field and Laboratory Methods Applicable to Overburdens and Minesoils; Industrial Environmental Research Laboratory, Office of Research and Development, US Environmental Protection Agency: Colombia, WA, USA, 1978.
- Bouzahzah, H.; Benzaazoua, M.; Bussière, B.; Plante, B. Revue de littérature détaillée sur les tests statiques et les essais cinétiques comme outils de prédiction du drainage minier acide. Déchets Sci. Et Tech. Tech. 2014, 66, 14–31. [Google Scholar] [CrossRef] [Green Version]
- Plante, B.; Benzaazoua, M.; Bussière, B. Kinetic Testing and Sorption Studies by Modified Weathering Cells to Characterize the Potential to Generate Contaminated Neutral Drainage. Mine Water Environ. 2010, 30, 22–37. [Google Scholar] [CrossRef]
- Park, I.; Tabelin, C.B.; Seno, K.; Jeon, S.; Inano, H.; Ito, M.; Hiroyoshi, N. Carrier-microencapsulation of arsenopyrite using Al-catecholate complex: Nature of oxidation products, effects on anodic and cathodic reactions, and coating stability under simulated weathering conditions. Heliyon 2020, 6, e03189. [Google Scholar] [CrossRef] [PubMed] [Green Version]
- Eary, L.E.; Williamson, M.A. Simulations of the Neutralizing Capacity of Silicate Rocks in Acid Mine Drainage Environments. J. Am. Soc. Min. Reclam. 2006, 2006, 564–577. [Google Scholar] [CrossRef]
- Salmon, S.U. Geochemical modelling of acid mine drainage in mill tailings: Quantification of kinetic processes from laboratory to field scale. Byggvetenskap 2003, 7, 33–39. [Google Scholar]
- Plante, B. Évaluation des Principaux Facteurs D’influence sur la Prédiction du Drainage Neutre Contaminé; Université du Québec à en Abitibi-Témiscamingue: Quebec, QC, Canada, 2010. [Google Scholar]
- Jerz, J.K.; Rimstidt, J. Pyrite oxidation in moist air. Geochim. Et Cosmochim. Acta 2004, 68, 701–714. [Google Scholar] [CrossRef]
- Chou, L.; Wollast, R. Steady-state kinetics and dissolution mechanisms of albite. Am. J. Sci. 1985, 285, 963–993. [Google Scholar] [CrossRef]
- Casey, W.H.; Ludwig, C. Chapter 3. Silicate Mineral Dissolution as a Ligand-Exchange Reaction. Chem. Weather. Rates Silic. Miner. 1995, 87–118. [Google Scholar] [CrossRef]
- Palandri, J.L.; Kharaka, Y.K. A Compilation of Rate Parameters of Water-Mineral Interaction Kinetics for Application to Geochemical Modeling; US Geological Survey: Liston, WV, USA, 2004.
- Marty, N.; Claret, F.; Lassin, A.; Tremosa, J.; Blanc, P.; Madé, B.; Giffaut, E.; Cochepin, B.; Tournassat, C. A database of dissolution and precipitation rates for clay-rocks minerals. Appl. Geochem. 2015, 55, 108–118. [Google Scholar] [CrossRef]
- Lammers, K.; Smith, M.M.; Carroll, S.A. Muscovite dissolution kinetics as a function of pH at elevated temperature. Chem. Geol. 2017, 466, 149–158. [Google Scholar] [CrossRef]
- Smith, M.M.; Carroll, S.A. Chlorite dissolution kinetics at pH 3–10 and temperature to 275 °C. Chem. Geol. 2016, 421, 55–64. [Google Scholar] [CrossRef] [Green Version]
- Parkhurst, D.L.; Appelo, C.A.J. Description of Input and Examples for PHREEQC Version 3—A Computer Program for Speciation, Batch-reaction, One-dimensional Transport, and Inverse Geochemical Calculations. In Techniques and Methods; U.S. Geological Survey: Reston, VA, USA, 2013. [Google Scholar]
- Tiruta-Barna, L. Using PHREEQC for modelling and simulation of dynamic leaching tests and scenarios. J. Hazard. Mater. 2008, 157, 525–533. [Google Scholar] [CrossRef] [PubMed]
- Neuman, S.P. Universal scaling of hydraulic conductivities and dispersivities in geologic media. Water Resour. Res. 1990, 26, 1749–1758. [Google Scholar] [CrossRef]
- Kinniburgh, D.; Cooper, D. PhreePlot: Creating Graphical Output with PHREEQC. 2011. Available online: http://nora.nerc.ac.uk/id/eprint/19744/ (accessed on 23 October 2021).
- Appelo, C.A.J.; Postma, D. Geochemistry, Groundwater and Pollution; CRC Press: Boca Raton, FL, USA, 2004. [Google Scholar]
- Le Bourre, B.; Neculita, C.M.; Coudert, L.; Rosa, E. Manganese removal processes and geochemical behavior in residues from passive treatment of mine drainage. Chemosphere 2020, 259, 127424. [Google Scholar] [CrossRef]
- Hellmann, R. The albite-water system: Part II. The time-evolution of the stoichiometry of dissolution as a function of pH at 100, 200, and 300 °C. Geochim. Et Cosmochim. Acta 1995, 59, 1669–1697. [Google Scholar] [CrossRef]
- Reczek, L.; Michel, M.M.; Trach, Y.; Siwiec, T.; Tytkowska-Owerko, M. The Kinetics of Manganese Sorption on Ukrainian Tuff and Basalt—Order and Diffusion Models Analysis. Minerals 2020, 10, 1065. [Google Scholar] [CrossRef]
- Trach, Y.; Tytkowska-Owerko, M.; Reczek, L.; Michel, M.M. Comparison the Adsorption Capacity of Ukrainian Tuff and Basalt with Zeolite–Manganese Removal from Water Solution. J. Ecol. Eng. 2021, 22, 161–168. [Google Scholar] [CrossRef]
- Kimball, B.E.; Rimstidt, J.D.; Brantley, S.L. Chalcopyrite dissolution rate laws. Appl. Geochem. 2010, 25, 972–983. [Google Scholar] [CrossRef]
Figure 1.
Blend samples prepared to assess geochemical interactions among lithological units within geo-environmental domains (the size of the boxes represent blending proportions). D1. the mafic domain, D2. the dacite domain, D3. the intermediate domain, T1. the all-embracing domain, Unit-1. andesitic basalt unit, Unit-2. Fe-Ti rich basalt, Unit-3. andesite, Unit-4A. dacite, dacitic tuff, dacitic intrusions, and quartz-feldspar porphyry type 1, Unit-4B. alkaline andesite and alkaline andesitic tuff, Unit-5A. dacite, dacitic tuff, dacitic intrusions, and quartz-feldspar porphyry type 2, Unit-5B. alkaline andesite and alkaline andesitic tuffs.

Figure 2.
The conceptual model of the weathering cell tests.

Figure 3.
Acid–base accounting classification based on the neutralization potential ratio.

Figure 4.
Mineralogical composition of composite samples.

Figure 5.
Weathering cell test D2 and PHREEQC modeling results using BET and geometric surface area-derived rates. (a) Experimental and simulated results of the pH. (b) Experimental and simulated results of sulfate. (c) Experimental and simulated results of sodium. (d) Experimental and simulated results of the total dissolved iron. (e) Experimental and simulated results of total dissolved calcium. (f) Experimental and simulated results of total dissolved magnesium. (g) Experimental and simulated results of total dissolved aluminum. (h) Experimental and simulated results of total dissolved potassium. (i) Experimental and simulated results of total dissolved manganese.

Figure 6.
Weathering cells test D1 and PHREEQC modeling results. (a) Experimental and simulated results of the pH. (b) Experimental and simulated results of sulfate. (c) Experimental and simulated results of sodium. (d) Experimental and simulated results of the total dissolved iron. (e) Experimental and simulated results of total dissolved calcium. (f) Experimental and simulated results of total dissolved magnesium. (g) Experimental and simulated results of total dissolved aluminum. (h) Experimental and simulated results of total dissolved potassium. (i) Experimental and simulated results of total dissolved manganese.

Figure 7.
Weathering cell test D3 and PHREEQC modeling results. (a) Experimental and simulated results of the pH. (b) Experimental and simulated results of sulfate. (c) Experimental and simulated results of sodium. (d) Experimental and simulated results of the total dissolved iron. (e) Experimental and simulated results of total dissolved calcium. (f) Experimental and simulated results of total dissolved magnesium. (g) Experimental and simulated results of total dissolved aluminum. (h) Experimental and simulated results of total dissolved potassium. (i) Experimental and simulated results of total dissolved manganese.

Figure 8.
Weathering cell test T1 and PHREEQC modeling results. (a) Experimental and simulated results of the pH. (b) Experimental and simulated results of sulfate. (c) Experimental and simulated results of sodium. (d) Experimental and simulated results of the total dissolved iron. (e) Experimental and simulated results of total dissolved calcium. (f) Experimental and simulated results of total dissolved magnesium. (g) Experimental and simulated results of total dissolved aluminum. (h) Experimental and simulated results of total dissolved potassium. (i) Experimental and simulated results of total dissolved manganese.

Figure 9.
Various scenarios underlining the effect of various mineral assemblages on leachate quality. (a) Sulfate concentrations obtained in the presence of different mineral proportions. (b) Cu concentrations obtained in the presence of different mineral proportions (c) Fe concentrations obtained in the presence of different mineral proportions. (d) Mn concentrations obtained in the presence of different mineral proportions. (e) The pH obtained from the simulated mineral proportion scenarios.

Figure 10.
Various scenarios delineating the relationship between the residence time and leachate quality in weathering cell test simulation. (a) The pH obtained for various residence times. (b) Sulfate concentrations obtained for various residence times. (c) Sulfate concentrations obtained for various residence times.


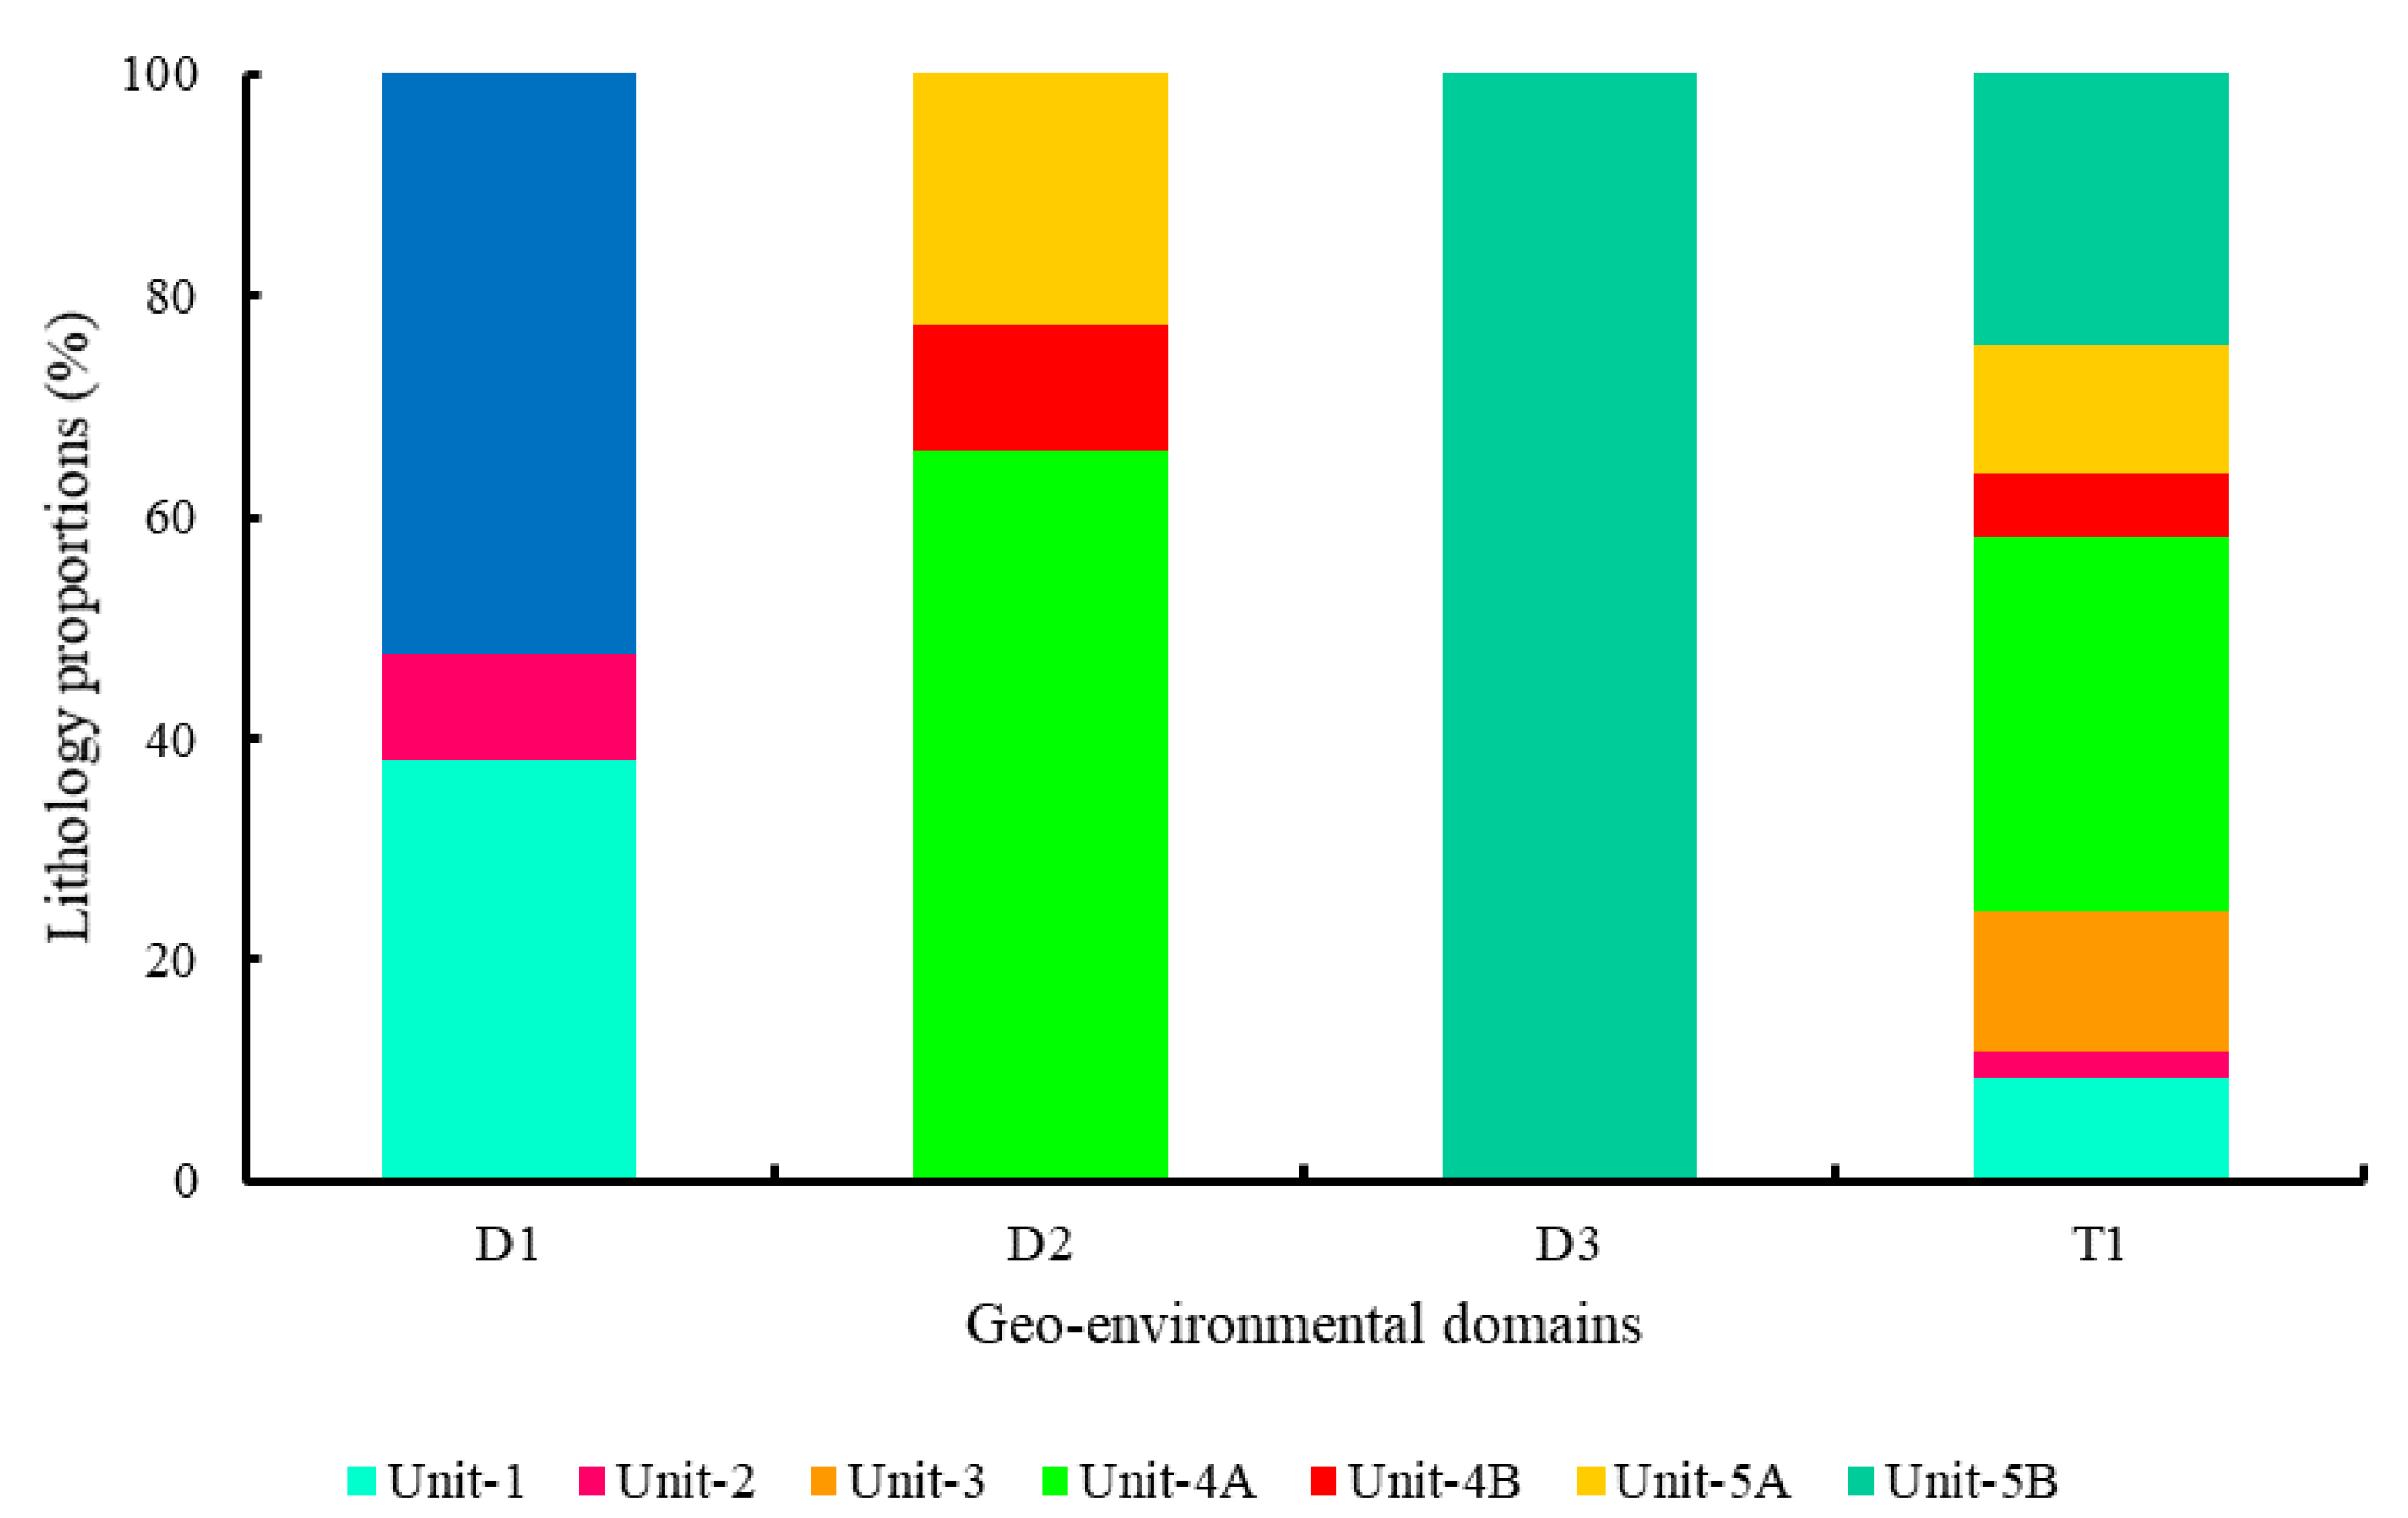
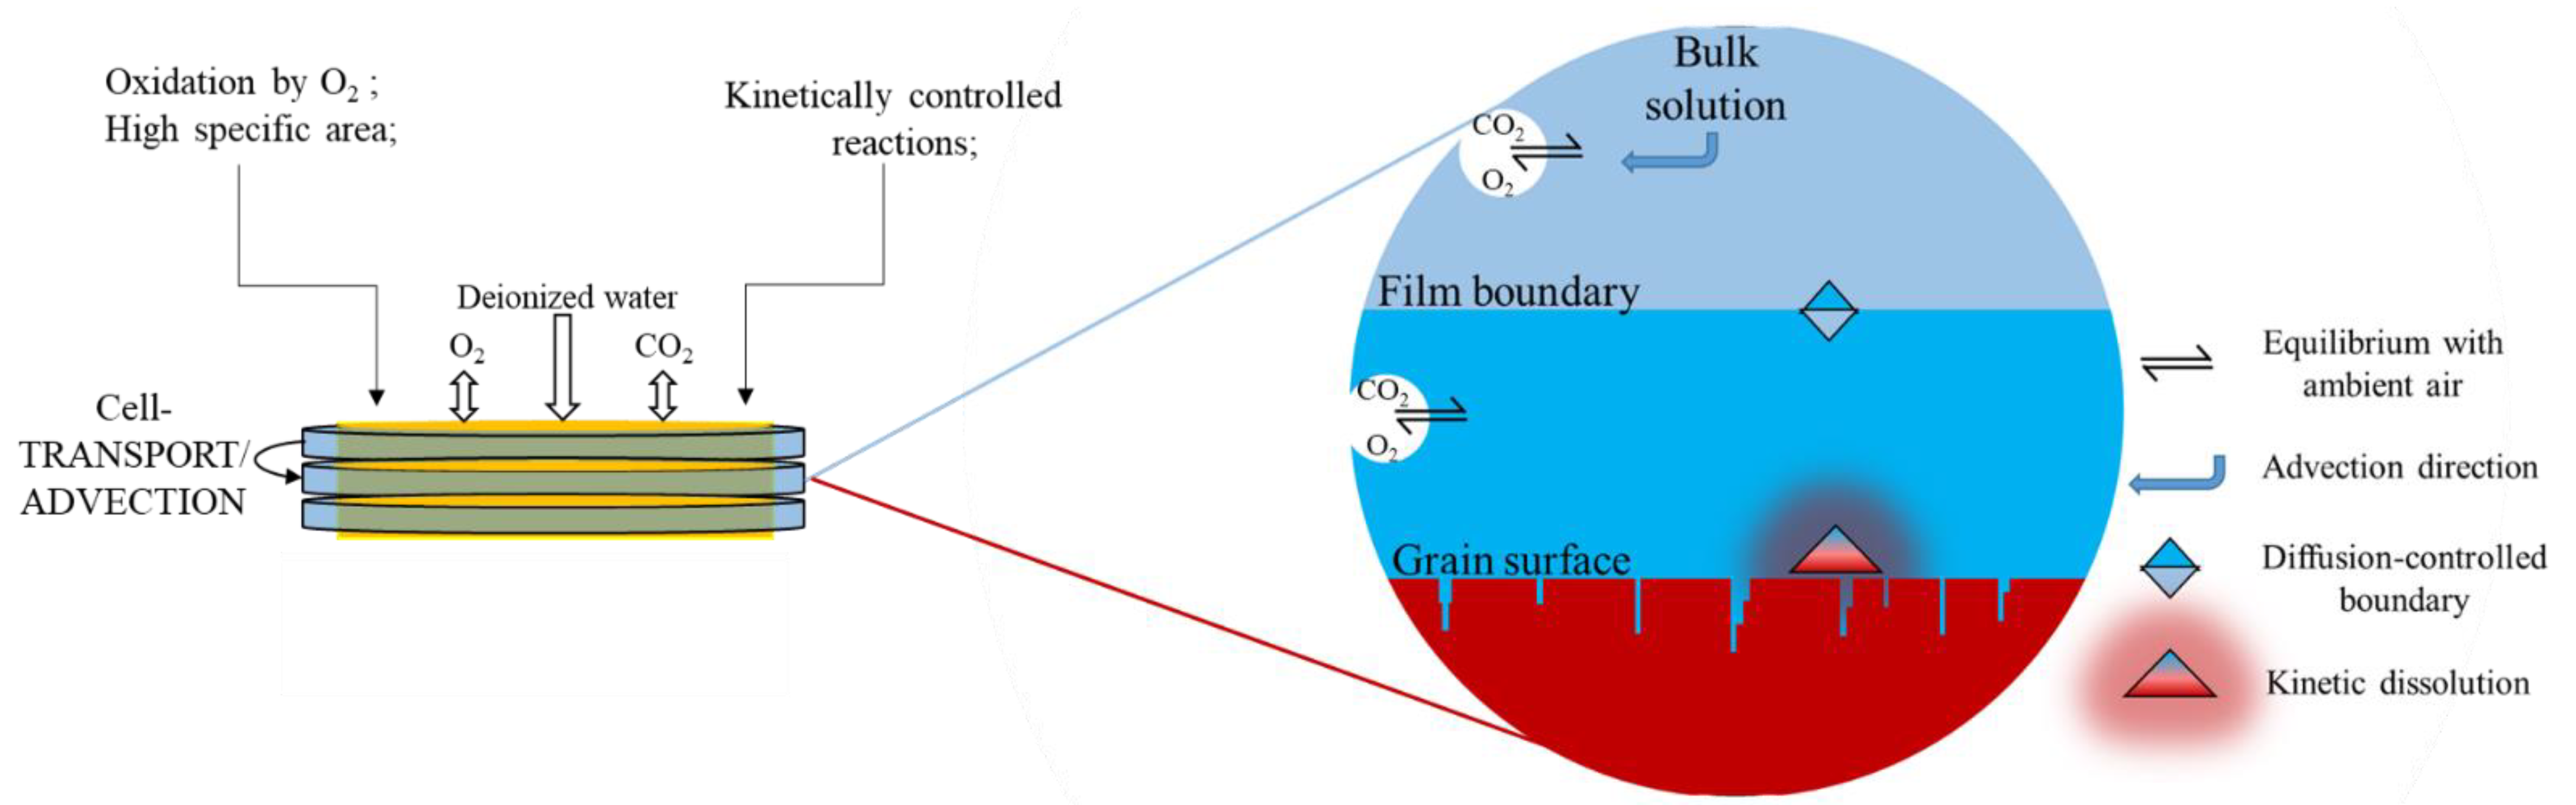
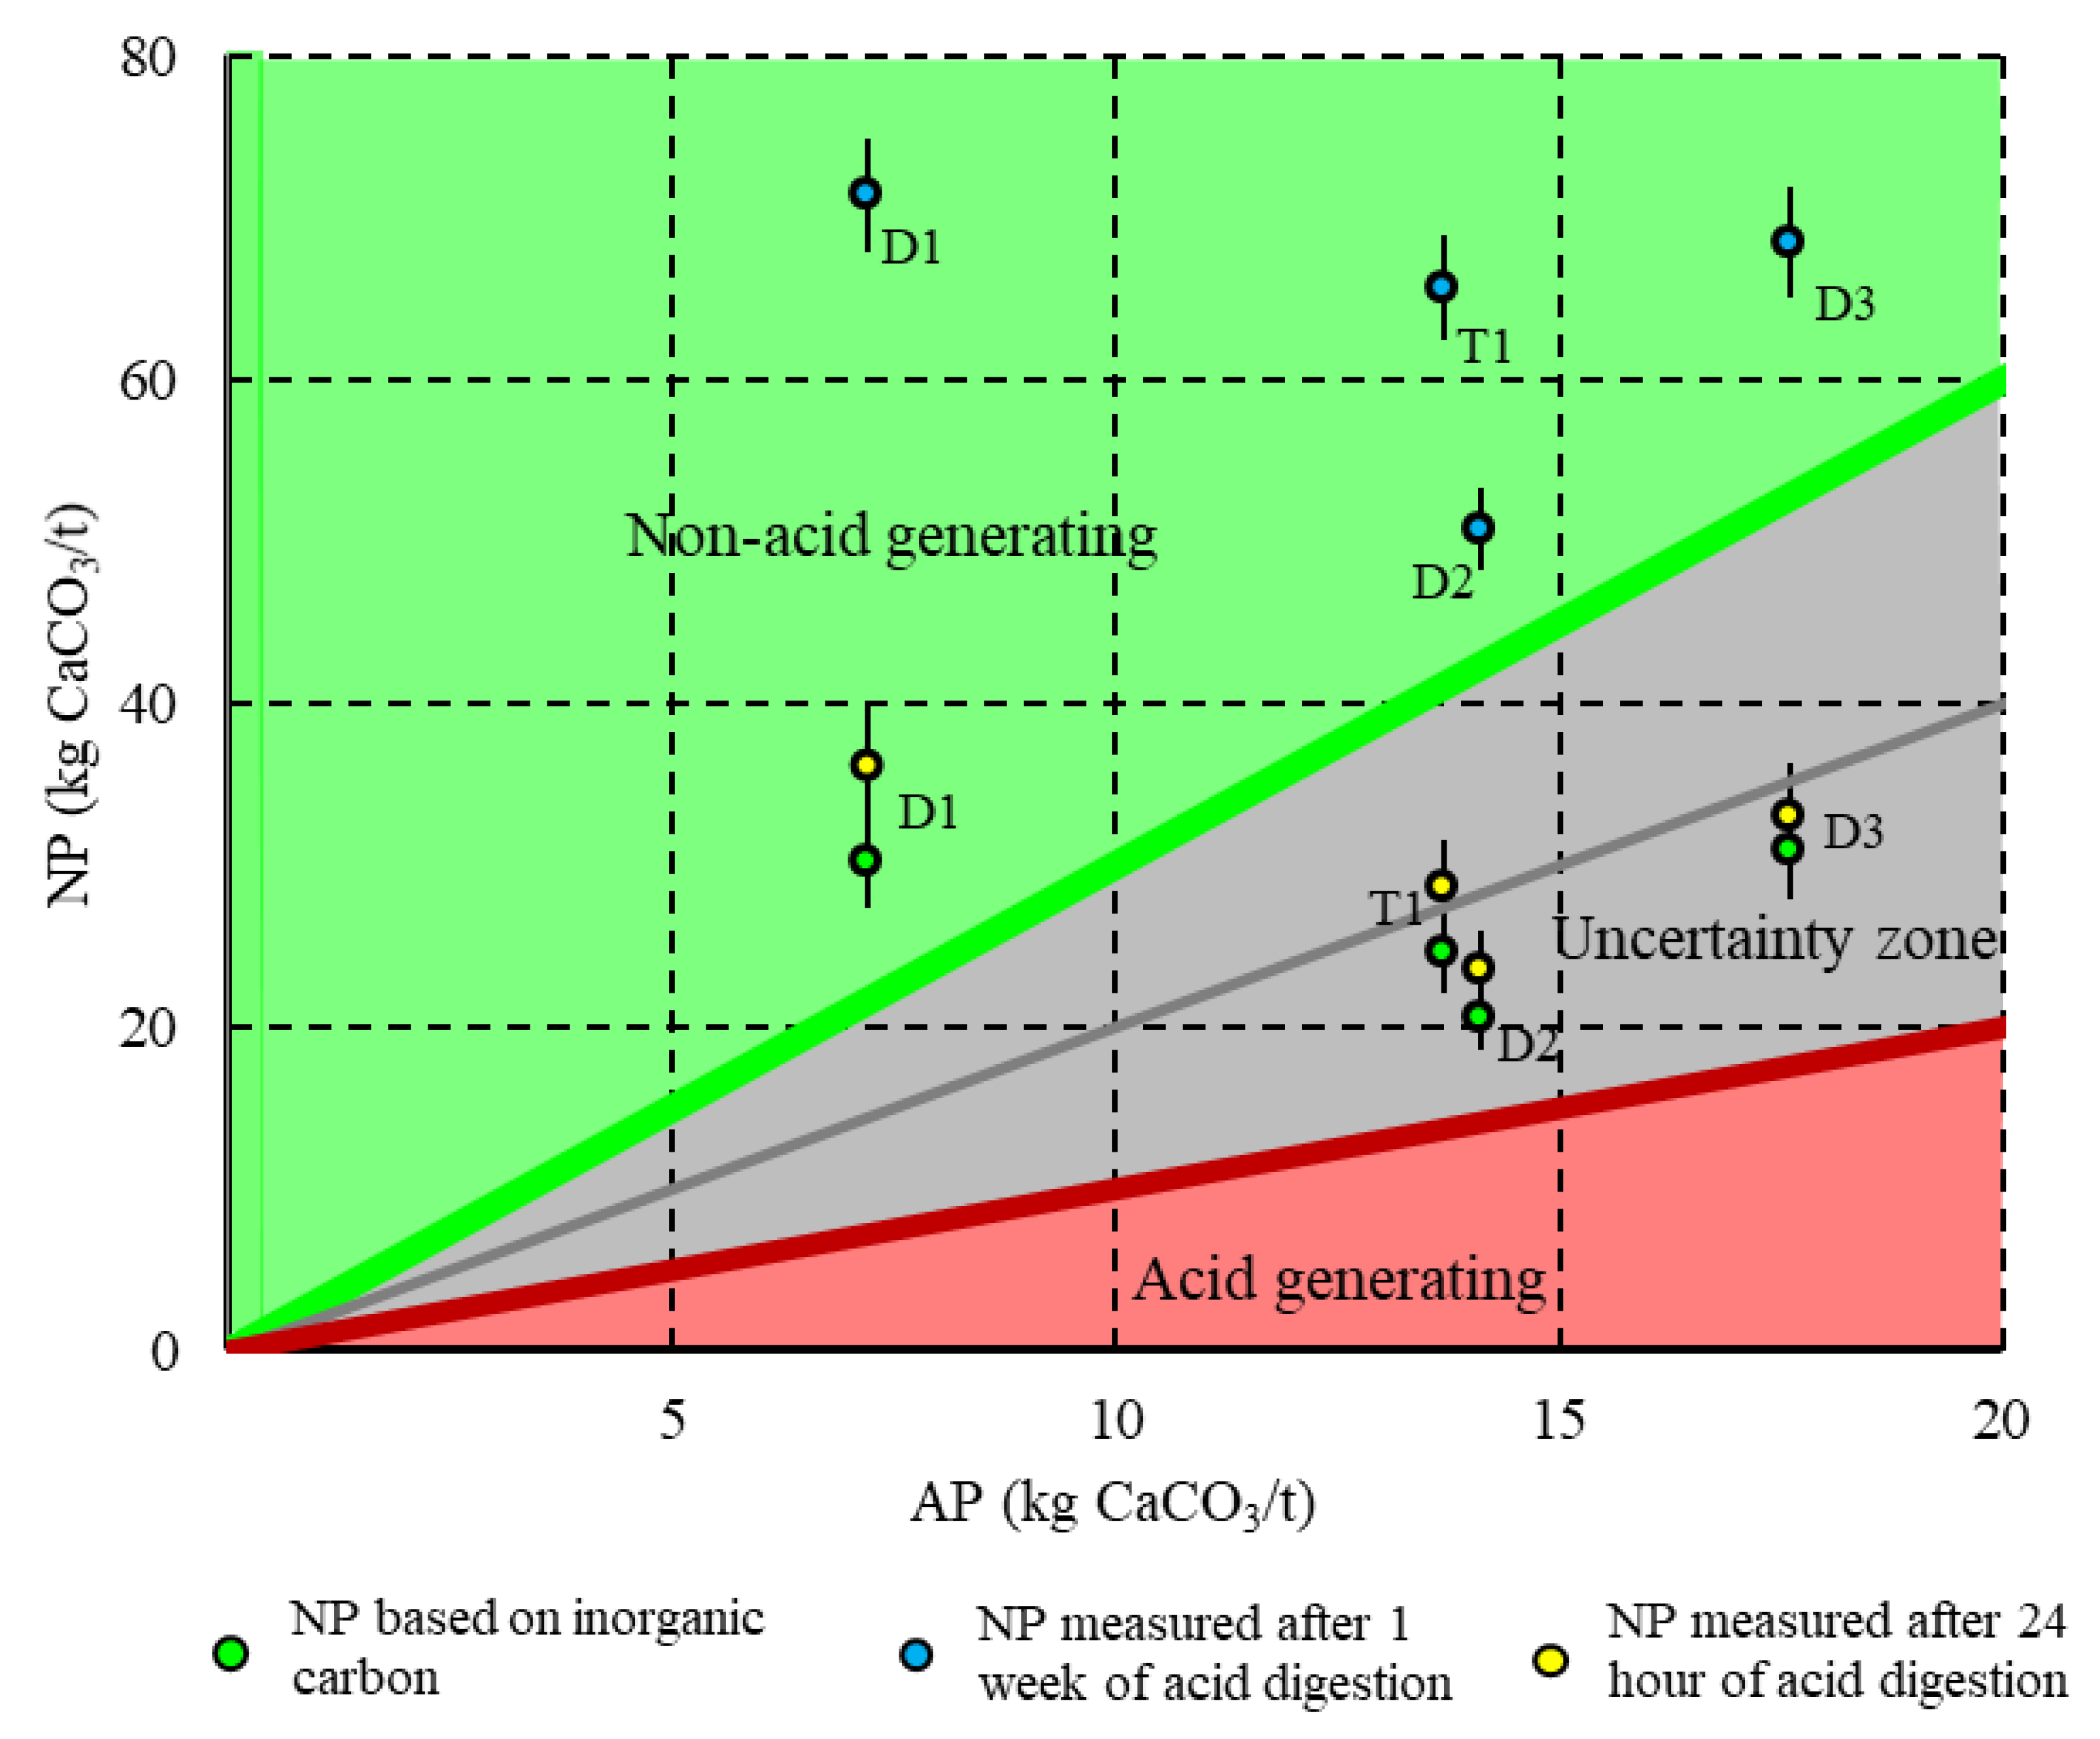
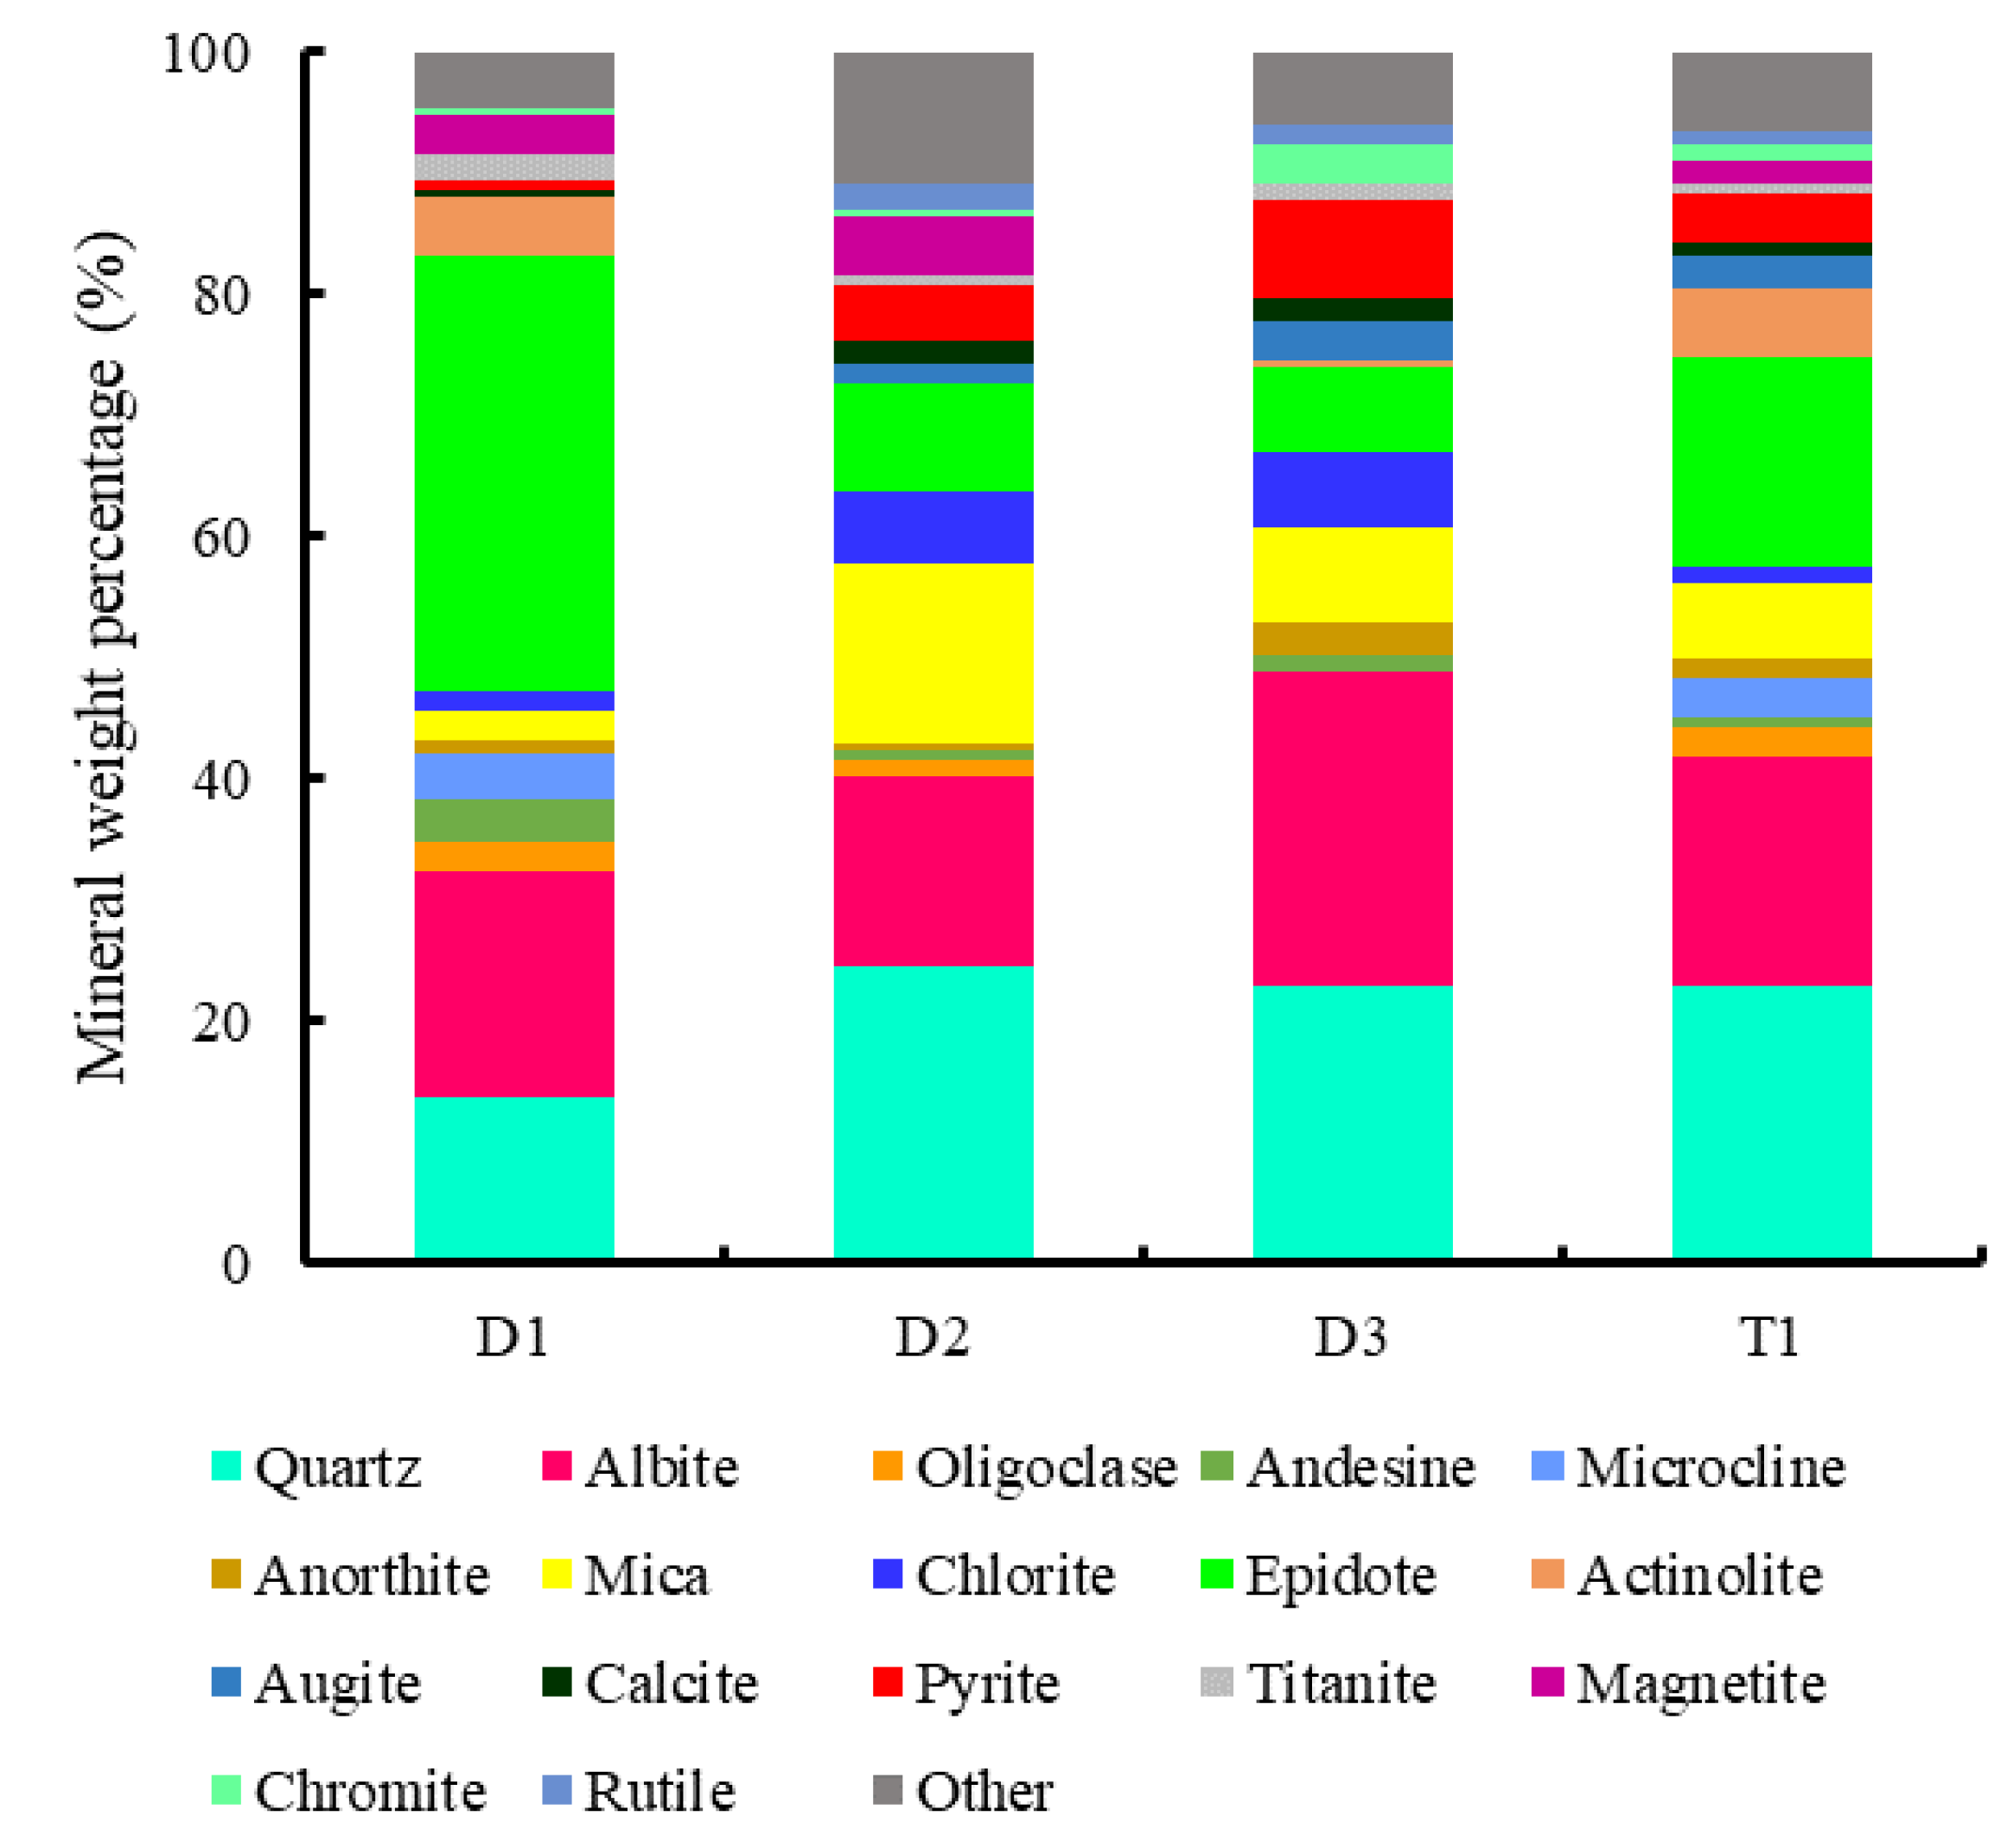
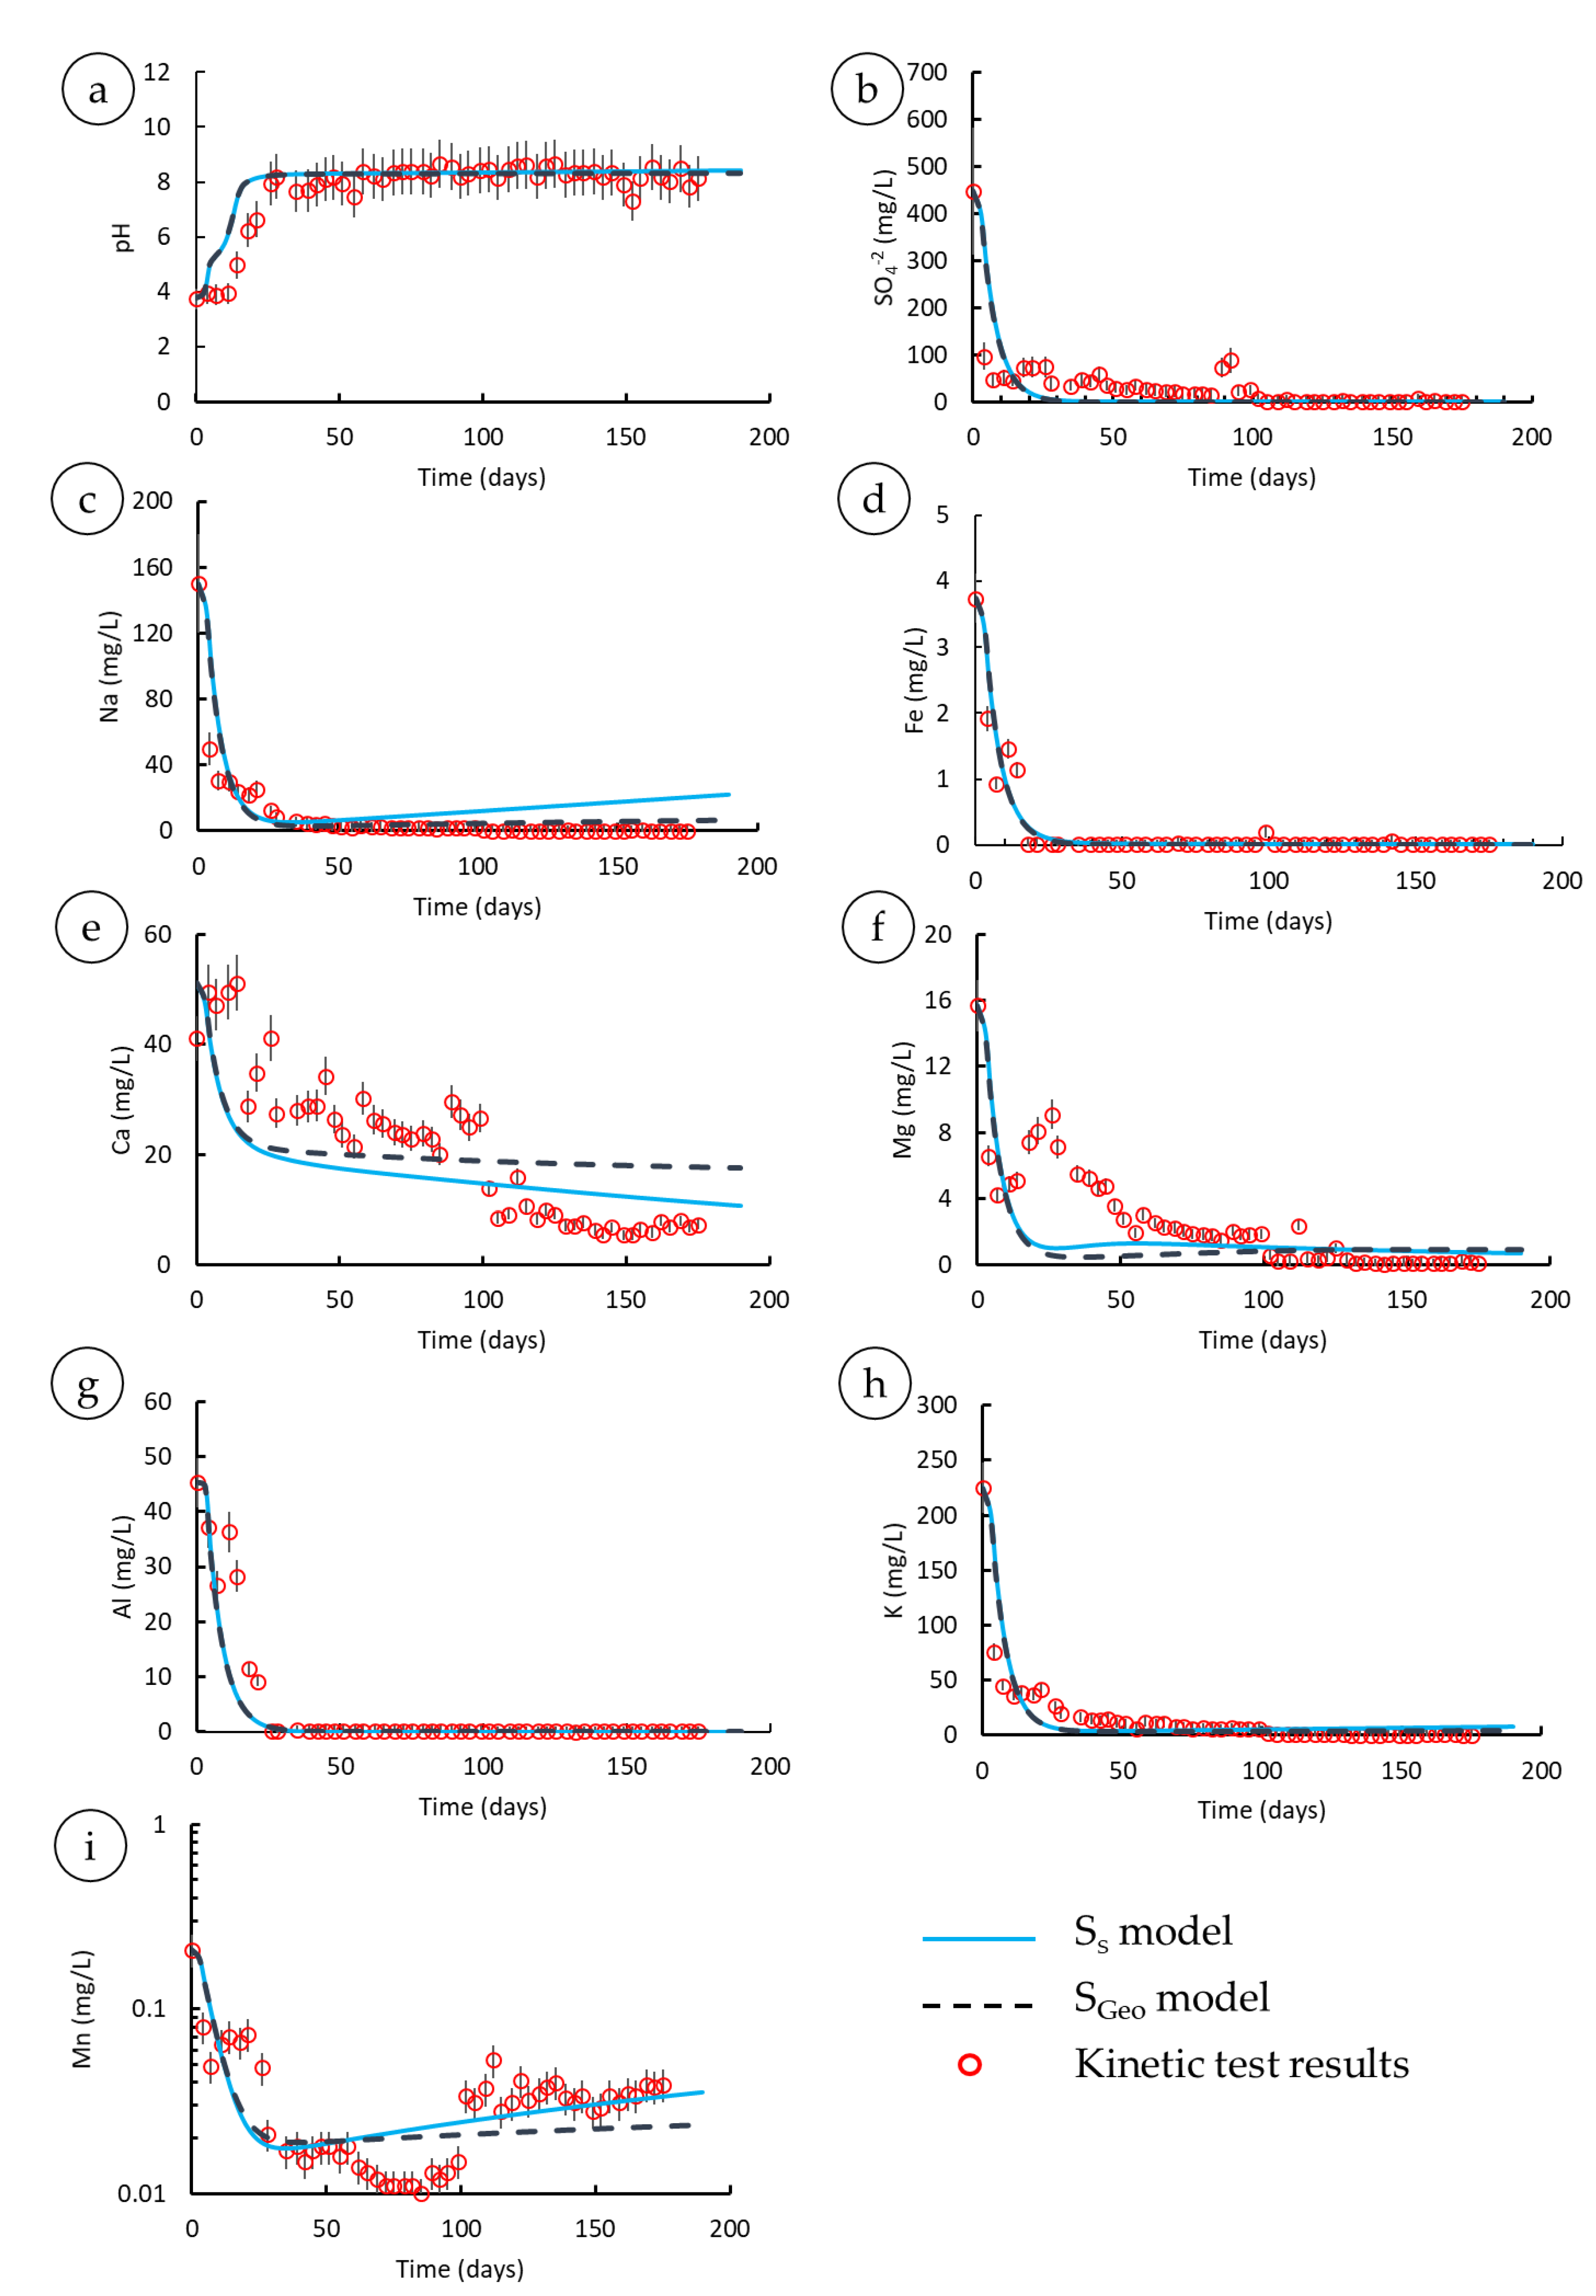
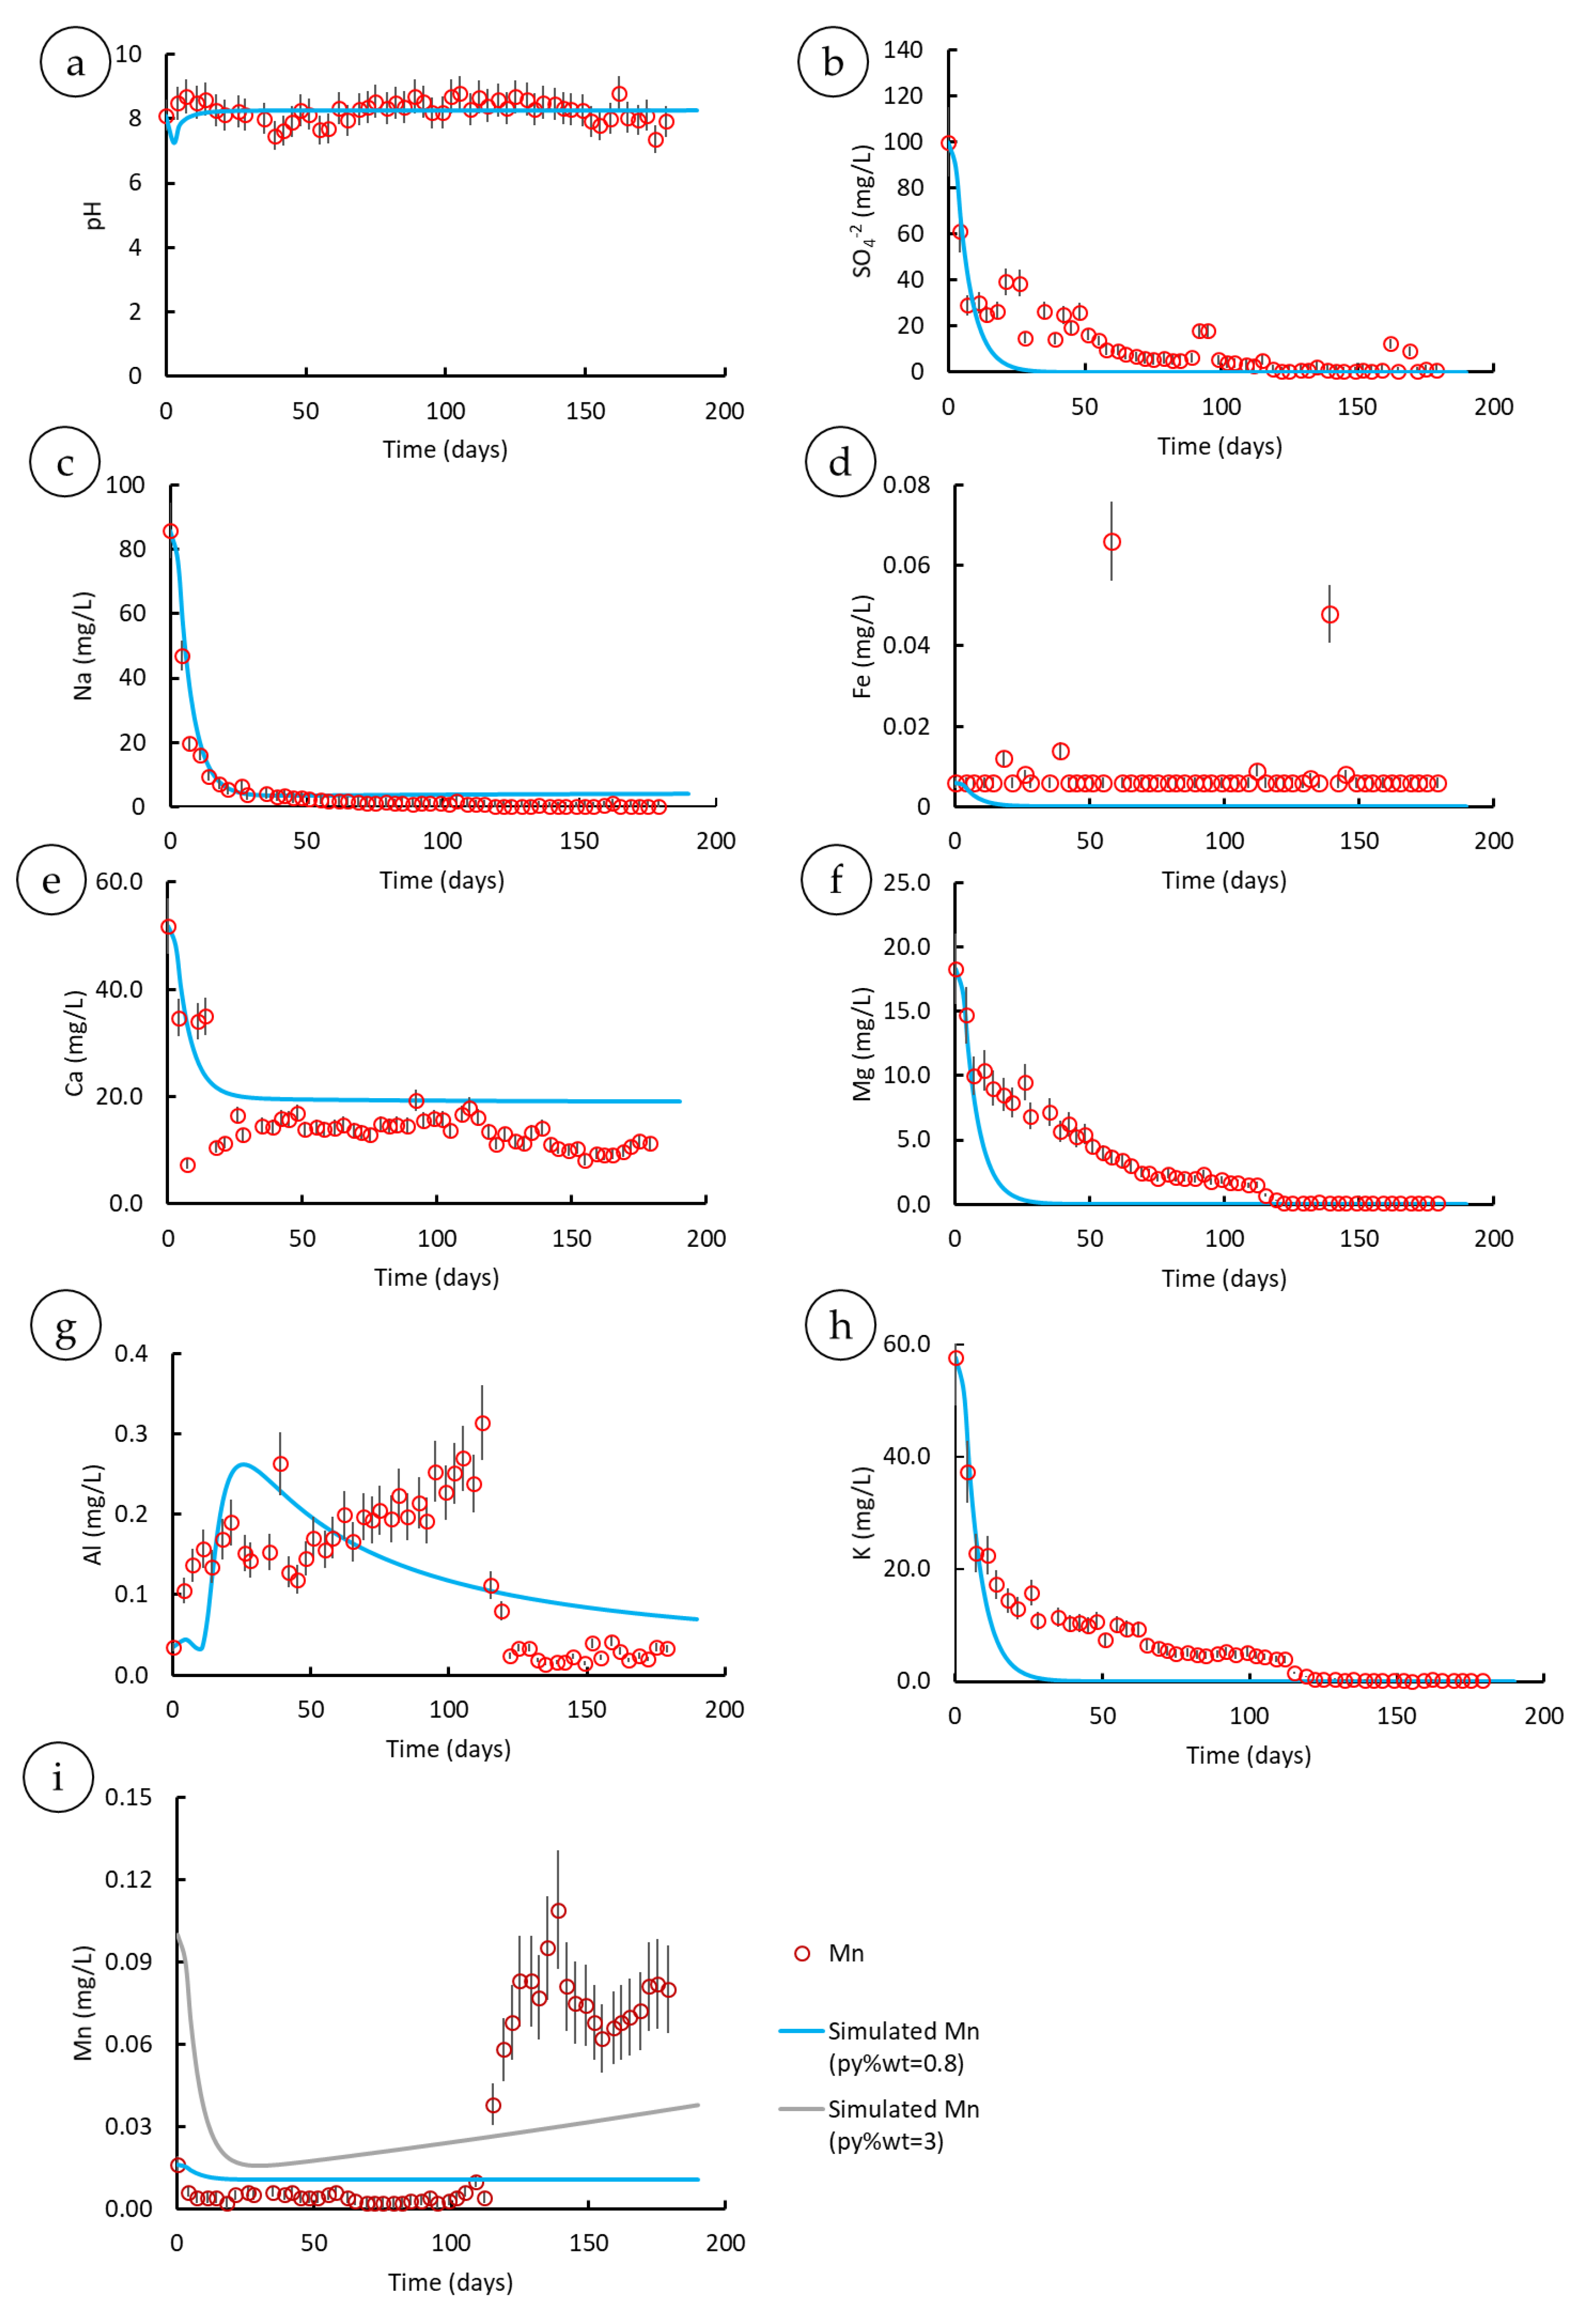
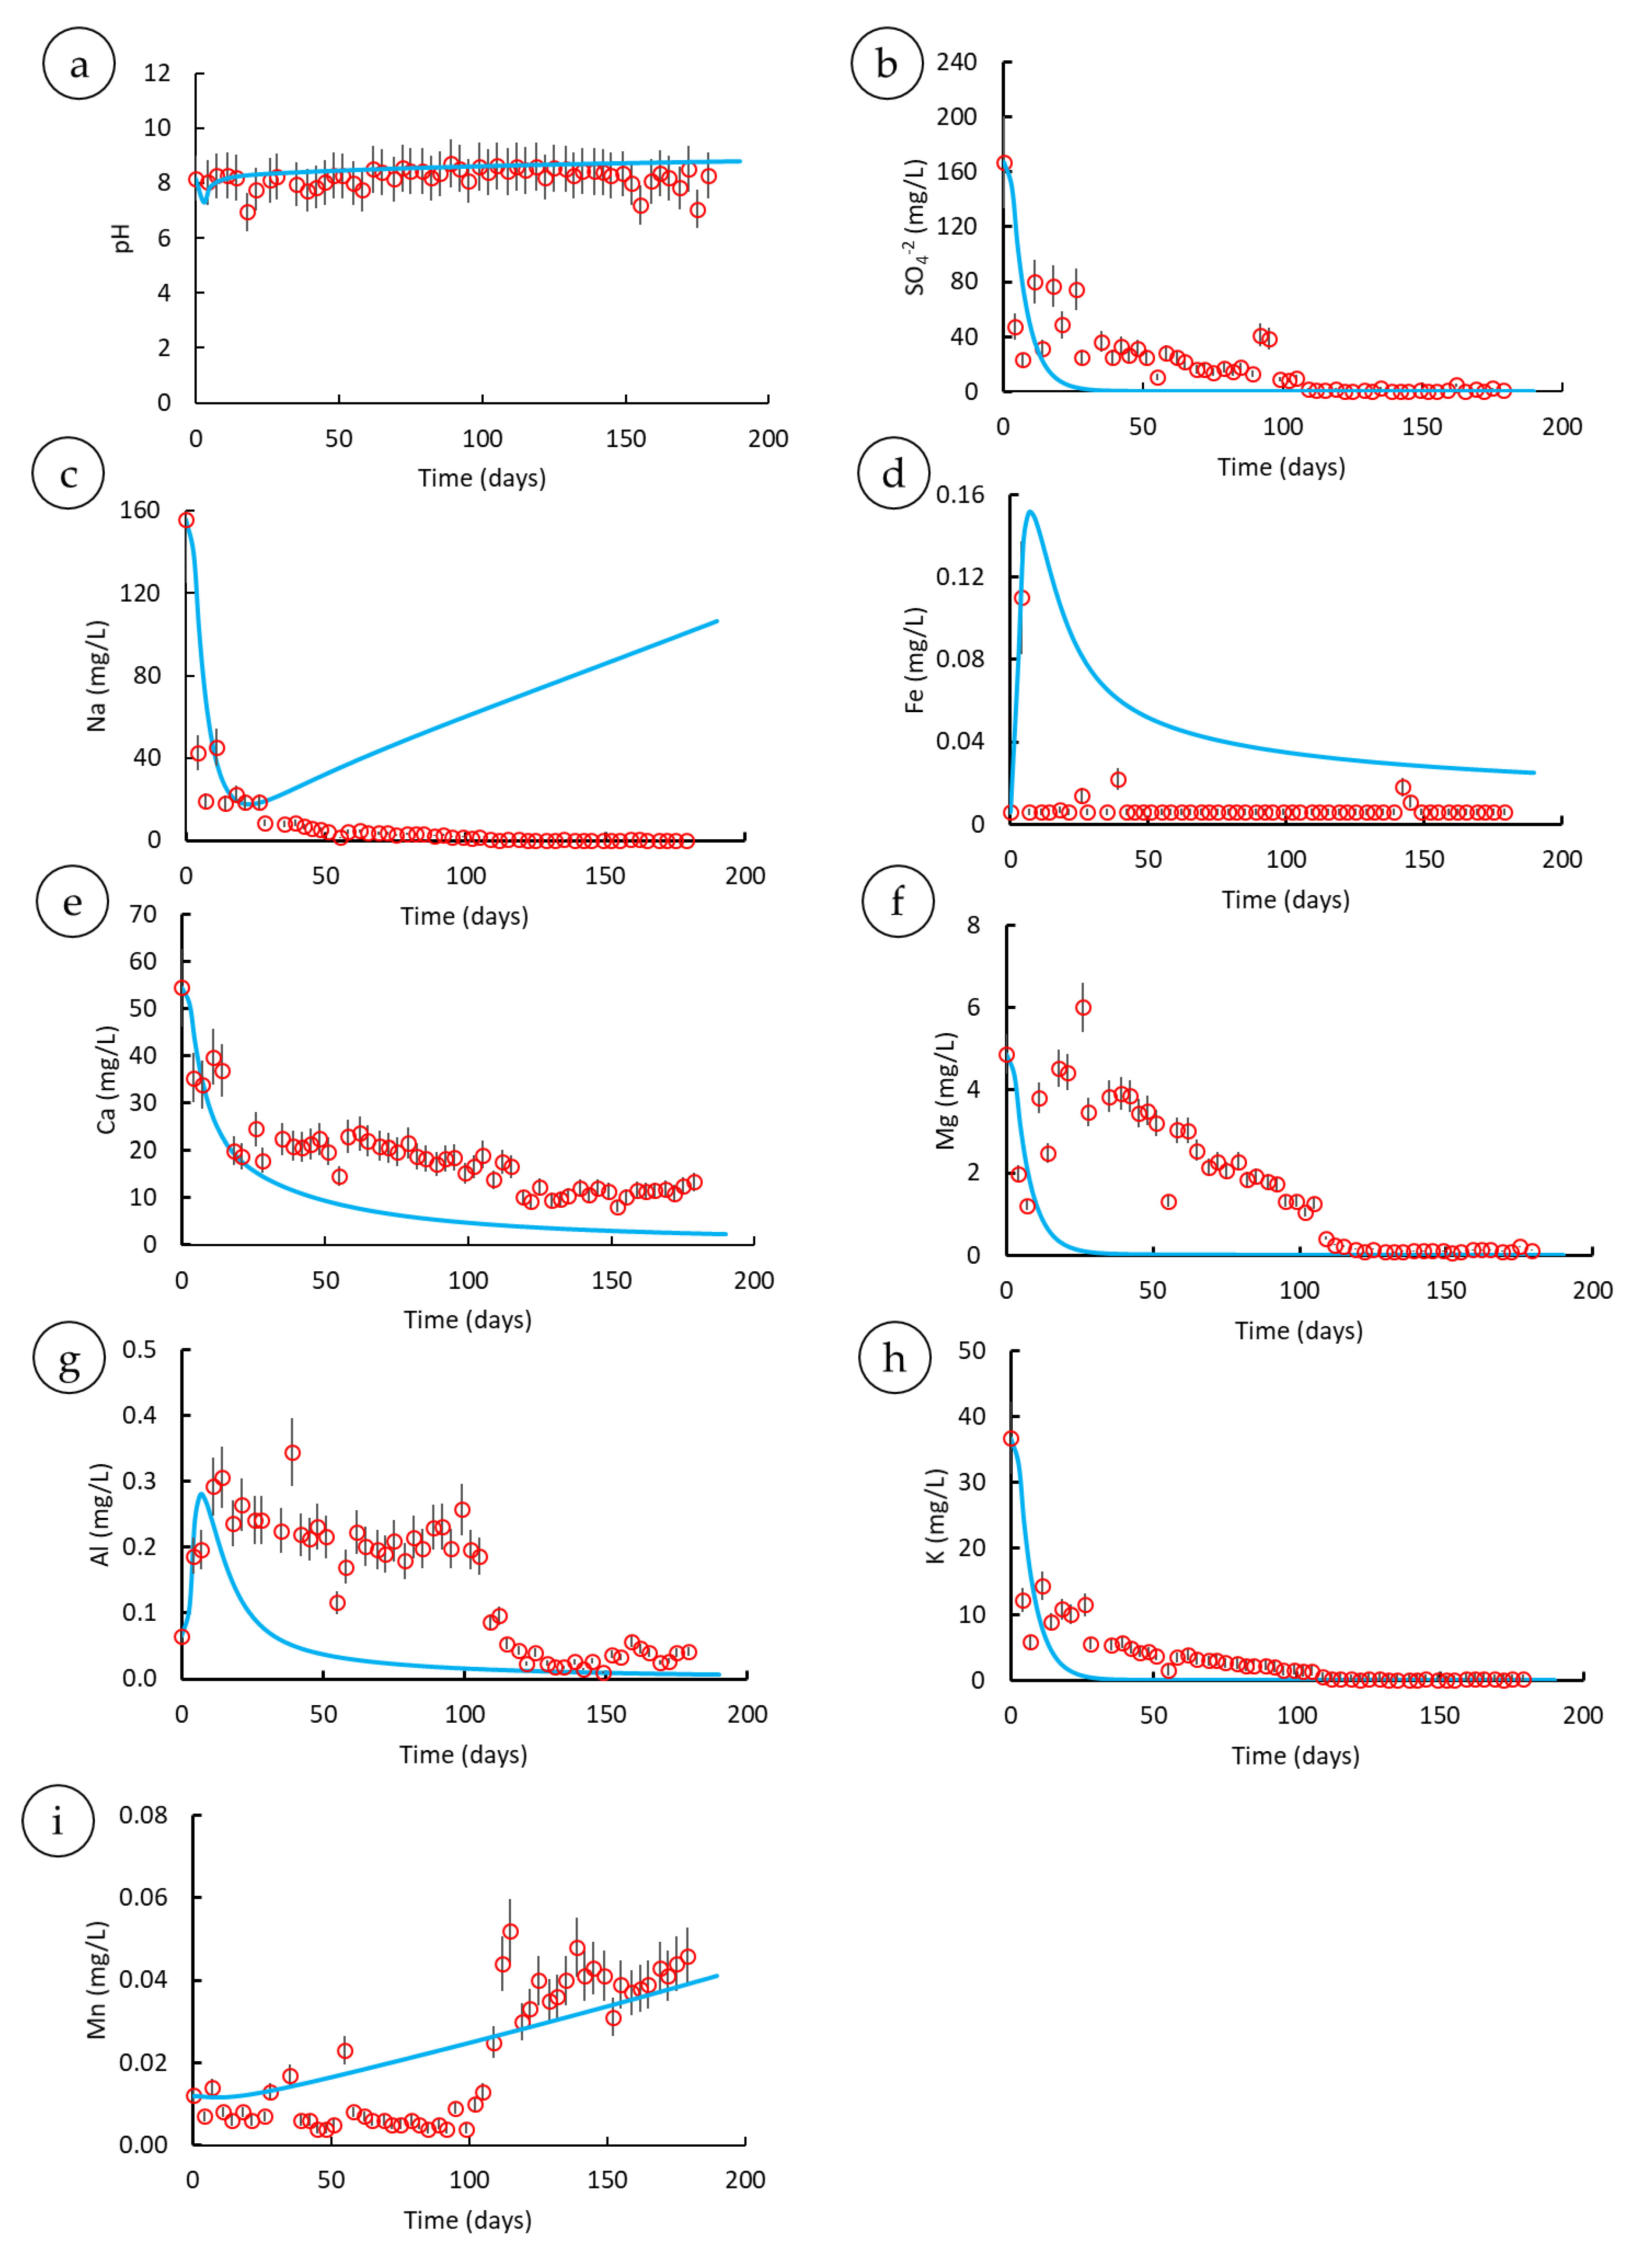
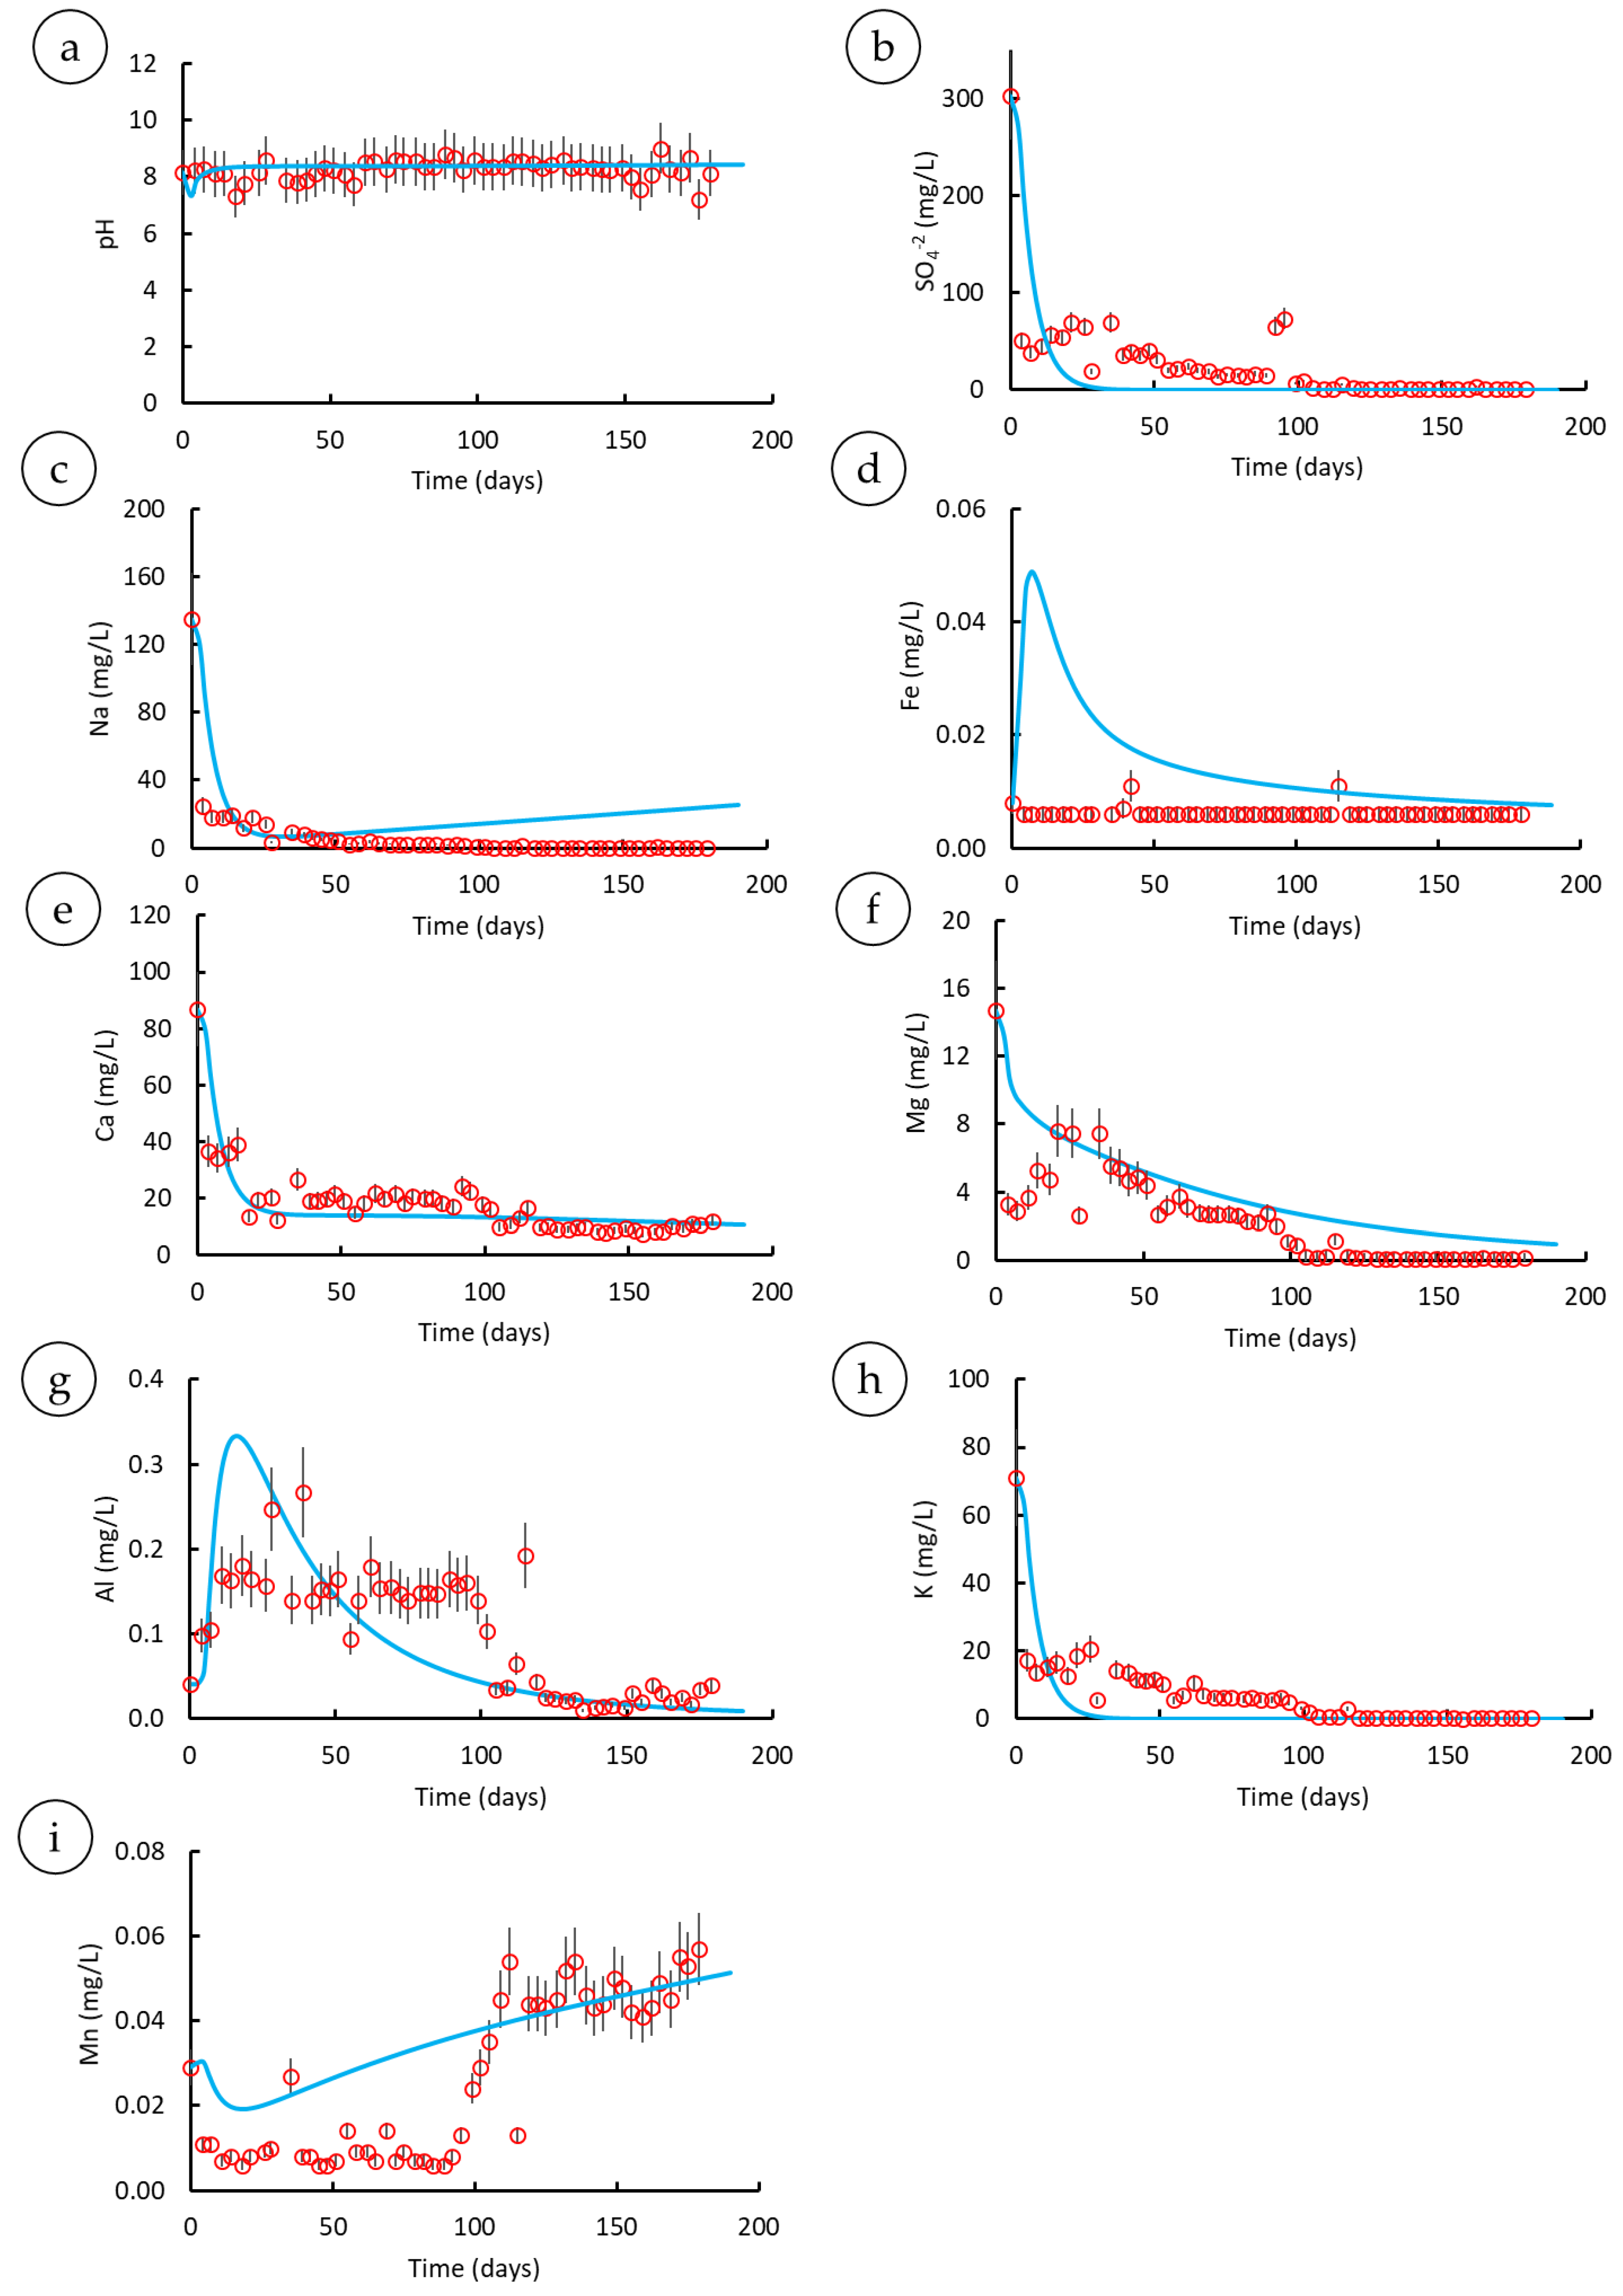
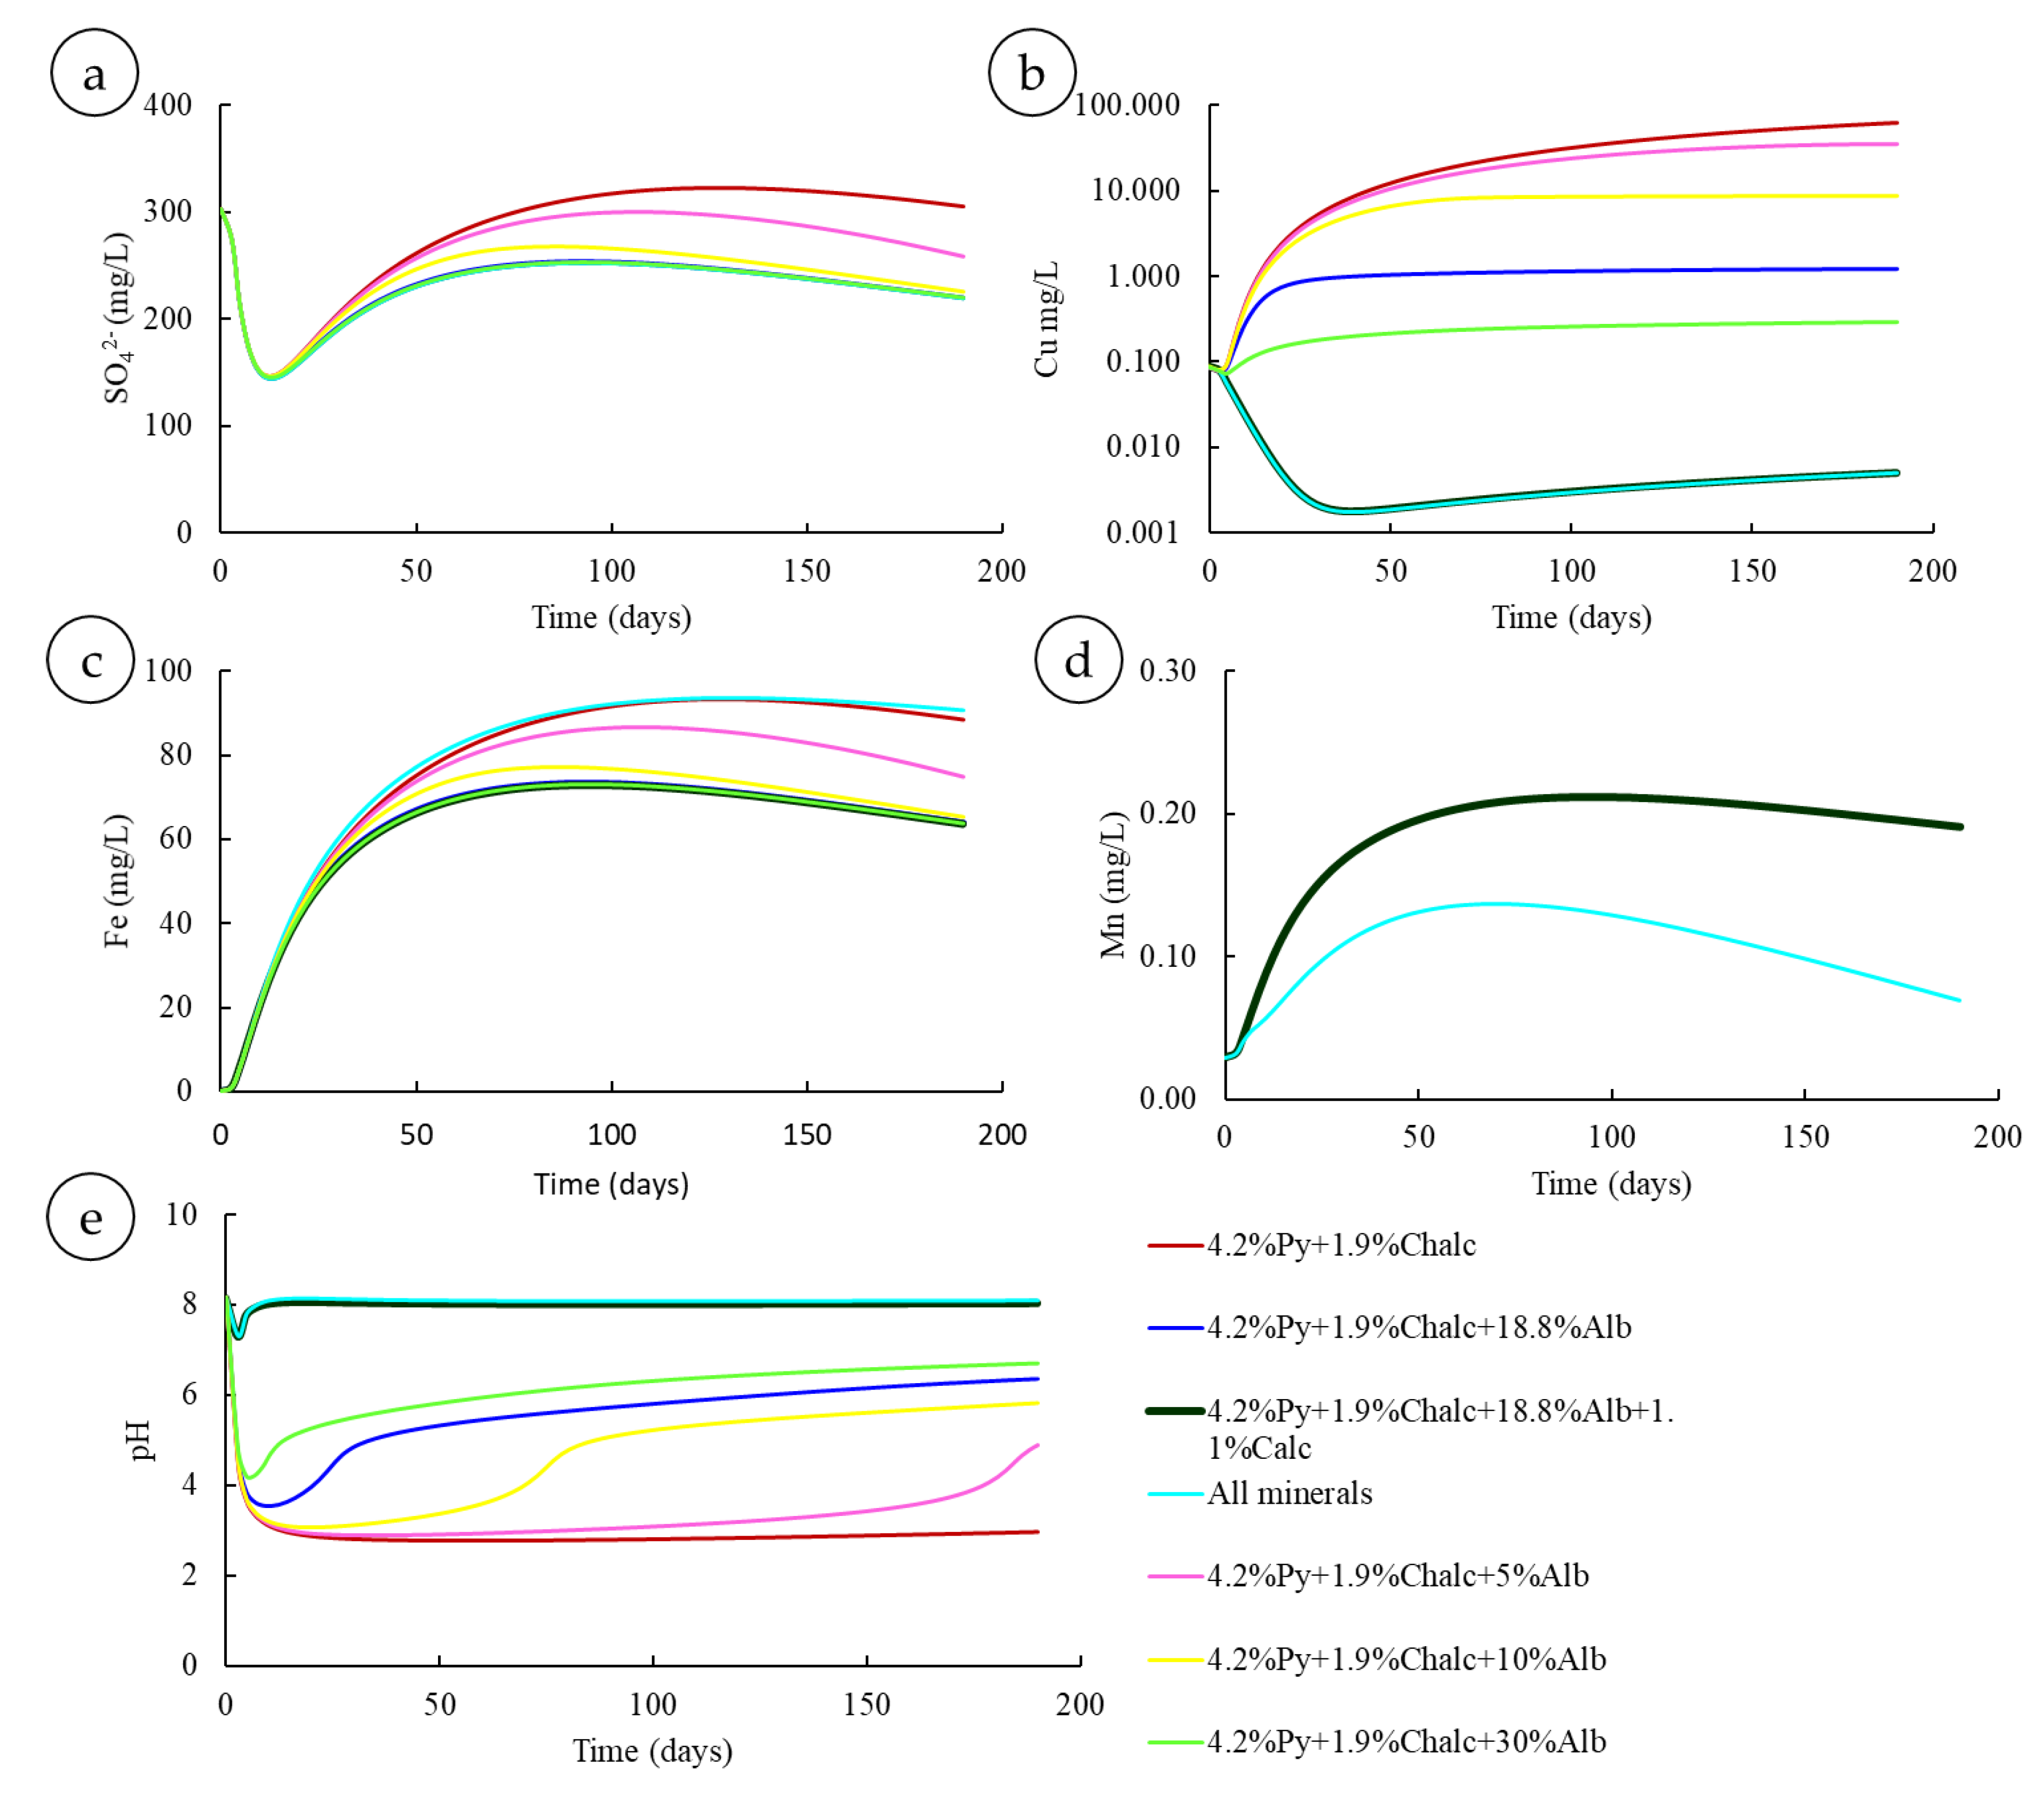
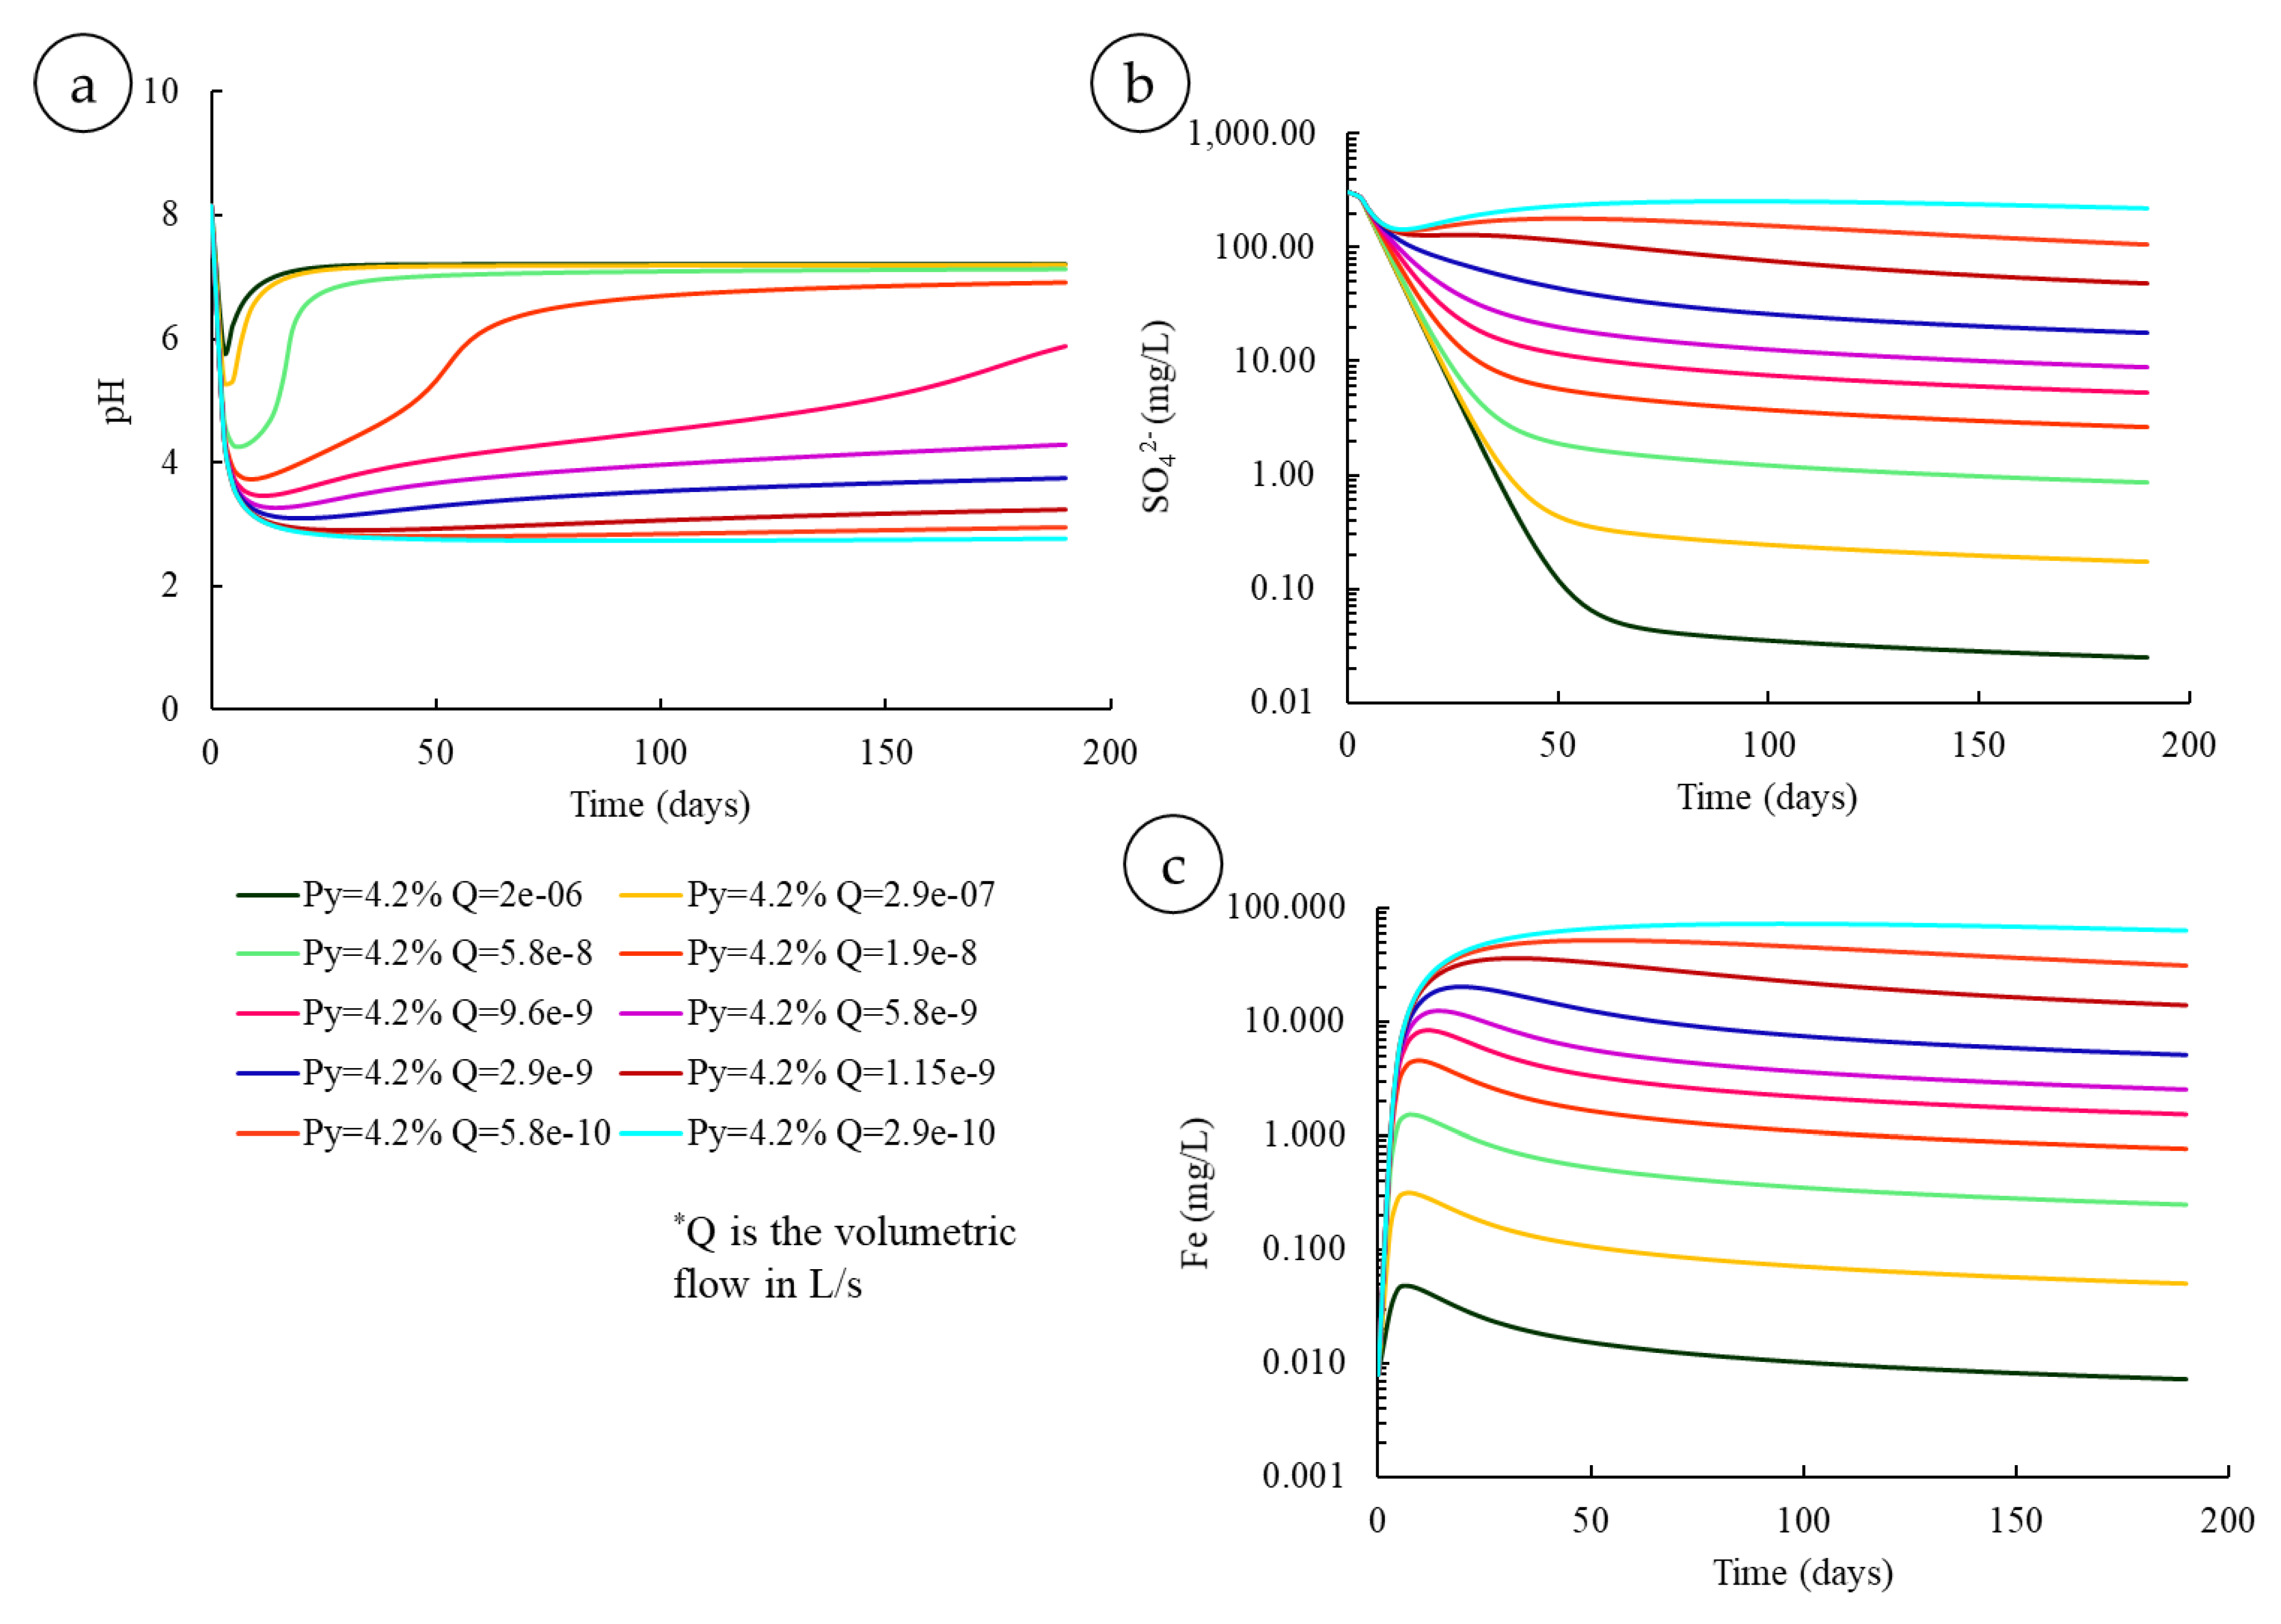
Table 1.
List of dissolution rate parameters used in this study to kinetically simulate the neutralization potential under a wide range of pH.
Table 1.
List of dissolution rate parameters used in this study to kinetically simulate the neutralization potential under a wide range of pH.
| Mineral | Acidic Mechanism | Neutral Mechanism | Alkaline Mechanism | |||||
|---|---|---|---|---|---|---|---|---|
| log k | E | n | log k | E | log k | E | n | |
| K-feldspar * (KAlSi3O8) | −10.06 | 51.7 | 0.5 | −12.41 | 38 | −21.2 | 94.1 | −0.823 a |
| Oligoclase * (Na0.8Ca0.2Al1.2 Si2.8O8) | −9.67 | 65 | 0.457 | −11.84 | 69.8 | - | - | - |
| Andesine * (Na0.6Ca0.4Al1.4 Si2.6O8) | −8.88 | 53.5 | 0.541 | −11.47 | 57.4 | - | - | - |
| Anorthite * (CaAl2Si2O8) | −3.5 | 16.6 | 1.411 | −9.12 | 17.8 | - | - | - |
| Augite * (Ca0.35Mg0.42Fe0.23SiO3) | −6.82 | 78 | 0.7 | −11.97 | 78 | - | - | - |
| Epidote * (Ca2FeAl2Si3O12OH) | −10.6 | 71.1 | 0.338 | −11.99 | 70.7 | −17.33 | 79.1 | −0.556 a |
| Calcite * (CaCO3) | −0.3 | 14.4 | 1 | −5.81 | 23.5 | −3.48 | 35.4 | 1 b |
| Tremolite * (Ca2Mg5Si8O22(OH)2) | −8.4 | 18.9 | 0.7 | −10.6 | 94.4 | - | - | - |
| Albite d ** (NaAlSi3O8) | −10.07 | 58 | 0.34 | −19.29 | 57 | −9.85 | 56 | 0.32 c |
| Muscovite *** (KAlSi3O10(OH)2) | −2.5 | 44 | 0.8 | −5.04 | 45 | −0.3 | 61 | 0.6 c |
| Chlorite **** (Mg5Al2Si3O10(OH)8) | −4 | 30 | 0.74 | −10.32 | 13 | −8.82 | 15 | 0.43 c |
* Palandri and Kharaka [93], ** Marty, Claret [94], *** Lammers, Smith [95], **** Smith and Carroll [96]. a Reaction order with respect to H+ activity. b Reaction order with respect to CO2 partial pressure, it is a carbonate mechanism. c Reaction order with respect to OH− activity. d For albite p1 = 0.48 and q1 = 100 [94]. k: the rate constant in mol.m−2.s−1, E: the activation energy in kJ/mol, n: the reaction order, -: Not available.
Table 2.
Physical properties of composite samples.
| The Composite Samples | Gs | Ss (m2/g) | D10 (μm) | D50 (μm) | D90 (μm) |
|---|---|---|---|---|---|
| D1 | 2.95 | 1.46 | 2 | 12 | 56 |
| D2 | 2.73 | 2.03 | 2.4 | 12 | 47.1 |
| D3 | 2.69 | 1.77 | 2.28 | 11.85 | 46.2 |
| T1 | 2.77 | 1.82 | 2.3 | 11.8 | 48.5 |
Gs: the specific gravity; Ss: the specific surface area; Dx: the grain size such that x% of the particles mass is made of grains finer than the diameter Dx.
Table 3.
Chemical analysis of the composite samples.
| The Composite Samples | Mass Fraction (wt%) | |||||||||
|---|---|---|---|---|---|---|---|---|---|---|
| Ctotal | Al | Ca | Cu | Fe | K | Mg | Mn | Na | Stotal | |
| Detection limit (ppm) | 60 | 90 | 60 | 10 | 10 | 1 | 15 | 15 | 1 | 90 |
| Absolute standard deviation (1SD) (wt%) | 0.03 | 0.49 | 0.075 | 0.016 | 0.4 | 0.26 | 0.043 | 0.004 | 0.12 | 0.048 |
| D1 | 0.36 | 9.4 | 9.09 | 0.04 | 8.1 | 1.1 | 1.9 | 0.06 | 1.78 | 0.23 |
| D2 | 0.25 | 8.97 | 2.07 | 0.13 | 4.5 | 1.5 | 1.4 | 0.03 | 2.78 | 0.45 |
| D3 | 0.37 | 13.5 | 2.34 | 0.02 | 3 | 0.9 | 0.75 | 0.02 | 3.46 | 0.56 |
| T1 | 0.3 | 9.08 | 3.29 | 0.08 | 3.8 | 1.2 | 1.36 | 0.03 | 2.66 | 0.43 |
Publisher’s Note: MDPI stays neutral with regard to jurisdictional claims in published maps and institutional affiliations. |
© 2021 by the authors. Licensee MDPI, Basel, Switzerland. This article is an open access article distributed under the terms and conditions of the Creative Commons Attribution (CC BY) license (https://creativecommons.org/licenses/by/4.0/).
Share and Cite
MDPI and ACS Style
Toubri, Y.; Vermette, D.; Demers, I.; Beier, N.; Benzaazoua, M. Incorporating Kinetic Modeling in the Development Stages of Hard Rock Mine Projects. Minerals 2021, 11, 1306. https://0-doi-org.brum.beds.ac.uk/10.3390/min11121306
AMA Style
Toubri Y, Vermette D, Demers I, Beier N, Benzaazoua M. Incorporating Kinetic Modeling in the Development Stages of Hard Rock Mine Projects. Minerals. 2021; 11(12):1306. https://0-doi-org.brum.beds.ac.uk/10.3390/min11121306
Chicago/Turabian StyleToubri, Youssef, Denys Vermette, Isabelle Demers, Nicholas Beier, and Mostafa Benzaazoua. 2021. "Incorporating Kinetic Modeling in the Development Stages of Hard Rock Mine Projects" Minerals 11, no. 12: 1306. https://0-doi-org.brum.beds.ac.uk/10.3390/min11121306
Note that from the first issue of 2016, this journal uses article numbers instead of page numbers. See further details here.