
The Separation of Carbonaceous Matter from Refractory Gold Ore Using Multi-Stage Flotation: A Case Study


The Robert M. Buchan Department of Mining, Queen’s University, Kingston, ON K7L3N6, Canada
*
Authors to whom correspondence should be addressed.
Minerals 2021, 11(12), 1430; https://0-doi-org.brum.beds.ac.uk/10.3390/min11121430
Submission received: 1 November 2021
/
Revised: 12 December 2021
/
Accepted: 15 December 2021
/
Published: 17 December 2021
(This article belongs to the Special Issue Flotation Reagents, Volume II)
Abstract
:As a pre-treatment method of refractory gold ore, carbonaceous matter (C-matter) flotation was investigated with multi-stage flotation by rougher, scavenger, and cleaner stages. Different dosages of kerosene and MIBC (4-Methyl-2-pentanol) were applied and the optimum dosage was selected by testing in each flotation stage. With the combination of each stage, four circuit designs were suggested, which were a single-stage rougher flotation (R), rougher-scavenger flotation (R+S), rougher-scavenger-scavenger cleaner flotation (R+S+SC), and rougher-rougher cleaner-scavenger-scavenger cleaner flotations (R+S+RC+SC). The results indicated that the scavenger flotation increased C-matter recovery but reduced C-matter grade compared with single-stage rougher flotation. Cleaning of the scavenger flotation concentrate improved C-matter grade significantly, but reduced recovery slightly. Cleaning of the rougher flotation concentrate achieved overall improved selectivity in flotation. A combination of rougher-scavenger flotation followed by cleaning of both concentrates (R+S+RC+SC) resulted in 73% C-matter recovery and a combined cleaner concentrate grade of 4%; the final tailings C-matter grade was 0.9%, where the C-matter remaining in the tailings was locked, and fine grained. The results demonstrate the need for the multi-stage flotation of C-matter from refractory gold ore to achieve selective separation and suggested the potential of C-matter flotation as the pre-treatment for efficient gold production.
1. Introduction
Refractory gold ore, which shows poor gold recovery by cyanidation, typically contains one or all of the following: (1) carbonaceous matter (C-matter), which causes preg-robbing; (2) locked gold in sulfides/silicates, and (3) cyanide/oxygen consumable matter, such as copper or sulfidic material [1,2,3]. The ore used in this study is typical refractory gold ore—containing C-matter and locked gold in sulfide minerals—from Barrick’s Goldstrike Mine, NV, USA. In practice, the ore is treated by alkaline pressure oxidation (POX) to liberate gold from sulfides, followed by thiosulfate gold leaching to avoid the preg-robbing effect caused by the presence of C-matter. However, the process still struggles with low gold leaching efficiency (59%), which has generated interest in the development of a modified or alternative process. Roasting, flotation, chemical oxidation, pressure oxidation, bio-oxidation, and ultrafine grinding have been investigated as pre-treatment processes for refractory gold ore [4,5]. In the flotation of C-matter from gold ore, C-matter with low gold concentration is separated and then discarded, while C-matter possessing high gold concentration is treated by roasting before extracting gold by cyanidation [4,6,7]. The main objective of this study was to separate C-matter from refractory gold ore with high recovery and selectivity such that the C-matter concentrate can be treated in a Goldstrike roaster, which features limited capacity. Thus, the mass of the C-matter concentrate must be low, while removing as much C-matter as possible from the feed to pressure oxidation; the flotation tailing can then be treated in an autoclave to oxidize sulfides and liberate more gold, followed by the thiosulfate leaching for gold extraction. By roasting C-matter concentrate, more gold can be liberated from the C-matter, which is not decomposed by the present process, leading to better gold production. The gold recovery from the tailing may not be improved because it is treated by the same procedure of alkaline POX, followed by thiosulfate gold leaching; however, the finer particle size for the flotation than the present process (P80 size of Alkaline POX discharge: 56.5 μm) could result in greater liberation of sulfide and gold, leading to higher oxidation efficiency and gold recovery. Through the proposed process, all gold in the ore is processed, but this is carried out separately by each effective treatment on the concentrate and tailings.
Due to the natural hydrophobicity of C-matter, flotation without collector (pre-flotation) can be carried out for its separation. However, it has been reported that collector-less flotation results in low selectivity, insufficient recovery, and high consumption of frother [8]; the use of collector in combination with frother contributed to improved performance. In the flotation of C-matter, adding diesel as collector increases both recovery and kinetics, and lowers the amount of frother (typically MIBC; 4-Methyl-2-pentanol) required for effective flotation by preventing MIBC adsorption on the surface of particles [8,9]. Fuel oils, such as kerosene and diesel, result in improved recovery by increasing hydrophobicity. However, overdosing the collector leads to poor selectivity by collecting more minerals or ash (in the case of coal flotation), either through the recovery of middling particles, or through hydraulic entrainment [10,11]. For C-matter flotation, the combination of a conventional oil collector and alcohol frother achieves a satisfactory result; however, the optimum dosage should be determined for high selectivity and sufficient recovery.
Flotation performance is influenced by the conditions in each stage, and by the circuit’s configuration and design—the optimum design is determined by simulation and/or testing [12,13]. For most types of ore, a multi-stage flotation circuit (i.e., a combination of rougher/scavenger/cleaner) is required to accomplish better separation efficiency [13,14,15]. Calisaya et al. [12] compared five alternative circuits obtained by simulation and showed that the optimum metallurgical conditions (e.g., reagent dosages, additional milling, scraping speed) in each stage are all same regardless of the circuit design. However, with the selected optimum conditions, the overall performance is changed by the circuit design. Sutherland [13] determined that the best performance is achieved when the circuit is arranged as rougher and cleaner with equal residence time. The simulation results indicated that the addition of a cleaner flotation stage improved the flotation selectivity with the kinetic rate limited flotation and non-selective detachment conditions; in addition, the number of cleaner stages for the further selectivity improvement is determined by the middling contents [15]. In coal column flotation testing, the highest separation efficiency is attained using either a rougher-scavenger-scavenger-cleaner or a rougher-scavenger-cleaner flotation configuration [14]. In graphite flotation with scrubbing treatment for high selectivity, more stages of cleaner flotation only resulted in decreased recovery, with no improvement in grade [16]. The study concludes that the efficacy of the cleaner flotation is influenced by the nature of the feed-to-cleaner circuit. For the best flotation performance, both the optimization of each stage flotation and the investigation of the flotation circuit design should be considered.
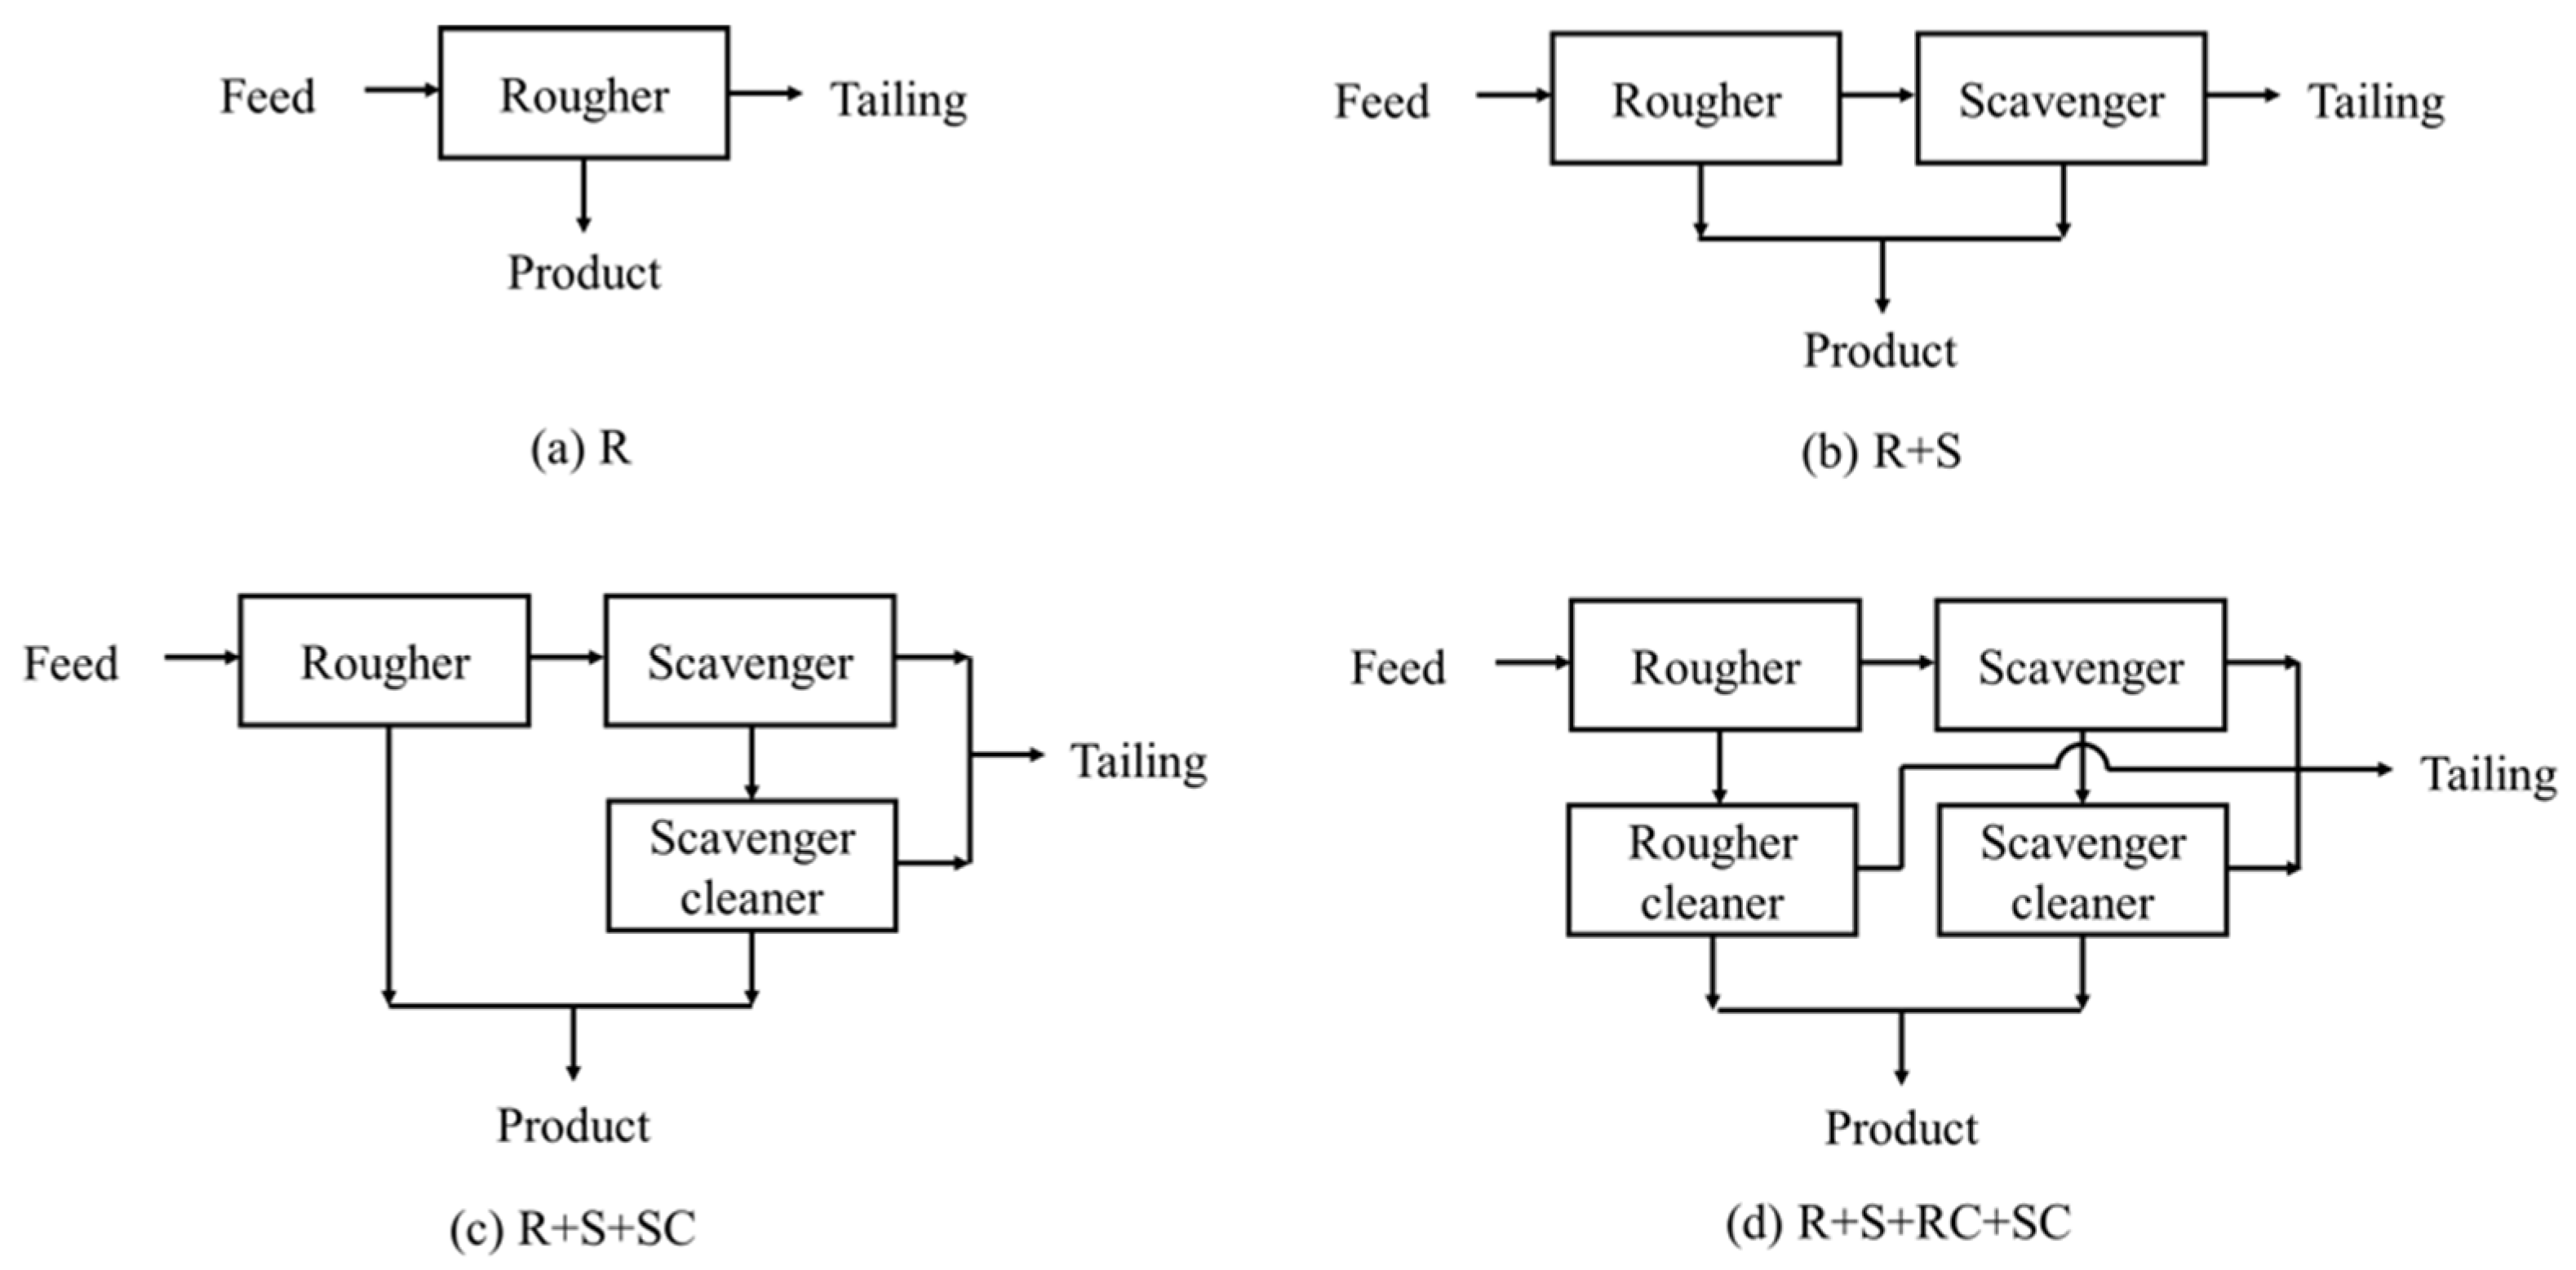
In typical flotation circuits, the rougher and scavenger concentrates are combined to form the feed-to-cleaner flotation. However, in this study, the cleaner flotation for the rougher concentrate and the scavenger concentrate was carried out separately to evaluate the effectiveness of different circuit configurations using a limited number of tests. Considering this, four flotation circuit designs were evaluated to assess their potential for recovery of C-matter from Goldstrike’s double refractory gold ore (Figure 1): (1) single-stage rougher flotation (R), (2) rougher flotation followed by scavenger flotation (R+S), (3) rougher-scavenger flotation followed by cleaning of the scavenger concentrate (R+S+SC), and (4) rougher-scavenger flotation followed by cleaning of the rougher and scavenger concentrates, separately (R+S+RC+SC). In addition, the optimum conditions of each stage were determined by testing different reagent dosages. The flotation products from each configuration were evaluated in terms of overall C-matter recovery and combined concentrate grade.
This study aims to determine the best flowsheet to separate C-matter from the gold ore with the highest selectivity; the purposed recovery and grade were above 90% and 10%, respectively. To perform selective and efficient C-matter flotation, each stage of flotation was carried out with different reagent conditions (selected to achieve the best performance), and the results were compared for the different circuit configurations to identify the circuit design yielding the best selectivity.
2. Materials and Methods
2.1. Materials
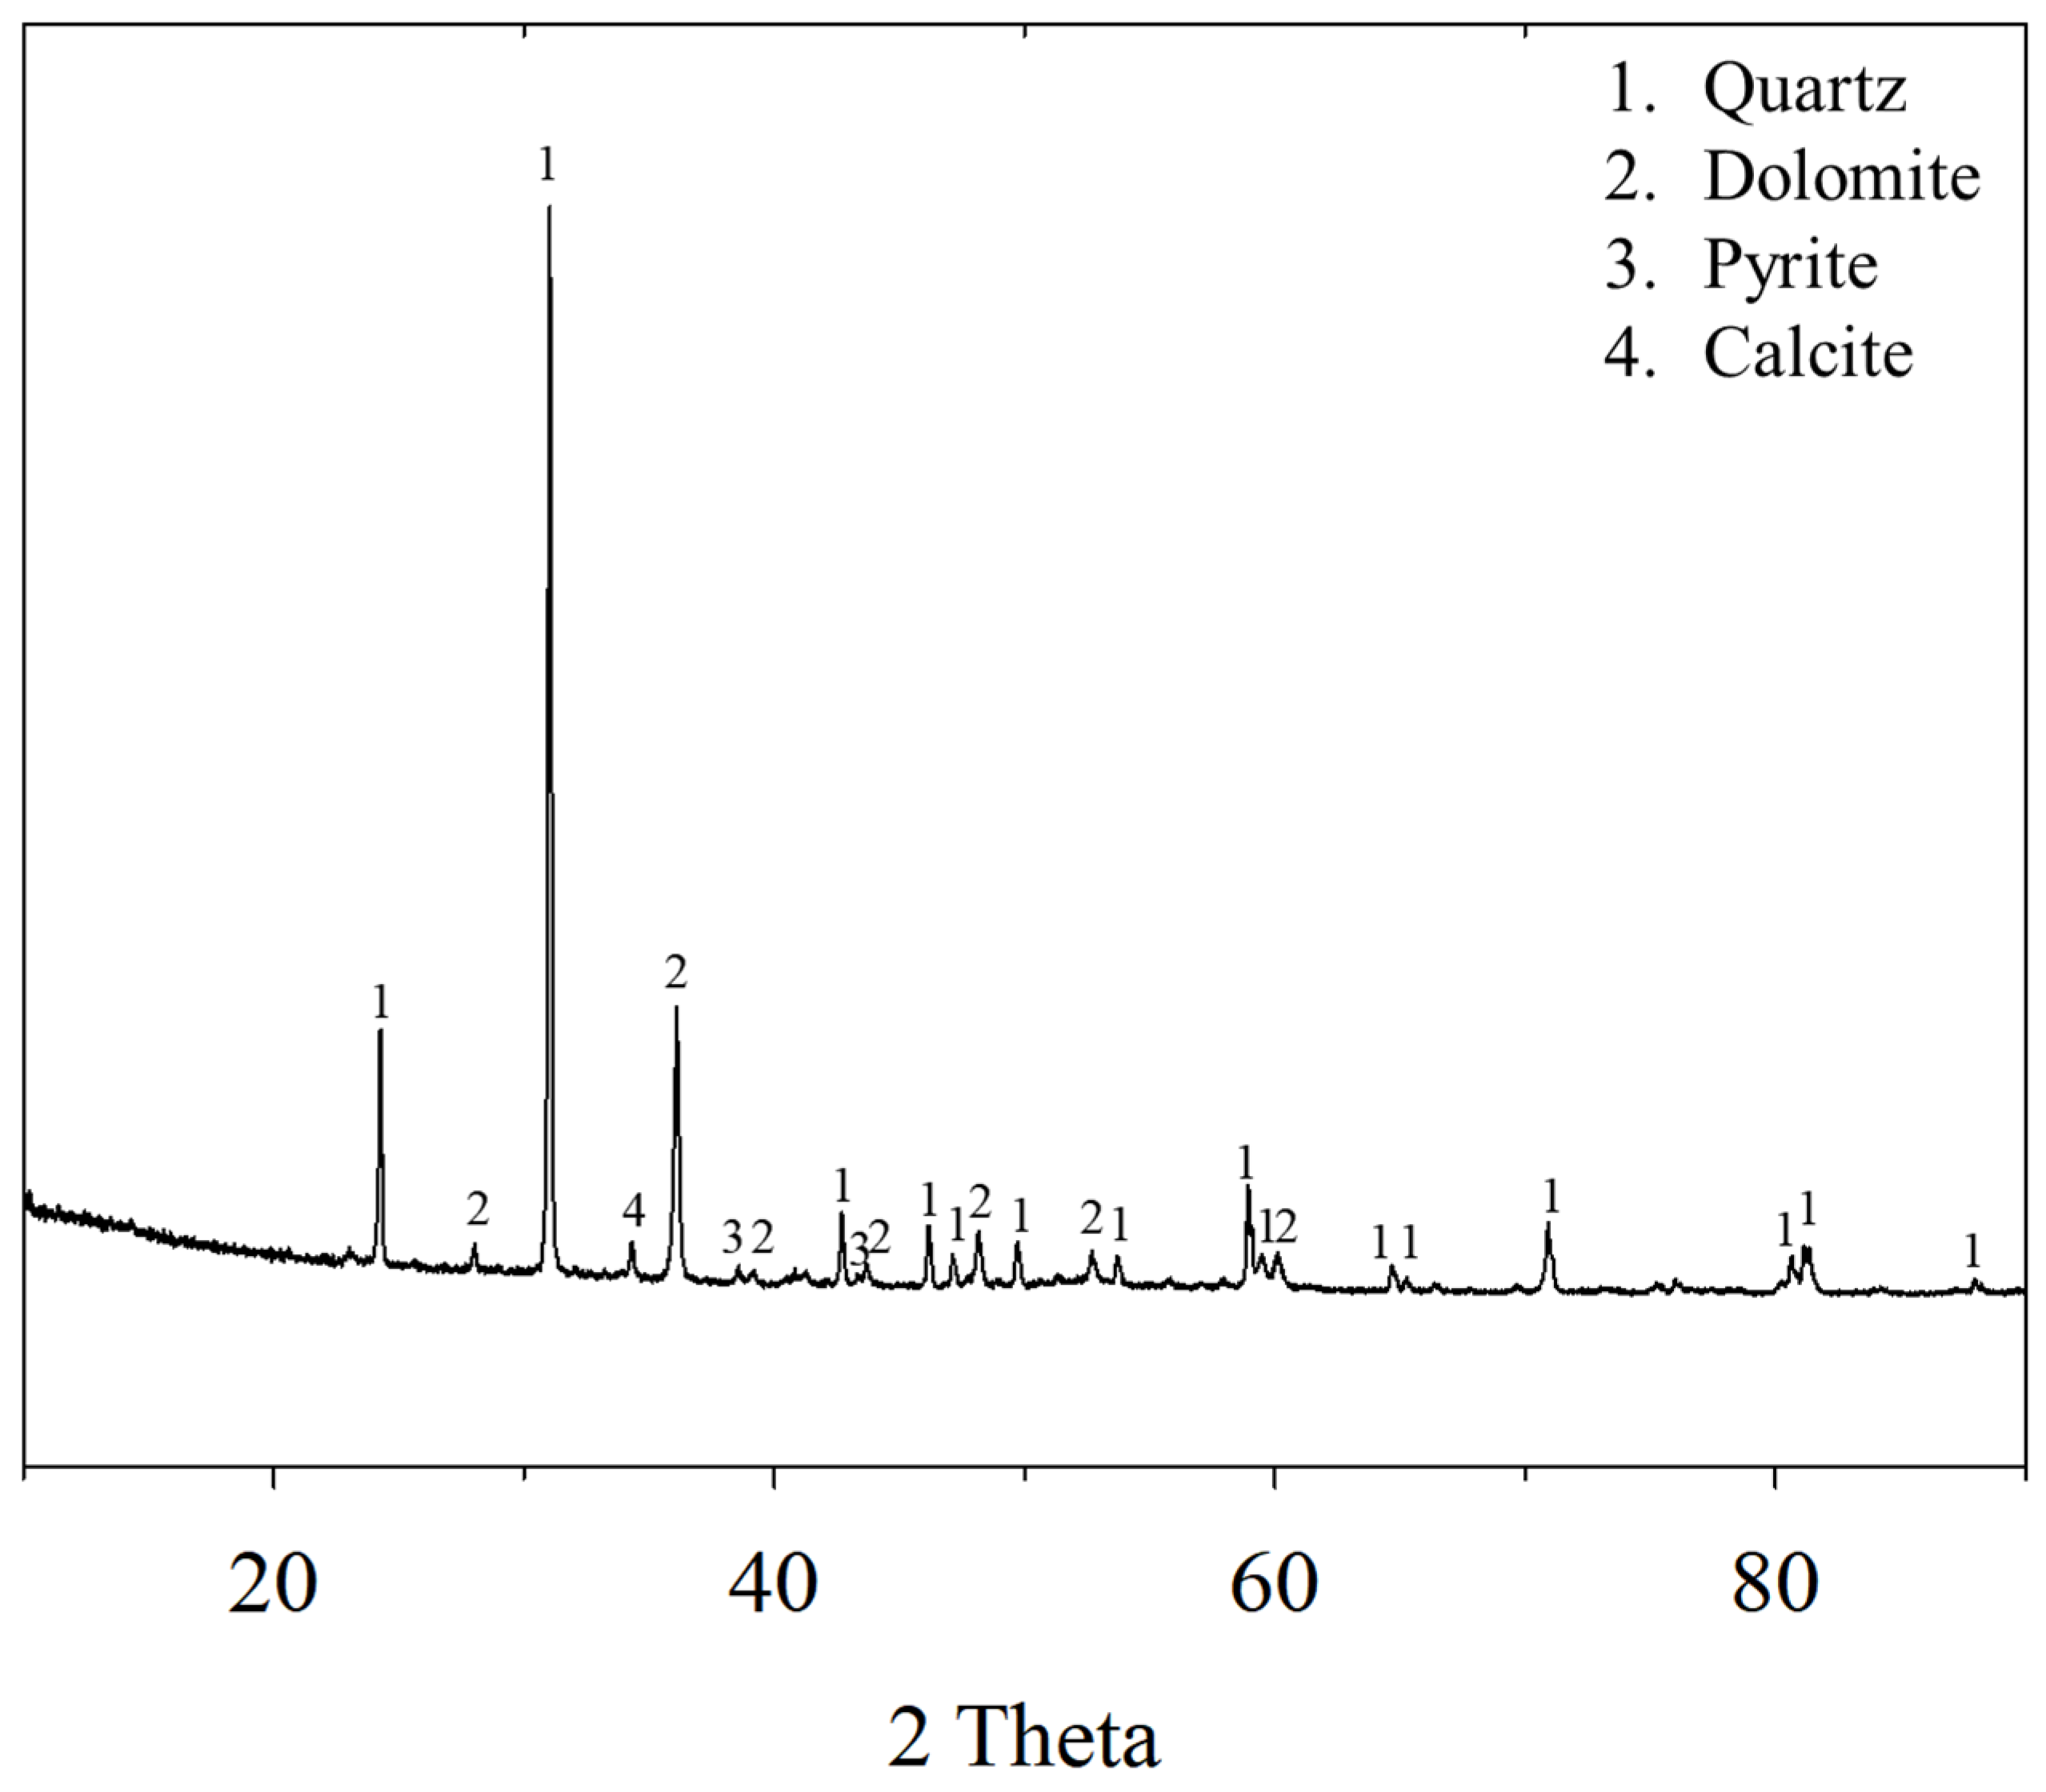
The sample ore from the Goldstrike mine mainly consisted of quartz, dolomite, and minor quantities of pyrite and calcite, as analyzed by X-ray diffraction (XRD) (Figure 2). Additional analysis was carried out to determine other element contents, which were not detected by XRD. Carbon and sulfur (by ELTRA, CS 2000, Haan, Germany), peroxide fusion, fire assay, and inductively coupled plasma-optical emission spectrometry (ICP-OES, PerkinElmer, MA, USA) analysis indicated that the sample contained gold, sulfur, and carbon as well as other elements (Table 1). In addition, the sample featured 252 ppm of As, 347 ppm of Cr, 165 ppm of Mn, 447 ppm of V, and 340 ppm of Zn and minor quantities (<100 ppm) of other elements.
2.2. Method
Rougher and scavenger flotations were performed followed by cleaner flotation for each concentrate (Figure 3). Rod mill (400 mm × 175 mm) grinding was carried out prior to flotation testing to reduce the particle size with 11 kg of various size rods for 10/15/20 min at 33 wt.% solids. The Denver laboratory flotation machine performed all the flotation tests. Kerosene (>99%, Fisher Chemical™, Hampton, USA) and methyl isobutyl carbinol (MIBC) (4-Methyl-2-pentanol, 98%, Sigma-Aldrich, Saint Louis, USA) were selected as the collector and frother, respectively.
Additionally, a laboratory-stirred media mill (PE 075, Netsch, Shanghai, China) was used as the further fine grinding for the determination of the limited flotation performance.
2.2.1. Rougher Flotation
The rougher flotation was carried out with different particle sizes (P80: 36.5, 44.6, and 67.7 μm) and reagent dosages (Kerosene: 50/100/200/300/500 g t−1; MIBC: 30/60/90/120/150 g t−1). The ground ore was mixed with tap water at 25 wt.% solids for 3 min, then kerosene and MIBC were added into the 2.5 L cell and conditioned for 1 min at 1200 rpm. The froth was collected at different time intervals (0.5/1.5/2.5/4.5/6.5 min). The impeller speed was 1200 rpm for both the conditioning and the froth collection.
2.2.2. Scavenger Flotation
Following the rougher flotation, tap water (200 mL) was added to increase the water level. Different dosages of kerosene (70/210/350 g t−1) and MIBC (21/42/63 g t−1) were added to the 2.5 L flotation cell. The conditioning time was again 1 min for kerosene and MIBC and separate froth products were collected as flotation time elapsed (0.5/1.5/2.5/4.5 min). The impeller speed was 1200 rpm for both conditioning and froth collection.
2.2.3. Cleaner Flotation
For each rougher and scavenger concentrate, the cleaner flotation was conducted with additional water (500 mL for rougher cleaner and 350 mL for scavenger cleaner) and reagents in a 1.0 L flotation cell at 1200 rpm. For rougher cleaner flotation, 36–108 g t−1 of kerosene and 11–32 g t−1 of MIBC were added with 1 min of conditioning time for each, and flotation was performed for a total of 4.5 min with separate concentrate products collected after 0.5, 1.5, 3.0, and 4.5 min. Scavenger cleaner flotation was conducted with 42–125 g t−1 of kerosene and 11–32 g t−1 of MIBC for 1 min of conditioning each; the froth was collected for a total of 3 min with separate concentrate products collected after 0.5, 1.5, and 3.0 min.
Each concentrate and tailing product was dried, then weighed. The C-matter was determined as total carbon content, except for carbon from carbonate. For the analysis of the C-matter, HCl dissolution was carried out on a representative subsample. A 3 g subsample was dissolved in 20% HCl solution (Certified ACS Plus, 36.5 to 38.0%, Fisher Chemical) at 60 °C for 1 h. The dissolved sample was filtered, then washed well with deionized water (D.I water). A C/S analyzer (ELTRA, CS 2000) was used to determine the carbon and sulfur contents of the samples before and after HCl dissolution. For the kinetics study, the classical first order model was fit to the test results (Equation (1)).
R is recovery, R∞ is the ultimate recovery with infinite time, and k is the rate constant (min−1).
R = R∞(1−e−kt)
3. Results and Discussion
3.1. Rougher Flotation
In rougher flotation, across the conditions tested, C-matter recovery ranged from 40% to 70%, with grades between 2% and 4% (Table 2). Tests 7, 9, 10, and 11 showed higher C-matter recovery (>67%) than the others. Tests 7, 9, 10 and 11 featured finer particle sizes (P80: 36.5 μm) and resulted in a higher concentrate grade, attributed to higher MIBC dosages between 60 to 150 g/t (Table 2). Tests 5–7 were conducted with the same reagent dosages, but the feed particle size distribution varied; as the particle size decreased, recovery increased. The concentrate grade was the lowest in the intermediate size range tested (P80: 44.6 μm; Test 6), likely resulting from a combination of fine particles and poor liberation. As the particle size decreases, the entrainment factor increases, leading to reduced selectivity [17,18]. However, the flotation rate and recovery tend to increase as liberation improves with finer size while the recovery of gangue (carbonate and silicate) decreases [19,20]. Thus, the results showed that as the particle size decreased from a P80 of 67.7 µm to a P80 of 44.6 µm, gangue entrainment increased with the minor change in mineral liberation, leading to a decrease in the concentrate grade. However, when the particle size was further reduced to a P80 of 36.5 µm, improved liberation resulted in slightly higher recovery and grade through the reduction of gangue recovery. In Test 8, C-matter recovery was significantly lower (51%) with the fine particle size (P80: 36.5 µm). This result was due to a low dosage of MIBC (30 g t−1), which was insufficient to form stable froth and small bubbles. Further information on the effect of MIBC dosage on C-matter flotation recovery from Goldstrike’s ore is detailed in a separate study [21]. Significantly lower recovery (41%) with 30 g/t of MIBC was also observed in Test 12, with coarser feed. Additionally, C-matter recovery was low with coarser feed material (P80: 67.7 μm) in Tests 1 and 2, with a low dosage of kerosene (50 and 100 g t−1). Hence, in rougher flotation, it was concluded that a sufficient reagent dosage and finer feed particle sizes were required to obtain high C-matter recovery.
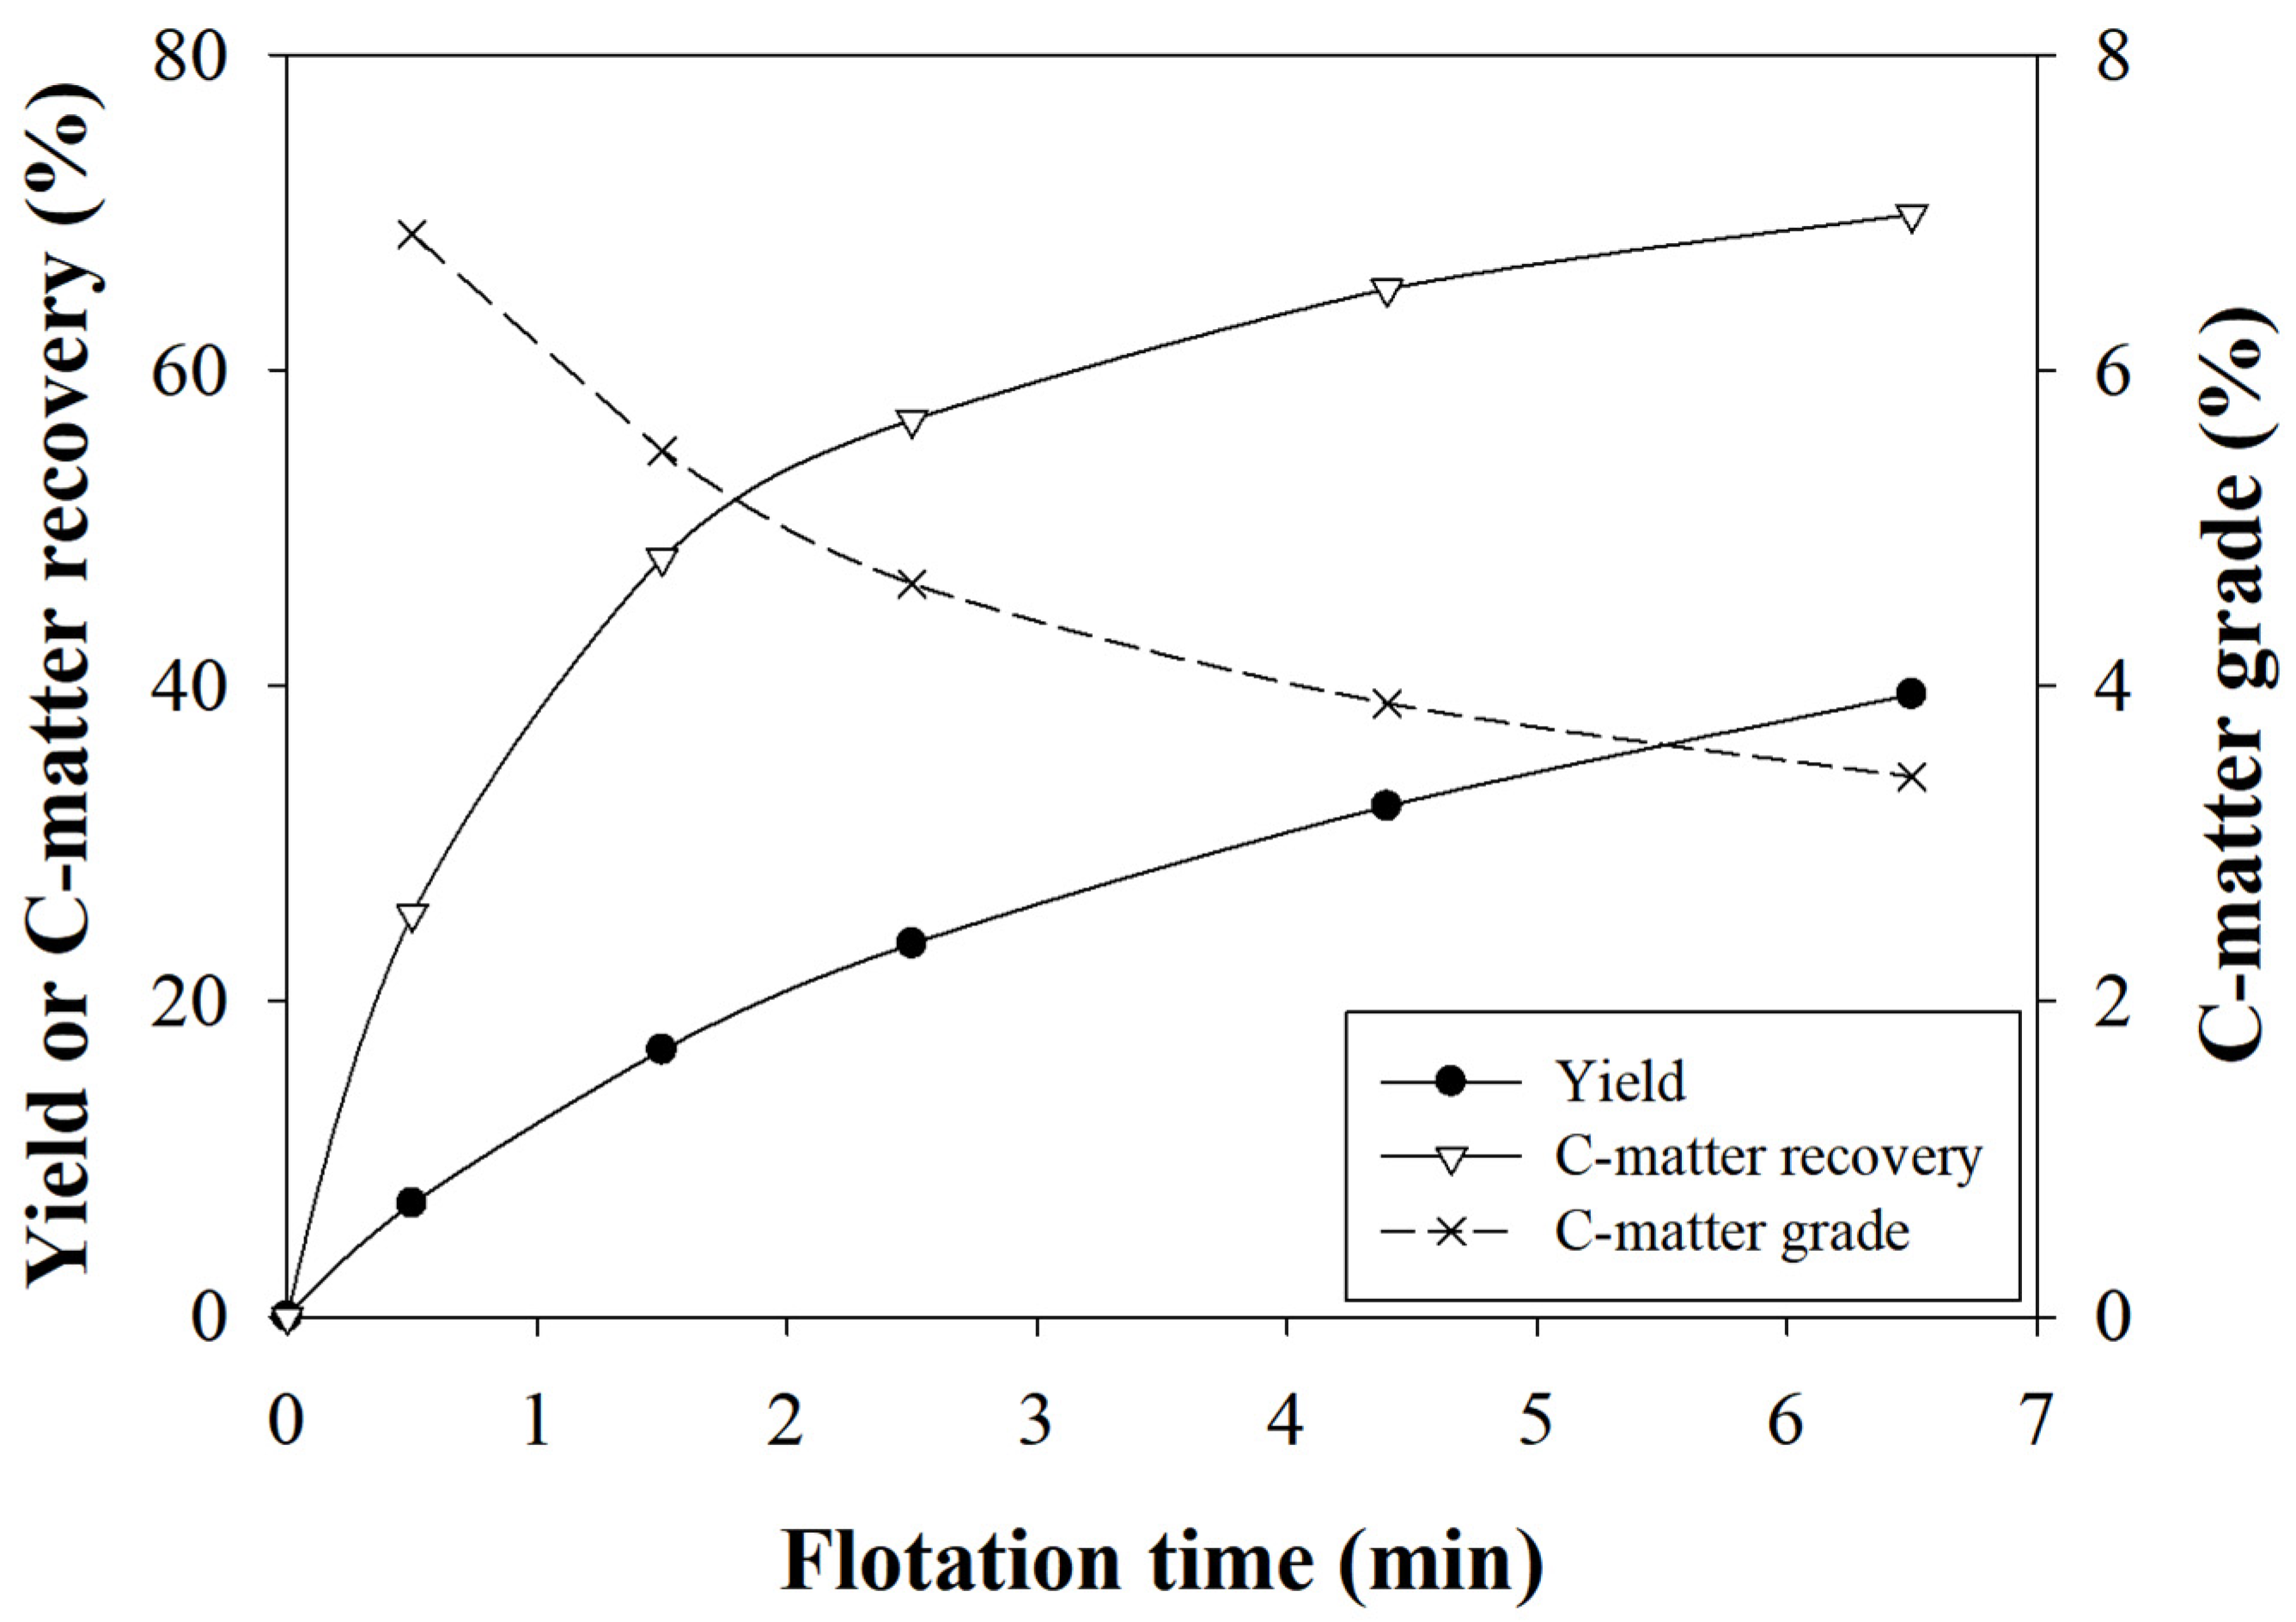
The purpose of the rougher flotation was high C-matter recovery; thus, Test 10 was selected as the optimal conditions for rougher flotation, as this test corresponded to maximum recovery (69.87%), with a high C-matter grade (3.42%) in the rougher concentrate. Test 11 also resulted in high recovery (70.09%) with high grade (3.62%); however, the difference in recovery and grade was insignificant and Test 10 was chosen as it used a lower MIBC dosage (120 g/t). Figure 4 describes the flotation results again with yield and grade; both the C-matter recovery and yield increased together with the increased flotation time, but after 2.5 min, the increased C-matter recovery began to plateau, while the yield continued to increase. Above this point, further improvement in selectivity was not possible. Thus, the flotation time for the rougher flotation was limited to 2.5 min for subsequent test work.
3.2. Scavenger Flotation
Additional kerosene and MIBC effects were investigated in the scavenger flotation testing. The scavenger overall recovery—the recovery in the scavenger as a function of the feed-to-rougher flotation is presented in Table 3. In the contrast to the rougher flotation showing a 30% difference in recovery, the scavenger overall recovery saw limited change as a function of reagent dosage (the variation in recovery was less than 4% between all the conditions tested). The limited change to the C-matter recovery with different reagent dosages could be attributed to the presence of residual reagents from the rougher flotation and the low floatability of the remaining particles. In the rougher flotation, the most floatable particles are collected first, leaving behind locked or middling particles, which are more difficult to float [22]. Thus, the limited floatability, likely resulting from the locked or composite particles, led to minimal change in C-matter recovery in the scavengers with changes to the reagent dosage.
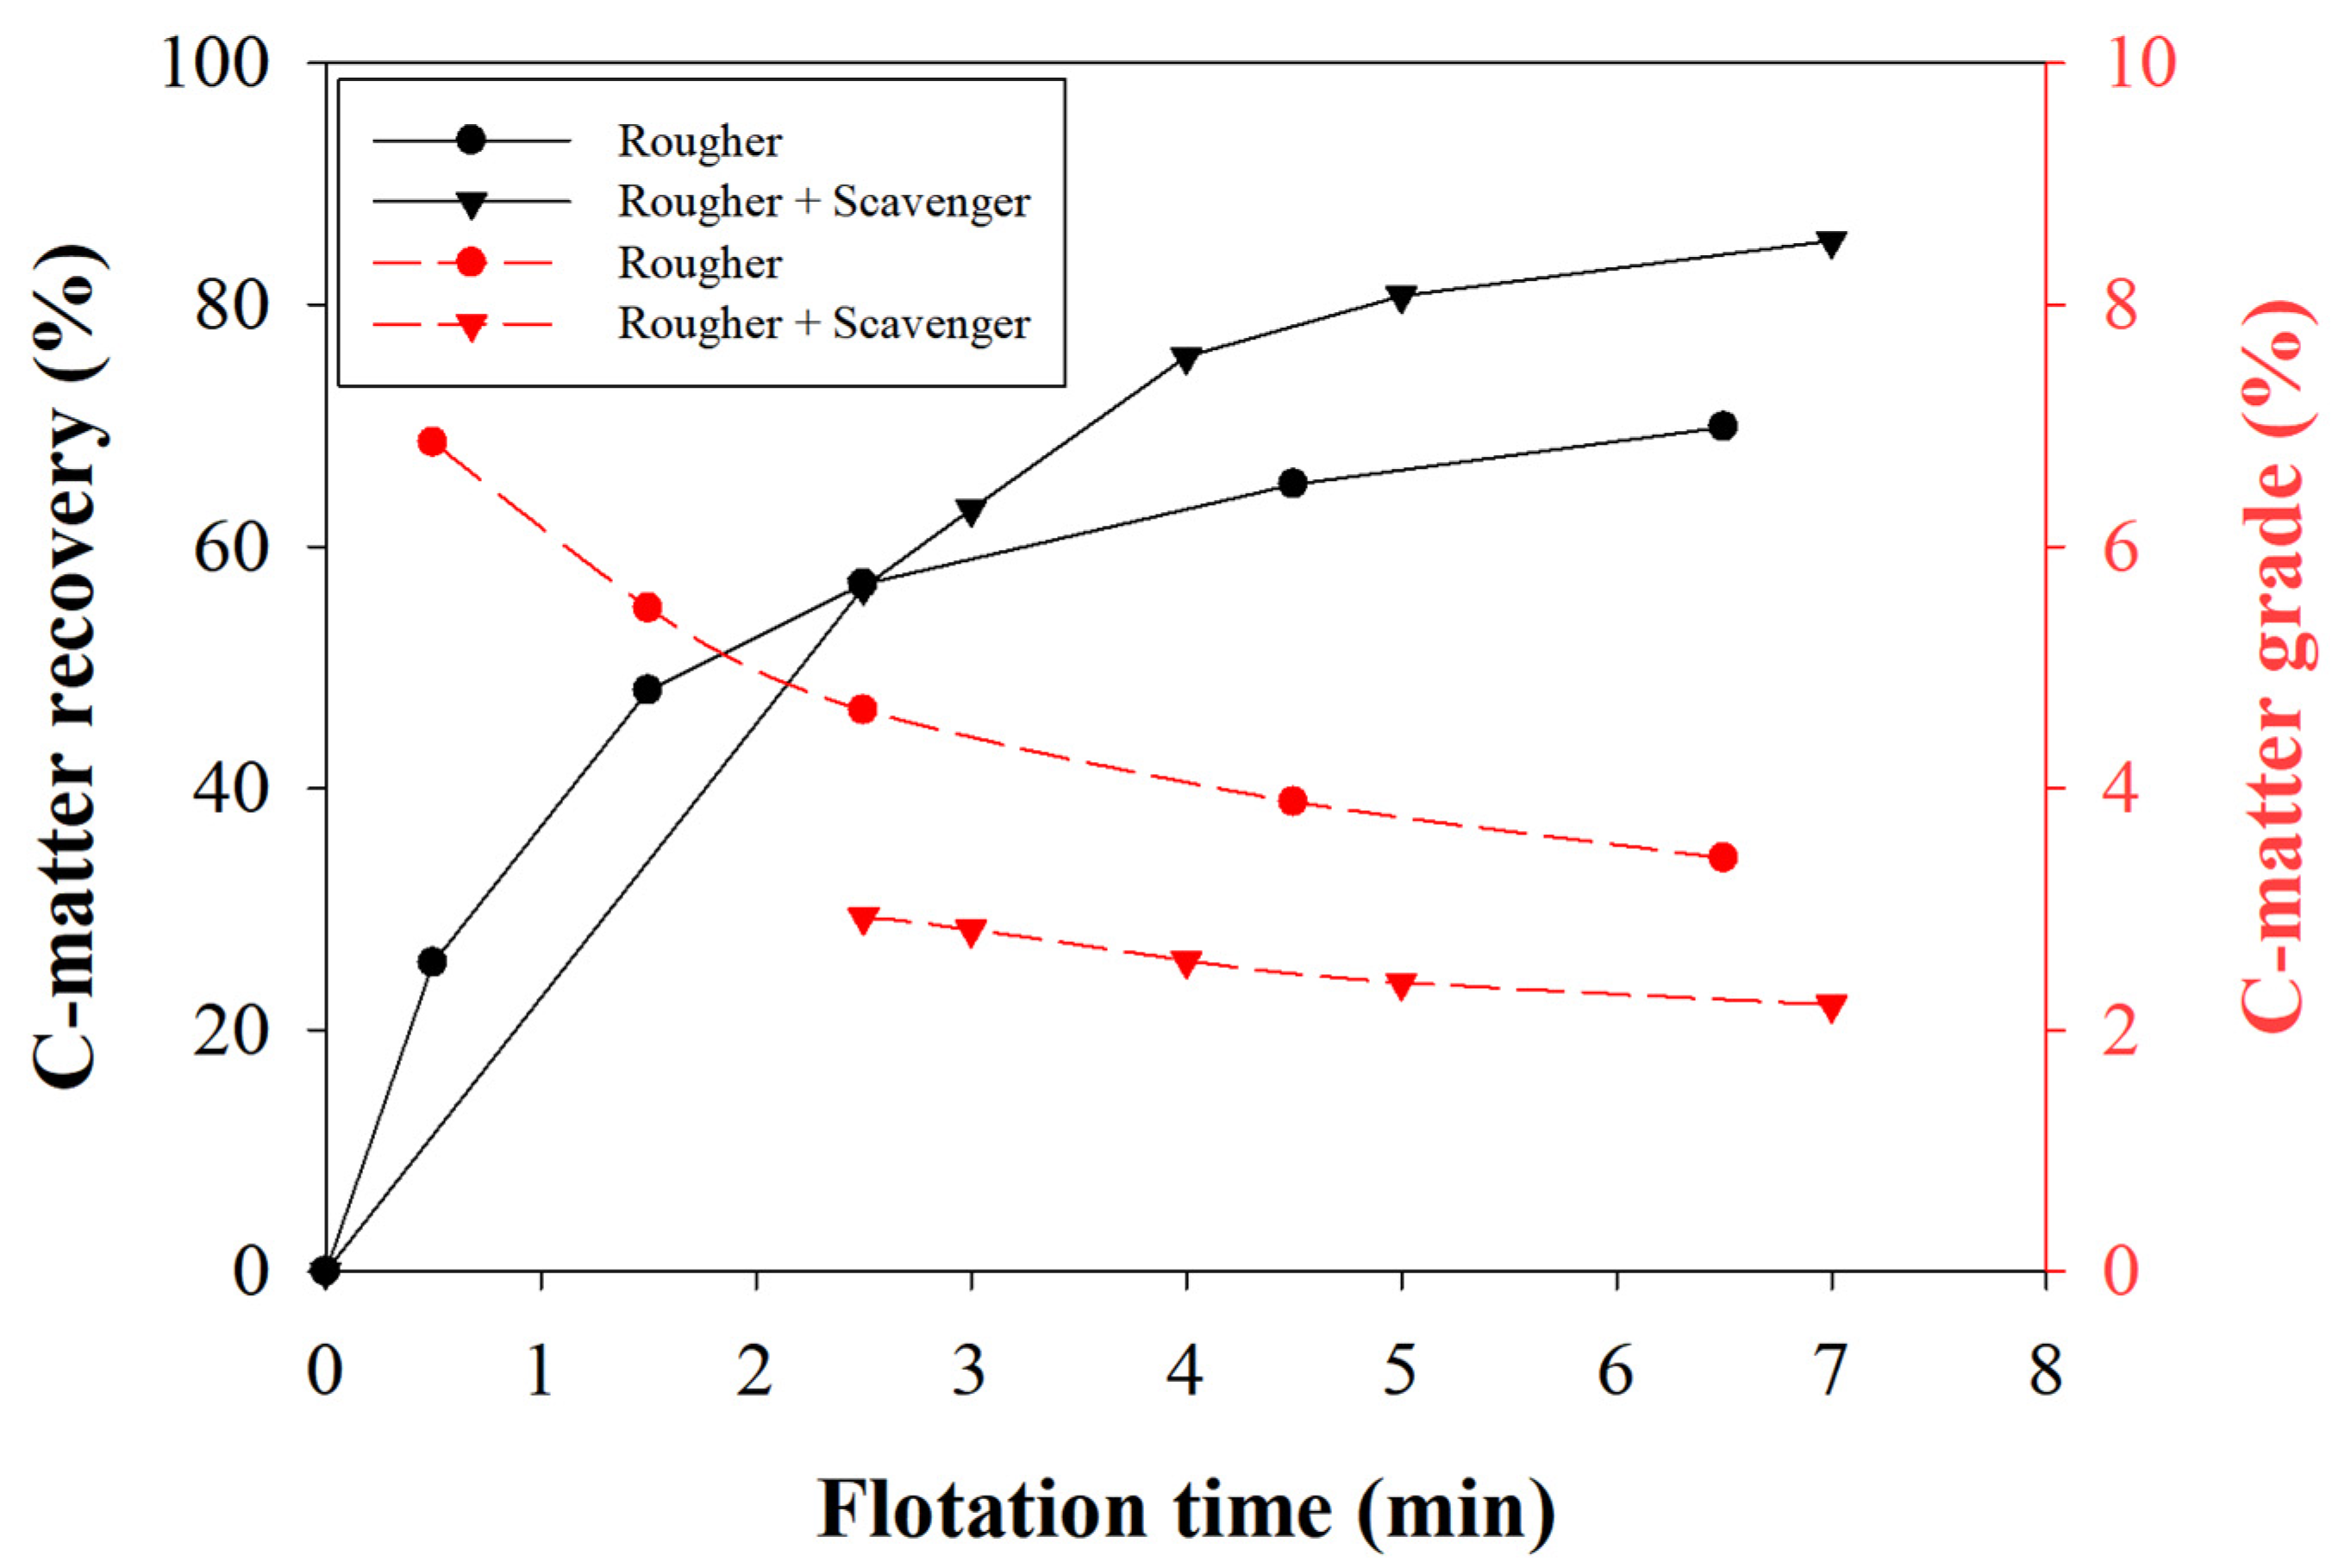
Although the influence of the reagent dosage on the recovery in the scavenger was weaker than in the rougher flotation, the scavenger helped to collect more C-matter than with a single rougher flotation stage (Figure 5). The additional kerosene and the longer conditioning time likely increased the hydrophobicity of slow-floating middling particles, increasing their floatability. The selected test results for the highest recovery in the scavenger are presented in Figure 5, along with the rougher results; however, the C-matter grade was much reduced by the scavenger flotation. This resulted from the collected higher grade matter in the rougher stage and the greater entrainment in the scavenger stage.
3.3. Cleaner Flotation
The cleaner flotation for each rougher concentrate (C-matter recovery mean: 52.04%; std.dev: 1.65%) and scavenger concentrate (C-matter recovery mean: 27.04%; std.dev: 2.99%) was carried out with the further addition of reagents. Changes to the reagent dosage had a minor effect on cleaner flotation performance. The rougher cleaner showed a higher stage recovery (90–94%) compared with the scavenger cleaner (84–89%). The test conditions that resulted in the highest selectivity were 36 g t−1 of kerosene and 11 g t−1 of MIBC for the rougher-cleaner and 83 g t−1 of kerosene and 11 g t−1 of MIBC for the scavenger-cleaner. Under these conditions, in the rougher cleaner, the stage recovery was 90.11%, corresponding to 45.95% overall recovery with 5.18% grade. The scavenger-cleaner flotation required more kerosene (83 g t−1) to achieve an 86.68% stage recovery (overall recovery 26.27% with 2.87% grade).
3.4. Comparison of Flotation Circuit Configurations
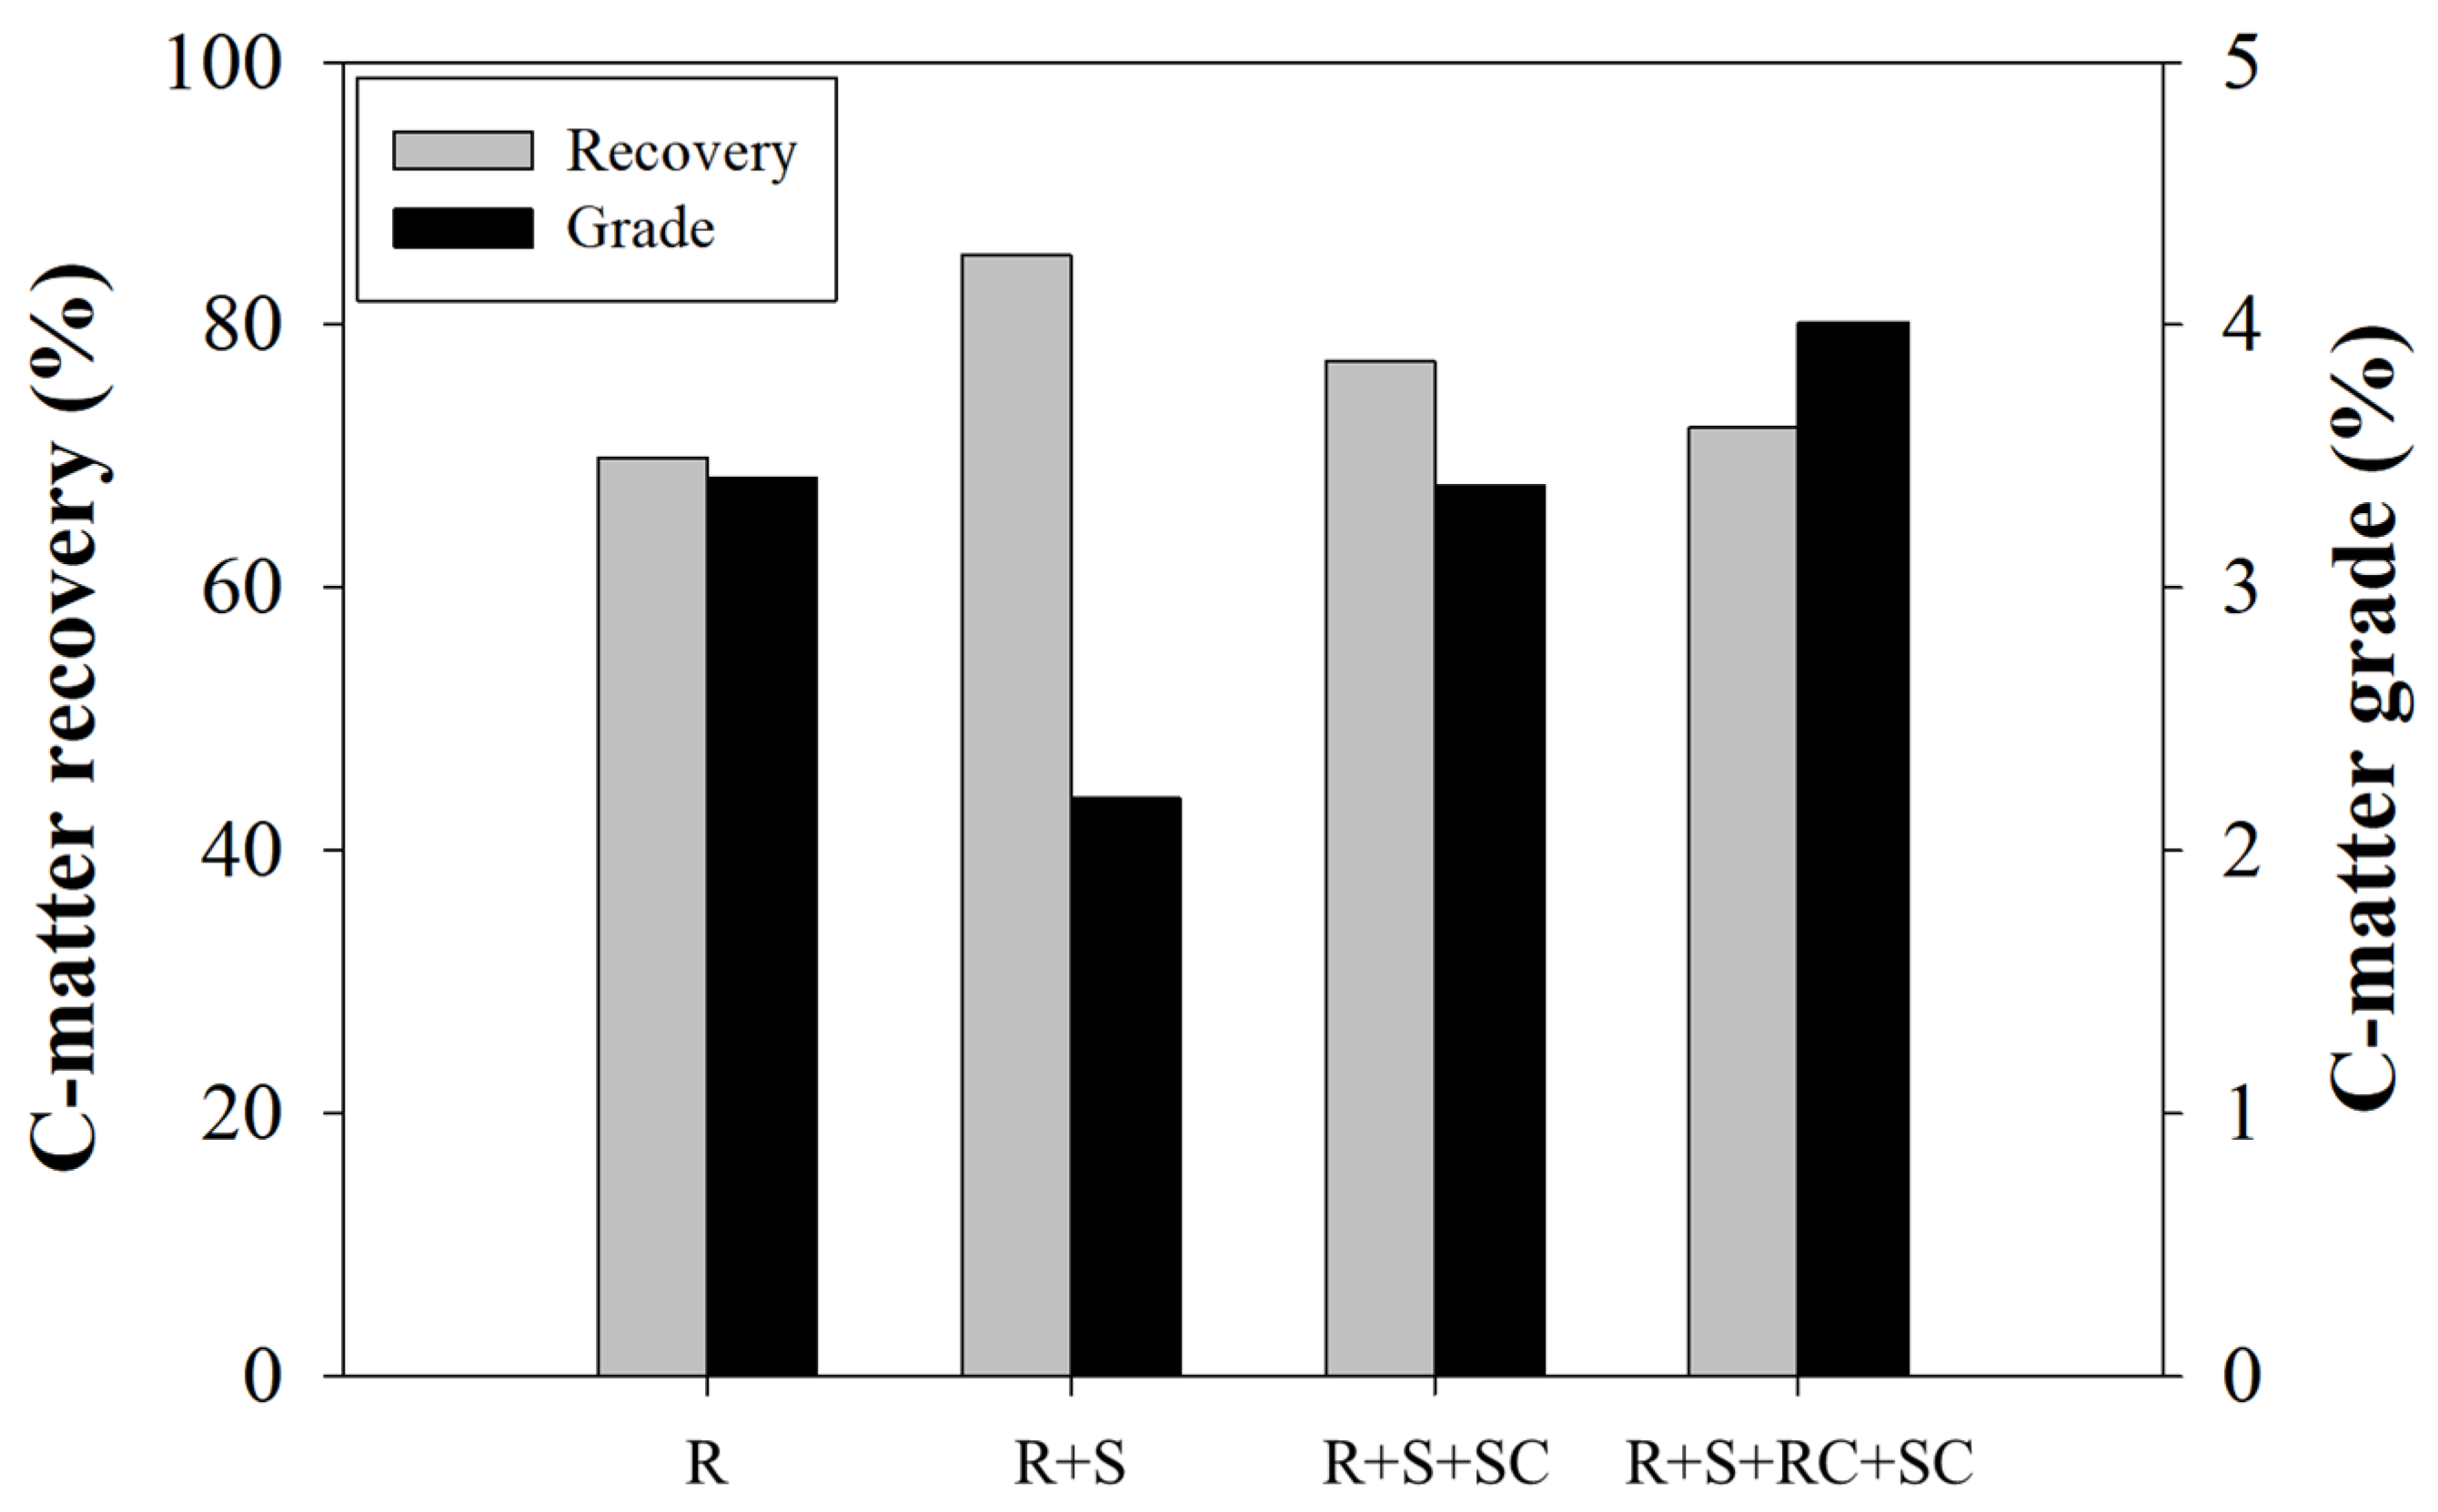
The flotation circuit design options are described in Figure 1. The flotation performances in each circuit were compared in terms of C-matter recovery and grade (Figure 6). The R+S flowsheet resulted in higher C-matter recovery (85.31%) than the single-stage flotation (R: 69.87%), although increased recovery corresponded to a reduction in C-matter grade from 3.42% to 2.20%. This was due to the increased recovery of the middling particles and hydraulic entrainment during the scavenger flotation. As more middling particles collected, the C-matter recovery increased. However, it also reduced the concentrate grade. With the scavenger cleaner flotation (R+S+SC), C-matter recovery decreased (77.26%) compared with R+S flotation; however, it upgraded the C-matter concentrate to 3.39%, suggesting that the scavenger cleaner flotation stage was necessary for effective separation. This can be attributed to the difference in the kinetics. The increase in the grade at the cleaner stage is discussed with the kinetics in the next section. By adding a rougher cleaner flotation stage, C-matter recovery decreased again to 72.22% with a further improvement in concentrate grade (4.01%), which was a higher recovery and grade than the single-stage flotation (R). Again, the cleaner stage had an effect on the improvement of the grade from rougher concentrate, but the increased grade was less than the scavenger cleaner. This was attributed to the reduced middling recovery and the entrainment in the rougher concentrate compared with the scavenger concentrate.
Overall, by adding a cleaner flotation stage, the selectivity was greatly improved. The flotation rate constant was obtained by using Equation (1), indicating that the cleaner flotation had a higher flotation rate constant than the rougher flotation (Figure 7). Thus, in the cleaner flotation, much faster flotation kinetics with shorter flotation times resulted in high selectivity by reducing the recovery of middling, composite particles, or gangue, which have slower kinetics. Additionally, the rougher cleaner stage was generally faster than the scavenger cleaner. This result can also be attributed to the presence of more liberated C-matter having lower attachment times in the rougher cleaner feed than in the scavenger cleaner feed (Figure 7b) [20]. The faster flotation kinetics with higher dosages of kerosene in the scavenger cleaner indicated that the kerosene improved the collection of high C-matter composite matter, which led to higher selectivity.
In this study, the cleaner flotation was effective for the further improvement of the selectivity. In a simulation study, conducted by Honaker and Mohanty, on column flotation for fine coal cleaning, it was shown that the efficacy of the cleaner stage depends on the non-selective detachment conditions and the collected amount of middling [15]. Thus, the scavenger flotation may help to collect more C-matter, which was detached during the rougher stage. However, the scavenger flotation collected middling as well, leading to reduced grade. Improved selectivity in the scavenger cleaner flotation stage indicated that the more middling and gangue were collected as scavenger concentrate; middling and gangue were rejected in the cleaner stage.
3.5. The Investigation of the Limited Flotation Performance
A superior flotation performance was achieved through multi-stage flotation than through single-stage flotation. However, even under the most promising flotation conditions, C-matter recovery was less than 90% and the flotation concentrate grade was less than 10%. Less than the aimed flotation performance could be attributed to the poor liberation of C-matter in the feed even at a fine grind size (P80: 36.5 μm). For the determination, mineral liberation analysis (MLA) was attempted; however, MLA was not able to detect the qualified C-matter. This may be because of the low concentration of C-matter in the feed (1.95%), the fine grain size of the C-matter, and the complex mineralogy, again supporting the theory that the ore comprised very finely disseminated C-matter. The particle size analysis (P80 value) results showed that the rougher concentrate was finer than the scavenger concentrate, and all the concentrates featured smaller particle size than tailings (Table 4). This may suggest that the floatability was related to the particle size, with increased floatability at finer particle sizes due to better liberation of finely disseminated C-matter.
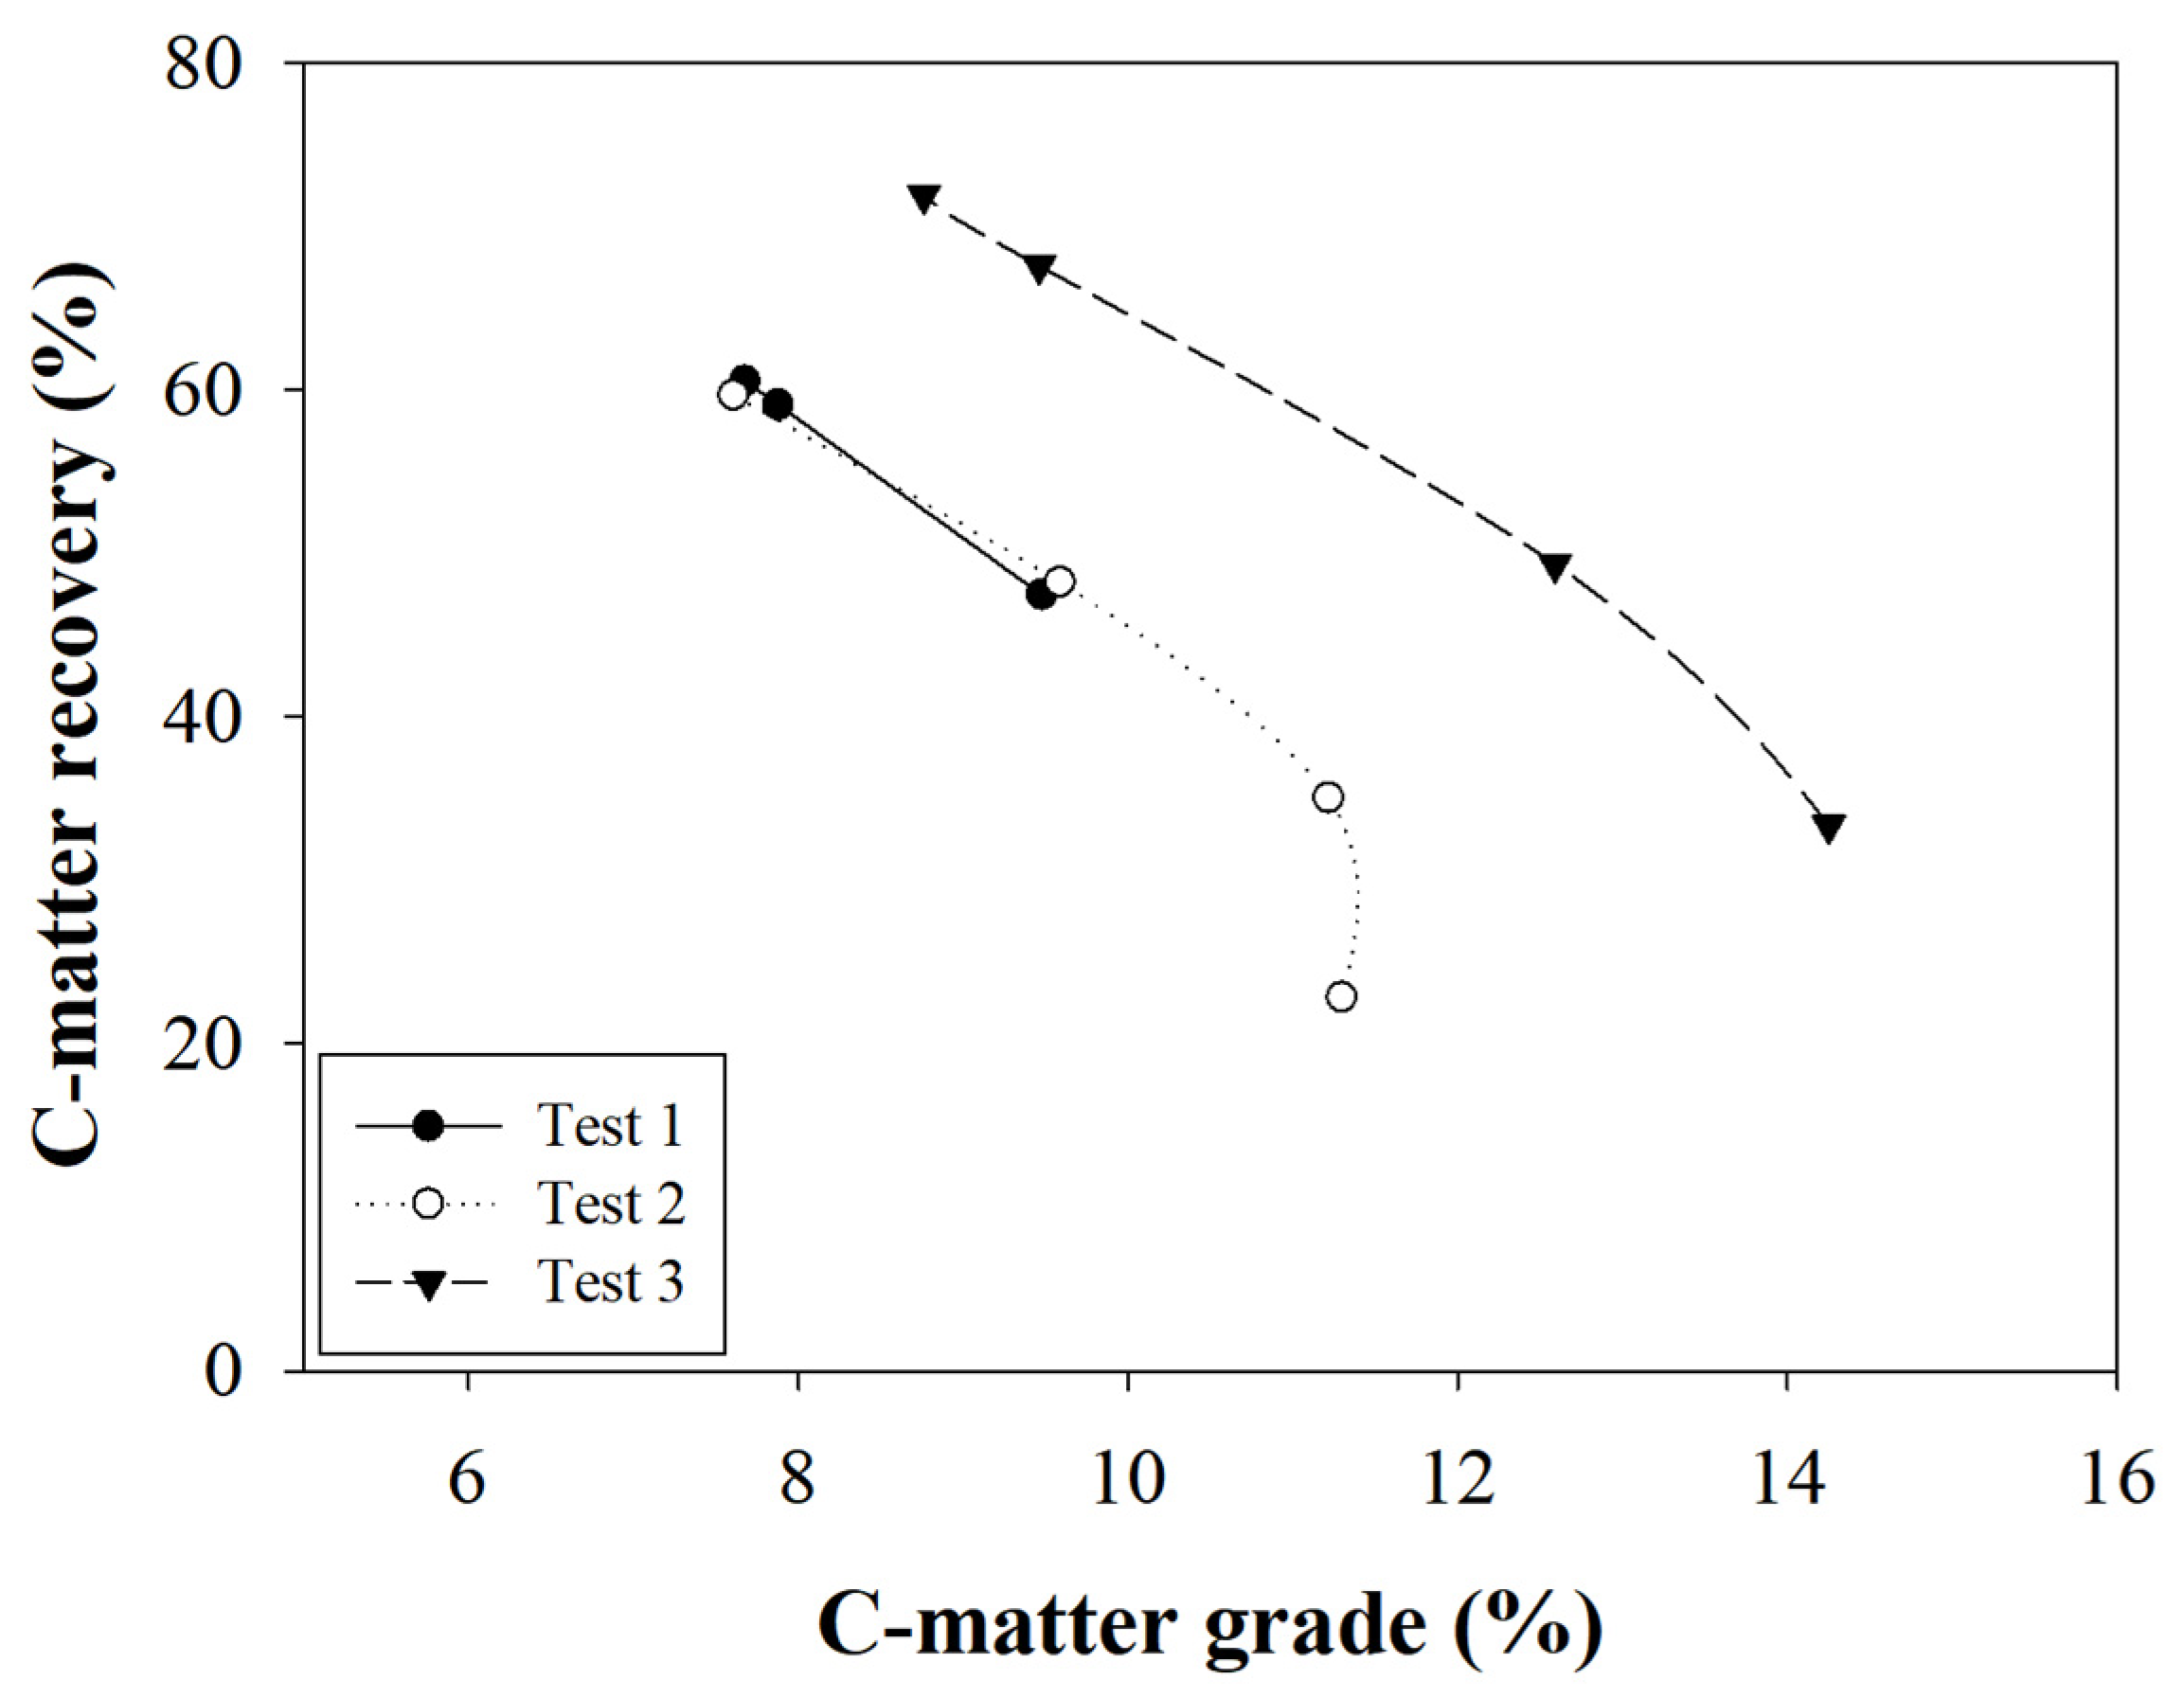
Instead of MLA, tests were performed to determine the relationship between the floatability and the particle size. To investigate the effect of further size reduction on floatability, two tests (Test 1 and Test 2) were conducted with the same size of samples with the rougher flotation study (P80: 36.5 μm) and one more test (Test 3) was performed with ultrafine grinding (P80: 11.3 μm). Additionally, to achieve flotation with minimal entrainment, flotation was carried out by only collecting the black froth with the naked eye, regardless of kinetics. It is thus hypothesized that only true flotation occurred in this test, with minimal entrainment. The test conditions were varied in terms of reagent dosage, agitation speed, and aeration rate to obtain the black froth, as described in the Appendix (Table A1, Table A3 and Table A5). All the tests were continued until no more black froth floated. The results of Test 1 and 2 were almost the same, regardless of the test conditions (Figure 8; Table A2 and Table A4), which indicated that the black froth was collected selectively and that this test well estimated the amount of collectable material by true flotation effectively. Flotation after fine grinding by the stirred media mill (P80: 11.3 μm of the whole ore sample) resulted in the significant improvement in the selectivity compared with the coarser grind sizes (Figure 8; Table A6). It supported the assumption that finer grinding led to improved liberation, ultimately achieving better flotation selectivity.
Additionally, the Test 1 and Test 2 (P80: 36.5 μm) results indicated that the recovery was lower (60%) than the test result (R+S+RC+SC-recovery: 72%, grade: 4%) from the multi-stage flotation, while the grade was higher (7.6%) (Table 5), suggesting that the C-matter collected by the multi-stage flotation was likely the result of both true flotation and the entrainment of particles (which is inevitable in flotation testing). It also supported the notion that the efficacy of the cleaner stage is determined by the contents of middling; with the middling in the feed, the cleaner stage is effective for better selectivity [15]. In addition, the C-matter grade (7.68%) with 60.45% recovery was still low, meaning that the collected C-matter featured a strong association with gangue minerals due to its poor liberation. The higher C-matter recovery (71.81%) with increased grade (8.76%) with fine grinding suggested that the locked C-matter was a limiting factor in flotation performance, and that the finer particle size can lead to better selectivity. However, 30% of the C-matter remained as non-floatable matter even with the selective flotation and a fine particle size of P80 11.3 μm. It is likely that the remaining C-matter was very finely disseminated, and even ultrafine grinding was insufficient to achieve the floatability with the high selectivity.
The different circuit designs performed in the following performance order, from best to worst: R+S+SC+RC > R > R+S+SC > R+S. Through R+S+RC+RC flotation, 72% C-matter with a 4.01% grade and 28% of C-matter with a 0.87% grade remained in concentrates and tailings, respectively; 45.3% of gold was collected with the concentrate (33.2% yield) and 54.7% (66.8% yield) of gold remained in the tailings. As roasting is an efficient means of decomposing carbonaceous matter, it is expected that the gold recovery from the concentrate by roasting and leaching will be above 90% [6,23,24,25]. The extraction of gold from the tailings follows the same pressure oxidation procedure; thus, it can be conservatively assumed that gold recovery will be 59% (unchanged; with P80: 56.5 μm) or marginally higher due to a finer particle size distribution in the feed (P80: −46.6 μm, Table 4). As a result, the total gold recovery can be estimated as at least 73% (41% from the concentrate and 32% from the tailing), which is 14% higher than the recovery with the present process. Thus, there is potential for improved overall gold recovery, even without the achievement of a recovery increase in the treatment of the flotation tailings by pressure oxidation followed by thiosulfate leaching.
4. Conclusions
As a first stage of pre-treatment, a C-matter flotation study was investigated with the assessment of multiple flotation circuit configurations. Through the testing of rougher, scavenger and cleaner flotation, the optimum conditions for each stage were determined, and the flotation performance was assessed considering a combined final concentrate product. For the highest combined grade and recovery, a flowsheet including R+S+RC+SC demonstrated the most potential, resulting in 72% C-matter recovery with 4% C-matter grade. Through the additional testing, it was determined that the limited overall C-matter recovery was attributed to poor liberation. As a subject for future study, the application of novel flotation reagents and oil collector emulsion, which are effective at ultrafine grind sizes, may help to improve selectivity in flotation. Studies have shown that certain neutral oils perform very well at ultrafine grind sizes in the flotation of minerals such as molybdenite [26], but have yet to be tested on other mineral systems. With the optimized flotation process presented in this study, it is recommended that the concentrate and tailings products be subjected to further testing using a suitable downstream process (i.e., roasting, followed by cyanidation for the concentrate and pressure oxidation, followed by thiosulfate leaching for the tailings) to determine the effect of C-matter flotation on global gold recovery.
Author Contributions
Conceptualization, S.L., A.G. and C.E.G.; methodology, S.L.; software, S.L.; formal analysis, S.L.; investigation, S.L.; resources, A.G.; data curation, S.L.; writing—original draft preparation, S.L.; writing—review and editing, A.G. and C.E.G.; visualization, S.L.; supervision, A.G. and C.E.G.; project administration, A.G. and C.E.G.; funding acquisition, A.G. All authors have read and agreed to the published version of the manuscript.
Funding
This research was funded by the Natural Sciences and Engineering Research Council of Canada (NSERC; CRDPJ 522968-17), Ontario Centres for Excellence (OCE; OCE-VIP 2 project 30113) and Barrick Gold Corp. (323266).
Data Availability Statement
Not applicable.
Conflicts of Interest
The authors declare no conflict of interest.
Appendix A

Table A1.
Test 1 flotation conditions.
| Kerosene (g/t) | MIBC (g/t) | Collecting Time (min) | Cond. Speed (rpm) | Collect. Speed (rpm) | |
|---|---|---|---|---|---|
| Rougher | 500 | 120 | 4.5 | 1200 | 1200 |
| Scavenger 1 | 350 | 22 | 4.5 | 1200 | 1500 |
| Scavenger 2 | 175 | 11 | <10 | 1200 | 1500 |
Table A2.
Test 1 flotation results.
| Cum. Yield (%) | Cum. C-matter (%) | Cum. S (%) | Cum. C as CO3 (%) | C-matter Grade (%) | S Grade (%) | C as CO3 Grade (%) | |
|---|---|---|---|---|---|---|---|
| Rougher | 9.84 | 47.41 | 13.61 | 9.7 | 9.48 | 1.61 | 4.39 |
| Scavenger 1 | 14.74 | 59.01 | 19.12 | 15.6 | 7.88 | 1.51 | 4.72 |
| Scavenger 2 | 15.49 | 60.45 | 19.87 | 16.6 | 7.68 | 1.50 | 4.77 |
Table A3.
Test 2 flotation conditions.
| Kerosene (g/t) | MIBC (g/t) | Collecting Time (min) | Cond. Speed (rpm) | Collect. Speed (rpm) | |
|---|---|---|---|---|---|
| Rougher | 500 | 30 | 7 | 1200 | 1500 |
| Scavenger 1 | - | 22 | 3 | 1200 | 1500 |
| Scavenger 2 | - | 11 | 3 | 1200 | 1500 |
| Scavenger 3 | 175 | 5 | 3.5 | 1200 | 1500 |
Table A4.
Test 2 flotation results.
| Cum. Yield (%) | Cum. C-matter (%) | Cum. S (%) | Cum. C as CO3 (%) | C-matter Grade (%) | S Grade (%) | C as CO3 Grade (%) | |
|---|---|---|---|---|---|---|---|
| Rougher | 3.92 | 22.80 | 5.95 | 3.2 | 11.30 | 1.61 | 3.67 |
| Scavenger 1 | 6.06 | 34.99 | 9.34 | 5.0 | 11.22 | 1.63 | 3.72 |
| Scavenger 2 | 9.76 | 48.17 | 14.46 | 8.7 | 9.59 | 1.57 | 4.01 |
| Scavenger 3 | 15.21 | 59.61 | 20.94 | 15.4 | 7.61 | 1.46 | 4.56 |
Table A5.
Test 3 flotation conditions.
| Kerosene (g/t) | MIBC (g/t) | Collecting Time (min) | Cond. Speed (rpm) | Collect. Speed (rpm) | |
|---|---|---|---|---|---|
| Rougher | 500 | 86 | 0.5 | 1000 | 1200 |
| Scavenger 1 | - | 86 | 1 | 1200 | 1200 |
| Scavenger 2 | 250 | 43 | 2 | 1200 | 1200 |
| Scavenger 3 | 250 | 22 | 6 | 1200 | 1200 |
Table A6.
Test 3 flotation results.
| Cum. Yield (%) | Cum. C-matter (%) | Cum. S (%) | Cum. C as CO3 (%) | C-matter Grade (%) | S grade (%) | C as CO3 Grade (%) | |
|---|---|---|---|---|---|---|---|
| Rougher | 4.27 | 33.35 | 9.34 | 2.54 | 14.25 | 2.07 | 2.66 |
| Scavenger 1 | 7.15 | 49.30 | 14.83 | 4.46 | 12.59 | 1.97 | 2.79 |
| Scavenger 2 | 13.03 | 67.54 | 23.83 | 9.49 | 9.46 | 1.73 | 3.26 |
| Scavenger 3 | 14.99 | 71.87 | 26.53 | 11.15 | 8.76 | 1.68 | 3.33 |
References
- Chen, T.; Cabri, L.; Dutrizac, J. Characterizing Gold in Refractory Sulfide Gold Ores and Residues. Jom 2002, 54, 20–22. [Google Scholar] [CrossRef]
- Komnitsas, C.; Pooley, F. Mineralogical Characteristics and Treatment of Refractory Gold Ores. Miner. Eng. 1989, 2, 449–457. [Google Scholar] [CrossRef]
- La Brooy, S.; Linge, H.; Walker, G. Review of Gold Extraction from Ores. Miner. Eng. 1994, 7, 1213–1241. [Google Scholar] [CrossRef]
- Fraser, K.; Walton, R.; Wells, J. Processing of Refractory Gold Ores. Miner. Eng. 1991, 4, 1029–1041. [Google Scholar] [CrossRef]
- Corrans, I.; Angove, J. Ultra Fine Milling for the Recovery of Refractory Gold. Miner. Eng. 1991, 4, 763–776. [Google Scholar] [CrossRef]
- Yang, Y.; Xie, Z.; Xu, B.; Li, Q.; Jiang, T. Gold Extraction from a High Carbon Low-Grade Refractory Gold Ore by Flotation-Roasting-Leaching Process. In Rare Metal Technology; Springer: Cham, Switzerland, 2015; Volume 2015, pp. 63–70. [Google Scholar] [CrossRef]
- Afenya, P. Treatment of Carbonaceous Refractory Gold Ores. Miner. Eng. 1991, 4, 1043–1055. [Google Scholar] [CrossRef]
- Gredelj, S.; Zanin, M.; Grano, S. Selective Flotation of Carbon in the Pb–Zn Carbonaceous Sulphide Ores of Century Mine, Zinifex. Miner. Eng. 2009, 22, 279–288. [Google Scholar] [CrossRef]
- Zhang, W.; Honaker, R. Studies on Carbon Flotation from Fly Ash. Fuel Process. Technol. 2015, 139, 236–241. [Google Scholar] [CrossRef]
- Naik, P.K.; Reddy, P.S.R.; Misra, V.N. Interpretation of Interaction Effects and Optimization of Reagent Dosages for Fine Coal Flotation. Int. J. Miner. Process. 2005, 75, 83–90. [Google Scholar] [CrossRef]
- Polat, M.; Polat, H.; Chander, S. Physical and Chemical Interactions in Coal Flotation. Int. J. Miner. Process. 2003, 72, 199–213. [Google Scholar] [CrossRef] [Green Version]
- Calisaya, D.A.; López-Valdivieso, A.; Marcos, H.; Gálvez, E.E.; Cisternas, L.A. A Strategy for the Identification of Optimal Flotation Circuits. Miner. Eng. 2016, 96, 157–167. [Google Scholar] [CrossRef]
- Sutherland, D. A Study on the Optimization of the Arrangement of Flotation Circuits. Int. J. Miner. Process. 1981, 7, 319–346. [Google Scholar] [CrossRef]
- Tao, D.; Luttrell, G.; Yoon, R.-H. An Experimental Investigation on Column Flotation Circuit Configuration. Int. J. Miner. Process. 2000, 60, 37–56. [Google Scholar] [CrossRef]
- Honaker, R.; Mohanty, M. Enhanced Column Flotation Performance for Fine Coal Cleaning. Miner. Eng. 1996, 9, 931–945. [Google Scholar] [CrossRef]
- Lu, X.; Forssberg, E. Flotation Selectivity and Upgrading of Woxna Fine Graphite Concentrate. Miner. Eng. 2001, 14, 1541–1543. [Google Scholar] [CrossRef]
- Yianatos, J.; Contreras, F. Particle Entrainment Model for Industrial Flotation Cells. Powder Technol. 2010, 197, 260–267. [Google Scholar] [CrossRef]
- Neethling, S.; Cilliers, J. The Entrainment Factor in Froth Flotation: Model for Particle Size and Other Operating Parameter Effects. Int. J. Miner. Process. 2009, 93, 141–148. [Google Scholar] [CrossRef]
- Hoang, D.H.; Kupka, N.; Peuker, U.A.; Rudolph, M. Flotation Study of Fine Grained Carbonaceous Sedimentary Apatite Ore–Challenges in Process Mineralogy and Impact of Hydrodynamics. Miner. Eng. 2018, 121, 196–204. [Google Scholar] [CrossRef]
- Albijanic, B.; Subasinghe, G.N.; Bradshaw, D.J.; Nguyen, A.V. Influence of Liberation on Bubble–Particle Attachment Time in Flotation. Miner. Eng. 2015, 74, 156–162. [Google Scholar] [CrossRef]
- Lee, S.; Gibson, C.E.; Ghahreman, A. Flotation of Carbonaceous Matter from a Double Refractory Gold Ore: The Effect of MIBC on Flotation Performance and Kinetics. Minerals 2021, 11, 1021. [Google Scholar] [CrossRef]
- Tsatouhas, G.; Grano, S.; Vera, M. Case Studies on the Performance and Characterisation of the Froth Phase in Industrial Flotation Circuits. Miner. Eng. 2006, 19, 774–783. [Google Scholar] [CrossRef]
- Amankwah, R.; Pickles, C. Microwave Roasting of a Carbonaceous Sulphidic Gold Concentrate. Miner. Eng. 2009, 22, 1095–1101. [Google Scholar] [CrossRef]
- Wang, J.; Wang, W.; Dong, K.; Fu, Y.; Xie, F. Research on Leaching of Carbonaceous Gold Ore with Copper-Ammonia-Thiosulfate Solutions. Miner. Eng. 2019, 137, 232–240. [Google Scholar] [CrossRef]
- Nanthakumar, B.; Pickles, C.; Kelebek, S. Microwave Pretreatment of a Double Refractory Gold Ore. Miner. Eng. 2007, 20, 1109–1119. [Google Scholar] [CrossRef]
- Lin, Q.Q.; Gu, G.H.; Wang, H.; Liu, Y.C.; Fu, J.G.; Wang, C.Q. Flotation Mechanisms of Molybdenite Fines by Neutral Oils. Int. J. Miner. Metall. Mater. 2018, 25, 1–10. [Google Scholar] [CrossRef]
Figure 1.
The flotation circuit design from the results (a) R: single-stage rougher flotation (b) R+S: rougher and scavenger flotation (c) R+S+SC: rougher, scavenger, and scavenger cleaner flotation (d) R+S+RC+SC: rougher, rougher cleaner, scavenger, and scavenger cleaner flotation.
Figure 1.
The flotation circuit design from the results (a) R: single-stage rougher flotation (b) R+S: rougher and scavenger flotation (c) R+S+SC: rougher, scavenger, and scavenger cleaner flotation (d) R+S+RC+SC: rougher, rougher cleaner, scavenger, and scavenger cleaner flotation.

Figure 2.
XRD patterns of the sample ore.

Figure 3.
The proposed flotation process for the separation of C-matter.

Figure 4.
Rougher flotation results with the selected conditions (Test 10–kerosene: 500 g t−1, MIBC: 120 g t−1, P80: 36.5 μm).
Figure 4.
Rougher flotation results with the selected conditions (Test 10–kerosene: 500 g t−1, MIBC: 120 g t−1, P80: 36.5 μm).

Figure 5.
The selected rougher-scavenger flotation results (Kerosene: 350 g t−1, MIBC: 21 g t−1) compared with the rougher flotation results.
Figure 5.
The selected rougher-scavenger flotation results (Kerosene: 350 g t−1, MIBC: 21 g t−1) compared with the rougher flotation results.

Figure 6.
Flotation test results with the selected conditions in each flotation circuit (R-kerosene: 500 g t−1, MIBC: 120 g t−1, 6.5 min; R+S: R-kerosene: 500 g t−1, MIBC: 120 g t−1, 2.5 min and S-kerosene: 250 g t−1, MIBC: 21 g t−1, 4.5 min; R+S+SC: SC-kerosene: 83 g t−1, MIBC: 11 g t−1, 3.0 min, R+S+RC+SC: RC -kerosene: 36 g t−1, MIBC: 11 g t−1, 4.5 min and SC-kerosene: 83 g t−1, MIBC: 11 g t−1, 3.0 min).

Figure 7.
Rate constant changes by (a) kerosene dosage level (b) MIBC dosage level in rougher and cleaner flotation (sca. cleaner (low): with low dosage of kerosene, 42 g t−1 and sca. cleaner (high): with high dosage of kerosene, 125 g t−1 in scavenger cleaner) obtained by the classical first order model (R2 > 0.96).

Figure 8.
C-matter recovery vs. grade by tests 1, 2, and 3.

Table 1.
Elemental composition of the sample ore.
| Al (%) | Ba (ppm) | Ca (%) | Mg (%) | Fe (%) | K (%) | Na (%) | P (ppm) | Total C (C-matter) (%) | Total S (%) | Au (g/t) |
|---|---|---|---|---|---|---|---|---|---|---|
| 2.21 | 926 | 7.92 | 3.96 | 1.32 | 0.95 | 0.04 | 1000 | 5.93 (1.95) | 1.33 | 2.14 |
Table 2.
Rougher flotation test conditions (agitation speed: 1200 rpm, pulp density: 25 wt.%, flotation time: 6.5 min).
Table 2.
Rougher flotation test conditions (agitation speed: 1200 rpm, pulp density: 25 wt.%, flotation time: 6.5 min).
| Test | Kerosene Dosage (g t−1) | MIBC Dosage (g t−1) | P80 (μm) | Recovery (%) | Grade (%) |
|---|---|---|---|---|---|
| 1 | 50 | 60 | 67.7 | 42.23 | 2.03 |
| 2 | 100 | 60 | 67.7 | 39.87 | 2.44 |
| 3 | 200 | 60 | 67.7 | 51.19 | 2.36 |
| 4 | 300 | 60 | 67.7 | 54.19 | 2.64 |
| 5 | 500 | 60 | 67.7 | 55.98 | 2.72 |
| 6 | 500 | 60 | 44.6 | 61.60 | 2.57 |
| 7 | 500 | 60 | 36.5 | 67.30 | 2.67 |
| 8 | 500 | 30 | 36.5 | 51.18 | 2.67 |
| 9 | 500 | 90 | 36.5 | 68.23 | 2.90 |
| 10 | 500 | 120 | 36.5 | 69.87 | 3.42 |
| 11 | 500 | 150 | 36.5 | 70.09 | 3.62 |
| 12 | 500 | 30 | 67.7 | 41.11 | 2.81 |
| 13 | 500 | 90 | 67.7 | 60.55 | 3.18 |
| 14 | 500 | 120 | 67.7 | 61.16 | 2.82 |
| 15 | 500 | 150 | 67.7 | 66.54 | 2.60 |
Table 3.
Scavenger flotation results (rougher flotation for 2.5 min: C-matter recovery mean 54.49% (std.dev: 2.19%) (agitation speed: 1200 rpm, flotation time: 4.5 min, pulp density: 20 wt.%).
Table 3.
Scavenger flotation results (rougher flotation for 2.5 min: C-matter recovery mean 54.49% (std.dev: 2.19%) (agitation speed: 1200 rpm, flotation time: 4.5 min, pulp density: 20 wt.%).
| Test | Kerosene Dosage (g t−1) | MIBC Dosage (g t−1) | Scavenger Overall Recovery (%) |
|---|---|---|---|
| 1 | 70 | 21 | 24.12 |
| 2 | 210 | 21 | 24.98 |
| 3 | 350 | 21 | 28.69 |
| 4 | 70 | 42 | 26.29 |
| 5 | 70 | 63 | 25.95 |
| 6 | 350 | 42 | 25.84 |
| 7 | 350 | 63 | 27.70 |
Table 4.
Particle size analysis results of each concentrate and tailing.
| Rou. Conc. | Rou. Tail. | Sca. Conc. | Sca. Tail. | Tail. | |
|---|---|---|---|---|---|
| P80 (μm) | 30.3 | 42.5 | 38.5 | 43.0 | 46.6 |
Table 5.
The selective flotation test results.
| Test 1 | Test 2 | Test 3 | |
|---|---|---|---|
| Cum. C-matter recovery (%) | 60.45 | 59.61 | 71.81 |
| Cum. C-matter grade (%) | 7.68 | 7.61 | 8.76 |
Publisher’s Note: MDPI stays neutral with regard to jurisdictional claims in published maps and institutional affiliations. |
© 2021 by the authors. Licensee MDPI, Basel, Switzerland. This article is an open access article distributed under the terms and conditions of the Creative Commons Attribution (CC BY) license (https://creativecommons.org/licenses/by/4.0/).
Share and Cite
MDPI and ACS Style
Lee, S.; Gibson, C.E.; Ghahreman, A. The Separation of Carbonaceous Matter from Refractory Gold Ore Using Multi-Stage Flotation: A Case Study. Minerals 2021, 11, 1430. https://0-doi-org.brum.beds.ac.uk/10.3390/min11121430
AMA Style
Lee S, Gibson CE, Ghahreman A. The Separation of Carbonaceous Matter from Refractory Gold Ore Using Multi-Stage Flotation: A Case Study. Minerals. 2021; 11(12):1430. https://0-doi-org.brum.beds.ac.uk/10.3390/min11121430
Chicago/Turabian StyleLee, Sugyeong, Charlotte E. Gibson, and Ahmad Ghahreman. 2021. "The Separation of Carbonaceous Matter from Refractory Gold Ore Using Multi-Stage Flotation: A Case Study" Minerals 11, no. 12: 1430. https://0-doi-org.brum.beds.ac.uk/10.3390/min11121430
Note that from the first issue of 2016, this journal uses article numbers instead of page numbers. See further details here.