
Numerical Investigation on Influence of Two Combined Faults and Its Structure Features on Rock Burst Mechanism

 ,
,
Abstract
:1. Introduction
2. Classification of Two Combined Faults under Mining Background
2.1. Classification of Two Combined Faults
2.2. Influence of Two Combined Faults Types on Coal Mining
3. Influence of Two Combined Faults on Rock Bursts
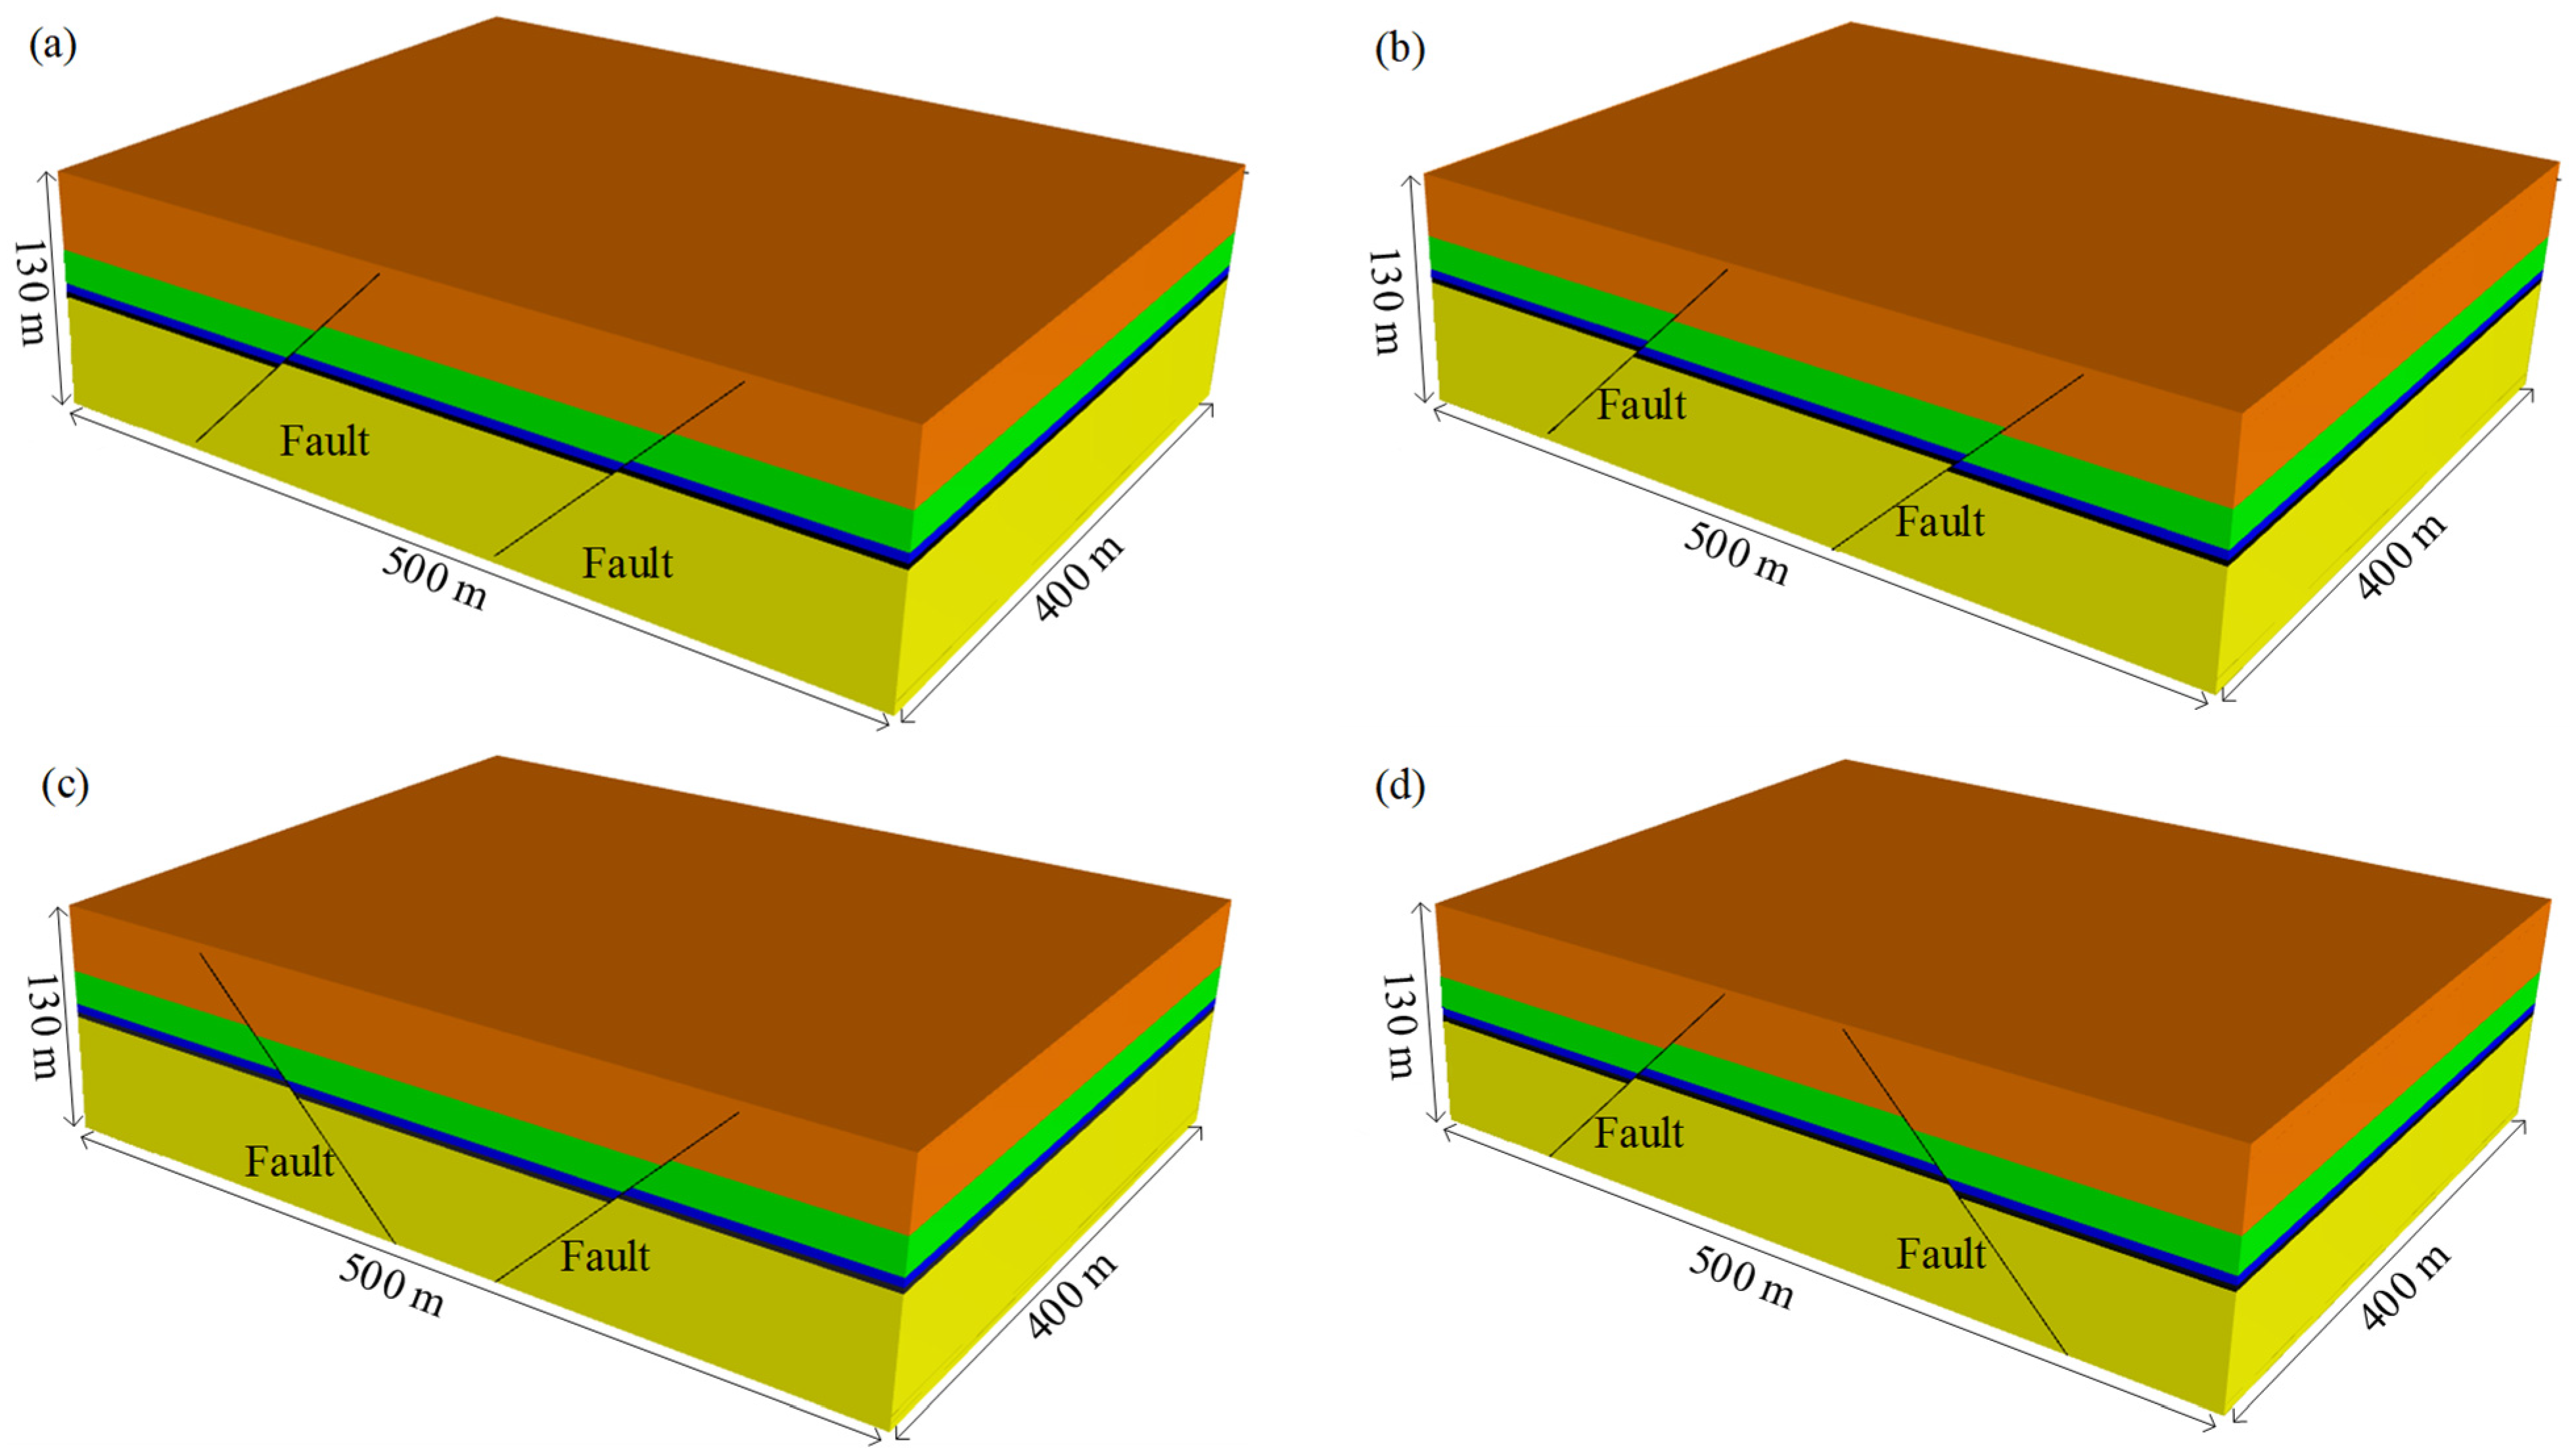
3.1. Model Setup and Material Properties
3.2. Mechanical Response of Two Combined Faults to Mining
3.3. Mechanism of Rock Burst Triggered by Two Combined Faults
4. Effects of Two Combined Faults on Rock Burst Potential
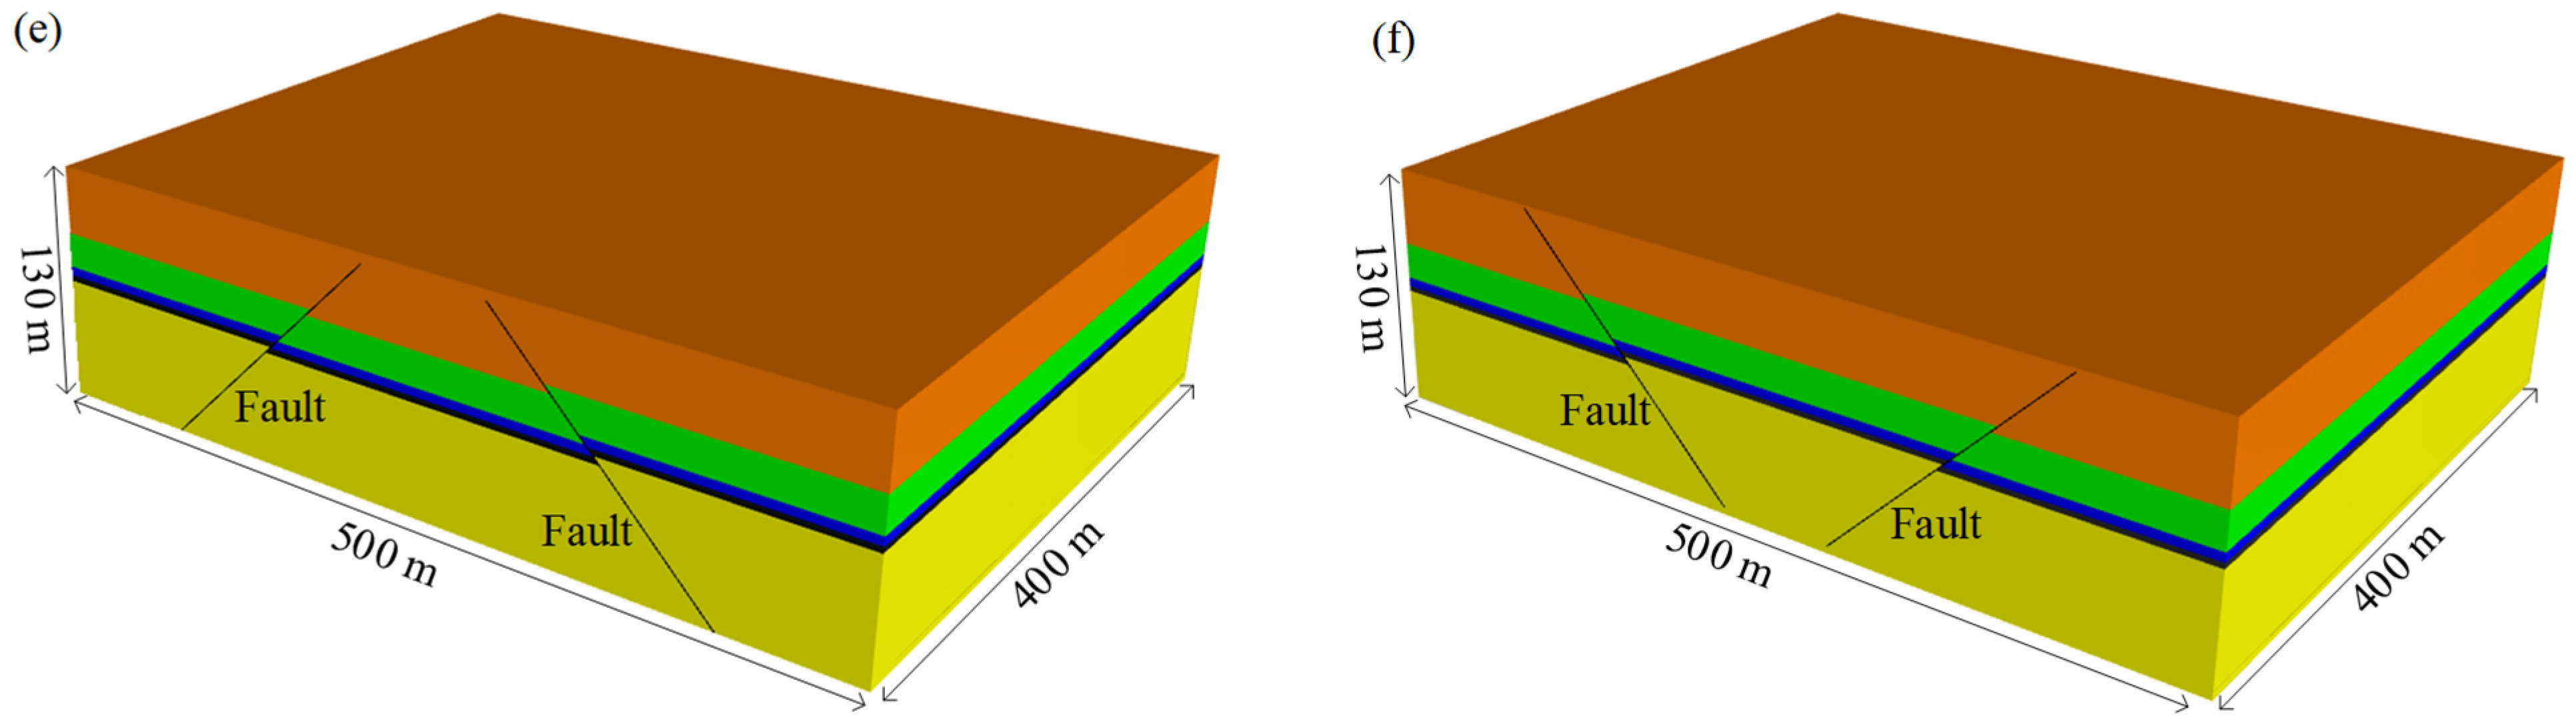
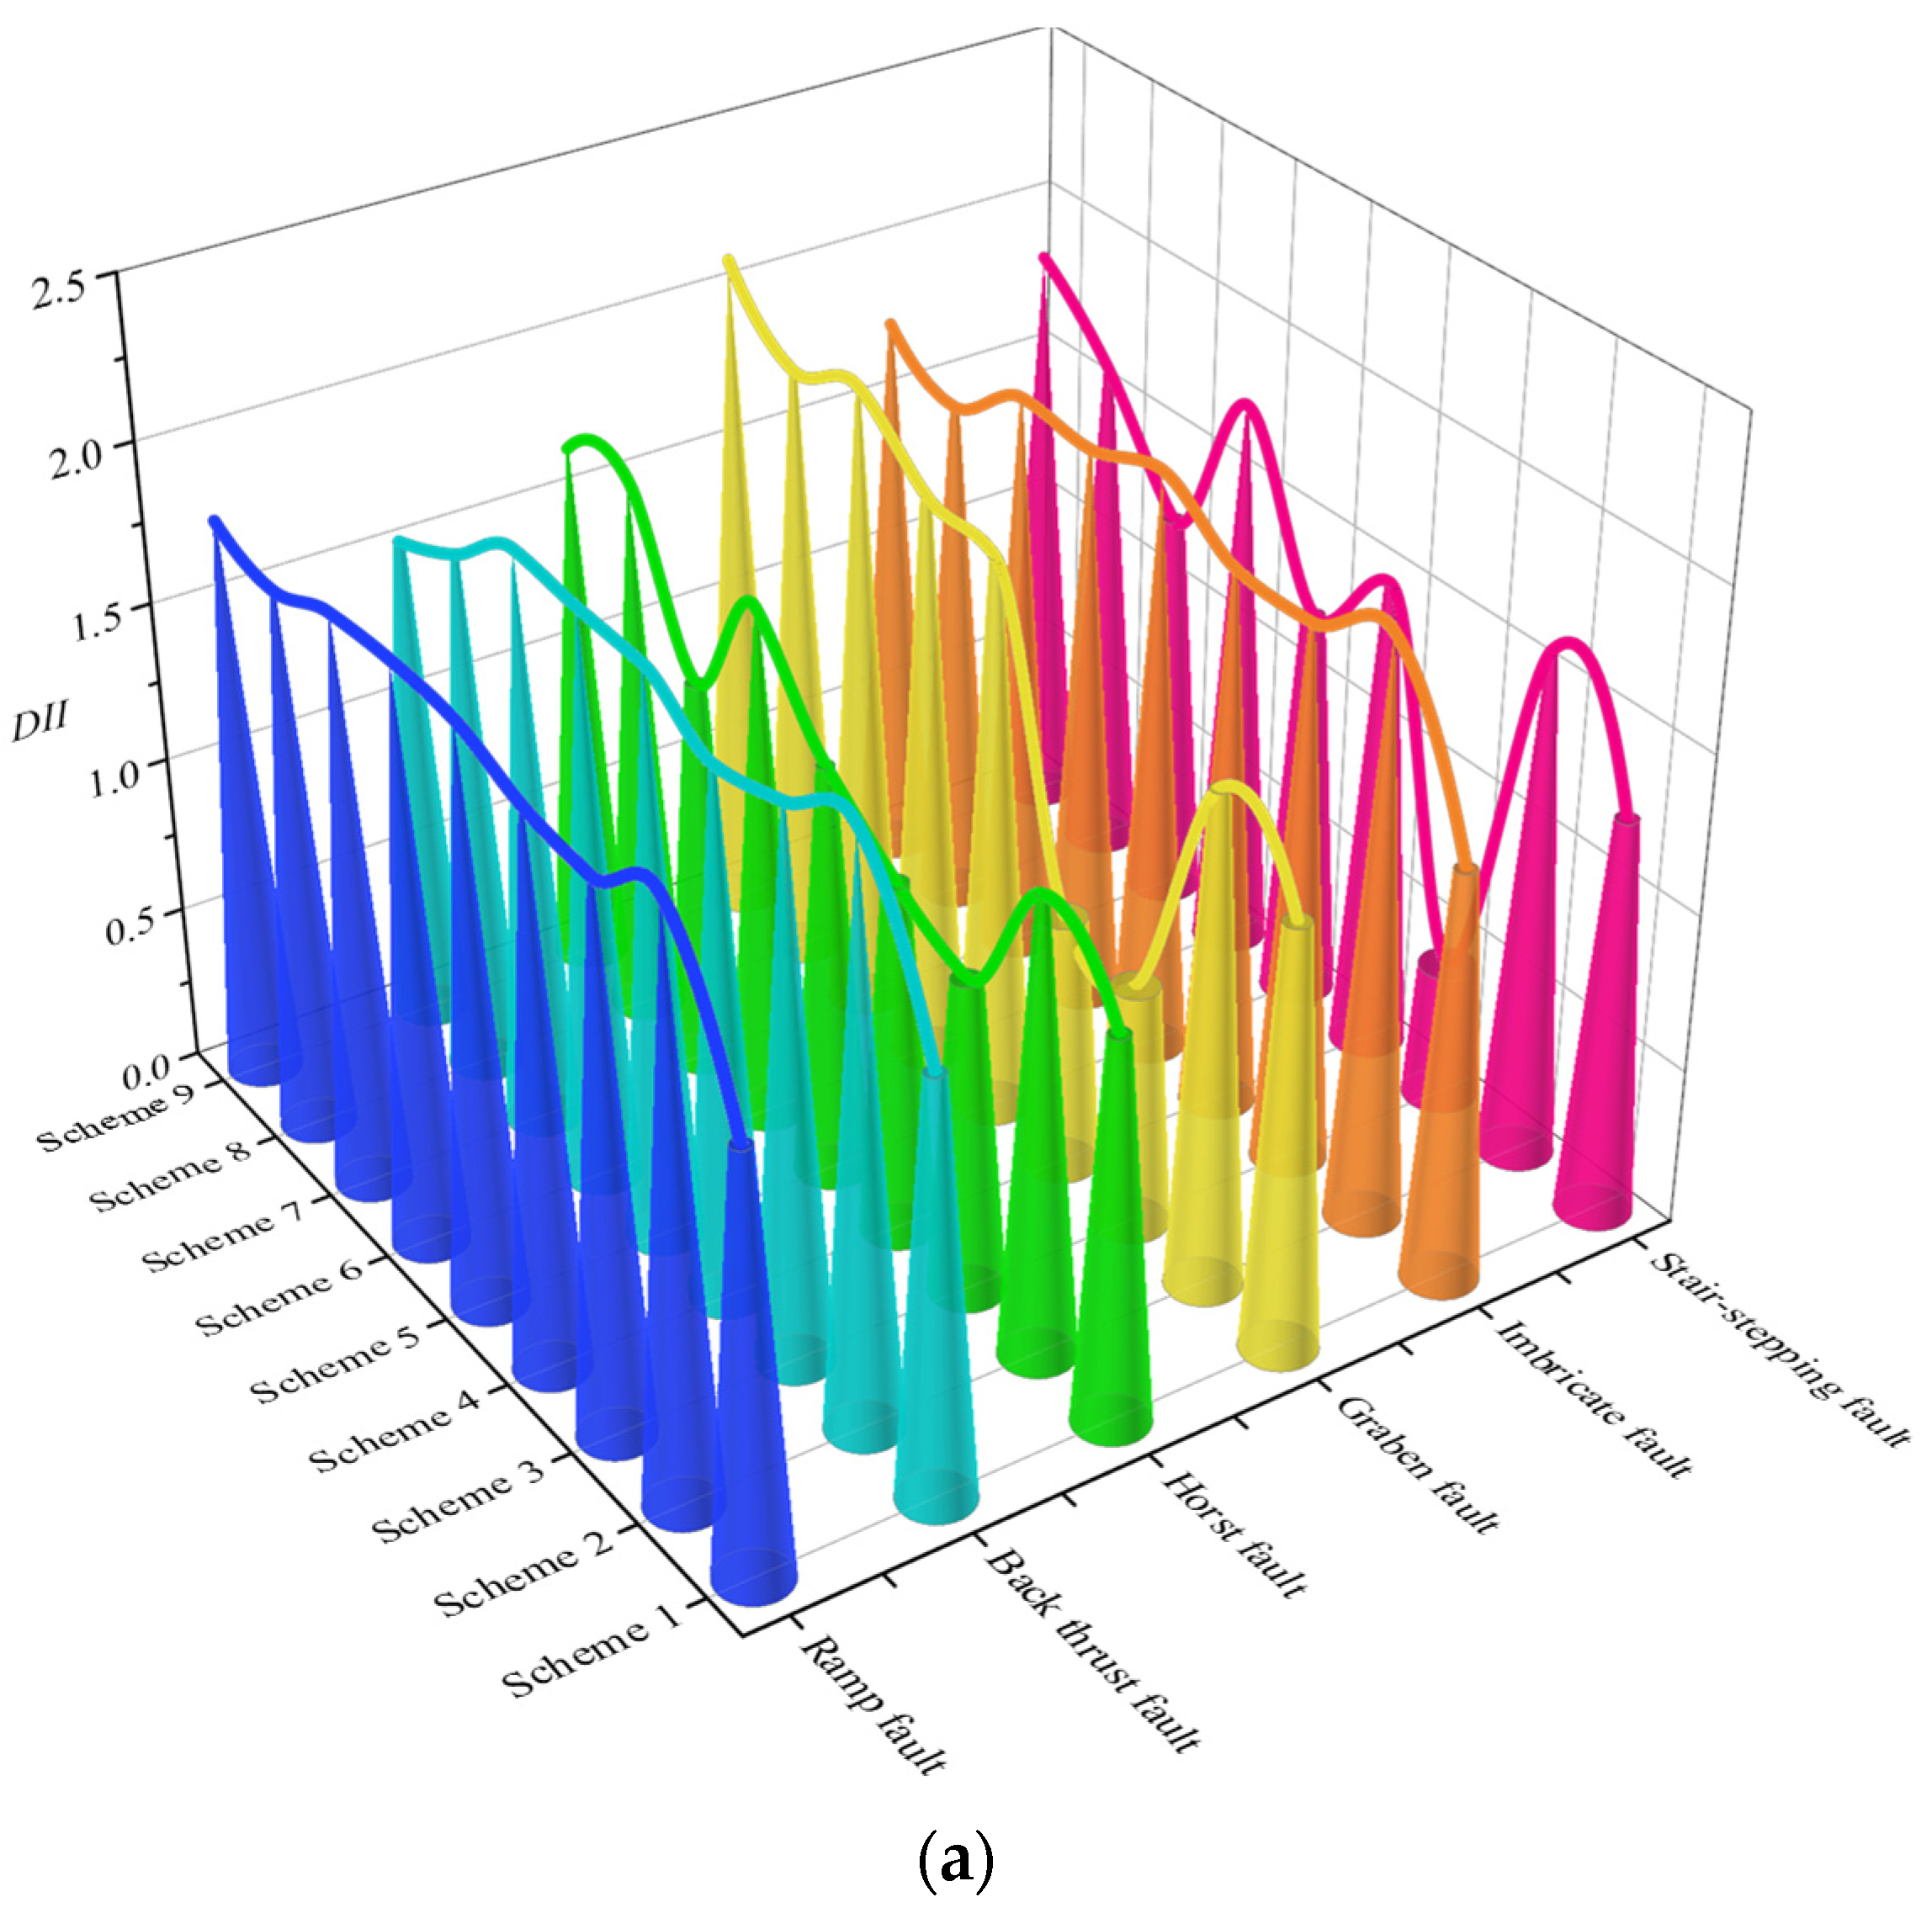
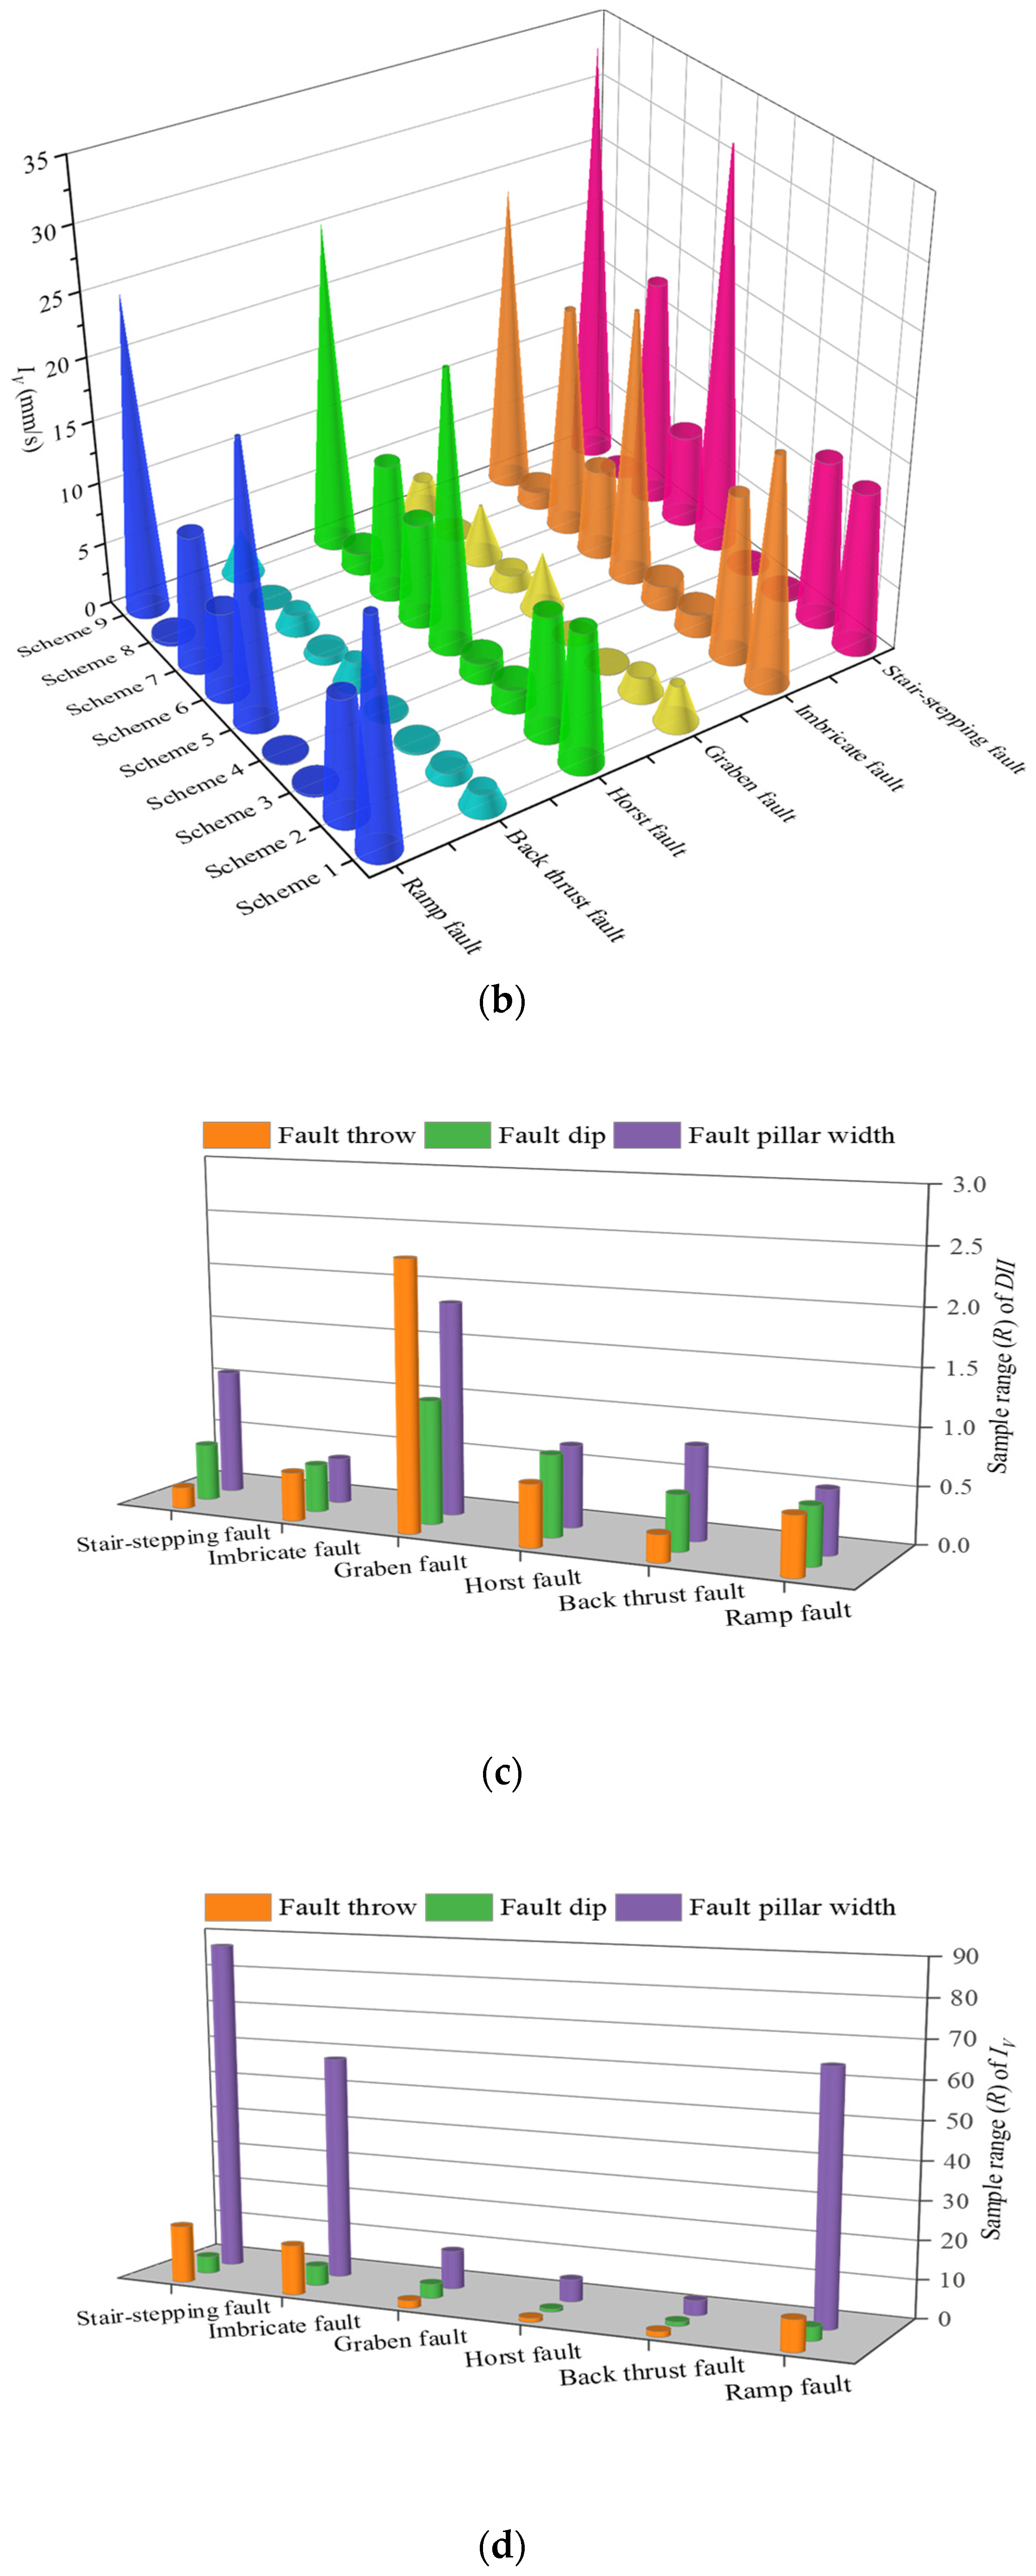
4.1. Definition of Rock Burst Potential Assessment Indexes
4.2. Influence of Different Parameters of Two Combined Faults on Rock Burst Potential
4.3. Identification of Main Control Factors of Rock Burst
5. Conclusions
- (1)
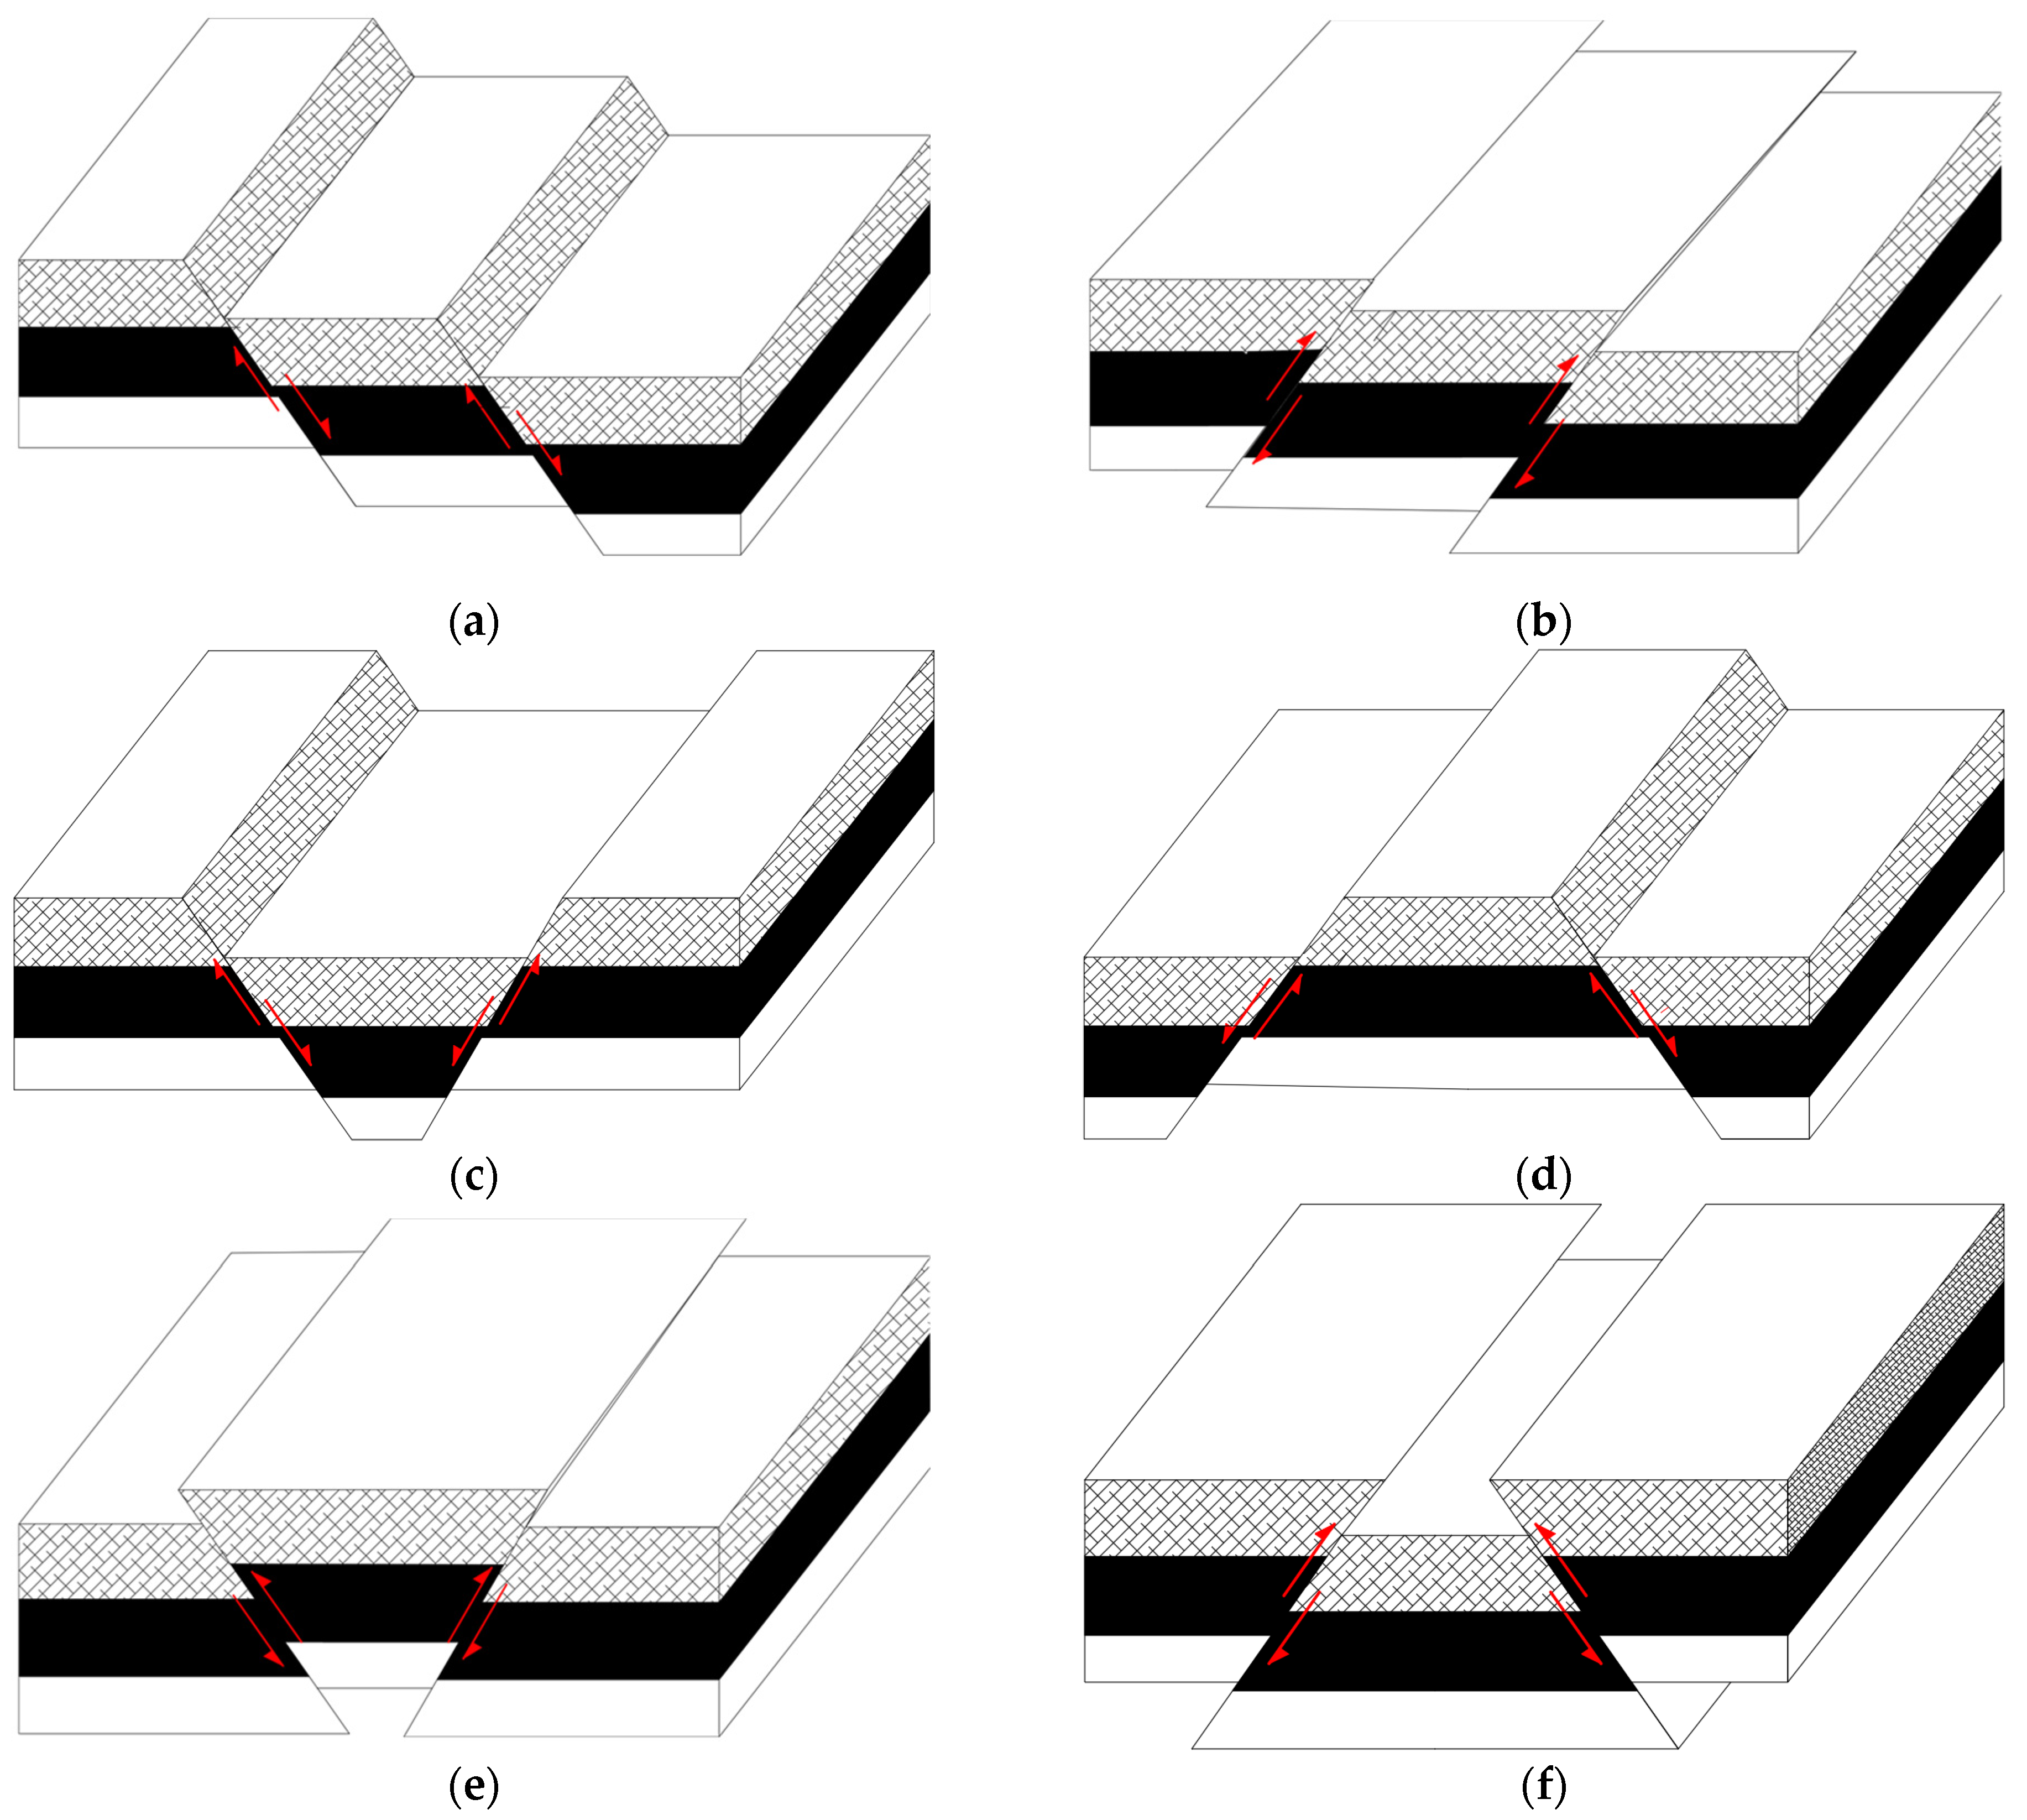
- According to types of two embedded faults, six types of two combined faults can be summarized, including stair-stepping fault, imbricate fault, graben fault, horst fault, back thrust fault, and ramp fault.
- (2)
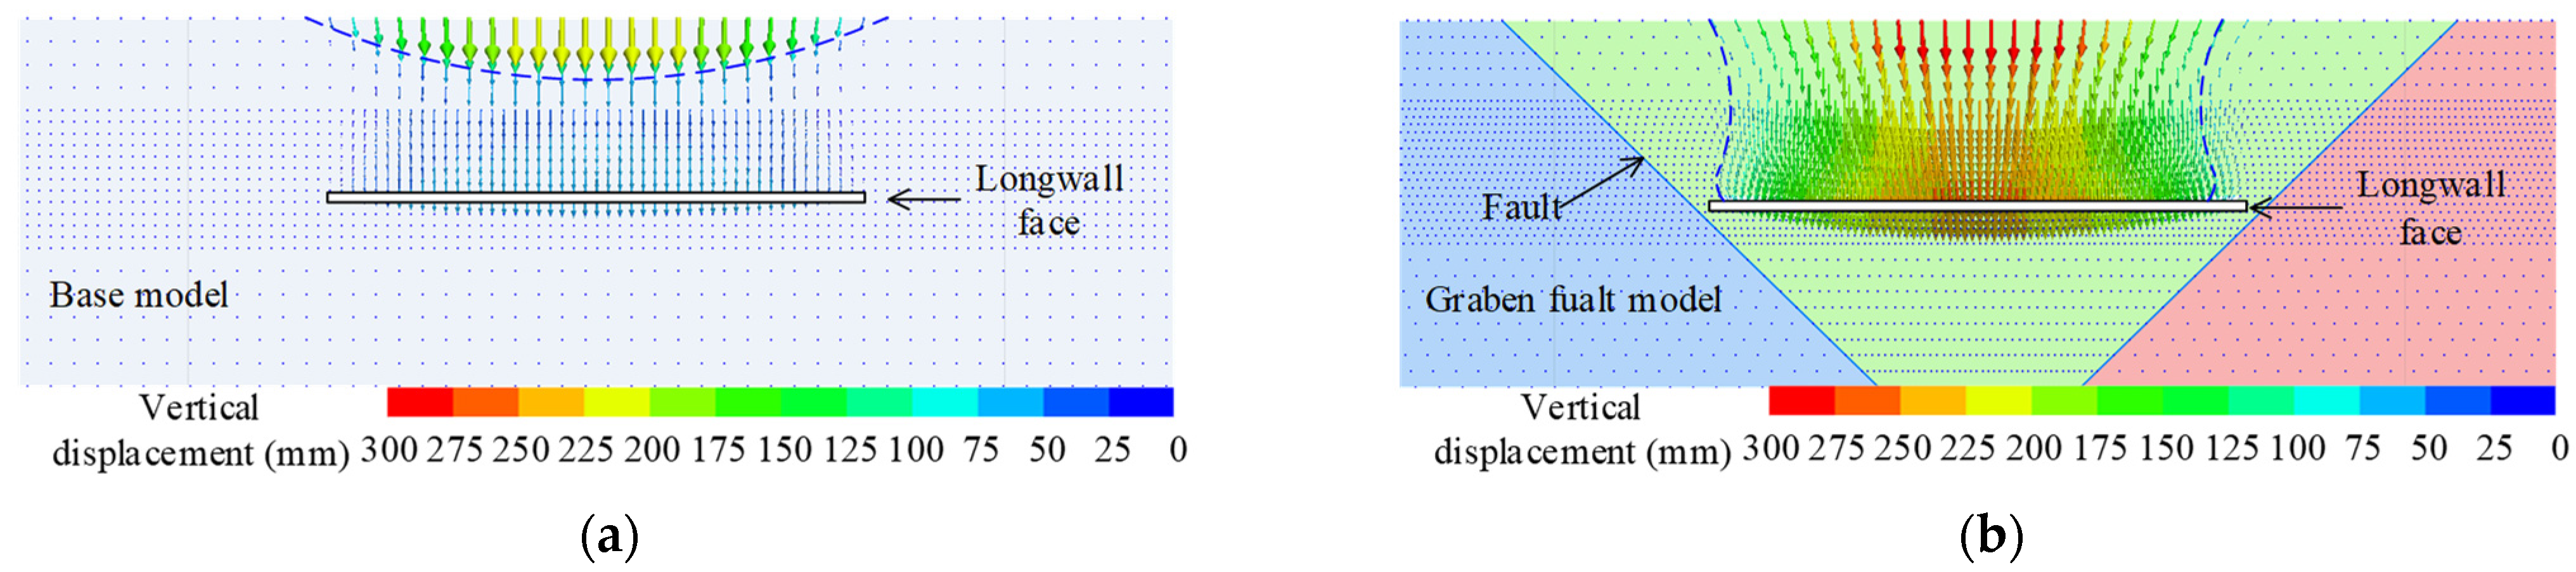
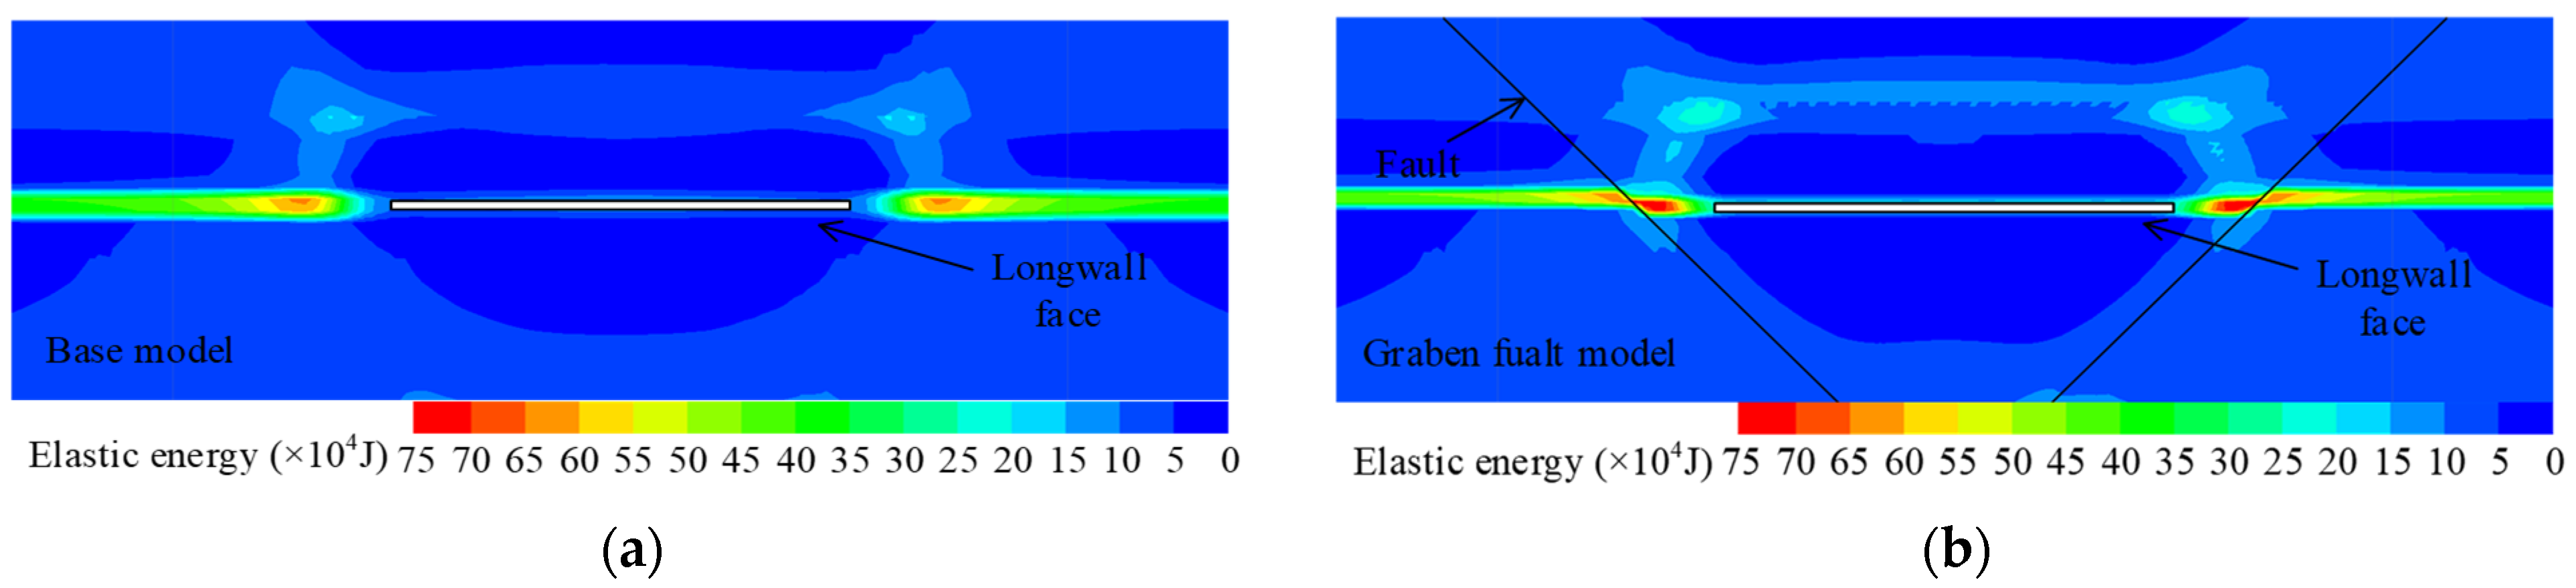
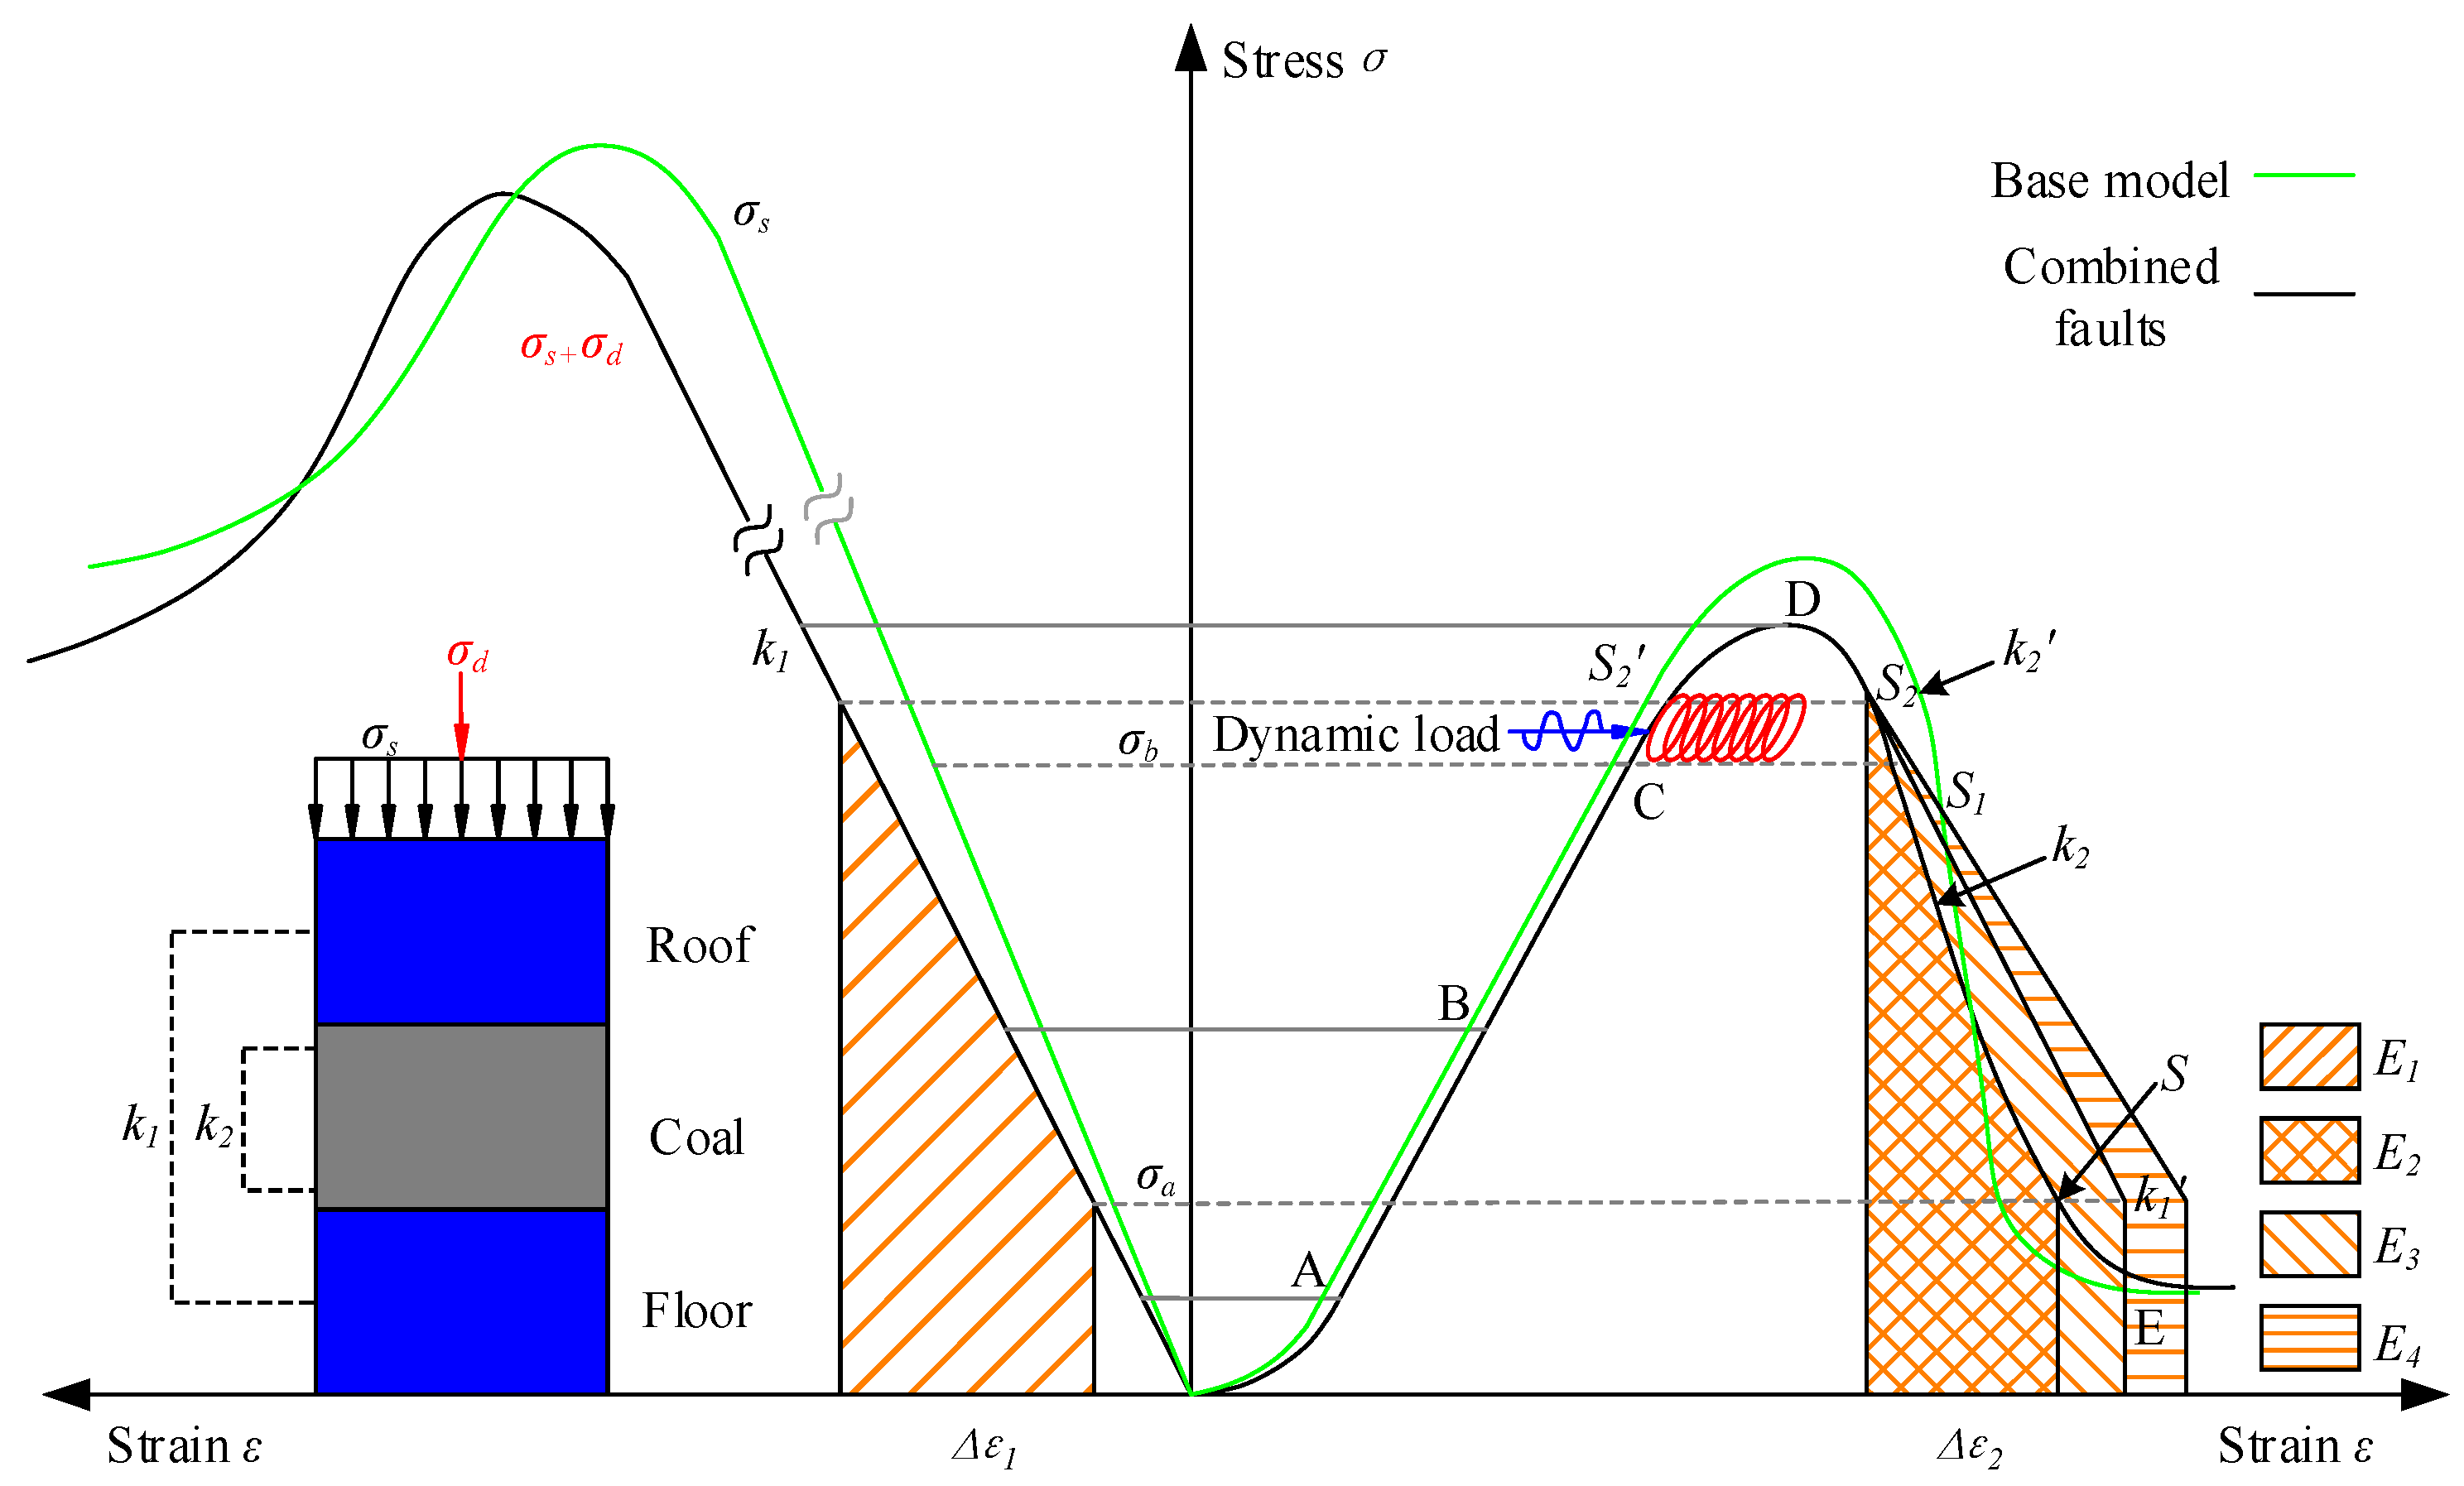
- The particular roof structure near the two combined faults mining preventing longwall face lateral abutment pressure from transferring to deep rock mass leads to stress concentration near the fault areas. Otherwise, a special roof structure causing the lower system stiffness of mining gives rise to the easier gathering of elastic energy in coal pillars, which makes it easier to trigger a rock burst.
- (3)
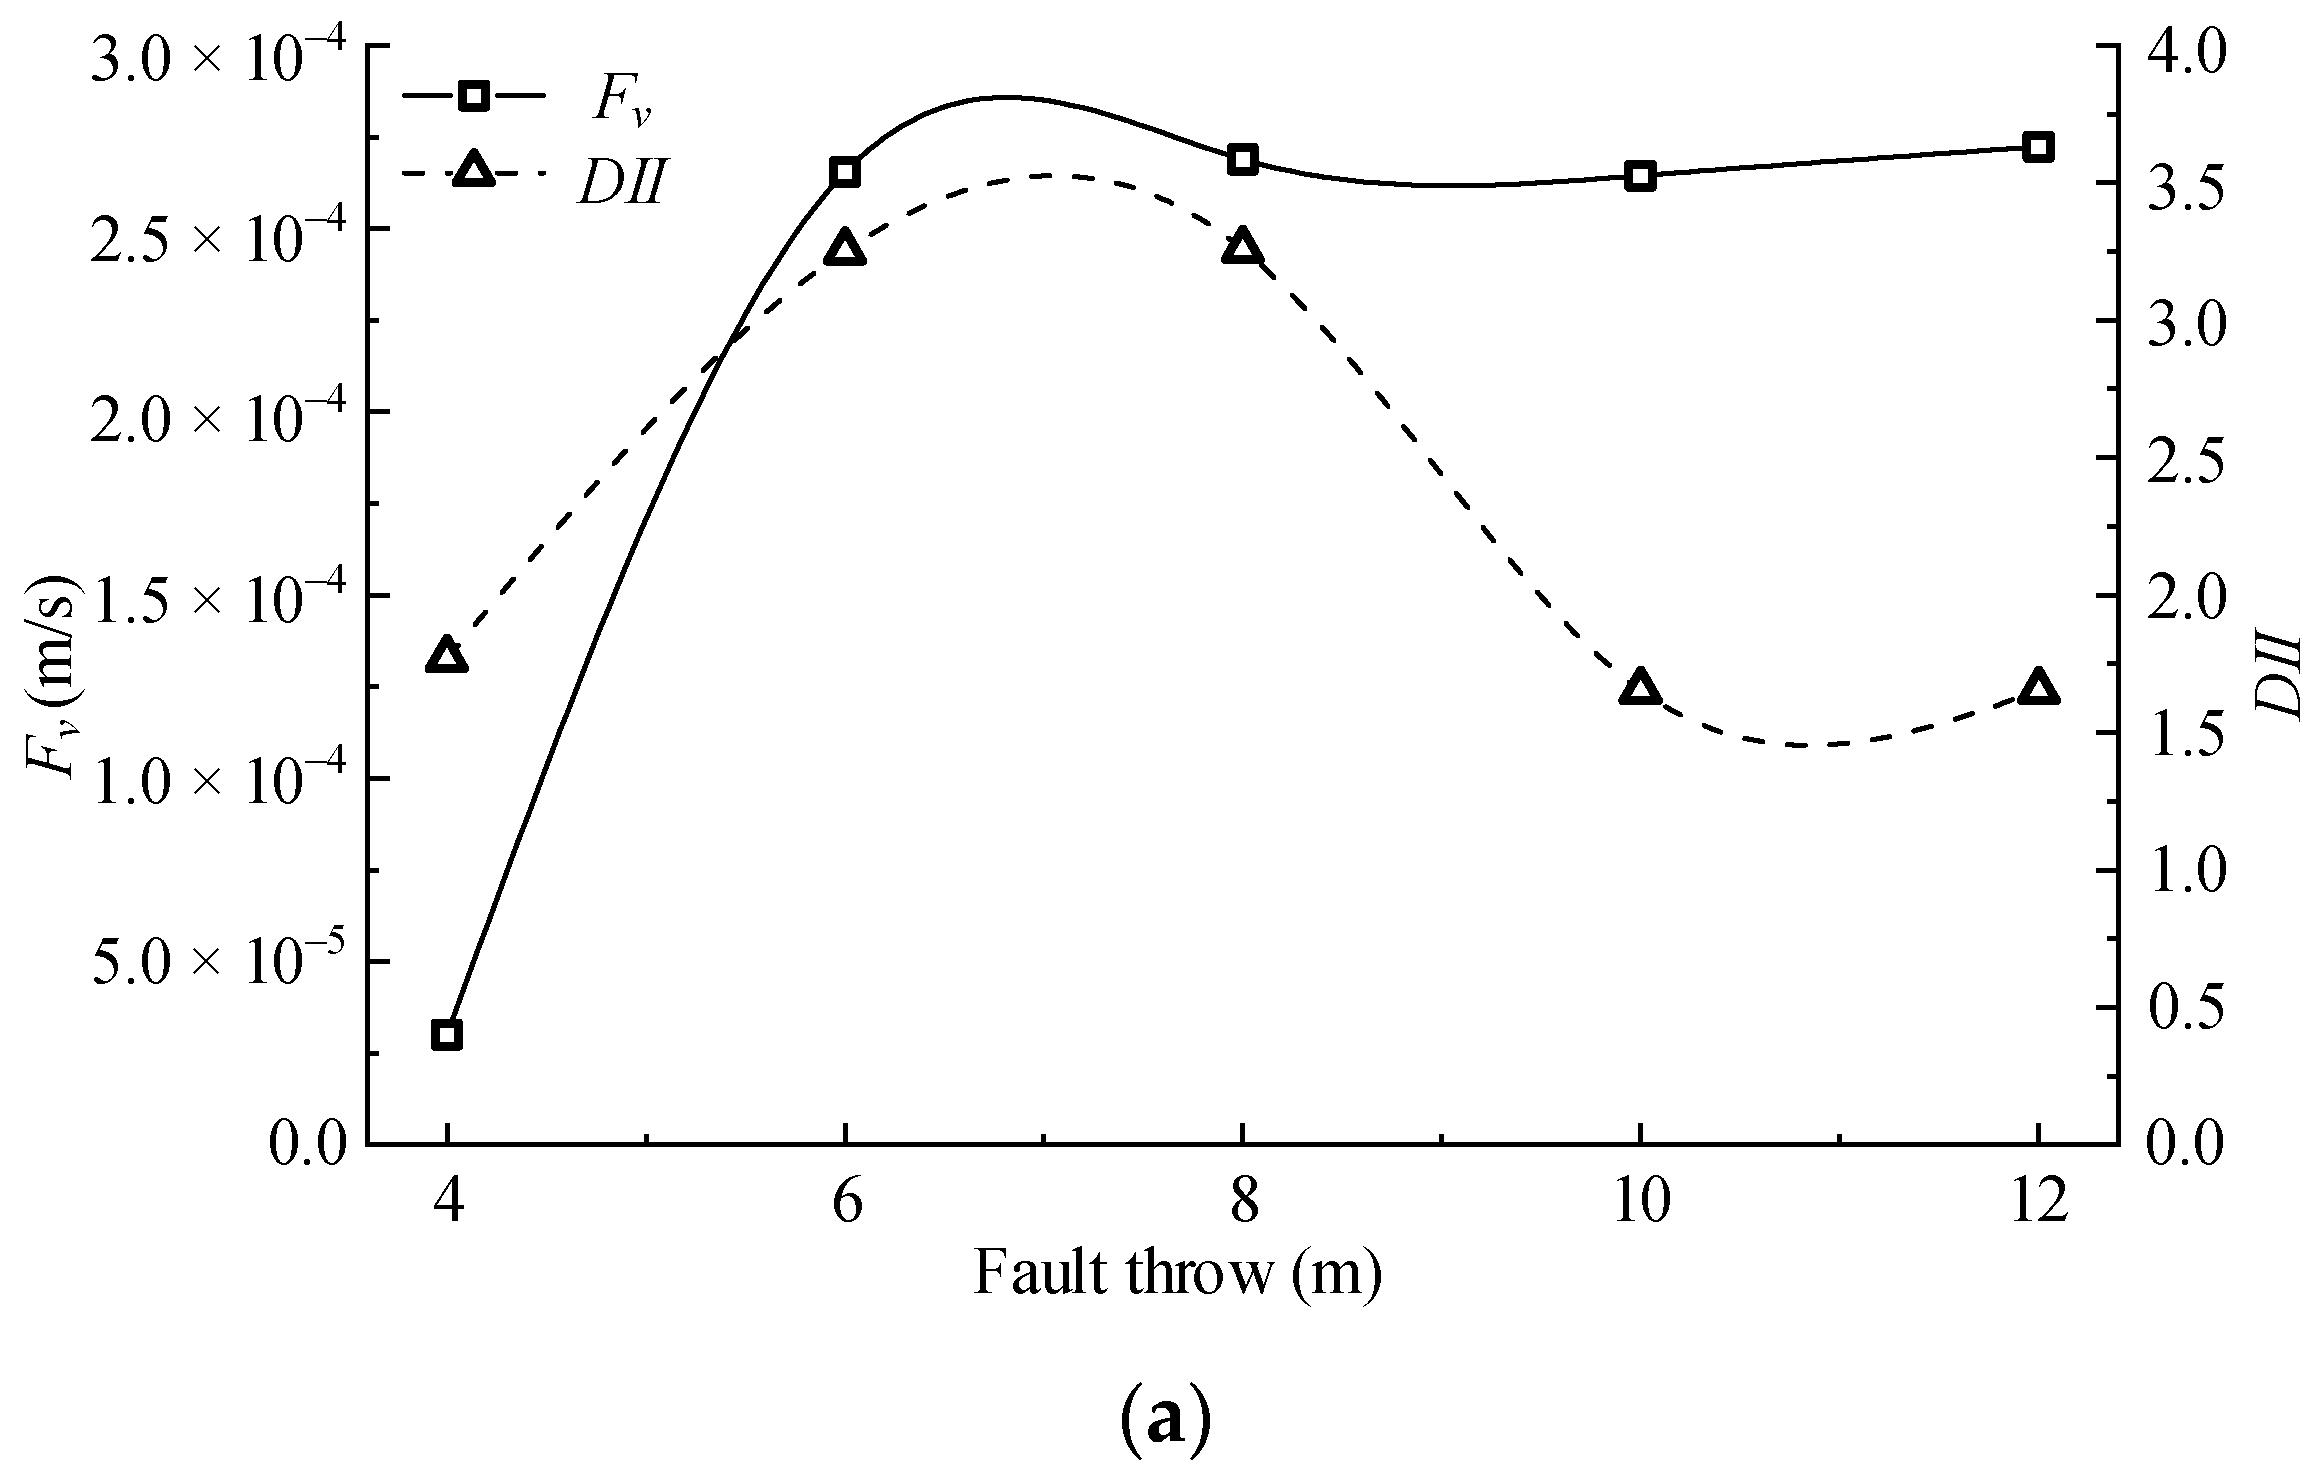
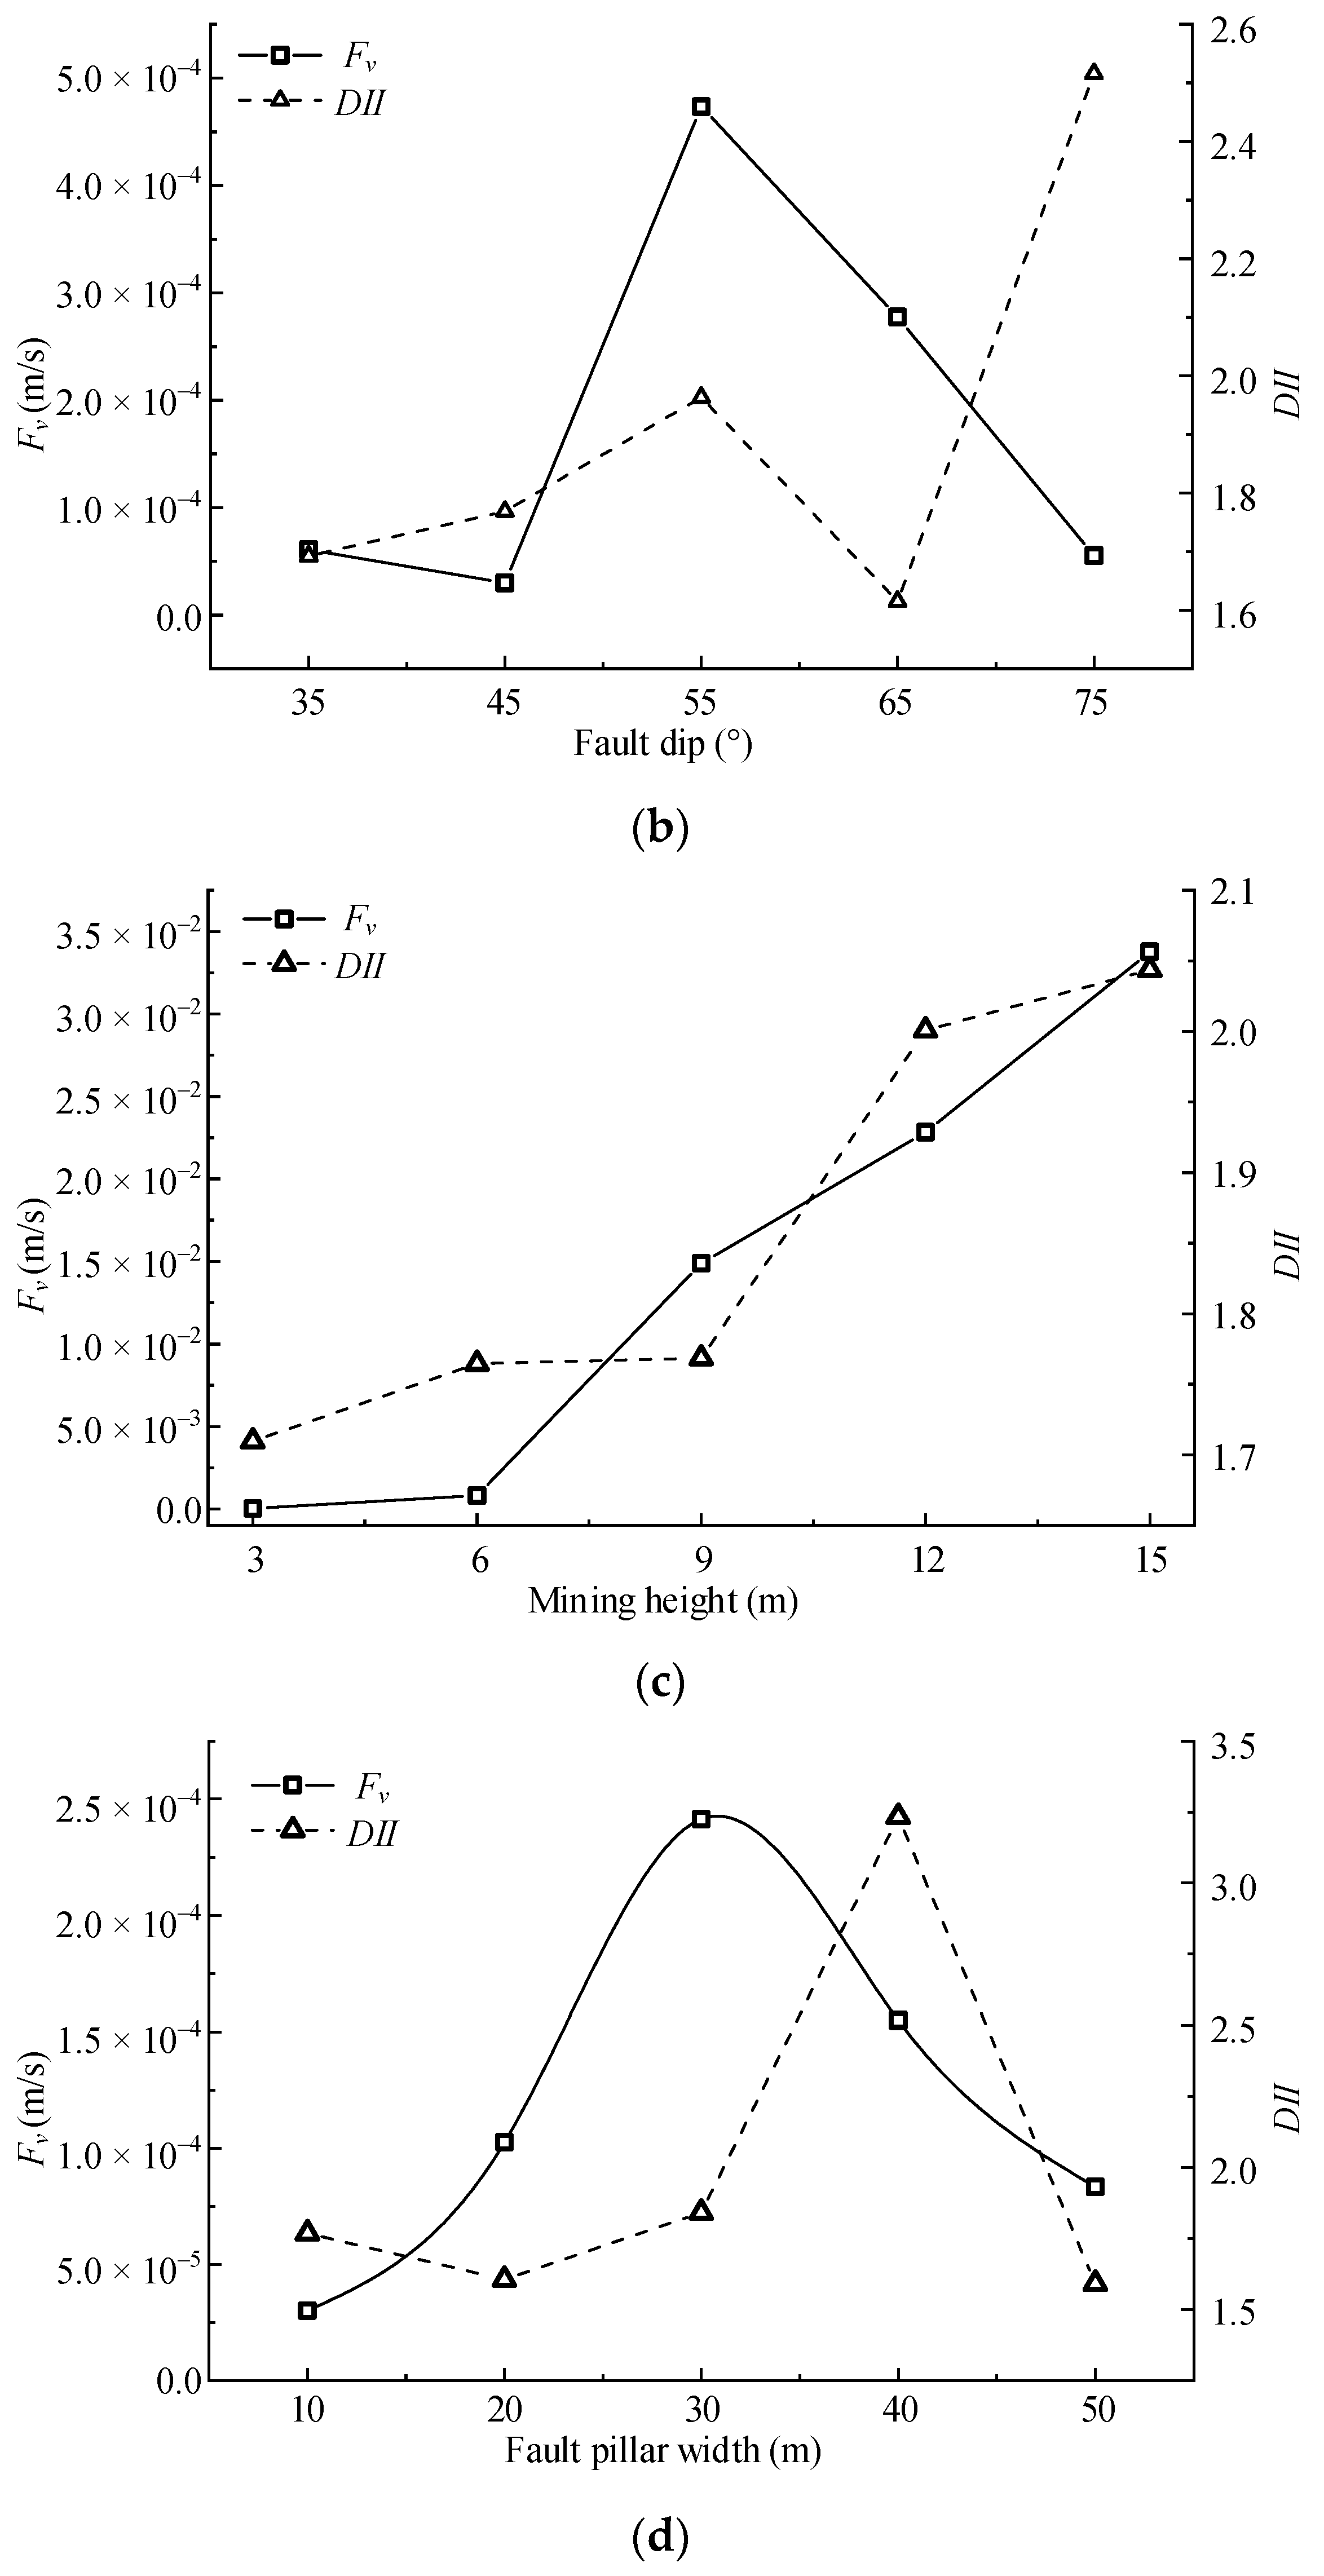
- The analysis of the influence of different parameters of graben faults on rock burst potential shows that none of them are linearly related to the level of static or dynamic load. It is noticed that the longwall face has the highest rock burst risk when the fault throw is between 6 and 8 m, the fault dip is larger than 65°, the mining height is greater than 6 m, and the coal pillar width is less than 50 m.
- (4)
- This approach of combined faults (i.e., stair-stepping, imbricate, horst, and ramp fault model) will produce higher dynamic load stress during longwall retreat. The main control factor for different two combined faults leading to the rise of static load stress and dynamic proneness is different in which fault pillar width is the most significant factor.
Author Contributions
Funding
Data Availability Statement
Conflicts of Interest
References
- Akdag, S.; Karakus, M.; Nguyen, G.D.; Taheri, A.; Bruning, T. Evaluation of the propensity of strain burst in brittle granite based on post-peak energy analysis. Undergr. Space 2021, 6, 1–11. [Google Scholar] [CrossRef]
- Cao, A.; Dou, L.; Cai, W.; Gong, S.; Liu, S.; Jing, G. Case study of seismic hazard assessment in underground coal mining using passive tomography. Int. J. Rock Mech. Min. Sci. 2015, 78, 1–9. [Google Scholar] [CrossRef]
- Faradonbeh, R.S.; Taheri, A.; Karakus, M. The propensity of the over-stressed rock masses to different failure mechanisms based on a hybrid probabilistic approach. Tunn. Undergr. space Technol. 2022, 119, 104214. [Google Scholar] [CrossRef]
- Jiang, L.; Wu, Q.; Wu, Q.; Wang, P.; Xue, Y.; Kong, P.; Gong, B. Fracture failure analysis of hard and thick key layer and its dynamic response characteristics. Eng. Fail. Anal. 2019, 98, 118–130. [Google Scholar] [CrossRef]
- Khan, M.; He, X.; Farid, A.; Song, D.; Li, Z.; Tian, X.; Ni, M. A novel geophysical method for fractures mapping and risk zones identification in a coalmine, Northeast, China. Energy Rep. 2021, 7, 3785–3804. [Google Scholar] [CrossRef]
- Manouchehrian, A.; Cai, M. Numerical modeling of rockburst near fault zones in deep tunnels. Tunn. Undergr. Space Technol. 2018, 80, 164–180. [Google Scholar] [CrossRef]
- Vardar, O.; Zhang, C.; Canbulat, I.; Hebblewhite, B. Numerical modelling of strength and energy release characteristics of pillar-scale coal mass. J. Rock Mech. Geotech. Eng. 2019, 11, 935–943. [Google Scholar] [CrossRef]
- Wang, C.; Cao, A.; Zhu, G.; Jing, G.; Li, J.; Chen, T. Mechanism of rock burst induced by fault slip in an island coal panel and hazard assessment using seismic tomography: A case study from Xuzhuang colliery, Xuzhou, China. Geosci. J. 2017, 21, 469–481. [Google Scholar] [CrossRef]
- Wang, H.; Shi, R.; Lu, C.; Jiang, Y.; Deng, D.; Zhang, D. Investigation of sudden faults instability induced by coal mining. Saf. Sci. 2019, 115, 256–264. [Google Scholar] [CrossRef]
- Dou, L.; He, X. Theory and Technology of Rock Burst Prevention; China University of Mining and Technology Press: Xuzhou, China, 2001. [Google Scholar]
- Keneti, A.; Sainsbury, B.-A.; Dargaville, R. Consideration of Strain-Bursting Phenomena Associated with Large-Scale Discontinuities: A Numerical Study. Pure Appl. Geophys. 2021, 178, 3581–3600. [Google Scholar] [CrossRef]
- Sainoki, A.; Schwartzkopff, A.K.; Jiang, L.; Mitri, H.S. Numerical Modeling of Complex Stress State in a Fault Damage Zone and Its Implication on Near-Fault Seismic Activity. J. Geophys. Res.: Solid Earth 2021, 126, e2021JB021784. [Google Scholar] [CrossRef]
- Wang, P.; Jiang, L.; Jiang, J.; Zheng, P.; Li, W. Strata Behaviors and Rock Burst–Inducing Mechanism under the Coupling Effect of a Hard, Thick Stratum and a Normal Fault. Int. J. Geomech. 2018, 18, 04017135. [Google Scholar] [CrossRef]
- Wang, P.; Jiang, L.-s.; Zheng, P.-q.; Qin, G.-p.; Zhang, C. Inducing mode analysis of rock burst in fault-affected zone with a hard–thick stratum occurrence. Environ. Earth Sci. 2019, 78, 467. [Google Scholar] [CrossRef]
- Pang, Y. Study on Rock Burst Initiation and Failure Propagation; Tsinghua University: Beijing, China, 1999. [Google Scholar]
- Feng, J.; Wang, E.; Ding, H.; Huang, Q.; Chen, X. Deterministic seismic hazard assessment of coal fractures in underground coal mine: A case study. Soil Dyn. Earthq. Eng. 2020, 129, 105921. [Google Scholar] [CrossRef]
- Keneti, A.; Sainsbury, B.-A. Review of published rockburst events and their contributing factors. Eng. Geol. 2018, 246, 361–373. [Google Scholar] [CrossRef]
- Ortlepp, W.D.; Armstrong, R.; Ryder, J.A.; O’Connor, D. Fundamental Study of Micro-Fracturing on the Slip Surface of Mine-Induced Dynamic Brittle Shear Zones. In Proceedings of the 6th International Symposium on Rockburst and Seismicity in Mines, Perth, Australia, 9–11 March 2005. [Google Scholar]
- Hofmann, G.F.; Scheepers, L.J. Simulating fault slip areas of mining induced seismic tremors using static boundary element numerical modelling. Min. Technol. 2011, 120, 53–64. [Google Scholar] [CrossRef]
- Sainoki, A.; Mitri, H.S. Back analysis of fault-slip in burst prone environment. J. Appl. Geophys. 2016, 134, 159–171. [Google Scholar] [CrossRef]
- Alber, M.; Fritschen, R. Rock mechanical analysis of a Ml= 4.0 seismic event induced by mining in the Saar District, Germany. Geophys. J. Int. 2011, 186, 359–372. [Google Scholar] [CrossRef] [Green Version]
- Tajdus, A.; Cala, M.; Tajdus, K. Seismicity and Rock Burst Hazard Assessment in Fault Zones: A Case Study. Arch. Min. Sci. 2018, 63, 747–765. [Google Scholar] [CrossRef]
- Uskov, V.A.; Eremenko, A.A.; Darbinyan, T.P.; Marysyuk, V.P. Geodynamic Hazard Assessment for Tectonic Structures in Underground Mining of North Ore Bodies in the Oktyabrsky Deposit. J. Min. Sci. 2019, 55, 77–87. [Google Scholar] [CrossRef]
- Stewart, R.A.; Reimold, W.U.; Charlesworth, E.G.; Ortlepp, W.D. The nature of a deformation zone and fault rock related to a recent rockburst at Western Deep Levels Gold Mine, Witwatersrand Basin, South Africa. Tectonophysics 2001, 337, 173–190. [Google Scholar] [CrossRef]
- Li, Z.; Dou, L.; Cai, W.; Wang, G.; He, J.; Gong, S.; Ding, Y. Investigation and analysis of the rock burst mechanism induced within fault–pillars. Int. J. Rock Mech. Min. Sci. 2014, 70, 192–200. [Google Scholar] [CrossRef]
- Cai, W.; Dou, L.; Si, G.; Hu, Y. Fault-Induced Coal Burst Mechanism under Mining-Induced Static and Dynamic Stresses. Engineering 2021, 7, 687–700. [Google Scholar] [CrossRef]
- Wang, H.; Shi, R.; Song, J.; Tian, Z.; Deng, D.; Jiang, Y. Mechanical model for the calculation of stress distribution on fault surface during the underground coal seam mining. Int. J. Rock Mech. Min. Sci. 2021, 144, 104765. [Google Scholar] [CrossRef]
- Administration, N.M.S. Government Information Publicity. Available online: https://www.chinamine-safety.gov.cn/ (accessed on 15 December 2021).
- Starfield, A.M.; Cundall, P.A. Towards a methodology for rock mechanics modelling. Int. J. Rock Mech. Min. Sci. Geomech. Abstr. 1988, 25, 99–106. [Google Scholar] [CrossRef]
- Wei, C.; Zhang, C.; Canbulat, I.; Huang, W. Numerical investigation into impacts of major fault on coal burst in longwall mining—A case study. Int. J. Rock Mech. Min. Sci. 2021, 147, 104907. [Google Scholar] [CrossRef]
- Jiang, L.; Kong, P.; Zhang, P.; Shu, J.; Wang, Q.; Chen, L.; Wu, Q. Dynamic Analysis of the Rock Burst Potential of a Longwall Panel Intersecting with a Fault. Rock Mech. Rock Eng. 2019, 53, 1737–1754. [Google Scholar] [CrossRef]
- Bizzarri, A. Rupture speed and slip velocity: What can we learn from simulated earthquakes? Earth Planet. Sci. Lett. 2012, 317–318, 196–203. [Google Scholar] [CrossRef]
- Sainoki, A.; Mitri, H.S. Dynamic modelling of fault-slip with Barton׳s shear strength model. Int. J. Rock Mech. Min. Sci. 2014, 67, 155–163. [Google Scholar] [CrossRef]
- U.S. Geological Survey. What Is a Fault and What Are the Different Types? Available online: https://www.usgs.gov/faqs/what-a-fault-and-what-are-different-types?qt-news_science_products=0#qt-news_science_products (accessed on 10 November 2021).
- Hu, M. Structural Geology; Petroleum Industry Press: Beijing, China, 2015. [Google Scholar]
- Stawikowski, W. Structural Geology, 2nd ed.; Cambridge University Press: Cambridge, UK, 2017; Volume 23. [Google Scholar]
- Chen, S.; Yin, D.; Liu, H.; Chen, B.; Jiang, N. Effects of coal’s initial macro-cracks on rockburst tendency of rock–coal composite samples. R. Soc. Open Sci. 2019, 6, 181795. [Google Scholar] [CrossRef] [Green Version]
- Ma, K.; Yuan, F.; Wang, H.; Zhang, Z.; Sun, X.; Peng, Y.; Wang, H. Fracture mechanism of roof key strata in Dongjiahe coal mine using microseismic moment tensor. Geomat. Nat. Hazards Risk 2021, 12, 1467–1487. [Google Scholar] [CrossRef]
- Gao, F.; Stead, D.; Kang, H. Simulation of roof shear failure in coal mine roadways using an innovative UDEC Trigon approach. Comput. Geotech. 2014, 61, 33–41. [Google Scholar] [CrossRef]
- Mondal, D.; Roy, P.N.S. Fractal and seismic b-value study during dynamic roof displacements (roof fall and surface blasting) for enhancing safety in the longwall coal mines. Eng. Geol. 2019, 253, 184–204. [Google Scholar] [CrossRef]
- Wang, H.; Xue, S.; Shi, R.; Jiang, Y.; Gong, W.; Mao, L. Investigation of Fault Displacement Evolution During Extraction in Longwall Panel in an Underground Coal Mine. Rock Mech. Rock Eng. 2020, 53, 1809–1826. [Google Scholar] [CrossRef]
- Cao, A.; Jing, G.; Dou, L.; Wu, Y.; Zhang, C. Statistical analysis of distribution patterns of coal seams in fold zones in Northwest China. Int. J. Min. Sci. Technol. 2018, 28, 819–828. [Google Scholar] [CrossRef]
- Chen, G.; Wang, Z.; Dou, L. The Study on Prevention of Rockburst when Mining in Folding Structure Areas. In Proceedings of the Asia-Pacific Power and Energy Engineering Conference (APPEEC 2011), Wuhan, China, 25–28 March 2011. [Google Scholar]
- Xue, Y.; Cao, Z.; Shen, W. Destabilization and energy characteristics of coal pillar in roadway driving along gob based on rockburst risk assessment. R. Soc. Open Sci. 2019, 6, 190094. [Google Scholar] [CrossRef] [PubMed] [Green Version]
- Cao, A.-Y.; Dou, L.-M.; Wang, C.-B.; Yao, X.-X.; Dong, J.-Y.; Gu, Y. Microseismic Precursory Characteristics of Rock Burst Hazard in Mining Areas Near a Large Residual Coal Pillar: A Case Study from Xuzhuang Coal Mine, Xuzhou, China. Rock Mech. Rock Eng. 2016, 49, 4407–4422. [Google Scholar] [CrossRef]
- Platform RBC Investigation Report of “2.22” Ground Pressure Impact Accident of Shandong New Julong Energy Co., LTD. Available online: https://mp.weixin.qq.com/s/cZ65mX6ZYuhs5ndyN6kCrA (accessed on 21 April 2020).
- Romashov, A.N.; Tsygankov, S.S. Generalized model of rock bursts. J. Min. Sci. 1993, 28, 420–423. [Google Scholar] [CrossRef]
- Chen, Z.H.; Tang, C.A.; Huang, R.Q. A double rock sample model for rockbursts. Int. J. Rock Mech. Min. Sci. 1997, 34, 991–1000. [Google Scholar] [CrossRef]
- Ma, T.-H.; Tang, C.-A.; Tang, S.-B.; Kuang, L.; Yu, Q.; Kong, D.-Q.; Zhu, X. Rockburst mechanism and prediction based on microseismic monitoring. Int. J. Rock Mech. Min. Sci. 2018, 110, 177–188. [Google Scholar] [CrossRef]
- Cai, W.; Dou, L.; Si, G.; Cao, A.; He, J.; Liu, S. A principal component analysis/fuzzy comprehensive evaluation model for coal burst liability assessment. Int. J. Rock Mech. Min. Sci. 2016, 81, 62–69. [Google Scholar] [CrossRef]
- Kidybiński, A. Bursting liability indices of coal. Int. J. Rock Mech. Min. Sci. Geomech. Abstr. 1981, 18, 295–304. [Google Scholar] [CrossRef]
- Cook, N.G.W. A note on rockbursts considered as a problem of stability. J. South. Afr. Inst. Min. Metall. 1965, 65, 437–446. [Google Scholar] [CrossRef]
- Linkov, A.M. Rockbursts and the instability of rock masses. Int. J. Rock Mech. Min. Sci. Geomech. Abstr. 1996, 33, 727–732. [Google Scholar] [CrossRef]
- Hudson, J.A.; Crouch, S.L.; Fairhurst, C. Soft, stiff and servo-controlled testing machines: A review with reference to rock failure. Eng. Geol. 1972, 6, 155–189. [Google Scholar] [CrossRef]
- Xu, S.; Yao, Z.; Zhou, J.; Liu, Y.; Fang, C.; Du, M. Transmittance enhancement of micro-grating structure sapphire with high-refractive index Y2O3 layer. J. Mod. Opt. 2017, 64, 777–780. [Google Scholar] [CrossRef]
- Zhang, C.; Jin, G.; Liu, C.; Li, S.; Xue, J.; Cheng, R.; Wang, X.; Zeng, X. Prediction of rockbursts in a typical island working face of a coal mine through microseismic monitoring technology. Tunn. Undergr. Space Technol. 2021, 113, 103972. [Google Scholar] [CrossRef]
- Yang, D.; Zhang, Y.; Chen, Z. Analysis on Catastrophe Theory during First Weighting Sliding Instability and Support Crushing of Main Roof with Large Mining Height in Shallow Coal Seam. Appl. Sci. 2020, 10, 5408. [Google Scholar] [CrossRef]
- Zhu, G.-a.; Dou, L.-m.; Li, Z.-l.; Cai, W.; Kong, Y.; Li, J. Mining-induced stress changes and rock burst control in a variable-thickness coal seam. Arab. J. Geosci. 2016, 9, 365. [Google Scholar] [CrossRef]
- Itasca, I. FLAC3D: Fast Lagrangian Analysis of Continua in 3 Dimension, Version Minneapolis; Itasca Consulting Group: Minneapolis, MN, USA, 2012. [Google Scholar]
- Karakaş, A. Practical Rock Engineering. Environ. Eng. Geosci. 2008, 14, 55–57. [Google Scholar] [CrossRef]
- Le, T.D.; Bui, X.-N. Effect of Key Parameters on Top Coal First Caving and Roof First Weighting in Longwall Top Coal Caving: A Case Study. Int. J. Geomech. 2020, 20, 04020037. [Google Scholar] [CrossRef]
- Cai, W.; Dou, L.; Si, G.; Cao, A.; Gong, S.; Wang, G.; Yuan, S. A new seismic-based strain energy methodology for coal burst forecasting in underground coal mines. Int. J. Rock Mech. Min. Sci. 2019, 123, 104086. [Google Scholar] [CrossRef]
- Zubelewicz, A.; Mróz, Z. Numerical simulation of rock burst processes treated as problems of dynamic instability. Rock Mech. Rock Eng. 1983, 16, 253–274. [Google Scholar] [CrossRef]
- Cai, W.; Bai, X.; Si, G.; Cao, W.; Gong, S.; Dou, L. A Monitoring Investigation into Rock Burst Mechanism Based on the Coupled Theory of Static and Dynamic Stresses. Rock Mech. Rock Eng. 2020, 53, 5451–5471. [Google Scholar] [CrossRef]
- Cao, A.; Jing, G.; Ding, Y.-l.; Liu, S. Mining-induced static and dynamic loading rate effect on rock damage and acoustic emission characteristic under uniaxial compression. Saf. Sci. 2019, 116, 86–96. [Google Scholar] [CrossRef]
- Dou, L.-m.; Mu, Z.-l.; Li, Z.-l.; Cao, A.-y.; Gong, S.-y. Research progress of monitoring, forecasting, and prevention of rockburst in underground coal mining in China. Int. J. Coal Sci. Technol. 2014, 1, 278–288. [Google Scholar] [CrossRef] [Green Version]
- He, J.; Dou, L.; Gong, S.; Li, J.; Ma, Z. Rock burst assessment and prediction by dynamic and static stress analysis based on micro-seismic monitoring. Int. J. Rock Mech. Min. Sci. 2017, 93, 46–53. [Google Scholar] [CrossRef]
- Li, Z.-l.; Dou, L.-m.; Wang, G.-f.; Cai, W.; He, J.; Ding, Y.-l. Risk evaluation of rock burst through theory of static and dynamic stresses superposition. J. Cent. South Univ. 2015, 22, 676–683. [Google Scholar] [CrossRef]
- Wang, C.; Cao, A.; Zhang, C.; Canbulat, I. A New Method to Assess Coal Burst Risks Using Dynamic and Static Loading Analysis. Rock Mech. Rock Eng. 2019, 53, 1113–1128. [Google Scholar] [CrossRef]
- Jaeger, J.; Cook, N.; Zimmerman, R. Fundamental of Rock Mechanics; Wiley-Blackwell: Hoboken, NJ, USA, 2007. [Google Scholar]
- PANG, Y.; WANG, G.; LI, B. Stress path effect and instability process analysis of overlying strata in deep stopes. Chin. J. Rock Mech. Eng. 2020, 39, 682–694. [Google Scholar]
- Bhat, H.; Dunham, E. Attenuation of Radiated Ground Motion and Stresses from Three-Dimensional Supershear Ruptures. J. Geophys. Res. (Solid Earth) 2008, 113, B08319. [Google Scholar] [CrossRef] [Green Version]
- Dou, L.; He, X. Technique of classification forecasting rock burst in coal mines. J. China Univ. Min. Technol. 2007, 36, 717–722. [Google Scholar]
- Box, G.; Hunter, S.; Hunter, W. Statistics for Experimenters: Design, Innovation, and Discovery, 2nd ed.; Wiley-Interscience: New York, NY, USA, 2005. [Google Scholar]


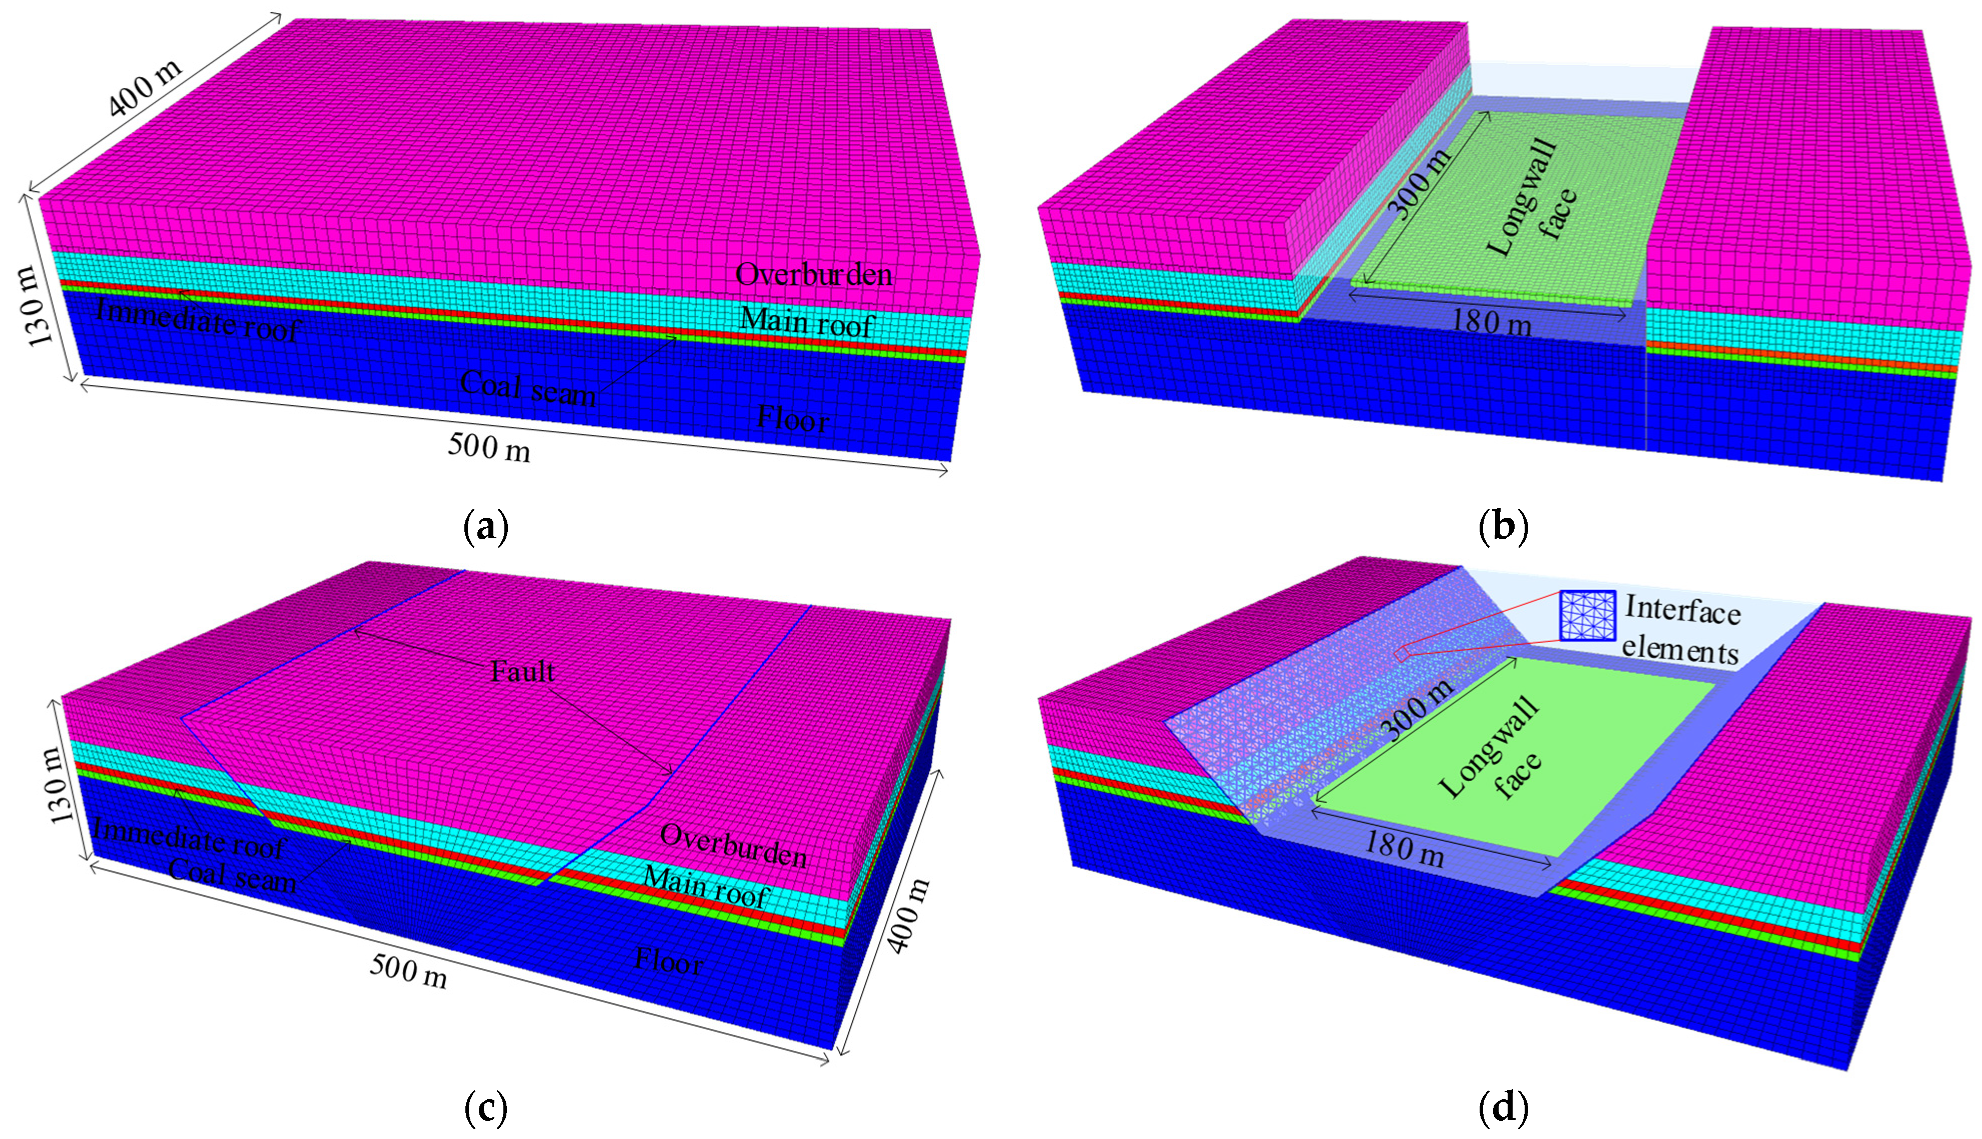
 blocks represent overburdens; the
  blocks represent main roofs; the
  blocks represent immediate roofs; the
  blocks represent coal seams; and the
  blocks represent floors.
blocks represent overburdens; the blocks represent main roofs; the blocks represent immediate roofs; the blocks represent coal seams; and the blocks represent floors.
blocks represent floors.
blocks represent overburdens; the blocks represent main roofs; the blocks represent immediate roofs; the blocks represent coal seams; and the blocks represent floors.


| Types of Two Combined Faults | Types of Two Embedded Faults | Identification |
|---|---|---|
| Stair-stepping fault | Two normal faults | The stair-stepping fault is formed by two parallel normal faults, the hanging walls of which descend in the same direction, resembling a staircase. |
| Imbricate fault | Two thrust faults | The imbricate fault is formed by two parallel thrust faults, the hanging walls of which descend in the same direction, resembling a roof tile on the house. |
| Graben fault | Two normal faults | The graben fault is composed of two symmetrical and inclined normal faults with fault walls rising on both sides and a common descending wall in the middle. |
| Horst fault | Two normal faults | The horst fault is composed of two symmetrically inclined normal faults with fault walls descending on both sides and common uplifting walls in the middle. |
| Back thrust fault | Two thrust faults | It is similar to the graben fault, but the back thrust fault consists of two thrust faults. |
| Ramp fault | Two thrust faults | It is similar to the horst fault, but the ramp fault consists of two thrust faults. |
| Items | Thickness (m) | Bulk Module (GPa) | Shear Module (GPa) | Cohesion (MPa) | Internal Friction Angle (°) | Density (kg·m−3) |
|---|---|---|---|---|---|---|
| Overburden | 37 | 1.31 | 0.42 | 0.30 | 33 | 2500 |
| Main roof | 20 | 2.30 | 1.52 | 1.7 | 38 | 2700 |
| Immediate roof | 5 | 1.31 | 0.42 | 0.30 | 33 | 2500 |
| Coal seam | 3 | 0.15 | 0.08 | 0.11 | 25 | 1400 |
| Floor | 65 | 1.97 | 1.14 | 0.40 | 35 | 2600 |
| Interface elements | / | interfacial cohesion = 2.0 MPa, interfacial friction angle = 30°, kn = ks ≈ 2.16 × 10¹⁰ Pa/m. | ||||
| Level | A | B | C |
|---|---|---|---|
| Throw (m) | Dip (°) | Pillar Width (m) | |
| 1 | 4 | 45 | 10 |
| 2 | 8 | 60 | 40 |
| 3 | 12 | 75 | 70 |
| Level (Scheme) | A | B | C | D |
|---|---|---|---|---|
| Throw (m) | Dip (°) | Pillar Width (m) | / | |
| 1 | 4 | 45 | 10 | / |
| 2 | 4 | 60 | 40 | / |
| 3 | 4 | 75 | 70 | / |
| 4 | 8 | 45 | 70 | / |
| 5 | 8 | 60 | 10 | / |
| 6 | 8 | 75 | 40 | / |
| 7 | 12 | 45 | 40 | / |
| 8 | 12 | 60 | 70 | / |
| 9 | 12 | 75 | 10 | / |
Publisher’s Note: MDPI stays neutral with regard to jurisdictional claims in published maps and institutional affiliations. |
© 2021 by the authors. Licensee MDPI, Basel, Switzerland. This article is an open access article distributed under the terms and conditions of the Creative Commons Attribution (CC BY) license (https://creativecommons.org/licenses/by/4.0/).
Share and Cite
Cao, A.; Liu, Y.; Jiang, S.; Hao, Q.; Peng, Y.; Bai, X.; Yang, X. Numerical Investigation on Influence of Two Combined Faults and Its Structure Features on Rock Burst Mechanism. Minerals 2021, 11, 1438. https://0-doi-org.brum.beds.ac.uk/10.3390/min11121438
Cao A, Liu Y, Jiang S, Hao Q, Peng Y, Bai X, Yang X. Numerical Investigation on Influence of Two Combined Faults and Its Structure Features on Rock Burst Mechanism. Minerals. 2021; 11(12):1438. https://0-doi-org.brum.beds.ac.uk/10.3390/min11121438
Chicago/Turabian StyleCao, Anye, Yaoqi Liu, Siqi Jiang, Qi Hao, Yujie Peng, Xianxi Bai, and Xu Yang. 2021. "Numerical Investigation on Influence of Two Combined Faults and Its Structure Features on Rock Burst Mechanism" Minerals 11, no. 12: 1438. https://0-doi-org.brum.beds.ac.uk/10.3390/min11121438