
Grinding Media Motion and Collisions in Different Zones of Stirred Media Mills


Institute for Particle Technology, Technische Universität Braunschweig, 38104 Braunschweig, Germany
*
Author to whom correspondence should be addressed.
Minerals 2021, 11(2), 185; https://0-doi-org.brum.beds.ac.uk/10.3390/min11020185
Submission received: 16 December 2020
/
Revised: 25 January 2021
/
Accepted: 5 February 2021
/
Published: 11 February 2021
(This article belongs to the Special Issue Simulation Using the Discrete Element Method (DEM) in the Minerals Industry)
Abstract
:Product fineness during grinding in stirred media mills is mainly influenced by the specific energy input, the stress energy transferred by the colliding grinding media and the stress frequency. The stress energy from grinding media collisions is heterogeneously distributed in stirred media mills. Herein, in order to characterize the stress energy distribution and the local grinding media collision frequencies, the grinding media motion was calculated using discrete element method (DEM) simulations coupled with computational fluid dynamics (CFD). The local grinding media concentration, velocity profiles, grinding media collisions and stress energies were compared for varied total grinding media fillings and stirrer speeds. It was confirmed that the normalized grinding media velocity profile can be used to divide the grinding chamber into four types of zones that allow the modeling of the stress energy distribution. However, the collision frequency showed very different distributions for varied stirrer velocities and grinding media fillings.
1. Introduction
The wet milling process in stirred media mills is applied by various industries for the production of fine particles, for example, pharmaceutics, inks or ceramics [1]. The minerals industry has also adopted horizontal stirred media mills [2], such as the IsaMillTM, to meet the demand for particles in the lower micrometer range [3]. The production of nanoparticles is possible using wet stirred media milling [4], and with a promising ultrasound assisted approach even at high solids concentration [5]. Apart from grinding, stirred media mills are applied to induce mechanochemical reactions [6]. The performance of these mills is defined by operational parameters, such as the grinding medium type and stirrer tip speed but depends also on the geometric design of the mill. It is of interest to understand the interplay of these parameters in order to improve process models and to scale up production [7]. In particular, the understanding of the motion of the grinding media helps to describe one of the key mechanisms: the collision of grinding media. The frequency, energy, and type of grinding media collisions decisively determine the grinding result.
Many studies have therefore investigated the grinding media motion in stirred media mills using particle tracking methods such as positron emission particle tracking (PEPT; e.g., [8]) or particle tracking through glass grinding chambers [9]. The grinding media flow field is also described based on computational fluid dynamic (CFD) simulations [10,11,12], with the discrete element method (DEM) [13,14,15,16], or, in order to represent both fluid flow and grinding media and their respective influences, by the coupling of DEM with CFD [17,18,19] or smoothed particle hydrodynamics (SPH) [20].
Based on insights of the grinding media movement, models have been developed that allow the prediction of the grinding results to some extent. One type of model takes the stress energy distribution directly as an outcome of the simulations and uses it as a model parameter [21,22]. In principle, this type of model promises to be precise; however, the approach involves conducting DEM simulations for each specific parameter case and is, therefore, time-intensive.
Another approach generalizes the outcomes of simulations in order to model the stress energy distribution based on geometrical considerations and assumptions of the relationship between grinding media collision energy and operational parameters [7,23]. Stender et al. [7] defined volumes for which certain stress energy characteristics can be concluded; the model is based on results of CFD simulations [11,12].
The aim of this work was to review the choice of volumes, defined by Stender et al. [7] and used in a similar way by Breitung-Faes and Kwade [23], via coupled DEM–CFD simulations, and to further characterize these volumes. The grinding media fillings analyzed herein ranged between 50% and 90%, whereby the technically relevant filling levels are mostly in the upper range of 70–90%. However, continuous operation of a stirred mill can result in axially heterogeneously distributed grinding media, causing lower local filling levels. Moreover, the stirrer tip speed was varied between 6 and 14 m/s, corresponding to between 1592 and 3714 rpm, respectively. The local grinding media distribution and velocity profiles were described and compared for different parameters. Furthermore, the grinding media collisions, as well as the resulting stress energies and power inputs, were shown in spatial distribution.
2. Simulation Set-Up and Methods
2.1. Discrete Element Method and Computation Fluid Dynamics Simulations
Coupled CFD–DEM simulations were carried out to investigate the fluid and grinding media motion and the grinding media collisions. The software packages used were OpenFOAM 4.x for the CFD simulations, LIGGGHTS-PFM (academic adaption, version 19.02 [24], released by the Department of Particulate Flow Modelling at Johannes Kepler University in Linz, Austria) for the DEM simulations, and CFDEMcoupling-PFM (academic adaption, version 19.02 [25], released by the Department of Particulate Flow Modelling at Johannes Kepler University in Linz, Austria) for the coupling of CFD and DEM. The academic software adaptions are based on LIGGGHTS and CFDEMcoupling from DCS Computing GmbH [26]. The exchange of momentum between the phases was conducted in both directions. The used models were the Hertz–Mindlin contact model in DEM, the k-ε turbulence model in CFD and the Koch–Hill drag function [27] necessary for CFD–DEM coupling. In order to take the repulsive force due to fluid displacement during the approach of two grinding beads into account, a lubrication force between grinding beads was implemented as described in [28]. The DEM was extended to track bead–bead contacts.
The geometry of the laboratory mill with disc stirrer geometry (PM-1, Drais/Buehler, see Figure 1a) consisted of a rotor shaft (rsh = 15 mm) with discs (R = 36 mm). The inner grinding chamber diameter was dcl = 90 mm. The thickness of the disc equaled bdisc = 8 mm and the distance between two discs was D = 20 mm. The simulation area, that is shown in Figure 1b,c, was a representative slice between two grinding discs, wherein the DEM simulation of the boundaries was periodically in the axial direction. The stirrer geometry was simplified to a stirrer with full discs.
The stirrer tip speed varied from 6 to 12 m/s in increments of 2 m/s. Furthermore, the investigated degree of filling of grinding media ranged from 50% to 90%. With a bulk porosity of = 0.4 and a bead size of 0.8 mm, the resulting number of beads in the simulations was between 155,520 and 289,951. Note that only the motion of the grinding media, and not the product particles, were simulated. Table 1 lists the other parameter values that were used in the simulations. The Young’s modulus was decreased by a factor of 104 to allow for a longer time step and, therefore, a quicker simulation [29]. The CFD mesh exhibited 11 cells in the gap between the outer circumference of the stirrer disc and the chamber wall. This mesh size was determined to be suitable by Beinert et al. [18] for the same geometry and bead size.
2.2. Data Evaluation
After introducing the grinding media particles into the simulation area, the stirrer started to rotate at a given speed and the grinding media and fluid became agitated. The analysis of the data started after a processing time of 2 s, when a steady state had been reached (confirmed by a steady translational () and rotational () kinetic energy). The grinding media positions, velocities and forces were sampled 50 times during a 1 s period. Additionally, during this 1 s the position and the collision energy were recorded for all grinding media collisions. According to the approach for representing the grinding beads as “soft-spheres”, two beads overlap during a contact. A collision is counted once at the first time-step of the overlap of two beads. For multi-body contacts, each pair-wise contact was counted as a separate collision. The collision energy of the contact refers to the kinetic energy at the first time-step of the contact and was calculated as described by Beinert et al. [18]. The positions and energies in the interval between 10−20 and 1 J of the grinding media collisions were saved. The collision energy is an upper limit for the stress energy of the bead–bead collisions, i.e., the energy that is at most applied to a product particle captured between two colliding beads. In the translatoric normal direction the stress energy was calculated as follows:
where is the grinding bead mass and is the relative translational, normal component of the velocity. Beinert et al. [18] also distinguished further stress energies resulting from collisions with shear, rolling and torsion components.
2.3. Local Grinding Media Filling
In this article, total grinding media filling describes the defined volumetric ratio of the grinding media filling in the grinding chamber at rest. With the porosity of the grinding media at rest, , the grinding media filling was calculated by:
where is the bulk volume of the grinding media, refers to the volume of solids of the grinding media and is the volume of the fluid-grinding media mixture.
Local grinding media filling refers to the locally defined volumetric ratio of grinding media filling per volume during the stirrer movement, which was also calculated by Equation (2). The porosity of resting monodisperse spheres can be determined quite accurately as = 0.4 and was used in these simulations to calculate the number of beads and the local grinding media filling. A grinding media filling of = 1.0 corresponds to a grinding media volume concentration of = 0.6 at a porosity of = 0.4. During operation, however, the grinding media could be arranged in such a way that locally higher concentrations were possible. In this article, the degree of local filling was related to a porosity of 0.4 in the same way as the total grinding media filling, which means that Equation (2) resulted sometimes in local grinding media fillings greater than 1.
2.4. Geometric Characterization of the Stress Energy Volumes
The simulation geometry was divided into four volumes (named V1–V4) for the data evaluation. These volumes were originally defined by Stender [7] based on velocity profiles resulting from CFD simulations [9] for a similar stirrer geometry. The dimensions of V1–V4 can be found in Figure 2 and Table 2.
3. Results
3.1. Grinding Media Distribution
The distribution of the grinding media within the simulated area is the main indicator of how frequently product particles are stressed within certain zones. The time-averaged, local grinding media concentration for different total filling levels is shown in Figure 3a in plain view along the cylinder axis, and in Figure 3b in a section vertically along the cylinder axis. Due to centrifugal force, the grinding media was concentrated in the outer area. At a stirrer tip speed of vt = 6 m/s, a nearly radially symmetrical concentration profile was achieved. In Figure 3a, the stirrer rotated clockwise. On the rising side of the grinding chamber wall, a slightly higher concentration of grinding media can be seen, as also shown by Jayasundara et al. [30]. Nevertheless, in the following analysis of this study, the simulation data were averaged over the radius.
In Figure 4a,b, the local grinding media filling within the defined volumes of V1–V4 is depicted. The uneven distribution of the grinding media is particularly evident at low total filling levels (see Figure 4b). The lowest grinding media concentrations were found in V1 and V4 for all simulations. In these volumes, the grinding media concentration increased almost proportionally to the total grinding media filling level. The highest grinding media concentrations were mainly found in V3. However, V2 showed a disproportionate increase in the local grinding media concentration at higher total filling levels. At the highest investigated total filling level of 90%, V2 contained the maximum grinding media concentrations. An increase in the stirrer tip speed at a total filling level of 80% had no significant influence on the local grinding media concentration in the volumes (see Figure 4a).
3.2. Grinding Media Velocity
Within the mill, there was a locally dependent grinding media velocity distribution. The averaged local grinding bead speed was highest in the area of the outer circumference of the stirrer disc (see Figure 5). Due to the horizontal grinding chamber arrangement, the velocity profile was not completely radially symmetrical. In Figure 5, the stirrer turned clockwise. At low grinding media filling levels, it was particularly evident that the grinding media were accelerated at the stirrer disc in the ascending area before moving down at high speeds in the descending part directly along the grinding chamber wall.
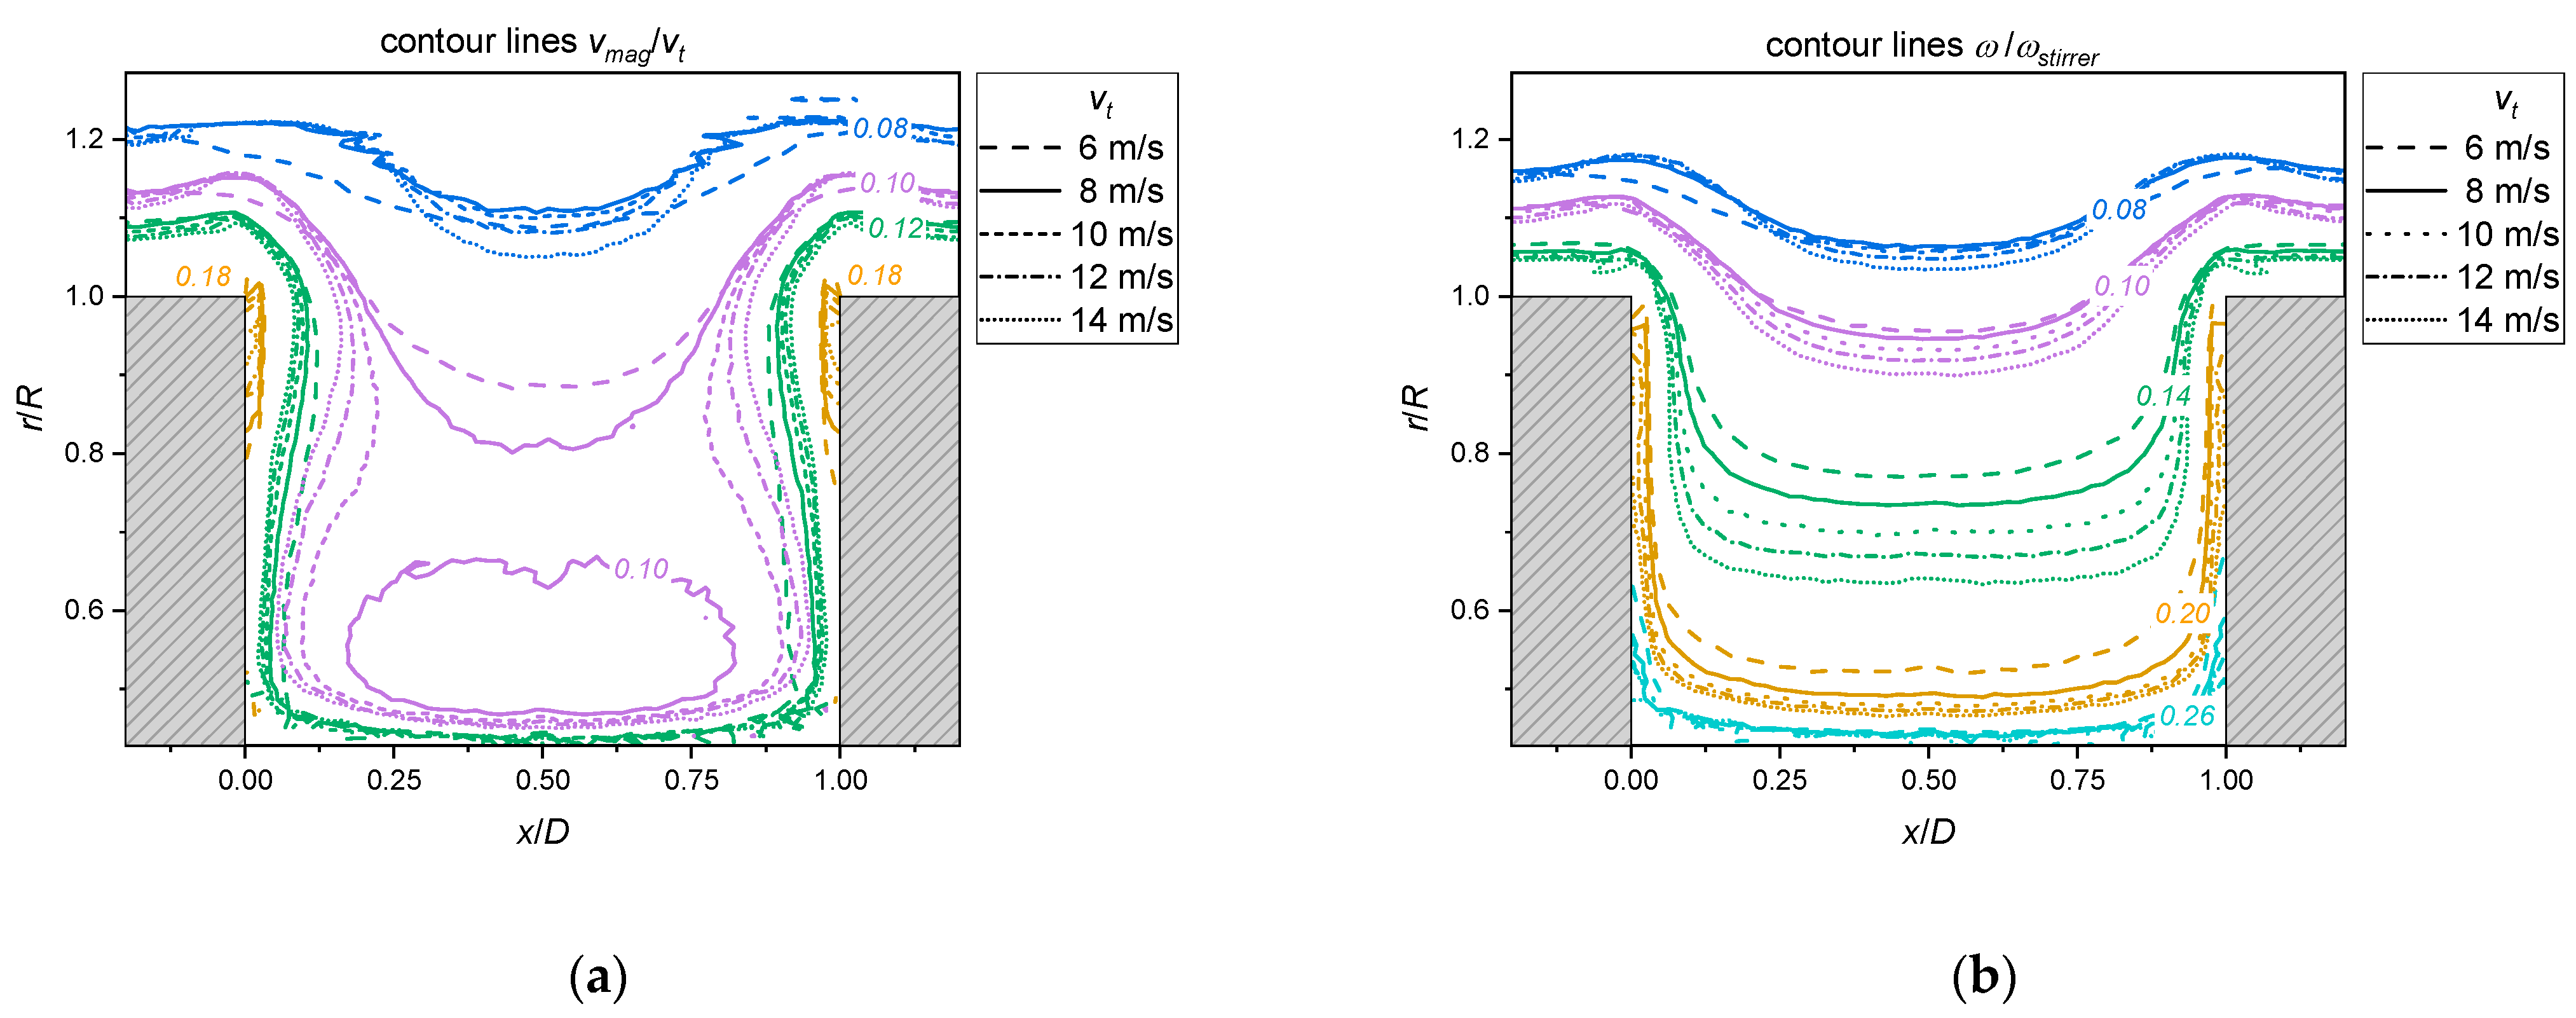
In order to compare different stirrer speeds vt, the grinding media velocities were averaged radially and timewise. All velocities were normalized by the disc tip velocity. In Figure 6a, the area of highest speed was again clearly found at the sidewalls on the outer circumference of the stirrer discs. Only within a small region did the grinding media reach more than 18% of the rotor circumferential speed for all rotor speeds. The normalized velocity profile was, in general, similar for all investigated stirrer tip speeds, whereby the areas with proportionally higher grinding media velocities were more extensive for lower stirrer speeds. Figure 6b depicts to what extent the rotor and fluid effectively dragged the grinding media in the direction of rotation. The angular velocities of the grinding beads around the shaft (x-axis) were calculated by , where is the cross radial velocity of a grinding bead in a plane perpendicular to the x-axis and is the radial distance of a grinding bead to the x-axis. The angular velocities were then normalized by the angular velocity of the shaft ().
Operating at a stirrer tip speed of 8 m/s, the grinding media, which were located within a lateral distance of 0.6 mm to the grinding disc and within a radial distance of 2 mm to the rotor shaft, moved with a normalized angular velocity of at least 20%. The lateral distance of the 0.2 contour line toward the stirrer disc was in the order of the grinding bead diameter (dgm = 0.8 mm), and therefore represents the first layer of grinding beads. Independently of the stirrer speed, the angular velocity in the first layer was between 20% and 26% of the stirrer angular velocity. Toward the rotor shaft, the distance of the 0.2 contour line decreased with stirrer speed.
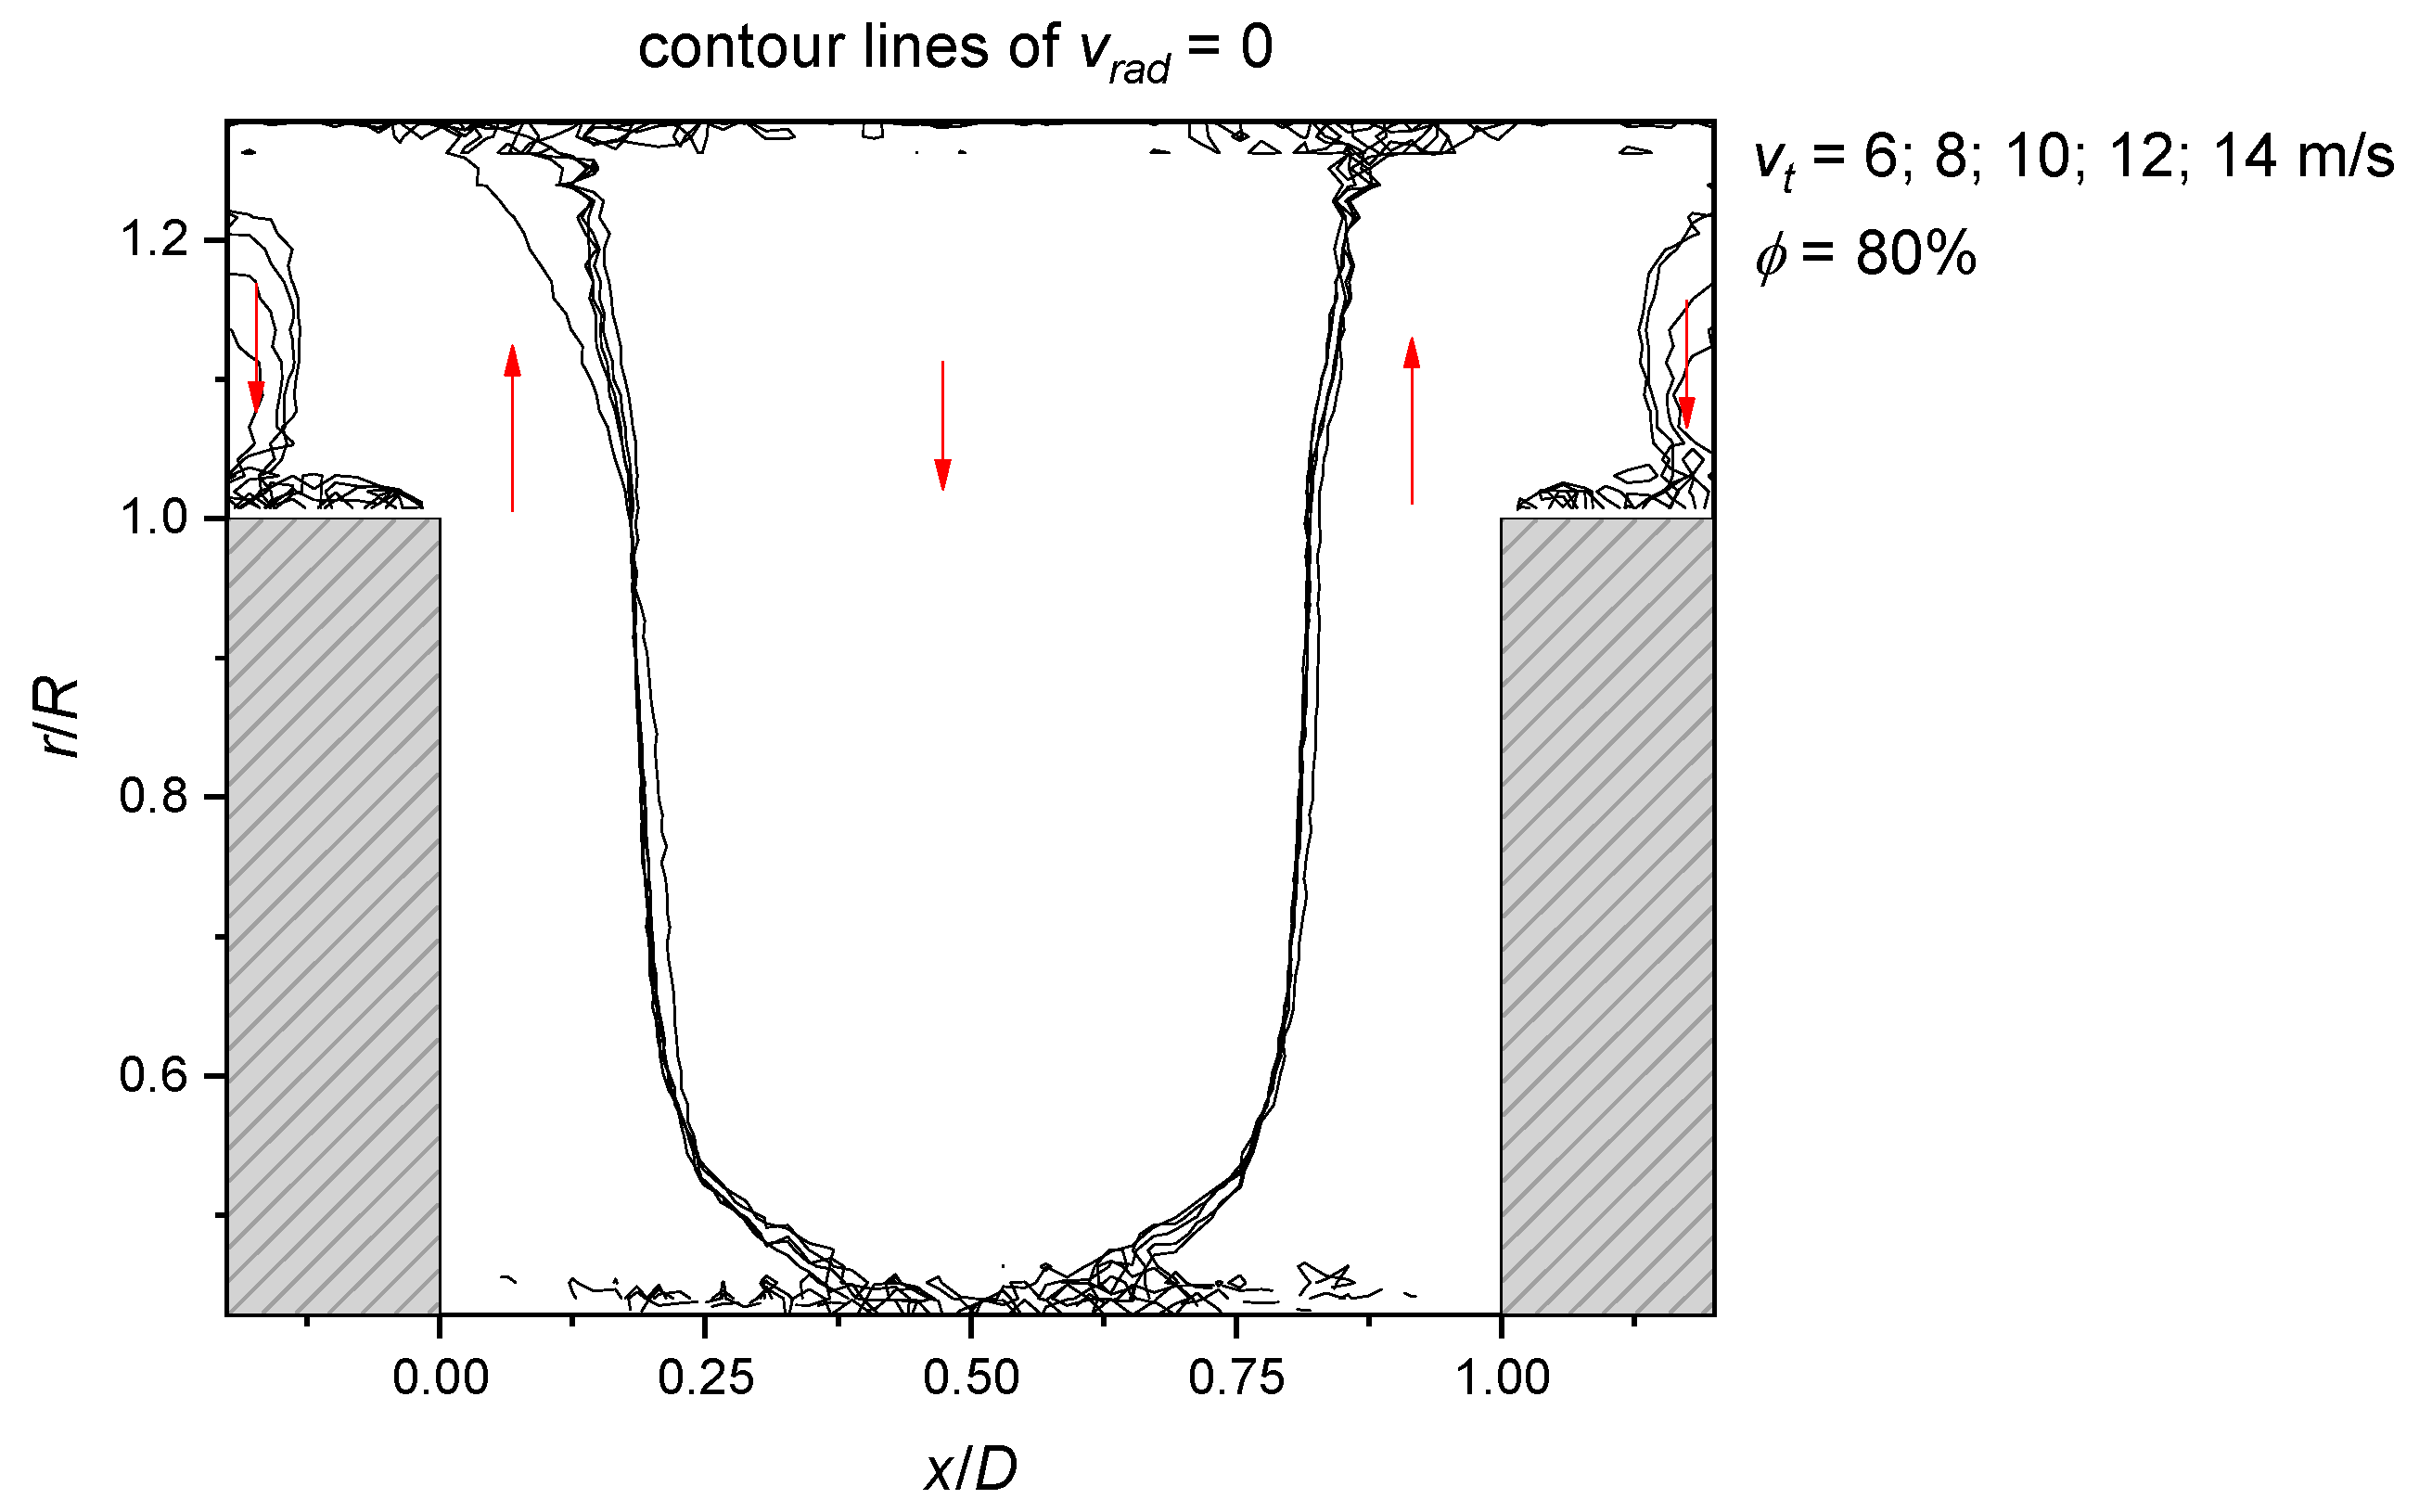
It is well known that the grinding media between the rotor discs undergo an axial–rotational movement: Next to the grinding disc, the grinding media are accelerated outward toward the chamber wall and flow back to the rotor shaft in the middle between the grinding discs (e.g., [1,16,20]). Figure 7 shows the contour line with a radial velocity equal to 0; the areas with radial velocity facing outward and inward are highlighted. In any case, the profile of the large vortex between the grinding discs was the same for all rotor speeds. Between the rotating disc tip and the fixed chamber wall, a secondary, smaller vortex can be seen for vt = 8–14m/s, but not for vt = 6 m/s. The secondary vortex increased in size with rising stirrer speeds. This smaller vortex was also found by Gers et al. [10]. In their CFD simulations of a stirred media mill, the secondary vortex started to appear in simulations with Newtonian fluid at a Reynolds number of Re = 458 and expanded with increasing Reynolds number. Their simulation at the Reynolds number equal to 229 showed only the primary large vortex. There are several definitions for the Reynolds number in stirred media mills. Gers et al. [10] calculated the Reynolds number with the following expression for mixing systems:
where refers to revolutions per second, is the effective density of the equivalent fluid (grinding media and suspension mixture) and is the effective viscosity of the equivalent fluid. Gers et al. estimated using the Krieger–Dougherty model:
where is the viscosity of the suspension and refers to the random close packing fraction. In the present simulations with a grinding media filling of = 0.8, the effective fluid properties were = 1724 and = 0.225 using Equation (4) and inserting the viscosity of water for and 0.64 for . Based on Equation (3) the Reynolds numbers were 263, 351, 438, 526 and 614 for the stirrer tip speed of 6 m/s, 8 m/s, 10 m/s, 12 m/s and 14 m/s, respectively. The quantitative comparison of the simulations of Gers et al. [10] and the present simulations is consistent regarding Re and the appearance and growth of the secondary vortex between disc and chamber wall.
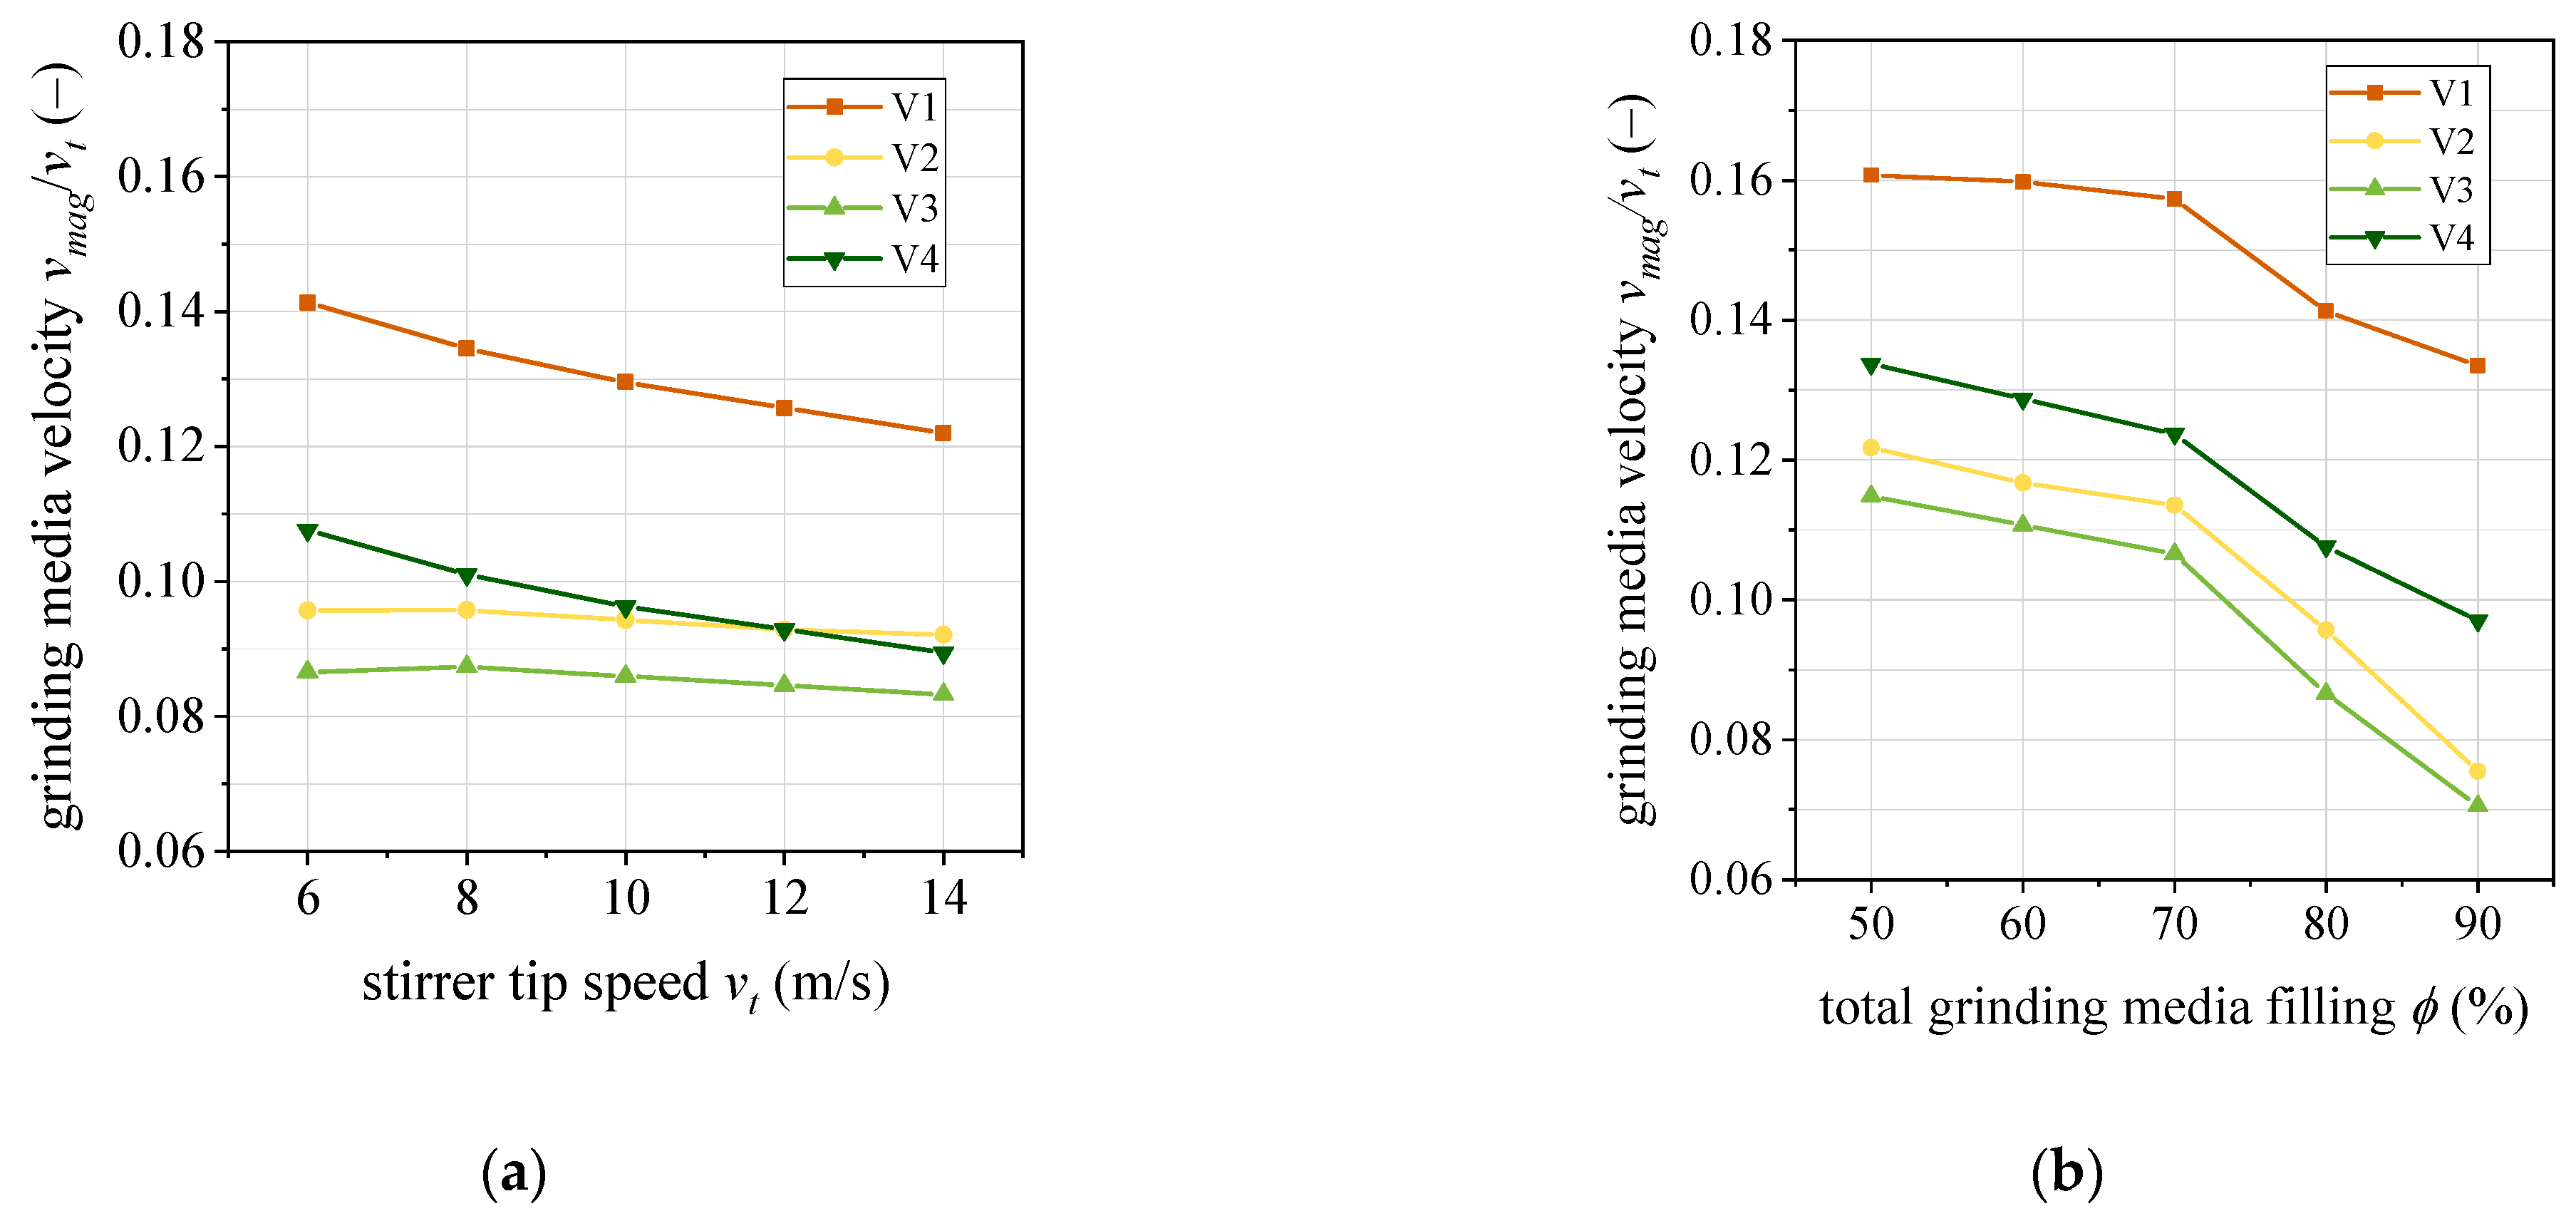
In the following, the grinding media velocity and the fluid velocity are described within the individual volumes V1–V4 defined by Stender et al. [7]. Figure 8a,b show the average grinding media velocities present in the individual volumes. In V1, the grinding media clearly moved fastest, which was to be expected. The mean values of the grinding media velocities in V2, V3 and V4 were found to be similar, while the mean of the grinding media velocities in V3 was the lowest in all investigated cases. The average grinding media velocity in V4 was even higher than in V2 at lower stirrer tip velocities. For the collision energy, however, the relative speed of the grinding media was of importance, and the average speed shown did not provide any direct indication of the grinding effectiveness in V4.
In Figure 8, the average grinding media velocity in V1–V4 normalized by the stirrer tip speed is plotted for the different parameter sets. Figure 8a confirms that there is a linear relationship between the stirrer tip speed and the average grinding media velocity in V2 and V3. For a grinding media filling of φ = 80%, the average grinding bead speed in V2 equaled 9.5% of the stirrer tip speed, and in V3 the average speed was approximately 8.5% of the stirrer tip speed. In V1 and V4, however, the average grinding media velocity increased nonproportionally to vt. The grinding media in V1 reached an average of 12%–14% of the stirrer tip speed for a filling of φ = 80%. The grinding media moved significantly faster at lower grinding media filling levels (compare Figure 8b). Above a filling degree of 70%, a decrease in the grinding media velocity was observed equally for all volumes. Therefore, the local grinding media velocity depended on the prevailing fluid velocity, but also on the local grinding media filling level, i.e., the freedom of movement of the grinding media. This could also explain the sequence of the average grinding media velocities in the volumes, i.e., vgm (V4) > vgm (V2) > vgm (V3), since the sequence of the local grinding media filling levels was reversed (see Figure 4). Similar results have also been found for the PEPT measurement of grinding media motion in stirred medial mills with disc stirrer [8].
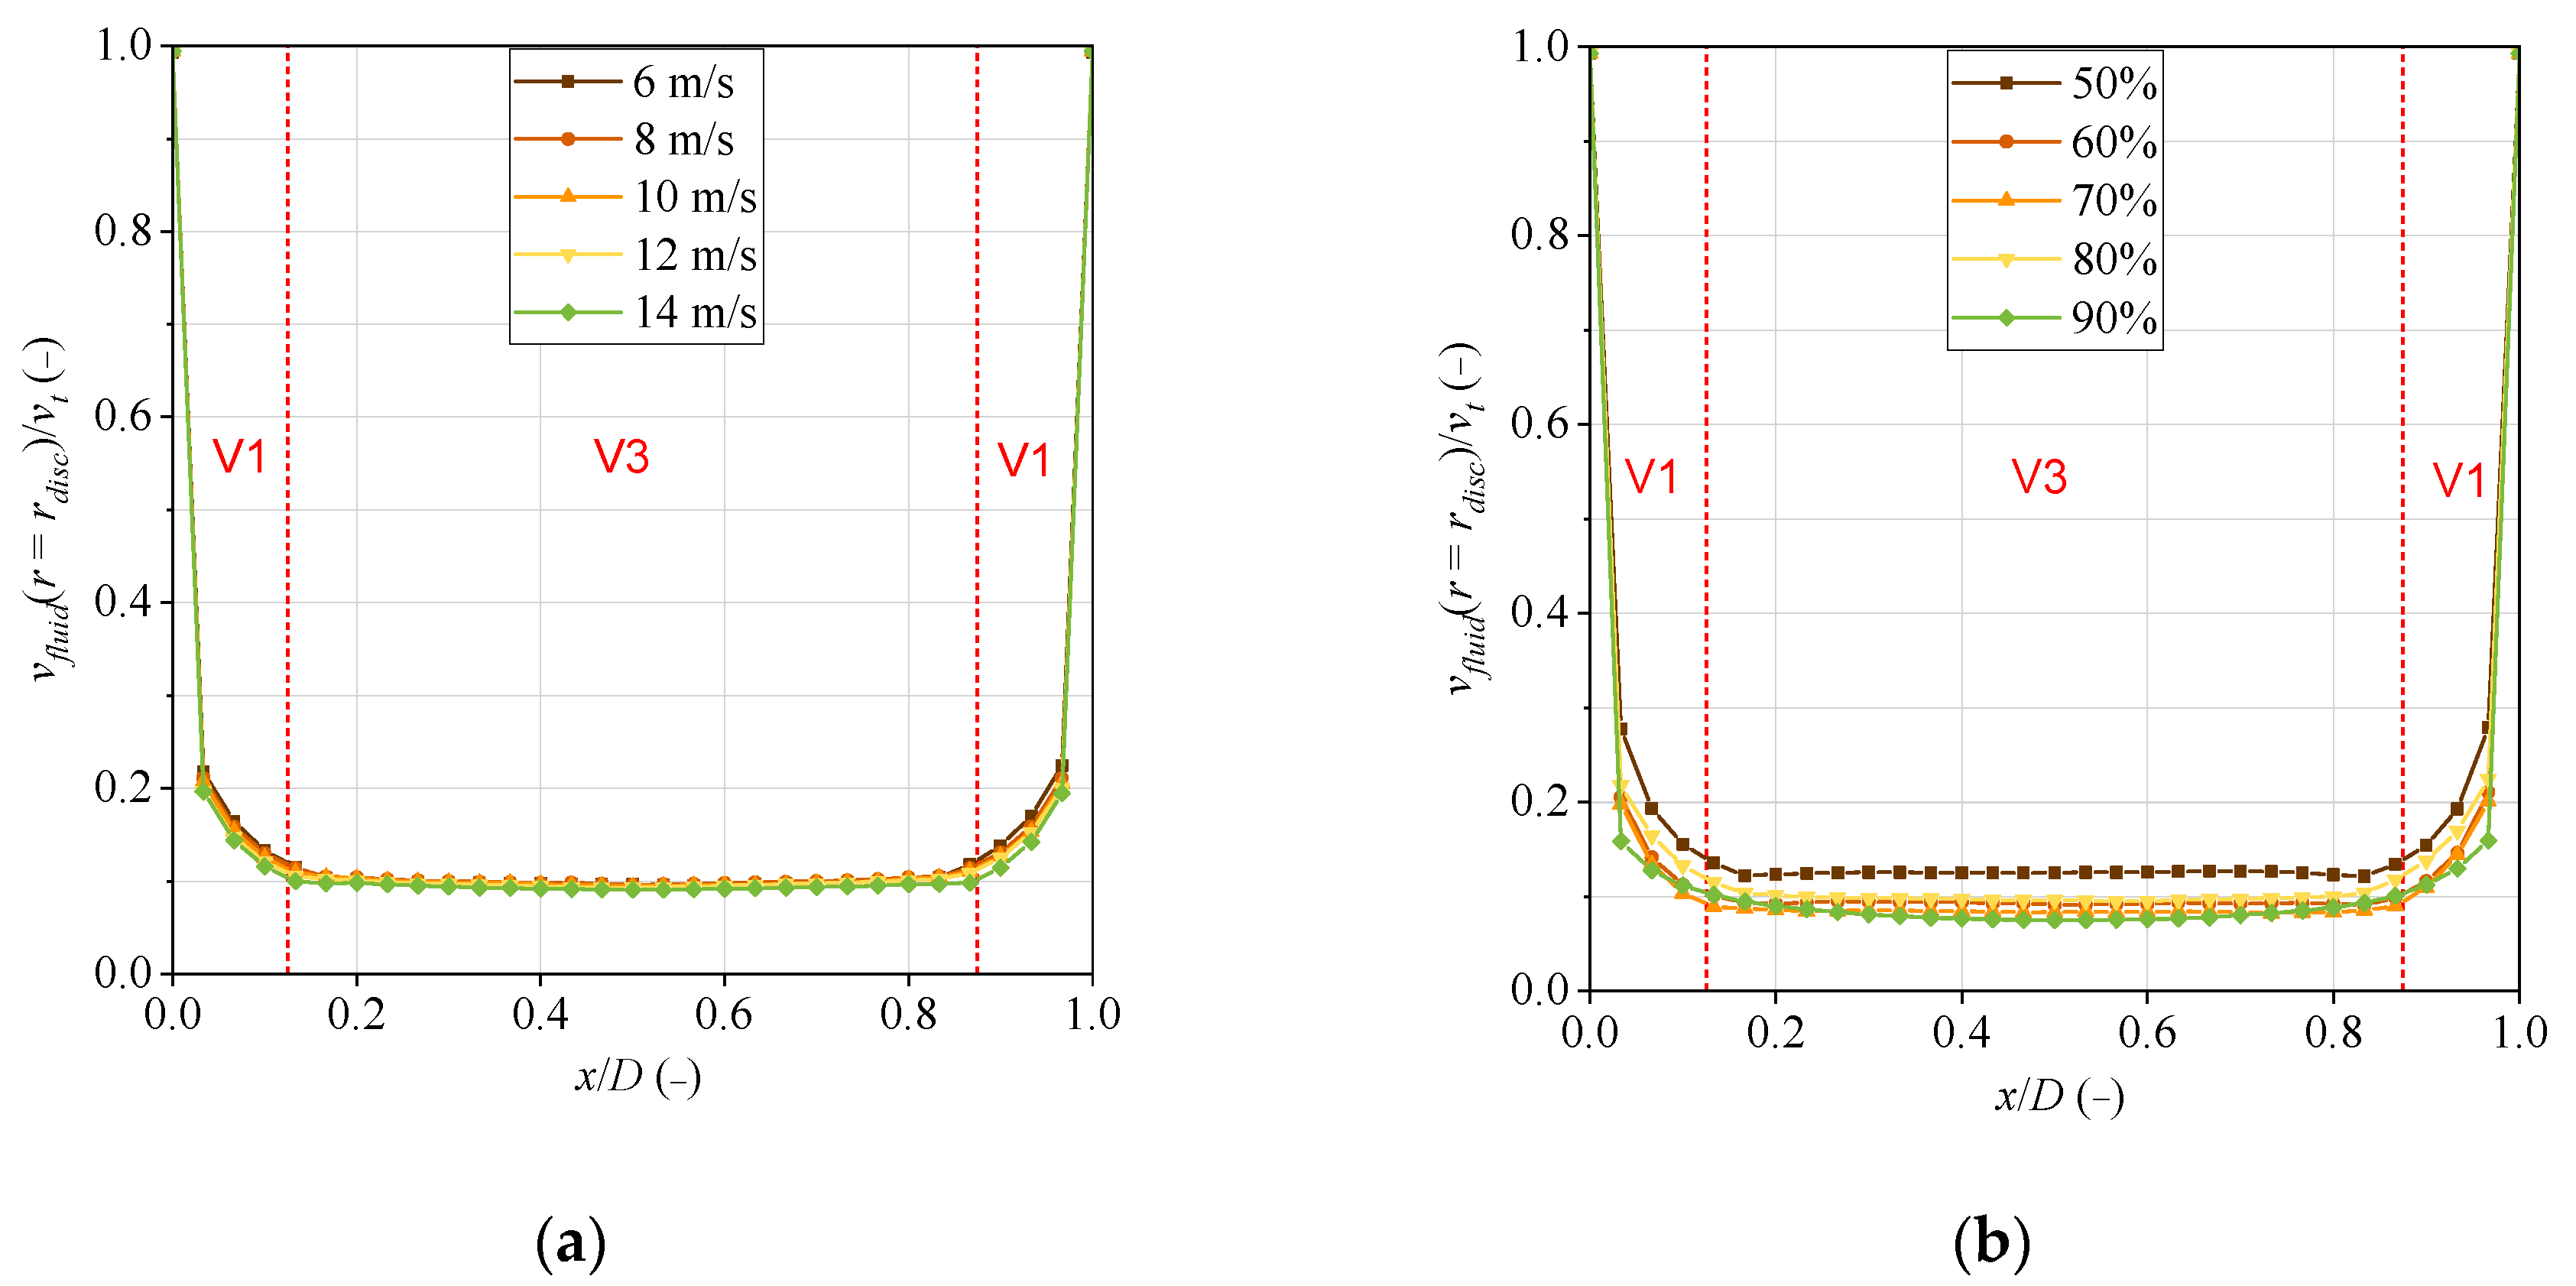
To verify whether the limits between V1 and V3 or V4 were selected appropriately for this grinding chamber geometry, the fluid velocity between the stirrer discs is plotted in Figure 9. The speed profile plotted relative to the circumferential speed was almost identical for all of the rotational speeds examined. The profile in V1 was characterized by a strong gradient, while the velocity in V3 was constant over the distance between the stirrer discs. The grinding media filling level influenced the profile in such a way that a low filling level of 50% resulted in a generally higher fluid velocity, whereas a high filling level of 90% resulted in a lower fluid velocity. However, based on Figure 9, no clear correlation between filling level and fluid velocity can be established for the filling levels examined in between. Nevertheless, the classification of volumes for modeling purposes based on the fluid velocity was acceptable for all of the cases investigated.
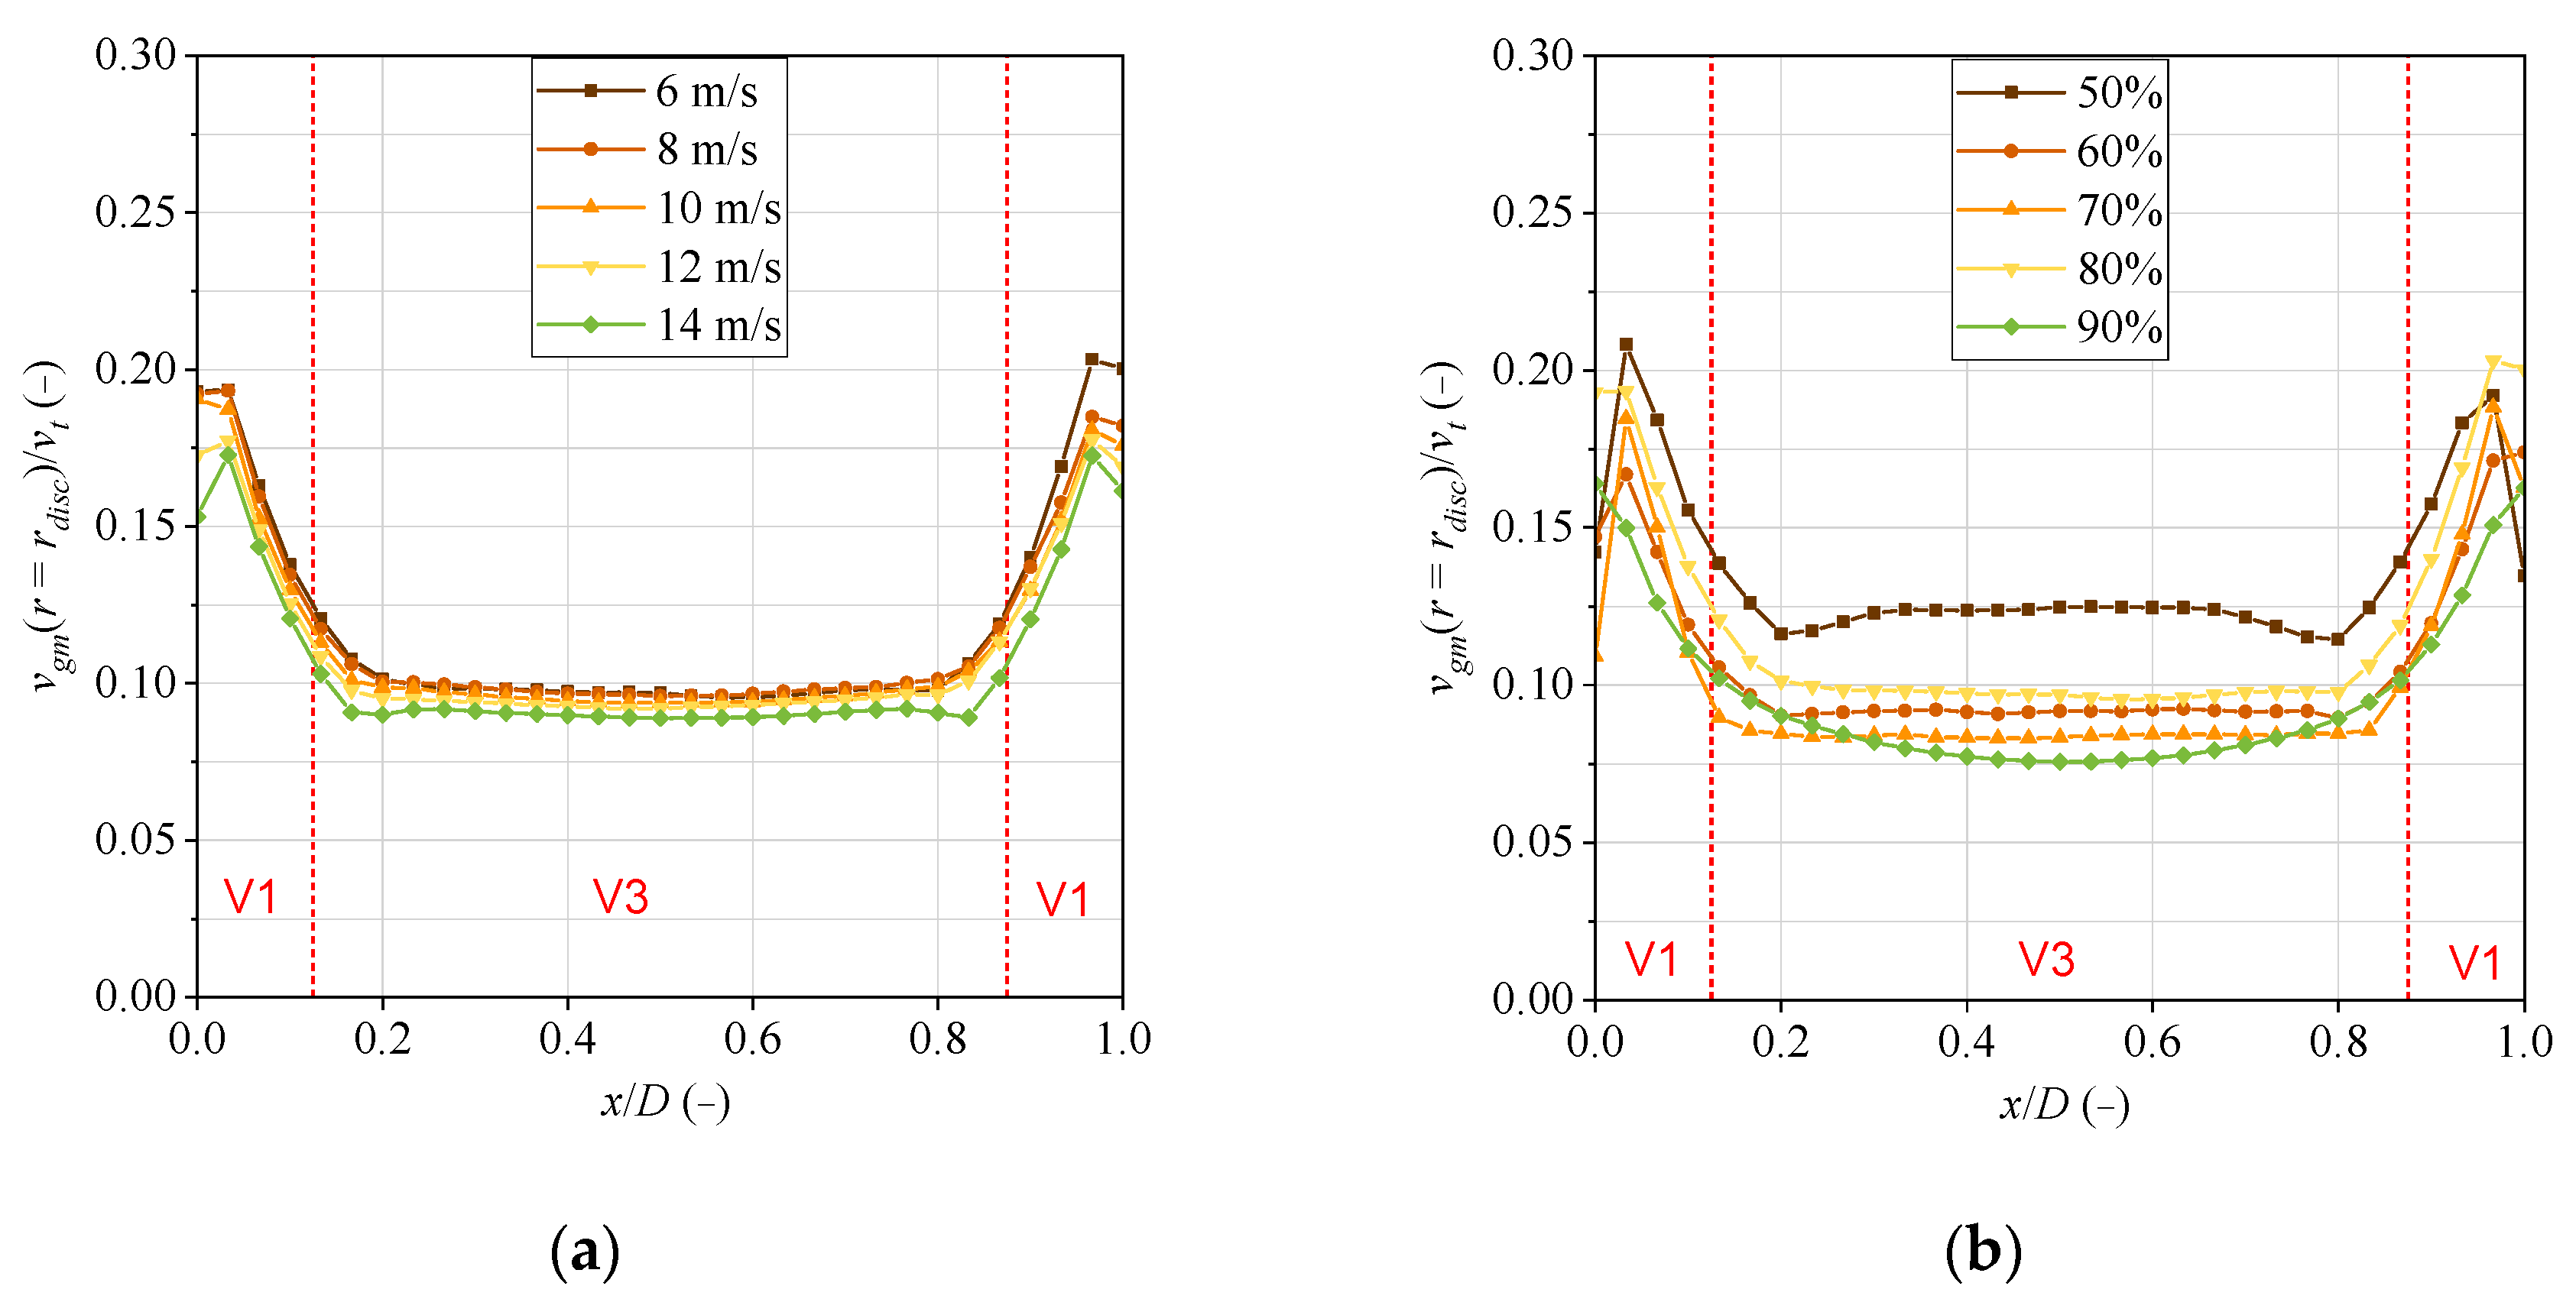
However, consideration of the grinding media velocity profiles (see Figure 10) suggests that the area of high shear rate of the grinding media spans a wider range than shown by the fluid profile. Since the profile of the grinding media velocities should be decisive for the volumes, it is recommended to increase the width of V1 from 2.5 to 3 mm, which, in Figure 10, would correspond to a limit at x/D = 0.2 or 0.8.
3.3. Stress Energy
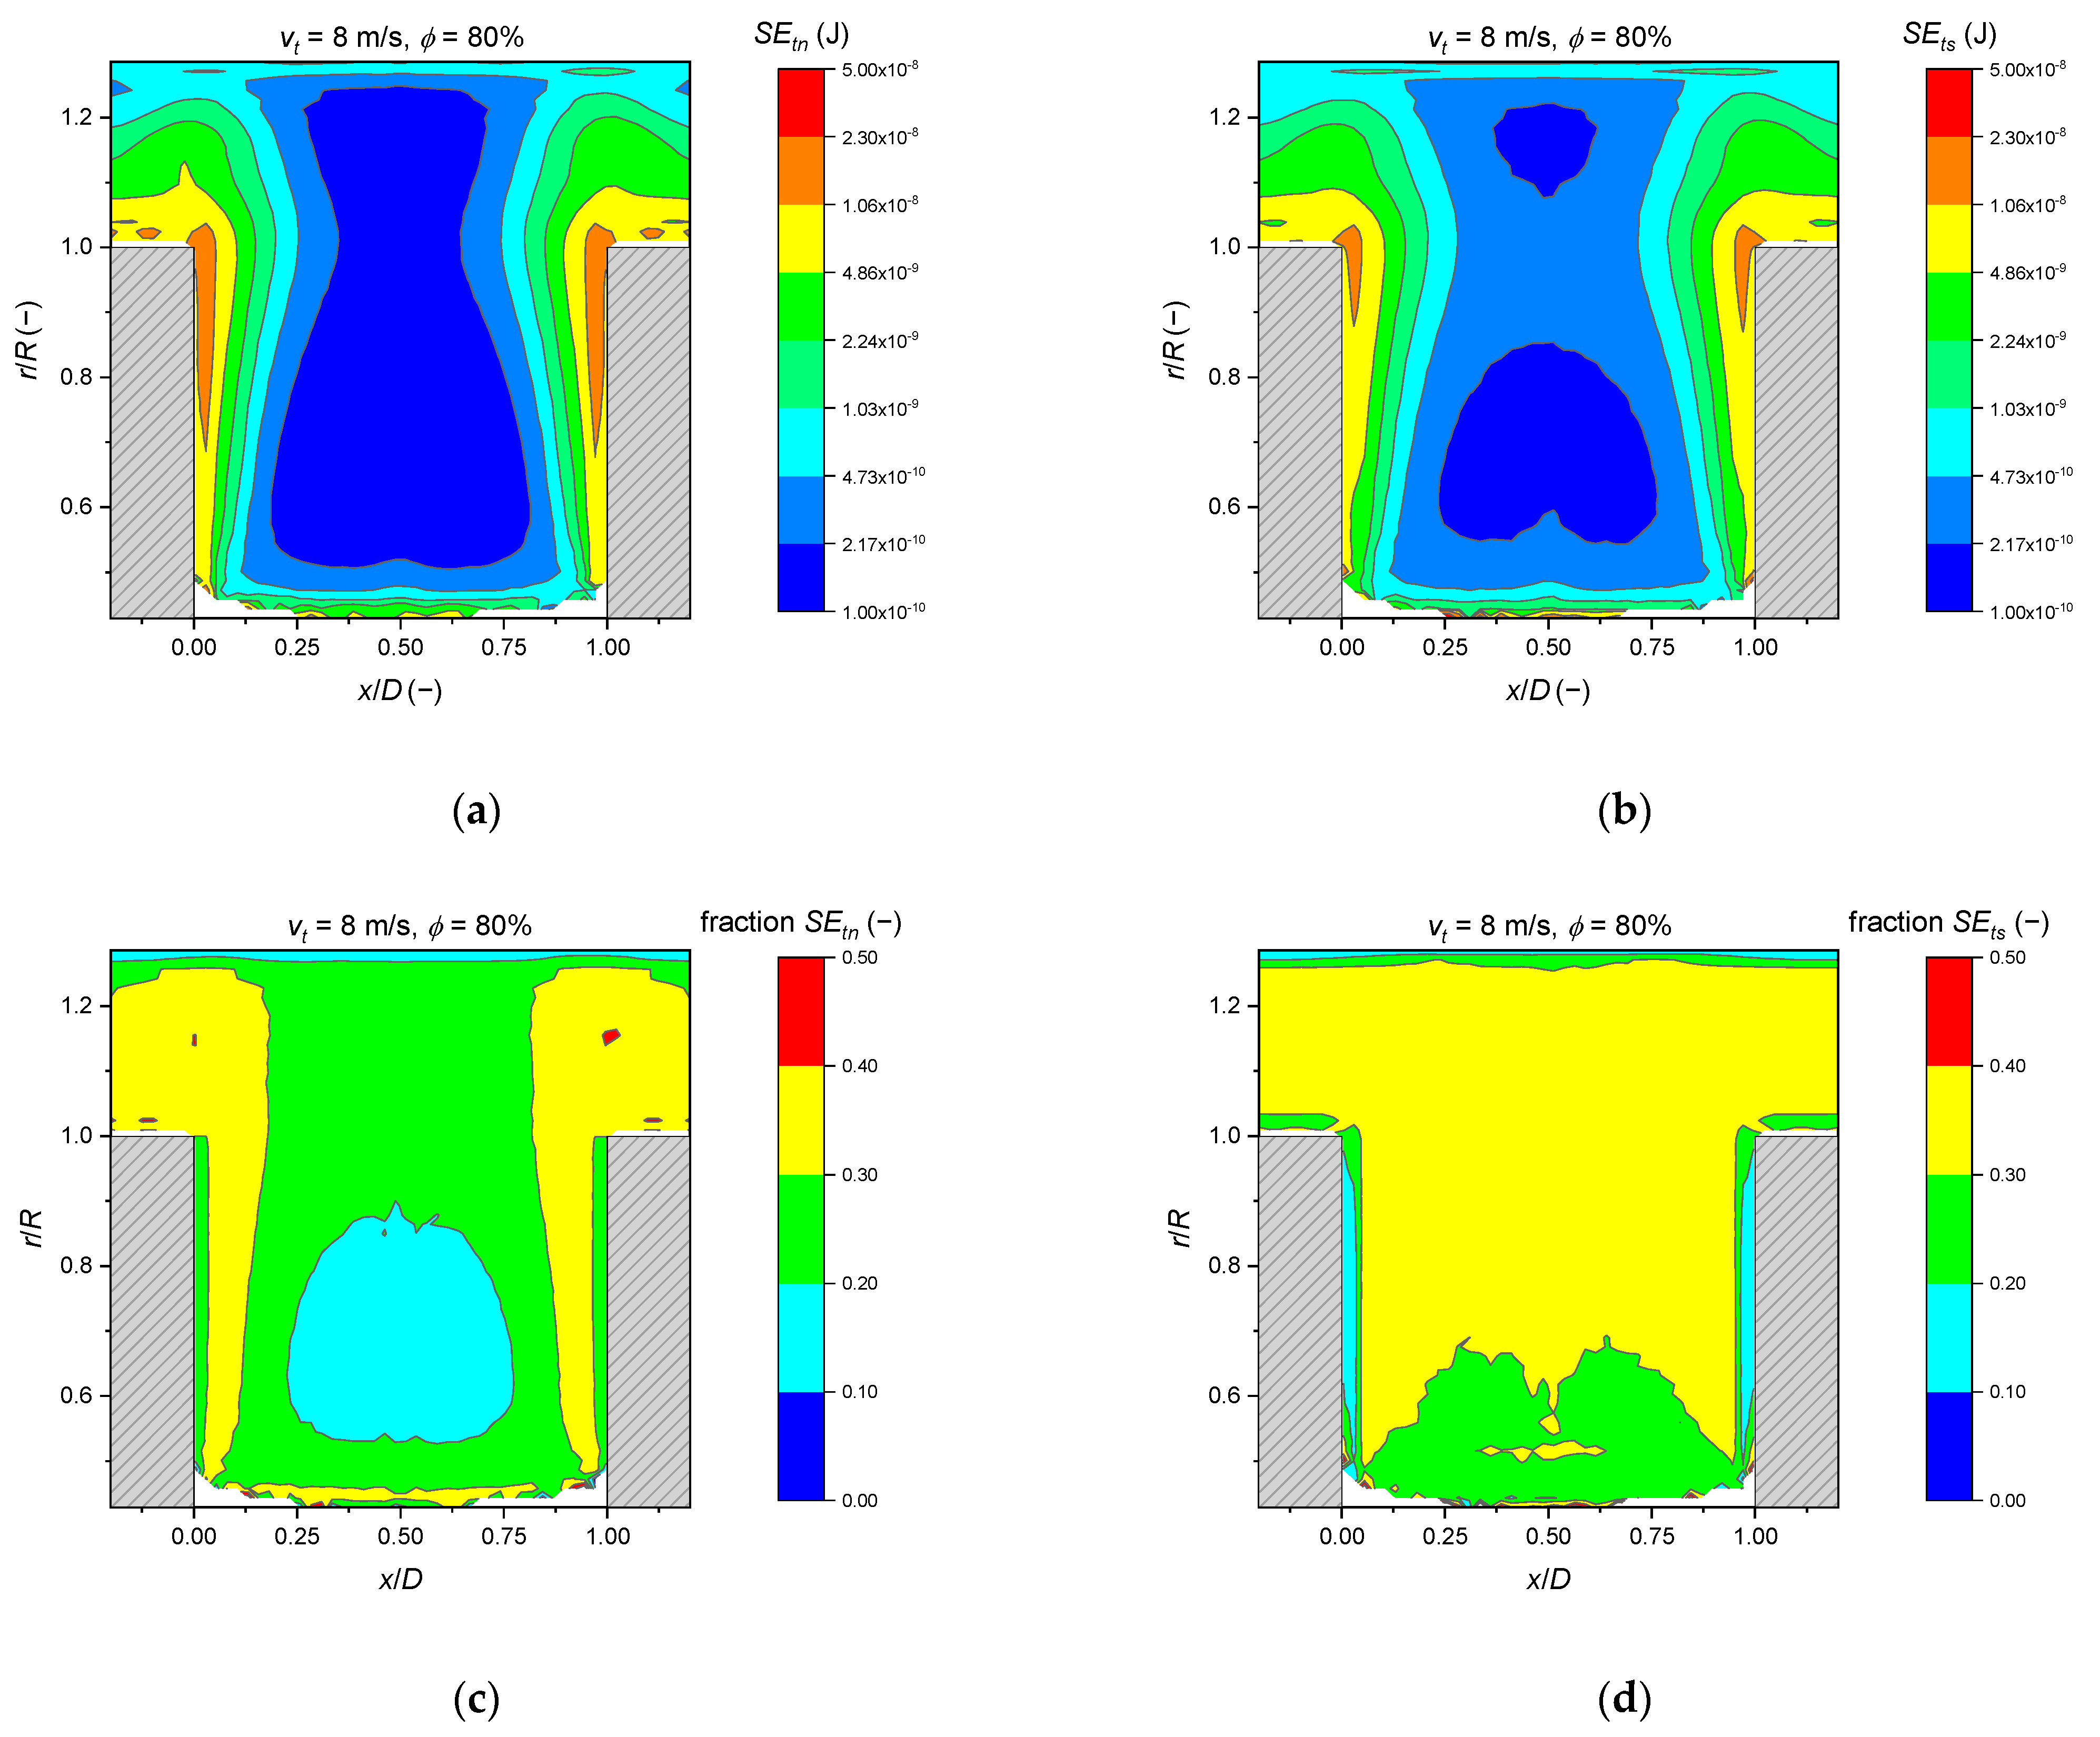
In the following, the theoretical maximum stress energies occurring during a bead–bead impact are investigated according to their local distribution. Figure 11a,b show the locally averaged stress energies in the axial section. In Figure 11a, the energy resulting from the normal translational impact direction is shown in the logarithmic scale, and in Figure 11b the energy resulting from the translational shear is drawn. The collisions with the highest stress energies can be found close to the stirrer. On average, the collisions with the lowest stress energies took place in the middle between the two stirrer discs. In the middle area between the stirring discs, the dominant direction of the impact was translational shear with a proportion between 30% and 40%, whereas near the stirring disc, the translational normal direction of impact predominated with 30% to 40% (see Figure 11c,d). A dominance of the shear component was also reported by Trofa et al. [31], who simulated a low-energy, magnetically-driven stirred media system via DEM and found median impact angles of less than 20° against the common tangent plane of the colliding particles.
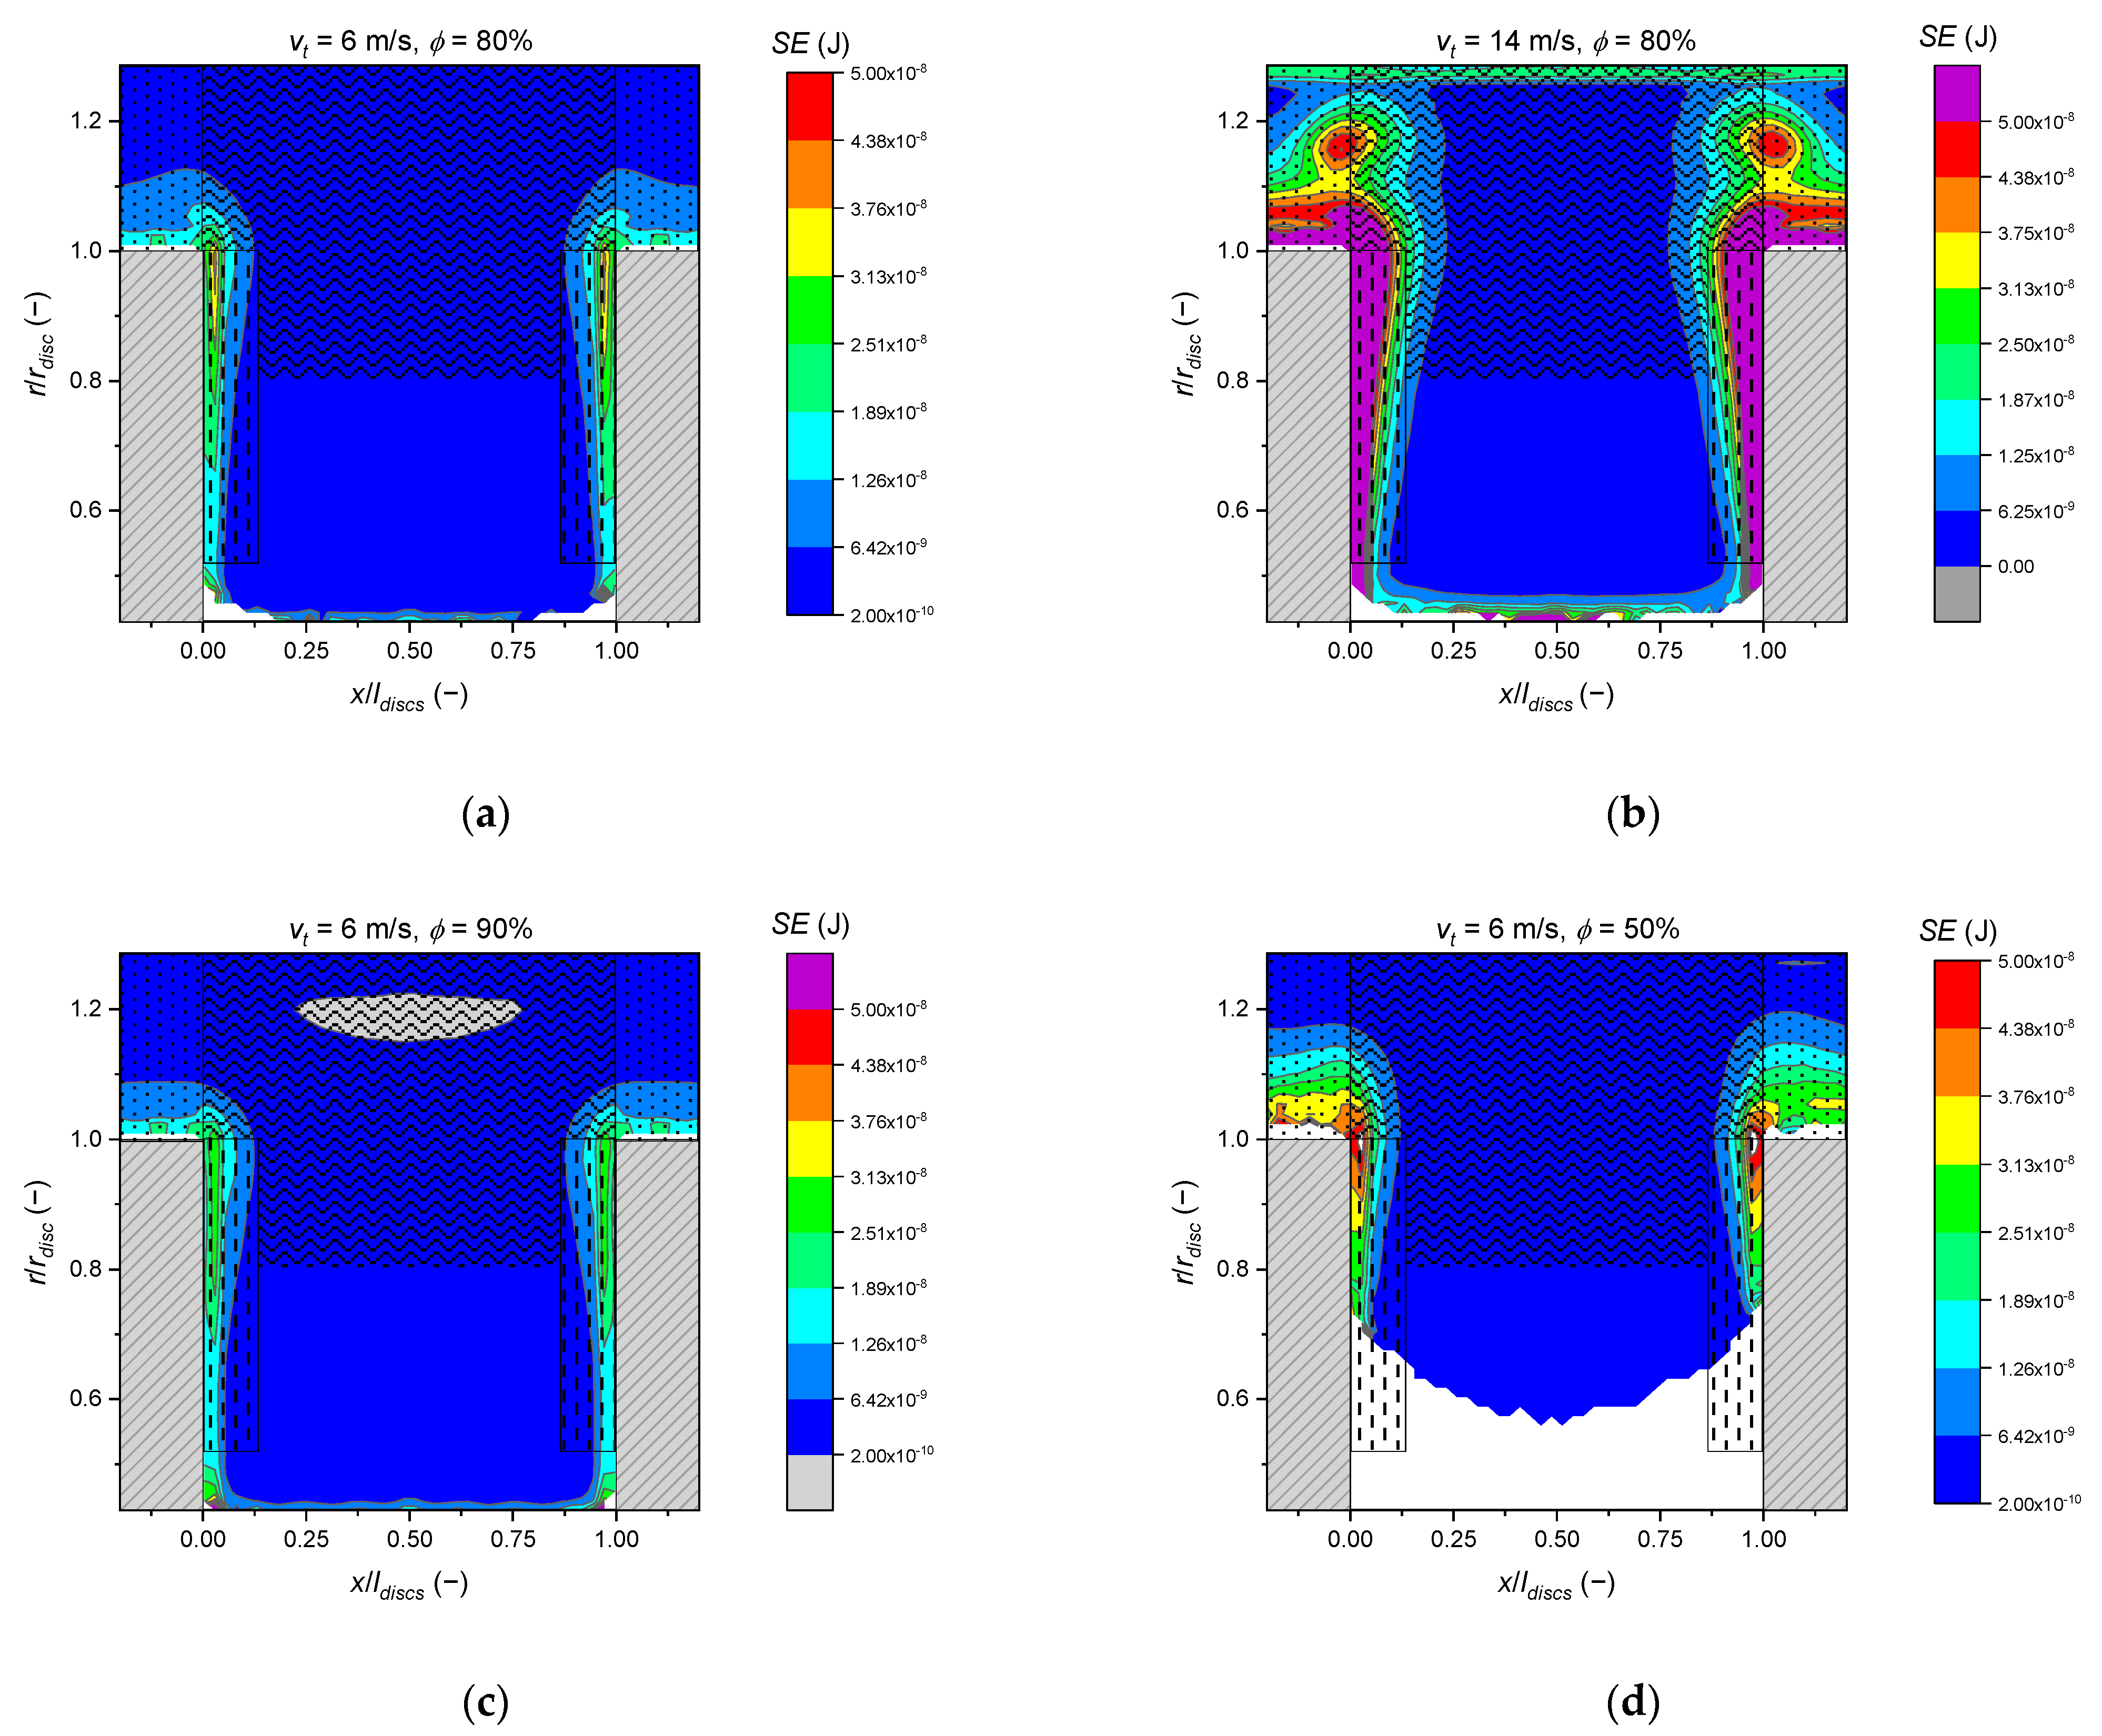
The total stress energy (therefore, the stress energy cumulated from all impact directions) is shown in Figure 12a–d in the linear scale. Volumes V1–V3, as defined by Stender et al. [7], are drawn in the graphs. It can be seen that the width of V1 was chosen appropriately. For V2, Stender et al. [7] assumed a linear drop from the stirring disc toward to the grinding chamber wall. However, Figure 12 shows that there were three areas. Starting from the stirrer disc circumference, there was first a rapid drop over a distance of approximately 3 mm, which is approximately the width of V1. This was followed by a slow linear decrease until close to the wall of the grinding chamber, where there was a slight rise again. At the corners of the stirrer discs, an area of high energy appeared, assigned to V3. Except for this corner, no significant difference can be seen between V3 and V4 in the stress energy.
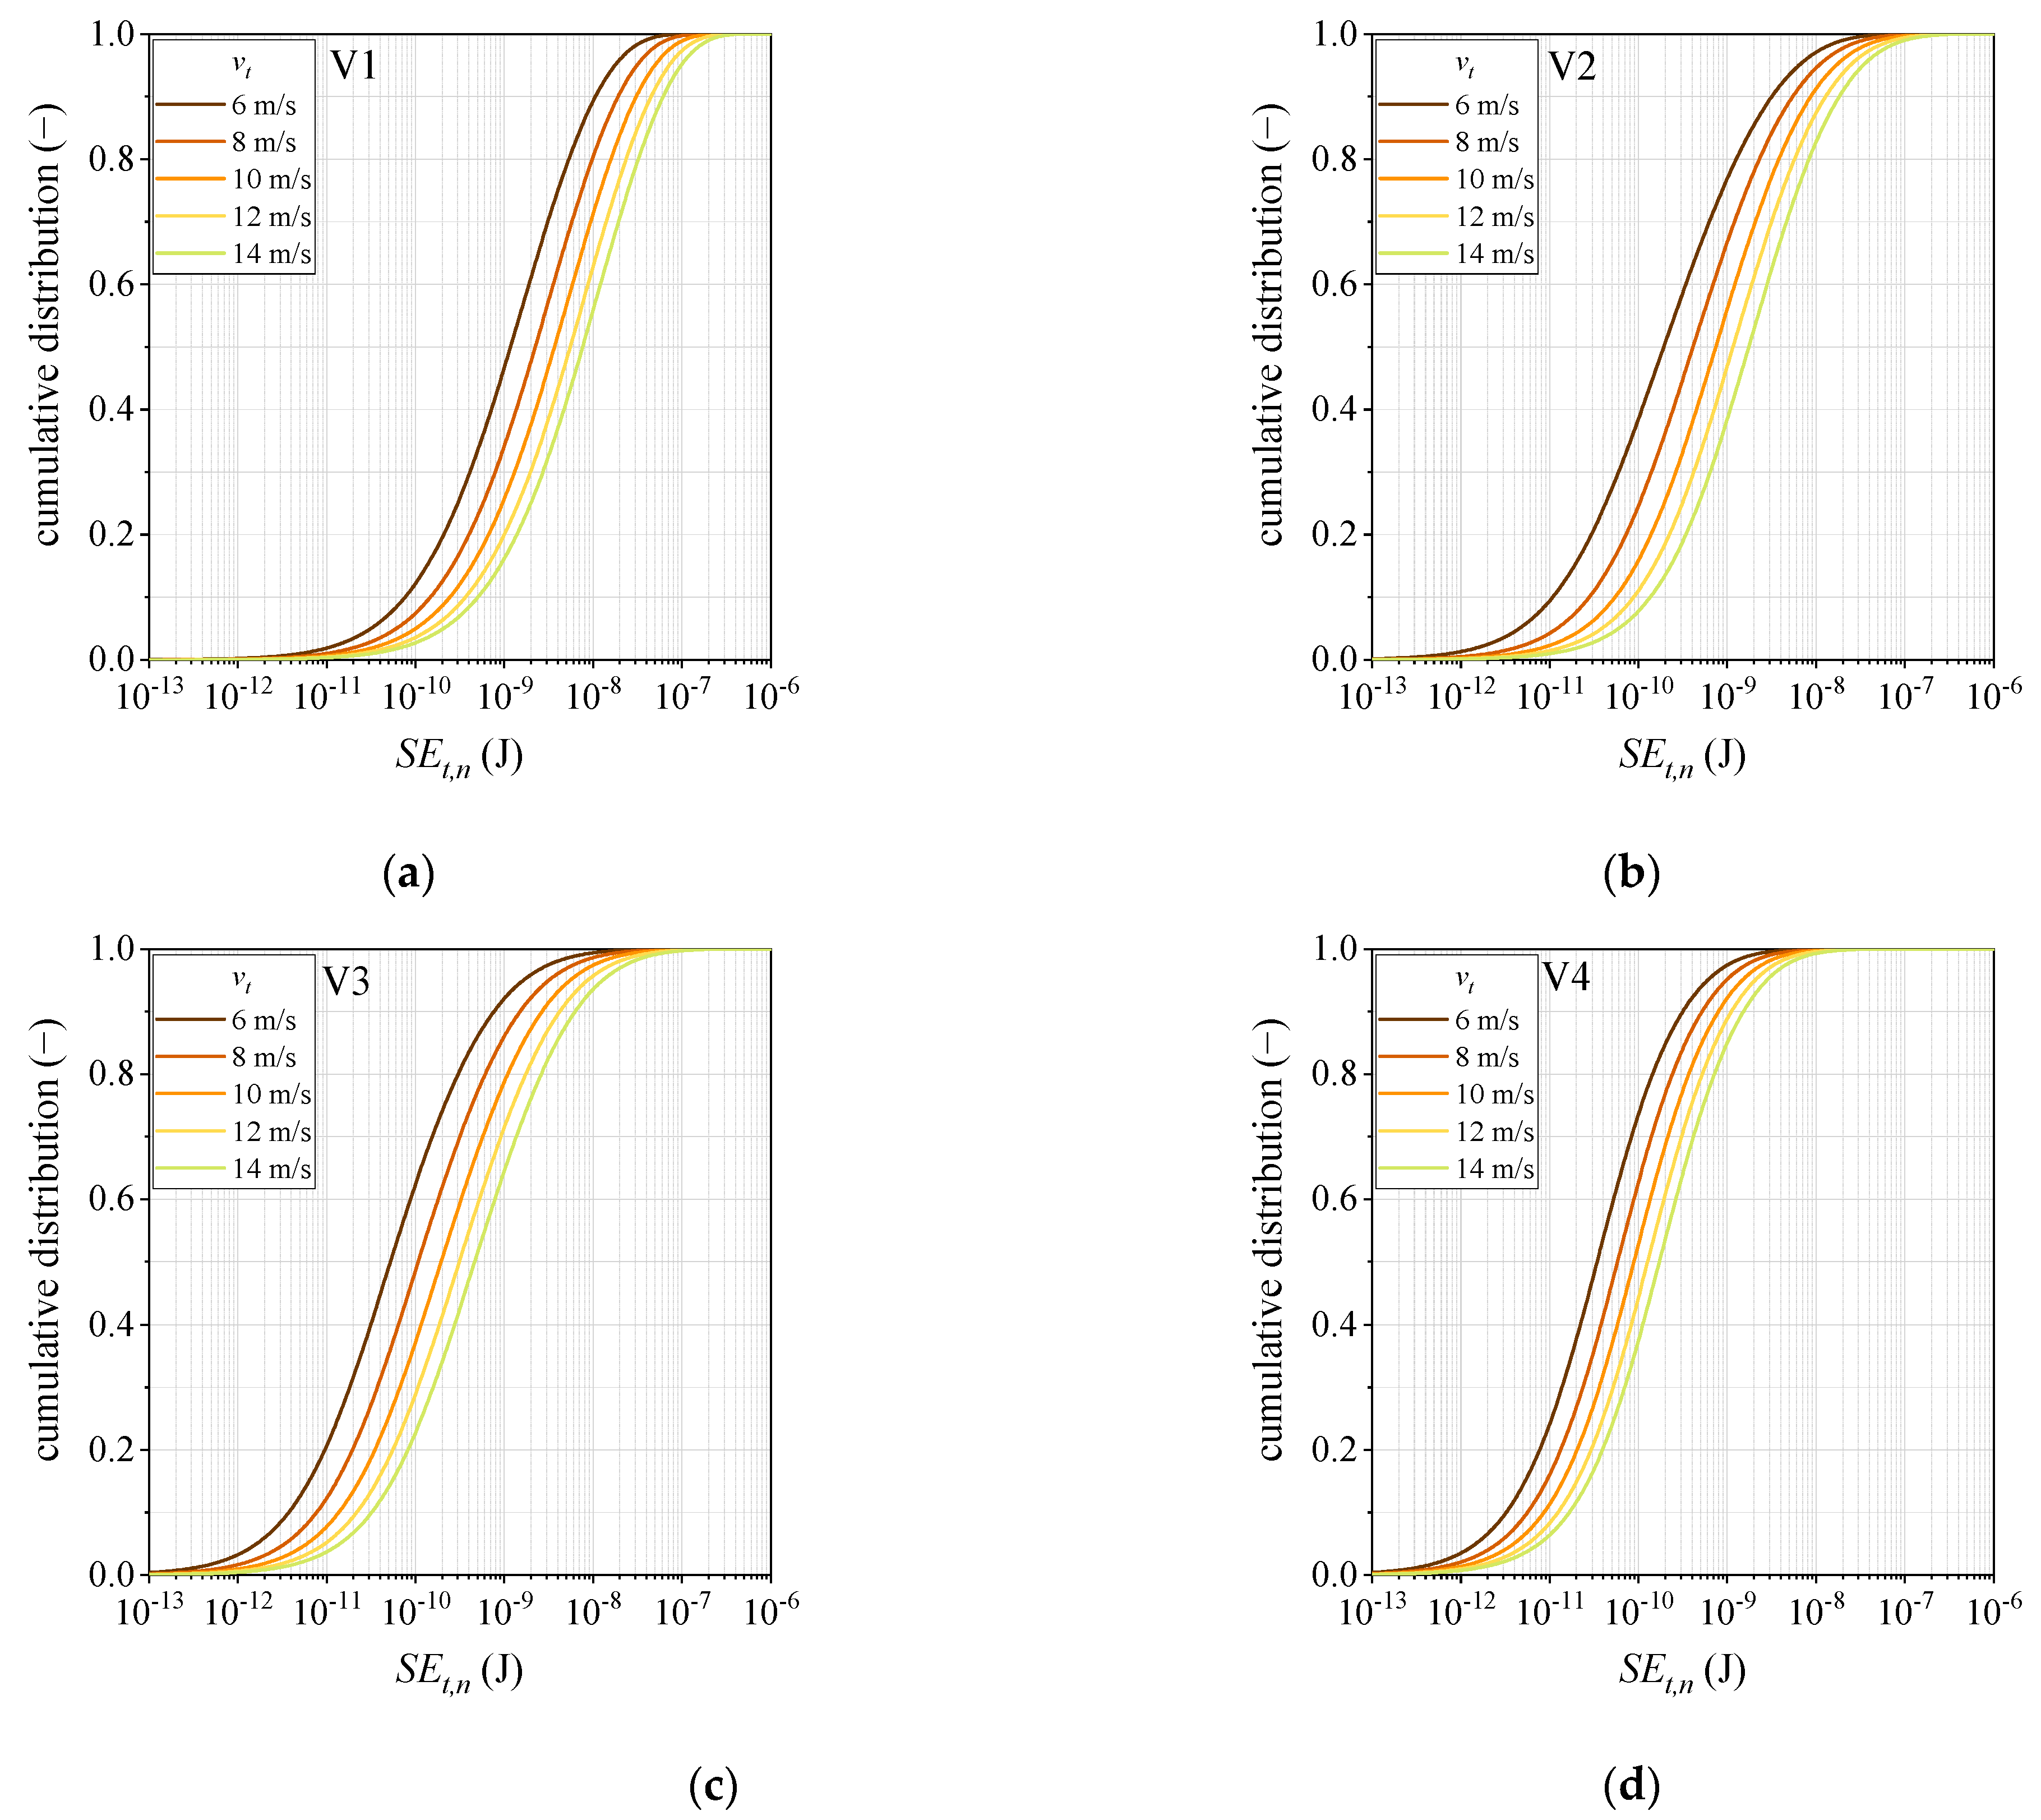
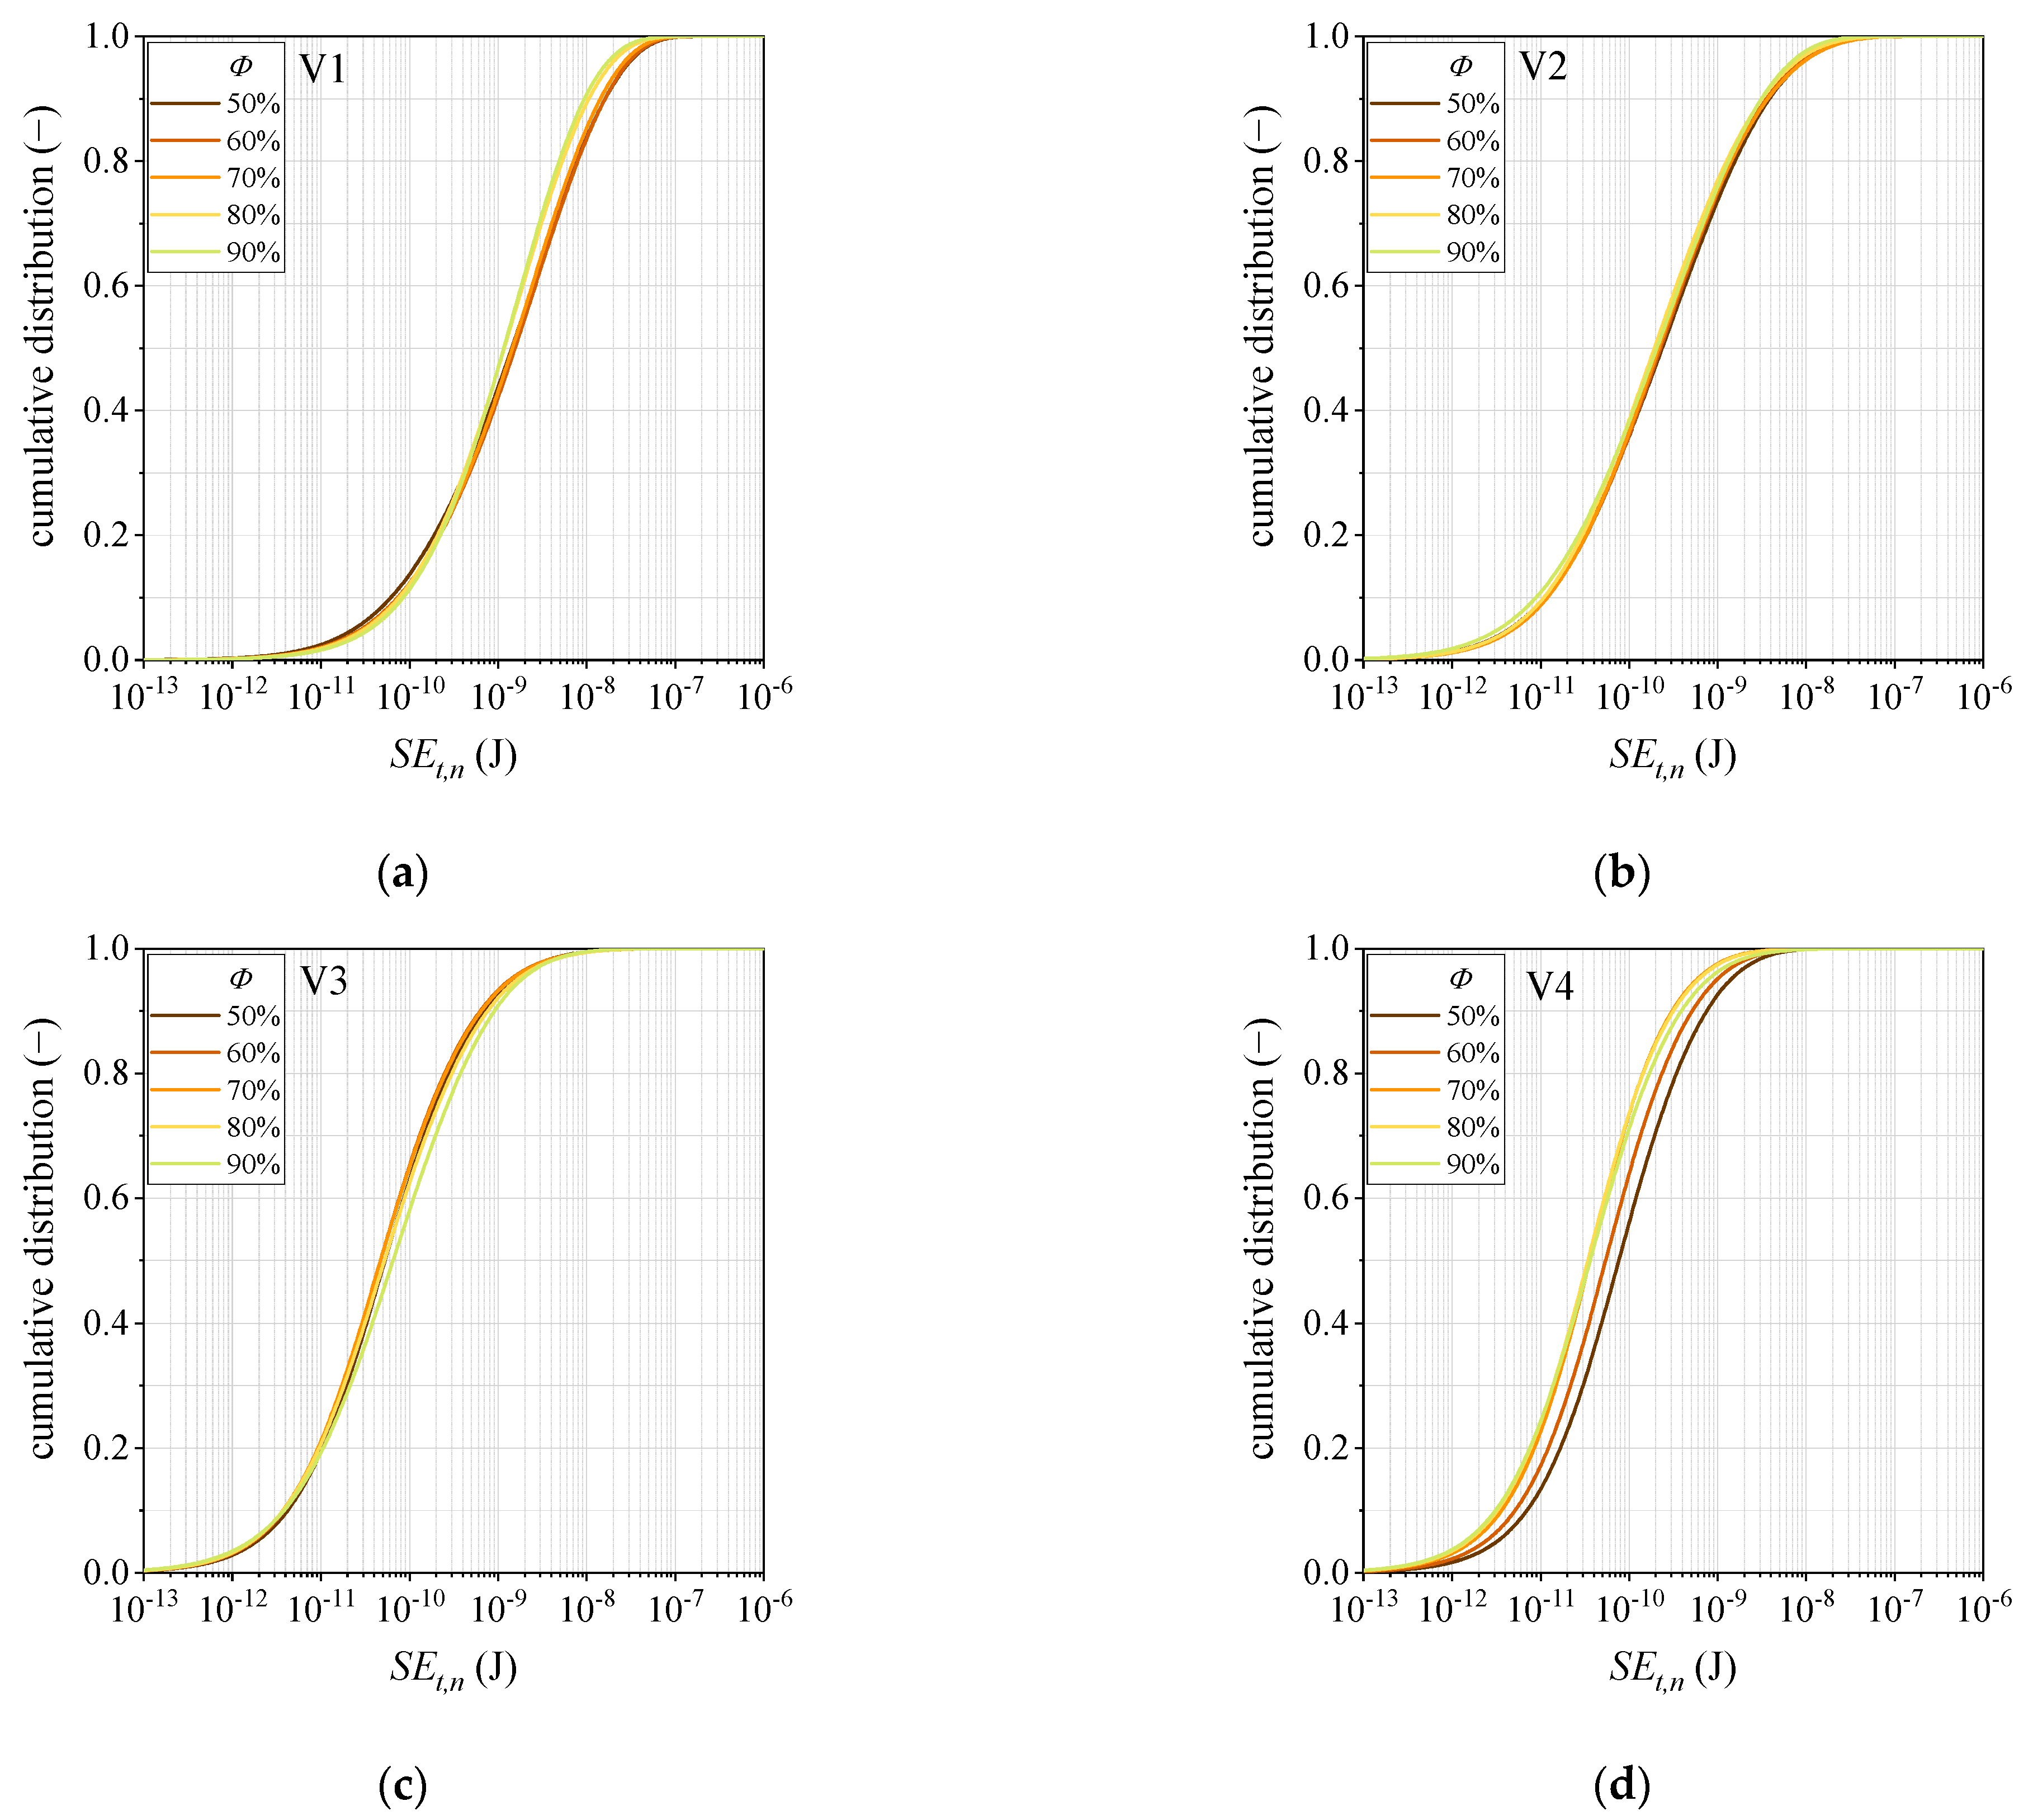
The distributions of the stress energy for the translational normal contact direction SEt,n within V1–V4 are shown in Figure A1 for the stirrer speed variations. As expected, the SEt,n increased with increasing stirrer speed. The median SEt,n of the volumes ranked, for all investigated cases, in the following order: SEt,n (V1) > SEt,n (V2) > SEt,n (V3) > SEt,n (V4). The variation of the grinding media filling showed a less pronounced influence on the stress energy distributions (see Figure A2). Although the grinding media velocity increased by a similar amount for all volumes at lower grinding media fillings, it was only V4 that exhibited a shift of the full SEt,n distribution to higher values at the filling levels of 50% and 60%. In V1, lower filling levels of φ = 50–70% led to an equal increase in the amount of grinding bead collisions with SEt,n higher than 10−9 J.
3.4. Local Number of Grinding Media Collisions
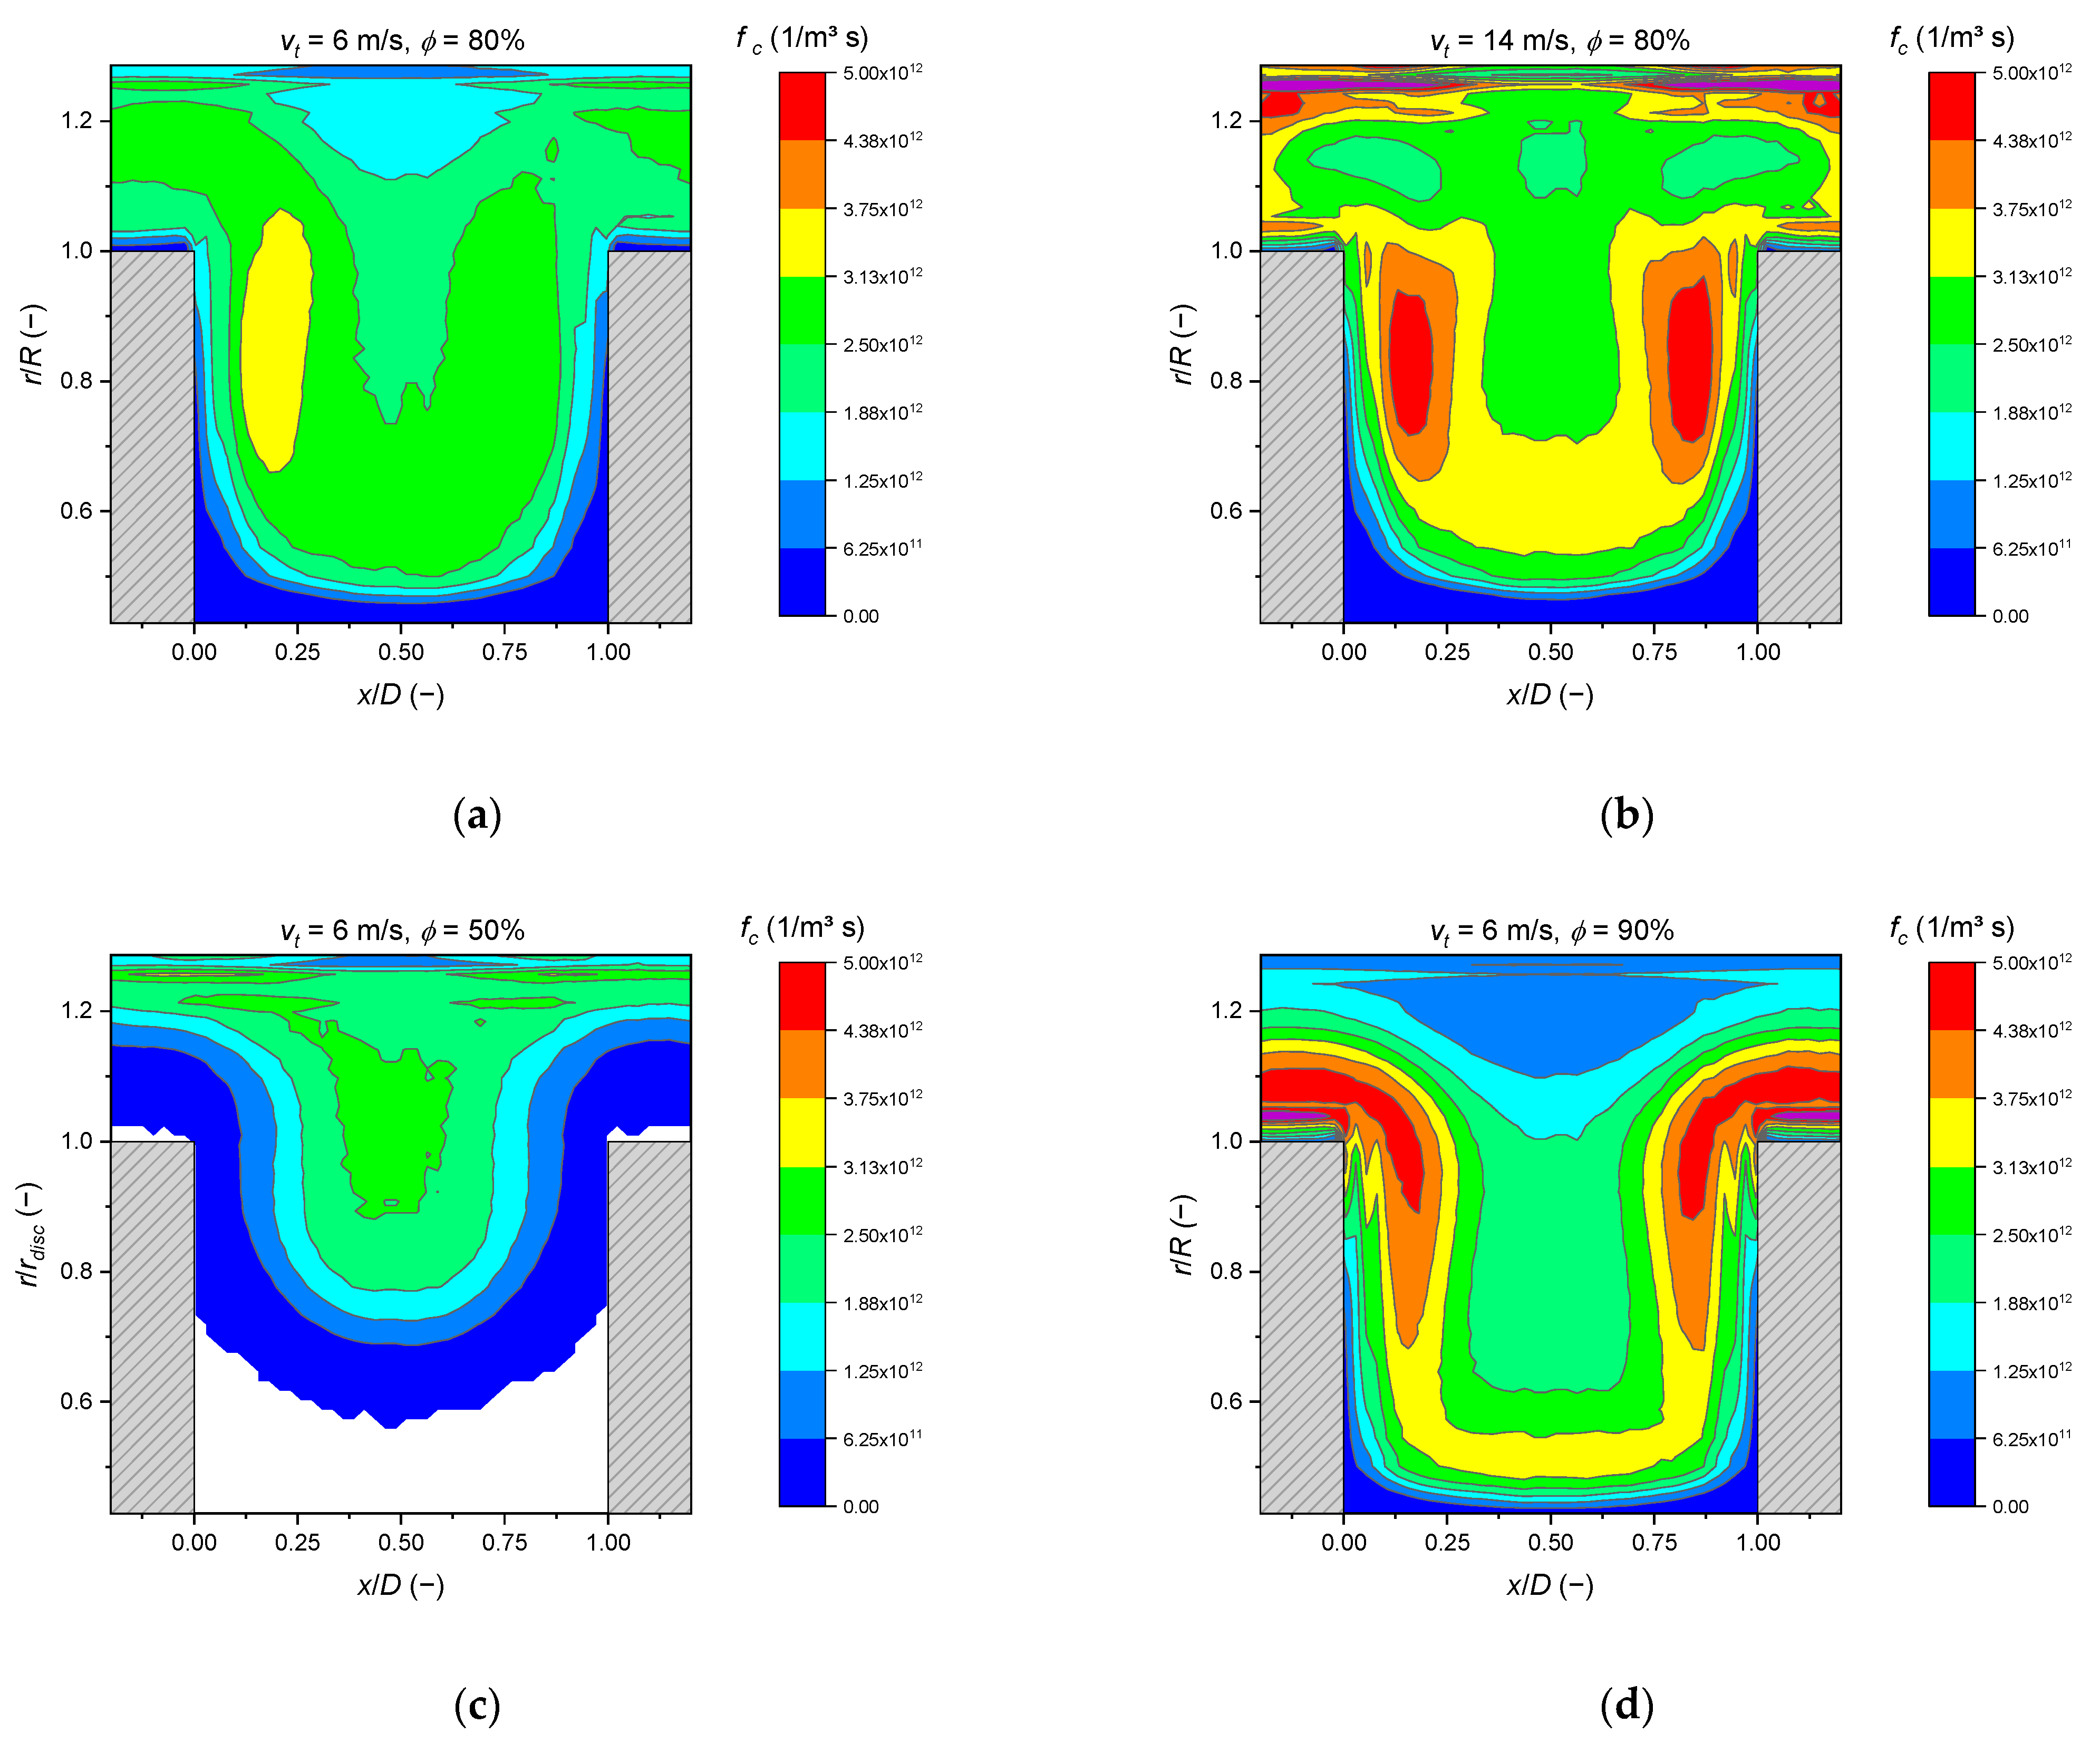
During comminution in stirred media mills, particles are captured and broken between grinding media or between grinding media and the grinding chamber wall or rotor. The number of grinding media collisions is, therefore, one of the key indicators of the grinding progress [32]. In the following, the number of bead–bead collisions that occurred is evaluated for 1 s. Figure 13 shows, in panels from (a) to (d), the radially averaged local collision frequencies per volume for varied parameters. The profile of the grinding media collisions changed distinctly for the different parameters. However, all cases have in common the least number of collisions close to the stirrer shaft and stirrer disc, and a medium amount of collisions in the middle between the two stirrer discs. A peak of the amount of collision can be found in two grinding bead diameters distance to the grinding chamber wall. For a stirrer tip speed of 14 m/s, the highest collision frequencies (more than 5·1012 m−3s−1) can be found in this area (Figure 13b). However, a dense packing of grinding media led to a low collision frequency. This was the case for a total filling of 90% (see Figure 13d), where the grinding media were tightly packed toward the outer chamber wall and, hence, the local collision frequency was lower compared to the reference case (Figure 13a).
Figure 14a shows that V3 had the highest absolute number of collisions, followed by V4, V2 and V1, corresponding to the order of volume size. Figure 14b shows the collision density (number of collisions per volume) in the zones, and it is apparent that the highest collision density occurred in V2 and the lowest in V1. This order can be determined for all investigated stirrer speeds. The collision density of the entire grinding chamber increased approximately linearly with the stirrer speed, but not in direct proportion as assumed in the stress model of Kwade and Schwedes [33]. The ratio of grinding media collision in the individual volumes changed for different stirrer speeds. This was even more pronounced when varying the filling level. At a high filling level of 90%, the order of collision density altered due to the fact that V3 had the lowest collision density of all volumes. This may be due to the particularly high filling level of 95%, which was present there (see Figure 4b), so that the grinding media showed little relative movement. However, most collisions occurred in V2, although it exhibited a local filling level of 100% at a total filling level of 90%. The stirrer disc seemed to ensure good grinding media mixing in this zone despite the tight packing. Overall, the number of grinding media collisions increased with increasing filling levels.
3.5. Local Power Input
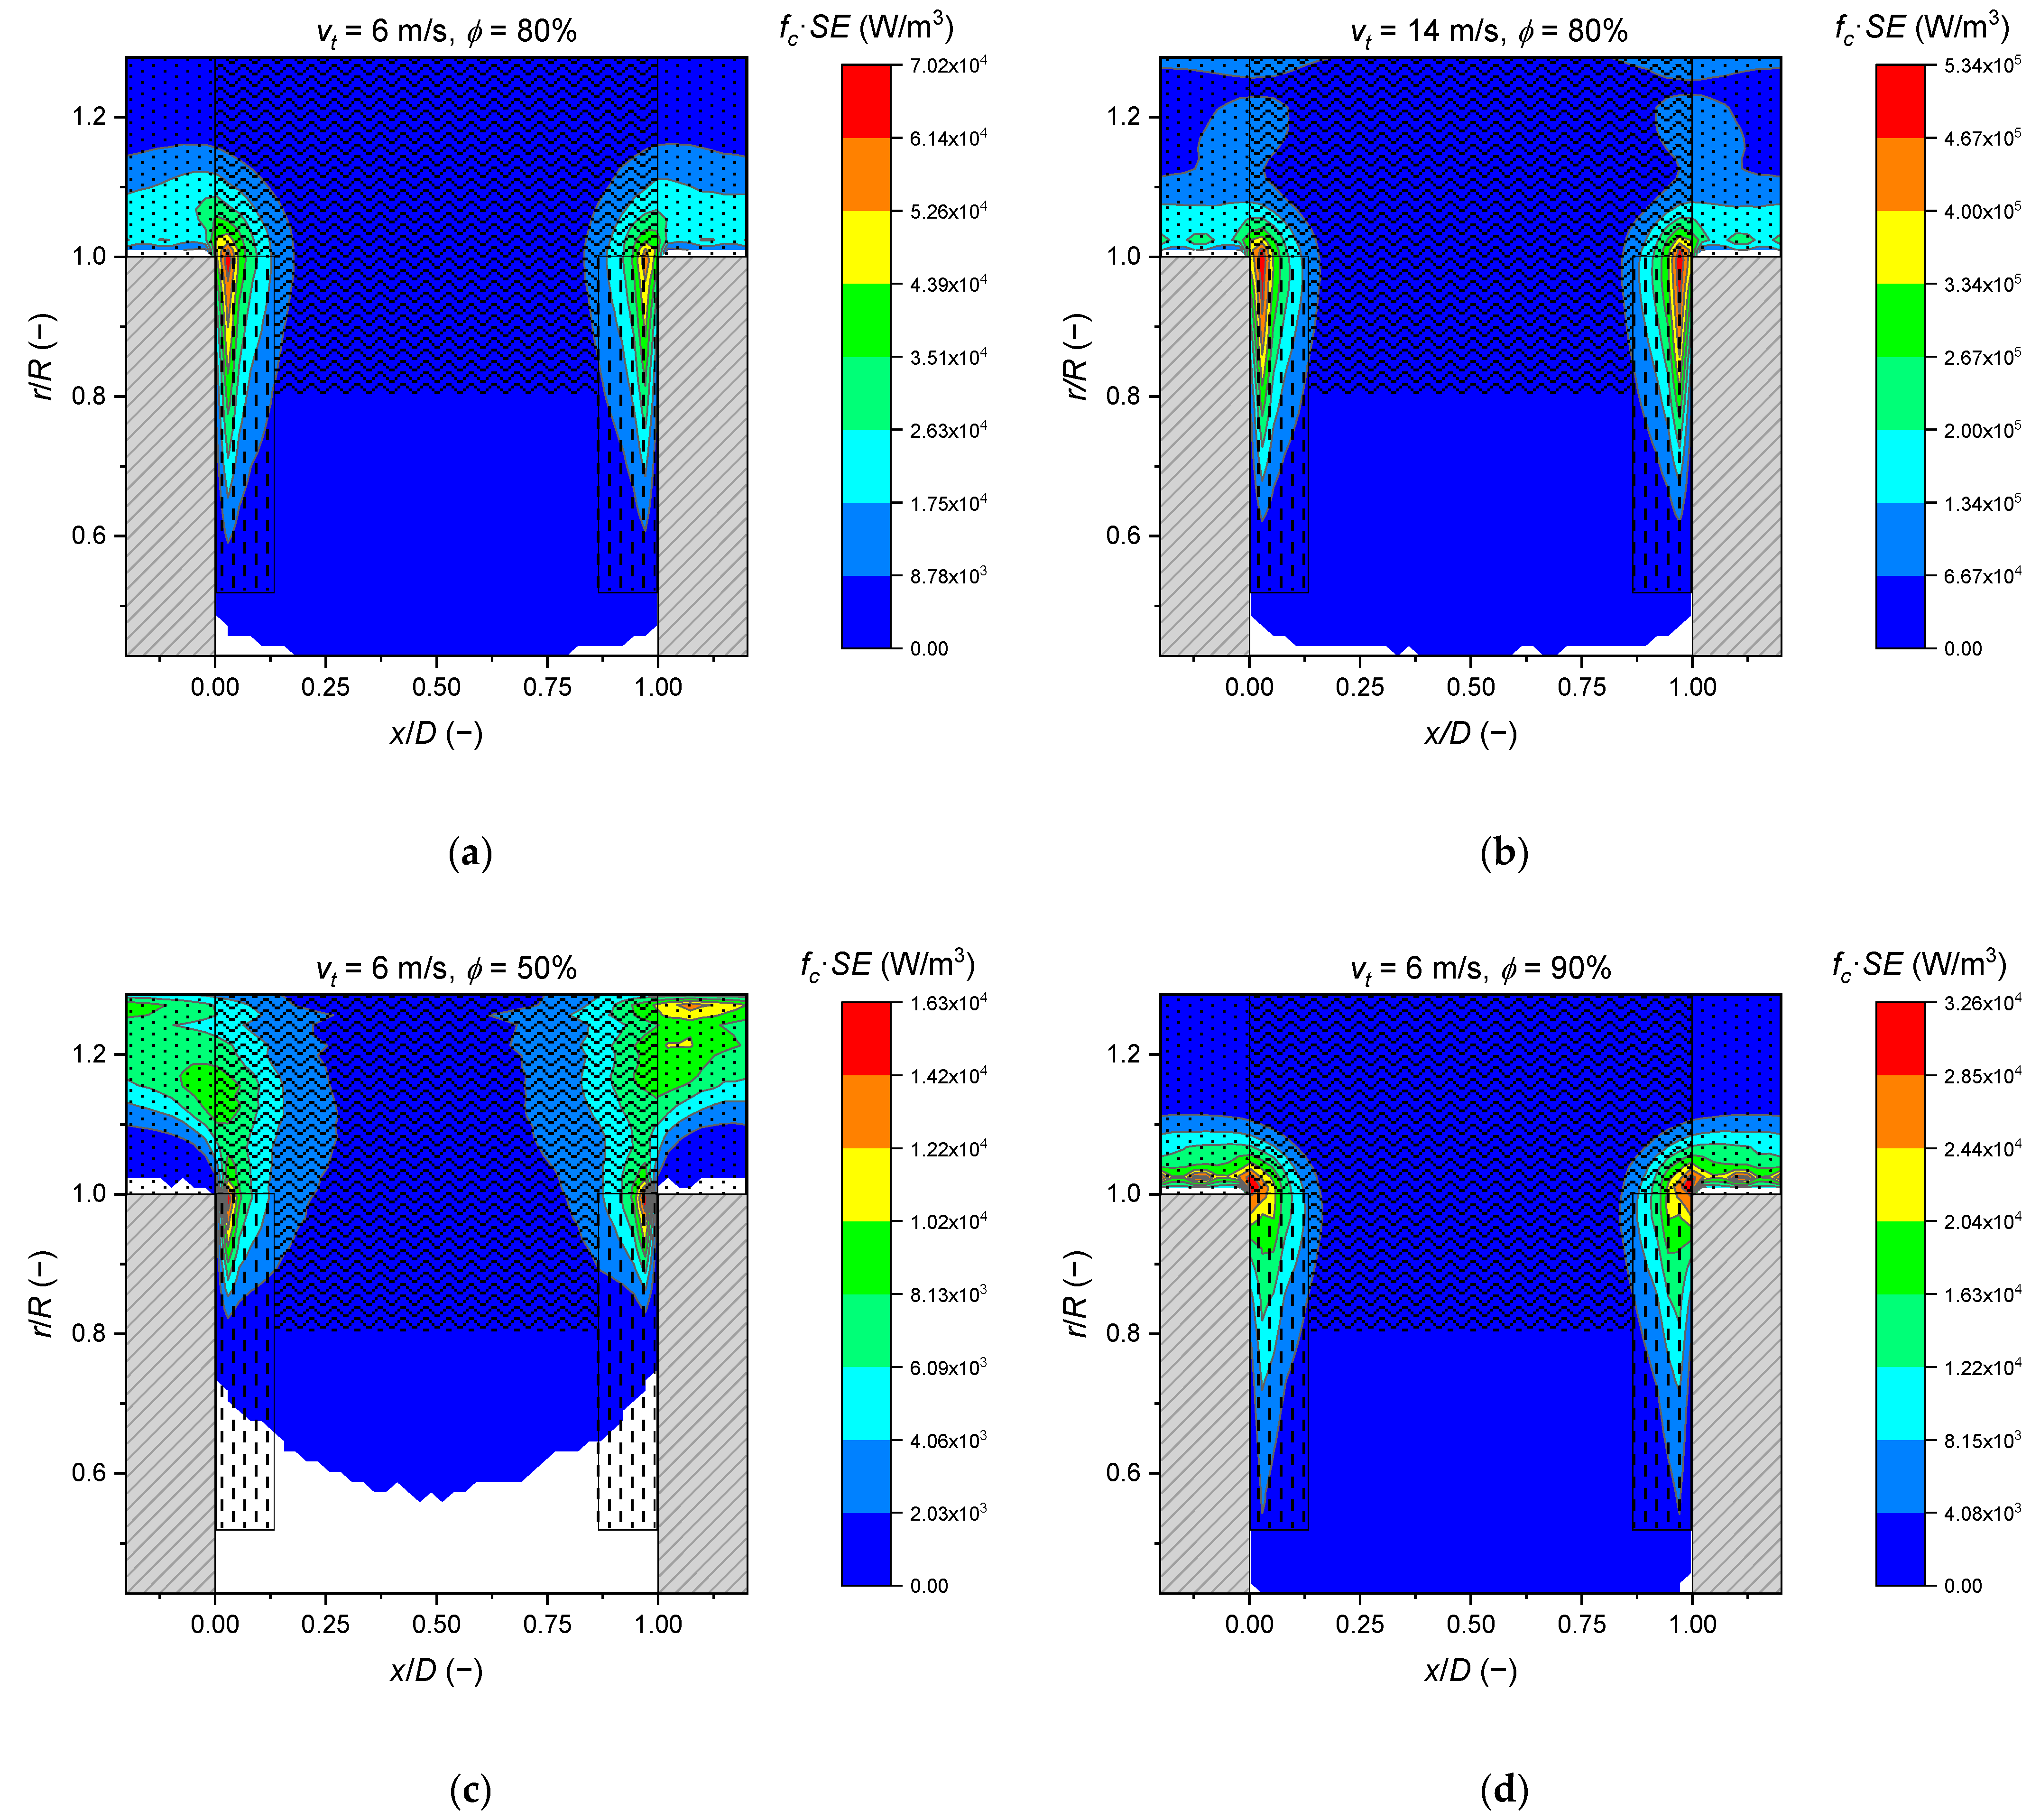
By cumulating the local collision energies for 1 s and relating them to the volume, a locally resolved power input from grinding media collisions was obtained (plotted in Figure 15a–d). The areas with high power input were along the stirrer disc and between the front surface of the stirrer disc and the wall of the grinding chamber. When comparing the different process parameters, the different scales must be taken into account. The locally highest power input was, in all cases, found at the side of the outer edge of the stirrer disc. With a higher stirrer speed, the power input increased significantly and a second area at the edge of the grinding chamber wall with higher power input was formed. The power-intensive area in V2 between the stirrer disc and the wall of the grinding chamber shifted radially toward the wall of the grinding chamber as the filling level decreased.
4. Discussion
The stress energy distribution model of Stender et al. [7] is based on grinding media motion that is derived from CFD simulations [9,11]. Four distinguished volumes showed a characteristic grinding media motion. Some of the characteristics of these volumes could be reproduced by the simulations in this study. The order of median stress energies SE (V1) > SE (V2) > SE (V3) > SE (V4) affirms the expectation of Stender et al. [7].
The width of V1, in particular, described quite accurately the width of the shear band close to the stirrer disc (see Figure 9a,b) for all parameter sets. This confirms the CFD simulations of Blecher and Schwedes [11] and Theuerkauf and Schwedes [9,12]. However, looking at the grinding media velocity profiles in Figure 10, one can see that the shear plane reached further than the border of V1. Considering that the stress energy distribution is mainly determined by the shear profile of grinding media, it is suggested to increase the width of V1 from 2.5 to 3 mm. Moreover, the assumption for the grinding media velocity in V1 cannot be confirmed quantitatively. Unlike Stender et al. [7] assumed, the grinding media did not reach the stirrer velocity close to the stirrer. In the present simulations, the average grinding media velocity at the stirrer tip was 20% of the stirrer tip speed. Yet, this value depends on the friction coefficient, as shown by Bremner et al. [34]. However, with the more common stirrer discs with holes, the grinding media might effectively almost reach the stirrer velocity, so that the assumptions of Stender et al. [7] comes closer to reality than our results showed. Very interesting is the large significant effect of the filling ratio on the grinding media velocities, especially for the collision velocities, and also on the number of media collisions per volume. This has not been considered by simpler models thus far. As Figure 13, Figure 14 and Figure 15 show, the influence of the filling ratio is very complex, and it is believed that no simple model can be defined to model this influence.
In V4, the power input by grinding media collision was, on average, approximately one decade lower than the respective peak power input in V1. It is, therefore, reasonable to set the stress energy to zero for the stress energy distribution model, as Stender et al. proposed. Additionally, V3 showed mostly low power input, similar to V4. Only the corners of V3, which were above the edges of the stirrer disc, showed higher local power input. An improved partitioning would, therefore, extend V4 until the grinding chamber wall. The remaining part of V3 could either stay as a separate volume or might be combined with V2.
In conclusion it can be stated that the quantitatively most similar normalized velocity profiles of the grinding media serve as a good basis for modeling the stress energy profile in a stirred media mill. However, the local grinding media filling and the grinding media collision frequency could be less clearly described.
Author Contributions
Conceptualization, G.F., C.S., and A.K.; methodology, M.S. and G.F.; software, M.S.; investigation, A.N. and G.F.; data curation, A.N. and G.F.; original draft preparation, A.N. and G.F.; funding acquisition, A.K. and C.S. All authors have read and agreed to the published version of the manuscript.
Funding
This research was funded by Deutsche Forschungsgemeinschaft via Priority Program SPP 1679 “Dynamic simulation of interconnected solids processes,” grant numbers KW 9/19-2 and SCHI 1265/2-1. This work was carried out within the framework of the SMART BIOTECS alliance between the Technische Universität Braunschweig and the Leibniz Universität Hannover. This initiative was supported by the Ministry of Science and Culture (MWK) of Lower Saxony.
Institutional Review Board Statement
Not applicable.
Informed Consent Statement
Not applicable.
Data Availability Statement
The data presented in this study are available on request from the corresponding author.
Conflicts of Interest
The authors declare no conflict of interest.
Appendix A
Figure A1.
Stress energy distribution for the trans-normal direction at varied stirrer speeds and a grinding media filling of 80% in (a) V1, (b) V2, (c) V3, and (d) V4.
Figure A1.
Stress energy distribution for the trans-normal direction at varied stirrer speeds and a grinding media filling of 80% in (a) V1, (b) V2, (c) V3, and (d) V4.

Figure A2.
Stress energy distribution for the trans-normal direction at varied grinding media fillings and stirrer speed of 6 m/s in (a) V1, (b) V2, (c) V3, and (d) V4.
Figure A2.
Stress energy distribution for the trans-normal direction at varied grinding media fillings and stirrer speed of 6 m/s in (a) V1, (b) V2, (c) V3, and (d) V4.

References
- Kwade, A.; Schwedes, J. Wet Comminution in Stirred Media Mills. Kona Powder Part. J. 1997, 15, 91–102. [Google Scholar] [CrossRef] [Green Version]
- Taylor, L.; Skuse, D.; Blackburn, S.; Greenwood, R. Stirred media mills in the mining industry: Material grindability, energy-size relationships, and operating conditions. Powder Technol. 2020, 369, 1–16. [Google Scholar] [CrossRef]
- Gao, M.; Young, M.F.; Cronin, B.; Harbort, G. IsaMill medium competency and its effect on milling performance. Min. Met. Explor. 2001, 18, 117–120. [Google Scholar] [CrossRef]
- Knieke, C.; Steinborn, C.; Romeis, S.; Peukert, W.; Breitung-Faes, S.; Kwade, A. Nanoparticle Production with Stirred-Media Mills: Opportunities and Limits. Chem. Eng. Technol. 2010, 33, 1401–1411. [Google Scholar] [CrossRef]
- Li, H.; Rostamizadeh, M.; Mameri, K.; Boffito, D.C.; Saadatkhah, N.; Rigamonti, M.G.; Patience, G.S. Ultrasound assisted wet stirred media mill of high concentration LiFePO4 and catalysts. Can. J. Chem. Eng. 2019, 97, 2242–2250. [Google Scholar] [CrossRef]
- Romeis, S.; Schmidt, J.; Peukert, W. Mechanochemical aspects in wet stirred media milling. Int. J. Miner. Process. 2016, 156, 24–31. [Google Scholar] [CrossRef]
- Stender, H.-H.; Kwade, A.; Schwedes, J. Stress energy distribution in different stirred media mill geometries. Int. J. Miner. Process. 2004, 74, S103–S117. [Google Scholar] [CrossRef]
- van der Westhuizen, A.P.; Govender, I.; Mainza, A.N.; Rubenstein, J. Tracking the motion of media particles inside an IsaMill™ using PEPT. Miner. Eng. 2011, 24, 195–204. [Google Scholar] [CrossRef]
- Theuerkauf, J. Numerische und Experimentelle Untersuchungen von Fluid- und Mahlkörperbewegungen in Rührwerkskugelmühlen; Cuvillier Verlag: Göttingen, Germany, 2000; ISBN 3-89712-803-9. [Google Scholar]
- Gers, R.; Climent, E.; Legendre, D.; Anne-Archard, D.; Frances, C. Numerical modelling of grinding in a stirred media mill: Hydrodynamics and collision characteristics. Chem. Eng. Sci. 2010, 65, 2052–2064. [Google Scholar] [CrossRef] [Green Version]
- Blecher, L.; Schwedes, J. Energy distribution and particle trajectories in a grinding chamber of a stirred ball mill. Int. J. Miner. Process. 1996, 44–45, 617–627. [Google Scholar] [CrossRef]
- Theuerkauf, J.; Schwedes, J. Investigation of Motion in Stirred Media Mills. Chem. Eng. Technol. 2000, 23, 203–209. [Google Scholar] [CrossRef]
- Cleary, P.W.; Sinnott, M.D.; Pereira, G.G. Computational prediction of performance for a full scale Isamill: Part 1–Media motion and energy utilisation in a dry mill. Miner. Eng. 2015, 79, 220–238. [Google Scholar] [CrossRef]
- Beinert, S.; Schilde, C.; Kwade, A. Simulation of Stress Energy and Grinding Media Movement within a Wet-Operated Annular-Gap Mill Using the Discrete-Element Method. Chem. Eng. Technol. 2012, 35, 1911–1921. [Google Scholar] [CrossRef]
- Jayasundara, C.T.; Yang, R.Y.; Yu, A.B. Discrete Particle Simulation of Particle Flow in a Stirred Mill: Effect of Mill Properties and Geometry. Ind. Eng. Chem. Res. 2012, 51, 1050–1061. [Google Scholar] [CrossRef]
- Jayasundara, C.T.; Yang, R.Y.; Yu, A.B.; Curry, D. Discrete Particle Simulation of Particle Flow in the IsaMill Process. Ind. Eng. Chem. Res. 2006, 45, 6349–6359. [Google Scholar] [CrossRef]
- Beinert, S.; Fragnière, G.; Schilde, C.; Kwade, A. Multiscale simulation of fine grinding and dispersing processes: Stressing probability, stressing energy and resultant breakage rate. Adv. Powder Technol. 2018, 29, 573–583. [Google Scholar] [CrossRef]
- Beinert, S.; Fragnière, G.; Schilde, C.; Kwade, A. Analysis and modelling of bead contacts in wet-operating stirred media and planetary ball mills with CFD–DEM simulations. Chem. Eng. Sci. 2015, 134, 648–662. [Google Scholar] [CrossRef]
- Jayasundara, C.T.; Yang, R.Y.; Guo, B.Y.; Yu, A.B.; Govender, I.; Mainza, A.; van der Westhuizen, A.; Rubenstein, J. CFD–DEM modelling of particle flow in IsaMills–Comparison between simulations and PEPT measurements. Miner. Eng. 2011, 24, 181–187. [Google Scholar] [CrossRef]
- Cleary, P.W.; Sinnott, M.D. Computational prediction of performance for a full scale Isamill: Part 2–Wet models of charge and slurry transport. Miner. Eng. 2015, 79, 239–260. [Google Scholar] [CrossRef]
- Fragnière, G.; Beinert, S.; Overbeck, A.; Kampen, I.; Schilde, C.; Kwade, A. Predicting effects of operating condition variations on breakage rates in stirred media mills. Chem. Eng. Res. Des. 2018, 138, 433–443. [Google Scholar] [CrossRef]
- Bilgili, E.; Capece, M.; Afolabi, A. 7-Modeling of milling processes via DEM, PBM, and microhydrodynamics. In Predictive Modeling of Pharmaceutical Unit Operations; Pandey, P., Bharadwaj, R., Eds.; Woodhead Publishing: Sawston, Cambridge, UK, 2017; pp. 159–203. ISBN 978-0-08-100154-7. [Google Scholar]
- Breitung-Faes, S.; Kwade, A. Prediction of energy effective grinding conditions. Miner. Eng. 2013, 43–44, 36–43. [Google Scholar] [CrossRef]
- Department of Particulate Flow Modelling, Johannes Kepler Universität. LIGGGHTS-PFM GitHub Repository. Available online: https://github.com/ParticulateFlow/LIGGGHTS-PFM (accessed on 25 March 2019).
- Department of Particulate Flow Modelling, Johannes Kepler Universität. CFDEM-PFM GitHub Repository. Available online: https://github.com/ParticulateFlow/CFDEMcoupling-PFM (accessed on 25 March 2019).
- Kloss, C.; Goniva, C.; Hager, A.; Amberger, S.; Pirker, S. Models, algorithms and validation for opensource DEM and CFD-DEM. Prog. Comput. Fluid Dyn. 2012, 12, 140–152. [Google Scholar] [CrossRef]
- van Buijtenen, M.S.; van Dijk, W.-J.; Deen, N.G.; Kuipers, J.A.M.; Leadbeater, T.; Parker, D.J. Numerical and experimental study on multiple-spout fluidized beds. Chem. Eng. Sci. 2011, 66, 2368–2376. [Google Scholar] [CrossRef]
- Schrader, M.; Pommerehne, K.; Wolf, S.; Finke, B.; Schilde, C.; Kampen, I.; Lichtenegger, T.; Krull, R.; Kwade, A. Design of a CFD-DEM-based method for mechanical stress calculation and its application to glass bead-enhanced cultivations of filamentous Lentzea aerocolonigenes. Biochem. Eng. J. 2019, 148, 116–130. [Google Scholar] [CrossRef]
- Lommen, S.; Schott, D.; Lodewijks, G. DEM speedup: Stiffness effects on behavior of bulk material. Particuology 2014, 12, 107–112. [Google Scholar] [CrossRef]
- Jayasundara, C.T.; Yang, R.Y.; Yu, A.B.; Rubenstein, J. Effects of disc rotation speed and media loading on particle flow and grinding performance in a horizontal stirred mill. Int. J. Miner. Process. 2010, 96, 27–35. [Google Scholar] [CrossRef]
- Trofa, M.; D’Avino, G.; Fabiano, B.; Vocciante, M. Nanoparticles Synthesis in Wet-Operating Stirred Media: Investigation on the Grinding Efficiency. Materials 2020, 13, 4281. [Google Scholar] [CrossRef] [PubMed]
- Kwade, A. A stressing model for the description and optimization of grinding processes. Chem. Eng. Technol. 2003, 26, 199–205. [Google Scholar] [CrossRef]
- Kwade, A.; Schwedes, J. Wet Grinding in Stirred Media Mills. In Handbook of Powder Technology; Elsevier Science B.V.: Amsterdam, The Netherlands, 2007; pp. 251–382. [Google Scholar]
- Bremner, S.; Govender, I.; Mainza, A. Asymmetric dynamics in a horizontally stirred mill using DEM. Miner. Eng. 2019, 134, 232–240. [Google Scholar] [CrossRef]
Figure 1.
Simulated geometry: (a) simulation area shown in a horizontal stirred media mill (adapted from [9]); (b) simulation area in the axial direction; (c) axially cut side view.
Figure 1.
Simulated geometry: (a) simulation area shown in a horizontal stirred media mill (adapted from [9]); (b) simulation area in the axial direction; (c) axially cut side view.

Figure 2.
Definition and dimensions of the four volumes (V1–V4) in a horizontal stirred media mill with a disc stirrer according to Stender et al. [7]. The cell element described by V1–V4 ranges from the middle of the disc to half of the length between the two discs. The scheme is not drawn to scale.

Figure 3.
Local grinding media concentrations for different total filling levels: (a) in radial plan view; (b) an axial cut at y = 0. The scale shows the volumetric fluid fraction, where a fluid fraction of 0.4 implies a local grinding media filling of 100%, assuming a bulk porosity of ε = 0.4.
Figure 3.
Local grinding media concentrations for different total filling levels: (a) in radial plan view; (b) an axial cut at y = 0. The scale shows the volumetric fluid fraction, where a fluid fraction of 0.4 implies a local grinding media filling of 100%, assuming a bulk porosity of ε = 0.4.

Figure 4.
Local filling level in the individual volumes V1–V4 for: (a) varied stirrer tip speeds; (b) varied total filling levels.
Figure 4.
Local filling level in the individual volumes V1–V4 for: (a) varied stirrer tip speeds; (b) varied total filling levels.

Figure 5.
Local average grinding media speed in the radial plan view of the simulation cell for different grinding media filling grades φ at a circumferential speed of vt = 6 m/s.
Figure 5.
Local average grinding media speed in the radial plan view of the simulation cell for different grinding media filling grades φ at a circumferential speed of vt = 6 m/s.

Figure 6.
View in the axial section for different stirrer tip speeds at a grinding media filling level of 80%: (a) local normalized mean grinding media velocity, where the dark-blue, lilac, green and yellow lines represent the 0.08, 0.10, 0.12 and 0.18 contour lines, respectively; (b) local normalized mean angular velocity of the grinding media around the shaft, where the dark-blue, lilac, green, yellow and bright-blue lines represent the 0.08, 0.10, 0.14, 0.20 and 0.26 contour lines, respectively.

Figure 7.
Contour lines of the radial velocity of zero for different circumferential speeds at a grinding media filling of 80%. The arrows show if the velocity was radially pointing outward or inward.
Figure 7.
Contour lines of the radial velocity of zero for different circumferential speeds at a grinding media filling of 80%. The arrows show if the velocity was radially pointing outward or inward.

Figure 8.
Normalized mean grinding media velocities for volumes V1–V4: (a) depending on the stirring disc tip speed at a grinding media filling level φtotal = 80%; (b) depending on the degree of grinding media filling φtotal at a stirrer tip speed of vt = 6 m/s.
Figure 8.
Normalized mean grinding media velocities for volumes V1–V4: (a) depending on the stirring disc tip speed at a grinding media filling level φtotal = 80%; (b) depending on the degree of grinding media filling φtotal at a stirrer tip speed of vt = 6 m/s.

Figure 9.
Average fluid velocity between the discs at the disc circumference (r = 0.36). The red vertical lines show the border between volume V1 and V3: (a) for varied stirrer tip speeds; (b) for varied grinding media fillings.
Figure 9.
Average fluid velocity between the discs at the disc circumference (r = 0.36). The red vertical lines show the border between volume V1 and V3: (a) for varied stirrer tip speeds; (b) for varied grinding media fillings.

Figure 10.
Average grinding media velocity between the discs at the radius of the disc circumference (r = 0.36). The red vertical lines show the border between volumes V1 and V3: (a) for varied stirrer tip speeds; (b) for varied grinding media fillings.
Figure 10.
Average grinding media velocity between the discs at the radius of the disc circumference (r = 0.36). The red vertical lines show the border between volumes V1 and V3: (a) for varied stirrer tip speeds; (b) for varied grinding media fillings.

Figure 11.
Radially averaged local stress energy components on a logarithmic color scale and their ratio in regard to the total stress energy of a collision: (a) stress energy SEtn resulting from the translatoric normal directional component of a collision; (b) stress energy SEts resulting from translatoric shear components of collision; (c) ratio of SEtn per total stress energy SE of a collision; (d) ratio of SEts per total stress energy SE of a collision.

Figure 12.
Radially averaged local stress energy on a linear color scale with the dimensions of the volumes marked as follows: V1, dots; V2, dashes; V3, saw-toothed. (a) Stirrer tip speed of 6 m/s and grinding media filling of 80%; (b) stirrer tip speed of 14 m/s and grinding media filling of 80%; (c) stirrer tip speed of 6 m/s and grinding media filling of 90%; (d) stirrer tip speed of 6 m/s and grinding media filling of 50%.

Figure 13.
Radially averaged local collision frequency on a linear color scale: (a) stirrer tip speed of 6 m/s and grinding media filling of 80%; (b) stirrer tip speed of 14 m/s and grinding media filling of 80%; (c) stirrer tip speed of 6 m/s and grinding media filling of 90%; (d) stirrer tip speed of 6 m/s and grinding media filling of 50%.

Figure 14.
The amount of grinding media collisions in each volume (V1–V4): (a) bead–bead collision in 1 s for different stirrer speeds; (b) bead–bead collisions in 1 s normalized to the evaluated volume for different stirrer speeds; (c) bead–bead collisions in 1 s for different total grinding media fillings; (d) bead–bead collisions in 1 s normalized on the evaluated volume for different grinding media fillings.

Figure 15.
Radially averaged product of collision frequency and stress energy SE with the dimensions of the volumes marked as follows: V1, dots; V2, dashes; V3, saw-toothed. Each panel has its own scale. (a) Stirrer tip speed of 6 m/s and grinding media filling of 80%; (b) stirrer tip speed of 14 m/s and grinding media filling of 80%; (c) stirrer tip speed of 6 m/s and grinding media filling of 50%; (d) stirrer tip speed of 6 m/s and grinding media filling of 50%.


Table 1.
Material and simulation parameters.
| Parameter | Value | Unit |
|---|---|---|
| Grinding media density | 2510 | kg/m3 |
| Grinding media size | 0.8 | mm |
| Young’s modulus | 6.3·106 | Pa |
| Poisson’s ratio | 0.25 | - |
| Restitution coefficient | 0.99 | - |
| Static friction factor | 0.3 | - |
| Rolling friction factor | 0.10 | - |
| Water density | 998.2 | kg/m3 |
| Water viscosity | 1.002·10−3 | Pa·s |
| Gravitational acceleration in z-direction | −9.81 | m/s2 |
| DEM time step | 5⋅10−6 | s |
| CFD time step | 5⋅10−5 | s |
| Coupling time | 5⋅10−5 | s |
DEM, discrete element method; CFD, computational fluid dynamics.
Table 2.
Dimensions of the investigated volumes as drawn in Figure 2.
Table 2.
Dimensions of the investigated volumes as drawn in Figure 2.
| Name | Value |
|---|---|
| wV1 | 2.5 mm |
| D | 20 mm |
| wsim | 28 mm |
| rsh | 15 mm |
| rV1 | 0.55 R = 19.8 mm |
| rV3 | 0.8 R = 28.8 mm |
| R | 36 mm |
| rc | 45 mm |
Publisher’s Note: MDPI stays neutral with regard to jurisdictional claims in published maps and institutional affiliations. |
© 2021 by the authors. Licensee MDPI, Basel, Switzerland. This article is an open access article distributed under the terms and conditions of the Creative Commons Attribution (CC BY) license (http://creativecommons.org/licenses/by/4.0/).
Share and Cite
MDPI and ACS Style
Fragnière, G.; Naumann, A.; Schrader, M.; Kwade, A.; Schilde, C. Grinding Media Motion and Collisions in Different Zones of Stirred Media Mills. Minerals 2021, 11, 185. https://0-doi-org.brum.beds.ac.uk/10.3390/min11020185
AMA Style
Fragnière G, Naumann A, Schrader M, Kwade A, Schilde C. Grinding Media Motion and Collisions in Different Zones of Stirred Media Mills. Minerals. 2021; 11(2):185. https://0-doi-org.brum.beds.ac.uk/10.3390/min11020185
Chicago/Turabian StyleFragnière, Greta, Aleksandra Naumann, Marcel Schrader, Arno Kwade, and Carsten Schilde. 2021. "Grinding Media Motion and Collisions in Different Zones of Stirred Media Mills" Minerals 11, no. 2: 185. https://0-doi-org.brum.beds.ac.uk/10.3390/min11020185
Note that from the first issue of 2016, this journal uses article numbers instead of page numbers. See further details here.