
REEs in the North Africa P-Bearing Deposits, Paleoenvironments, and Economic Perspectives: A Review


1
Department of Sciences, University of Basilicata, 85100 Potenza, Italy
2
Laboratoire des Réservoirs Souterrains: Pétroliers, Gaziers et Aquifères, Université Kasdi Merbah, Ouargla 30000, Algeria
3
National Research Council, Institute of Methodologies for Environmental Analysis, 85050 Tito Scalo, Italy
*
Author to whom correspondence should be addressed.
Minerals 2021, 11(2), 214; https://0-doi-org.brum.beds.ac.uk/10.3390/min11020214
Submission received: 29 January 2021
/
Revised: 14 February 2021
/
Accepted: 16 February 2021
/
Published: 19 February 2021
(This article belongs to the Special Issue Feature Papers in Mineral Deposits 2020)
Abstract
:A review of the compositional features of Tunisia, Algeria, and Morocco phosphorites is proposed in order to assess and compare the paleoenvironmental conditions that promoted the deposit formation as well as provide information about their economic perspective in light of growing worldwide demand. Since these deposits share a very similar chemical and mineralogical composition, the attention was focused on the geochemistry of rare earth elements (REEs) and mostly on ΣREEs, Ce and Eu anomalies, and (La/Yb) and (La/Gd) normalized ratios. The REEs distributions reveal several differences between deposits from different locations, suggesting mostly that the Tunisian and Algerian phosphorites probably were part of the same depositional system. There, sub-reducing to sub-oxic conditions and a major REEs adsorption by early diagenesis were recorded. Conversely, in the Moroccan basins, sub-oxic to oxic environments and a minor diagenetic alteration occurred, which was likely due to a different seawater supply. Moreover, the drastic environmental changes associated to the Paleocene–Eocene Thermal Maximum event probably influenced the composition of Northern African phosphorites that accumulated the highest REEs amounts during that span of time. Based on the REEs concentrations, and considering the outlook coefficient of REE composition (Koutl) and the percentage of critical elements in ΣREEs (REEdef), the studied deposits can be considered as promising to highly promising REE ores and could represent a profitable alternative source for critical REEs.
1. Introduction
In the last decades, the demand for useful elements is constantly growing and there is an increasing interest in rare earth elements (hereafter REEs), which play a critical role in several sectors, such as industry and technology [1,2,3,4,5,6,7]. REEs are a group of 15 chemical elements, from Lanthanum (La) to Lutetium (Lu), to which Scandium (Sc) and Yttrium (Y) are generally added because of their similar geochemical characteristics and behavior. They are commonly divided into three main groups consisting of the light rare earth elements (LREEs), from La to Pm, the middle rare earth elements (MREEs), Sm to Dy, and the heavy rare earth elements (HREEs), from Eu to Lu, on the basis of their geochemical affinities. Among these elements, the HREEs are particularly important for emerging technologies, green economy, and pharmaceutical and industrial sectors.
However, the REEs exploitation is quite challenging because these elements are usually hosted in a wide range of fine-grained refractory minerals that are difficult to physically concentrate and dissolve [2,5].
Phosphate nodules, and sedimentary phosphorite rocks in general, are able to sequestrate and accumulate large amounts of REEs during their formation and diagenesis [8,9,10,11,12,13,14]. According to Emsbo et al. [6], such deposits represent a useful source of REEs being a potential factor in solving the global REE demand. A further advantage deriving from the REE recovery by phosphorites is attributable to the possible simultaneous extraction of uranium from these rocks [15]. In fact, very high contents of U are associated to phosphorites worldwide [16,17,18], increasing the economic significance of these deposits.
In addition to their economic relevance, the REEs are considered powerful tracers of geochemical processes and have been largely used to reconstruct the paleoenvironmental conditions during the formation of marine authigenic and biogenic phosphates [14,19,20,21,22]. In particular, the analysis of REEs patterns normalized to international standards such as, for example, the Upper Continental Crust (UCC, [23]) and the Post Archean Australian Shale (PAAS, [24]), can be a useful tool for retrieving the depositional conditions and diagenetic processes that involved the marine phosphorites [13,25,26,27]. Furthermore, by using the anomalies of selected REEs, including Ce and Eu, the parental affinity, paleo-redox conditions, diagenesis, and phosphogenesis processes may be further defined [19,21,22,28,29].
The North Africa and Middle East countries contain considerable resources of sedimentary phosphorites that experienced a gradual evolution during the Paleocene–Eocene time [9,10,11,12,13,30]. Based on their trace element contents, such deposits represent a strategic raw material for their numerous uses, such as the production of fertilizers for agriculture and various applications in the high-tech industry [6,7].
In recent years, the phosphate deposits of North Africa have been intensively studied with the principal aim to characterize them from chemical and mineralogical points of view. Such studies are at the basis of this work that represents a review of the compositional features of some Upper Cretaceous to Eocene sedimentary phosphorites of Tunisia, Algeria, and Morocco with the following two purposes: (1) to reconstruct the paleodepositional environments and paleogeography during the deposit formation along the North Africa paleomargin, by means of concentrations and distribution of the REEs within the P-bearing deposits considered; (2) to illustrate the possible economic significance of such phosphorites, calculating and comparing valuable ratios commonly used for this purpose.
2. Geology of the North African Phosphorite Deposits
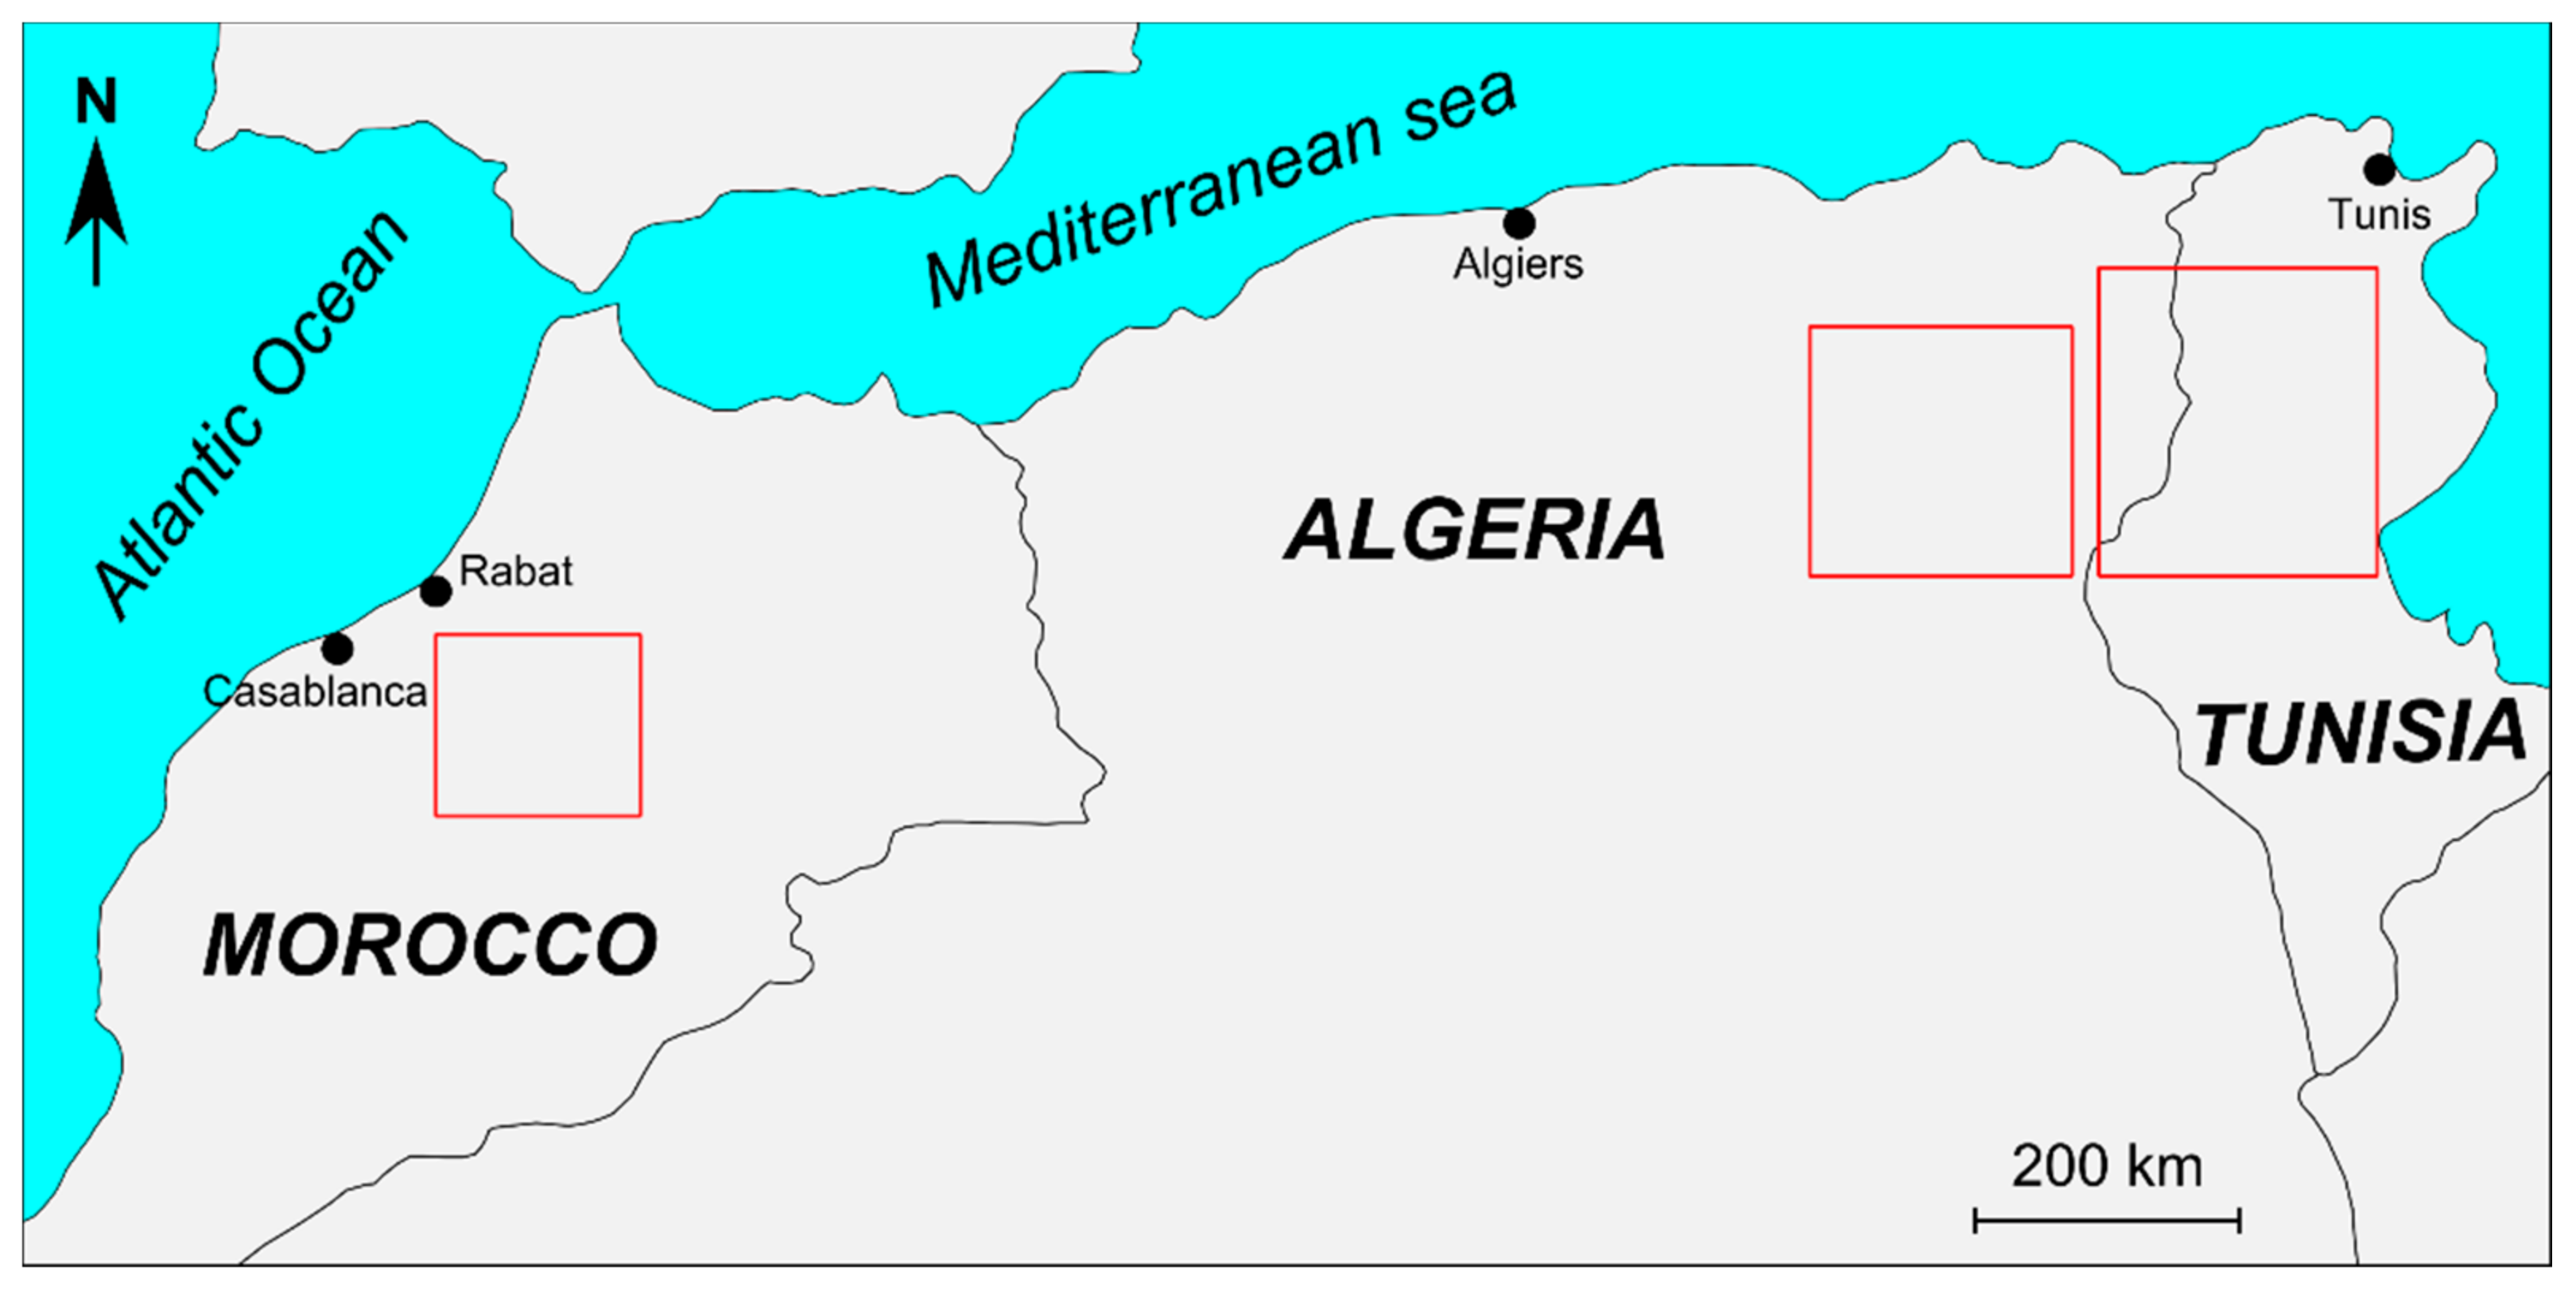
The studied phosphate deposits are part of the Late Cretaceous-Eocene Giant Phosphorite Belt, which extends from the Caribbean to the Middle East through North Africa (Figure 1) [31,32].
In detail, they include the following deposits:
- Tunisian deposits
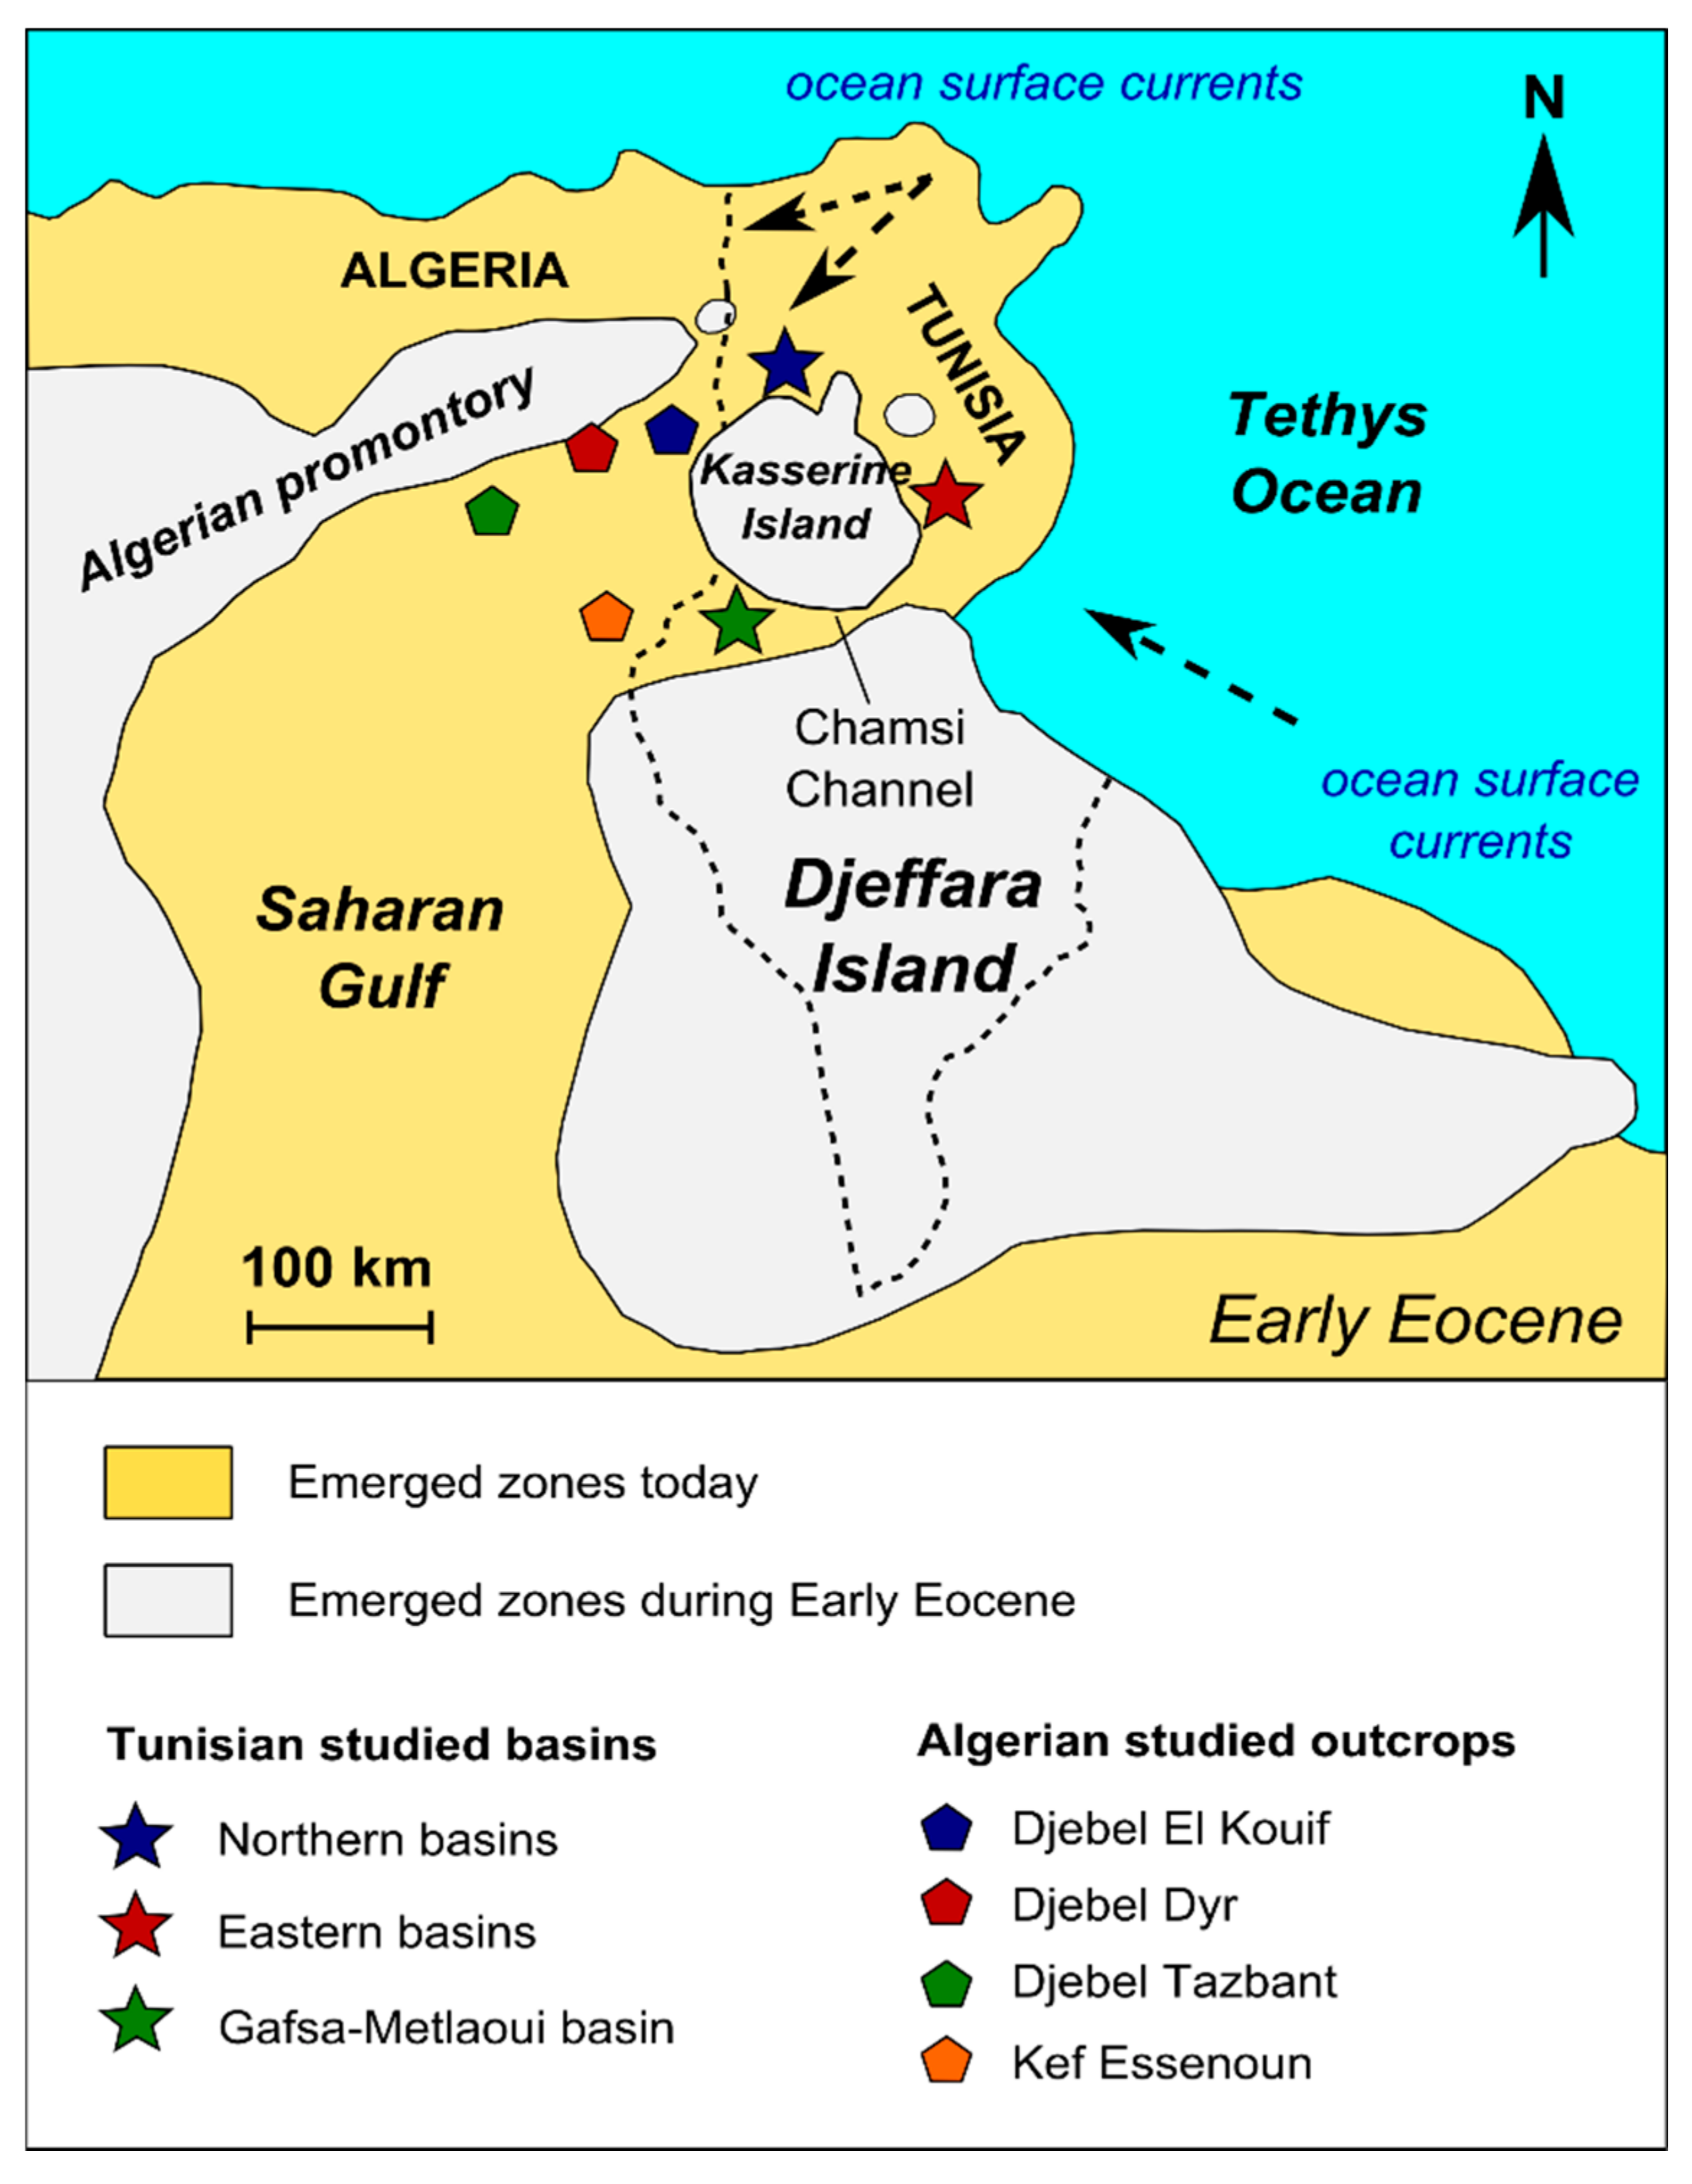
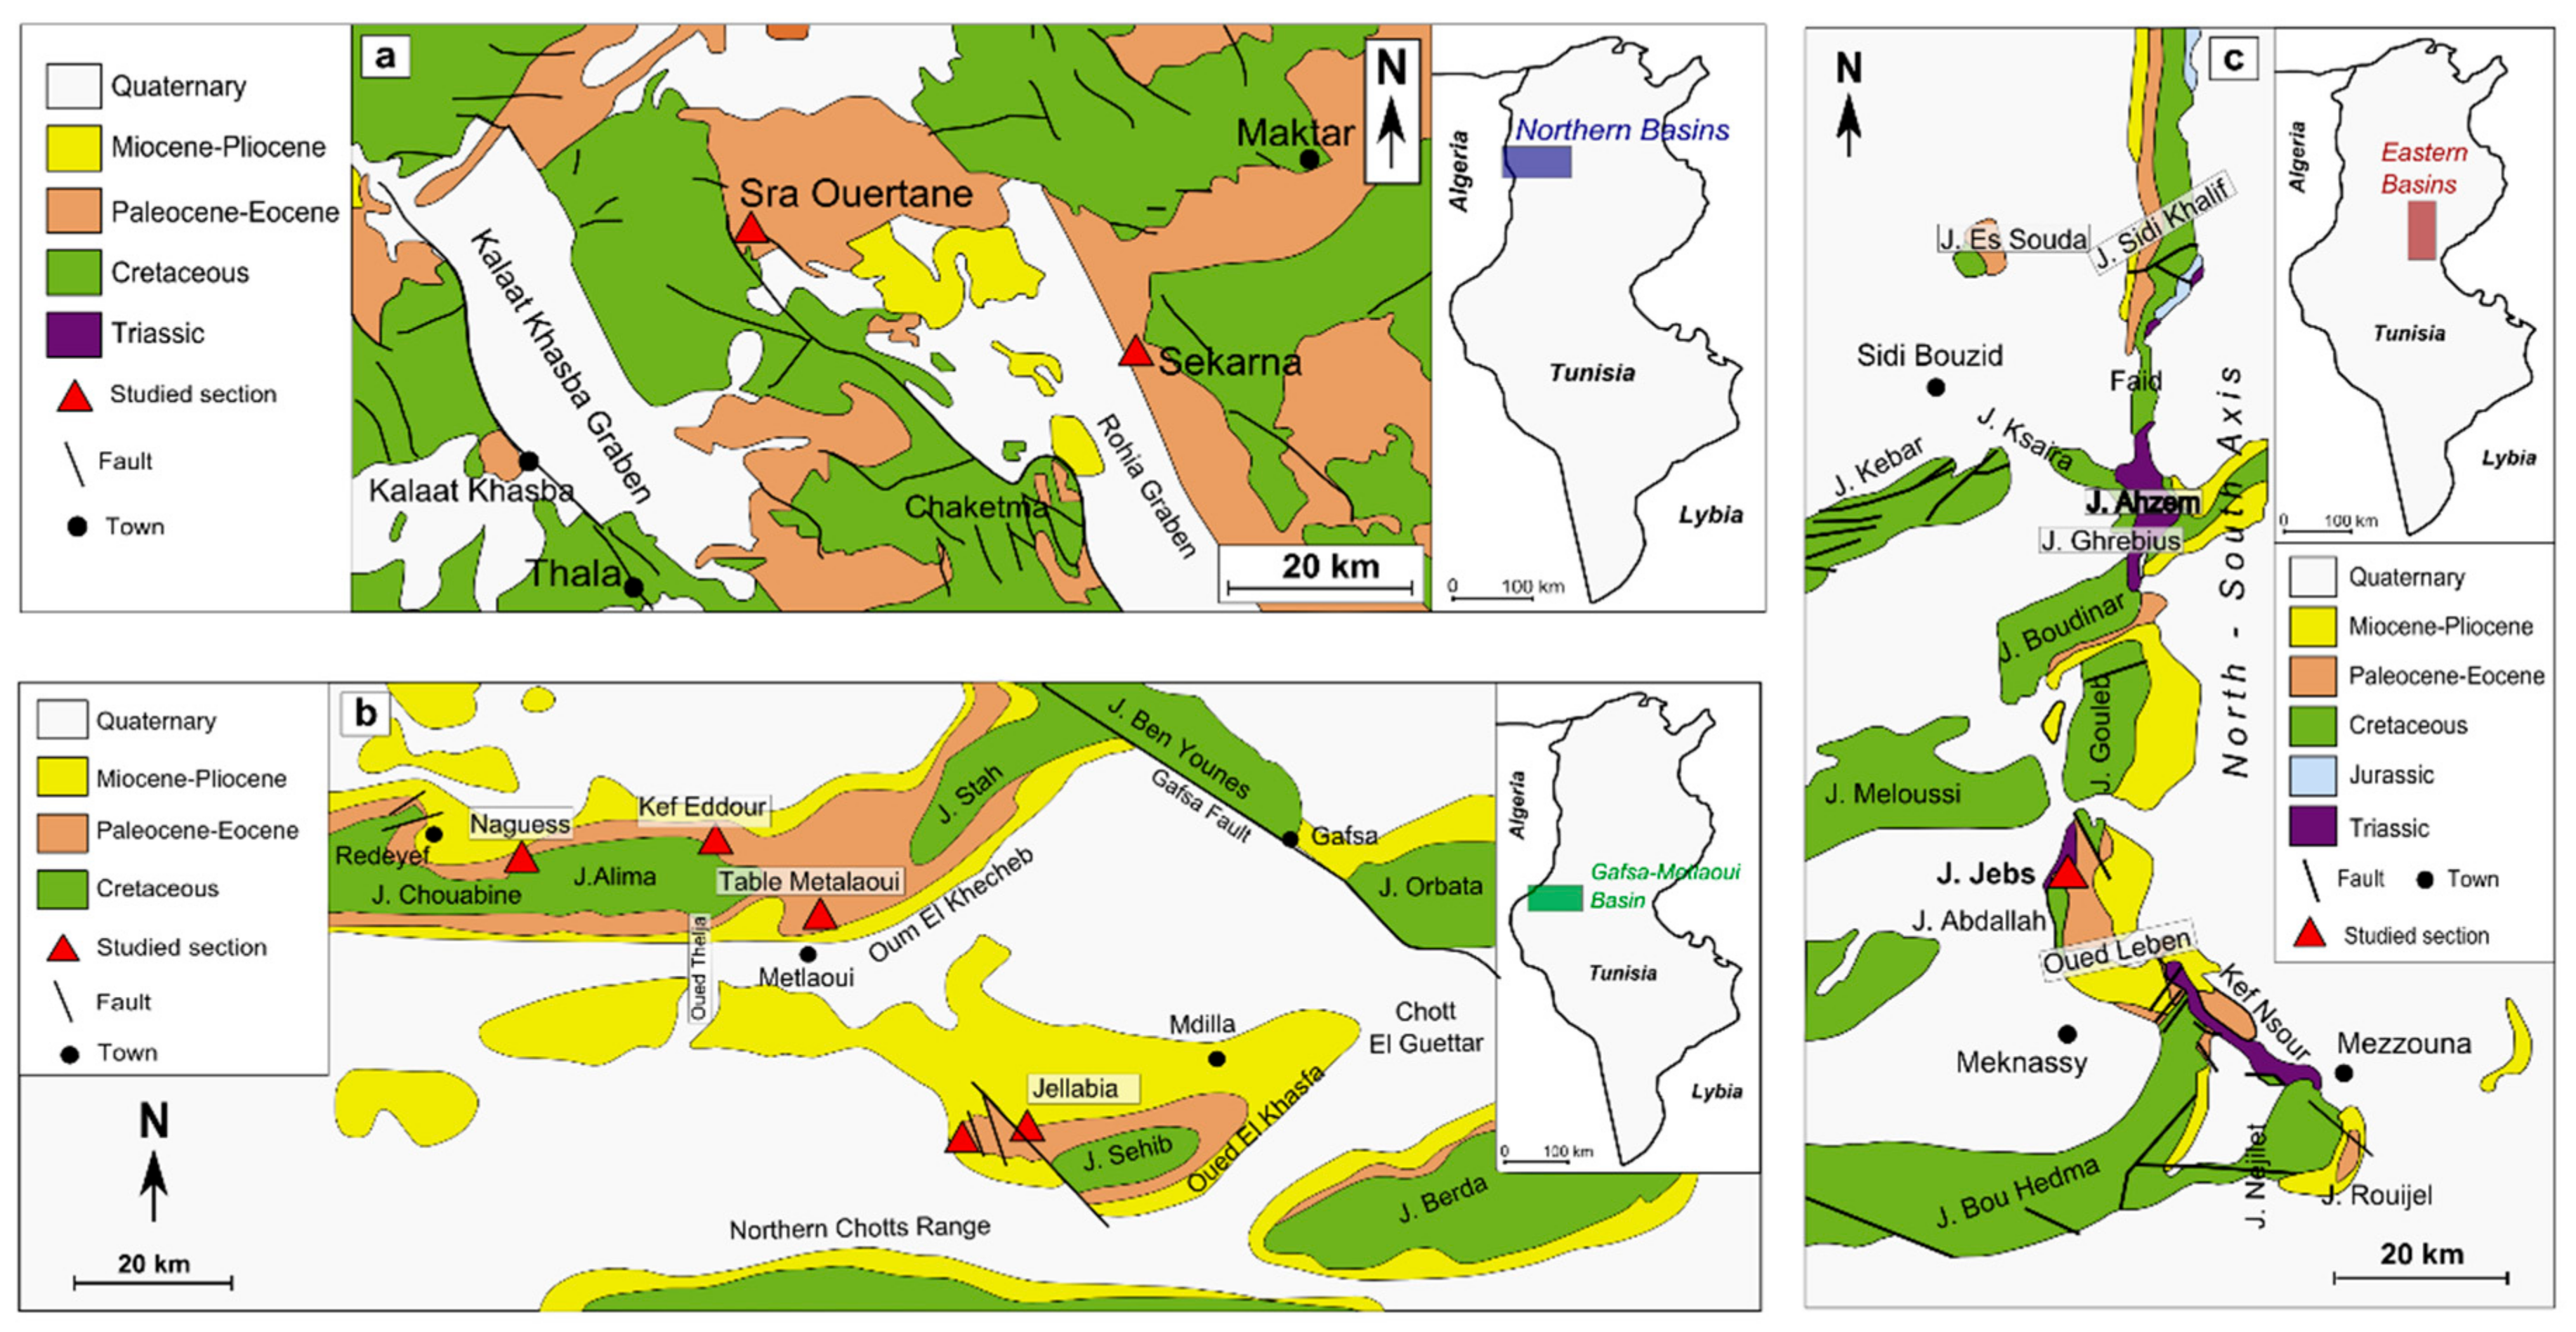
During Late Cretaceous–Eocene, large amounts of phosphorites were deposited in the area now known as Tunisia by phosphogenesis in the Tethyan Ocean [9,10,11,12]. Tunisian phosphorites occur in marine sediments of late Paleocene–early Eocene age that were deposited on the borders of Kasserine Island (Figure 2) in three large basins: the northern basin, which represents a shallow platform setting (Figure 3a), and the Gafsa-Metlaoui basin and eastern basins (Meknassy-Mezzouna basins), which are situated at south and east of the Kasserine Island (Figure 3b,c) respectively, corresponding to a more basinal, depositional environment.
The Gafsa-Metlaoui basin is an intracratonic basin with subsidence controlled by major NW–SE and W–E oriented faults [35]. Sedimentation in the Gafsa basin occurred in a relatively restricted basin, which fluctuated between littoral–lagoonal environments, resulting in rhythmic or episodic sedimentation. The phosphorite-bearing series belongs to the Eocene Metlaoui Group, which lies above the Paleocene series of El Haria Formation (green shales interbedded with thin limestone beds) and is overlain by the late Eocene Jebs Formation (massive bedded gypsum and dolomite) (Figure 4).
- Algerian deposits
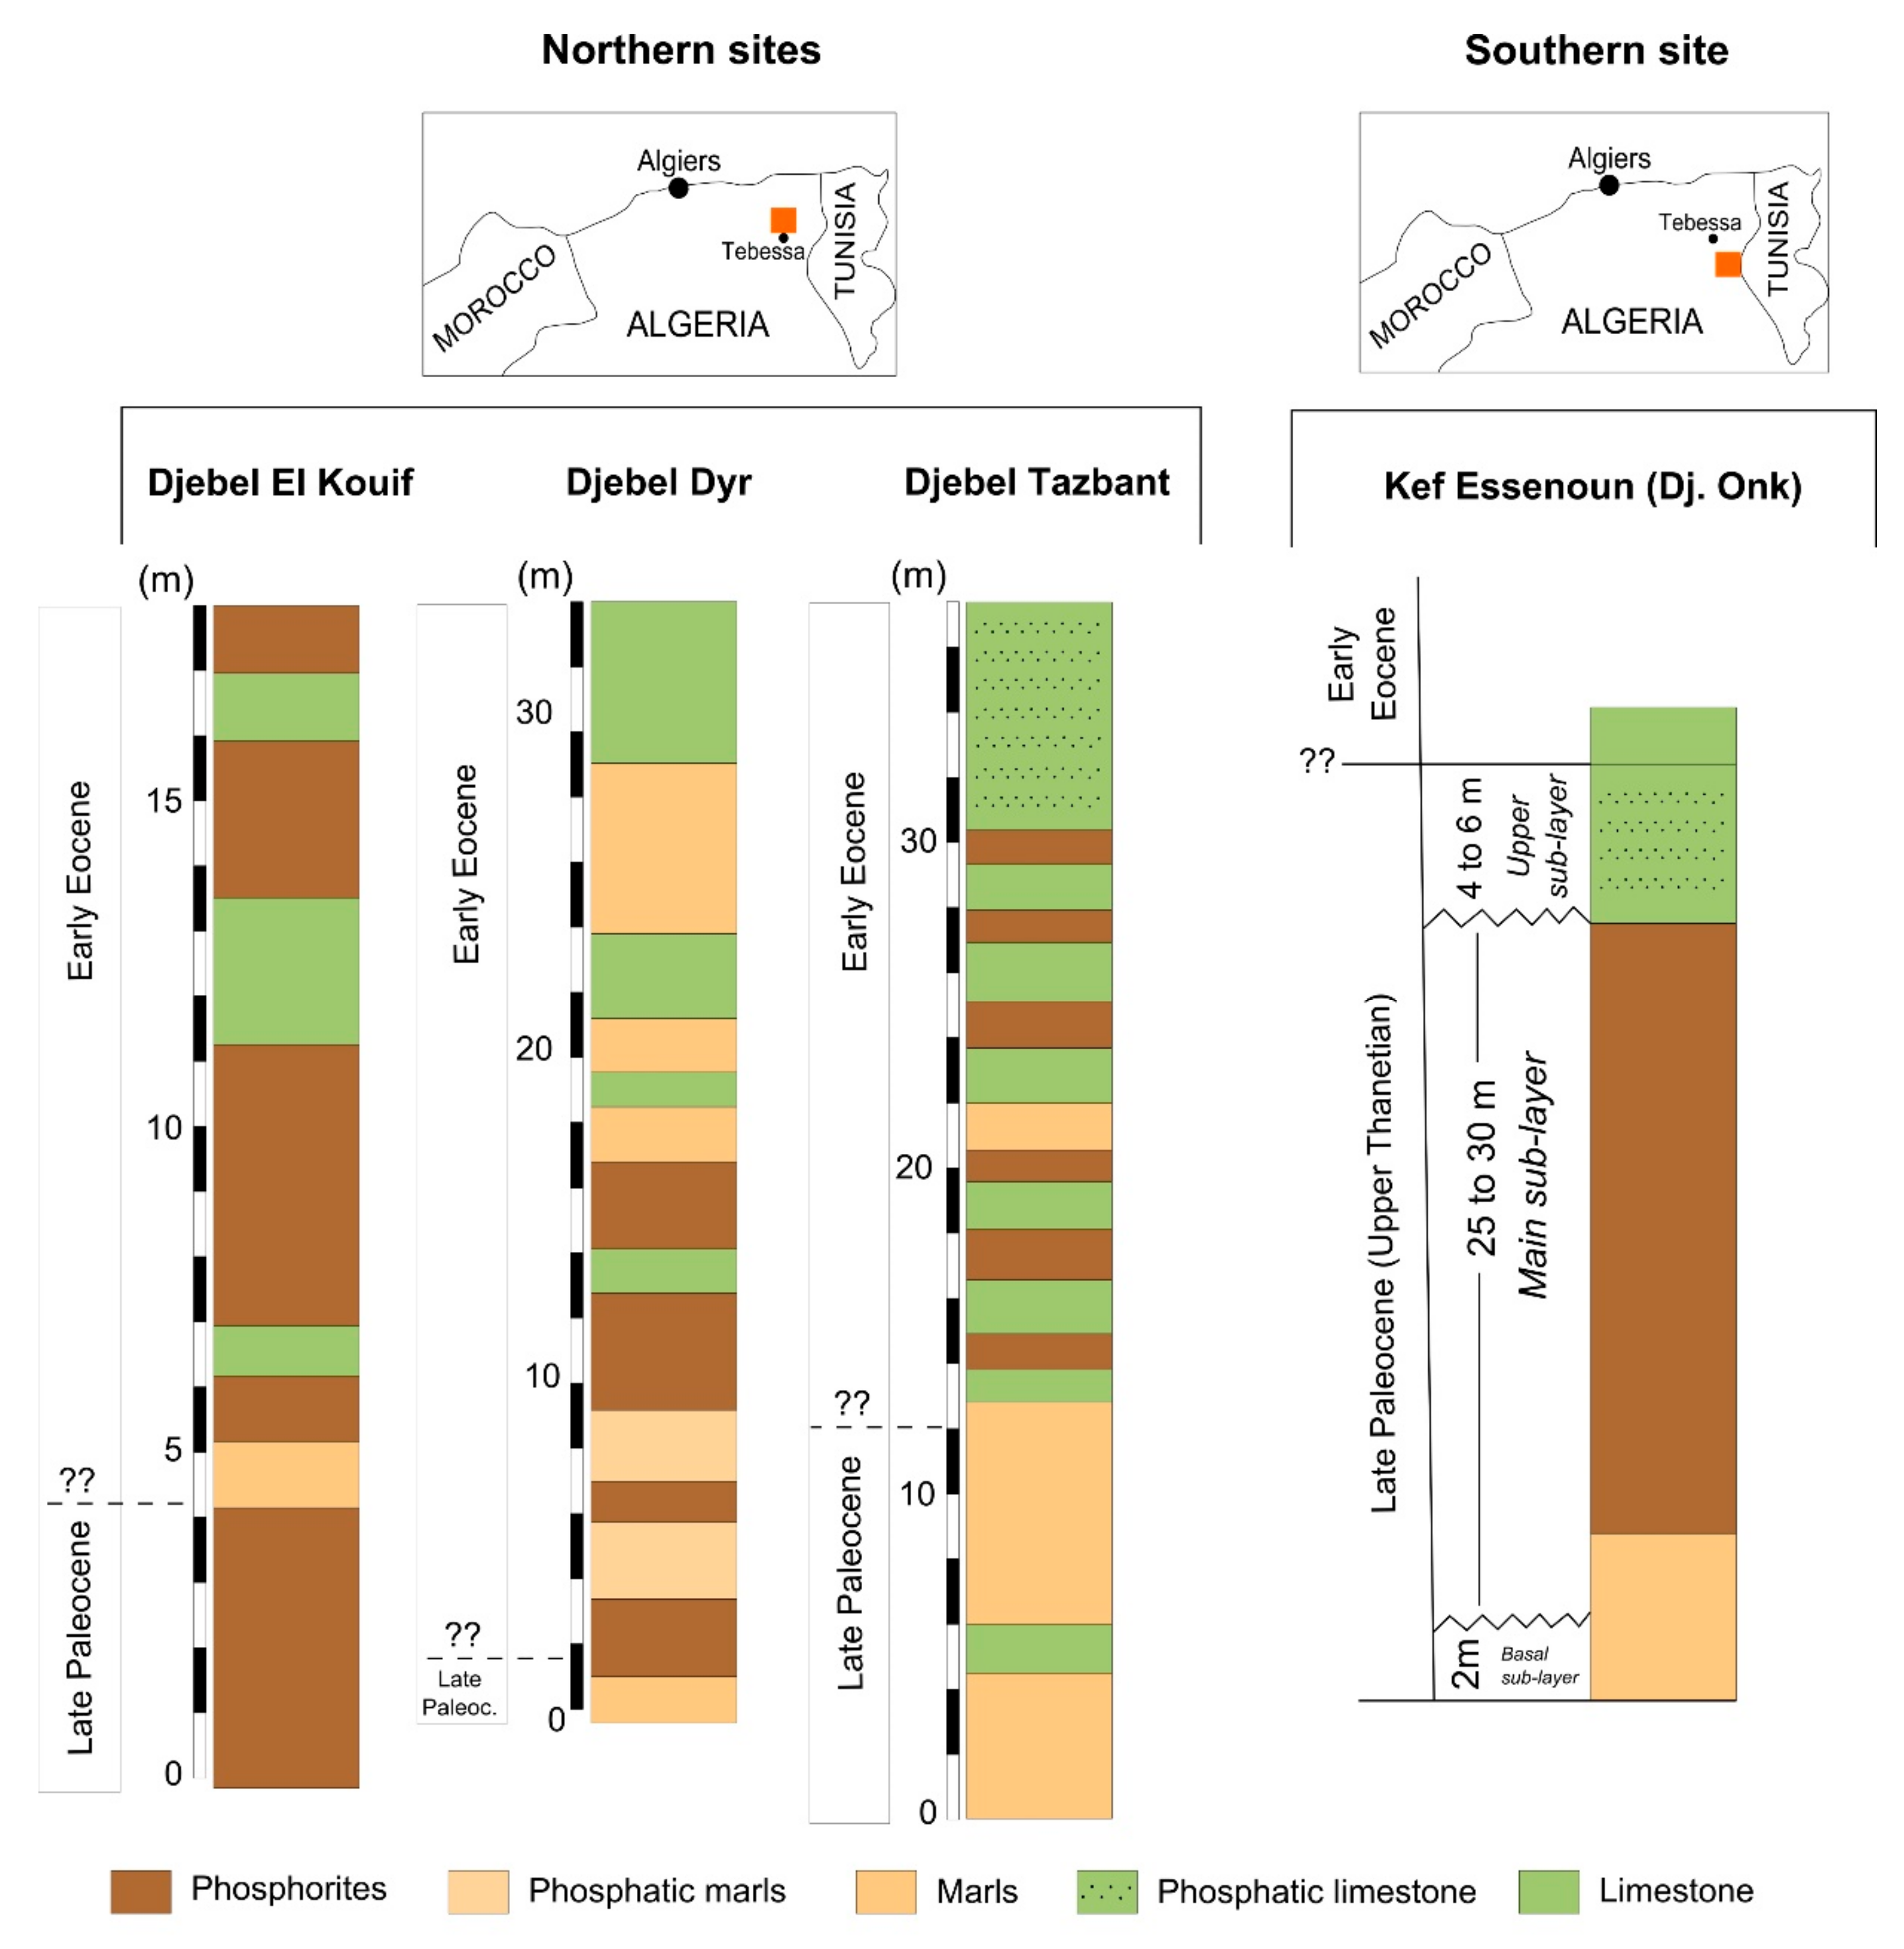
Algerian phosphorites are mainly located in the Tébessa region that belongs to the Eastern Saharan Atlas, close to the Algerian–Tunisian border [13]. These were deposited between Late Paleocene to Early Eocene times during the same phosphogenesis event that was developed in the western part of Kasserine Island (Figure 2). The northern basin of Tebessa hosts thin phosphorite beds (0.1 to 2 m) and is considered the shallowest nearby the Sra Ouertane basin in Tunisia. Conversely, to the south, the Djebel Onk mining basin hosts giant deposits, which are linked to Gafsa-Metlaoui-Onk basin [38]. In detail, this region includes two main phosphorite occurrences (Figure 5) that were intensively studied: in the northern sector, phosphorites occur at Djebel El Kouif, Djebel Dyr, and Djebel Tazbant sites; in the southern sector, they occur at the Kef Essenoun deposit. This deposit belongs to the mining district of Djebel Onk, which is geographically close to the Gafsa-Metlaoui deposits in Tunisia.
- Morocco deposits
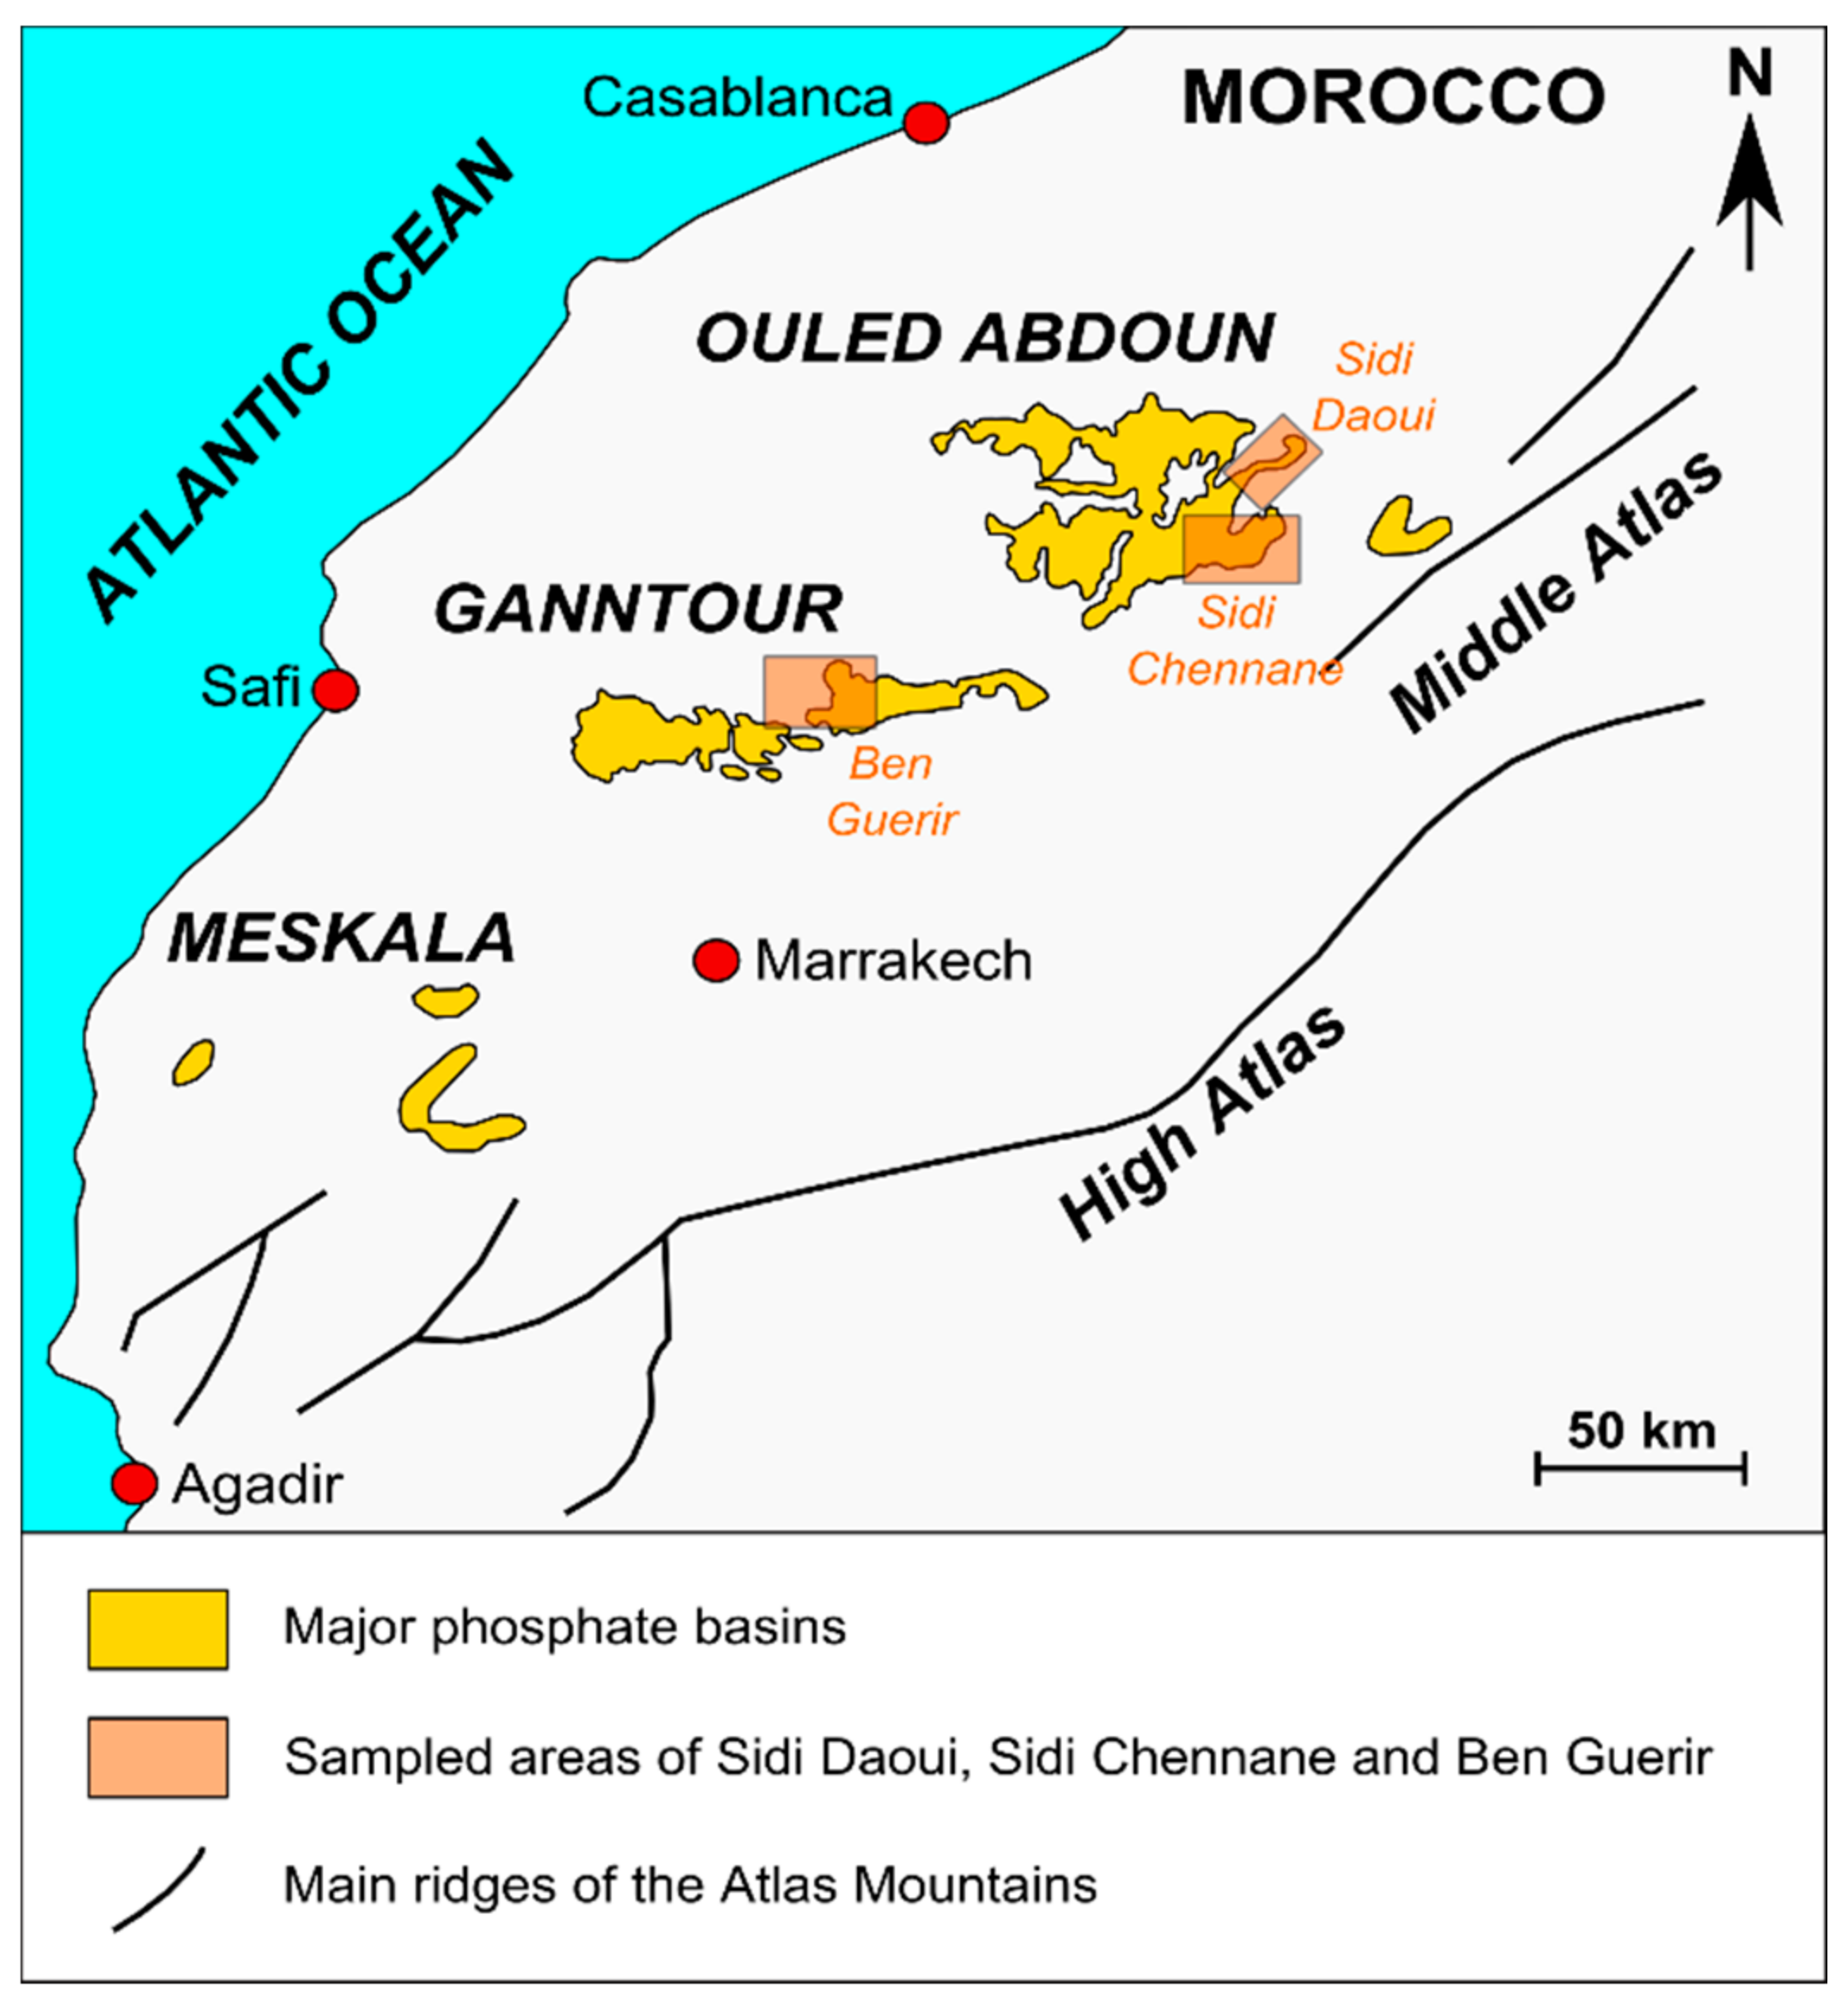
During the Late Cretaceous and Early Paleogene, various shallow marine basins occur in the structural zones of the Western Meseta in western Morocco (Figure 6).
The Ouled Abdoun, Ganntour, and Meskala basins are the largest ones. In these basins, the marine sedimentary sequence (Figure 7) is represented by Cenomanian–Turonian deposits (marl, gypsum, limestone) and by Senonian marl and limestone [11]. This is overlaid by the Maastrichtian–Ypresian phosphorite sequence, which is covered by dolomite and limestone of Lutetian age or locally by continental deposits of Neogene [39]. Principally, phosphorite deposits consist of three megasequences (first order transgressive–regressive cycles) separated by major discontinuities aged of Maastrichtian, Danian–Thanetian, and Ypresian [39].
3. Materials and Methods
In this review, the available data of chemical and mineralogical composition of a total of two hundred and twenty-two samples from the North Africa (Tunisia, Algeria, and Morocco) phosphorite deposits have been summarized by previous authors, analyzed, and discussed. One hundred and twenty-five samples are from Tunisia, forty-one are from Algeria, and fifty-six are from Morocco. It has to be noted that for the present study, major elements and mineralogical data of the Moroccan phosphorites are not available. As to the chemical compositions here reported, two types of samples, the bulk phosphorite and separate particles, have been considered with the assumption that the REEs contents of studied samples are mainly hosted by P-bearing mineralogical phases.
As detailed below, different analytical methods were used for the determination of element concentrations. The major variability of techniques used is for the major element analysis. On the contrary, the REEs detection was performed by inductively coupled plasma-mass spectrometry (ICP-MS) and laser ablation-inductively coupled plasma-mass spectrometry (LA-ICP-MS), which are two forms of the same analytical technique (inductively coupled plasma mass spectrometry) and, according with Balaram [40], differ only by sensitivity, not for precision and accuracy of results.
3.1. Whole Rock Analyses
Garnit et al. [12] analyzed fifty-eight bulk samples from Metlaoui Group (Tunisia) phosphorites. These authors determined the major elements and REEs concentrations by inductively coupled plasma-atomic emission spectrometry (ICP-AES) and inductively coupled plasma-mass spectrometry (ICP-MS) analyses respectively, following the methods described in [12].
The major and rare earth elements of thirty bulk phosphorite samples from the Tébessa region (Algeria) were analyzed only by ICP-MS at University of Montpellier (France), as described in [13].
3.2. Separate Particle Analyses
Fifty-two samples of phosphatic particles were collected from three Tunisian basins, including Sra Ouertane, Jebel Jebs, and Gafsa Metlaoui [10]. The particles, consisting of pellets and coprolites, were separated from their matrix by granulometric fractionation and further selected by hand-picking under binocular microscope. On these samples, in situ analysis on polished sections of individual grains was performed by laser ablation-inductively coupled plasma-mass spectrometry (LA-ICP-MS). Ounis et al. [9] also analyzed sixteen samples of P-particles from Tunisia basins performing X-ray fluorescence analysis for the determination of major elements and LA-ICP-MS for the REEs detection.
Coexisting P-bearing and glauconite particles separated by eleven bulk phosphorite samples of Algeria deposits were also analyzed. As described by Kechiched et al. [7], the major elements contents were detected by electron probe micro-analysis (EPMA), while the REEs concentrations were obtained by LA-ICP-MS. More details on the analytical procedures used can be found in [41,42].
Finally, the REEs concentrations of fifty-six samples of phosphorites from the Ouled Abdoun and Ganntour Basins of Morocco were determined by LA-ICP-MS following the criteria and methods described by [11].
4. Results
4.1. Mineralogy
The mineralogy of Tunisian phosphorites has been widely studied by a number of authors [10,35,37,43,44,45,46,47,48,49], who documented that these ores are mainly composed of francolite, which is a complex carbonate fluorapatite (CFA) [49]. In the associated gangue minerals, calcite, dolomite, quartz, gypsum (occasionally), and clay minerals (smectite, illite, palygorskite, sepiolite, kaolinite) were also found. Among the accessory minerals, glauconite, sulfides (pyrite, sphalerite), heavy minerals (ilmenite, zircon, apatite, amorphous Ti-Fe oxides), and feldspar are also present. Previous studies [44,50,51] reported that clay minerals in the Gafsa-Metlaoui deposits are dominated by smectite (>45 wt%), with a minor presence of palygorskite (typically 10–20 wt%), sepiolite (generally 5–20 wt%), and kaolinite (<10 wt%, in the lowest beds only). Clay minerals in the Eastern Basins at Jebel Jebs yield even higher proportions of smectite (100 wt% in several late phosphorite beds), with minor amounts of palygorskite and kaolinite (≈15 wt% in the lowest phosphorite beds) and illite (up to 30 wt% in the latest phosphorite deposits) [12].
In the Northern Basins at Sra Ouertane, smectite (60–100 wt%), kaolinite (0–20 wt%), and illite (0–30 wt%) dominate clay mineral assemblage, while illite is the subordinate clay mineral up section. Kaolinite (64–85 wt%), illite (0–36 wt%), and minor amounts of smectite were found in the Sekarna deposit. Sulfides are mostly found in the heavy mineral fraction of fresh samples from the Gafsa-Metlaoui Basin. These minerals generally occur as dispersed free crystals, intergranular cement, micrometric inclusions in phosphatic particles, and/or as foraminifera test infillings. The heavy minerals in the Tunisian phosphate deposits consist mainly of Fe-Ti oxides (ilmenite, rutile), apatite, and zircon. The latter do not seem to record reworking or inclusions.
Pellets and coprolites of Tunisian deposits mainly consisting of cryptocrystalline carbonate fluoroapatite [10]. In some pellets, secondary dolomite and sulfide inclusions have been detected; most coprolites show crystalline apatites together with well-formed francolite crystals. This is confirmed by Ounis et al. [9]; however, they highlighted that particles (coprolites and shark teeth) found in the Paleocene–Eocene Tunisia phosphorites are mainly composed of CFA minerals, while those of the Upper Cretaceous deposits also consist of minor amounts of pyrite and quartz.
The mineralogical composition of the Algerian deposits is mainly made up of CFA minerals [13,35]. Mineralogical association is completed by dolomite, calcite, quartz, gypsum, and heulandite [13,38]. In these deposits, Kechiched et al. [13] have documented also significant amounts of glauconitic particles with rounded to sub-rounded shapes and size up to 200 μm.
4.2. Major Elements
The most abundant oxides in Tunisian phosphorites are CaO, ranging from 49.5 to 54.8 wt% with a median of 43.75 wt%, and P2O5, ranging from 30 to 34 wt% (median = 25.51 wt%) (Table 1). SiO2 contents display a median of 9.01 wt%. A lower presence of oxides such as Al2O3 (median = 1.25 wt%), Fe2O3 (median = 0.54 wt%), MgO (median = 0.76 wt%), Na2O (median = 1.0 wt%), K2O (0.27 wt%), and SO3 (median = 3.01 wt%) was also detected. P2O5 reaches the highest values (up to 30 wt%) in the samples from the Gafsa-Metlaoui basin. The average P2O5 content of 34.7 wt% for francolite assessed in commercial Tunisian phosphate rock [52] yields an average francolite content of 75 wt% (maximum 87 wt%) for the Gafsa-Metlaoui Basin sediments, 52 wt% for the Eastern Basins (maximum 85 wt%), and 39 wt% for the Northern Basins (maximum 75 wt%). MgO ranges from a minimum value of 0.23 wt% to a maximum value of 12.6 wt% [49,52].
Na2O and K2O show a similar variability (0.13–1.72 wt% and 0.06–1.47 wt%, respectively). These concentrations could reflect Na substitution in francolite (maximum Na = 1.2 ± 0.2 wt%) [49,53], and to the presence of clinoptilolite, smectite and/or feldspar. The abundance of K2O is mainly linked with the amount of smectite-illite, glauconite, and K-feldspar.
Fe2O3 contents range from a minimum of 0.16 wt% to a maximum of 2.17%, and they show a significant correlation with MnO, indicating an association with ferro-manganese oxy-hydroxides. The glauconite-rich phosphorites (Sekarna) show the highest average of Fe2O3 and K2O contents.
SO3 ranges from 0.20 to 6.84 wt%, and this wide range is likely associated to both the occurrence of sulfate as a constituent anionic group in the lattice of phosphate minerals (maximum 2.7 ± 0.3 wt% SO4) [49,53] and the presence of sulfides (such as pyrite, sphalerite) and gypsum. The lowest SO3 values, which were recorded in the samples from Sra Ouertane, Sekarna, and reworked phosphorite of Mzinda and Jellabia, are consistent with sediment reworking and weathering that lead to sulfur depletion via oxidation and/or sulfate loss from the francolite crystal structure [54].
Algerian phosphorites show CaO contents, with a median value of 39.82 wt%, while the second most abundant major oxide is P2O5, with a median of 23.39 wt%.
Samples from the Djebel El Kouif deposit display high P2O5 contents (from 22.78 to 31.95 wt%). Al2O3 and Fe2O3 concentrations show an average of 0.65 wt% (ranging from 0.21 to 1.56 wt%) and 0.32 wt% (ranging from 0.11 to 0.65 wt%), respectively. The K2O contents range from 0.04 to 0.35 wt% (average = 0.16 wt%), while MnO and TiO2 concentrations are very low, since MnO has a minimum of 0.002 and a maximum of 0.09 wt%, while TiO2 shows a minimum of 0.016 and a maximum of 0.108 wt%.
Samples from Djebel Dyr and Djebel Tazbant are close geographically and were treated statistically together. The abundance of P2O5 ranges from 6.63 to 30.33 wt%. MgO concentrations range from a minimum of 0.28 wt% to a maximum of 2.65 wt% with an average of 0.93 ± 0.63 wt%. The other elements display an average content of <1 wt%. Other samples (P-rich marls) were collected exhibiting lower contents of P2O5 (min = 6.52 wt%, max = 10.24 wt%).
Kechiched et al. [7] analyzed both glauconites and coexisting phosphate particles from Djebel El Kouif and Kef Essenoun deposits. Glauconites from the two deposits show relatively high P2O5 contents from a minimum value of 22.78 wt% to a maximum value of 27.98 wt%. However, the highest P2O5 values are recorded in the coexisting phosphate particles, such as pellets and coprolites, where P2O5 values range from 30.94 to 31.95 wt%. The concentration of fluorine (F) content is similar in glauconites, pellets, and coprolites samples (from 3.21 to 5.23 wt%). The abundances of major oxides such as SiO2, K2O, Al2O3, FeO, and MgO are significantly higher in glauconites, indicating that the precursor is likely to be an argillaceous material. In the glauconitic grains, the amount of SiO2 shows similar values for Djebel El Kouif and Kef Essenoun ranging from a minimum of 10.14 wt% to a maximum of 16.85 wt% and from 13.17 to 17.69 wt%, respectively). FeO contents in the glauconite particles in the two localities range from a minimum value of 2.53 wt% to a maximum of 11.19 wt%.
4.3. Rare Earth Elements
Sedimentary phosphorite deposits are generally recognized as being enriched in rare earth elements (Table 2) compared to shales and other standard rocks such as chondrite [49,55,56,57]. The total amount of rare earth elements (ΣREEs), chondrite-normalized [23] Ce and Eu anomalies, and La/Yb and Gd/Yb ratios of the analyzed samples are plotted into box and whiskers diagrams organized on the basis of the deposits’ age. The chondrite-normalized Ce (Ce/Ce*) and Eu (Eu/Eu*) anomalies were calculated using the following formulas: Eu/Eu* = [Euch/√(Smch·Gdch)]; Ce/Ce* = [Cech/√(Lach·Prch)] (Table S1 in the Supplementary Materials). Concentrations of the REEs in the analyzed deposits are listed in Table 2.
4.3.1. Rare Earth Elements Based on Country Localities.
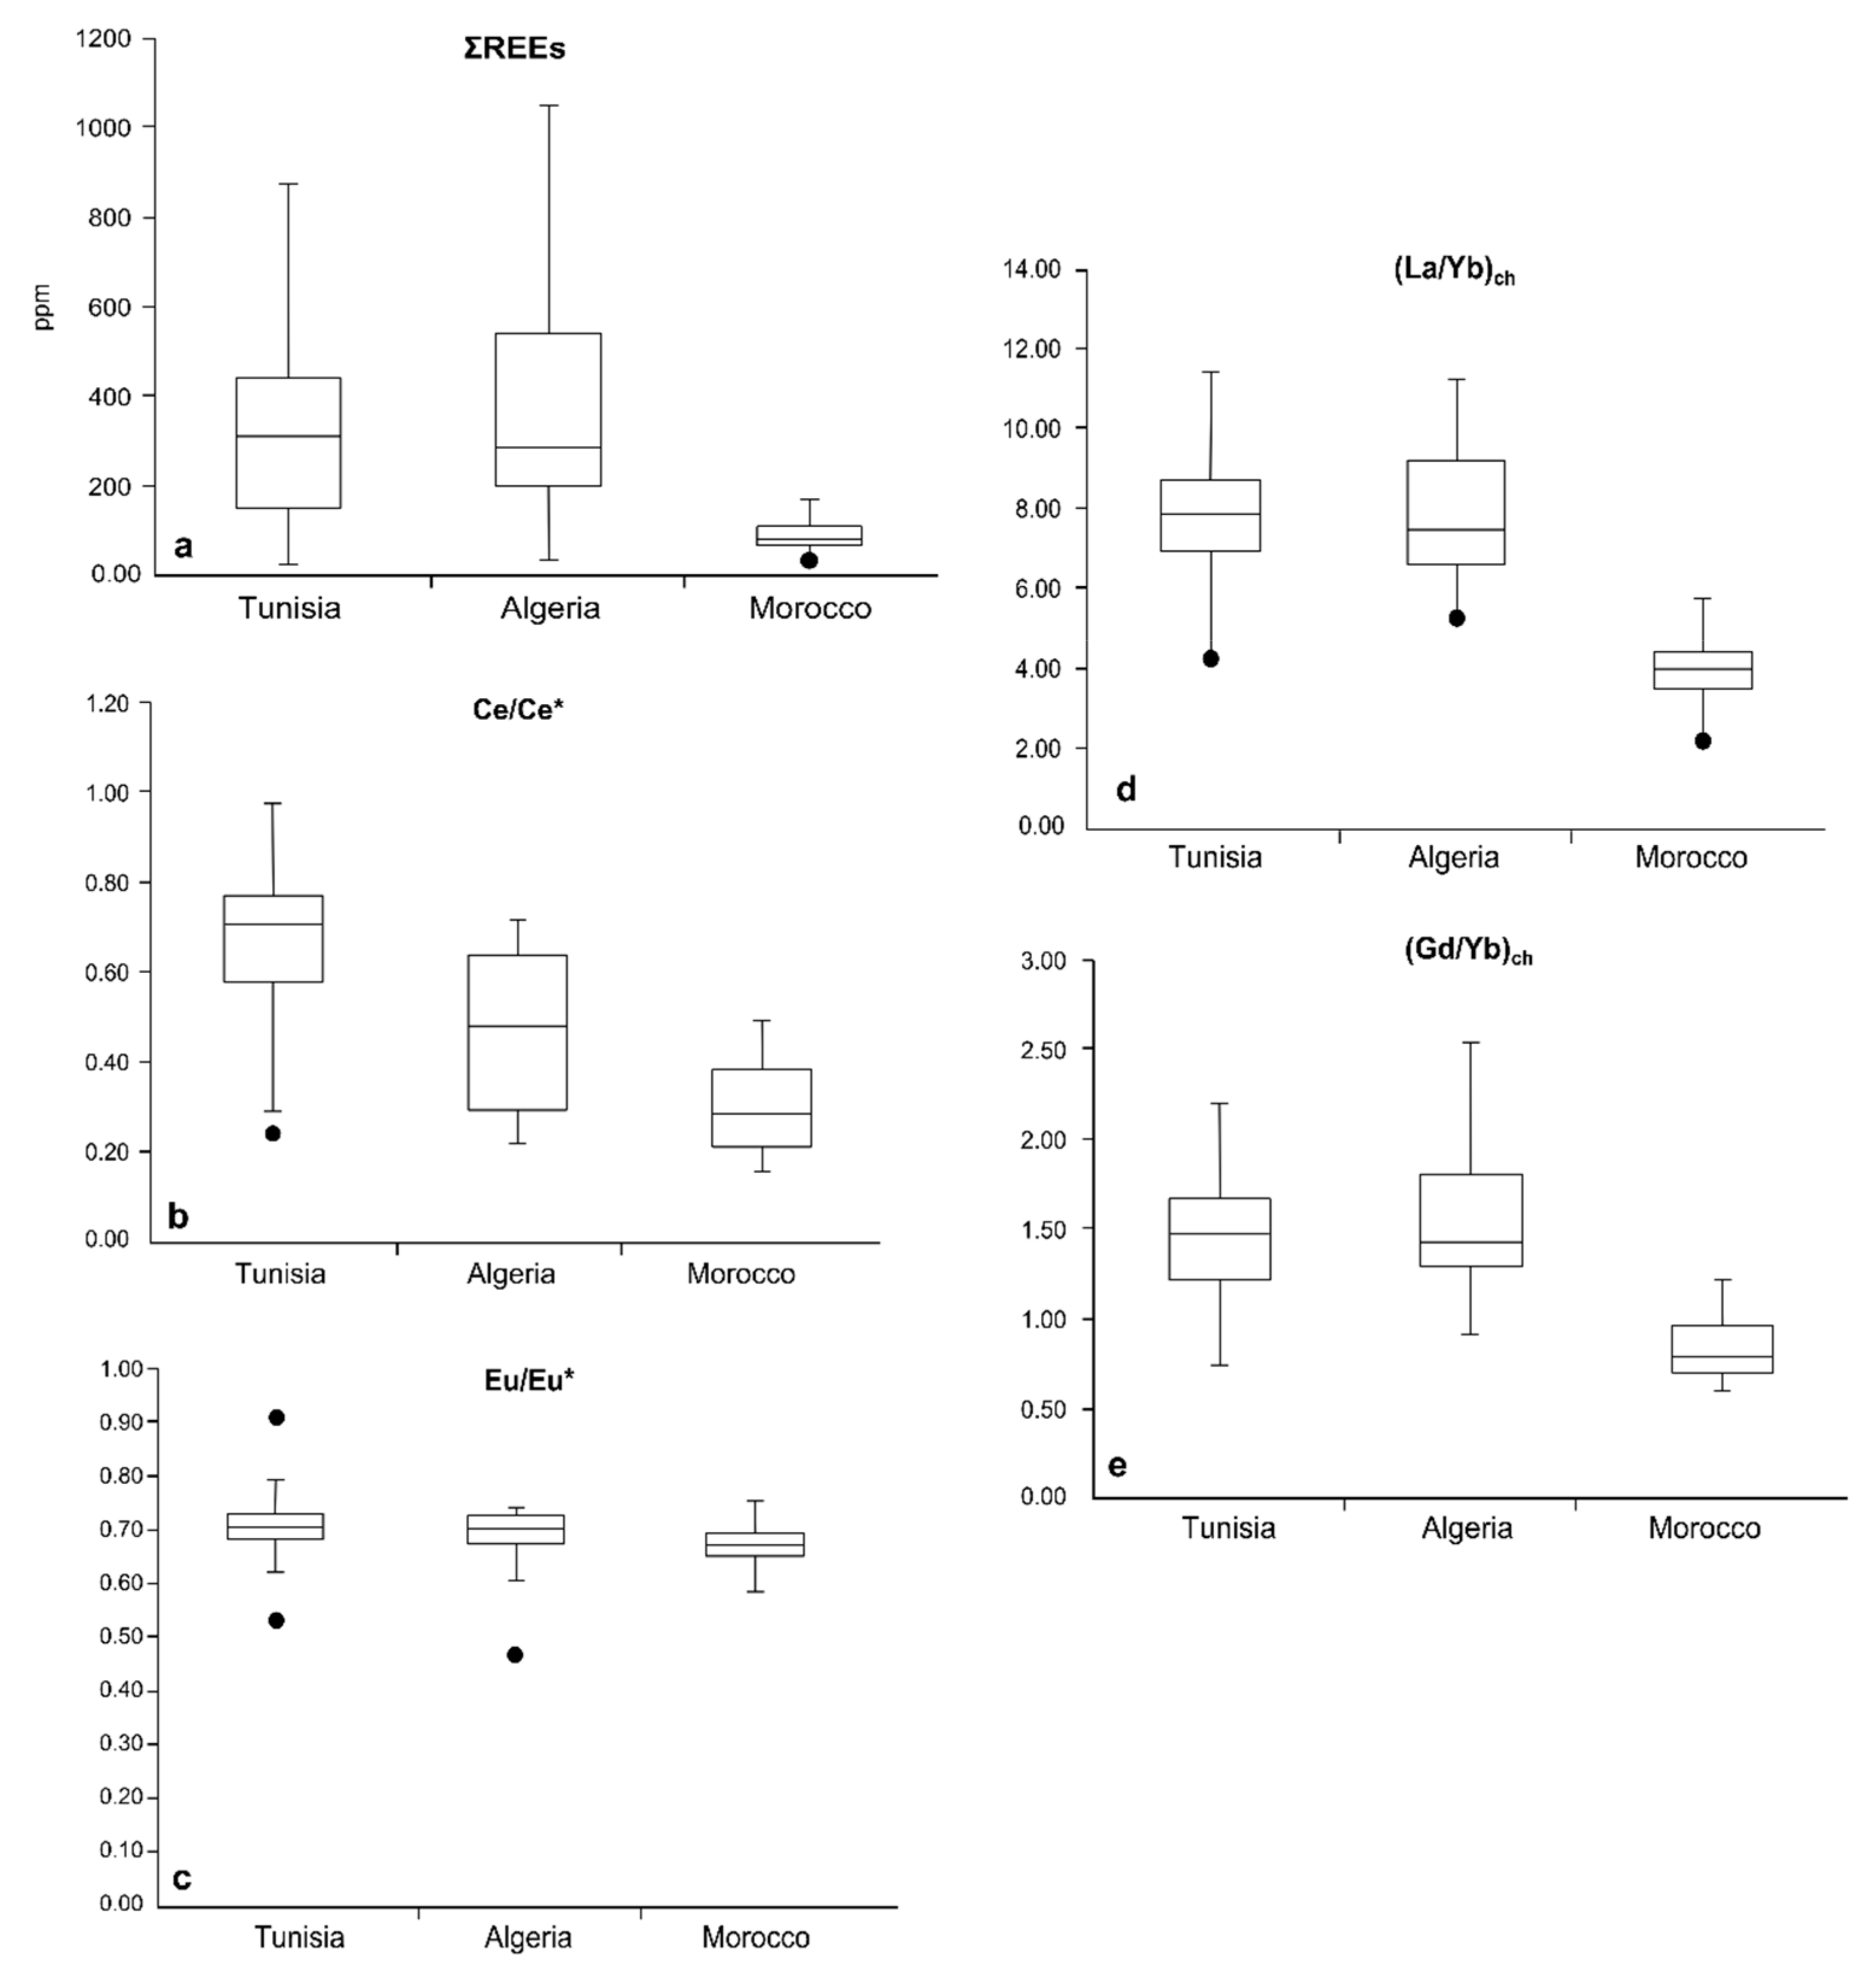
Concerning the REEs’ distribution, the Tunisian and Algerian phosphate deposits share very similar features. In fact, the abundances of total REEs in Tunisian and Algerian deposits are quite similar since they exhibit a median of 314.5 ppm (maximum value 1018.34 ppm) and 289.21 ppm (maximum value 1759.41 ppm), respectively. Differently, the total amount of REEs in phosphate deposits from Morocco is definitely lower with a median of 83.6 ppm and a maximum of 195.4 ppm (Figure 8a).
REEs patterns of Tunisian phosphorites show slight negative Ce anomalies with a Ce/Ce* median of 0.71, while such negative anomalies are more pronounced in Algerian phosphorites showing a Ce/Ce* median of 0.48. The Morocco phosphorites show the lowest median value of the Ce anomaly (median Ce/Ce* = 0.29) among the Maghrebian deposits (Figure 8b).
Tunisian and Algerian phosphorites share also very similar Eu anomaly with Eu/Eu* median values of 0.71 and 0.70, respectively. In addition, for Eu anomaly, phosphate deposits from Morocco show a slightly more pronounced anomaly with a median of 0.66 (Figure 8c).
The fractionation between LREEs and HREEs can be easily described by the (La/Yb)ch ratio and, again, Tunisian (min = 4.51; max = 13.63) and Algerian (min = 5.50; max = 11.26) samples share a very similar behavior with a median of (La/Yb)ch of 7.9 and 7.5 respectively. Phosphorite samples from Morocco show lower values of (La/Yb)ch with a median of 4.0, a maximum of 5.92, and a minimum of 2.53. Therefore, Moroccan phosphate deposits are more enriched of HREEs (Figure 8d).
Concerning the (Gd/Yb)ch ratio, which is is commonly used to assess the MREEs vs. HREEs fractionation, the Tunisian phosphorites show a median of 1.5 with a minimum of 0.7 and a maximum of 2.2. Analyzed samples from Algeria show similar (Gd/Yb)ch values, since the median is 1.43, the minimum value is 0.9, and the maximum is 2.5. Finally, Moroccan phosphorites have lower (Gd/Yb)ch values with a minimum of 0.6, a maximum of 1.2, and a median of 0.8 (Figure 8e).
4.3.2. Rare Earth Elements Fractionation and Deposition Age
In this paragraph, the REEs composition of studied samples is displayed with respect to the deposition ages as suggest by previous authors [7,9,10,11,12,13] for each deposit.
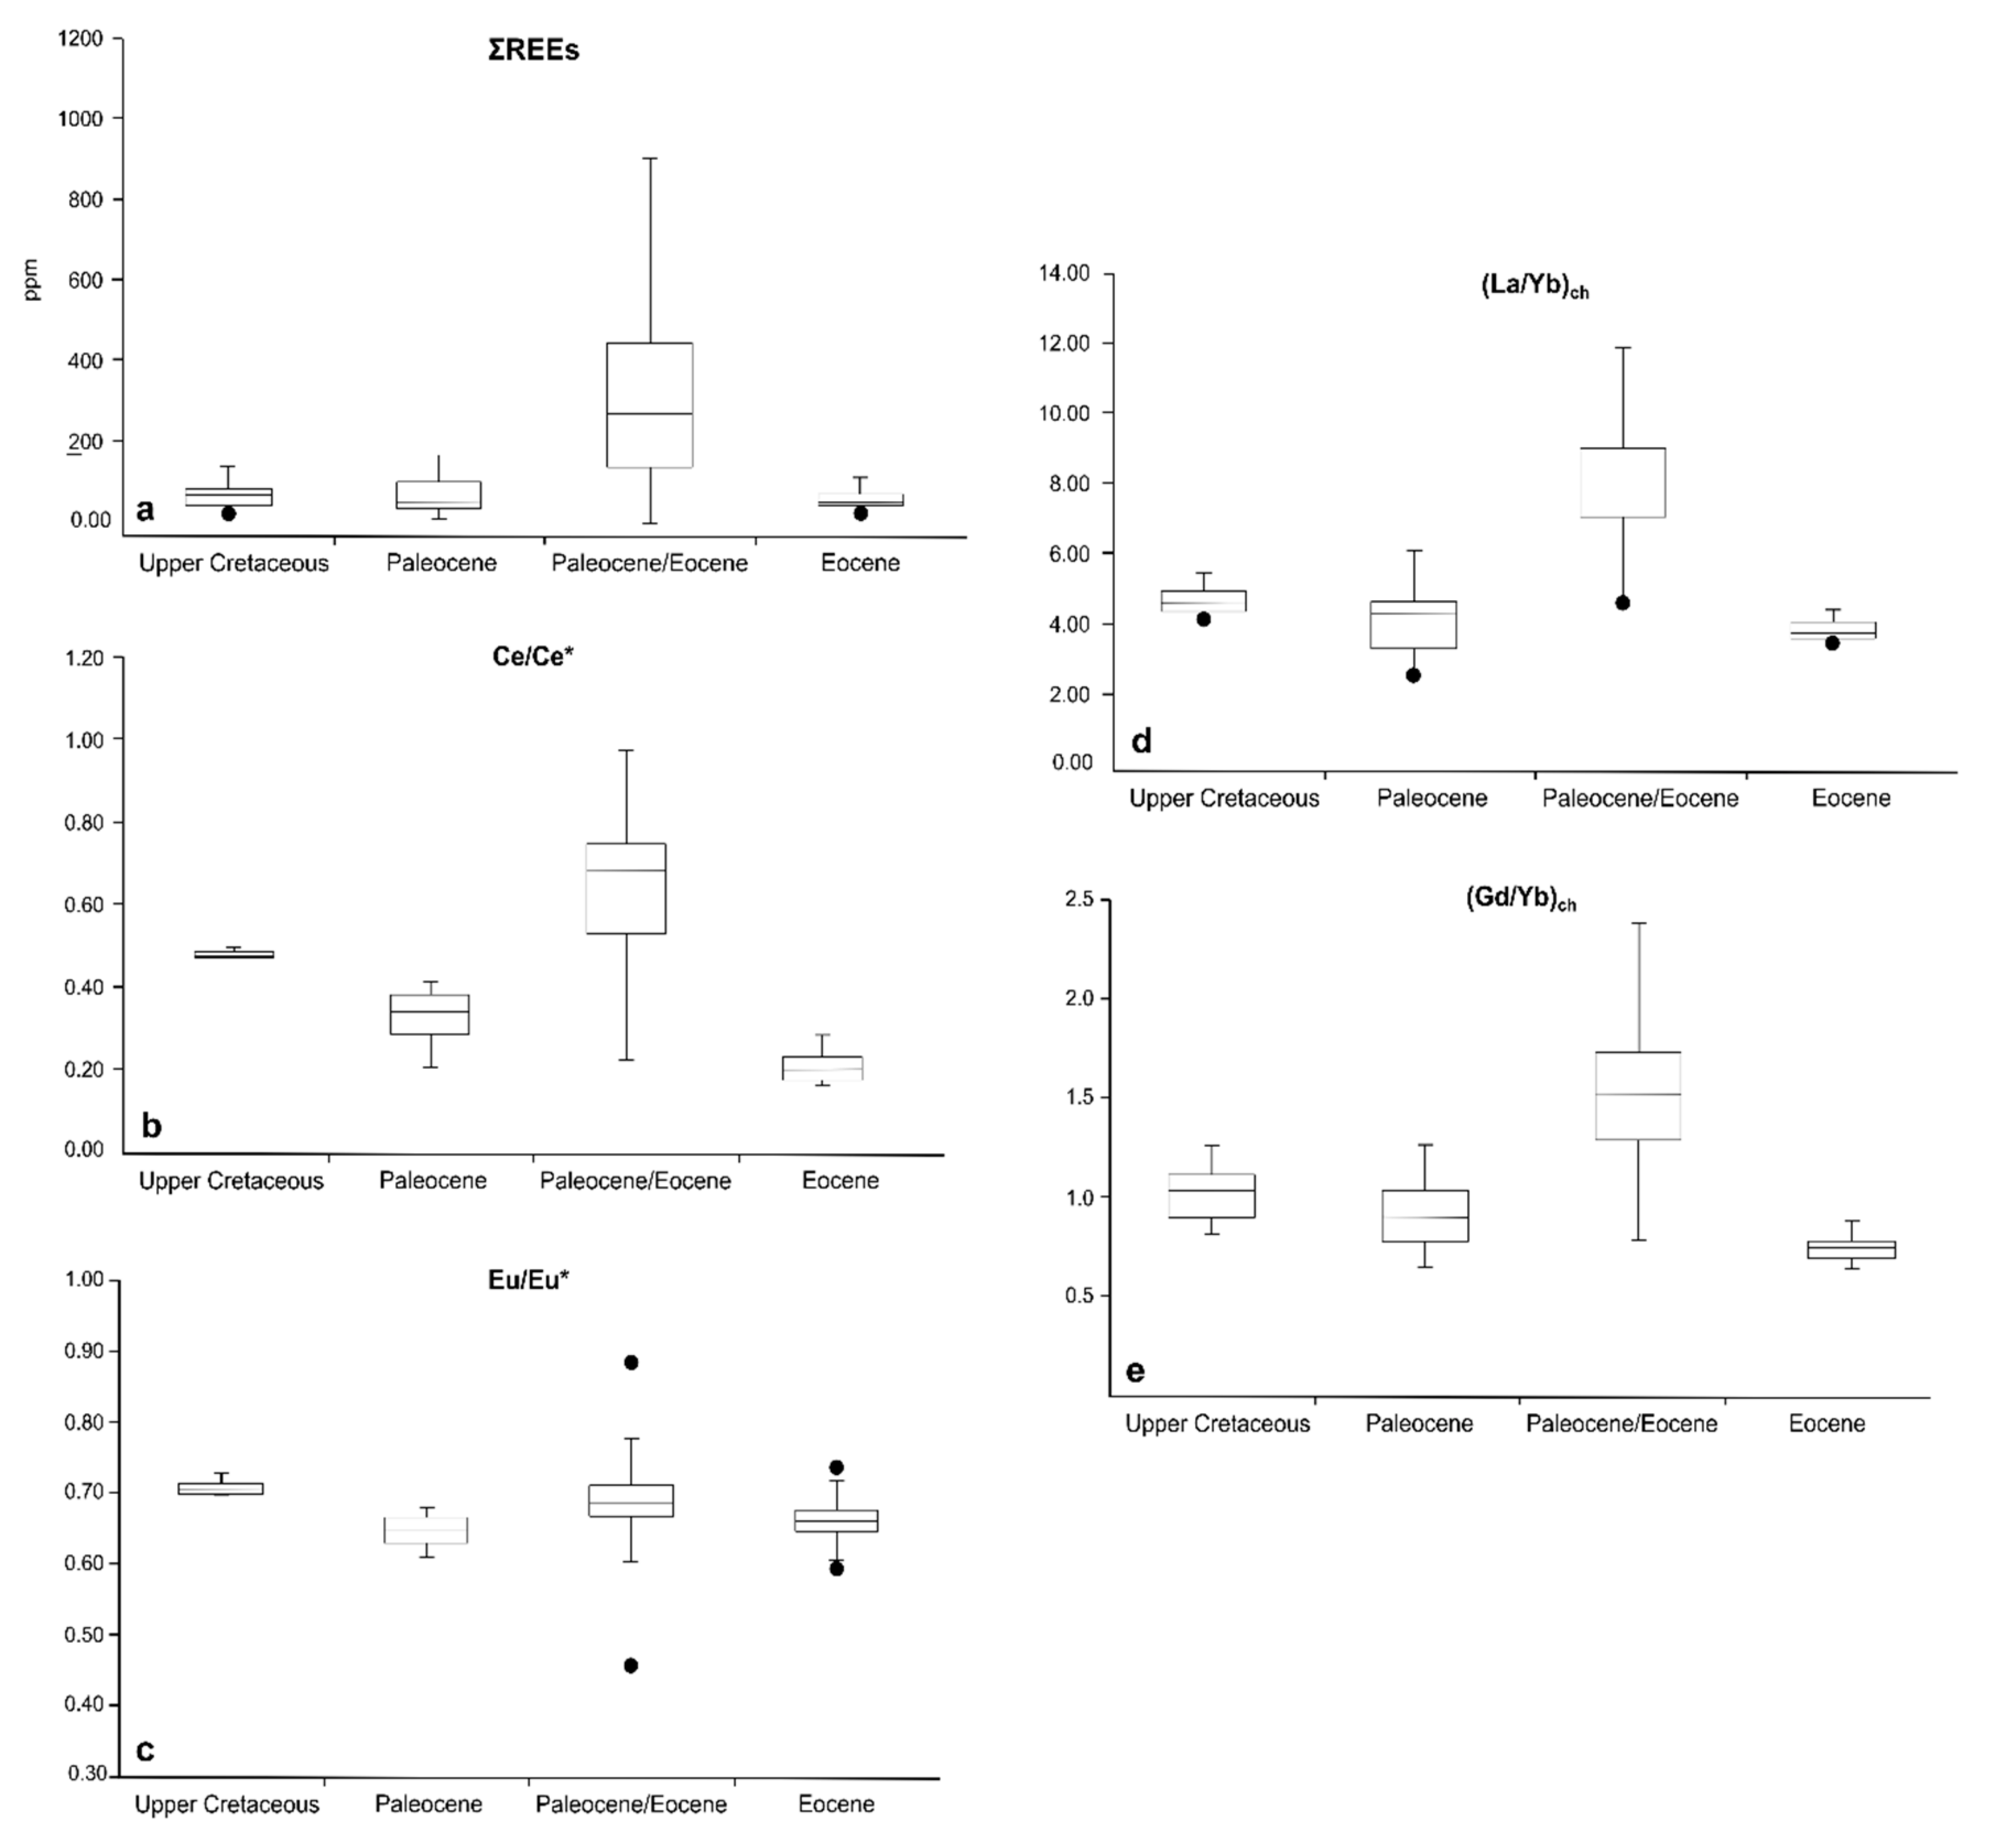
Figure 9 shows the values of ΣREEs (Figure 9a), the Ce and Eu anomalies (Figure 9b,c), and the (La/Yb)ch and (Gd/Yb)ch proxies (Figure 9d,e) for samples grouped on the basis of own age.
- Late Cretaceous deposits
Among the phosphate deposits of Tunisia (Chouabine Formation of the Gafsa-Metlaoui area) and Morocco (Ouled Abdoun, Ganntour and Meskala basins), eight samples are Late Cretaceous in age. The median value of ΣREEs for Late Cretaceous phosphorite samples is 179 ppm with a minimum of 58 ppm and a maximum of 715 ppm. Ce and Eu always exhibit negative anomalies. Ce anomalies show a median value of 0.55 with a minimum value of 0.45 and a maximum value of 0.99, while Eu anomalies show median, maximum, and minimum values of 0.75, 0.23, and 0.83, respectively. (La/Yb)ch shows a median value of 6.1 with a minimum of 4.0 and the highest value of 7.7. Concerning the (Gd/Yb)ch ratio, the median is 1.4 and the minimum is 0.8, while the maximum value is 2.1.
- Paleocene deposits
Among the studied samples, the Morocco ones (from the Ouled Abdoun, Ganntour, and Meskala basins) are of the Paleocene age. The median value of their total amount of REEs is 82 ppm, with a minimum of 39 ppm and a maximum of 195 ppm. All samples show negative anomalies of Ce and Eu. In detail, the Ce/Ce* values are between a minimum of 0.20 and a maximum of 0.41 with a median value of 0.34, whereas the Eu/Eu* ratio has a minimum value of 0.61 and a maximum of 0.68 with a median of 0.65. The (La/Yb)ch shows values ranging from 2.4 to 5.6 (median = 4.2); the (Gd/Yb)ch ratio is between 0.6 and 1.2 (median = 0.9).
- Paleocene–Eocene deposits
Most of the total samples analyzed in this paper (one hundred and sixty-seven) are from deposits formed during the Paleocene–Eocene span time in the Tunisian (Chouabine Formation of the Gafsa-Metlaoui area) and Algerian basins (Djebel El Kouif, Djebel Dyr, Djebel Tazbant, and Kef Essenoun sector of Djebel Onk deposits). These samples have variable values of ΣREEs falling between 27 and 1759 ppm. The ΣREEs median value is 364 ppm, which is the highest one among the values of the studied deposits. A wide range of variation was detected also for the values of Ce and Eu anomalies, and of the (La/Yb)ch ratio. In detail, the Ce/Ce* has a minimum value of 0.22 and a maximum of 0.97, with a median of 0.68; the Eu/Eu* shows 0.46 as a minimum value and 0.89 as maximum, with 0.69 as median; the (La/Yb)ch are between 4.5 and 13.6, with a median value of 7.8. The (Gd/Yb)ch ratio varies in a more narrow range of values being between 0.7 and 2.5 (median = 1.5).
- Eocene deposits
Similarly to the Paleocene ones, the Eocene samples are from the Morocco phosphate deposits only (Ouled Abdoun, Ganntour, and Meskala basins). The total amount of REEs show a median value of 86 ppm, with minimum of 58 ppm and a maximum of 178 ppm. In these deposits, Ce exhibits strongly negative anomalies with a median Ce/Ce* value of 0.20 deriving from a minimum of 0.16 and a maximum of 0.28. The Eu/Eu* ratio shows a median of 0.66, a minimum value of 0.60, and a maximum of 0.74. The (La/Yb)ch has a minimum value of 3.3, a maximum of 4.3, and a median of 3.6. The (Gd/Yb)ch ratio shows a median of 0.7, with a minimum of 0.6 and a maximum of 0.8.
Overall, the comparison among samples having different deposition age (Figure 9) indicates that the Late Cretaceous, Paleocene, and Eocene deposits have very similar ΣREEs contents, whereas the Paleocene–Eocene deposits show the higher ΣREEs amounts. As for Ce, its anomalies are negative in all samples, although values vary in a wide range (from about 0.20 to close to 1). Similarly, the Eu has negative anomalies consistent with low Eu/Eu* values; however, the median is close to value typical of the upper continental crustal standards (Eu/Eu*PAAS = 0.65, Eu/Eu*UCC = 0.61 [23]). Finally, Eocene phosphorites are characterized by the lowest (La/Yb)ch and (Gd/Yb)ch median values, whereas the highest (La/Yb)ch and (Gd/Yb)ch median values are associated to the Paleocene–Eocene deposits.
5. Discussion
5.1. REEs Signatures, Depositional Environment, and Paleoclimate Conditions
REEs are conservative elements with a coherent geochemical behavior resulting from their very similar chemical properties. For this reason, the REEs distribution paths, along with possible REE anomalies and fractionation indices, may contribute to infer the paleoclimate as much as paleoredox conditions occurring during the deposition of a sediment. Current knowledge of the geochemical behavior of REEs in the ocean suggests that authigenic sediments usually form in equilibrium with the medium in which they precipitated, inheriting its chemical signature [22,27]. According to Tostevin et al. [58] and Deng et al. [59], oceanic seawater is characterized by a well-defined (PAAS- or UCC-) normalized REEs distribution pattern having a strong negative Ce anomaly (≈0.17) and a progressive HREEs enrichment. However, the marine deposits composition may show deviations from the typical seawater path because of the alteration of the primary marine REEs signal by global or local pH and/or Eh conditions of waters (mainly referred to the water deep of formation), changes in complexing ligands and organic carbon contents [60], and post-depositional processes such as early and late diagenesis and sediment reworking [22,61].
It has been widely demonstrated that sedimentary phosphorites show a relevant content in several trace elements including REEs that, in our case and based on the above, may help retrieve information about the evolution of depositional environment during the African phosphogenesis events. Regarding the studied sediments, insights on their formation, referring to both the deposition age and paleogeographic position (Figure 8 and Figure 9), have been provided by using the amounts of total REEs and the relevant REEs fractionation indexes such as Ce and Eu anomalies, as well as chondrite-normalized (La/Yb) and (Gd/Yb) ratios [13,22,62].
From a geographic point of view, our results highlight significant differences between studied deposits. In detail, as previously stated, samples from Algeria and Tunisia show very similar values of ΣREEs, Ce anomaly, (La/Yb)ch, and (Gd/Yb)ch ratios, suggesting that such deposits may be considered as parts of the same depositional system, especially for those deposits located around Kasserine Island. Differently, samples from the Morocco phosphorite deposits have lower ΣREEs, Ce anomaly, (La/Yb)ch, and (Gd/Yb)ch values that confirm the hypothesis of depositional conditions different from those of the Algeria–Tunisia system.
5.1.1. The Ce Anomalies and Paleoredox Insights
Among the REE proxies, the Ce anomaly is a valuable proxy for the characterization of redox conditions during the formation of ancient phosphates [6,10,19,27,28,63]. The conversion of Ce3+ to Ce4+ in marine water occurs in response to the shift from anoxic to oxic conditions, promoting the CeO2 formation. Therefore, a pronounced negative Ce anomaly is considered a valuable indicator of oxic conditions [10,63,64]. However, it is noteworthy to observe that the magnitude of negative Ce anomalies varies within and among ocean basins due to redox changes in the water column, even on a meter scale [58].
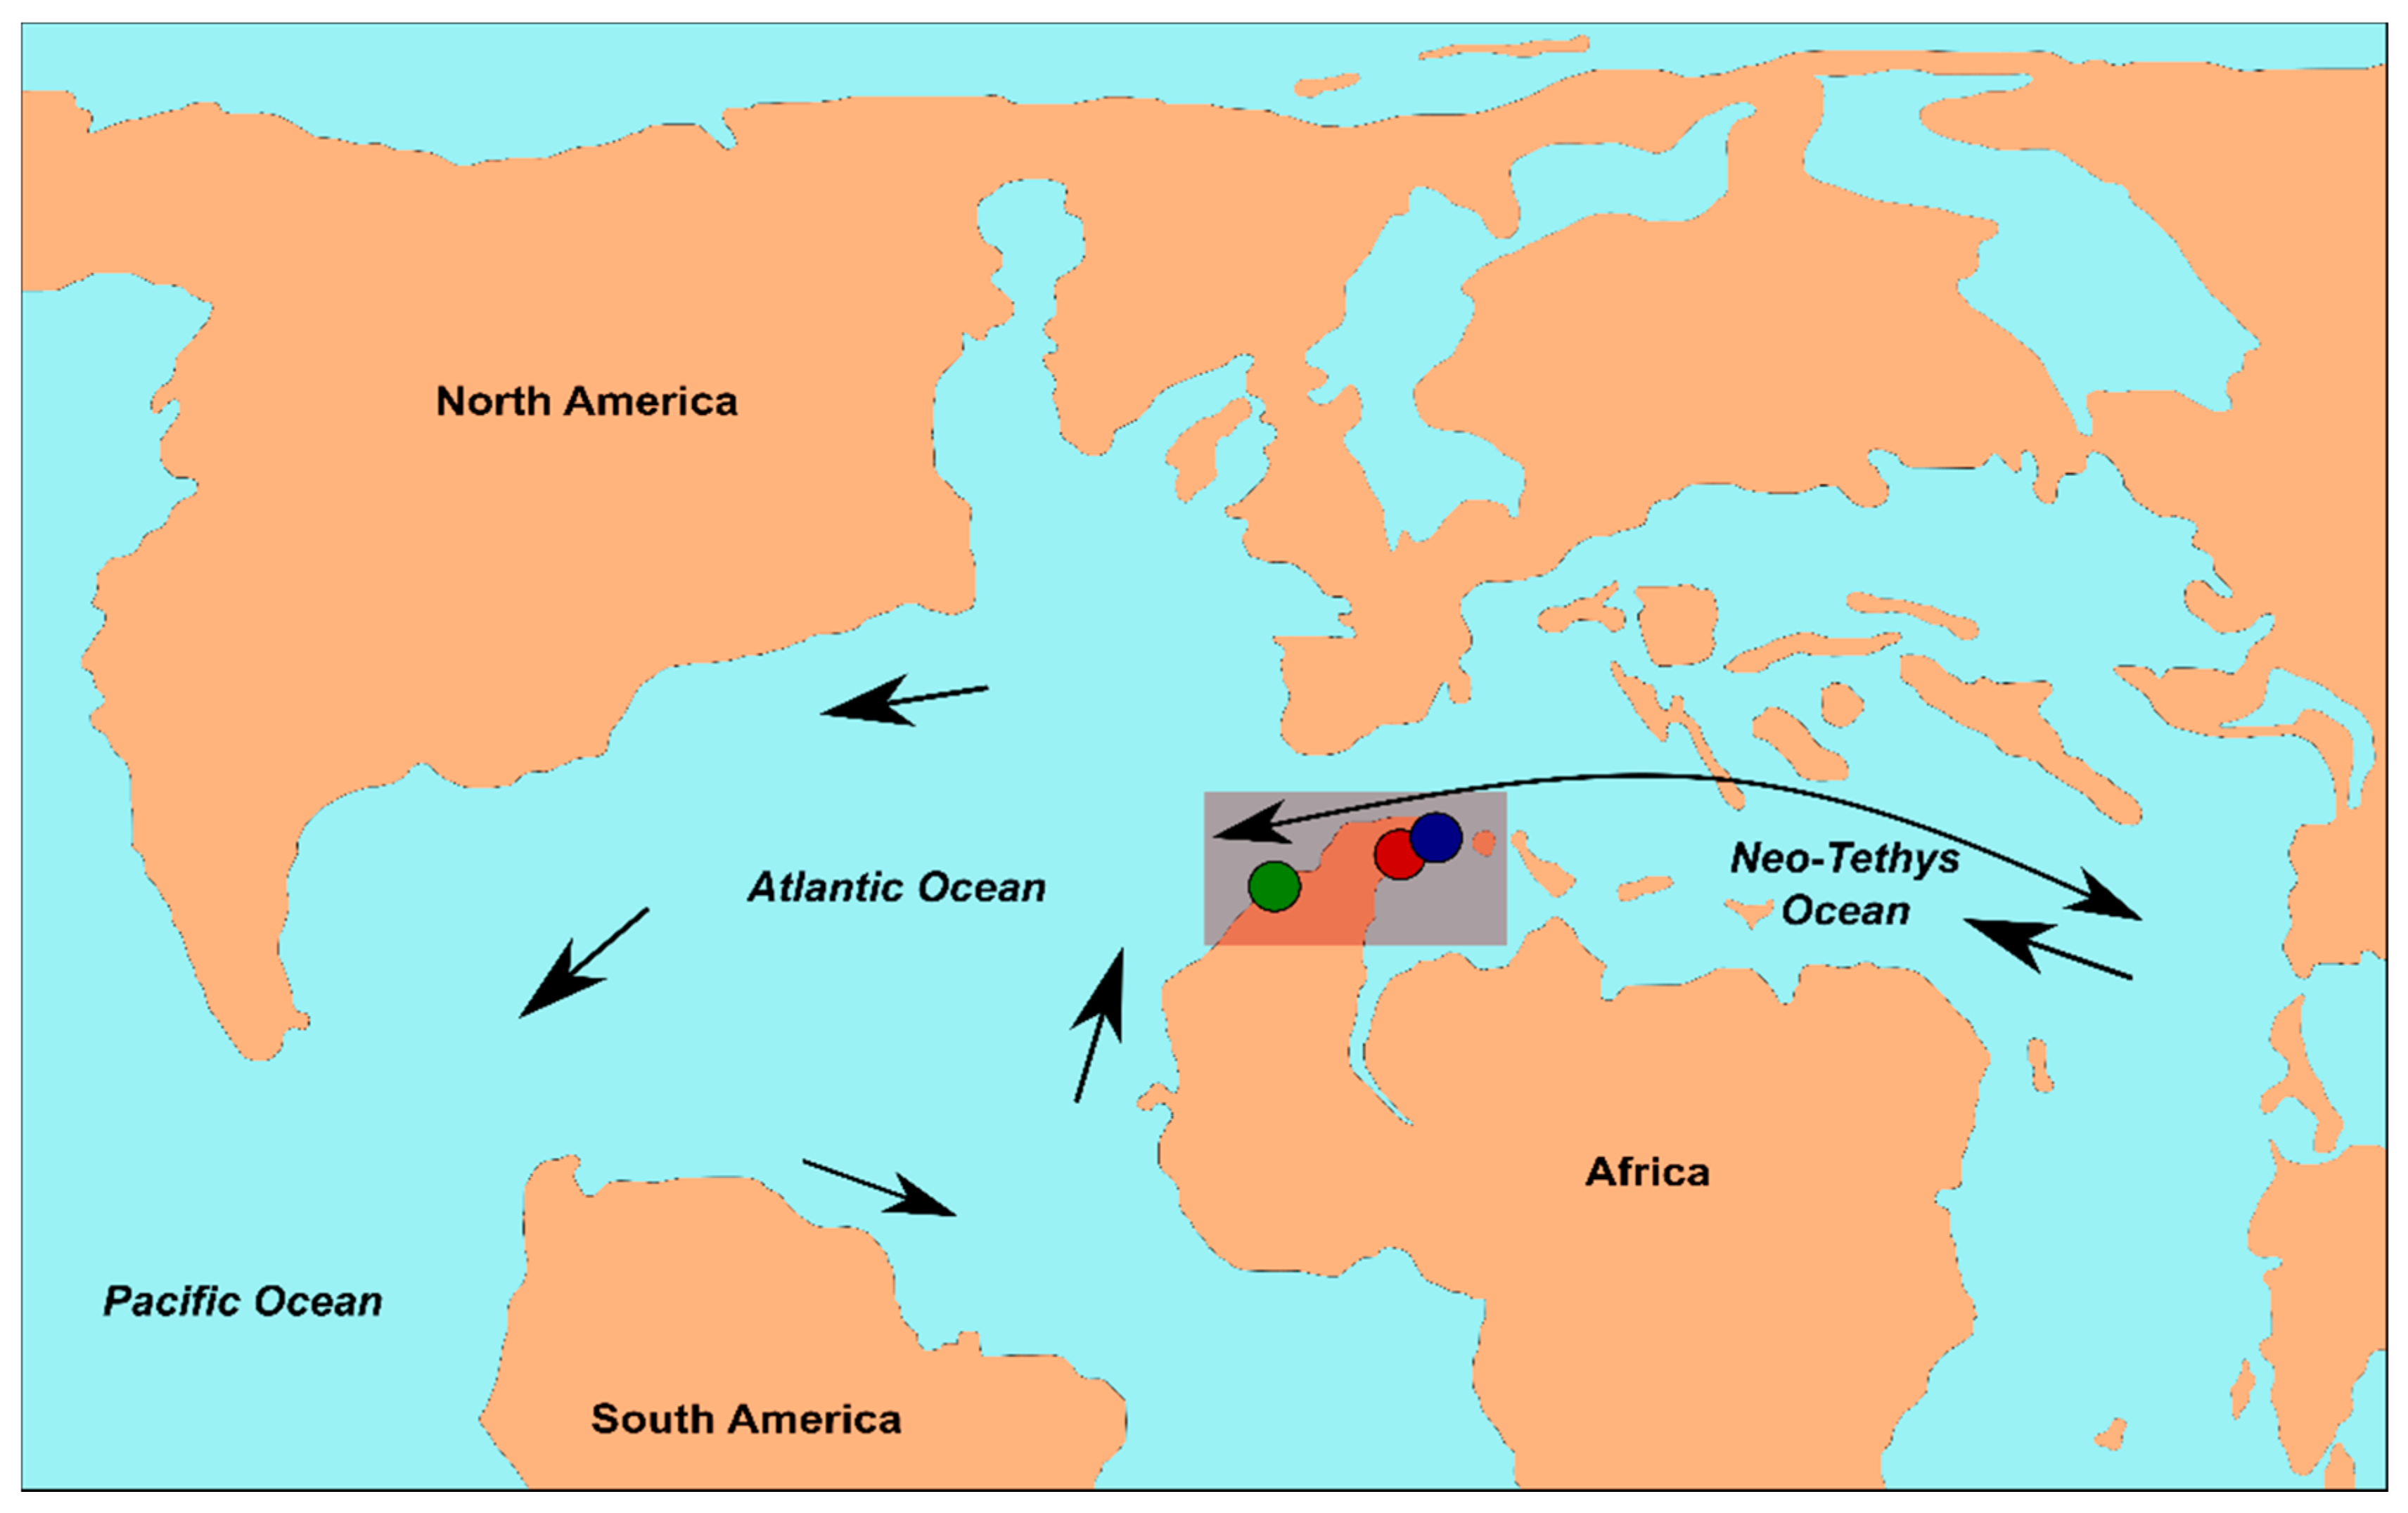
To assess a possible influence of the redox conditions on the phosphorite composition, the Ce anomaly has been taken into account. Some differences of the Ce/Ce* ratio have been detected between the phosphorites. In detail, the Ce/Ce* values suggest a general sub-reducing to sub-oxic environmental condition for basins from the Algeria–Tunisia system and a sub-oxic to oxic environment for those of Morocco, which were likely affected by a different supply and mixing of oceanic waters with respect to the other African deposits (Figure 10).
As stated by Kocsis et al. [11], the Morocco phosphorites were connected with open Atlantic Ocean waters that were also responsible for the strong upwelling currents affecting the shelf and coastal basins of Northwest Africa since the Turonian. On the contrary, a more relevant influence of the Tethys Ocean in the Algerian and Tunisian basins was suggested by [12,13], further supporting our hypothesis about a different water supply for the different African basins.
5.1.2. The Eu Anomalies and Paleoenvironment
Despite the Eu anomaly being commonly considered a more reliable proxy for detecting petrogenetic processes and sediment provenance [66,67,68,69], some authors suggest to use it also for the assessment of paleoredox conditions [25,70]. For example, in strongly reducing environments, such as those occurring in pore water of anoxic sediments, a possible variation of the europium oxidation state (from Eu3+ to Eu2+) may be taken into account. In particular, positive Eu anomalies of marine sediments, associated to highly reducing and alkaline conditions of pore water at the seawater/sediment interface, may induce Eu2+ stability in solution, promoting europium inclusion into authigenic minerals.
As for the Eu anomaly in studied deposits, all samples share very similar values regardless of their geographic position. Standard deviations of the Eu/Eu* values in each deposit are very low (0.06 for Algeria and Tunisia, 0.09 for Morocco), suggesting negligible fluctuations among different deposits and within each of them. Therefore, as suggested by Mongelli et al. [62] for the Salento Peninsula phosphorites (southern Italy), also in our case, the Eu anomaly may retain a valuable provenance proxy and not a redox proxy. Moreover, the Eu/Eu* values fall in the range of those of the most common upper continental crust standards, implying a crustal contribution for the studied samples and, in addition, a similar provenance for the detrital component of the Northern African phosphorites. In turn, this suggests that the observed REEs-related compositional differences have to be linked to syn- or post-phosphogenesis processes and/or to a different environmental condition of the basin waters.
5.1.3. LREE–MREE–HREE Fractionations and Diagenesis
The LREEs vs. HREEs and MREEs vs. HREEs fractionations may furnish important insight about the adsorption, desorption, recrystallization, and substitution processes affecting the sediments during or after the deposition. In general, the dissolved REEs are mostly complexed by carbonate ions, which form progressively stronger carbonato- and di-carbonato-complexes with increasing atomic number. As a result, among the REEs, the HREE group tends to remain longer in seawater. Consequently, the seawater and sediments precipitated from it are more enriched of HREE than of LREEs and MREEs. therefore, a relative LREEs and/or MREEs enrichment of the authigenic marine sediments is commonly referred to primary REEs changes caused by post-depositional adsorption and/or substitution processes [26].
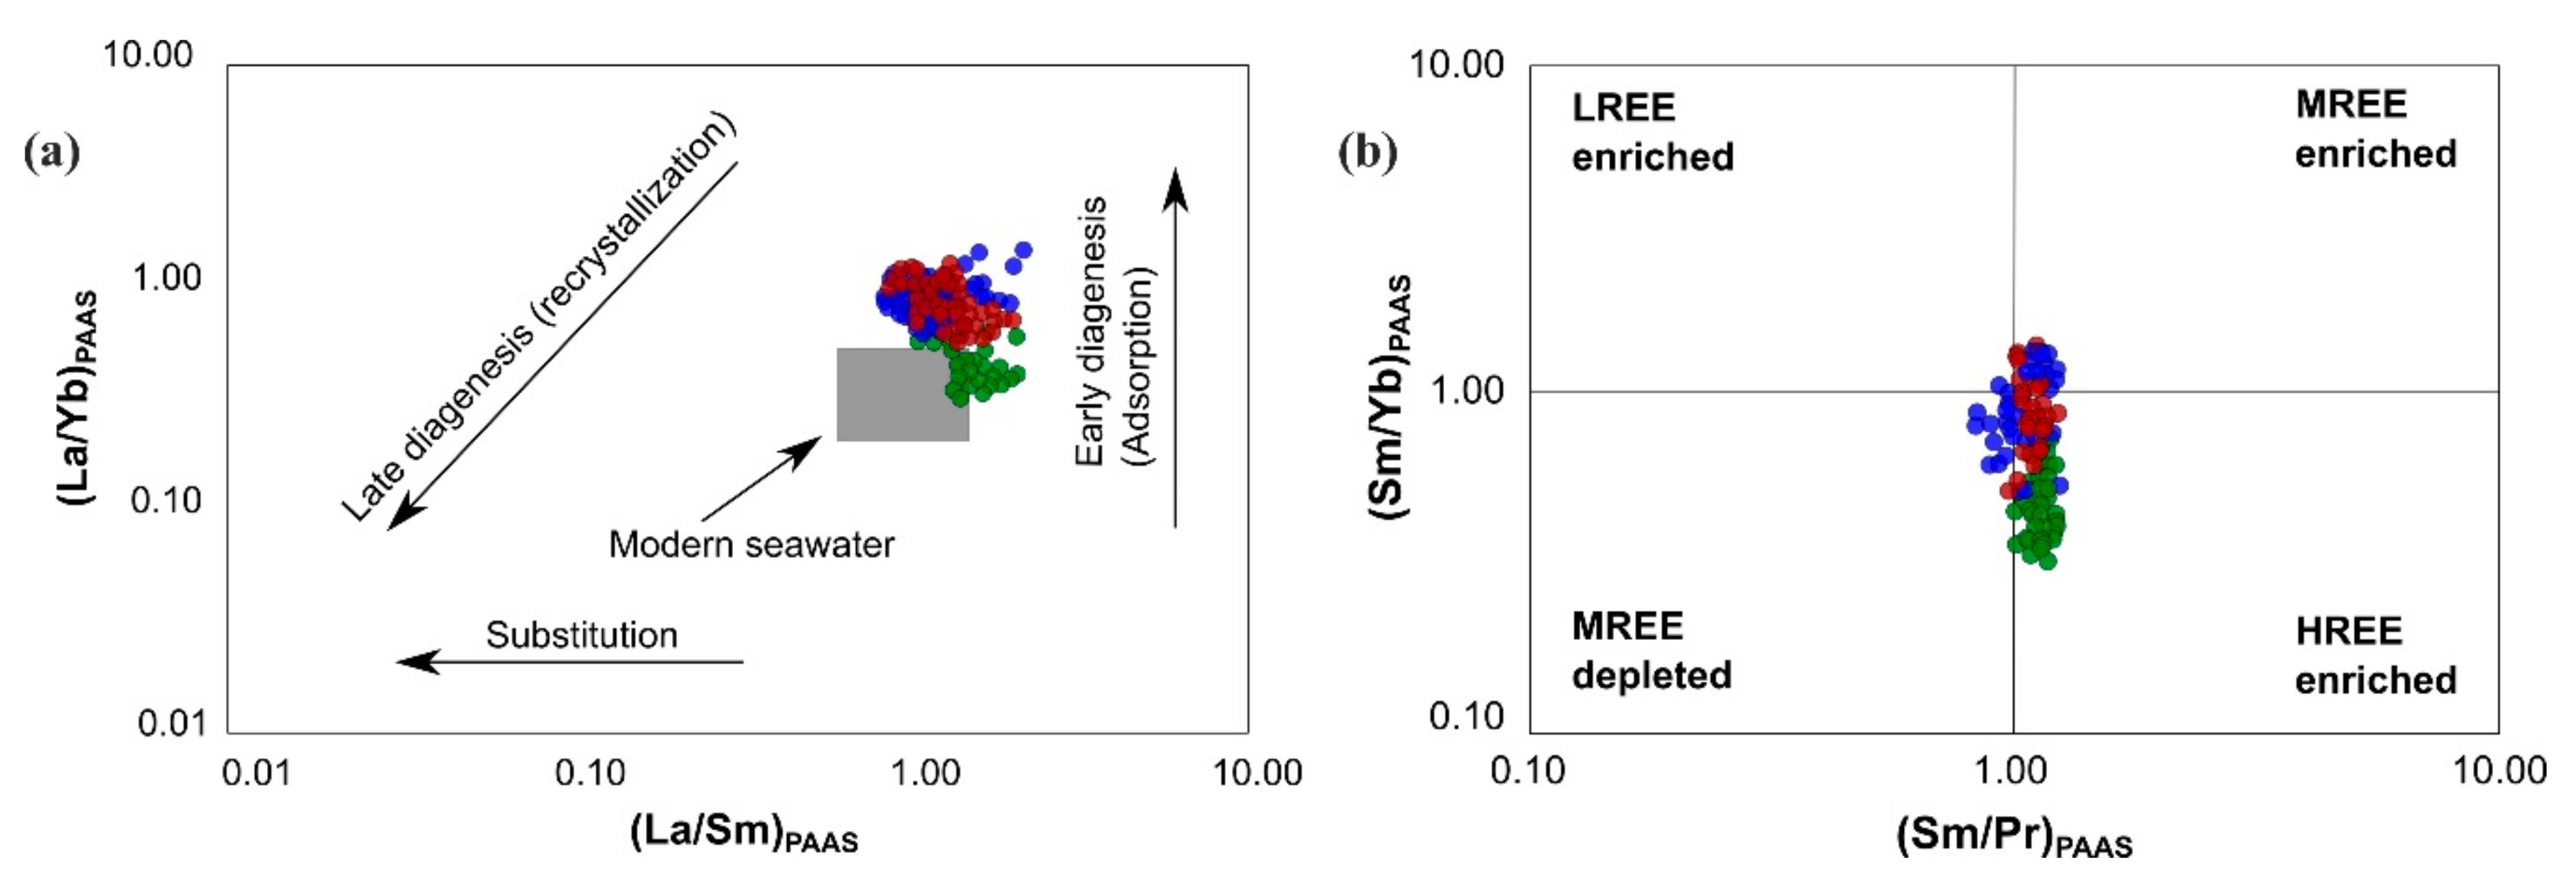
According to Reynard et al. [18], the (La/Sm)PAAS vs. (La/Yb)PAAS diagram (Figure 11a) was considered in order to evaluate a possible variation of the REEs contents and fractionations by diagenesis. Studied samples plot in a well-defined area of the diagram close to, or in some cases within, the typical values of the modern seawater. Such a distribution suggests a slight deviation of ratios toward higher values (more pronounced for the (La/Yb)PAAS) that can be interpreted as the result of adsorption processes occurring at the water/sediment surface mainly during early diagenesis.
However, the (La/Sm)PAAS vs. (La/Yb)PAAS binary plot evidences a further difference between the African phosphorites from different localities. In particular, samples from the Algeria–Tunisia basins strongly overlap, showing (La/Yb)PAAS values higher than those of the Morocco deposits, which conversely have (La/Yb)PAAS values more similar to the seawater one. This observation on one hand suggests that adsorption affected the deposits of Algeria and Tunisia; on the other hand, it demonstrates that the Morocco phosphorites were not significantly influenced by post-depositional processes.
It is noteworthy that in the studied rocks, high values of the (La/Yb)ch ratio, accounting for the chondrite-normalized LREEs/HREEs fractionation, have been detected as well. The comparison between our data and those of the upper continental crust standards (PAAS and UCC) suggests an HREEs enrichment of the African phosphorites. In fact, the mean (La/Yb)ch values of the Algeria–Tunisia (mean Tunisia= 7.9, mean Algeria= 7.5) and Morocco (mean = 4.0) deposits are respectively lower and strongly lower than those of the upper continental crust standards (UCC = PAAS = 9.2), pointing to a more HREEs-enriched sediment. This hypothesis is also corroborated by the (Sm/Pr)PAAS vs. (Sm/Yb)PAAS plot (Figure 11b) where samples from the African phosphorite deposits mainly fall in the HREE enrichment field. As previously stated, such an HREE enrichment could be a record of the original seawater signature, which is only partially hidden by post-depositional processes.
It has been widely reported that francolite, along with the other P-bearing phases, controls the mineralogical uptake of REEs in phosphoritic rocks. In addition, glauconite, when it occurs in high amounts, may play an important role in the REEs uptake due to its capability to incorporate or adsorb the REEs onto the mineral surfaces [71]. Based on the previously presented mineralogical compositions, francolite and glauconite are in almost all the Northern African phosphorite deposits with significant amounts, and therefore, they could represent the main phases responsible for the REEs contents of the studied deposits. The results of LA-ICP-MS analyses performed on single P-bearing minerals and glauconite particles, which are associated to the negligible amounts of other REEs-bearing mineralogical phases (such as detrital apatite, monazite, etc.) in studied samples, support this idea.
5.2. The North African Phosphogenesis during the Paleocene–Eocene Span Time
If we look at analyzed samples with regard to their reciprocal ages, a further consideration on the Northern African phosphogenesis events can be made. As previously stated and shown in Figure 9, the Late Cretaceous, Paleocene, and Eocene phosphorites share similar fractionation indexes, whereas the Paleocene–Eocene samples, which are most of the analyzed samples, show different features, including higher values of total REEs and fractionation indexes. The most reasonable explanation is that in Northern Africa, the phosphorite deposits experienced the most relevant REEs enrichment during the Paleocene–Eocene time.
Overall, riverine inputs are considered as the primary source of REEs to seawater [59] where continental REEs-bearing particles, solution, and colloids arrive and accumulate.
During the late Paleocene–early Eocene span time, the so-called Paleocene–Eocene Thermal Maximum (PETM) occurred, as one of the global warming intervals affected the Paleogene [71]. According to several authors [72,73,74], in Northern Africa, the PETM event is documented by the highly depleted δ13C values of the Paleocene–Eocene phosphorites of the Gafsa Basin (Tunisia).
Recently Banerjee et al. [71] suggested a close relationship between the formation of worldwide marine authigenic mineralizations (including glauconite, phosphorite, lignite, ironstone) and the fluctuations in global seawater temperature. Precisely, the aforementioned authors demonstrated that authigenic mineralizations record the global hyperthermal events and that their formation is mostly promoted by such climatic conditions. For instance, it is noteworthy that a number of phosphorite deposits developed along the paleo-Tethys margin in concomitance of the Paleogene warm climatic intervals and, at the northern margin of the African continent, mostly during the PETM. Moreover, the most common phosphorite deposits host detrital and/or authigenic glauconite, whose presence suggests depositional paleo-environments characterized by shallow and warm marine waters, a slow rate of sediment accumulation, and a high supply of dissolved ions [71].
According with Hessler et al. [75], although the PETM period was characterized by a warm climate, humid conditions were also present, enhancing the continental weathering and, consequently, the dissolved ions supply to the marine environment.
In this paleo-climatic and paleo-environmental setting, also featured by a concomitant global flooding event responsible for the global sea level rise and eustatic highstand [76], a significant REEs supply to marine basins, and to the oceanic waters in general, was ensured, and this could represent a possible cause for the observed REEs enrichments in phosphorites.
However, data on the mineralogical composition of studied phosphorites seem to disagree with the hypothesis of strong humid conditions during the northern Africa Paleocene–Eocene phosphogenesis. Among the principal mineralogical phases, the Paleocene phosphorites contain a major concentration of kaolinite, which typically forms in hot and humid climate zones featured by high precipitations [77]. Instead, in the younger deposits, smectite is the prevailing clay mineral together with palygorskite and sepiolite, whose occurrence is strongly indicative of semi-arid climatic conditions [44,78,79]. Therefore, the gradual disappearance of kaolinite associated to the greater presence of smectite, palygorskite, and sepiolite along the deposits could indicate a progressive intensification of arid conditions during the phosphorite formation.
Further, several researchers stated that during the PETM, the drastic environmental changes caused also the acidification of the ocean masses [80], inducing a global pH decreasing of about 0.3 [81]. The Ce geochemical behavior and its solubility in seawater may be influenced by pH [82,83]. Precisely, at higher values of pH, the Ce solubility decreases and, as a consequence, a stronger negative Ce anomaly is expected. Therefore, part of the previously discussed variation of Ce anomaly values in the Northern African phosphorites could be related to the oceanic pH changes, although local factors affecting single basins cannot be excluded.
Nevertheless, based on the currently available literature data, it is possible to believe that within this very complex paleogeographic and paleoclimatic realm, the circulation of open ocean water was promoted and, consequently, the upwelling and phosphogenesis in marine sediments was triggered.
5.3. Economic Perspective of the North Africa REEs-Bearing Phosphorites
In recent years, several studies [6,84,85] have indicated the phosphorites as the most suitable materials for extracting REEs as a by-product, according to a number of advantages that include the high amounts of phosphate rock that are yearly processed for manufacturing phosphoric acid and fertilizers, the average of ΣREEs in the phosphorite material (average 0.046 wt% [86]), environmental issues that required REEs, and hazardous metal elements removal from fertilizers, phosphoric acid sludge, and phosphogypsum [14,87].
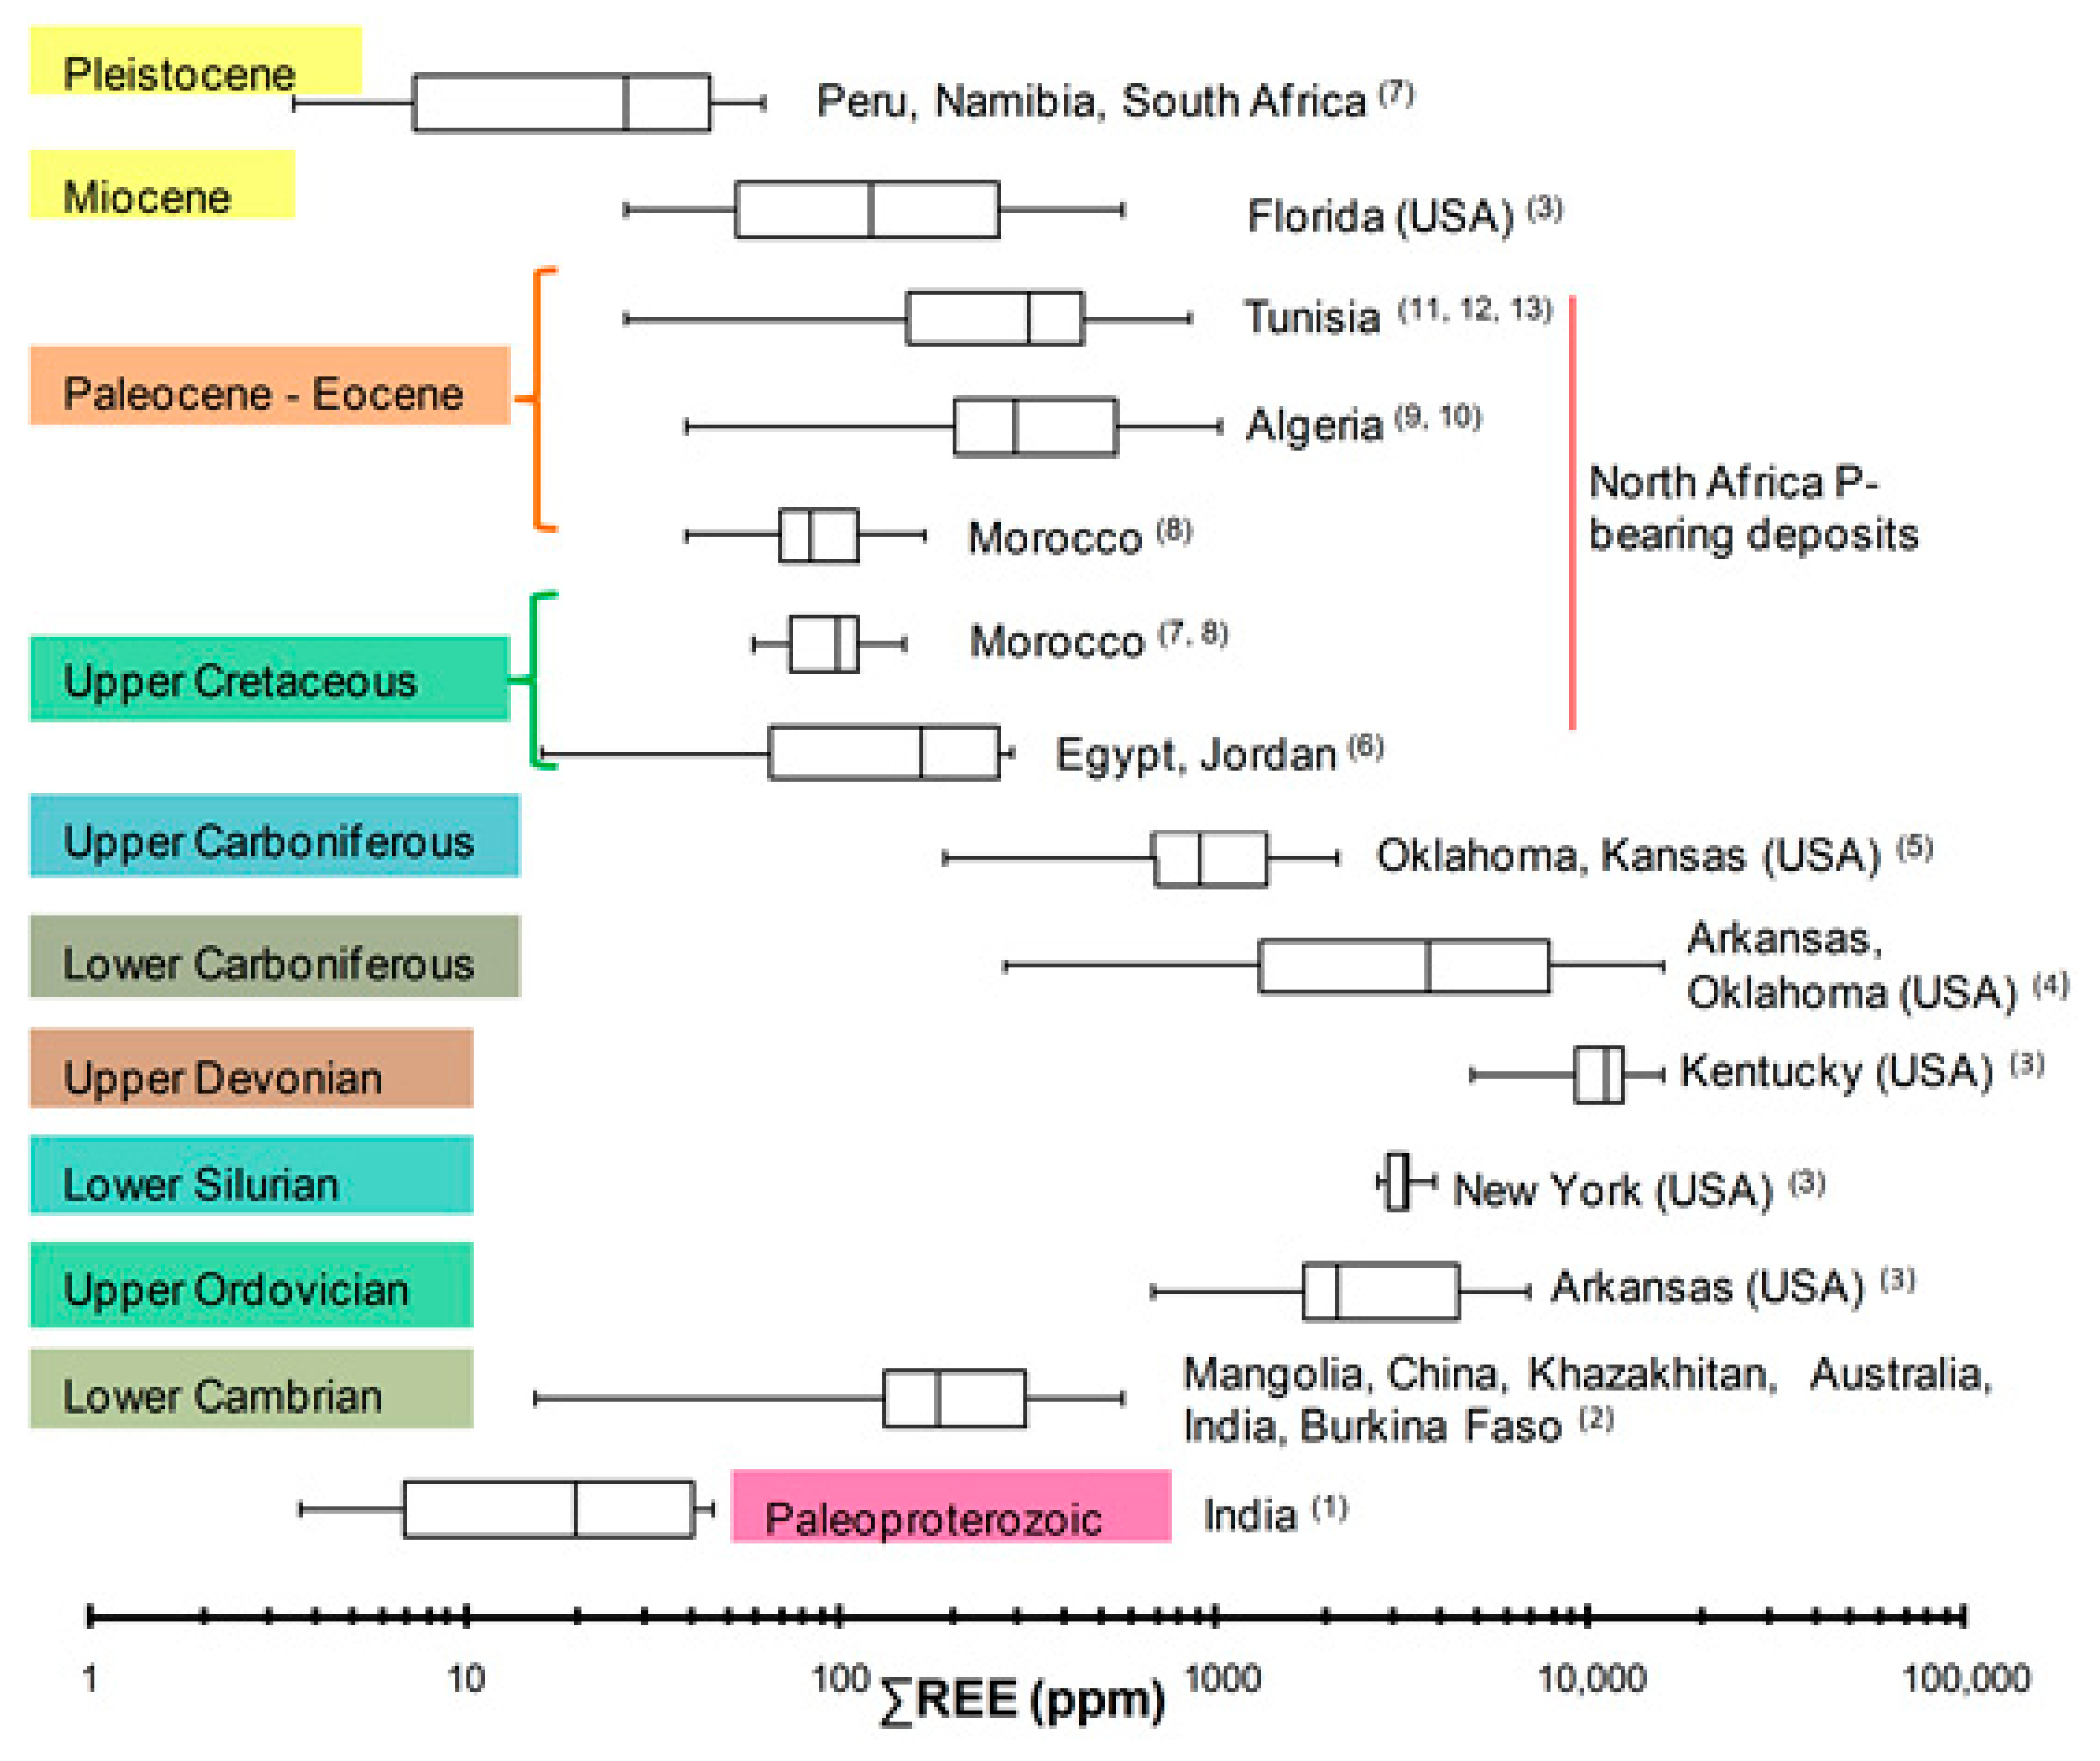
In order to evaluate to economical perspectives of REEs-bearing Northern African deposits, the ΣREEs were plotted against those from different worldwide locations and compared also to the geological age (Figure 12). In term of total REEs concentrations, the studied African deposits fall in the second range after the U.S. deposits that are the most REE-enriched (average = 4394 ppm).
However, the concentration is not the only criterion to evaluate the potentialities in term of REE resources. The reserve of phosphorite raw material and the percentage of critical elements, including the REEs, are similarly important. The world-class P-deposits of phosphorites are mainly located in North Africa (Upper Cretaceous–Eocene). According to the U.S. Geological Survey [4], the reserve of sedimentary phosphorites in Maghrebian countries can reach more than 50 billion metric tons, representing about ≈75% of the world reserves (69 billion metric tons). The outlook of REE deposits, usually based on REE+Y contents, LREE/HREE ratio, and in some cases on the LREE, MREE, and HREE classification, is not enough to establish a primary evaluation of ore profitability [94,95]. According to Seredin [94] and Seredin and Dai [95], the primary evaluation of REE ores depends on critical and potentially critical amounts of individual REE based on industry demand. These authors divided the REE into the following classes: (1) critical and potentially critical, represented by Nd, Tb, Dy, Y, Eu, and Er, (2) uncritical, including La, Pr, Sm, and Gd, and (3) excess, consisting of Ce, Ho, Tm, Yb, and Lu.
Seredin [94] also gives a formula to calculate the outlook coefficient of REE composition as Koutl = (Nd + Eu + Tb + Dy + Er + Y)/ΣREE)/(Ce + Ho + Tm + Yb + Lu)/ΣREE), suggesting that the higher values of Koutl reflect promising ores in terms of industry necessity.
This ratio can be helpful for determining how the ore is in optimal composition with respect to industry demand and for a primary evaluation of the ore’s profitability. In addition, it is important to note that this index can be updated regarding the evolution of individual REEs in industry as well as according to demand on them [94].
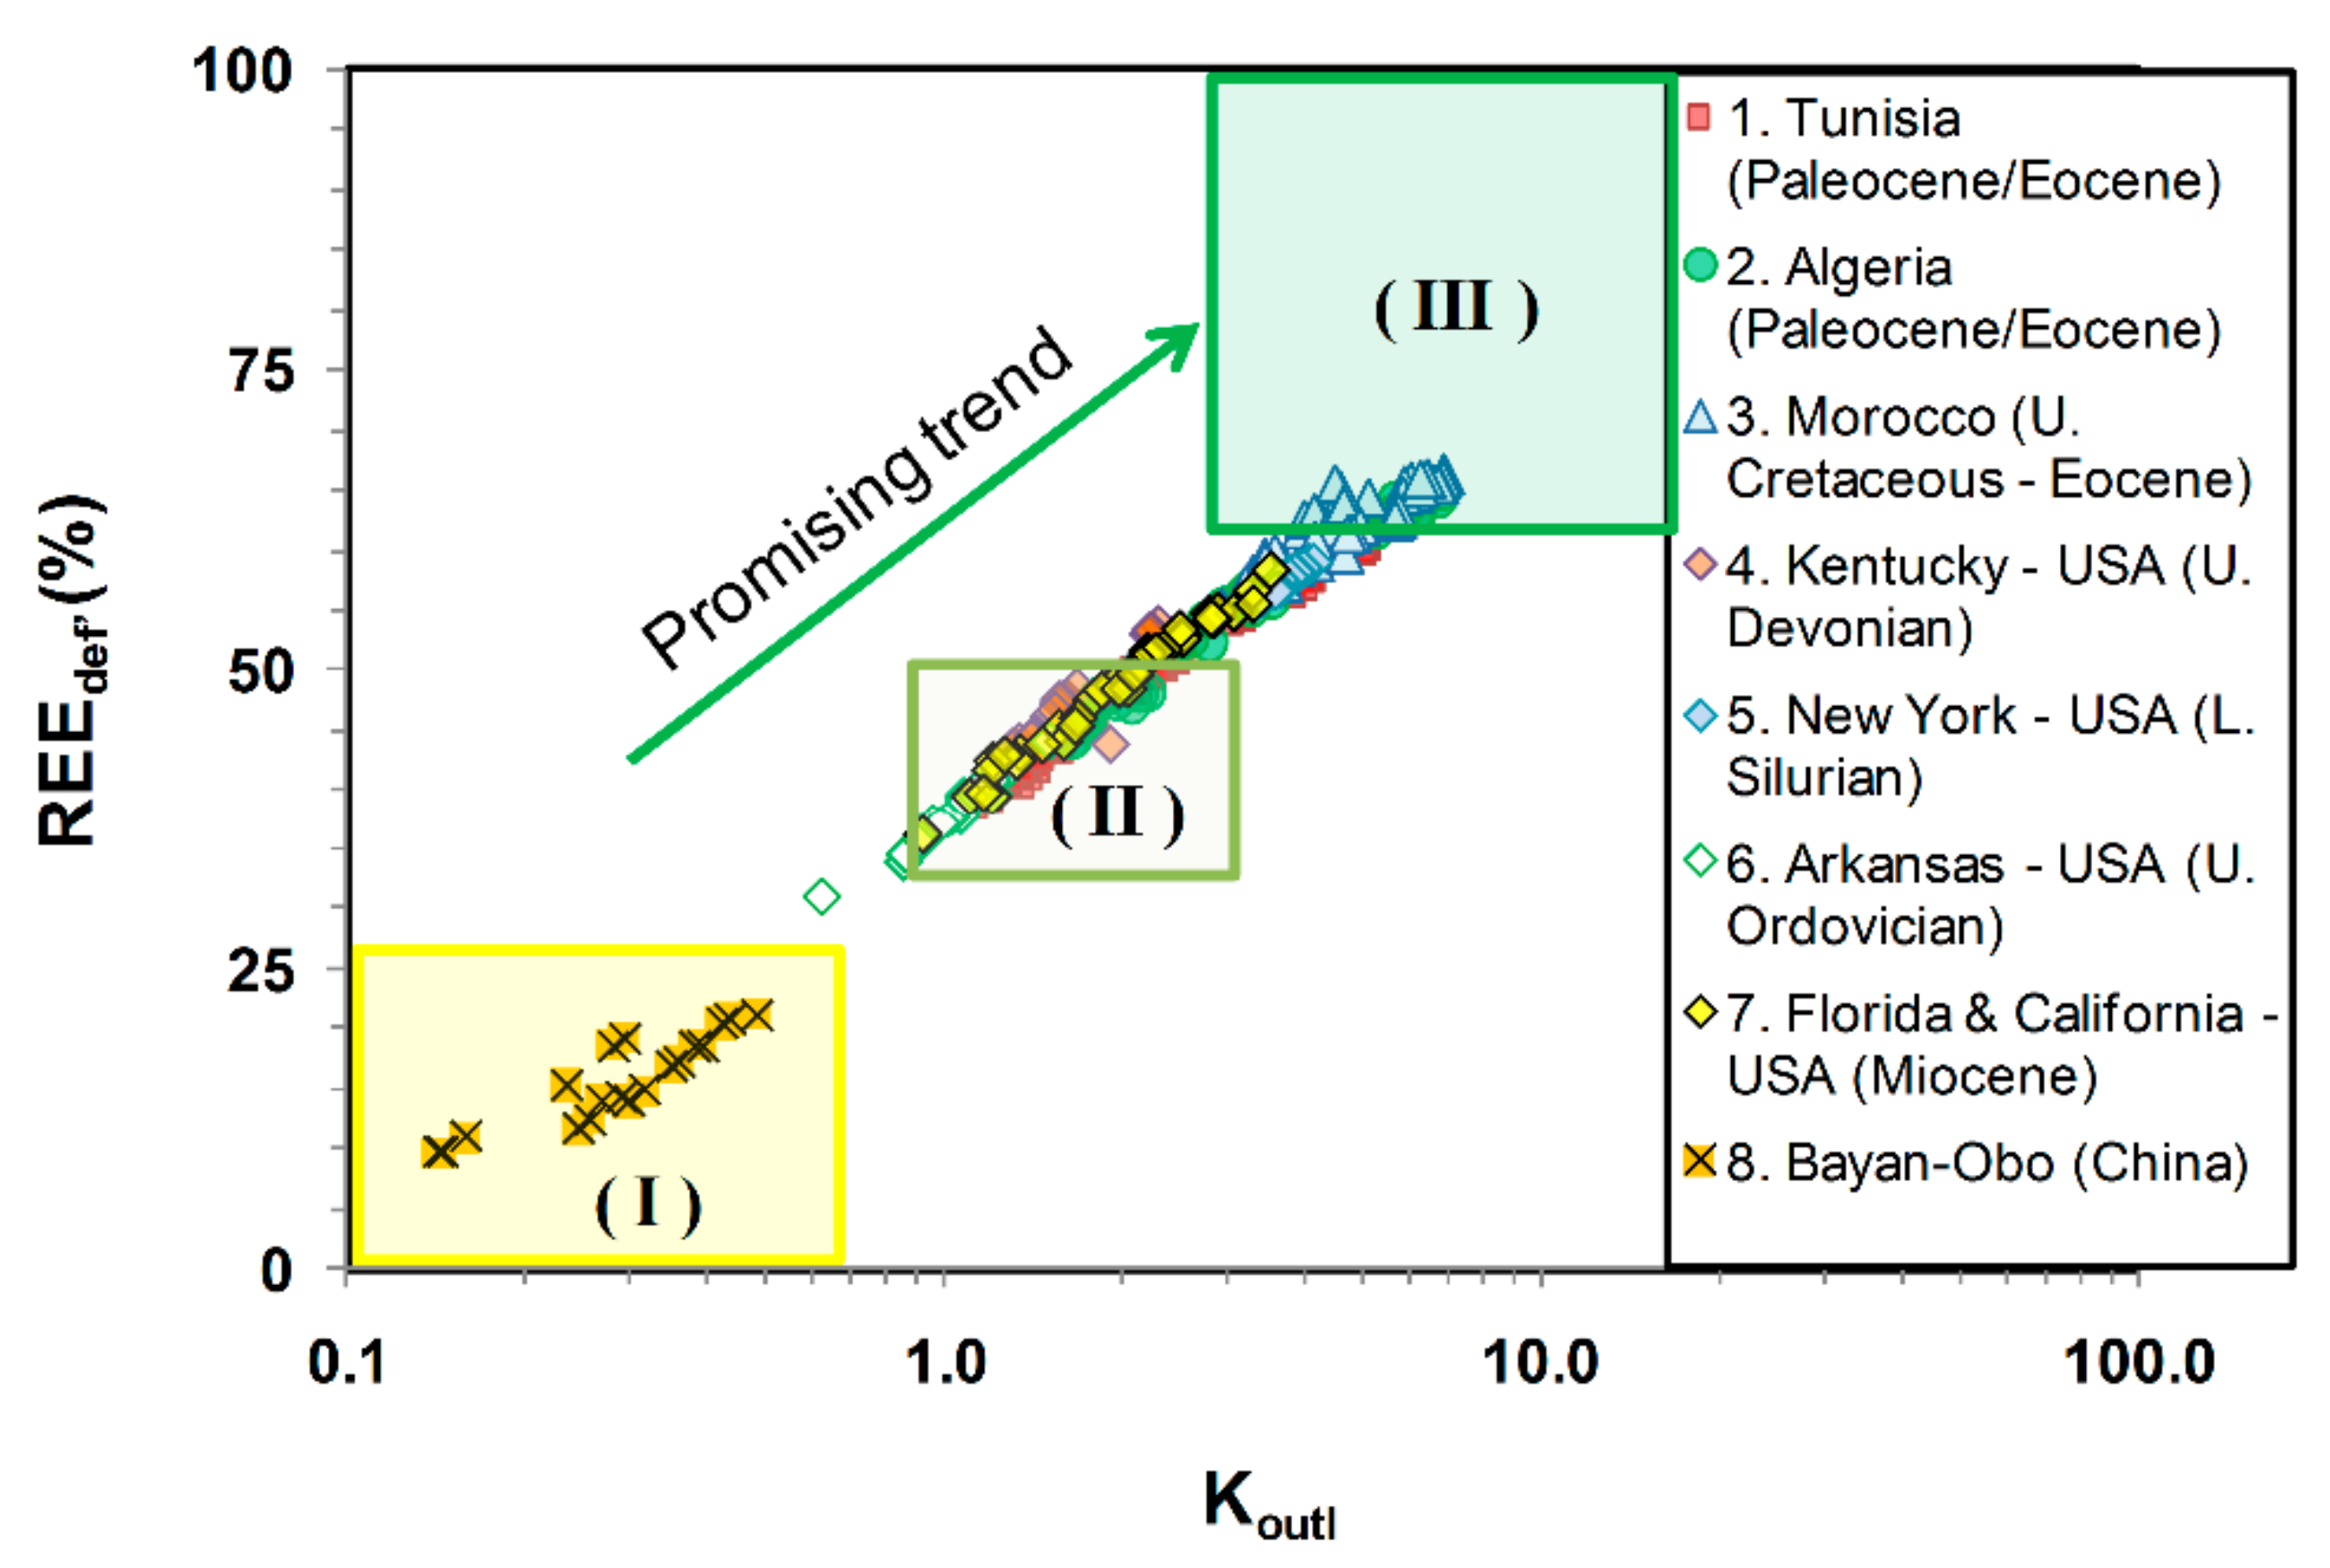
Based on the Koutl index and the percentage of critical elements in ΣREE (REEdef), the Northern African deposits lie within the promising to highly promising REE ores field, as shown in Figure 13. The Palaeozoic phosphorite deposits from the USA, which are extremely REE-enriched, display lower Koutl and REEdef values compared to North African deposits, but they also are between the promising and highly promising fields (Figure 13). The Koutl ratios of sedimentary phosphorites also display higher values compared to conventional REE ores such as Bayan-Obo (China), a high-grade (6–8% REE) REE-deposit [96,97], which however has Koutl = 0.2 and REEdef < 26% [94]. As shown in Figure 13, the Bayan Obo samples fall in the (I) unpromising field because of their lower amounts of critical REE in respect to those of the uncritical REE.
In general, this indicates that the phosphorites may represent an alternative source for critical REEs.
6. Conclusions
In this work, a review on the phosphorite deposits of Northern Africa (Tunisia, Algeria, and Morocco) was performed, mainly focused on REEs geochemical properties and the constraints they can provide about paleoenvironmental settings. The results were discussed based on both the geographical position of deposits and deposition time. Referring to the relative location of deposits, we observed that Algerian and Tunisian phosphorites share similar geochemical signatures, including the high ΣREEs amounts, the negative Ce anomalies, and high LREE/HREE fractionations. The Moroccan phosphorites differ from the other deposits studied because of their lower values of ΣREEs, lower (La/Yb)ch and (La/Gd)ch fractionations, and more pronounced negative Ce anomalies. On the contrary, very weak variations of the Eu anomalies have been detected throughout the deposits, suggesting the Eu/Eu* ratio as provenance (not redox) proxy in the analyzed deposits.
Considering the paleogeographic realm in which phosphorites formed, along the paleo-Tethys African margin, the compositional differences suggest different depositional conditions. In particular, the Ce/Ce* values indicate a general sub-reducing to a sub-oxic environmental condition for basins from the Algeria–Tunisia system and a sub-oxic to oxic environment for those of the Morocco, which may be linked to a different seawater supply. However, it has to be taken into account that the original marine REEs signature of studied phosphorites was likely altered by early diagenesis adsorption processes, which induced a general HREE enrichment for all the studied deposits.
Referring to the age of deposition, a relative REEs enrichment of the Paleocene–Eocene phosphorites with respect to the other ones was observed. A possible explanation for this can be found in the enhanced supply of dissolved ions to the marine environment triggered by warm and humid conditions, which characterized the PETM climatic interval.
Finally, in this work, a first attempt for evaluating the potentialities of Northern African phosphorite deposits as REE resources has been made. It is worth noting that based on the classification proposed by Seredin [94], among the REE-bearing P-rocks, the Northern African phosphorites can be considered promising to highly promising REE ores representing a valuable and profitable alternative source for critical REEs.
Supplementary Materials
The following are available online at https://0-www-mdpi-com.brum.beds.ac.uk/2075-163X/11/2/214/s1, Table S1: Rare earth elements composition of all the Northern African phosphorite deposits studied in this paper. Supplementary material including the ages of each deposit/sample, values of the chondrite-normalized Ce and Eu anomalies, and of (La/Yb)ch and (Gd/Yb)ch ratios.
Author Contributions
Conceptualization, G.M., R.K. and R.S.; writing—original draft preparation, R.B.; writing—review and editing, G.M., R.K. and R.S. All authors have read and agreed to the published version of the manuscript.
Funding
This research received no external funding.
Institutional Review Board Statement
Not applicable.
Informed Consent Statement
Not applicable.
Data Availability Statement
Not applicable.
Acknowledgments
Many thanks to the research teams of Hachmi Garnit and Anouar Ounis from University of Tunis El Manar and of László Kocsis from University Brunei Darussalam for their great help in conducting the review. In addition, we want to thank the editor and four anonymous reviewers for their constructing comments and suggestions that greatly improved the final version of the manuscript.
Conflicts of Interest
The authors declare no conflict of interest.
References
- Humphries, M. Rare Earth Elements: The Global Supply Chain; CRS Report for Congress; Congressional Research Service: The Library: Washington, DC, USA, December 2013; p. 27. [Google Scholar]
- Long, K.R.; Van Gosen, B.S.; Foley, N.K.; Cordier, D. The Principal Rare Earth Elements Deposits of the United States A Summary of Domestic Deposits and a Global Perspective; U.S. Geological Survey Scientific Investigations Report 5220; Springer: Heidelberg, Germany, 2010; pp. 1–104. [Google Scholar]
- Service, R.F. Nations Move to Head off Shortages of Rare Earths. Science 2010, 327, 1596–1597. [Google Scholar] [CrossRef]
- U.S. Geological Survey. Mineral Commodity Summaries. 2020. Available online: https://0-doi-org.brum.beds.ac.uk/10.3133/mcs2020 (accessed on 7 February 2020).
- Kato, Y.; Fujinaga, K.; Nakamura, K.; Takaya, Y.; Kitamura, K.; Ohta, J.; Toda, R.; Nakashima, T.; Iwamori, H. Deep-sea mud in the Pacific Ocean as a potential resource for rare-earth elements. Nat. Geosci. 2011, 4, 535–539. [Google Scholar] [CrossRef]
- Emsbo, P.; McLaughlin, P.I.; Breit, G.N.; du Bray, E.A.; Koenig, A.E. Rare earth elements in sedimentary phosphate deposits: Solution to the global REE crisis? Gondwana Res. 2015, 27, 776–785. [Google Scholar] [CrossRef] [Green Version]
- Kechiched, R.; Laouar, R.; Bruguier, O.; Salmi-Laouar, S.; Kocsis, L.; Bosch, D.; Foufou, A.; Ameur-Zaimeche, O.; Larit, H. Glauconite-Bearing Sedimentary Phosphorites from the Tébessa Region (Eastern Algeria): Evidence of REE En-richment and Geochemical Constraints on Their Origin. J. Afr. Earth Sci. 2018, 145, 190–200. [Google Scholar] [CrossRef]
- Kidder, D.; Krishnaswamy, P.; Mapes, P. Elemental mobility in phosphatic shales during concretion growth and implications for provenance analysis. Chem. Geol. 2003, 198, 335–353. [Google Scholar] [CrossRef]
- Ounis, A.; Kocsis, L.; Chaabani, F.; Pfeifer, H.-R. Rare earth elements and stable isotope geochemistry (δ13C and δ18O) of phosphorite deposits in the Gafsa Basin, Tunisia. Palaeogeogr. Palaeoclim. Palaeoecol. 2008, 268, 1–18. [Google Scholar] [CrossRef]
- Garnit, H.; Bouhlel, S.; Barca, D.; Chtara, C. Application of LA-ICP-MS to sedimentary phosphatic particles from Tunisian phosphorite deposits: Insights from trace elements and REE into paleo-depositional environments. Geochemestry 2012, 72, 127–139. [Google Scholar] [CrossRef]
- Kocsis, L.; Gheerbrant, E.; Mouflih, M.; Cappetta, H.; Ulianov, A.; Chiaradia, M.; Bardet, N. Gradual changes in upwelled seawater conditions (redox, pH) from the late Cretaceous through early Paleogene at the northwest coast of Africa: Negative Ce anomaly trend recorded in fossil bio-apatite. Chem. Geol. 2016, 421, 44–54. [Google Scholar] [CrossRef]
- Garnit, H.; Bouhlel, S.; Jarvis, I. Geochemistry and depositional environments of Paleocene–Eocene phosphorites: Metlaoui Group, Tunisia. J. Afr. Earth Sci. 2017, 134, 704–736. [Google Scholar] [CrossRef] [Green Version]
- Kechiched, R.; Laouar, R.; Bruguier, O.; Kocsis, L.; Salmi-Laouar, S.; Bosch, D.; Ameur-Zaimeche, O.; Foufou, A.; Larit, H. Comprehensive REE + Y and sensitive redox trace elements of Algerian phosphorites (Tébessa, eastern Algeria): A geochemical study and depositional environments tracking. J. Geochem. Explor. 2020, 208, 106396. [Google Scholar] [CrossRef]
- Wu, S.; Wang, L.; Zhang, P.; El-Shall, H.; Moudgil, B.; Huang, X.; Zhao, L.; Zhang, L.; Feng, Z. Simultaneous recovery of rare earths and uranium from wet process phosphoric acid using solvent extraction with D2EHPA. Hydrometallurgy 2018, 175, 109–116. [Google Scholar] [CrossRef] [Green Version]
- Baturin, G.N.; Kochenov, A.V. Uranium in Phosphorites. Lithol. Miner. Resour. 2001, 36, 303–321. [Google Scholar] [CrossRef]
- Ewing, R.C.; Wang, L. Phosphates as Nuclear Waste Forms. Rev. Miner. Geochem. 2002, 48, 673–699. [Google Scholar] [CrossRef]
- Tzifas, I.T.; Glasmacher, U.A.; Misaelides, P.; Godelitsas, A.; Gamaletsos, P.; Goettlicher, J.; de Godoy, F. Urani-um-bearing francolites present in organic-rich limestones of NW Greece: A preliminary study using synchrotron radia-tion and fission track techniques. J. Radioanal. Nucl. Chem. 2017, 311, 465–472. [Google Scholar] [CrossRef]
- Reynard, B.; Lécuyer, C.; Grandjean, P. Crystal-chemical controls on rare-earth element concentrations in fossil biogenic apatites and implications for paleoenvironmental reconstructions. Chem. Geol. 1999, 155, 233–241. [Google Scholar] [CrossRef]
- Morad, S.; Felitsyn, S. Identification of primary Ce-anomaly signatures in fossil biogenic apatite: Implication for the Cambrian oceanic anoxia and phosphogenesis. Sediment. Geol. 2001, 143, 259–264. [Google Scholar] [CrossRef]
- Felitsyn, S.; Morad, S. REE patterns in latest Neoproterozoic–early Cambrian phosphate concretions and associat-ed organic matter. Chem. Geol. 2002, 187, 257–265. [Google Scholar] [CrossRef]
- Lécuyer, C.; Reynard, B.; Grandjean, P. Rare earth element evolution of Phanerozoic seawater recorded in biogen-ic apatites. Chem. Geol. 2004, 204, 63–102. [Google Scholar] [CrossRef]
- Auer, G.; Markus, R.; Christoph, A.H.; Werner, E.P. The impact of transport processes on rare earth element pat-terns in marine authigenic and biogenic phosphates. Geochem. Cosmochim. Acta 2017, 203, 140–156. [Google Scholar] [CrossRef]
- McLennan, S.M.; Taylor, S.R.; Hemming, S.R. Composition, differentiation, and evolution of continental crust: Constraints from sedimentary rocks and heat flow. In Evolution and Differentiation of the Continental Crust; Brown, M., Rushmer, T., Eds.; Cambridge University Press: Cambridge, UK, 2006; pp. 92–134. [Google Scholar]
- Taylor, S.R.; McLennan, S.M. The Continental Crust: Its Composition and Evolution; Blackwell Scientific: Oxford, UK, 1985; 311p. [Google Scholar]
- Al-Bassam, K.; Magna, T.; Vodrážka, R.; Čech, S. Mineralogy and geochemistry of marine glauconitic siliciclasts and phosphates in selected Cenomanian–Turonian units, Bohemian Cretaceous Basin, Czech Republic: Implications for provenance and depositional environment. Geochemestry 2019, 79, 347–368. [Google Scholar] [CrossRef]
- Shields, G.; Stille, P. Diagenetic constraints on the use of cerium anomalies as palaeoseawater redox proxies: An isotopic and REE study of Cambrian phosphorites. Chem. Geol. 2001, 175, 29–48. [Google Scholar] [CrossRef]
- Haley, B.; Klinkhammer, G.P.; McManus, J. Rare earth elements in pore waters of marine sediments. Geochim. Cosmochim. Acta 2004, 68, 1265–1279. [Google Scholar] [CrossRef]
- Alibo, D.S.; Nozaki, Y. Rare earth elements in seawater: Particle association, shale-normalization, and Ce oxidation. Geochim. Cosmochim. Acta 1999, 63, 363–372. [Google Scholar] [CrossRef]
- Mongelli, G.; Boni, M.; Buccione, R.; Sinisi, R. Geochemistry of the Apulian karst bauxites (southern Italy): Chemical fractionation and parental affinities. Ore Geol. Rev. 2014, 63, 9–21. [Google Scholar] [CrossRef]
- Kocsis, L.; Gheerbrant, E.; Mouflih, M.; Cappetta, H.; Yans, J.; Amaghzaz, M. Comprehensive stable isotope inves-tigation of marine biogenic apatite from the late Cretaceous–early Eocene phosphate beds of Morocco. Palaeogeogr. Palaeoclimatol. Palaeoecol. 2014, 394, 74–88. [Google Scholar] [CrossRef]
- Sheldon, R.P. Association of phosphatic and siliceous marine sedimentary deposits. In Siliceous Sedimentary Rock-Hosted Ores and Petroleum; Hein, J.R., Ed.; Van Norstrand Reinhold Co.: New York, NY, USA, 1987; pp. 58–80. [Google Scholar]
- Notholt, A.J.G.; Sheldon, R.P.; Davidson, D.F. Phosphate Deposits of the World 2: Phosphate Rock Resources; Cambridge University Press: Cambridge, UK, 1989; 566p. [Google Scholar]
- Zaïer, A.; Béji-Sassi, A.; Sassi, S.; Moody, R.T.J. Basin evolution and deposition during the early Paleocene in Tuni-sia. In Petroleum Geology of North Africa; Macgregor, D.S., Moody, R.T.J., Clark-Lowes, D.D., Eds.; Geological Society London Special Publications: London, UK, 1998; Volume 132, pp. 375–393. [Google Scholar]
- Ben Haj Ali, M.; Jedoui, Y.; Dali, T.; Ben Salem, H.; Memmi, L. Carte Géologique al’échelle 1:500000 de la Tunisie; Service Géologique, Tunisie: Tunis, Tunisia, 1985. [Google Scholar]
- Chaabani, F. Dynamique de la Partie Orientale du Bassin de Gafsa au Cretace et au Paleogene: Etude Mineralogique et Geochimique de la serie Phosphatee Eocene, Tunisie Meridionale. Ph.D. Thesis, Universite de Tunis II, Tunis, Tunisia, 1995. [Google Scholar]
- Béji-Sassi, A. Les Phosphates dans les Basins Paléogènes de la Partie Mérid- Ionale de l’axe Nord-Sud (Tunisie). Ph.D. Thesis, Universite de Tunis II, Tunis, Tunisia, 1999. [Google Scholar]
- Zaïer, A. Evolution Tectno-Sédimentaire du Bassin Phosphate du Centre-Ouest de la Tunisie Minéralogie, Pétrogra-Phie, Géochimie et Genèse des Phosphorites. Ph.D. Thesis, Universite de Tunis II, Tunis, Tunisia, 1999. [Google Scholar]
- Chabou-Mostefai, S. Étude de la série Phosphatée Tertiaire du Djebel Onk, Algérie, Stratigraphie, Pétrographie, Minéralogie et Analyse Statistique. Ph.D. Thesis, Université de Droit, d’Économie et des Sciences, d’Aix-Marseille, France, 1987; p. 376. [Google Scholar]
- Office Chérifien des Phosphates. The phosphate deposits of Morocco. In Phosphate Deposits of the World, Phosphate Rock Resources; Notholt, A.J.G., Sheldon, R.P., Davidson, D.F., Eds.; Cambridge University Press: Cambridge, UK, 1989; Volume 2, pp. 301–311. [Google Scholar]
- Balaram, V. Rare earth elements: A review of applications, occurrence, exploration, analysis, recycling, and environmental impact. Geosci. Front. 2019, 10, 1285–1303. [Google Scholar] [CrossRef]
- Bosch, D.; Hammor, D.; Mechati, M.; Fernandez, L.; Bruguier, O.; Caby, R.; Verdoux, P. Geochemical study (major, trace elements and Pb–Sr–Nd isotopes) of mantle material obducted onto the North African margin (Edough Massif, North Eastern Algeria): Tethys fragments or lost remnants of the Liguro–Provençal basin? Tectonophysics 2014, 626, 53–68. [Google Scholar] [CrossRef]
- Fernandez, F.; Bosch, D.; Bruguier, O.; Hammor, D.; Caby, R.; Monié, P.; Arnaud, N.; Toubal, A.; Galland, B.; Douchet, C. Permo-Carboniferous and early Miocene geological evolution of the internal zones of the Maghrebides - new in-sights on the western Mediterranean evolution. J. Geodyn. 2016, 96, 146–173. [Google Scholar] [CrossRef]
- Günther, D.; Frischknecht, R.; Heinrich, C.A.; Kahlert, H.J. Capabilities of an Argon Fluoride 193 nm excimer laser for laser ablation inductively coupled plasma mass spectrometry microanalysis of geological materials. J. Anal. At. Spectrom. 1997, 12, 939–944. [Google Scholar] [CrossRef]
- Felhi, M.; Tlili, A.; Montacer, M. Geochemistry, Petrography and Spectroscopy of Organic Matter of Clay-Associated Kerogen of Ypresian Series: Gafsa-Metlaoui Phosphatic Basin, Tunisia. Resour. Geol. 2008, 58, 428–436. [Google Scholar] [CrossRef]
- Ben Hassen, A.; Trichet, J.; Disnar, J.-R.; Belayouni, H. Petrographie et geochimie comparees des pellets phos-phates et de leur gangue dans le gisement phosphate de Ras-Draa (Tunisie). Implications sur la genese des pellets phos-phates. Swiss. J. Geosci. 2010, 103, 457–473. [Google Scholar] [CrossRef] [Green Version]
- Galfati, I.; Sassi, A.B.; Zaier, A.; Bouchardon, J.L.; Bilal, E.; Joron, J.L.; Sassi, S. Geochemistry and mineralogy of Paleocene–Eocene Oum El Khecheb phosphorites (Gafsa-Metlaoui Basin) Tunisia. Geochem. J. 2010, 44, 189–210. [Google Scholar] [CrossRef] [Green Version]
- Galai, H.; Sliman, F. Mineral characterization of the Oum El Khacheb phosphorites (Gafsa-Metlaoui basin;) S Tunisia. Arab. J. Chem. 2019, 12, 1607–1614. [Google Scholar] [CrossRef] [Green Version]
- Ahmed, A.H.; Tlili, A.; Zalat, A.A.; Jeddoui, Y. Fossil diatoms from endogangue of the Ypresian phosphatic pellets of the Gafsa-Metlaoui basin: Implication on the origin of biogenic silica and depositional environment. Arab. J. Geosci. 2014, 8, 1077–1087. [Google Scholar] [CrossRef]
- Jarvis, I.; Burnett, W.C.; Nathan, Y.; Almbaydin, F.S.M.; Attia, A.K.M.; Castro, L.N.; Flicoteaux, R.; Hilmy, M.E.; Husain, V.; Qutawnah, A.A.; et al. Phosphorite geochemistry: State-of-the-art and environmental con-cerns. Eclogae Geol. Helv. 1994, 87, 643–700. [Google Scholar]
- Bolle, M.P.; Adatte, T.; Keller, G.; Von Salis, K.; Burns, S. The Paleocene-Eocene transition in the southern Tethys (Tunisia): Climatic and environmental fluctuations. Bull. Soc. Geol. Franc. 1999, 170, 661–680. [Google Scholar]
- Tlili, A.; Felhi, M.; Montacer, M. Origin and Depositional Environment of Palygorskite and Sepiolite from the Ypresian Phosphatic Series, Southwestern Tunisia. Clays Clay Miner. 2010, 58, 573–584. [Google Scholar] [CrossRef]
- McClellan, G.H. Mineralogy of carbonate fluorapatites. J. Geol. Soc. 1980, 137, 675–681. [Google Scholar] [CrossRef]
- McArthur, J. Francolite geochemistry—Compositional controls during formation, diagenesis, metamorphism and weathering. Geochim. Cosmochim. Acta 1985, 49, 23–35. [Google Scholar] [CrossRef]
- McArthur, J. Systematic variations in the contents of Na, Sr, CO3 and SO4 in marine carbonate—Fluorapatite and their relation to weathering. Chem. Geol. 1978, 21, 89–112. [Google Scholar] [CrossRef]
- Gulbrandsen, R. Chemical composition of phosphorites of the Phosphoria Formation. Geochim. Cosmochim. Acta 1966, 30, 769–778. [Google Scholar] [CrossRef]
- Altschuler, Z.S. The geochemistry of trace elements in marine phosphorites. Part I: Characteristic abundances and enrichment. In Marine Phosphorites; Bentor, Y.K., Ed.; SEPM Special Publications: Broken Arrow, OK, USA, 1980; Volume 29, pp. 19–30. [Google Scholar]
- Prevot, L. Geochemistry, petrography, genesis of Cretaceous Eocene phosphorites. Mem. Soc. Geol. Franc. 1990, 158, 232. [Google Scholar]
- Tostevin, R.; Shields, G.A.; Tarbuck, G.M.; He, T.; Clarkson, M.O.; Wood, R.A. Effective use of cerium anomalies as a redox proxy in carbonate-dominated marine settings. Chem. Geol. 2016, 438, 146–162. [Google Scholar] [CrossRef] [Green Version]
- Deng, Y.; Ren, J.; Guo, Q.; Cao, J.; Wang, H.; Liu, C. Rare earth element geochemistry characteristics of seawater and porewater from deep sea in western Pacific. Sci. Rep. 2017, 7, 1–13. [Google Scholar] [CrossRef] [Green Version]
- Hein, J.R.; Koschinsky, A.; Mikesell, M.; Mizell, K.; Glenn, C.R.; Wood, R. Marine Phosphorites as Potential Re-sources for Heavy Rare Earth Elements and Yttrium. Minerals 2016, 6, 88. [Google Scholar] [CrossRef] [Green Version]
- Chen, C.; Deng, W.; Xu, X.; He, J.; Wang, S.; Jiao, L.; Zhang, Y. Phosphorus adsorption and release characteristics of surface sediments in Dianchi Lake, China. Environ. Earth Sci. 2015, 74, 3689–3700. [Google Scholar] [CrossRef]
- Mongelli, G.; Sinisi, R.; Paternoster, M.; Perri, F. REEs and U distribution in P-rich nodules from Gelasian Apulian Tethyan carbonate: A genetic record. J. Geochem. Explor. 2018, 194, 19–28. [Google Scholar] [CrossRef]
- German, C.R.; Elderfield, H. Application of the Ce anomaly as a paleoredox indicator: The ground rules. Paleoceanography 1990, 5, 823–833. [Google Scholar] [CrossRef]
- Sinisi, R. Mineralogical and Geochemical Features of Cretaceous Bauxite from San Giovanni Rotondo (Apulia, Southern Italy): A Provenance Tool. Minerals 2018, 8, 567. [Google Scholar] [CrossRef] [Green Version]
- Carmichael, M.J.; Inglis, G.N.; Badger, M.P.; Naafs, B.D.A.; Behrooz, L.; Remmelzwaal, S.; Monteiro, F.M.; Rohrssen, M.; Farnsworth, A.; Buss, H.L.; et al. Hydrological and associated biogeo-chemical consequences of rapid global warming during the Paleocene–Eocene Thermal Maximum. Glob. Planet. Chang. 2017, 157, 114–138. [Google Scholar] [CrossRef]
- Johnsson, M.J.; Basu, A.; McLennan, S.M.; Hemming, S.; McDaniel, D.K.; Hanson, G.N.; Marsaglia, K.M.; Ridgway, K.D.; DeCelles, P.G.; Devaney, K.A.; et al. Processes Controlling the Composition of Clastic Sediments. Geol. Soc. Am. Spec. Pap. 1993, 284, 21–40. [Google Scholar] [CrossRef] [Green Version]
- Cullers, R.L.; Podkovyrov, V.N. Geochemistry of the Mesoproterozoic Lakhanda shales in southeastern Yakutia, Russia: Implications for mineralogical and provenance control, and recycling. Precamb. Res. 2000, 104, 77–93. [Google Scholar] [CrossRef]
- Condie, K.C.; Des Marais, D.J.; Abbott, D. Precambrian superplumes and supercontinents: A record in black shales, carbon isotopes, and paleoclimates? Precamb. Res. 2001, 106, 239–260. [Google Scholar] [CrossRef]
- Sinisi, R.; Mongelli, G.; Mameli, P.; Oggiano, G. Did the Variscan relief influence the Permian climate of Mesoeurope? Insights from geochemical and mineralogical proxies from Sardinia (Italy). Palaeogeogr. Palaeoclim. Palaeoecol. 2014, 396, 132–154. [Google Scholar] [CrossRef]
- Ismael, I.S. Rare earth elements in Egyptian phosphorites. Chin. J. Geochem. 2002, 21, 19–28. [Google Scholar] [CrossRef]
- Banerjee, S.; Choudhury, T.R.; Saraswati, P.K.; Khanolkar, S. The formation of authigenic deposits during Paleogene warm climatic intervals: A review. J. Palaeogeogr. 2020, 9, 1–27. [Google Scholar] [CrossRef]
- Shemesh, A.; Kolodny, Y.; Luz, B. Oxygen isotope variation in phosphate of biogenic apatites, II. Phosphorite rocks. Earth Planet. Sci. Lett. 1983, 64, 405–416. [Google Scholar] [CrossRef]
- Sadaqah, M.R.; Abed, M.A.; Grimm, A.K.; Pufahl, K.P. Oxygen and carbon isotopes in Jordanian phosphorites and associated fossils. J. Asian Earth Sci. 2007, 29, 803–812. [Google Scholar] [CrossRef]
- Compton, J.S.; Hodell, D.A.; Garrido, J.R.; Mallinson, D.J. Origin and age of phosphorite from the south-central Florida Platform; relation of phosphogenesis to sea level fluctuations and δ13C excursions. Geochim. Cosmochim. 1993, 57, 131–146. [Google Scholar] [CrossRef]
- Hessler, A.M.; Zhang, J.; Covault, J.; Ambrose, W. Continental weathering coupled to Paleogene climate changes in North America. Geology 2017, 45, 911–914. [Google Scholar] [CrossRef]
- Bolle, M.-P.; Adatte, T. Palaeocene- early Eocene climatic evolution in the Tethyan realm: Clay mineral evidence. Clay Miner. 2001, 36, 249–261. [Google Scholar] [CrossRef]
- Chamley, H. Clay Sedimentology; Springer Science and Business Media LLC: Heidelberg, Germany, 1989; p. 623. [Google Scholar]
- Robert, C.; Chamley, H. Development of early Eocene warm climates, as inferred from clay mineral variations in oceanic sediments. Palaeogeogr. Palaeoclim. Palaeoecol. 1991, 89, 315–331. [Google Scholar] [CrossRef]
- Jones, B.F.; Conko, K.M. Environmental Influences on the Occurrences of Sepiolite and Palygorskite: A Brief Re-view. Dev. Clay Sci. 2011, 3, 69–83. [Google Scholar]
- Zachos, J.C.; Röhl, U.; Schellenberg, S.A.; Sluijs, A.; Hodell, D.A.; Kelly, D.C.; Thomas, E.; Nicolo, M.; Raffi, I.; Lourens, L.J.; et al. Rapid Acidification of the Ocean During the Paleocene-Eocene Thermal Maximum. Science 2005, 308, 1611–1615. [Google Scholar] [CrossRef] [Green Version]
- Penman, D.E.; Hönisch, B.; Zeebe, R.E.; Thomas, E.; Zachos, J.C. Rapid and sustained surface ocean acidification during the Paleocene-Eocene Thermal Maximum. Paleoceanography 2014, 29, 357–369. [Google Scholar] [CrossRef] [Green Version]
- De Baar, H.J.; German, C.R.; Elderfield, H.; Van Gaans, P. Rare earth element distributions in anoxic waters of the Cariaco Trench. Geochim. Cosmochim. Acta 1988, 52, 1203–1219. [Google Scholar] [CrossRef]
- Liu, Y.-G.; Miah, M.; Schmitt, R. Cerium: A chemical tracer for paleo-oceanic redox conditions. Geochim. Cosmochim. Acta 1988, 52, 1361–1371. [Google Scholar] [CrossRef]
- Wu, S.; Wang, L.; Zhao, L.; Zhang, P.; El-Shall, H.; Moudgil, B.; Huang, X.; Zhang, L. Recovery of rare earth elements from phosphate rock by hydrometallurgical processes—A critical review. Chem. Eng. J. 2018, 335, 774–800. [Google Scholar] [CrossRef]
- Peiravi, M.; Dehghani, F.; Ackah, L.; Baharlouei, A.; Godbold, J.; Liu, J.; Mohanty, M.; Ghosh, T. A Review of Rare-Earth Elements Extraction with Emphasis on Non-conventional Sources: Coal and Coal Byproducts, Iron Ore Tailings, Apatite, and Phosphate Byproducts. Min. Met. Explor. 2021, 38, 1–26. [Google Scholar] [CrossRef]
- Li, Y.H. A Compendium of Geochemistry: From Solar Nebula to the Human Brain; Princeton University Press: Princeton, NJ, USA, 2000. [Google Scholar]
- Christmann, P. A Forward Look into Rare Earth Supply and Demand: A Role for Sedimentary Phosphate Depos-its? Procedia Eng. 2014, 83, 19–26. [Google Scholar] [CrossRef] [Green Version]
- Khan, K.; Dar, S.A.; Khan, S.A. Geochemistry of phosphate bearing sedimentary rocks in parts of Sonrai block, Lalitpur District, Uttar Pradesh, India. Geochemistry 2012, 72, 117–125. [Google Scholar] [CrossRef]
- Ilyin, A.V. Rare-earth geochemistry of ‘old’ phosphorites and probability of syngenetic precipitation and accumulation of phosphate. Chem. Geol. 1998, 144, 243–256. [Google Scholar] [CrossRef]
- Murthy, R.; Kidder, D.; Mapes, R.; Hannigan, R. Rare-earth element chemistry of Mississippian–age phosphate nodules in the Fayetteville Shale of Oklahoma and Arkansas. Environ. Geosci. 2004, 11, 99–111. [Google Scholar] [CrossRef]
- Kidder, D.L.; Eddy Dilek, C.A. Rare-earth element variation in phosphate nodules from Midcontinent Pennsylva-nian cyclothems. J. Sedim. Res. 1994, 64, 584–592. [Google Scholar]
- Baioumy, H. Rare earth elements and sulfur and strontium isotopes of upper Cretaceous phosphorites in Egypt. Cretac. Res. 2011, 32, 368–377. [Google Scholar] [CrossRef]
- McArthur, J.; Walsh, J. Rare-earth geochemistry of phosphorites. Chem. Geol. 1984, 47, 191–220. [Google Scholar] [CrossRef]
- Seredin, V.V. A new method for primary evaluation of the outlook for rare earth element ores. Geol. Ore Depos. 2010, 52, 428–433. [Google Scholar] [CrossRef]
- Seredin, V.V.; Dai, S. Coal deposits as potential alternative sources for lanthanides and yttrium. Int. J. Coal Geol. 2012, 94, 67–93. [Google Scholar] [CrossRef]
- Zhang, S.-H.; Zhao, Y.; Liu, Y. A precise zircon Th-Pb age of carbonatite sills from the world’s largest Bayan Obo deposit: Implications for timing and genesis of REE-Nb mineralization. Precambrian Res. 2017, 291, 202–219. [Google Scholar] [CrossRef]
- Hou, X.-Z.; Yang, Z.-F.; Wang, Z.-J. The occurrence characteristics and recovery potential of middle-heavy rare earth elements in the Bayan Obo deposit, Northern China. Ore Geol. Rev. 2020, 126, 103737. [Google Scholar] [CrossRef]
Figure 1.
Geographical schema displaying the northern Africa sector where the studied phosphorite deposits (red boxes) are located.
Figure 1.
Geographical schema displaying the northern Africa sector where the studied phosphorite deposits (red boxes) are located.

Figure 2.
A (paleo)geographical sketch map of northern Africa continent showing also the present position of the studied Tunisian and Algerian deposits in respect to the emerged zones during the Early Eocene. Dotted line is the actual border between Algeria and Tunisia. Modified after Zaïer et al. [33] and Garnit et al. [12].

Figure 3.
Schematic geological maps of the (a) northern, (b) Gafsa-Metlaoui, and (c) eastern Tunisian basins affected by Paleocene–Eocene phosphogenesis. Modified after Ben Haj Ali et al. [34] and Garnit et al. [12].

Figure 4.
Stratigraphical columns of the phosphorite-bearing sequence of the studied Tunisian basins. Gafsa-Metlaoui basin and Jebel Jebs modified after [36]; Sra Ouertane modified after [37].

Figure 5.
Stratigraphical columns of the phosphorite-bearing sequence from the northern and southern basins of Tébessa region (Algeria). From Kechiched et al. [13].
Figure 5.
Stratigraphical columns of the phosphorite-bearing sequence from the northern and southern basins of Tébessa region (Algeria). From Kechiched et al. [13].

Figure 6.
Location of the studied phosphorite ores of western Morocco [30].
Figure 6.
Location of the studied phosphorite ores of western Morocco [30].

Figure 7.
Stratigraphy of the P-bearing sequences of the Ouled Abdon and Ganntour basins of Morocco [30].
Figure 7.
Stratigraphy of the P-bearing sequences of the Ouled Abdon and Ganntour basins of Morocco [30].

Figure 8.
Box and whisker plots of ΣREEs (a) and selected geochemical proxies (b) Ce/Ce*; (c) Eu/Eu*; (d) (La/Yb)ch; (e) (Gd/Yb)ch) calculated for the studied samples grouped by location. The horizontal bar in the box refers to the median value; the ends of the whiskers are the maximum and minimum values of variables; the top and bottom of the boxes are the values of first and third quartiles; circles represent the outlier values of the dataset.

Figure 9.
Box and whisker plots of ΣREEs (a) and selected geochemical proxies (b) Ce/Ce*; (c) Eu/Eu*; (d) (La/Yb)ch; (e) (Gd/Yb)ch) calculated for the studied samples grouped by deposition age. Symbols are as shown in Figure 8.
Figure 9.
Box and whisker plots of ΣREEs (a) and selected geochemical proxies (b) Ce/Ce*; (c) Eu/Eu*; (d) (La/Yb)ch; (e) (Gd/Yb)ch) calculated for the studied samples grouped by deposition age. Symbols are as shown in Figure 8.

Figure 10.
Paleogeographic schema at Paleocene–Eocene time displaying the main water circulation along the Africa paleomargin and the position of studied deposits. Modified after [65].
Figure 10.
Paleogeographic schema at Paleocene–Eocene time displaying the main water circulation along the Africa paleomargin and the position of studied deposits. Modified after [65].

Figure 11.
(a) The (La/Sm)PAAS vs. (La/Yb)PAAS binary plot showing the influence of diagenesis to studied phosphorite samples grouped by location. Red circles are for the Algeria deposits, blue circles are for the Tunisia deposits, green circles are for the Morocco deposits. (b) The (Sm/Pr)PAAS vs. (Sm/Yb)PAAS diagram displaying the HREE enrichment recorded in the Africa deposits. Symbols are as in (a).

Figure 12.
Rare earth elements (REEs) comparison against geological age and several worldwide locations. Data after (1) [88]; (2) [89]; (3) [6]; (4) [90]; (5) [91]; (6) [92]; (7) [93]; (8) [11]; (9) [7]; (10) [13]; (11) [9]; (12) [10]; (13) [12].

Figure 13.
Classification of REE-bearing P-deposits based on outlook coefficient (Koutl) versus the percentage of critical elements in total REE (REEdef) [94]. I: unpromising (REEdef ≤ 26% and Koutl ≤ 0.7); II: promising (33% ≤ REEdef ≤ 50; 0.9 ≤ Koutl ≤ 3.1); III: highly promising (REEdef ≥ 62% and Koutl ≥ 2.8). Data source: (1) [9,10,12]; (2) [7,13]; (3) [11]; (4,5,7) [6]; (6) [90], (8) [96,97].


Table 1.
Major elements composition (wt%) of the Paleocene–Eocene phosphorite deposits from Northern Africa.
Table 1.
Major elements composition (wt%) of the Paleocene–Eocene phosphorite deposits from Northern Africa.
| Locality/Deposit | Samples | SiO2 | TiO2 | Al2O3 | Fe2O3 | MnO | MgO | CaO | Na2O | K2O | P2O5 | SO3 | LOI | Total |
|---|---|---|---|---|---|---|---|---|---|---|---|---|---|---|
| TUNISIA 1 | ||||||||||||||
| Sra Ouertana | SRO1 | 21.37 | 0.17 | 3.41 | 1.06 | 0.011 | 0.64 | 38.93 | 0.54 | 0.91 | 7.74 | 0.69 | 25.09 | 100.57 |
| SRO2 | 13.22 | 0.129 | 1.7 | 0.44 | 0.009 | 0.57 | 44.25 | 0.23 | 0.37 | 10.5 | 0.89 | 27.11 | 99.42 | |
| SRO3 | 8.35 | 0.062 | 1.36 | 0.7 | 0.008 | 1.38 | 46.57 | 0.3 | 0.39 | 10.44 | 2.37 | 27.69 | 99.62 | |
| SRO4 | 9.18 | 0.081 | 1.63 | 0.66 | 0.011 | 2.07 | 45.56 | 0.24 | 0.39 | 4.66 | 0.64 | 34.04 | 99.16 | |
| SRO5 | 7.42 | 0.089 | 1.9 | 0.82 | 0.007 | 0.89 | 48.23 | 0.13 | 0.32 | 5.81 | 0.23 | 33.9 | 99.75 | |
| SRO6 | 10.86 | 0.078 | 1.9 | 0.68 | 0.005 | 1.09 | 45.74 | 0.41 | 0.58 | 8.81 | 0.36 | 29.03 | 99.55 | |
| SRO7 | 13.26 | 0.159 | 2.63 | 0.86 | 0.005 | 0.75 | 44.55 | 0.15 | 0.49 | 3.78 | 0.2 | 33.73 | 100.57 | |
| SRO8 | 8.23 | 0.039 | 0.68 | 0.46 | 0.002 | 0.24 | 48.6 | 0.52 | 0.2 | 26.12 | 0.89 | 13.13 | 99.11 | |
| SRO9 | 9.46 | 0.035 | 0.48 | 0.42 | 0.008 | 0.23 | 48.33 | 0.45 | 0.11 | 21.94 | 0.97 | 17.69 | 100.12 | |
| Sekarna | SEK1 | 18.2 | 0.041 | 1.22 | 2.17 | 0.025 | 3.88 | 38.76 | 0.41 | 0.5 | 19.73 | 0.92 | 13.74 | 99.6 |
| SEK3 | 22.45 | 0.05 | 1.21 | 1.99 | 0.015 | 2.43 | 38.18 | 0.48 | 0.45 | 23.77 | 1.35 | 9.06 | 101.44 | |
| SEK4 | 9.31 | 0.036 | 0.88 | 1.69 | 0.023 | 5.12 | 42.35 | 0.42 | 0.39 | 19.14 | 3 | 19.02 | 101.38 | |
| Jebel Jebs | JBS4 | 31.47 | 0.145 | 2.11 | 0.69 | 0.006 | 7.88 | 24.79 | 0.7 | 1.47 | 8.83 | nd | 19.64 | 97.73 |
| JBS5 | 29.01 | 0.064 | 1.09 | 0.45 | 0.005 | 5.47 | 30.8 | 0.87 | 0.72 | 14.32 | 2.41 | 16.17 | 101.38 | |
| JBS10 | 12.13 | 0.098 | 0.98 | 0.41 | 0.006 | 12.08 | 32.72 | 0.68 | 0.64 | 9.17 | nd | 28.87 | 97.78 | |
| JBS7 | 15.5 | 0.128 | 1.72 | 0.46 | 0.007 | 12.63 | 30.1 | 0.53 | 1.2 | 6.7 | 1.75 | 29.48 | 100.2 | |
| JBS14 | 15.72 | 0.037 | 0.7 | 0.53 | 0.003 | 0.45 | 42.7 | 1.45 | 0.33 | 27.86 | 3.55 | 9.97 | 103.3 | |
| JBS18 | 7.26 | 0.064 | 1.33 | 0.67 | 0.003 | 0.77 | 44.84 | 1.72 | 0.37 | 29.44 | 4.74 | 10.8 | 102.01 | |
| JBS19 | 6.52 | 0.082 | 1.81 | 0.87 | 0.004 | 1.05 | 44.91 | 1.68 | 0.68 | 28.8 | 4.47 | 11.19 | 102.07 | |
| Naguess | NAGI | 9.23 | 0.065 | 1.62 | 0.59 | 0.003 | 0.5 | 44.53 | 1.29 | 0.69 | 26.76 | 3 | 11.41 | 99.68 |
| NAGIIa | 3.98 | 0.032 | 0.74 | 0.29 | 0.004 | 0.47 | 48.49 | 1.3 | 0.17 | 27.72 | 3.1 | 11.74 | 98.03 | |
| NAGIIb | 7.4 | 0.046 | 1.09 | 0.45 | 0.004 | 0.65 | 45.56 | 1.27 | 0.18 | 26.1 | 4.09 | 13.28 | 100.12 | |
| NAGIII | 5.44 | 0.04 | 0.91 | 0.4 | 0.004 | 0.6 | 46.95 | 1.36 | 0.13 | 28.05 | 3.75 | 12.11 | 99.74 | |
| NAGIV | 14.56 | 0.029 | 0.7 | 0.16 | 0.003 | 0.48 | 43.59 | 1.35 | 0.08 | 26.76 | 2.65 | 11.6 | 101.96 | |
| NAGV | 21.96 | 0.021 | 0.43 | 0.21 | 0.002 | 0.39 | 39.04 | 1.22 | 0.06 | 23.93 | 2.13 | 11.07 | 100.47 | |
| NAGVI | 5.79 | 0.033 | 0.76 | 0.34 | 0.003 | 0.6 | 47.31 | 1.44 | 0.11 | 28.9 | 3.5 | 11.69 | 100.47 | |
| NAGVII | 3.35 | 0.03 | 0.67 | 0.31 | 0.002 | 0.63 | 49.22 | 1.39 | 0.12 | 28.99 | 4.42 | 11.44 | 100.57 | |
| Central Kef Eddour | KECI | 6.97 | 0.053 | 1.28 | 0.56 | 0.003 | 0.62 | 45.88 | 1.42 | 0.32 | 27.81 | 3.9 | 11.9 | 100.71 |
| KECII | 6.11 | 0.04 | 0.92 | 0.44 | 0.003 | 0.67 | 46.78 | 1.47 | 0.15 | 28.83 | 4.99 | 12.03 | 102.44 | |
| KECIII | 12.6 | 0.058 | 1.58 | 0.65 | 0.005 | 0.78 | 42.44 | 1.38 | 0.2 | 25.38 | 3.72 | 13.01 | 101.8 | |
| KECIV | 14.01 | 0.041 | 1.13 | 0.45 | 0.005 | 0.6 | 42.61 | 1.35 | 0.15 | 25.93 | 3.57 | 12.6 | 102.45 | |
| KECV | 12.02 | 0.051 | 1.27 | 0.56 | 0.005 | 0.72 | 42.67 | 1.42 | 0.16 | 25.94 | nd | 12.56 | 97.38 | |
| KECVI | 7.65 | 0.051 | 1.19 | 0.56 | 0.007 | 0.81 | 44.64 | 1.37 | 0.14 | 27.02 | nd | 13.45 | 96.89 | |
| KECVII | 6.2 | 0.044 | 0.92 | 0.38 | 0.004 | 0.81 | 45.34 | 1.3 | 0.14 | 25.64 | 6.72 | 12.98 | 100.47 | |
| KECVIII | 6.7 | 0.042 | 0.99 | 0.43 | 0.003 | 0.76 | 45.27 | 1.39 | 0.18 | 25.65 | 5.22 | 13.39 | 100.02 | |
| Table Metlaoui | TMI | 7.91 | 0.061 | 1.38 | 0.55 | 0.005 | 0.53 | 43.53 | 1.46 | 0.45 | 26.4 | nd | 12.01 | 94.29 |
| TMII | 8.02 | 0.062 | 1.45 | 0.56 | 0.006 | 0.53 | 44 | 1.47 | 0.45 | 26.62 | 5.87 | 12.24 | 101.28 | |
| TMIII | 13.3 | 0.047 | 1.21 | 0.56 | 0.007 | 0.67 | 42.07 | 1.39 | 0.15 | 25.91 | 3.77 | 12.36 | 101.44 | |
| TMIV | 14.51 | 0.052 | 1.24 | 0.59 | 0.007 | 0.74 | 40.91 | 1.36 | 0.14 | 24.87 | 3.62 | 12.75 | 100.79 | |
| TMV | 6.23 | 0.048 | 0.98 | 0.52 | 0.005 | 0.65 | 45.3 | 1.5 | 0.13 | 28.3 | 6.12 | 11.64 | 101.42 | |
| TMVI | 10.13 | 0.077 | 1.71 | 0.81 | 0.005 | 0.98 | 44.01 | 1.48 | 0.19 | 26.58 | 3.77 | 12.2 | 101.94 | |
| TMVIIa | 8.15 | 0.069 | 1.31 | 0.54 | 0.004 | 1.17 | 44.47 | 1.33 | 0.17 | 24.14 | 5.72 | 15.06 | 102.13 | |
| TMVIII | 5.9 | 0.042 | 0.99 | 0.49 | 0.004 | 0.74 | 46.63 | 1.49 | 0.21 | 27.12 | nd | 12.12 | 95.74 | |
| Mzinda | MZ0 | 29.98 | 0.146 | 3.67 | 1.24 | 0.007 | 5.17 | 26.78 | 1.11 | 0.74 | 11.56 | 1.46 | 17.98 | 99.85 |
| MZI> | 18.3 | 0.06 | 1.33 | 0.54 | 0.005 | 1.44 | 39.74 | 1.24 | 0.29 | 20.81 | 2.67 | 14.1 | 100.53 | |
| MZI< | 5.2 | 0.049 | 1.09 | 0.51 | 0.004 | 1.45 | 46.61 | 1.48 | 0.13 | 27.61 | 6.84 | 12.64 | 103.61 | |
| MZH1 | 11.64 | 0.1 | 2.07 | 0.91 | 0.007 | 1.3 | 41.98 | 1.37 | 0.24 | 23.83 | 3.7 | 14.85 | 101.99 | |
| MZH2 | 9.53 | 0.029 | 0.58 | 0.32 | 0.003 | 0.5 | 45.92 | 1.39 | 0.1 | 27.43 | 4.49 | 12.64 | 102.94 | |
| MZII> | 7.86 | 0.082 | 1.89 | 0.79 | 0.005 | 1.22 | 44.05 | 1.54 | 0.19 | 27 | 4.14 | 13.7 | 102.47 | |
| MZII< | 4.27 | 0.041 | 0.83 | 0.34 | 0.003 | 0.84 | 46.44 | 1.55 | 0.11 | 28.46 | 2.37 | 12.05 | 97.31 | |
| MZIII | 4.41 | 0.039 | 0.84 | 0.31 | 0.004 | 0.67 | 48 | 1.5 | 0.16 | 24.15 | 5.22 | 14.8 | 100.1 | |
| Jellabia | JLA0 | 35.6 | 0.072 | 1.94 | 0.61 | 0.007 | 3.08 | 28.5 | 0.88 | 0.59 | 14.38 | 1.54 | 12.71 | 99.91 |
| JLAI | 4.17 | 0.04 | 0.86 | 0.38 | 0.005 | 3.17 | 45.59 | 1.25 | 0.11 | 25.93 | 3.22 | 14.48 | 99.21 | |
| JLAH1 | 6.88 | 0.054 | 1.12 | 0.53 | 0.004 | 1.97 | 45.34 | 1.37 | 0.12 | 26.5 | 2.65 | 13.29 | 99.82 | |
| JLAH2 | 10.21 | 0.038 | 0.75 | 0.25 | 0.003 | 0.53 | 45.03 | 1.46 | 0.1 | 28.54 | 2.95 | 11.71 | 101.57 | |
| JLAII> | 4.44 | 0.05 | 1.08 | 0.44 | 0.003 | 0.76 | 47.77 | 1.51 | 0.14 | 29.35 | 4.52 | 10.38 | 100.44 | |
| JLII< | 2.64 | 0.031 | 0.57 | 0.26 | 0.002 | 0.62 | 48.47 | 1.53 | 0.08 | 30.32 | 3.95 | 9.98 | 98.45 | |
| JLAIII | 5.32 | 0.048 | 1.06 | 0.41 | 0.003 | 0.76 | 47.46 | 1.26 | 0.32 | 26.79 | 2.7 | 12.86 | 98.99 | |
| ALGERIA 2 | ||||||||||||||
| Djebel El Kouif | ra#14 | 16.85 | 0.06 | 1.82 | 11.19 | - | 1.67 | 33.02 | 0.51 | 2.57 | 22.78 | 0.94 | - | 94.65 |
| ra#20 | 11.62 | 0 | 1.31 | 3.37 | - | 1.43 | 42.22 | 0.54 | 1.94 | 27.09 | 1.06 | - | 95.14 | |
| ra#21 | 10.14 | 0 | 1.34 | 2.53 | - | 1.18 | 42.77 | 0.5 | 1.57 | 27.98 | 1.02 | - | 93.69 | |
| ra#11 | 2.06 | 0.03 | 0.59 | 0.32 | - | 0.45 | 48.98 | 1.08 | 0.09 | 31.23 | 1.93 | - | 92.06 | |
| ra#12 | 0.48 | 0 | 0.07 | 0.03 | - | 0.24 | 50.43 | 1.41 | 0.05 | 31.83 | 2.49 | - | 92.37 | |
| Kef Essenoun | rc#5 | 17.69 | 0 | 2.65 | 5.81 | - | 1.76 | 34.78 | 0.46 | 3.02 | 23.03 | 1.54 | - | 94.65 |
| rc#6 | 13.17 | 0 | 1.68 | 5.1 | - | 1.28 | 39.36 | 0.57 | 2.42 | 26.93 | 1.67 | - | 96.64 | |
| rc#4 | 1.82 | 0.02 | 0.45 | 0.23 | - | 0.53 | 49.12 | 1.16 | 0.07 | 30.94 | 1.99 | - | 91.37 | |
| rc#2 | 0.79 | 0.02 | 0.21 | 0.28 | - | 0.57 | 49.41 | 1.06 | 0.03 | 31.95 | 2.05 | - | 91.22 | |
| Djebel Dyr | D_1 | - | 0.032 | 0.58 | 0.31 | - | 1.21 | 46.8 | - | 0.15 | 23.78 | - | - | - |
| D_2 | - | 0.131 | 2.38 | 1.09 | - | 1.36 | 37.96 | - | 0.4 | 6.52 | - | - | - | |
| D_3 | - | 0.04 | 0.75 | 0.54 | - | 0.65 | 32.5 | - | 0.16 | 22.26 | - | - | - | |
| D_4 | - | 0.086 | 1.35 | 0.55 | - | 1.27 | 35.06 | - | 0.34 | 15.98 | - | - | - | |
| D_5 | - | 0.137 | 2.29 | 0.93 | - | 2.65 | 29.76 | - | 0.53 | 13.31 | - | - | - | |
| D_6 | - | 0.06 | 0.95 | 0.4 | - | 1.66 | 41.84 | - | 0.18 | 23.02 | - | - | - | |
| D_7 | - | 0.033 | 0.5 | 0.21 | - | 0.67 | 48.86 | - | 0.14 | 18.03 | - | - | - | |
| D_8 | - | 0.107 | 1.34 | 0.65 | - | 0.65 | 30.16 | - | 0.25 | 10.24 | - | - | - | |
| D_9 | - | 0.015 | 0.18 | 0.23 | - | 0.37 | 45.61 | - | 0.06 | 30.33 | - | - | - | |
| D_10 | - | 0.015 | 0.32 | 0.16 | - | 0.47 | 37.15 | - | 0.07 | 21.32 | - | - | - | |
| Djebel Tazbant | T_1 | - | 0.016 | 0.23 | 0.12 | - | 0.9 | 47.97 | - | 0.05 | 21.84 | - | - | - |
| T_2 | - | 0.01 | 0.36 | 0.08 | - | 0.28 | 30.04 | - | 0.08 | 19.26 | - | - | - | |
| T_3 | - | 0.022 | 0.45 | 0.31 | - | 0.53 | 21.91 | - | 0.12 | 13.32 | - | - | - | |
| T_4 | - | 0.011 | 0.53 | 0.09 | - | 0.28 | 28.06 | - | 0.1 | 18.23 | - | - | - | |
1 Data from [9,10,12]. 2 Data from [7,13]. nd = not detected; - = not available.Samples from Sra Ouertane and Jebel Jebs are characterized by the highest CaO and MgO contents, respectively, reflecting the high amounts of calcite and dolomite in these deposits. SiO2 and Al2O3 concentrations show significant variations (2.64–35.6 wt%, 0.43–3.67 wt%, respectively), reflecting the changing proportions of quartz (detrital and biogenic), opal-CT, and mixed clay mineral assemblages in the deposits. TiO2 values show a minimum of 0.02 and a maximum of 0.17 wt%, representing clay minerals. The correlation between chemical concentrations, obtained using Pearson correlations, outlined that TiO2 is strongly correlated (ρ > 0.75) with Al2O3. The highest TiO2 values (0.16 wt% and 0.17 wt%) were recorded in two ilmenite-rich samples from Sra Ouertane, which are likely associated to heavy mineral enrichment in relation with a siliciclastic fraction.
Table 2.
Rare earth elements composition (ppm) of all the Northern African phosphorite deposits studied in this paper. See Supplementary Material for the ages of each deposit/sample and values of the Ce and Eu anomalies, and (La/Yb)ch and (Gd/Yb)ch ratios.
Table 2.
Rare earth elements composition (ppm) of all the Northern African phosphorite deposits studied in this paper. See Supplementary Material for the ages of each deposit/sample and values of the Ce and Eu anomalies, and (La/Yb)ch and (Gd/Yb)ch ratios.
| Locality/Deposit | Samples | La | Ce | Pr | Nd | Sm | Eu | Gd | Tb | Dy | Ho | Er | Tm | Yb | Lu | ΣREEs |
|---|---|---|---|---|---|---|---|---|---|---|---|---|---|---|---|---|
| TUNISIA 1 | ||||||||||||||||
| Sra Ouertana | SRO1 | 59.2 | 57.8 | 11.3 | 46.8 | 9.4 | 2.5 | 10.3 | 1.6 | 9.7 | 2.2 | 6.2 | 0.9 | 5.4 | 0.8 | 224.1 |
| SRO2 | 76.6 | 48.7 | 13.2 | 56.1 | 11.5 | 3.0 | 14.0 | 2.2 | 13.8 | 3.3 | 9.5 | 1.3 | 8.5 | 1.4 | 263.0 | |
| SRO3 | 69.0 | 75.8 | 14.1 | 59.1 | 12.1 | 2.9 | 12.7 | 2.0 | 11.4 | 2.5 | 7.3 | 1.0 | 6.2 | 1.0 | 277.1 | |
| SRO4 | 31.4 | 31.2 | 6.1 | 25.5 | 5.1 | 1.3 | 5.6 | 0.9 | 5.2 | 1.2 | 3.3 | 0.5 | 2.9 | 0.5 | 120.6 | |
| SRO5 | 71.4 | 106.0 | 17.0 | 70.8 | 14.5 | 3.4 | 13.9 | 2.1 | 11.8 | 2.5 | 6.9 | 0.9 | 5.9 | 0.9 | 328.0 | |
| SRO6 | 82.0 | 93.5 | 17.3 | 71.8 | 14.8 | 3.6 | 15.1 | 2.3 | 13.6 | 3.0 | 8.4 | 1.1 | 7.2 | 1.1 | 334.8 | |
| SRO7 | 31.8 | 23.5 | 5.5 | 23.0 | 4.7 | 1.2 | 5.5 | 0.9 | 5.4 | 1.3 | 3.6 | 0.5 | 3.4 | 0.5 | 110.9 | |
| SRO8 | 213.0 | 114.0 | 34.1 | 147.0 | 29.8 | 7.7 | 37.7 | 5.9 | 36.8 | 8.8 | 25.7 | 3.6 | 22.7 | 3.7 | 690.4 | |
| SRO9 | 128.0 | 68.5 | 19.3 | 82.0 | 16.1 | 4.1 | 20.7 | 3.2 | 20.6 | 5.0 | 15.1 | 2.1 | 13.8 | 2.3 | 400.9 | |
| P-SR1 | 175.0 | 91.7 | 28.5 | 116.9 | 21.8 | 6.2 | 31.0 | 4.3 | 32.6 | 7.2 | 21.5 | 3.0 | 19.4 | 3.1 | 562.2 | |
| P-SR2 | 178.9 | 185.3 | 36.1 | 149.1 | 29.1 | 7.2 | 32.8 | 4.4 | 29.9 | 6.2 | 19.0 | 2.5 | 15.5 | 2.6 | 698.4 | |
| P-SR3 | 191.0 | 135.6 | 32.1 | 129.4 | 25.8 | 6.5 | 31.2 | 4.2 | 30.5 | 6.7 | 20.8 | 2.7 | 17.0 | 2.7 | 636.2 | |
| P-SR4 | 209.7 | 99.8 | 31.0 | 135.5 | 26.6 | 6.9 | 39.7 | 5.2 | 38.8 | 9.0 | 27.3 | 3.9 | 27.4 | 4.5 | 665.4 | |
| P-SR5 | 164.9 | 85.6 | 25.1 | 105.7 | 20.1 | 5.5 | 27.3 | 3.9 | 28.2 | 6.9 | 20.5 | 3.0 | 18.8 | 3.1 | 518.6 | |
| CC-SR1 | 249.1 | 93.3 | 34.8 | 143.1 | 26.5 | 7.3 | 35.6 | 5.8 | 43.3 | 10.5 | 29.2 | 4.4 | 31.0 | 4.8 | 718.5 | |
| CR-SR1 | 289.3 | 116.1 | 44.5 | 181.0 | 36.7 | 10.1 | 47.3 | 7.1 | 55.4 | 12.3 | 38.5 | 5.5 | 35.5 | 5.8 | 885.2 | |
| CC-SR2 | 99.0 | 83.4 | 15.3 | 62.2 | 10.8 | 2.9 | 13.6 | 2.0 | 13.1 | 2.7 | 8.4 | 1.2 | 8.1 | 1.3 | 323.8 | |
| CR-SR2 | 130.6 | 119.5 | 22.7 | 91.2 | 16.8 | 4.0 | 21.4 | 2.5 | 19.0 | 4.6 | 12.3 | 1.9 | 12.9 | 2.2 | 461.4 | |
| CC-SR3 | 140.3 | 64.8 | 17.9 | 68.7 | 13.3 | 3.8 | 15.7 | 2.6 | 18.8 | 4.9 | 14.4 | 2.3 | 15.2 | 2.4 | 385.1 | |
| CR-SR3 | 162.8 | 79.0 | 22.0 | 84.3 | 15.8 | 4.5 | 20.7 | 3.0 | 23.7 | 6.1 | 16.9 | 2.4 | 19.7 | 2.6 | 463.3 | |
| CC-SR4 | 305.4 | 108.0 | 38.9 | 173.4 | 34.9 | 8.9 | 56.2 | 7.4 | 54.7 | 12.1 | 37.8 | 5.5 | 40.5 | 6.9 | 890.4 | |
| CR-SR4 | 311.9 | 113.0 | 42.9 | 185.2 | 39.3 | 9.5 | 62.8 | 8.1 | 61.0 | 13.3 | 41.5 | 6.5 | 46.8 | 7.4 | 949.1 | |
| CC-SR5 | 59.2 | 32.8 | 7.6 | 32.0 | 6.8 | 1.5 | 9.1 | 1.2 | 8.5 | 2.0 | 5.7 | 0.9 | 6.9 | 1.2 | 175.3 | |
| CR-SR5 | 82.1 | 38.6 | 9.3 | 40.4 | 8.1 | 2.0 | 11.3 | 1.4 | 10.7 | 2.3 | 8.2 | 1.1 | 8.8 | 1.5 | 225.7 | |
| Sekarna | SEK1 | 184.0 | 195.0 | 38.9 | 167.0 | 34.7 | 8.3 | 37.0 | 5.6 | 32.5 | 7.1 | 19.6 | 2.6 | 15.8 | 2.4 | 750.4 |
| SEK3 | 186.0 | 213.0 | 41.9 | 182.0 | 37.6 | 9.0 | 40.1 | 6.0 | 34.5 | 7.5 | 20.8 | 2.7 | 16.1 | 2.5 | 799.6 | |
| SEK4 | 155.0 | 152.0 | 30.5 | 130.0 | 26.2 | 6.4 | 29.0 | 4.4 | 25.5 | 5.7 | 15.9 | 2.1 | 12.8 | 2.0 | 597.5 | |
| Jebel Jebs | JBS4 | 57.2 | 76.7 | 11.8 | 49.2 | 9.8 | 2.4 | 9.8 | 1.5 | 8.6 | 1.9 | 5.3 | 0.7 | 4.6 | 0.7 | 240.2 |
| JBS5 | 87.5 | 116.0 | 18.2 | 75.9 | 14.8 | 3.5 | 14.7 | 2.2 | 12.9 | 2.8 | 7.8 | 1.0 | 6.5 | 1.0 | 364.8 | |
| JBS10 | 65.8 | 96.7 | 14.6 | 60.0 | 11.6 | 2.7 | 11.0 | 1.7 | 9.4 | 2.0 | 5.6 | 0.8 | 4.7 | 0.7 | 287.3 | |
| JBS7 | 51.3 | 76.6 | 11.4 | 47.4 | 9.3 | 2.2 | 8.9 | 1.4 | 7.7 | 1.6 | 4.4 | 0.6 | 3.8 | 0.6 | 227.2 | |
| JBS14 | 221.0 | 354.0 | 52.4 | 215.0 | 43.0 | 9.8 | 39.2 | 5.9 | 32.6 | 6.8 | 18.5 | 2.5 | 15.4 | 2.3 | 1018.3 | |
| JBS18 | 213.0 | 335.0 | 49.3 | 204.0 | 40.2 | 9.2 | 36.9 | 5.6 | 31.1 | 6.4 | 17.8 | 2.4 | 15.2 | 2.3 | 968.4 | |
| JBS19 | 203.0 | 331.0 | 47.7 | 198.0 | 38.7 | 8.8 | 34.6 | 5.2 | 28.6 | 5.9 | 16.0 | 2.1 | 13.1 | 2.0 | 934.7 | |
| P-JBS1 | 111.2 | 155.7 | 22.0 | 82.4 | 14.4 | 3.6 | 14.7 | 2.2 | 14.0 | 2.8 | 8.7 | 1.2 | 7.1 | 1.2 | 441.0 | |
| P-JBS2 | 121.4 | 148.7 | 24.2 | 99.0 | 19.7 | 4.7 | 19.0 | 2.8 | 17.5 | 3.8 | 10.9 | 1.5 | 10.1 | 1.5 | 484.6 | |
| P-JBS3 | 137.4 | 197.0 | 29.2 | 118.6 | 22.2 | 5.6 | 20.2 | 3.1 | 21.2 | 4.3 | 12.1 | 1.8 | 10.8 | 1.8 | 585.2 | |
| P-JBS4 | 186.0 | 216.3 | 34.6 | 138.7 | 21.4 | 5.4 | 27.7 | 3.4 | 25.2 | 6.8 | 15.6 | 2.5 | 14.8 | 2.6 | 701.2 | |
| P-JBS5 | 155.4 | 230.3 | 37.4 | 151.2 | 28.6 | 6.8 | 28.1 | 3.7 | 24.4 | 4.6 | 15.9 | 2.0 | 12.6 | 2.0 | 702.9 | |
| CC-JBS1 | 94.8 | 134.8 | 20.2 | 87.6 | 17.2 | 3.1 | 14.1 | 2.1 | 14.1 | 3.0 | 8.2 | 1.1 | 6.8 | 0.8 | 407.8 | |
| CR-JBS1 | 102.8 | 144.0 | 22.0 | 85.4 | 18.6 | 3.5 | 16.7 | 2.4 | 15.6 | 3.1 | 8.2 | 1.1 | 6.8 | 1.2 | 431.3 | |
| CC-JBS2 | 177.3 | 169.2 | 28.8 | 109.0 | 20.3 | 4.5 | 22.8 | 3.6 | 21.4 | 4.7 | 15.7 | 2.1 | 14.4 | 2.2 | 595.7 | |
| CR-JBS2 | 227.9 | 272.5 | 40.5 | 170.6 | 30.7 | 7.1 | 33.1 | 4.4 | 28.8 | 6.1 | 19.2 | 2.4 | 15.3 | 2.4 | 861.0 | |
| CC-JBS4 | 119.4 | 162.1 | 23.0 | 93.2 | 18.2 | 3.8 | 18.2 | 2.2 | 16.2 | 3.2 | 8.9 | 1.5 | 7.9 | 1.3 | 479.0 | |
| CR-JBS4 | 137.5 | 189.5 | 27.8 | 110.9 | 22.0 | 5.1 | 21.9 | 3.1 | 18.4 | 3.9 | 10.8 | 1.5 | 9.1 | 1.6 | 562.9 | |
| CC-JBS5 | 105.0 | 129.7 | 19.0 | 69.3 | 12.4 | 3.0 | 11.3 | 1.7 | 11.8 | 2.5 | 7.0 | 1.2 | 6.1 | 1.0 | 380.8 | |
| CR-JBS5 | 122.3 | 154.1 | 26.9 | 98.3 | 19.2 | 4.4 | 18.0 | 2.6 | 16.3 | 3.4 | 9.5 | 1.3 | 10.3 | 1.6 | 488.0 | |
| Naguess | NAGI | 111.0 | 180.0 | 24.9 | 103.0 | 20.3 | 4.6 | 19.2 | 2.9 | 16.6 | 3.6 | 10.1 | 1.4 | 9.1 | 1.5 | 508.1 |
| NAGIIa | 86.6 | 120.0 | 18.0 | 74.1 | 14.8 | 3.4 | 14.7 | 2.3 | 13.3 | 3.0 | 8.5 | 1.2 | 8.0 | 1.3 | 369.1 | |
| NAGIIb | 93.6 | 122.0 | 19.2 | 79.3 | 16.0 | 3.7 | 16.2 | 2.5 | 14.9 | 3.4 | 9.7 | 1.4 | 8.9 | 1.5 | 392.2 | |
| NAGIII | 110.0 | 168.0 | 24.4 | 101.0 | 20.5 | 4.7 | 19.8 | 3.1 | 17.6 | 3.8 | 10.9 | 1.5 | 9.9 | 1.6 | 496.7 | |
| NAGIV | 75.9 | 108.0 | 15.7 | 64.3 | 12.6 | 2.9 | 12.3 | 1.9 | 11.2 | 2.5 | 7.4 | 1.0 | 6.9 | 1.1 | 323.7 | |
| NAGV | 55.1 | 59.3 | 9.8 | 39.2 | 7.5 | 1.7 | 8.2 | 1.3 | 7.9 | 1.9 | 5.6 | 0.8 | 5.4 | 0.9 | 204.6 | |
| NAGVI | 60.6 | 82.3 | 12.0 | 49.4 | 9.8 | 2.2 | 9.9 | 1.5 | 9.2 | 2.1 | 6.1 | 0.9 | 5.8 | 0.9 | 252.8 | |
| NAGVII | 52.5 | 65.5 | 10.0 | 41.6 | 8.4 | 2.0 | 9.0 | 1.4 | 8.9 | 2.1 | 6.3 | 0.9 | 6.0 | 1.0 | 215.5 | |
| Central Kef Eddour | KECI | 108.0 | 164.0 | 23.5 | 96.5 | 18.9 | 4.3 | 18.4 | 2.8 | 16.1 | 3.5 | 10.1 | 1.4 | 9.2 | 1.5 | 478.2 |
| KECII | 91.8 | 133.0 | 19.4 | 80.2 | 15.8 | 3.7 | 15.7 | 2.4 | 14.0 | 3.1 | 8.9 | 1.3 | 8.3 | 1.3 | 398.9 | |
| KECIII | 80.3 | 130.0 | 17.9 | 73.5 | 14.4 | 3.3 | 13.5 | 2.1 | 11.8 | 2.5 | 7.3 | 1.0 | 6.7 | 1.0 | 365.3 | |
| KECIV | 76.4 | 108.0 | 15.4 | 63.2 | 11.9 | 2.7 | 11.6 | 1.8 | 10.4 | 2.3 | 6.7 | 1.0 | 6.4 | 1.0 | 318.8 | |
| KECV | 68.8 | 92.1 | 13.9 | 56.4 | 11.1 | 2.6 | 11.1 | 1.8 | 10.4 | 2.3 | 6.9 | 1.0 | 6.7 | 1.1 | 286.1 | |
| KECVI | 79.9 | 117.0 | 17.0 | 69.5 | 13.9 | 3.2 | 14.0 | 2.2 | 12.8 | 2.8 | 8.2 | 1.2 | 7.8 | 1.2 | 350.7 | |
| KECVII | 50.4 | 60.5 | 8.8 | 35.6 | 6.7 | 1.6 | 7.4 | 1.2 | 7.4 | 1.8 | 5.7 | 0.8 | 5.7 | 1.0 | 194.6 | |
| KECVIII | 45.1 | 49.3 | 7.8 | 32.0 | 6.2 | 1.5 | 6.8 | 1.1 | 6.9 | 1.7 | 5.3 | 0.8 | 5.2 | 0.9 | 170.5 | |
| Table Metlaoui | TMI | 118.0 | 197.0 | 27.2 | 112.0 | 22.2 | 5.0 | 20.5 | 3.1 | 17.4 | 3.7 | 10.3 | 1.4 | 9.3 | 1.5 | 548.6 |
| TMII | 86.5 | 124.0 | 18.5 | 76.3 | 14.8 | 3.5 | 14.4 | 2.2 | 13.0 | 2.8 | 8.2 | 1.1 | 7.5 | 1.2 | 374.0 | |
| TMIII | 79.8 | 129.0 | 17.9 | 73.5 | 14.5 | 3.3 | 13.5 | 2.0 | 11.7 | 2.5 | 7.1 | 1.0 | 6.6 | 1.0 | 363.4 | |
| TMIV | 67.9 | 96.4 | 13.7 | 55.8 | 10.7 | 2.4 | 10.3 | 1.6 | 9.3 | 2.0 | 5.9 | 0.8 | 5.6 | 0.9 | 283.3 | |
| TMV | 76.4 | 97.1 | 15.0 | 61.3 | 12.1 | 2.7 | 12.0 | 1.9 | 11.3 | 2.6 | 7.6 | 1.1 | 7.3 | 1.2 | 309.6 | |
| TMVI | 83.0 | 125.0 | 18.3 | 74.7 | 15.3 | 3.5 | 14.8 | 2.3 | 13.4 | 2.9 | 8.3 | 1.2 | 7.8 | 1.2 | 371.6 | |
| TMVIIa | 49.7 | 50.6 | 8.0 | 32.6 | 6.1 | 1.5 | 7.0 | 1.1 | 7.2 | 1.8 | 5.7 | 0.8 | 5.6 | 0.9 | 178.7 | |
| TMVIII | 46.1 | 51.2 | 7.9 | 32.8 | 6.3 | 1.5 | 6.9 | 1.1 | 7.0 | 1.7 | 5.3 | 0.8 | 5.2 | 0.9 | 174.7 | |
| Mzinda | MZ0 | 55.2 | 95.4 | 12.4 | 49.4 | 9.4 | 2.2 | 8.4 | 1.3 | 7.0 | 1.5 | 4.1 | 0.6 | 3.6 | 0.5 | 251.0 |
| MZI> | 73.7 | 118.0 | 16.2 | 65.6 | 12.5 | 2.9 | 11.6 | 1.7 | 9.8 | 2.1 | 5.8 | 0.8 | 5.1 | 0.8 | 326.6 | |
| MZI< | 78.0 | 120.0 | 16.8 | 68.6 | 13.0 | 3.0 | 12.1 | 1.8 | 10.4 | 2.2 | 6.3 | 0.9 | 5.8 | 0.9 | 339.7 | |
| MZH1 | 78.6 | 122.0 | 16.5 | 67.4 | 12.8 | 2.9 | 11.8 | 1.8 | 10.3 | 2.2 | 6.3 | 0.9 | 5.7 | 0.9 | 340.0 | |
| MZH2 | 78.5 | 113.0 | 15.5 | 62.7 | 11.7 | 2.7 | 11.4 | 1.7 | 10.0 | 2.2 | 6.4 | 0.9 | 5.9 | 0.9 | 323.5 | |
| MZII> | 78.4 | 117.0 | 16.5 | 66.2 | 12.8 | 2.9 | 12.2 | 1.9 | 10.8 | 2.3 | 6.7 | 0.9 | 6.2 | 1.0 | 335.8 | |
| MZII< | 65.6 | 80.1 | 12.0 | 48.5 | 9.4 | 2.2 | 10.1 | 1.6 | 9.7 | 2.3 | 6.9 | 1.0 | 6.6 | 1.1 | 257.1 | |
| MZIII | 40.1 | 46.1 | 7.0 | 28.5 | 5.2 | 1.3 | 5.6 | 0.9 | 5.5 | 1.3 | 4.1 | 0.6 | 3.9 | 0.7 | 150.7 | |
| Jellabia | JLA0 | 66.3 | 116.0 | 15.6 | 63.3 | 12.2 | 2.8 | 10.8 | 1.6 | 8.9 | 1.8 | 5.1 | 0.7 | 4.4 | 0.7 | 310.1 |
| JLAI | 74.5 | 115.0 | 16.5 | 66.7 | 12.8 | 2.9 | 11.9 | 1.8 | 10.3 | 2.2 | 6.3 | 0.9 | 5.7 | 0.9 | 328.4 | |
| JLAH1 | 78.3 | 126.0 | 16.5 | 66.4 | 12.5 | 2.8 | 11.4 | 1.7 | 9.8 | 2.1 | 5.8 | 0.8 | 5.4 | 0.8 | 340.3 | |
| JLAH2 | 104.0 | 158.0 | 21.7 | 87.2 | 16.6 | 3.8 | 15.6 | 2.4 | 13.4 | 2.8 | 8.2 | 1.2 | 7.4 | 1.1 | 443.4 | |
| JLAII> | 100.0 | 153.0 | 21.4 | 85.8 | 16.3 | 3.7 | 15.5 | 2.4 | 13.6 | 2.9 | 8.4 | 1.2 | 7.8 | 1.2 | 433.2 | |
| JLII< | 73.5 | 94.1 | 13.8 | 55.1 | 10.6 | 2.5 | 11.0 | 1.7 | 10.5 | 2.4 | 7.3 | 1.1 | 7.0 | 1.1 | 291.6 | |
| JLAIII | 46.3 | 55.0 | 8.2 | 32.7 | 6.1 | 1.5 | 6.5 | 1.0 | 6.2 | 1.5 | 4.5 | 0.7 | 4.3 | 0.7 | 175.1 | |
| Gafsa Metlaoui | P-MZ2 SUP | 61.5 | 87.6 | 12.2 | 51.0 | 9.9 | 2.0 | 9.0 | 1.2 | 8.5 | 1.6 | 5.3 | 0.7 | 4.6 | 0.8 | 256.0 |
| P-MZ2 INF | 28.1 | 32.2 | 4.7 | 18.5 | 3.6 | 0.7 | 3.6 | 0.6 | 3.7 | 0.8 | 3.0 | 0.4 | 2.8 | 0.5 | 103.1 | |
| P-KEC3 | 72.0 | 94.2 | 13.0 | 53.8 | 9.4 | 2.1 | 9.3 | 1.3 | 8.9 | 2.0 | 5.9 | 0.8 | 6.3 | 1.0 | 279.9 | |
| P-NAG4 | 56.2 | 88.3 | 11.6 | 48.5 | 8.0 | 1.9 | 7.7 | 1.1 | 7.0 | 1.5 | 4.2 | 0.6 | 4.2 | 0.7 | 241.4 | |
| P-NAG5 | 38.6 | 37.8 | 6.5 | 25.7 | 4.6 | 1.2 | 4.8 | 0.8 | 4.8 | 1.3 | 4.3 | 0.5 | 3.3 | 0.6 | 134.8 | |
| P-MZ3 | 77.4 | 104.9 | 15.8 | 63.4 | 11.9 | 2.6 | 12.4 | 1.6 | 10.6 | 2.3 | 7.4 | 1.1 | 6.6 | 1.1 | 319.0 | |
| CC-KEC3 | 51.9 | 45.8 | 7.1 | 31.0 | 4.8 | 1.3 | 5.6 | 0.8 | 5.5 | 1.4 | 4.1 | 0.7 | 4.4 | 0.7 | 165.2 | |
| CR-KEC3 | 65.8 | 61.2 | 10.1 | 40.1 | 6.1 | 1.6 | 8.6 | 1.2 | 8.1 | 1.8 | 6.3 | 1.0 | 6.0 | 1.1 | 219.0 | |
| CC-NAG5 | 14.5 | 15.6 | 2.2 | 8.1 | 1.6 | 0.4 | 1.5 | 0.2 | 2.4 | 0.4 | 1.4 | 0.2 | 1.4 | 0.3 | 50.4 | |
| CR-NAG5 | 16.0 | 16.8 | 2.6 | 9.3 | 2.1 | 0.4 | 2.0 | 0.2 | 2.0 | 0.6 | 1.5 | 0.3 | 1.3 | 0.3 | 55.1 | |
| CC-MZ3 | 19.1 | 16.3 | 2.7 | 11.2 | 1.7 | 0.5 | 1.9 | 0.3 | 2.9 | 0.6 | 1.9 | 0.2 | 1.7 | 0.3 | 61.1 | |
| CR-MZ3 | 16.5 | 20.0 | 2.7 | 11.8 | 2.2 | 0.6 | 2.2 | 0.3 | 2.5 | 0.5 | 1.7 | 0.2 | 1.5 | 0.3 | 62.8 | |
| P-ME1 (1) | 91.1 | 132.4 | 18.2 | 76.7 | 15.7 | 3.0 | 13.5 | 1.9 | 13.1 | 2.3 | 8.2 | 1.0 | 6.4 | 1.0 | 384.5 | |
| P-ME1 (2) | 94.1 | 147.4 | 13.7 | 72.6 | 10.2 | 2.4 | 13.0 | 1.6 | 8.8 | 1.8 | 5.5 | 0.7 | 4.8 | 0.7 | 377.1 | |
| P-ME2 (1) | 31.6 | 29.5 | 4.8 | 18.4 | 3.9 | 0.7 | 3.9 | 0.7 | 4.7 | 1.1 | 4.2 | 0.5 | 3.8 | 0.6 | 108.1 | |
| P-ME2 (2) | 18.5 | 23.1 | 3.5 | 14.3 | 2.6 | 0.6 | 3.5 | 0.4 | 2.7 | 0.6 | 1.9 | 0.3 | 1.8 | 0.3 | 74.3 | |
| P-ME3 (1) | 33.7 | 31.8 | 5.5 | 21.6 | 3.6 | 0.8 | 3.3 | 0.6 | 3.9 | 1.2 | 3.9 | 0.4 | 3.6 | 0.5 | 114.1 | |
| P-ME3 (2) | 37.5 | 42.2 | 6.5 | 26.7 | 4.7 | 1.2 | 6.7 | 0.9 | 5.1 | 1.2 | 3.9 | 0.6 | 3.6 | 0.6 | 141.4 | |
| C-ME1 (1) | 20.6 | 27.4 | 3.7 | 15.2 | 2.8 | 0.7 | 2.8 | 0.4 | 3.1 | 0.5 | 1.8 | 0.2 | 1.6 | 0.3 | 81.0 | |
| C-ME1 (2) | 18.8 | 29.7 | 4.0 | 16.1 | 2.9 | 0.8 | 3.8 | 0.5 | 2.6 | 0.5 | 1.6 | 0.2 | 1.5 | 0.2 | 83.2 | |
| C-ME2 (1) | 16.3 | 17.6 | 2.4 | 9.1 | 1.8 | 0.5 | 1.7 | 0.3 | 1.6 | 0.5 | 1.6 | 0.3 | 1.6 | 0.3 | 55.5 | |
| C-ME2 (2) | 15.0 | 18.4 | 2.6 | 10.7 | 1.9 | 0.5 | 2.6 | 0.3 | 2.0 | 0.5 | 1.4 | 0.2 | 1.3 | 0.2 | 57.7 | |
| C-ME3 (1) | 11.9 | 12.5 | 1.9 | 6.9 | 1.6 | 0.3 | 1.5 | 0.2 | 1.5 | 0.4 | 1.1 | 0.2 | 1.0 | 0.2 | 41.1 | |
| C-ME3 (2) | 11.8 | 15.1 | 2.1 | 8.5 | 1.5 | 0.4 | 2.0 | 0.3 | 1.5 | 0.4 | 1.1 | 0.2 | 1.0 | 0.2 | 45.9 | |
| Alima Mount | ZT-2c | 43.7 | 63.8 | 9.0 | 38.4 | 7.2 | 1.9 | 7.0 | 1.0 | 6.3 | 1.3 | 3.8 | 0.5 | 3.5 | 0.5 | 187.8 |
| ZT-2s | 21.0 | 27.4 | 3.3 | 13.2 | 2.1 | 0.6 | 2.8 | 0.4 | 2.5 | 0.6 | 1.8 | 0.3 | 1.7 | 0.3 | 77.9 | |
| ZT-3c | 37.0 | 60.0 | 7.6 | 31.4 | 5.7 | 1.5 | 5.7 | 0.8 | 5.0 | 1.0 | 2.9 | 0.4 | 2.6 | 0.4 | 162.0 | |
| ZT-4s | 20.8 | 29.0 | 3.9 | 15.8 | 2.8 | 0.7 | 3.0 | 0.4 | 2.8 | 0.6 | 1.9 | 0.3 | 1.9 | 0.3 | 84.3 | |
| ZT-6s | 24.6 | 38.8 | 5.1 | 19.3 | 3.5 | 1.0 | 3.4 | 0.5 | 3.3 | 0.7 | 2.0 | 0.3 | 2.1 | 0.3 | 104.8 | |
| ZT-7c | 29.3 | 49.0 | 6.0 | 23.7 | 4.3 | 1.2 | 4.4 | 0.6 | 3.9 | 0.9 | 2.6 | 0.4 | 2.5 | 0.4 | 129.0 | |
| ZT-10c | 22.1 | 32.0 | 4.3 | 18.4 | 3.3 | 0.9 | 3.6 | 0.5 | 3.3 | 0.7 | 2.2 | 0.3 | 2.1 | 0.3 | 94.1 | |
| ZT-11c | 15.0 | 18.2 | 2.4 | 10.2 | 1.8 | 0.5 | 2.0 | 0.3 | 2.0 | 0.5 | 1.6 | 0.2 | 1.5 | 0.3 | 56.4 | |
| Chouabine Formation | CAC-4s | 7.9 | 9.1 | 1.2 | 4.5 | 0.8 | 0.2 | 0.9 | 0.1 | 0.8 | 0.2 | 0.6 | 0.1 | 0.6 | 0.1 | 26.9 |
| CAC-5s | 13.3 | 18.6 | 2.4 | 9.6 | 1.7 | 0.4 | 1.7 | 0.3 | 1.7 | 0.4 | 1.1 | 0.2 | 1.1 | 0.2 | 52.5 | |
| CAC-6 s | 7.8 | 12.4 | 1.4 | 6.0 | 1.0 | 0.3 | 1.0 | 0.1 | 0.9 | 0.2 | 0.6 | 0.1 | 0.6 | 0.1 | 32.4 | |
| CAC-7c | 15.1 | 24.4 | 2.9 | 11.0 | 2.0 | 0.5 | 2.1 | 0.3 | 1.8 | 0.4 | 1.1 | 0.2 | 1.2 | 0.2 | 63.1 | |
| CAC-8As | 35.4 | 48.1 | 5.2 | 19.2 | 3.0 | 0.8 | 3.2 | 0.5 | 3.1 | 0.7 | 2.2 | 0.3 | 2.1 | 0.3 | 124.1 | |
| CAC-9c | 21.8 | 27.7 | 3.4 | 12.7 | 2.4 | 0.6 | 2.2 | 0.3 | 2.2 | 0.5 | 1.6 | 0.2 | 1.6 | 0.3 | 77.5 | |
| CAC-13 s | 30.7 | 39.5 | 4.2 | 15.7 | 2.4 | 0.8 | 2.8 | 0.4 | 2.5 | 0.5 | 1.6 | 0.2 | 1.5 | 0.2 | 103.0 | |
| ALGERIA 2 | ||||||||||||||||
| Djebel El Kouif | K_1 | 127.4 | 123.8 | 22.2 | 96.3 | 18.3 | 4.8 | 21.7 | 3.1 | 20.9 | 4.7 | 14.3 | 2.0 | 11.0 | 2.1 | 472.4 |
| K_2 | 113.8 | 112.5 | 20.1 | 88.1 | 16.7 | 4.3 | 19.7 | 2.8 | 19.1 | 4.2 | 12.9 | 1.8 | 9.8 | 1.9 | 427.9 | |
| K_3 | 115.9 | 104.3 | 19.7 | 86.5 | 16.5 | 4.3 | 19.9 | 2.8 | 19.4 | 4.3 | 13.4 | 1.9 | 10.5 | 2.0 | 421.3 | |
| K_4 | 88.8 | 72.7 | 14.4 | 62.9 | 11.8 | 3.1 | 14.9 | 2.1 | 14.7 | 3.3 | 10.3 | 1.4 | 8.0 | 1.6 | 310.0 | |
| K_5 | 21.1 | 14.7 | 3.3 | 13.3 | 2.5 | 0.7 | 3.2 | 0.5 | 3.2 | 0.8 | 2.2 | 0.3 | 2.2 | 0.4 | 68.4 | |
| K_6 | 95.1 | 40.0 | 12.5 | 55.7 | 10.5 | 2.9 | 15.1 | 2.2 | 16.0 | 3.8 | 12.4 | 1.8 | 10.1 | 2.0 | 280.1 | |
| K_7 | 150.9 | 61.8 | 21.6 | 93.0 | 18.1 | 5.0 | 26.1 | 3.7 | 27.0 | 6.4 | 20.5 | 2.9 | 16.2 | 3.2 | 456.5 | |
| K_8 | 74.3 | 32.5 | 9.1 | 40.7 | 7.6 | 2.1 | 11.6 | 1.7 | 12.6 | 3.1 | 10.1 | 1.4 | 8.2 | 1.7 | 216.5 | |
| K_9 | 58.2 | 24.0 | 7.0 | 31.1 | 5.9 | 1.6 | 8.9 | 1.2 | 9.1 | 2.2 | 7.2 | 1.0 | 5.4 | 1.1 | 163.7 | |
| K_10a | 100.2 | 40.8 | 13.5 | 57.8 | 10.5 | 3.1 | 16.6 | 2.4 | 17.2 | 4.4 | 12.9 | 1.8 | 12.1 | 2.0 | 295.2 | |
| ra_20 | 164.0 | 163.0 | 28.6 | 121.0 | 21.2 | 5.3 | 25.9 | 3.3 | 21.4 | 4.8 | 13.7 | 1.8 | 11.3 | 1.8 | 587.1 | |
| ra_21 | 177.0 | 170.0 | 30.0 | 127.0 | 22.5 | 5.5 | 28.2 | 3.5 | 23.4 | 5.1 | 14.4 | 2.1 | 12.6 | 1.9 | 623.1 | |
| ra_14 | 138.0 | 164.0 | 26.7 | 113.0 | 21.0 | 5.0 | 22.9 | 3.0 | 19.5 | 4.2 | 11.9 | 1.6 | 10.1 | 1.5 | 542.5 | |
| rc_5 | 184.0 | 186.0 | 32.4 | 136.0 | 23.9 | 6.1 | 26.6 | 3.4 | 22.8 | 4.9 | 13.1 | 1.8 | 11.0 | 1.6 | 653.7 | |
| rc_16 | 389.0 | 555.0 | 92.1 | 391.0 | 75.9 | 18.1 | 80.4 | 10.5 | 64.4 | 13.1 | 33.7 | 4.5 | 28.0 | 3.8 | 1759.4 | |
| rc_26 | 235.0 | 329.0 | 52.6 | 226.0 | 42.6 | 10.3 | 45.8 | 5.6 | 33.5 | 7.0 | 18.5 | 2.3 | 14.5 | 2.0 | 1024.7 | |
| Djebel Dyr | D_1 | 62.6 | 62.4 | 9.5 | 40.6 | 7.4 | 1.9 | 9.0 | 1.3 | 8.8 | 2.0 | 6.3 | 0.9 | 5.1 | 1.0 | 218.6 |
| D_2 | 42.1 | 55.4 | 8.3 | 35.8 | 6.9 | 1.7 | 7.4 | 1.1 | 6.9 | 1.5 | 4.3 | 0.6 | 3.3 | 0.6 | 175.8 | |
| D_3 | 45.8 | 42.4 | 6.8 | 29.0 | 5.3 | 1.4 | 6.3 | 0.9 | 6.1 | 1.4 | 4.5 | 0.6 | 3.7 | 0.7 | 154.9 | |
| D_4 | 60.5 | 49.7 | 9.7 | 42.3 | 8.1 | 2.1 | 10.1 | 1.4 | 10.0 | 2.3 | 7.2 | 1.0 | 5.7 | 1.1 | 211.2 | |
| D_5 | 82.6 | 67.1 | 13.7 | 60.3 | 11.7 | 3.2 | 14.6 | 2.1 | 14.3 | 3.2 | 10.0 | 1.4 | 7.7 | 1.5 | 293.4 | |
| D_6 | 95.0 | 45.6 | 13.4 | 59.7 | 11.5 | 3.1 | 15.9 | 2.3 | 16.4 | 3.8 | 12.2 | 1.7 | 9.9 | 2.0 | 292.5 | |
| D_7 | 66.1 | 32.5 | 9.2 | 41.0 | 7.7 | 2.1 | 10.8 | 1.5 | 11.0 | 2.6 | 8.3 | 1.2 | 6.7 | 1.3 | 202.1 | |
| D_8 | 65.3 | 36.1 | 10.6 | 45.8 | 8.6 | 2.5 | 12.6 | 1.8 | 12.5 | 3.0 | 8.6 | 1.2 | 8.0 | 1.3 | 218.1 | |
| D_9 | 100.8 | 42.6 | 12.6 | 56.9 | 10.7 | 2.9 | 15.9 | 2.2 | 16.1 | 3.8 | 12.2 | 1.6 | 9.2 | 1.8 | 289.2 | |
| D_10 | 46.1 | 17.2 | 5.5 | 24.2 | 4.4 | 1.2 | 6.7 | 0.9 | 6.8 | 1.6 | 5.2 | 0.7 | 4.0 | 0.8 | 125.4 | |
| Djebel Tazbant | T_1 | 82.2 | 35.8 | 10.8 | 48.3 | 9.2 | 2.5 | 13.1 | 1.8 | 13.5 | 3.2 | 10.2 | 1.4 | 8.2 | 1.6 | 241.8 |
| T_2 | 71.0 | 24.4 | 9.6 | 42.8 | 8.2 | 2.3 | 12.2 | 1.7 | 12.4 | 2.9 | 9.2 | 1.3 | 7.1 | 1.4 | 206.4 | |
| T_3 | 51.3 | 23.6 | 6.9 | 30.8 | 5.9 | 1.6 | 8.5 | 1.2 | 8.3 | 1.9 | 6.0 | 0.8 | 4.3 | 0.9 | 151.8 | |
| T_4 | 79.2 | 28.2 | 11.3 | 49.3 | 9.3 | 2.7 | 14.4 | 2.1 | 14.6 | 3.6 | 10.3 | 1.4 | 9.3 | 1.5 | 237.2 | |
| Djebel Onk | S_1 | 156.7 | 223.8 | 36.5 | 157.2 | 26.4 | 6.5 | 27.3 | 3.7 | 23.6 | 4.9 | 14.4 | 1.9 | 10.3 | 1.9 | 695.0 |
| S_2 | 199.2 | 295.0 | 47.9 | 207.3 | 35.0 | 8.6 | 35.4 | 4.9 | 30.7 | 6.3 | 18.2 | 2.4 | 13.1 | 2.4 | 906.4 | |
| S _3 | 165.4 | 238.6 | 39.1 | 169.5 | 28.3 | 7.0 | 29.2 | 4.0 | 25.3 | 5.2 | 15.1 | 2.0 | 10.8 | 2.0 | 741.4 | |
| S _4 | 133.8 | 191.1 | 31.0 | 118.4 | 22.5 | 5.5 | 23.0 | 3.2 | 19.8 | 4.1 | 11.9 | 1.6 | 8.4 | 1.6 | 575.6 | |
| S _5 | 145.7 | 208.5 | 33.9 | 146.3 | 24.4 | 6.0 | 25.3 | 3.5 | 21.6 | 4.5 | 13.0 | 1.7 | 9.3 | 1.7 | 645.2 | |
| S _6 | 64.6 | 21.6 | 7.5 | 33.3 | 6.1 | 1.7 | 9.5 | 1.3 | 9.9 | 2.5 | 7.9 | 1.1 | 6.2 | 1.2 | 174.4 | |
| Kef Essenoun | ra_12 | 75.6 | 43.9 | 9.0 | 37.1 | 6.2 | 1.6 | 8.7 | 1.2 | 9.5 | 2.3 | 7.1 | 1.1 | 7.7 | 1.3 | 212.3 |
| rc_24 | 106.0 | 136.0 | 20.1 | 83.5 | 15.8 | 3.6 | 16.4 | 2.1 | 14.8 | 3.1 | 9.1 | 1.4 | 9.4 | 1.4 | 422.7 | |
| rc_2 | 31.2 | 40.1 | 6.1 | 25.1 | 5.0 | 1.1 | 4.7 | 0.7 | 4.3 | 0.9 | 2.5 | 0.4 | 2.5 | 0.4 | 125.0 | |
| rd_7 | 12.2 | 8.8 | 1.7 | 6.7 | 1.2 | 0.2 | 1.9 | 0.3 | 1.5 | 0.5 | 1.6 | 0.3 | 1.4 | 0.3 | 38.6 | |
| rd_6 | 28.7 | 24.0 | 5.1 | 21.3 | 4.7 | 1.1 | 5.6 | 0.7 | 4.9 | 1.1 | 3.2 | 0.5 | 2.9 | 0.4 | 104.1 | |
| MOROCCO 3 | ||||||||||||||||
| Sidi Chennane | SC-1a | 25.4 | 8.9 | 2.9 | 12.5 | 2.4 | 0.7 | 3.9 | 0.5 | 4.4 | 1.2 | 3.8 | 0.6 | 4.3 | 0.7 | 72.2 |
| SC-1b | 26.5 | 9.2 | 3.0 | 12.0 | 2.1 | 0.7 | 3.5 | 0.5 | 4.5 | 1.2 | 4.1 | 0.6 | 4.2 | 0.7 | 72.9 | |
| SC-2a | 20.7 | 6.7 | 2.2 | 10.0 | 1.7 | 0.5 | 2.9 | 0.4 | 3.5 | 1.0 | 3.1 | 0.5 | 3.7 | 0.7 | 57.6 | |
| SC-2b | 27.8 | 9.7 | 3.5 | 15.4 | 2.8 | 0.8 | 4.5 | 0.6 | 5.0 | 1.4 | 4.4 | 0.7 | 5.2 | 0.9 | 82.7 | |
| SC-3a | 39.6 | 10.0 | 4.9 | 21.6 | 4.1 | 1.2 | 6.2 | 0.9 | 7.3 | 2.0 | 6.3 | 1.0 | 7.1 | 1.2 | 113.3 | |
| SC-3b | 37.4 | 9.1 | 4.4 | 18.8 | 3.6 | 1.0 | 5.7 | 0.8 | 6.9 | 1.8 | 6.2 | 1.0 | 7.1 | 1.2 | 105.0 | |
| SC-6a | 25.2 | 5.7 | 2.8 | 11.7 | 2.2 | 0.6 | 3.6 | 0.5 | 4.4 | 1.2 | 4.1 | 0.6 | 4.8 | 0.8 | 68.2 | |
| SC-6b | 25.0 | 6.0 | 3.0 | 12.6 | 2.3 | 0.7 | 3.8 | 0.5 | 4.5 | 1.2 | 4.1 | 0.6 | 4.9 | 0.8 | 70.0 | |
| SC-6c | 29.6 | 7.3 | 3.6 | 14.9 | 2.8 | 0.9 | 4.5 | 0.6 | 5.2 | 1.4 | 4.6 | 0.7 | 5.1 | 0.9 | 82.2 | |
| SC-8a | 37.9 | 10.4 | 4.8 | 20.5 | 3.8 | 1.1 | 6.4 | 0.9 | 7.3 | 1.9 | 6.4 | 1.0 | 7.7 | 1.3 | 111.2 | |
| SC-8b | 61.3 | 16.7 | 7.8 | 33.7 | 6.5 | 1.8 | 10.5 | 1.4 | 11.4 | 2.9 | 9.8 | 1.4 | 10.5 | 1.8 | 177.6 | |
| SC-8c | 33.1 | 9.5 | 4.3 | 18.6 | 3.6 | 1.0 | 5.7 | 0.8 | 6.6 | 1.7 | 5.8 | 0.9 | 6.5 | 1.1 | 99.3 | |
| SC-9a | 28.6 | 9.3 | 3.8 | 16.6 | 3.0 | 0.9 | 5.0 | 0.7 | 5.4 | 1.4 | 4.6 | 0.7 | 5.6 | 0.0 | 85.6 | |
| SC-9b | 27.9 | 9.0 | 3.6 | 15.7 | 3.0 | 0.8 | 4.8 | 0.7 | 5.2 | 1.4 | 4.6 | 0.7 | 5.3 | 1.0 | 83.6 | |
| SC-9c | 32.8 | 10.0 | 4.3 | 18.8 | 3.5 | 1.0 | 5.6 | 0.8 | 6.3 | 1.6 | 5.4 | 0.8 | 5.9 | 1.0 | 97.9 | |
| SC-9d | 31.1 | 8.8 | 3.6 | 15.1 | 2.9 | 0.8 | 4.8 | 0.7 | 5.6 | 1.5 | 5.3 | 0.8 | 6.3 | 1.1 | 88.3 | |
| SC-13 | 32.5 | 13.8 | 4.1 | 17.6 | 3.3 | 0.9 | 5.3 | 0.7 | 5.6 | 1.4 | 4.9 | 0.8 | 5.5 | 1.0 | 97.4 | |
| SC-24 | 20.9 | 6.9 | 2.7 | 11.5 | 2.2 | 0.6 | 3.5 | 0.5 | 3.7 | 1.0 | 3.1 | 0.5 | 3.4 | 0.6 | 61.1 | |
| SC-16b | 55.4 | 18.2 | 7.7 | 33.6 | 6.5 | 1.7 | 9.7 | 1.4 | 10.3 | 2.6 | 8.2 | 1.2 | 8.6 | 1.4 | 166.5 | |
| SC-16c | 55.0 | 18.0 | 7.9 | 33.3 | 6.5 | 1.7 | 9.2 | 1.3 | 10.0 | 2.5 | 8.0 | 1.2 | 8.8 | 1.5 | 164.7 | |
| SC-16a | 47.7 | 15.7 | 6.7 | 28.2 | 5.3 | 1.5 | 7.9 | 1.1 | 8.6 | 2.2 | 7.1 | 1.1 | 7.7 | 1.4 | 142.3 | |
| SC-17a | 31.5 | 14.2 | 4.5 | 18.7 | 3.6 | 1.0 | 5.6 | 0.8 | 6.0 | 1.5 | 5.0 | 0.7 | 5.4 | 0.9 | 99.4 | |
| SC-17c | 38.0 | 19.4 | 6.4 | 28.0 | 5.5 | 1.5 | 8.1 | 1.0 | 7.7 | 1.8 | 5.8 | 0.9 | 5.8 | 1.0 | 131.0 | |
| SC-17b | 32.1 | 16.3 | 5.1 | 21.7 | 4.2 | 1.1 | 6.1 | 0.9 | 6.1 | 1.5 | 4.7 | 0.7 | 5.0 | 0.8 | 106.3 | |
| SC-19a | 24.9 | 13.5 | 4.1 | 17.3 | 3.3 | 0.8 | 4.7 | 0.7 | 4.7 | 1.1 | 3.6 | 0.5 | 3.8 | 0.6 | 83.6 | |
| SC-19c | 22.3 | 10.0 | 2.8 | 12.0 | 2.4 | 0.7 | 3.9 | 0.6 | 4.6 | 1.2 | 4.0 | 0.6 | 4.3 | 0.7 | 70.0 | |
| SC-21b | 21.3 | 13.6 | 3.1 | 13.2 | 2.7 | 0.8 | 4.2 | 0.6 | 4.8 | 1.3 | 4.5 | 0.7 | 4.9 | 0.8 | 76.5 | |
| SC-21a | 21.7 | 13.0 | 3.0 | 12.9 | 2.7 | 0.7 | 4.2 | 0.6 | 5.0 | 1.3 | 4.5 | 0.7 | 5.0 | 0.9 | 76.1 | |
| SC-21c | 24.0 | 14.0 | 3.4 | 14.2 | 3.0 | 0.8 | 4.4 | 0.7 | 5.3 | 1.4 | 4.7 | 0.7 | 5.1 | 0.9 | 82.5 | |
| SC-21d | 19.8 | 13.4 | 3.0 | 12.9 | 2.8 | 0.7 | 4.0 | 0.5 | 4.2 | 1.1 | 3.6 | 0.6 | 4.2 | 0.7 | 71.5 | |
| SC-22a | 10.8 | 6.7 | 1.5 | 6.3 | 1.3 | 0.4 | 2.2 | 0.3 | 2.6 | 0.7 | 2.4 | 0.4 | 3.0 | 0.5 | 39.2 | |
| SC-22b | 12.6 | 8.5 | 1.9 | 8.2 | 1.7 | 0.5 | 2.6 | 0.4 | 2.8 | 0.7 | 2.4 | 0.4 | 3.1 | 0.5 | 46.2 | |
| SC-22c | 14.9 | 10.0 | 2.2 | 9.5 | 2.0 | 0.5 | 2.9 | 0.4 | 3.3 | 0.9 | 2.8 | 0.4 | 3.2 | 0.6 | 53.8 | |
| SC-27a | 45.6 | 15.6 | 6.5 | 28.4 | 5.6 | 1.4 | 8.1 | 1.1 | 8.6 | 2.1 | 6.8 | 1.0 | 7.3 | 1.2 | 139.4 | |
| SC-27b | 48.8 | 17.2 | 7.2 | 31.8 | 6.3 | 1.7 | 9.0 | 1.3 | 9.3 | 2.3 | 7.2 | 1.1 | 7.4 | 1.3 | 151.8 | |
| SC-29a | 19.6 | 11.8 | 3.0 | 13.0 | 2.6 | 0.0 | 3.5 | 0.5 | 3.4 | 0.8 | 2.6 | 0.4 | 2.6 | 0.4 | 64.2 | |
| SC-29b | 66.0 | 34.4 | 8.6 | 36.7 | 6.7 | 1.7 | 9.5 | 1.3 | 10.1 | 2.5 | 7.9 | 1.1 | 7.5 | 1.3 | 195.4 | |
| SC-29c | 18.2 | 12.0 | 2.9 | 12.1 | 2.4 | 0.6 | 3.3 | 0.5 | 3.4 | 0.8 | 2.5 | 0.4 | 2.6 | 0.4 | 62.0 | |
| SC-29d | 15.8 | 10.2 | 2.5 | 10.4 | 2.1 | 0.6 | 2.9 | 0.4 | 2.7 | 0.7 | 2.1 | 0.3 | 2.0 | 0.4 | 52.8 | |
| SC-29e | 20.4 | 12.9 | 3.5 | 14.8 | 3.0 | 0.7 | 3.9 | 0.5 | 3.6 | 0.9 | 2.6 | 0.4 | 2.6 | 0.4 | 70.2 | |
| SC-20d | 24.1 | 13.2 | 3.5 | 14.8 | 3.0 | 0.8 | 4.7 | 0.6 | 5.0 | 1.2 | 4.0 | 0.6 | 4.4 | 0.8 | 80.7 | |
| SC-20b | 20.0 | 10.3 | 2.6 | 10.9 | 2.1 | 0.6 | 3.5 | 0.5 | 3.9 | 1.1 | 3.7 | 0.6 | 4.3 | 0.8 | 64.9 | |
| SC-20c | 19.3 | 10.1 | 2.4 | 9.8 | 1.9 | 0.6 | 3.4 | 0.4 | 3.4 | 0.9 | 3.1 | 0.5 | 3.6 | 0.7 | 60.0 | |
| SC-20a | 23.4 | 12.4 | 3.1 | 13.5 | 2.7 | 0.8 | 4.2 | 0.6 | 4.9 | 1.3 | 4.2 | 0.7 | 4.7 | 0.8 | 77.3 | |
| SC-19b | 46.1 | 18.7 | 5.3 | 21.7 | 3.8 | 1.0 | 6.0 | 0.9 | 6.7 | 1.7 | 5.5 | 0.8 | 5.6 | 1.0 | 124.8 | |
| SC-30a | 26.1 | 21.5 | 4.5 | 19.4 | 4.0 | 1.1 | 5.2 | 0.7 | 5.4 | 1.3 | 3.9 | 0.6 | 4.0 | 0.6 | 98.3 | |
| SC-30c | 26.9 | 22.3 | 4.7 | 19.6 | 4.2 | 1.1 | 5.3 | 0.7 | 5.2 | 1.3 | 3.9 | 0.6 | 4.1 | 0.7 | 100.6 | |
| SC-30b | 26.1 | 20.0 | 4.0 | 16.7 | 3.3 | 1.0 | 4.8 | 0.7 | 5.3 | 1.3 | 4.1 | 0.6 | 4.2 | 0.7 | 92.8 | |
| SC-31d | 29.6 | 25.0 | 5.0 | 21.5 | 4.3 | 1.2 | 5.8 | 0.8 | 6.1 | 1.4 | 4.3 | 0.6 | 4.2 | 0.6 | 110.5 | |
| SC-31c | 38.2 | 34.7 | 7.2 | 31.1 | 6.3 | 1.6 | 7.4 | 1.0 | 7.3 | 1.6 | 5.1 | 0.7 | 4.9 | 0.8 | 148.0 | |
| SC-31b | 20.7 | 16.2 | 3.1 | 12.9 | 2.4 | 0.7 | 3.6 | 0.5 | 4.1 | 1.0 | 3.3 | 0.5 | 3.5 | 0.6 | 73.2 | |
| SC-31a | 20.1 | 15.1 | 2.7 | 11.0 | 2.1 | 0.6 | 3.0 | 0.4 | 3.4 | 0.8 | 2.7 | 0.4 | 2.8 | 0.5 | 65.6 | |
| SC-32a | 17.3 | 12.7 | 2.4 | 9.9 | 1.9 | 0.6 | 2.7 | 0.4 | 3.2 | 0.8 | 2.7 | 0.4 | 2.8 | 0.5 | 58.1 | |
| Ben Guerir | BG-L0-C4 | 29.2 | 11.6 | 3.5 | 14.6 | 2.7 | 0.8 | 4.4 | 0.7 | 5.2 | 1.4 | 4.4 | 0.7 | 4.7 | 0.8 | 84.6 |
| BG-L0-C5 | 38.5 | 16.5 | 5.1 | 21.9 | 4.1 | 1.1 | 6.3 | 0.9 | 6.9 | 1.7 | 5.7 | 0.9 | 5.9 | 1.0 | 116.5 | |
| BG-L0-C6 | 44.6 | 21.3 | 6.8 | 30.1 | 5.7 | 1.5 | 8.2 | 1.2 | 8.7 | 2.2 | 6.8 | 1.0 | 6.8 | 1.1 | 145.8 | |
Publisher’s Note: MDPI stays neutral with regard to jurisdictional claims in published maps and institutional affiliations. |
© 2021 by the authors. Licensee MDPI, Basel, Switzerland. This article is an open access article distributed under the terms and conditions of the Creative Commons Attribution (CC BY) license (http://creativecommons.org/licenses/by/4.0/).
Share and Cite
MDPI and ACS Style
Buccione, R.; Kechiched, R.; Mongelli, G.; Sinisi, R. REEs in the North Africa P-Bearing Deposits, Paleoenvironments, and Economic Perspectives: A Review. Minerals 2021, 11, 214. https://0-doi-org.brum.beds.ac.uk/10.3390/min11020214
AMA Style
Buccione R, Kechiched R, Mongelli G, Sinisi R. REEs in the North Africa P-Bearing Deposits, Paleoenvironments, and Economic Perspectives: A Review. Minerals. 2021; 11(2):214. https://0-doi-org.brum.beds.ac.uk/10.3390/min11020214
Chicago/Turabian StyleBuccione, Roberto, Rabah Kechiched, Giovanni Mongelli, and Rosa Sinisi. 2021. "REEs in the North Africa P-Bearing Deposits, Paleoenvironments, and Economic Perspectives: A Review" Minerals 11, no. 2: 214. https://0-doi-org.brum.beds.ac.uk/10.3390/min11020214
Note that from the first issue of 2016, this journal uses article numbers instead of page numbers. See further details here.