Article

Experimental Study of Pt Solubility in the CO-CO2 Fluid at Low fO2 and Subsolidus Conditions of the Ultramafic-Mafic Intrusions

by
Alexander Simakin
1,2,*,
Tamara Salova
1,
Anastassia Y. Borisova
3,4,
Gleb S. Pokrovski
3,
Olga Shaposhnikova
1,
Oksana Tyutyunnik
5,
Galina Bondarenko
1,
Alexey Nekrasov
1 and
Sergey I. Isaenko
6
1
Institute of Experimental Mineralogy, Russian Academy of Sciences, 142432 Chernogolovka, Moscow Region, Russia
2
Institute of the Earth Physics, Russian Academy of Sciences, B. Gruzinskaya Str., 10123242 Moscow, Russia
3
Géosciences Environnement Toulouse, GET-UMR 5563-OMP-CNRS, Université de Toulouse III, IRD, CNES, 14 Avenue E. Belin, 31400 Toulouse, France
4
Geological Department, Lomonosov Moscow State University, Vorobievu Gori, 119991 Moscow, Russia
5
Vernadsky Institute of Geochemistry and Analytical Chemistry, Russian Academy of Sciences, Kosygin Str. 19, 119334 Moscow, Russia
6
Institute of Geology, Komi Science Centre, Ural Branch of Russian Academy of Sciences, Pervomayskaya, 54, 167982 Syktyvkar, Russia
*
Author to whom correspondence should be addressed.
Submission received: 22 December 2020 / Revised: 16 February 2021 / Accepted: 18 February 2021 / Published: 23 February 2021

Abstract

:
The solubility of Pt in CO-CO2 fluid was studied experimentally at P = 50–200 MPa and T = 950 °C. A mixture of MgC2O4 and MgCO3 was used as a source of the fluid. Upon the reaction of the Pt capsule walls and the fluid, a carbonyl of platinum is formed. The use of the high-temperature quartz ceramics as a fluid trap avoids the effect of mechanical contamination with Pt from the eroded capsule walls. The total content of platinum in the porous fluid traps was measured by the Electrothermal Atomic Absorption (ET-AAS) method. In some experiments, the local analysis of traps was carried out by the Laser Ablation Inductively Coupled Plasma Mass Spectrometry (LA-ICP-MS) method. The composition of fluid in bubbles captured in an albite glass trap was studied by micro-Raman spectroscopy. On the capsule walls and MgO, Pt “whiskers” of submicron diameter were observed, which were formed as a product of carbonyl decomposition during quenching. About 5–15% of carbonyl withstands quenching resulting in 1.5 to 2 ppm Pt soluble in acetone (runs at P = 200 MPa) in a quartz glass trap. The amount of Pt soluble in acetone from the capsule walls corresponds to a concentration of up to 8 ppm in the fluid. A high content of soluble Pt of 2000–3000 ppm was determined in a carbon coated MgO matrix. Our study demonstrated that the solubility of Pt in the CO-CO2 fluid is 15–150 ppm, presumably in the form of Pt3(CO)62− under conditions corresponding to the conditions of the subsolidus stage of layered ultramafic-mafic and ultramafic-alkaline intrusions formation. Our preliminary data showed that this solubility will increase with the addition of water at low fO2.

1. Introduction

Platinum group elements (PGE) are both chalcophile and siderophile elements. Their lower contents in the mantle and crust relative to those of chondrite are explained by the strong fractionation into the iron core at the early stage of the Earth’s formation. Likewise, sulfide melts concentrate all PGE upon separation from basic magmas. At conditions of high oxygen fugacity (fO2) in the basic magmas of the subduction zones, no sulfides are formed and PGE are disseminated in the intrusive rocks. In the Ural-Alaska concentric intrusions of subduction origin, PGE are mobilized and concentrated at the post-magmatic stage as a result of the high-temperature fluid-rock interaction [1]. Postmagmatic fluid is also involved in the formation of the low sulphide type PGE deposits of Merensky reef type in the layered ultramafic-mafic intrusions with sulfide mineralization (Bushveld, SA and other) [2]. In the Merensky Reef, zircon and thorite were deposited from high-temperature fluid along with PGE and chromite [3]. The crystallization temperature estimated by the titanium contents in the zircon ranges from 750 to 930 °C.
Fluids that are active agents during the evolution of PGE-bearing basic-ultrabasic intrusions contain carbon, which is confirmed by an occurrence of carbonaceous matter in mineral form and in the form of fluid inclusions. The fluid–rock (melt) interaction continues in the temperature range from magmatic to the (background) temperature of the host rocks. Following the high-temperature stage, the fluid-rock system is quenched, and the fluid equilibrates at lower temperature. In a Stillwater complex (MT, USA), assemblage of graphite-calcite-forsterite-antigorite was equilibrated at the temperature below 510 °C [4]. Association of graphite with quartz and magnetite in the ultramafic pegmatites of the Bushveld complex was described to be equilibrated at T = 500–600 °C [5]. The fluid trapped in the solidified basic-ultrabasic rocks was also equilibrated at the subsolidus temperatures, and therefore contained reduced carbon components mainly in the form of CO2 and CH4. Hanley et al. [6] reported the CO2 ± CH4 fluid and concentrated brine inclusions in quartz of the late granophyric albite-quartz core of a zoned pegmatite body in the Gabbronorite of Stillwater Complex. Konnikov and Vasyukova [7] observed fluid inclusions in quartz from sulfide-bearing amphibolized pyroxenite (Shanuch Ni-bearing pluton, Kamchatka) containing 79 vol.% of CO2 and 12 vol.% of CH4. Bulk-rock analysis of the basic-ultrabasic PGE-bearing Yoko-Dovyren intrusion (Trans-Baikal region, Russia) showed an increased content of CH4 (up to 15 cm3/kg) and H2 (up to 7 cm3/kg) in the mineralized reefs of the Stillwater type [8]. An appreciable CO content (up to 2 cm3/kg) was found in the lower dunite-troctolite part of this intrusion. According to fluid inclusion data (from Au–Pt-rich quartz-sulfide-epidote veins, Sudbury Igneous Complex), Hanley et al. [9] concluded that at a late stage, Cu and partially Ag and Bi were fractionated into a gas phase enriched in CH4, in equilibrium with a coexisting brine enriched with Zn, Pb, Mn.
Graphite deposited from the fluid at the low oxygen fugacity (fO2) near CCO buffer (carbon dioxide-carbon oxide buffer) below quartz-fayalite-magnetite buffer (QFM)). There was a unique observation of ilmenite-titanomagnetite inclusion in the isoferroplatinum crystal in Konder PGE deposit (alkaline-ultramafic concentric intrusion, Russia) which indicates equilibration conditions at T = 700 °C and fO2 = QFM-1.6 [10]. High solubility of PGE and Au at high oxygen fugacity in form of chloride complexes is well established [11] and it was attributed to the ore formation in the ultramafic cumulus different from actual redox conditions. At low fO2 between QFM and wustite-magnetite (WM) buffers, PGE, Au, Ag, Ni, Co may exist in their native states. Methane is a non-polar compound that weakly interacts with most substances. While in a reduced carbonic fluid, CO can react with metals to form carbonyls MexCOy, which can become important PGE transporting species. Many carbonyls, e.g., carbonyls of Ni, Cr, Mo are stable at low pressures and temperatures up to 150–200 °C and are widely used in metallurgy and chemical industry (e.g., [12]). The stability of carbonyls at high pressure and temperature is poorly studied.
In geological processes, the main prerequisite of carbonyls formation is sufficiently high CO content in the fluid. The main forms of the carbon in C-O-H system at high temperatures are CO2, CO and CH4. At high oxygen fugacity, CO2 prevails while at low fO2, carbon monoxide and CH4. Maximum CO/CO2 ratio is controlled by the reaction of CCO buffer:
С + СО2 = 2СО,
Reaction (1) is endothermic and has positive volume effect, therefore ratio CO/CO2 rises with temperature increase and pressure decrease. As mentioned above, methane predominates in the low-temperature fluid inclusions observed mainly in the quartz of late differentiates of basic-ultrabasic magmas. Ratio СО/СН4 is controlled by reaction:
СО + 3Н2 = СН4 + Н2О,
Reaction (2) is exothermic and has negative volume effect correspondingly ratio СО/СН4 rises with temperature increase and pressure decrease. When the oxygen fugacity in the fluid is buffered externally, for example, by the reaction with cumulus minerals, the СО/СН4 ratio is also strongly dependent on the C/H ratio in the fluid and fO2. It is easy to show that at low concentrations of reduced gases in CO2-H2O fluid (that is often the case), the СН4 concentration reaches a maximum in the fluid with XCO2 = XH2O = 0.5 and increases in proportion to 1/(fO2)2. The CO concentration increases in proportion to CO2 content and to 1/(fO2)1/2. At the crustal conditions at pressures of 10–1000 MPa and magmatic temperatures of 900–1200 °С, mole ratio CO/(CO + CO2) varies in the range of 0.05–0.99. At P = 200 MPa in a fluid with C/H = 0.5 (initial composition XH2O = XCO2), CO prevails over CH4 at T > 700–800 °C: fO2 = QFM/QFM-1 [13]. Taking into account high chlorine content in magmatic fluids (10 atomic % of Cl) at low fO2 and high T, it leads to the prediction of the high content of CO, CO2, HCl and CH3Cl in expense of CH4 [4]. Fluid inclusions with a high CO contents were found in plagioclases and pyroxenes from magmatic rocks and in xenoliths quenched at high cooling rates at high temperature (e.g., [14,15]).
Figure 1 depicting the vapor pressure data of some carbonyls of the transitional metals as a function of temperature gives a general idea (educated guess) of the stability of the carbonyls. At the marginal stability of the carbonyl as a phase, its evaporation and decomposition reactions are in equilibrium. For example, we can write for nickel carbonyl Ni(CO)4 based on known thermodynamic properties:
Ni(CO)4l = Ni(CO)4g,
Ni(CO)4g = Nis +4COg,
It follows from Figure 1 that near decomposition point (P = 1 bar, T = 180 °C) Ni(CO)4 vapor pressure is about 0.1 bar. Based on this pressure, constant of the reaction (4) can be estimated as (ideal gas limit):
K 2 ( 180 ° C ) = X N i ( C O ) 4 ( X C O ) 4 0.1 0.9 4 = 0.15 ,
In accordance with our thermodynamic calculations [16], K2 reaches this value at Т = 171 °C. The similarity between the calculated and observed values confirms our predictions of the significant Ni solubility of 100–1000 ppm as a carbonyl in the temperature range of 600–900 °C and pressures above 500–700 MPa.
Simple platinum carbonyl Pt(CO)4 was only synthesized at low temperature (4–10 K) by condensation of platinum one atom vapor in the Ar-CO medium [19]. Anionic Chini complex [Pt3(CO)6]n2− is the most common carbonyl form in the solutions [20]. The number of stacked three member rings (Pt3(CO)6)n can reach 15. In each triangle, platinum atoms are bonded through a bridging CO, and the three terminal CO are bonded to single Pt atoms. Rings are connected via Pt-Pt bonds (see e.g., [21]). Stable multinuclear (n = 9–15) carbonyls were synthesized in the zeolite cavities with the method “ship in the bottle” [22]. Platinum carbonyls are unstable in air due to the oxidation [23]. There are no thermodynamic data on the platinum carbonyls, therefore it is impossible to predict theoretically their stability at high pressure–temperature (PT) conditions. We performed experimental study of Pt solubility in the dry CO-CO2 fluid at PT conditions close to the subsolidus conditions of upper crust ultramafic–mafic intrusions. Raman spectra of quenching Pt phases dissolved in acetone confirm the formation of Pt carbonyls in our experiments.

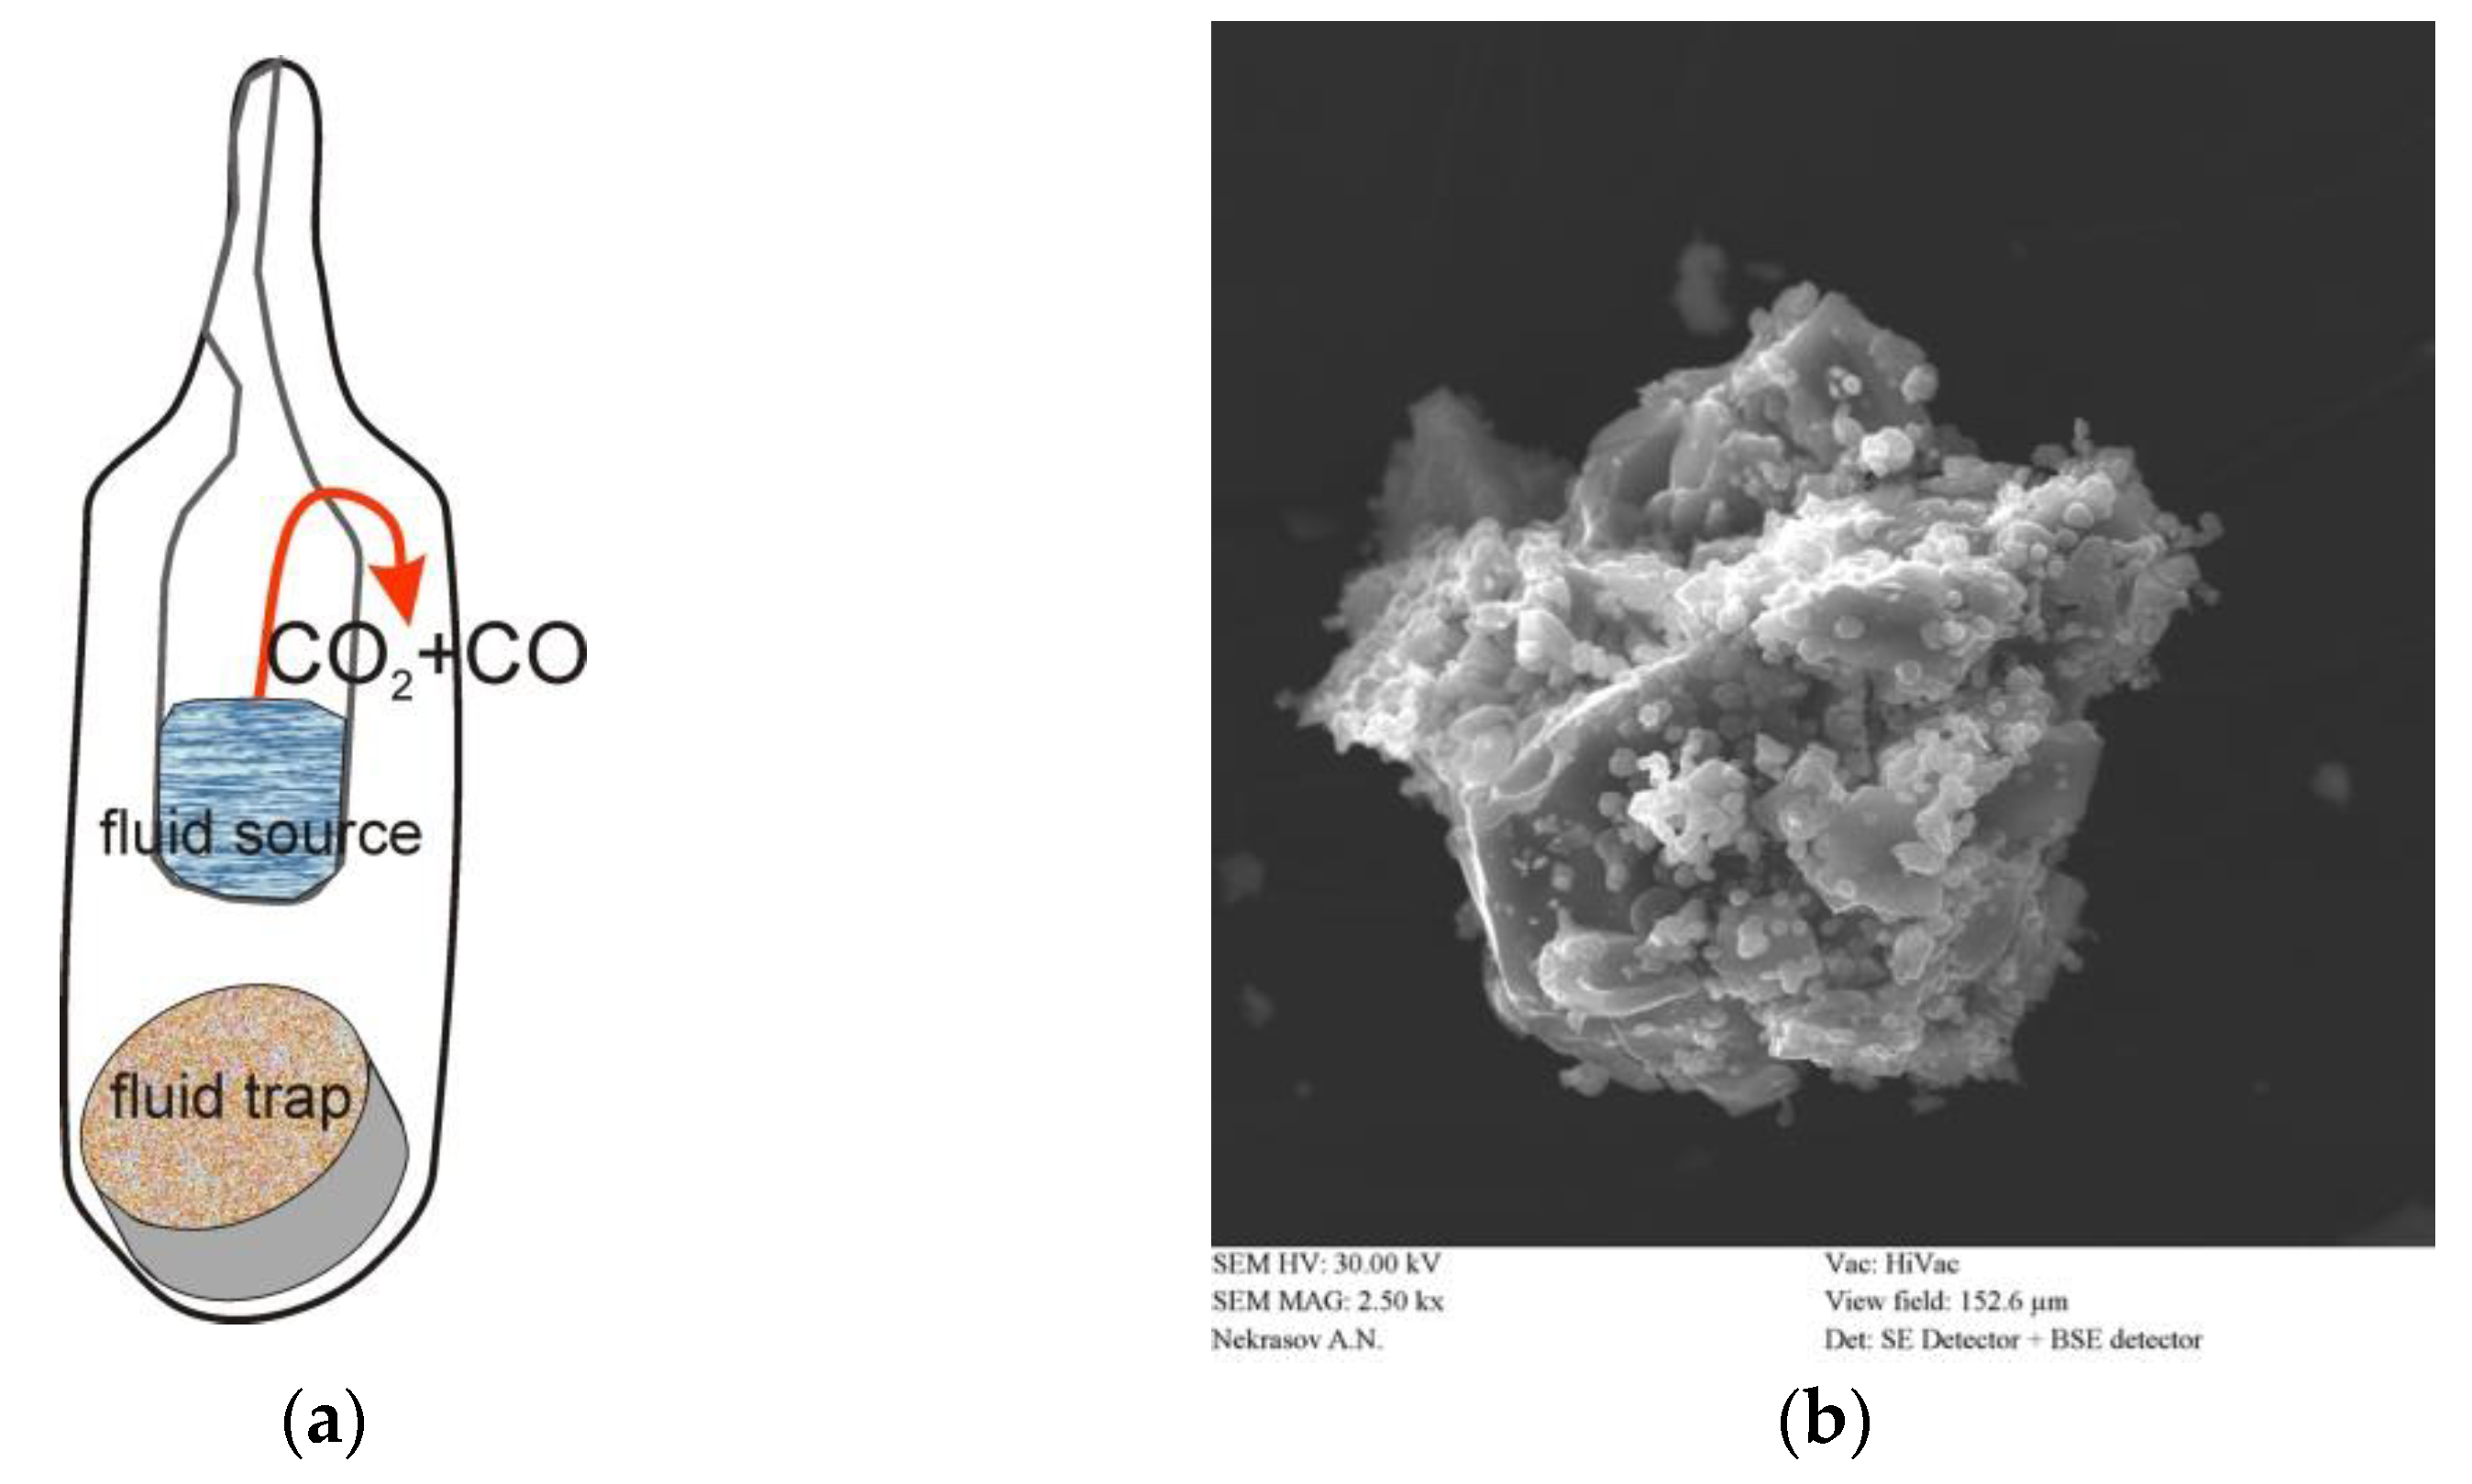
2. Materials and Methods

For the determination of Pt solubility in the CO-CO2 fluid, we use analogue of the diamond fluid trap method used for the work with water fluid at the mantle parameters in a rocking multi-anvil apparatus [24]. The reliability of this method is lower than that of in-situ techniques such as probing of fluid and spectral measurements during a run. In our experiments, fluid was generated due to the decomposition of MgC2O4 at the temperature above 650 °C in accordance with reaction:
MgC2O4 = MgO + CO + CO2,
To set higher than 0.5 mole fraction of CO2 in the fluid MgCO3 was added which is also decomposing at the temperature above 750 °C at P = 200 MPa. In one experiment (cor102) siderite was used which at the thermal decomposition generates fluid with XCO = 1/3:
3FeCO3 = Fe3O4 + CO + 2CO2,
Solids used as a fluid source were loaded into the small (diameter of 3 mm) open capsule, which was placed in the welded larger capsule (diameter of 5 mm and length of 40 mm) loaded with fluid trap (see Figure 2). Both capsules were made of platinum that was a source of this metal for the dissolution experiment. In our experiments using the Internally Heated Pressure Vessel (IHPV) apparatus, we tried several types of fluid traps.
(1)
Albite glass trap (AGT). It is a powder at the beginning of experiment when it is filled with fluid. It is sintered rapidly into the dense material with isolated fluid bubbles. In the loose state, the trap can be mechanically contaminated with platinum particles of the walls. These particles have larger size (up to 10–15 µm) than particles (usually of submicron size) deposited from the fluid. Mechanically produced particles contain less iron than deposited ones. Using of the bulk analysis of albite trap leads to the severely overestimated solubility. After the initial trials, albite traps were used only for probing experimental fluid conserved in the bubbles.
(2)
Industrial corundum filter for high temperature gasses (CRT). The advantages of this filter are the high mechanical stability and chemical resistance of the main corundum component. The main disadvantage is the use of alkaline aluminosilicate glass as a binder in the production of ceramics. This glass can react with the fluid and thus affect the platinum solubility. Another drawback of the corundum traps is the impossibility of their analysis by the Laser Ablation Inductively Coupled Plasma Mass Spectrometry (LA-ICP-MS) method.
(3)
Trap from the optic silica glass (CGT). These traps were prepared by the high-temperature sintering in the vacuum furnace at T = 1370 °C during an hour. Porosity of this trap measured after experiments at P = 200 MPa is about 40 ± 5%. Traps are not strong enough to clean their surface with mechanical abrasion after experiment, therefore some surface mechanical contamination with platinum is possible. To avoid this effect, trap was split into three pieces analyzed separately with Electrothermal Atomic Absorption (ET-AAS) method.
The procedure for estimating the solubility of Pt from the data on the bulk metal content in the trap is described in details in [25]. Neglecting the quenching effect and assuming an absence of adsorption and deposition during the experiment, the bulk platinum content (Cbulk) in the trap is:
C b u l k = ( 1 ε ) C s ρ s + ε ρ f l C f l ( 1 ε ) ρ s ,
where Cs and Cfl are metal content in the trap and fluid, ρs and ρfl are densities of the material of the trap and fluid and ε is porosity. Because of negligibly small Cs ≈ 0, the equation may be written as:
C b u l k = ε ρ f l C f l ( 1 ε ) ρ s = C f l γ   o r   C f l   =   γ C b u l k ,
The porosity of the quartz trap, estimated from BSE images of the slices surface is 0.4 ± 0.05. Quartz glass density is 2.3 g/cm3. Porosity of the corundum trap at P = 200 MPa is 0.3 ± 0.1, density of corundum is of 4.02 g/cm3. We estimate fluid density via equation of state for CO2 [26] correcting average molecular weight for CO mole fraction. Fugacity coefficients of СО and СО2 calculated in accordance with [27] at the experimental conditions differ by no more than 3% justifying this approach. The fluid density in the reference point at P = 200 MPa and T = 950 °C is ρfl = 0.589–0.214 XCO. Based on these data, values of conversion factor γ for corundum and quartz traps are in the ranges of γcor = 14–18 and γqz = 6–8.5.
Starting materials. We use chemically pure MgC2O4 (Onyxmet reagent). By X-ray powder diffraction data it is dihydrate MgC2O4 2H2O (СН2О = 24.3 wt.%). Water content after drying at T = 100 °C for 4 h by KFT analysis becomes 10.4 wt.%. After drying at 260 °C for 4 h, it decreases to less than 2 wt.%. As a source of CO2, we used natural magnesite (S. Ural). To minimize water contamination, all equipped capsules were additionally heated at 220 °C for 1–1.5 h before experiment, flashed with argon and then welded. Optical quartz (Lytkarino Optical Glass Factory, Lytkarino, Russia) glass was used in the fluid trap and has the concentrations of all impurities below detection limit for microprobe. Dry albite glass was prepared by the melting of the natural albite mineral from pegmatite (Kalba Region, Eastern Kazakhstan).
The experiments were carried out in an apparatus of high gas pressure at the Institute of Experiment Mineralogy, Russian Academy of Sciences (IEM RAS, Chernogolovka). The vessel of stainless steel had a free volume of 262 cm3, the working medium was Ar. The temperature was measured during the experimental run by a Pt–Rh thermocouple, the gradient-free zone was 40–50 mm. The pressure was measured with piezo sensors accurate to 5%. Temperature was controlled with precision of ±2.5°C, pressure was controlled with precision of ±1%. Quenching was performed by the switching off the furnace at the cooling rate 150 °C/min. The experiments have been performed at a pressure of 100 and 200 MPa and temperature of 950 °C, the duration of the runs was 2 h.
Spectroscopic study of fluid trapped in the albite glass was carried at the Institute of Geology, RAS (Syktyvkar) and at CEMES (Toulouse, France). Raman spectra of quenching platinum phases dissolved in acetone were measured in Institute of Experimental Mineralogy RAS (IEM RAS, Chernogolovka, Russia). Details of spectroscopic measurements are presented in supplementary materials (supplementary text).
Phase compositions of the each run products were studied in IEM RAS (Chernogolovka, Russia). Samples were prepared by mounting the products of the runs in polystyrene and polishing one face of a polystyrene cylinder. The textural and chemical analyses were performed using a CamScan MV2300 and Tescan Vega TS5130MM SEMs with an energy-dispersive spectrometer (INCA Energy 450). The spectrometer was equipped with semi-conductive Si(Li) detector INCA PentaFET X3. All phases were analyzed at an accelerating voltage of 20 kV, the current of the absorbed electrons on the Co sample was 0.1–0.2 nA. The smallest beam diameter was 0.2 μm for point phase analysis; some glasses were analyzed using a rectangle scanning area with a width of up to 50–80 µm. The measurements results were processed by the software package INCA Energy 200.
Water contents in the starting Mg2C2O4 were measured by the Karl–Fischer titration (KFT) on an Aqua 40.00 system with a high-temperature HT 1300 unit at IEM RAS (Chernogolovka, Russia). Detectable water weight (mW) range: 1 μg–100 mg, reproducibility: ± 3 μg at mW 1–1000 μg, 3% at the mW > 1 mg.
Platinum analyses were performed using a New Wave Research I3107 system (Fremont, CA, USA). This is a UV femtosecond laser system equipped with a Pharos HE from Light Conversions coupled with a high-resolution ICP-MS Element-XR. A 65 µm spot size was applied with 5 Hz and 3.34 J/cm2 conditions (laser output 48%). The background was measured during 60 s, ablation for 60 s and wash-out after ablation for 30 s. To quantify the elemental composition of the glasses, average silica concentrations (based on 29Si) measured by electron microprobe were used as an internal standard. For external calibration in bracketing mode, we used NIST SRM 612 reference material [28]. Furthermore, to control the accuracy, we used the MPI-DING mafic and ultramafic glasses (NIST SRM 610, GOR132-G, GOR128-G) [28,29] as secondary standards. The detection limit for major elements varied between 1 and 20 ppm, whereas it was 0.2 ppm for 195Pt. The distribution of platinum in the samples was uneven on a scale of 65 µm, therefore measurements are characterized by a large relative standard deviation of 60–80% of the measured values (see Supplementary text, Table S2, Figure S5).
To prepare for analysis by Electrothermal Atomic Absorption (ET-AAS) method, the samples were decomposed by heating to 120 °C in a mixture of strong HF + HNO3 in Savillex screw vessels, and then dried to wet salt. Then the sample was treated with Aqua Regia (HCl:HNO3 = 3:1) to obtain wet salts, and then it was treated with concentrated HCl to convert the salts into chlorides. After complete dissolution of the salts, the solution was cooled and filtered in a 5–10 mL flask. Determination of the nanograms quantities of Pt was carried out using a Solaar MQZ (Thermo Electron Corp. UK) ETAA spectrometer with a Zeeman background correction [30]. The measurements were conducted on the most sensitive line of λ = 265.9 using pyrolytically coated graphite furnaces. The sample was introduced automatically or manually with a micropipette with disposable plastic tips (5 to 20 μL). The signal was measured using the height of the peak and its area. The metrological performance of the methods was assayed using standard reference materials of known composition: SARM-7B, SOP-3-SR and others and samples available under the international GeoPT Proficiency Testing Programme (peridotite OPY-1, harzburgite HARZ-01, and iron–manganese nodules FeMn-1). The analytical inaccuracy of ET-AAS analysis within the concentration range of 1–100 ng/mL is no higher than 4 relative %. Detection limit is 2.5 ppb for Pt. To analyze the forms of platinum dissolved in acetone and chloroform, an organic phase was introduced directly into the ET-AAS graphite furnaces. The measurement was performed using water calibration solutions.

3. Results

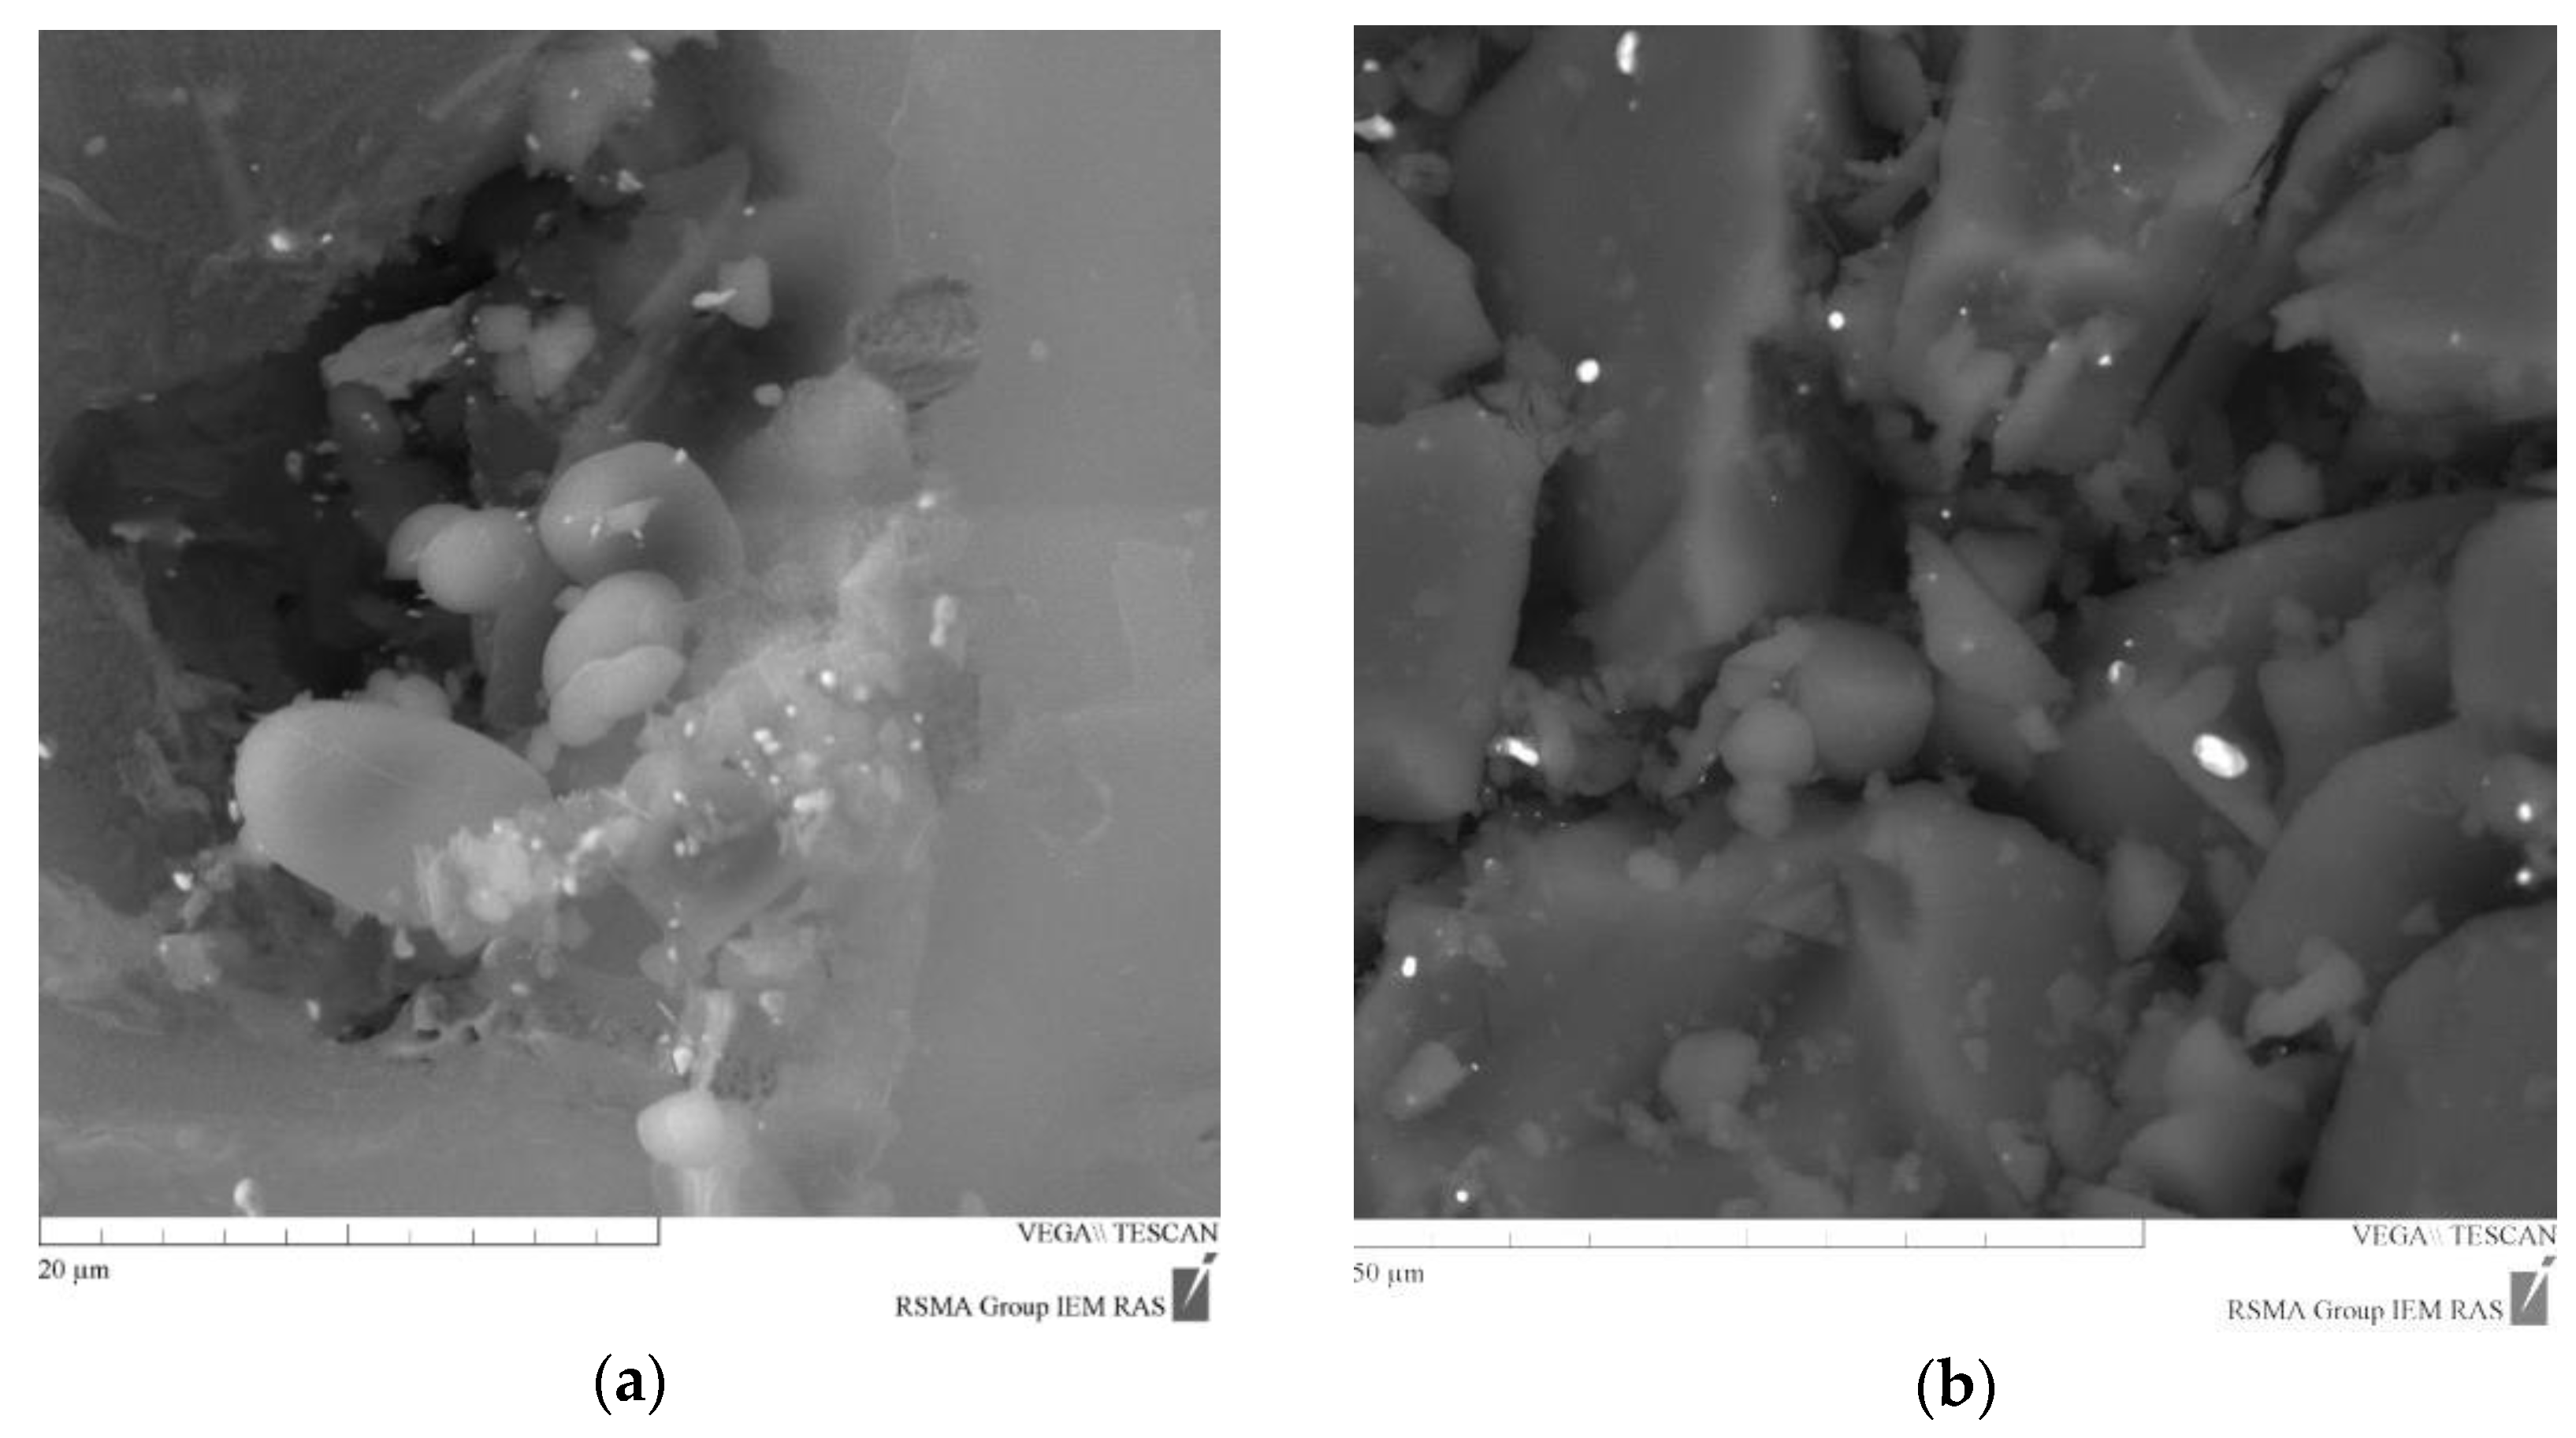
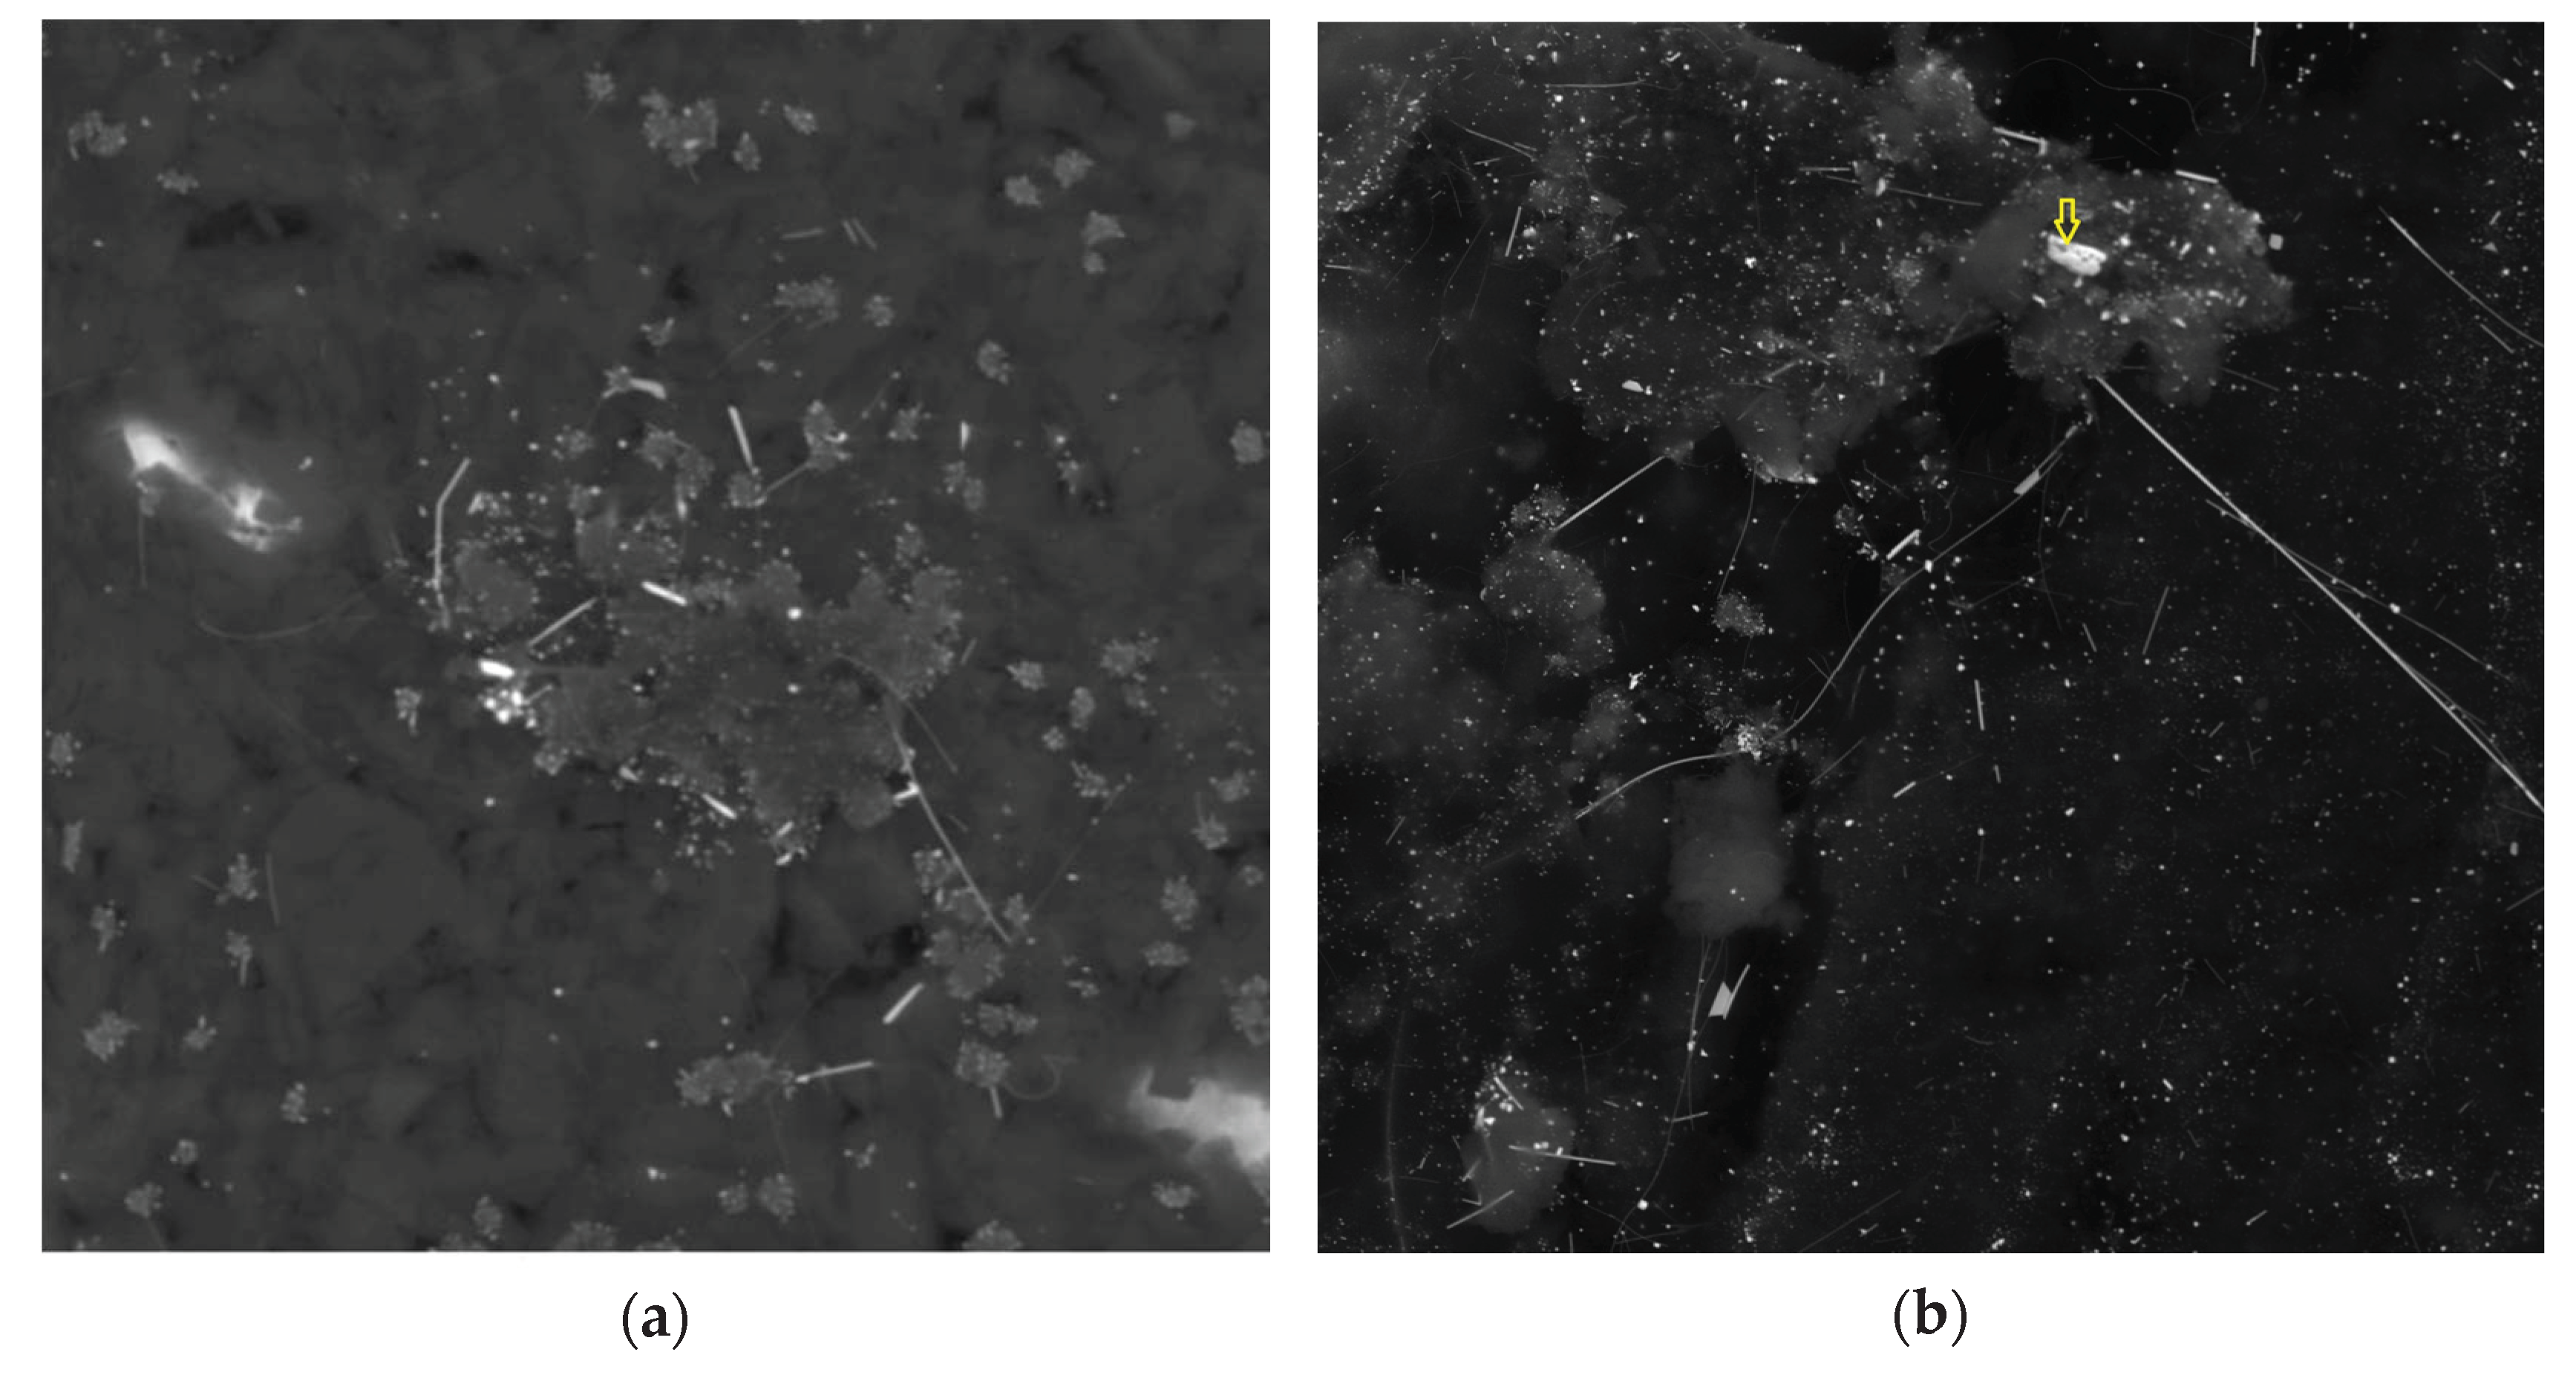
3.1. Qualitative Observations of the Reduced Carbonic Fluid Activity

In our experiments, the reduced carbonic fluid reacts not only with the walls of the platinum capsule, but also with the material of the trap. In earlier publication [25] interaction of such fluid with iron oxides matrix formed at siderite (used as a fluid source) decomposition was described. Figure 3a shows the SEM image of aliminosilicate glass ellipsoids deposited from the reduced carbonic fluid in the experiment ab84 (see Supplementary text, Table S3 for details) with albite trap. Small axes of the ellipsoids are in several microns range while maximum axes are up to 10 microns. SEM-EDS gives composition of the glass close to the albite with Na/Al ratio less than unity. This probably reflects the tendency of sodium to fractionate into the fluid. Tiny platinum particles were co-precipitated with albite. In Figure 3b, SEM image of the surface of the silica glass trap may be seen. Small deposited silica balls along with Pt particles are on the surface of the glass shreds. In the presence of water, silica glass began to actively crystallize from the surface at the parameters of our runs. Upon contact with a dry fluid, only the sharp silica glass edges were smoothed out due to dissolution. Thus, SEM observations indicate high dissolution ability of carbonic fluid at relatively low pressure of 200 MPa. The composition of the fluid and the solubility of Pt were quantitatively characterized by various instrumental methods and described below.

3.2. Fluid Composition

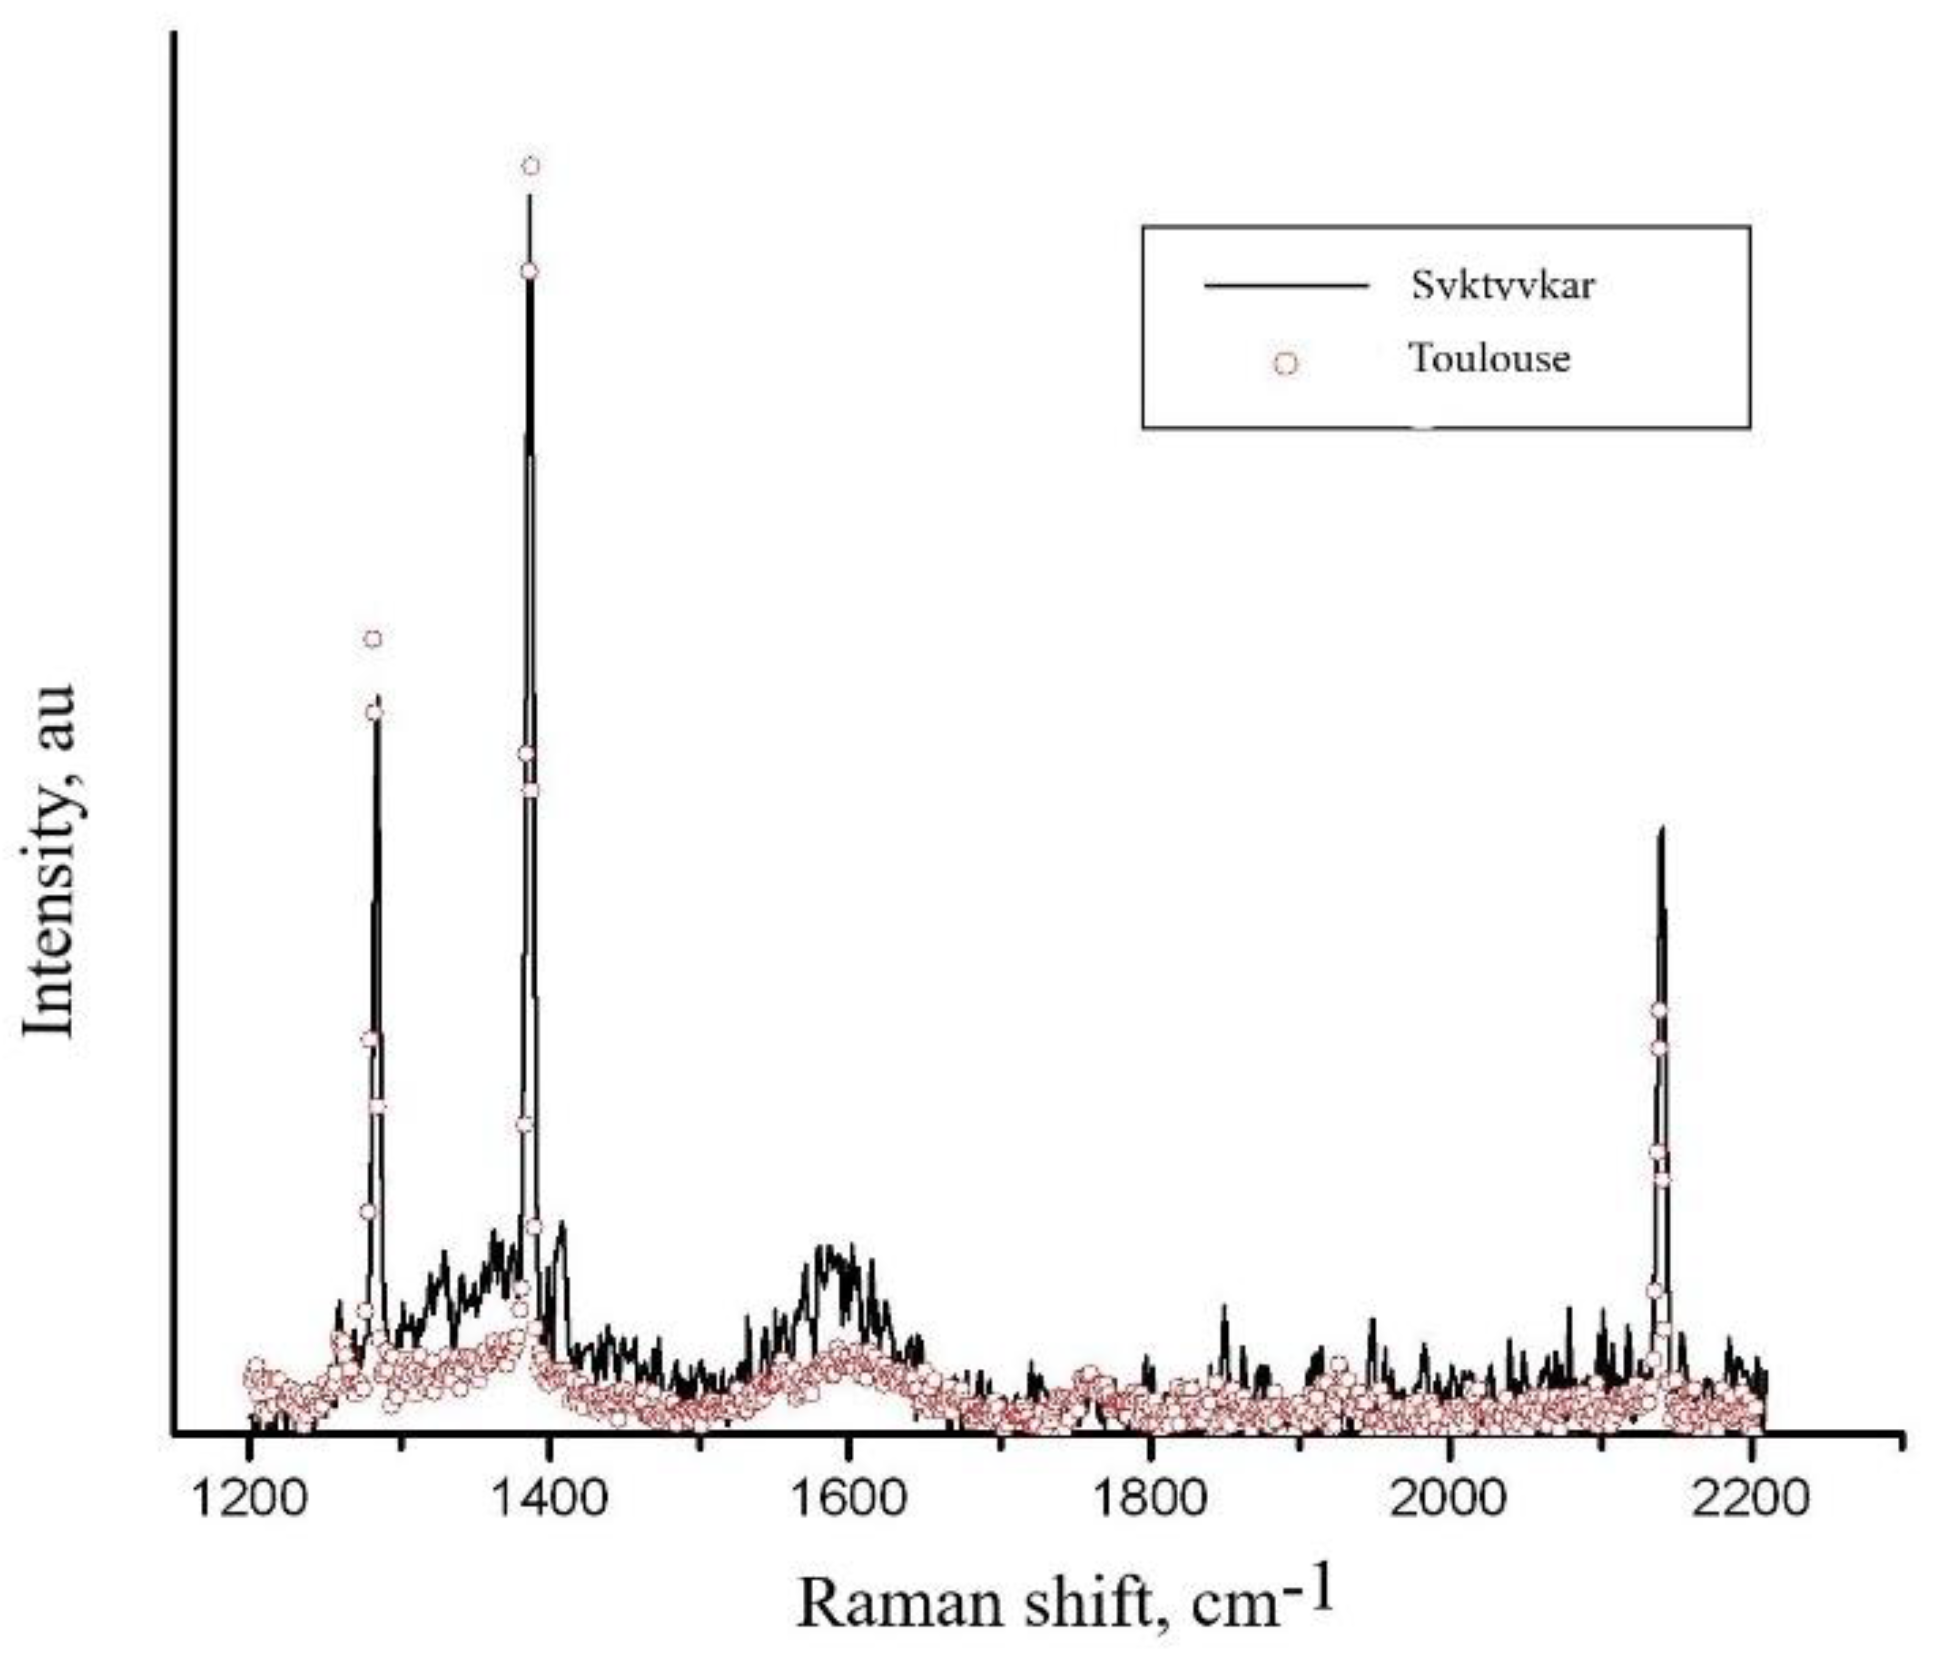
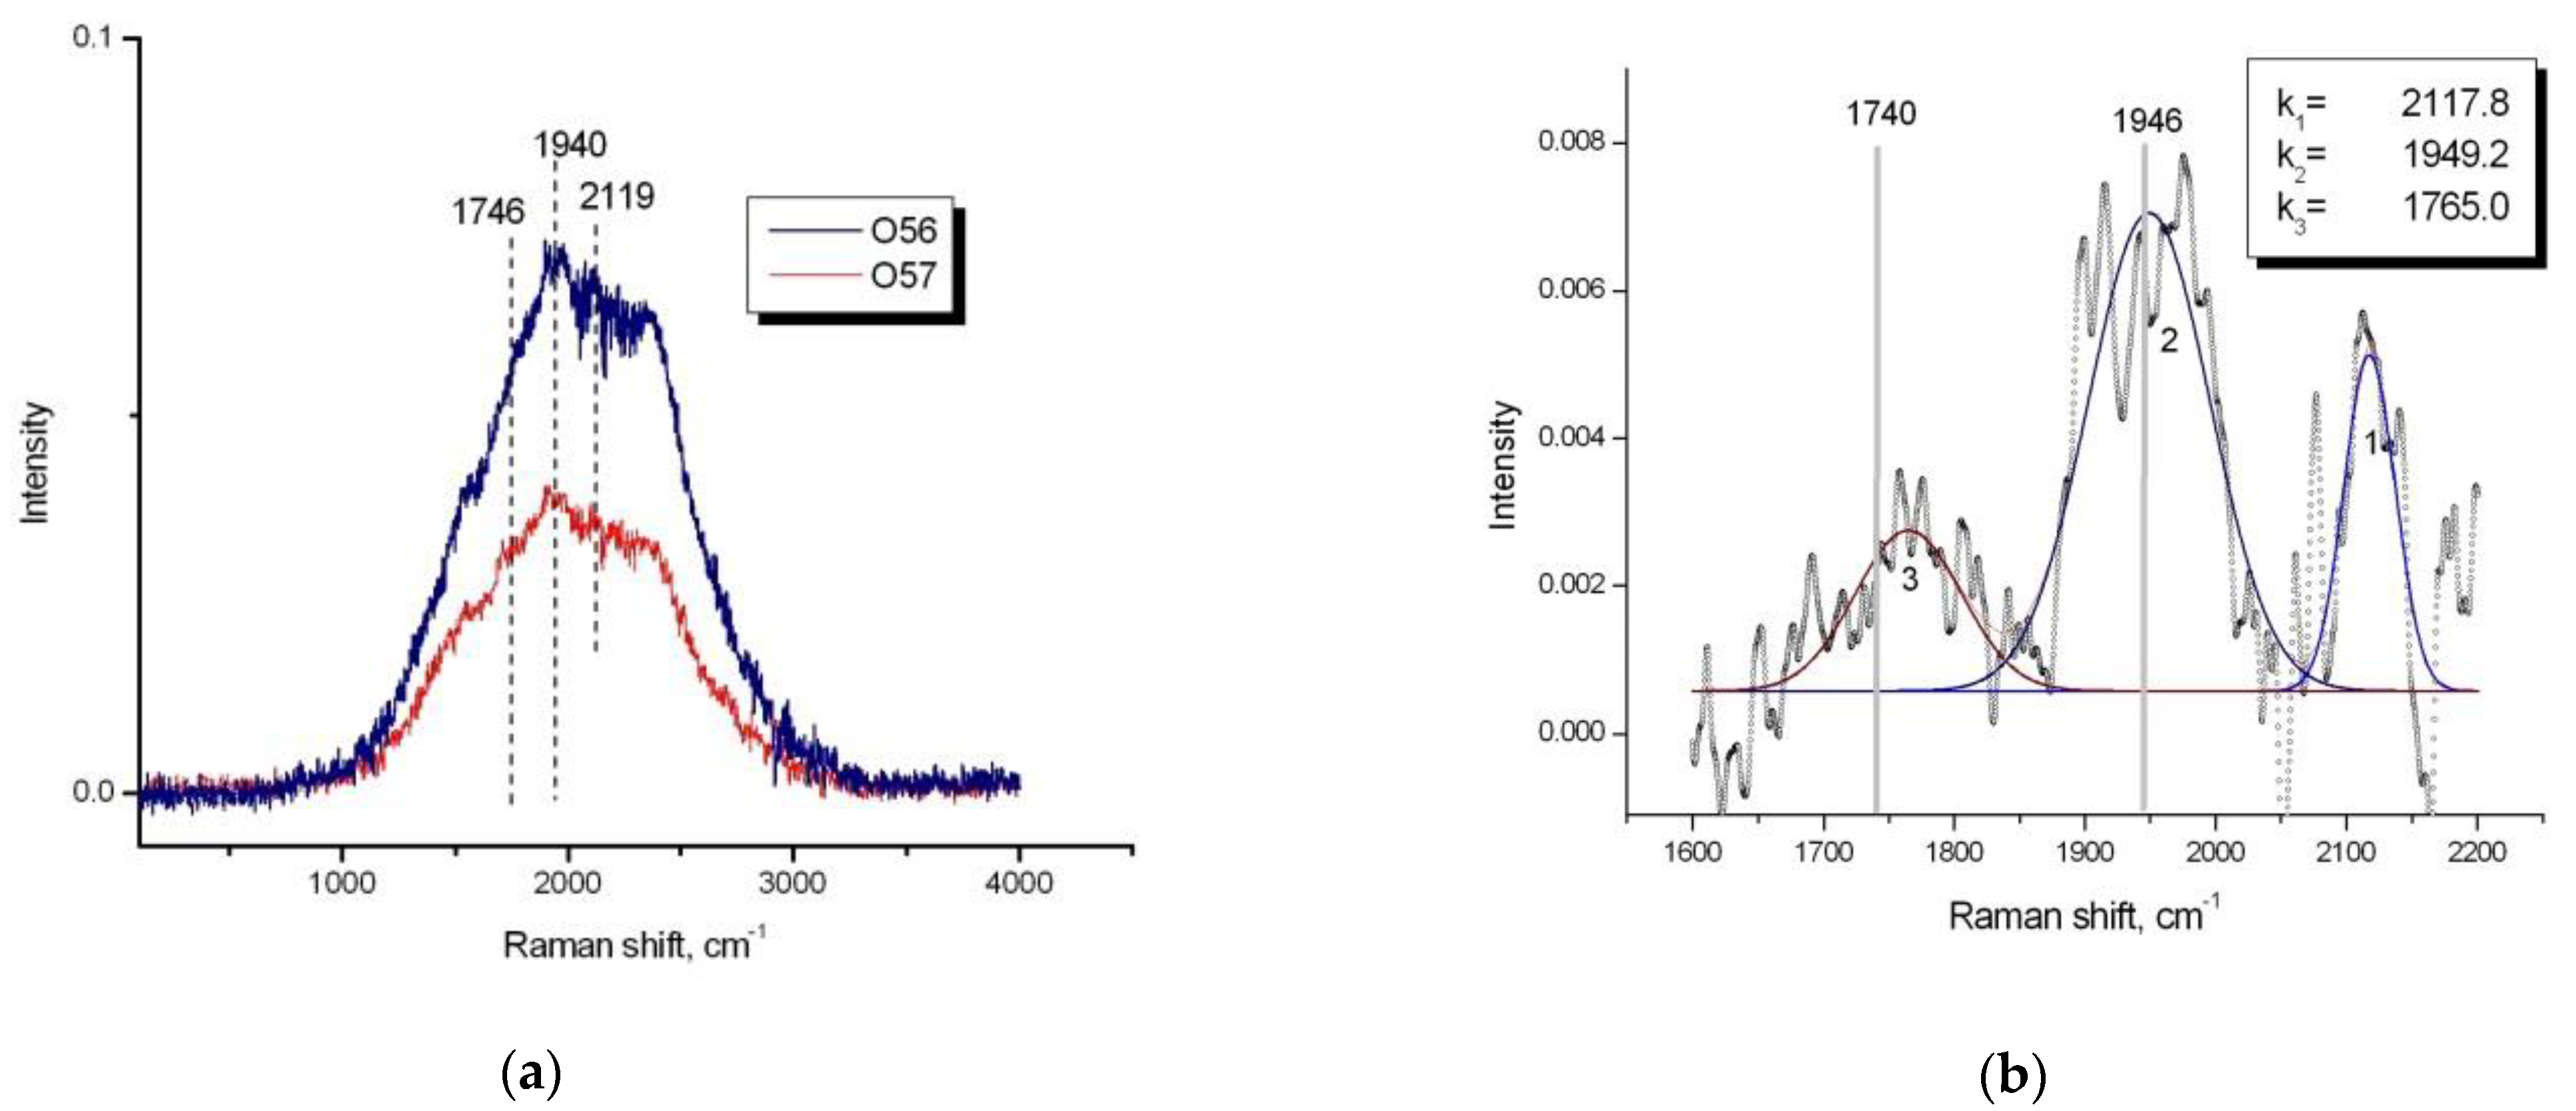
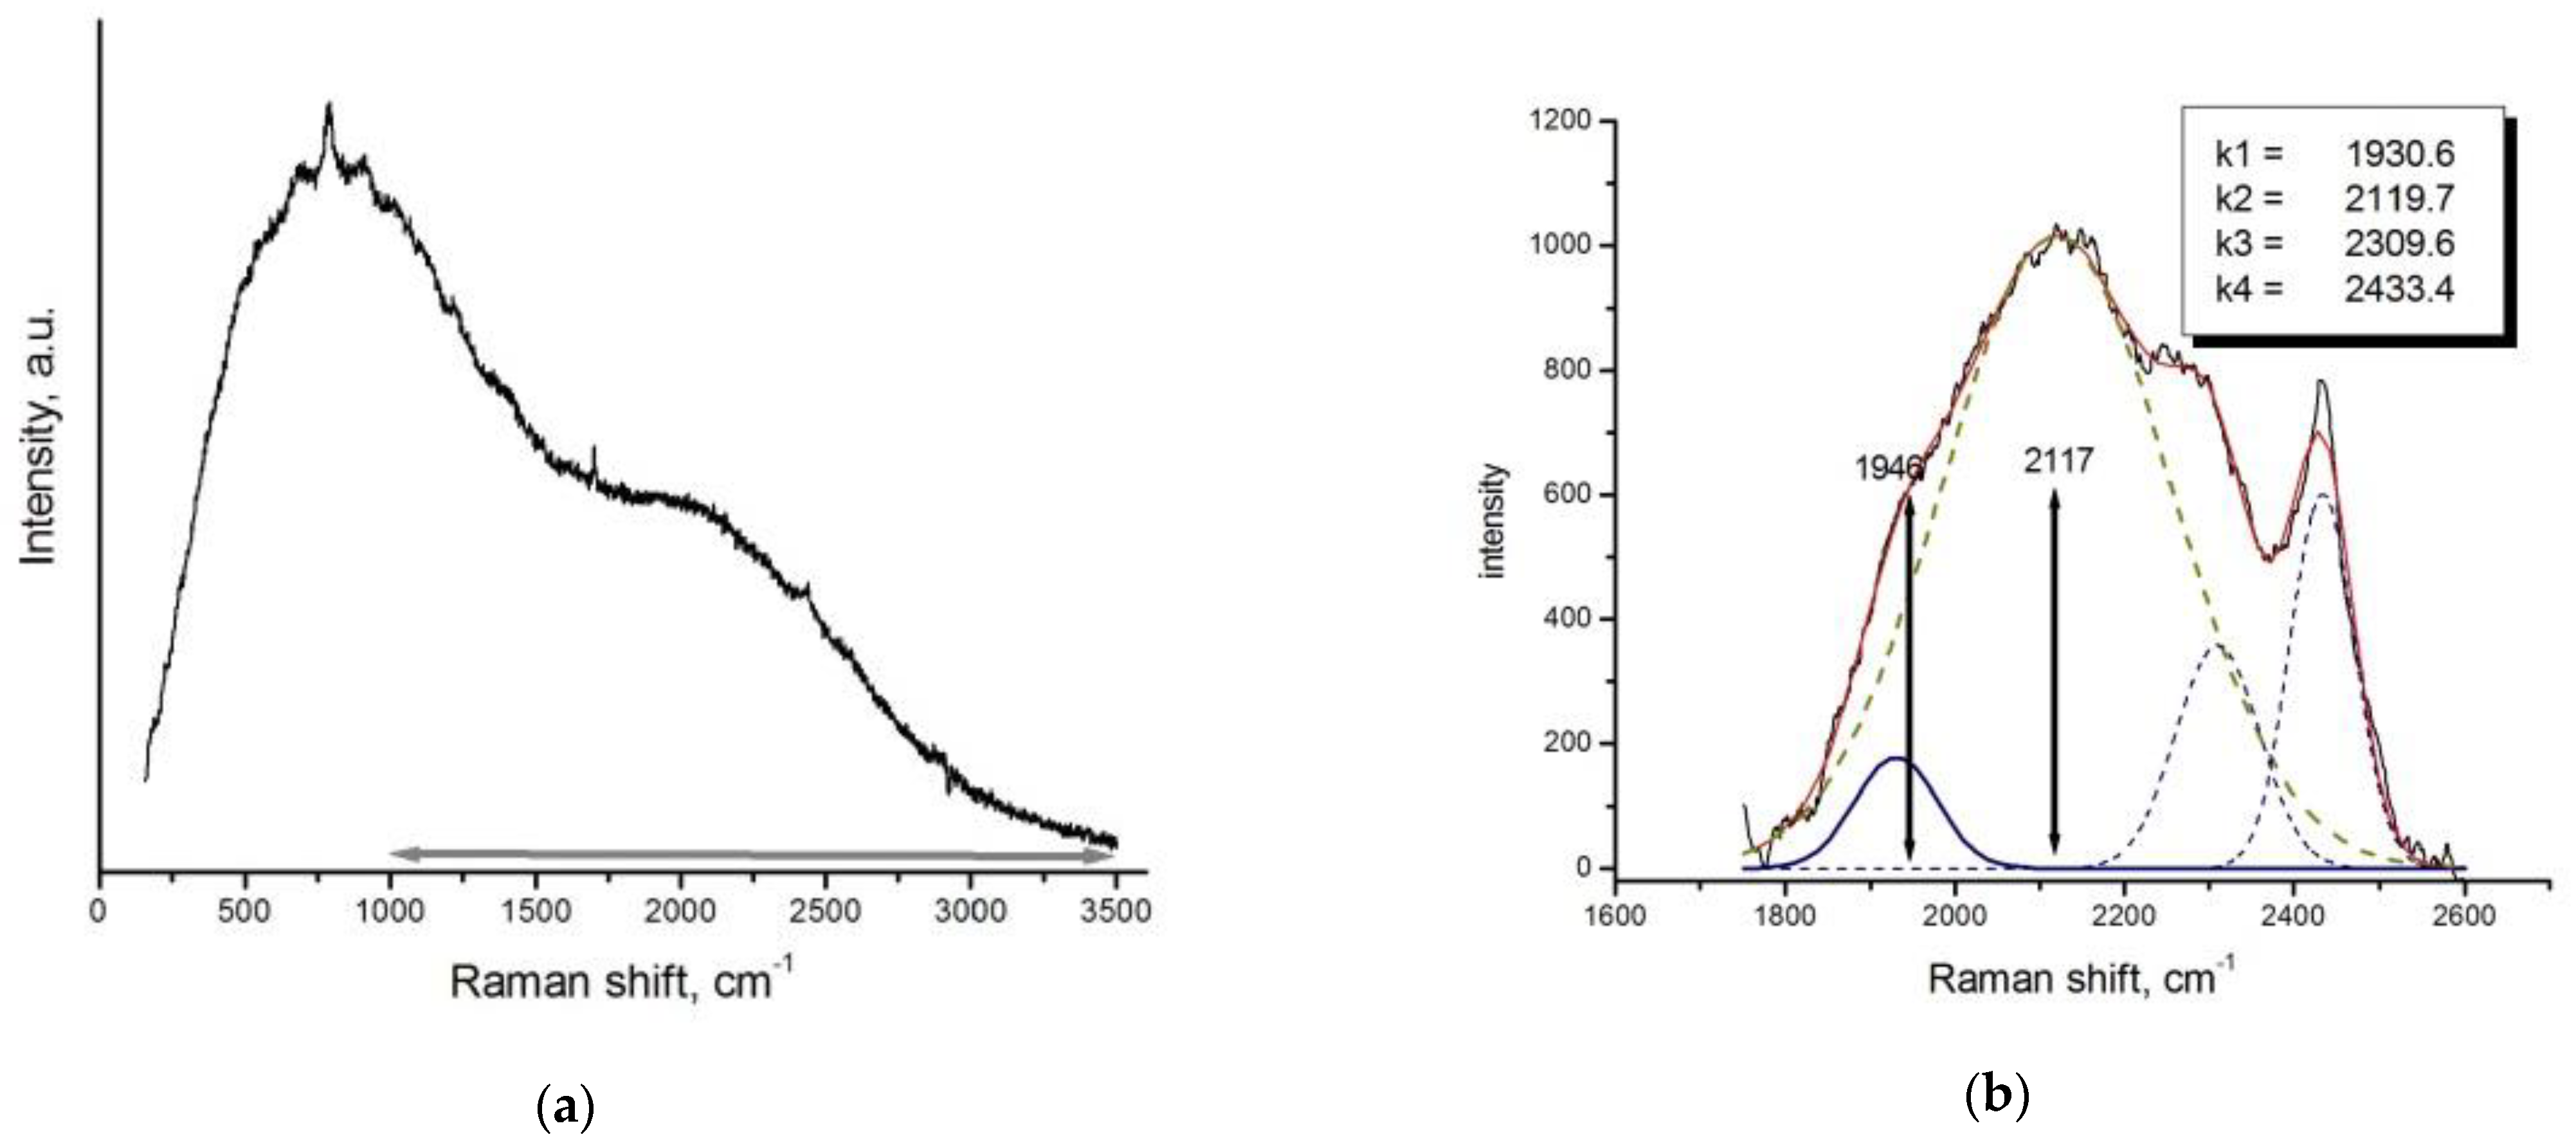
3.2.1. Raman Data Interpretation

The composition of the fluid in the first series of experiments was characterized by micro-Raman measurements of fluid inclusions in the albite glass trap. In Figure 4, Raman spectra of a fluid bubble from run ab108 recorded in Syktyvkar and Toulouse are displayed. They are similar and demonstrate strong CO band at k = 2141 cm−1. Quantitative estimation of the fluid composition can be made in accordance with the following relation (e.g., [31]).
X i = A i / ( σ i ζ i ) k = 1 .. n A k / ( σ k ς k ) ,
where Ai area of the peak, σi–Raman cross-section, а ζi–device efficiency coefficient for component i. The efficiency coefficients of devices are unknown. We use the products zi = σiζi as in [15] zCO = 0.95, zCO2 = 1.25 for bands CO with k = 2140 cm−1 and СО2 with k = 1388 cm−1, correspondingly.

Results of Micro-Raman Study

The initial CO2/CO ratio in the fluid was determined by the composition of the fluid source. When the CO content exceeds the level constrained by CCO buffer, it decomposes into carbon and CO2 at some finite rate. The equilibration of fluid can continue after trapping. The walls of the bubbles in the albite trap from experiment ab86 (P = 200 MPa) were covered with an opaque carbon layer formed in-situ, which hampers to carry out Raman measurements of the fluid composition.
In experiment ab108 (P = 100 MPa) pure MgC2O4 was used and an initial mole ratio (r = CO/CO2 + CO) was 0.5. The equilibrium value constrained by CCO buffer reaction at P = 100 MPa T = 950 °C is 0.23. For the trapped fluid, we estimated r = 0.40 (Syktyvkar) and 0.39 ± 0.03 (Toulouse); the smallest value was obtained for the smallest bubble. All r values are between the initial and equilibrium values, reflecting incomplete equilibration in 2 h.
The fluid composition formed at P = 50 MPa (run ab107) measured in Toulouse corresponds to r = 0.54 ± 0.03. This value is close to the initial value of 0.5 for pure MgC2O4. From these data, it follows that the used values of coefficients zi are in good agreement with the values given in [15]. No carbon was detected in the products of the experiment, despite the fact that the equilibrium XCO = 0.31 is lower than the initial mole fraction. At this pressure, the CO disproportionation rate was negligible. More information is presented in supplementary information (Supplementary text, Figures S1–S4, Table S1).

3.3. Platinum Dissolution in the Fluid

3.3.1. Pt Content in the Traps

The viscosity of the fluid under the PT conditions of our experiments is not more than 1.0 × 10⁻⁵ Pas. Due to the efficient diffusion in such a low viscosity fluid, the quenching phases can become significant in size, which they do. The supplementary information files (capsule_walls_I.xls, capsule_walls_II.xls) contain images of quenching Pt whiskers several tens of microns in length. Platinum is deposited from the fluid mainly as the particles (nuggets). Obviously, the “nugget” picks up metal in a significant volume of the fluid, forming a wide bare zone around itself, which leads to a greater uneven distribution of Pt. Similar nuggets were encountered in experimental studies of the solubility of noble metals in silicate melts (e.g., [32]). However, the possibility of a quenching mechanism of the nugget’s formation is excluded due to the low diffusivity of these metals in silicate melts, the contribution of nuggets is excluded from the analytical data.
Thus, the distribution of platinum particles in fluid traps is inherently irregular. First, the particles were initially located on the surface of the glass shards. When using the local LA-ICP-MS method, the analyzed volume is an ablation pit, the shape of which can be approximated by a hemisphere with a diameter equal to the spot width of 65 µm. The maximum width of fragments of quartz glass was 100–200 µm, albite glass—up to 1000 µm. When the analytical volume avoids the former grain boundaries, the analysis will give a blank result.
The next factor is particles size distribution. The largest particles were formed as a result of mechanical abrasion of the capsule walls. They are rare and there is a small chance of being captured by the ablation pit. The next set of relatively large particles can be attributed to a slow change in the intensive parameters during the experiment, causing a drop in solubility. These particles are larger than the particles formed during the several minutes of the quenching process. 3D distribution of large particles in the albite trap from the experiment ab86 was characterized by microX-Ray computer tomography (x-Ray CMT) with resolution 1.8 mkm (see supplementary information x-Ray_CMTab86.avi). For MCT, the SkyScan 1172 apparatus (MSU, Moscow) was used. Due to the large density contrast (21.45 g/cm3 Pt versus 2.2 g/cm3 glass) strong reflections appear in the recordings of transmission images of sample slices. The actual particles sizes were distorted and x-Ray CMT data cannot be used for a quantitative analysis. As a result, these factors lead to a large scatter in the results of local analysis using the LA-ICP-MS (see supplementary_text, Table S2). The bulk ET-AAS method gives a concentration averaged over the entire volume of the trap (or part of it) that is approximately 3.5 orders of magnitude greater than the sampling volume for LA-ICP-MS. However, in this case, all possible large particles are taken into account that are not related to deposition from the fluid during quenching and, therefore, to solubility.
The most reliable data was obtained for the reference point P = 200 MPa and T = 950 °C with different traps and different analysis methods. For initial CO/CO2 ratio of 0.5 (pure oxalate source) and quartz trap (run qz98), bulk CPt = 57.7 ppm (ET-AAS). The local concentration obtained with LA-ICP-MS is 22.1 ± 15.6 ppm. This difference can be attributed to the irregular in space Pt deposition during CO decomposition. The laser ablation spots transmit the sparsely distributed large Pt particles, resulting in a lower concentrations obtained by the LA-ICP-MS. In run qz118 with an initial r = CO/(CO + CO2) = 0.15 close to the equilibrium ratio r = 0.14, averaged over three parts CPt = 22.9 ± 7 ppm (ET-AAS). Corundum ceramics is the strongest trap, guaranteeing the absence of mechanical contamination. However, it appeared to have an irregular structure with the locally isolated pore space and sometime gives low CPt. As mentioned above, even at the highest laser power, corundum does not evaporate that makes it impossible to use LA-ICP-MS for analysis. The highest bulk concentration (run cor99) obtained by the ET-AAS method for an initial CO/CO + CO2 = 0.5 is 27.5 ppm. The density of corundum is high and the solubility corresponding to this value is practically the same as for qz98 by ET-AAS method (see Table 1). With the fluid generated by the decomposition of FeCO3 (run cor102) the bulk CPt is 11.5 ppm. In terms of solubility, it is close to the value obtained using a quartz glass trap and an equilibrium initial CO/CO2 ratio (183 and 133 ppm for cor102 and qz118, respectively, see Table 1). To assess the dynamics of equilibration of the fluid trap, experiment qz97 was quenched shortly after the decomposition of oxalate at Т = 800 °C and P = 200 MPa (holding for 5 min at these parameters). The local concentration of platinum found by LA-ICP-MS is 15.3 ± 11.8 ppm, which is only slightly lower than the value adopted above for 2 h runs at T = 950 °C. Experiments at low pressure 100 and 50 MPa gave generally lower platinum content. Especially low values of 2.5 and 0.22 ppm were obtained using LA-ICP-MS analysis of albite traps from experiments ab108 (P = 100 MPa) and ab107 (50 MPa), respectively (see Table 1). However, from the single piece ET-AAS analysis of CRT from run cor105 and SGT from run qz120 (P = 100 MPa) we get larger values of 5 and 10 ppm with corresponding solubility of 75.3, 70.5 ppm, respectively. And at P = 50 MPa, the results are similar: the bulk ET-AAS concentrations of SGT (run qz119) and CRT (run cor104) are 11.6 and 5 ppm, which corresponds to solubility of 119 and 93 ppm, which is significantly higher than the solubility of 5.2 ppm from LA-ICP-MS analysis data of AGT (run ab107). In other words, we do not find a large difference between the solubility at 200, 100 and 50 MPa estimated from the bulk analysis of SGT and CRT by the ET-AAS method. However, AGTs analyzed by local LA-ICP-MS have demonstrated a strongly decreasing solubility at lower pressures.

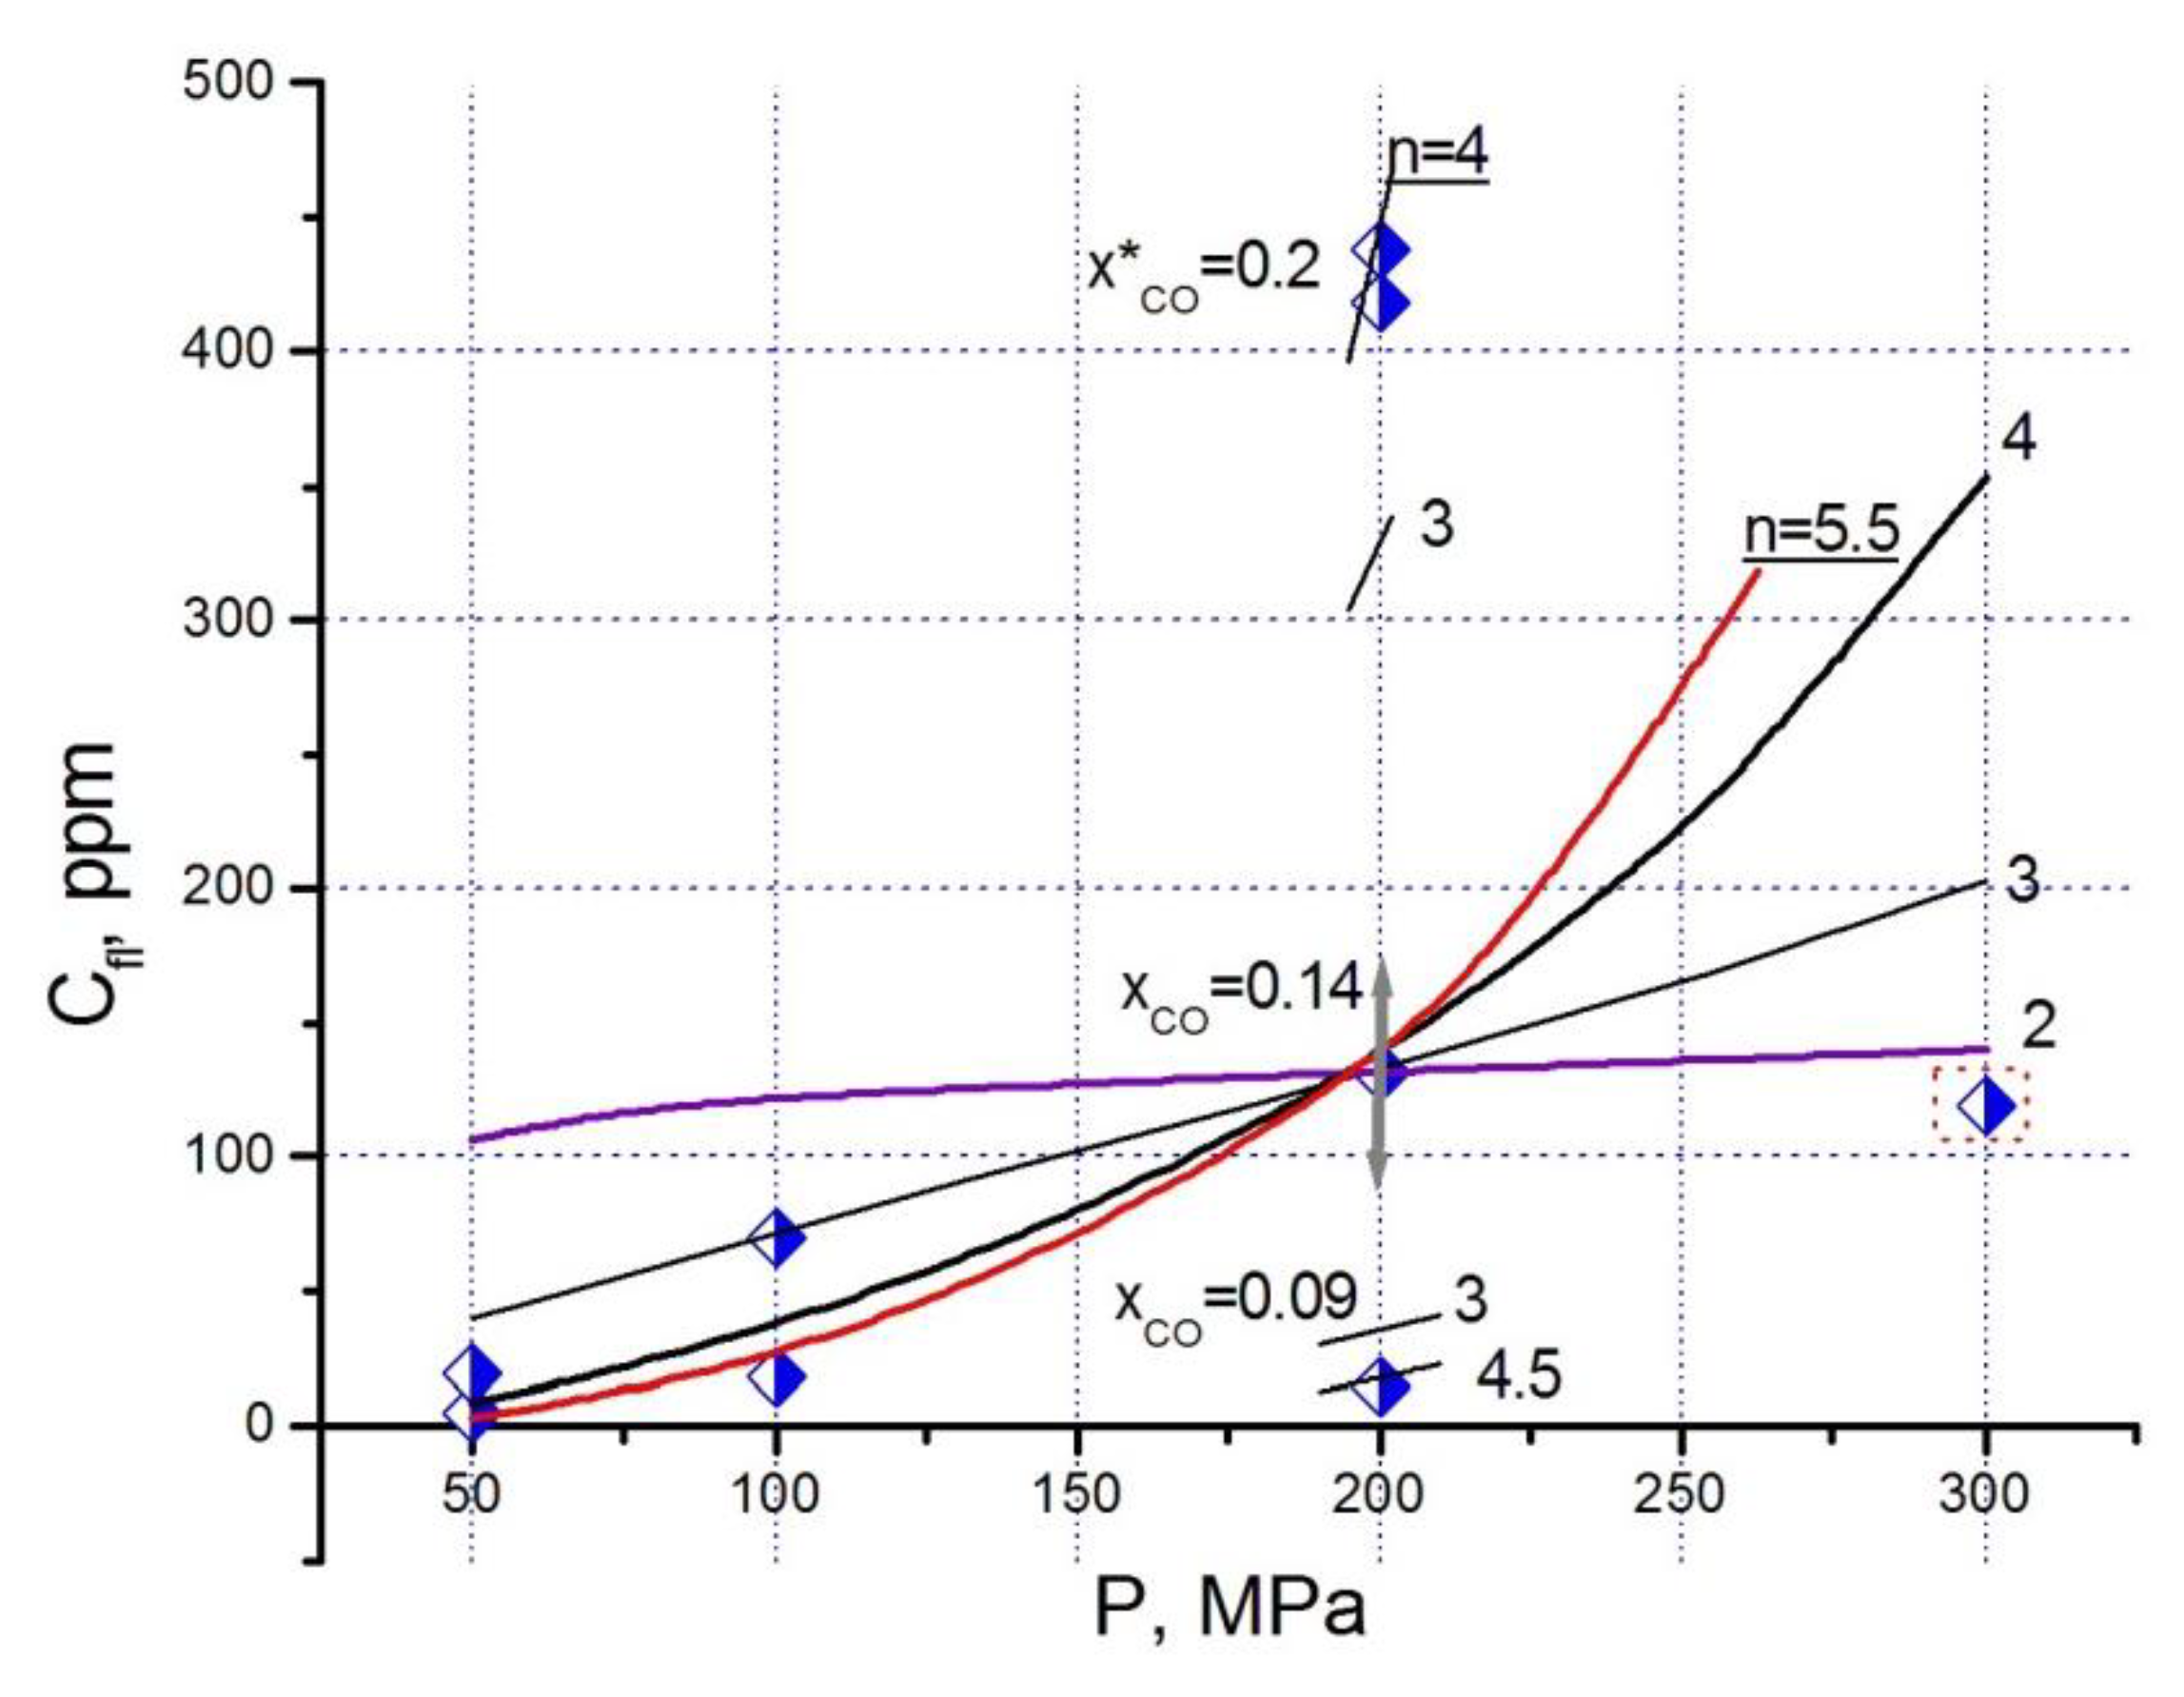
3.3.2. Influence of Pressure and CO Concentration on Pt Solubility

All our estimates of Pt solubility at T = 950 °C are presented in Table 1 and plotted in Figure 5. Variations in solubility caused by the different CO concentrations and pressures are comparable by magnitude. CO concentration in equilibrium with carbon decreases approximately as 1/P1/2, while stability of carbonyl increases with rise of XCO in accordance with reaction scheme:
mPt + nCO = PtmCOn,
as defined by the equilibrium condition
γ C O n X C O n P n 1 γ c r b X P t m ( C O ) n = K ( T ) ,
where ХСО-mole fraction of CO and γi are fugacity coefficients of CO and Pt carbonyl. Using the reference pressure P0, the variation in solubility can be expressed as
C ( P ) C ( P 0 ) = ( X C O γ C O ( P ) X C O γ C O ( P 0 ) ) n ( P 0 P ) n 1 γ c r b ( P 0 ) γ c r b ( P )
In our case, reference pressure is P0 = 200 MPa (T = 950 °C). To estimate the activity coefficient γ for CO, we use the ideal solution model of the non-ideal components and take the fugacity coefficient of pure CO from [27]. The fugacity coefficient for carbonyl is unknown. As a first proxy, we take it equal to γco. We also assume that the speciation of Pt in fluid does not depend on the pressure in the studied interval and its weight concentration is proportional to the carbonyl molar fraction used in equations (12 and 13). The dependence of Pt solubility as a function of pressure was calculated under these assumptions with the reaction coefficient n in the range 2–5.5 and is shown in Figure 5. Plots calculated for n = 4 and 5.5 are in the concentration interval for the pressure range 50–200 MPa. Two groups of experimental points below and above the reference point (P = 200 MPa) arose due to the influence of CO concentration on solubility. The low point corresponds to the published estimate [25] obtained with siderite as a source of fluid and albite fluid trap. The average CO concentration characterized by micro-Raman is 12 mol.%. The best fit with the reported concentration of Pt in the fluid of 15 ppm is obtained for n = 5.1. Upper group of points correspond to the effective solubility in the experiment with MgC2O4 as fluid source. In the course of experiment, mole fraction of CO dropped from 0.5 to some lower value. In experiment ab108 (P = 100 MPa), the molar fraction of CO in the fluid from the albite trap, determined using micro-Raman, is XCO = 0.39, which is between the initial and equilibrium values of 0.5 and 0.21. In experiment ab86 (P = 200 MPa), the walls of the fluid bubbles in the albite trap are coated with carbon, which makes it impossible to analyze the fluid composition using micro-Raman. Reducing of CO content towards CCO buffer limit resulted in the deposition of carbon, carbonyl decomposition and growth of the relatively large Pt particles. By discarding the LA-ICP-MS data points affected by mechanical contamination of trap and large particles, we get an estimate of the solubility in fluid of about 500 ppm. The increase in solubility from 130 to 500 ppm at XCO = 0.18–0.19 can be explained by the effective value of n = 5 in eqn. (13). For low pressure experiments with an albite glass trap analyzed by LA-ICP-MS, n = 5.5 is the best fit. The only value for 300 MPa was obtained with a corundum trap, the use of which often underestimates the results. However, this solubility is at least 100 ppm and is expected to be higher (see Figure 2).

3.4. Solubility of the Pt Quenching Phases in Organic Solvents

Additionally, we study platinum quenching phases soluble in organic solvents chlorophorm and acetone, providing an estimate of the decomposition degree of carbonyl during quenching (Table 2). Platinum deposited from fluid on the walls of capsule, trap, and periclase matrix has the morphology of whiskers and wires with a submicron width and up to tens of microns in length (see Figure 6 and supplementary files capsule_walls_I.xls and capsule_walls_II.xls). This morphology is indicative of high supersaturation and fast growth. Due to decomposition of carbonyl, the concentration of the soluble form of Pt is less than the bulk content determined both by ET-AAS and LA-ICP-MS methods.

3.4.1. Pt in Carbon-Periclase Matrix

As mentioned above, in experiments with MgC2O4 as a fluid source, the periclase matrix was coated with carbon adsorbing carbonyl from the fluid. At the initial stage of the research, the capsule is opened immediately after experiment, some days before being dissolved in acetone. Carbonyl is oxidized in air, and the content of the soluble Pt in the matrix was only 21.8 ppm and 32.4 ppm in experiments 114qz (acetone) and 91qz (chloroform), respectively. The total content of Pt in the periclase matrix was 87.1 and 32,403 ppm (high due to the mechanical contamination) in experiments 114qz and 91qz, respectively. The content of Pt soluble in acetone in experiments 98qz (silica glass trap) and 99cor (corundum trap) was even lower—1.5 and 6.0 ppm, respectively.
When the matrix was placed in acetone immediately after opening of the capsule, the Pt content in the solution was significantly higher. The matrix from runs qz121 and qz122 was thoroughly mixed with acetone, and the Pt concentrations in the solution were 1469 and 2393 ppm, respectively. The duration of these experiments was 21 and 2 h, and the difference in concentration may reflect the gradual decomposition of excess CO and carbonyl over time during approaching the C-CO-CO2 (CCO) buffer equilibrium. The matrix from run 123 was dissolved without stirring, and the concentration of soluble Pt was 17.4 ppm, which is close to the bulk content of quenching Pt in fluid traps treated at P = 200 MPa and T = 950 °C.

3.4.2. Pt in Pure Periclase Matrix

The pure periclase matrix, formed in experiments with MgCO3 + MgC2O4 mixture providing an equilibrium CO/CO2 ratio, was also investigated. Acetone soluble Pt concentrations in the runs O56 and O57 (immediate dissolution) were 1.4 and 3.4 ppm, respectively. Comparison of the data on the periclase matrix with and without carbon indicated that the carbonyl adsorbed on the carbon is almost completely retained during quenching. While in the carbon free matrix only about 13–15% of the carbonyl is conserved.
We also analyze solutions of quenching phases taken by flushing with acetone from the surface of the capsule walls. The total mass of soluble Pt in the flushing liquid was recalculated to the concentration in the fluid, assuming that half of the fluid was in the trap. Residual concentrations in the fluid were estimated at 2–24 ppm, which is 1.5–18% of our estimate of the equilibrium concentration of 130 ppm at the reference point. No systematic difference in Pt concentrations in the flush from runs with and without excess CO was observed.

3.5. Surface-Enhanced Raman Scattering (SERS) Spectra of the Quenching Phase Solution

The concentration of platinum in acetone solution determined with ET-AAS method is in the range 0.01–1 ppm, which is usually below the detection limit of Raman spectroscopy. It was discovered in 1977 that the Raman spectra of compounds adsorbed on the Ag surface are strongly amplified [33]. Currently, this effect known as Surface-Enhanced Raman scattering (SERS) is widely used in practice. For example, nano-sized supercrystals of gold (built of micro-spheres) with amplification factor up to 105 times are applied in medicine and forensic investigations to determine organic compounds [34,35].
In our acetone solutions, native platinum is formed during carbonyls oxidation, which allows spectroscopic investigation of the quenching phase in solution.

3.5.1. Excitation of Raman Spectrum with Infrared Laser

In the first series of measurements, fresh periclase and periclase-carbon matrices were kept in acetone for a day before measurements. In the second series, measurements were made after 10 min of dissolution. In both cases, acetone bands dominate in the spectra.
When using infrared laser light (1064 nm), a broad fluorescence band in the range 1000–3000 сm−1 was obtained after subtracting the acetone spectrum. This band was modulated with several peaks. In the series with a long dissolution time (Figure 7), a peak with a maximum of around 1946 cm−1 is clearly recognized, which corresponds to the main band of the terminal CO in Pt3(CO)62− complex [20]. A bridging CO peak of about 1740 сm−1 can be anticipated from the shoulder of the fluorescence band. In the solution with a small dissolution time (runs O59 and O63), a peak with a maximum of 1954 cm−1 is clearly recognized and can be associated with a polynuclear Pt carbonyl. In addition, two bands with wave numbers k = 210 cm−1 and 420 cm−1 are well expressed. These lines can be attributed to bonds Pt-Pt in metallic nanoparticles. The theoretical Raman spectrum of three atoms cluster has two lines 147 and 228 cm−1 [36]. Pt-Pt stretching mode in the crystalline Pt3Fe is prescribed k = 253 cm−1 [37]. Au micro-particles have a strong Raman band at k = 412 cm−1 [34].

3.5.2. Excitation of Raman Spectrum with Green Laser

When using green laser (λ = 532 nm), the low frequency edge of the fluorescence band is shifted to kleft = 100 cm−1 (Far Infrared), and the maximum—to kmax = 800 cm−1—compared to kleft = 1000 cm−1 and kmax = 2000 cm−1 for an infrared laser (λ = 1064 nm). In the spectrum of the O59 sample (Figure 8), the local maximum on the shoulder of the fluorescence band is located in the region of CO vibrations of about 2100 cm−1. The spectrum obtained when subtracting the smooth fluorescence band is deconvoluted in four Gaussians, two of which with k = 1931 cm−1 and 2119.7 cm−1 are close to the platinum carbonyl lines. Thus, spectroscopic observations are direct evidence of the formation of Pt carbonyls at high PT parameters.

4. Discussion

It is generally accepted that in the post-magmatic processes, platinum is dissolved in a hydrous fluid in the form of chloride, bisulphide, polysulphide, thiosulphate, depending on pH, fO2, temperature and ligand concentration [38,39,40]. The calculated maximum solubility of PtS at fO2 near QFM-1 at T = 300 °C as Pt(HS)2 is 3 ppb in an acidic fluid and 0.01 ppb in an oxidized conditions at pH = 2 as PtCl42− [41]. Our results demonstrated that at P = 200 MPa and T = 950 °C platinum solubility in the carbonic fluid in the form of carbonyl at the low CO content is about 15 ppm and increases to 130 ppm in the equilibrium with graphite. This value approaches the highest solubility level of Au in the hydrous fluid under close pressure–temperature (PT) conditions and high fO2 [11]. This means that the formation of carbonyl itself can be an important mechanism for the transport of Pt by fluid at the post-magmatic stage of evolution of layered ultramafic-mafic intrusions. There are numerous observations that the chlorine content in such fluids is high, which makes it possible to associate the transfer of Pt with chlorine [42]. Mixed chlorine/carbonyl complexes of Pt are known under ambient conditions and their study at elevated PT parameters deserves attention.
Our preliminary data indicate that low concentration of H2O in CO-CO2 fluid increases the solubility of Pt (see supplementary text, Table S3). As described in details in [25], we are limited in our attempts to quantitatively constrain the solubility of Pt using a dry CO-CO2 fluid due to the use of Pt capsules in the IHPV apparatus. During the experiment, the fluid is oxidized via the loss of H2 through the capsule walls, and it is not clear to what extent the high contents of Pt in the traps in hydrous carbonic fluid is caused by the re-deposition of Pt under conditions of the fO2 gradient. In the presence of water, organic compounds may form, which are potential ligands for complexation with Pt. However, it is expected that at P = 200 MPa and T above c.a. 700 °C (close to subsolidus conditions of mafic intrusions) CO predominates as a form of reduced carbon [13], and complexation with organic ligands can become significant at lower temperatures. As it follows from our experiments, carbon (graphite) will adsorb Pt carbonyl and may contribute to the concentration of the diluted relative PGE natural fluids. The origin of graphitized rocks enriched in PGE and Au [43] may be related to this process.
Carbonyl speciation may explain origin of isoferroplatinum (Pt3Fe), the most abundant nonsulfide platinum mineral. It is the main mineral of placer PGE deposits related to the origin of ring alkaline-ultrabasic (Konder) and ring ultrabasic-basic (Alaska type) intrusions. Pt alloys are also quite common in the Bushveld intrusion, where the main forms of platinum are sulfides, arsenides, tellurides [44]. Some investigators attributed the formation of Pt-Fe alloys to the magmatic stage of evolution of gabbro-pyroxenite-dunite massifs (e.g., [45,46]). Karpinsky in 1926 (see in [1]) proposed metasomatic mechanism of formation of chromitite-Pt association as a result of interaction of dunite with fluid containing Cr and Pt. Some modern researchers are developing similar models of the interaction cumulus-fluid as a mechanism of PGE localization [1,47].
Assuming crystallization of Pt3Fe from fluid, it should be noted that oxygen fugacity in ultramafic-mafic intrusions is close to CCO (near QFM-2) and much exceeds the IW buffer. Consequently, iron is present in the fluid as the Fe2+ ion and is reduced to native metal during the deposition of Pt3Fe. The specific mechanism of Pt3Fe crystallization can be associated with the nature of platinum carbonyl. The most probable form is the multinuclear anion Pt3(CO)62−. The origin of the negative charge can be explained with redox reactions:
Pt3(CO) 6 + O2− + CO = Pt3(CO)62− + CO2,
Pt3(CO) 6 + 2Fe2+ = Pt3(CO)62− + 2Fe3+
If the anionic form of the carbonyl does prevail, a neutral complex with Fe2+ will naturally form in the fluid:
Pt3(CO)62− + Fe2+ = FePt3(CO)6
At the decomposition of this complex during quenching in experiment or in due to a decrease in the CO fugacity in nature, isoferroplatinum crystallizes:
FePt3(CO)6 = Pt3Fe+ 6CO,
The formation of a Fe-Pt alloy with a higher Fe content (tetraferroplatinum PtFe) can be explained by the secondary leaching of Pt from isoferroplatinum. The less common Pt2FeCu and Pt3Cu are also thought to be formed from lower temperature fluid leaching [48].

Supplementary Materials

The following are available online at https://0-www-mdpi-com.brum.beds.ac.uk/2075-163X/11/2/225/s1, word file S1: suppl. text, excel sheet S2: capsule wall I, excel sheet S3: capsule wall II. Figure S1: Optic images of the bubbles, run ab108, Figure S2: Raman spectra of fluid, run ab108, Figure S3: Optic images of the bubbles, run ab107, Figure S4: Raman spectra of fluid, run ab107, Figure S5: Examples of representative LA-ICP-MS transient signals, Table S1: Measurements of CO concentration in fluid, Table S2: Measurements of Pt concentration by LA-ICP-MS method, Video S1:. x-Ray_CMTab86.avi.

Author Contributions

Conceptualization, project administration and writing were carried out by A.S.; experimental work was done by T.S. and O.S.; Raman measurements were performed by G.B., S.I.I., G.S.P.; interpretation of Raman data by A.S., LA-ICP-MS analysis was done by A.S., G.S.P. and A.Y.B.; microprobe analysis and SEM observations were done by A.N.; ET-AAS analyses were performed by O.T. All authors have read and agreed to the published version of the manuscript.

Funding

This study was supported by Russian Foundation for Basic Research, project no. 18-05-00597, visit of AS to Toulouse was funded by Metchnikov program-2018 grant.

Institutional Review Board Statement

Not applicable.

Informed Consent Statement

Not applicable.

Data Availability Statement

The data presented in this study are available on request from the corresponding author.

Acknowledgments

Authors thank Dmitriy Korost (MSU, Moscow) for MCT study of our run products. Two anonymous reviewers appreciably improve the final version of MS.

Conflicts of Interest

The authors declare no conflict of interest.

References

  1. Mochalov, A.G. A genetic model of PGM in cumulative gabbro-pyroxenite-dunite complexes of Koryak Highland, Russia. Geol. Ore Depos. 2013, 66, 145–161. [Google Scholar] [CrossRef]
  2. Kanitpanyacharoen, W.; Boudreau, A.E. Sulfide-associated mineral assemblages in the Bushveld Complex, South Africa: Platinum-group element enrichment by vapor refining by chloride–carbonate fluids. Miner Depos. 2013, 48, 193–210. [Google Scholar] [CrossRef]
  3. Yudovskaya, M.; Kinnaird, J.; Naldrett, A.J.; Rodionov, N.; Antonov, A.; Simakin, S.; Kuzmin, D. Trace-element study and age dating of zircon from chromitites of the Bushveld Complex (South Africa). Miner. Petrol. 2013, 107, 915–942. [Google Scholar] [CrossRef]
  4. Mathez, E.A.; Dietrich, V.J.; Holloway, J.R.; Boudreau, E. Carbon Distribution in the Stillwater Complex and Evolution of Vapor during Crystallization of Stillwater and Bushveld Magmas. J. Petrol. 1989, 30, 153–173. [Google Scholar] [CrossRef] [Green Version]
  5. Ballhaus, C.G.; Stumpfl, E.F. Occurrence and petrological significance of graphite in the Upper Critical Zone, Western Bushveld Complex, South Africa. Earth Planet. Sci. Lett. 1985, 74, 58–68. [Google Scholar] [CrossRef]
  6. Hanley, J.J.; Mungall, J.E.; Pettke, T.; Spooner, E.T.C.; Bray, C.J. Fluid and Halide Melt Inclusions of Magmatic Origin in the Ultramafic and Lower Banded Series, Stillwater Complex, Montana, USA. J. Petrol. 2008, 49, 1133–1160. [Google Scholar] [CrossRef] [Green Version]
  7. Konnikov, E.G.; Vasyukova, O.N. Composition of Fluid Inclusions from Intrusive Rocks of the Norite–Cortlandite Complex, Kamchatka. Geol. Ore Depos. 2007, 49, 227–237. [Google Scholar] [CrossRef]
  8. Konnikov, E.G.; Meuer, W.P.; Neruchev, S.S.; Prasolov, E.M.; Kislov, E.V.; Orsoev, D.A. Fluid regime of platinum group elemens (PGE) and gold-bearing reef formation in the Dovyren mafic-ultramafic layered complex, eastern Siberia, Russia. Miner. Depos. 2000, 35, 526–532. [Google Scholar] [CrossRef]
  9. Hanley, J.J.; Mungall, J.E.; Pettke, T.; Spooner, E.T.C.; Bray, C.J. Ore metal redistribution by hydrocarbon–brine and hydrocarbon–halide melt phases, North Range footwall of the Sudbury Igneous Complex, Ontario, Canada. Miner. Depos. 2005, 40, 237–256. [Google Scholar] [CrossRef] [Green Version]
  10. Shcheka, G.G.; Lehmann, B.; Gierth, E.; Gömann, K.; Wallianos, A. Macrocrystals of Pt–Fe alloy from the Kondyor PGE placer deposit, Khabarovskiy Kray, Russia: Trace-element content, mineral inclusions and reaction assemblages. Can. Miner. 2004, 42, 601–617. [Google Scholar] [CrossRef]
  11. Pokrovski, G.S.; Borisova, A.Y.; Harrichoury, J.C. The effect of sulfur on vapor-liquid fractionation of metals in hydrothermal systems. Earth Planet Sci. Lett. 2008, 266, 345–362. [Google Scholar] [CrossRef]
  12. Uel’skiy, A.A.; Grebennikov, A.V.; Storozhenko, P.A. Carbonyl Materials: Preparation, Properties, and Application. Polym. Sci. Ser. D Glues Seal. Mater. 2011, 4, 228–235. [Google Scholar] [CrossRef]
  13. Simakin, A.G.; Kislov, E.V.; Salova, T.P.; Shaposhnikova, O.Y.; Nekrasov, A.N. Reduced CO2 Fluid as an Agent of Ore-Forming Processes: A Case Study of Dolomite-Replacement Skarns at the Yoko-Dovyren Massif. Petrology 2019, 27, 1–16. [Google Scholar] [CrossRef]
  14. Torok, K.; Degi, J.; Szep, A.; Marosi, G. Reduced carbonic fluids in mafic granulite xenoliths from the Bakony–Balaton Highland Volcanic Field, W-Hungary. Chem. Geol. 2005, 223, 93–108. [Google Scholar] [CrossRef]
  15. Bergman, S.C.; Dubessy, J. CO2–CO fluid inclusions in a composite peridotite xenolith: Implications for upper mantle oxygen fugacity. Contrib. Miner. Petrol. 1984, 85, 1–13. [Google Scholar] [CrossRef]
  16. Simakin, A.; Salova, T.; Devyatova, V.; Zelensky, M. Reduced carbonic fluid and possible nature of high K magmas of Tolbachik. J. Volcanol. Geotherm. Res. 2015, 307, 210–221. [Google Scholar] [CrossRef]
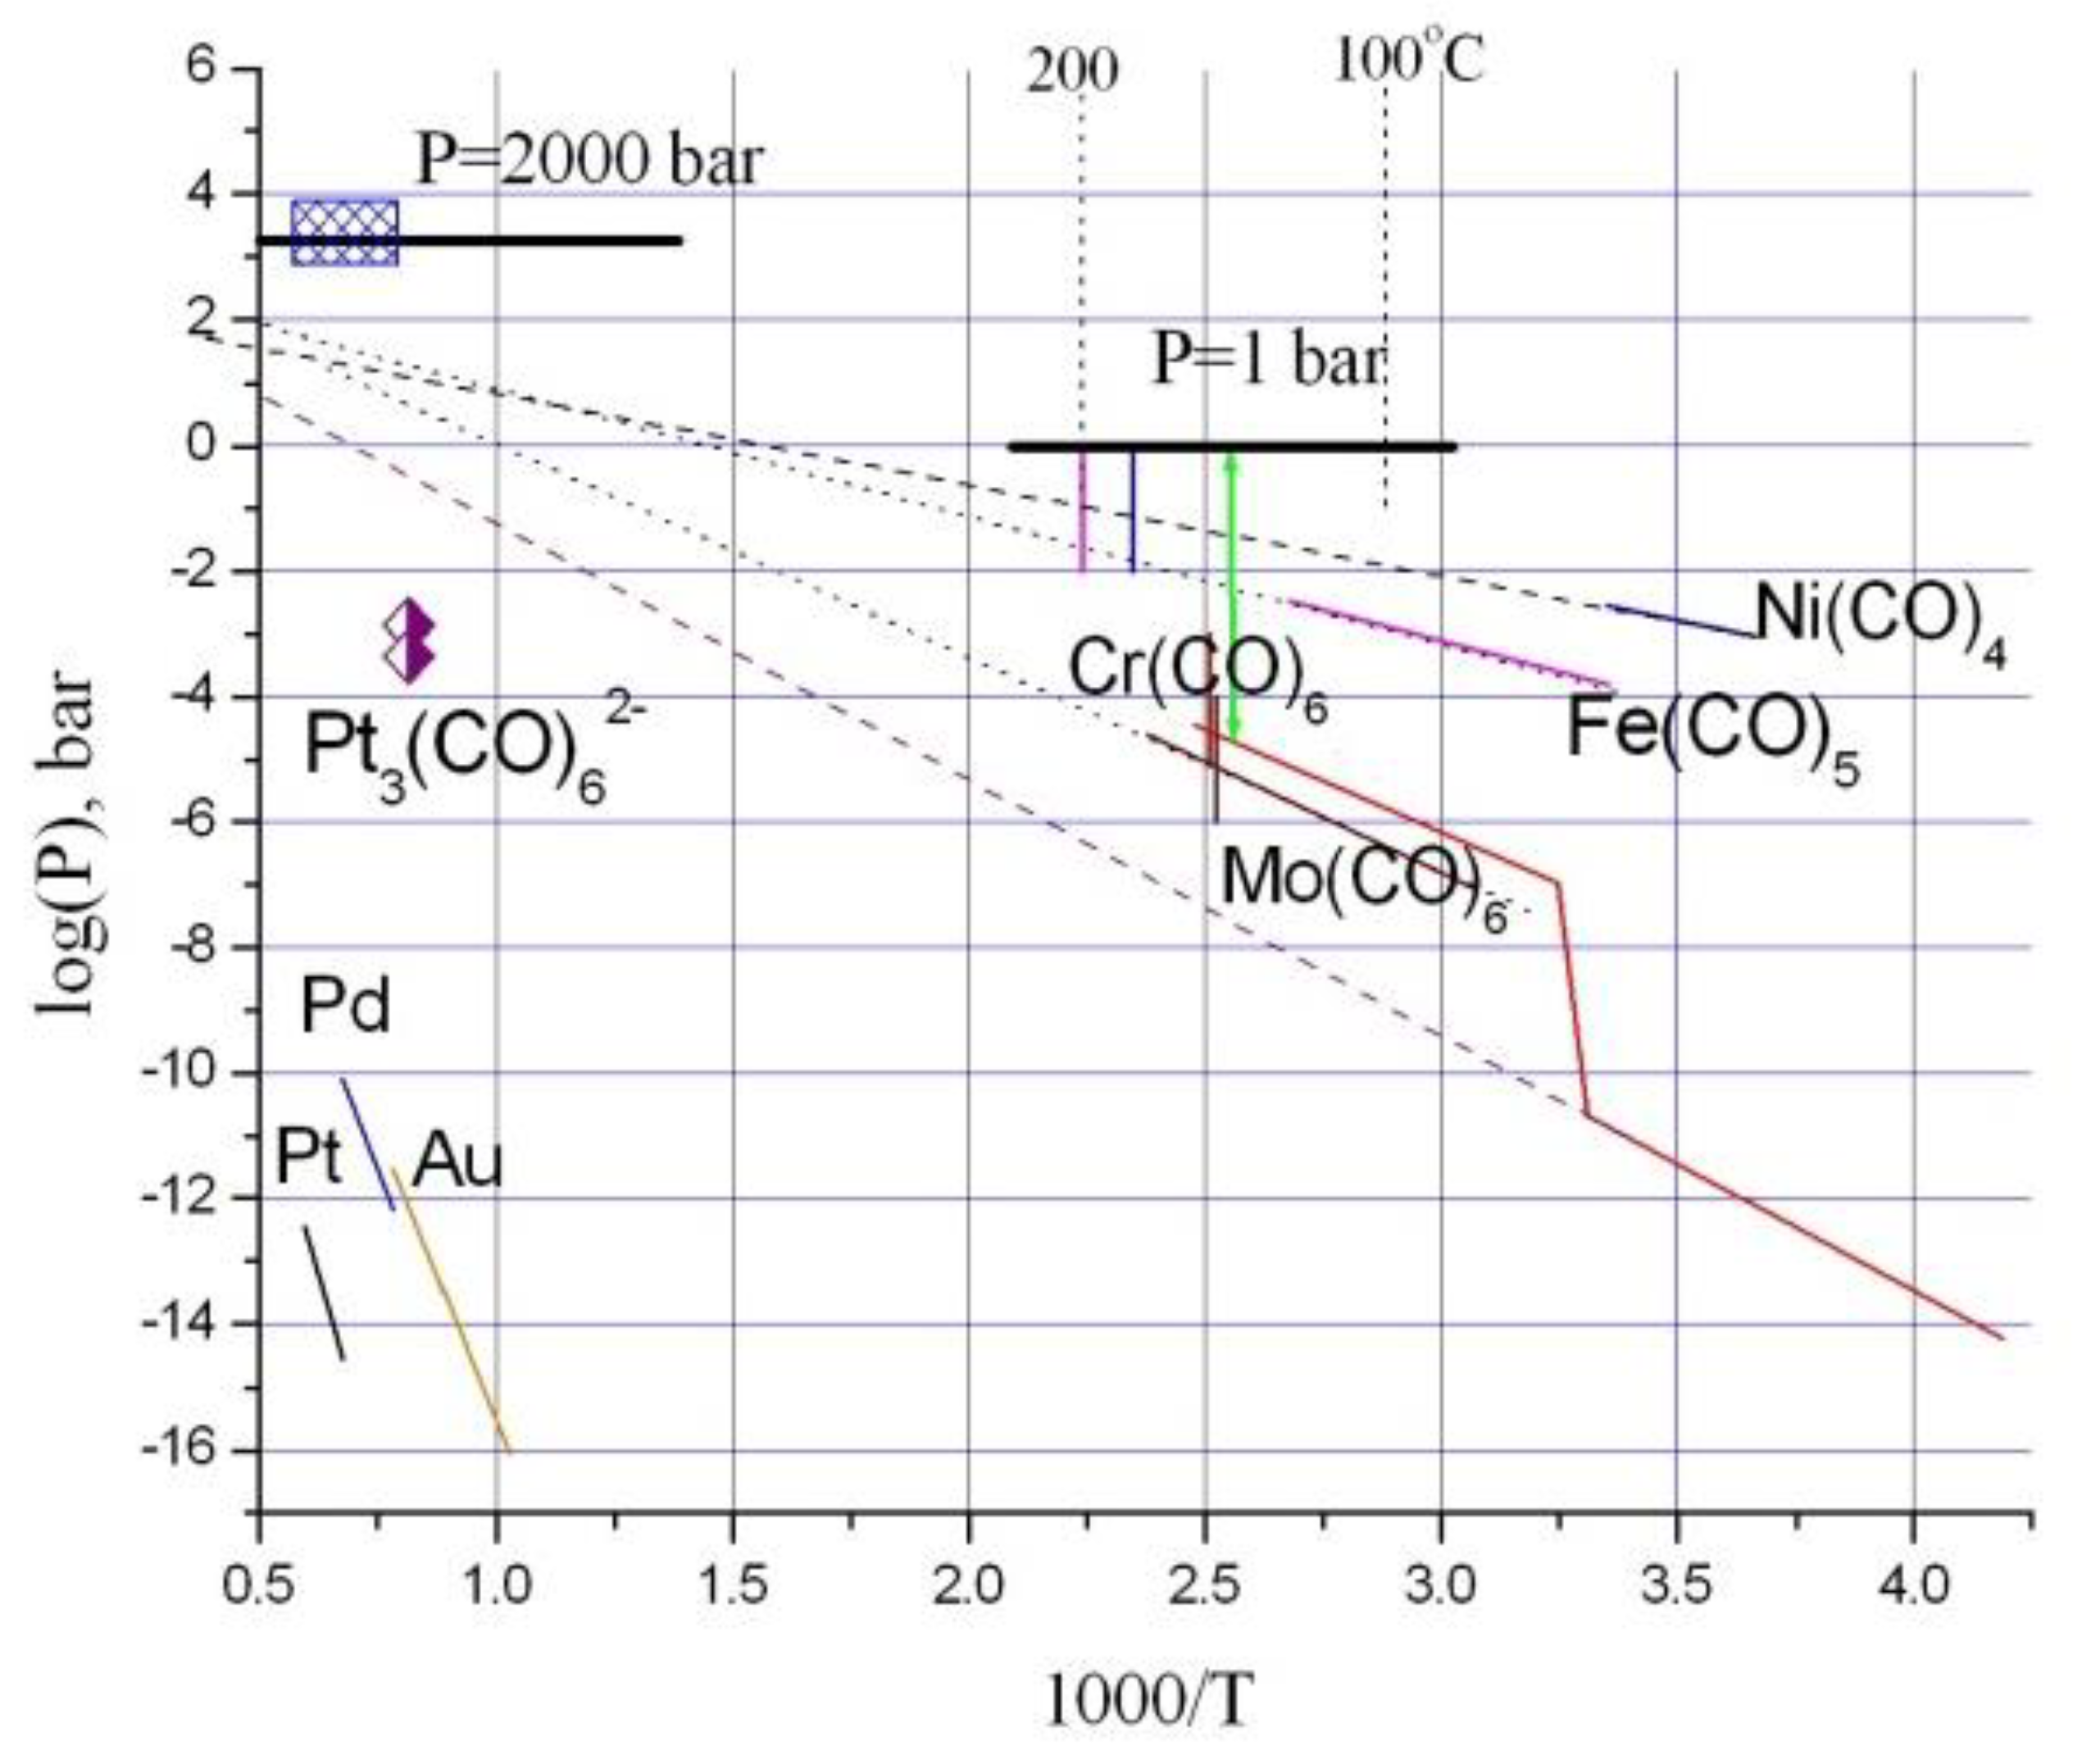
  17. Gamer, M. Vapor Pressures and Thermodynamic Properties of Tungsten, Chromium, Cobalt and Rhodium Carbonyls. Ph.D. Thesis, University of Nevada, Reno, NV, USA, 1994; p. 80. [Google Scholar]
  18. Moskvin, A.B. (Ed.) New Handbook of Chemist and Technologist. v.12. General Information: Structure of Matter; World and Family: Saint Petersburg, Russia, 2006; p. 1464. (In Russian) [Google Scholar]
  19. Kundig, E.P.; McIntosh, D.; Moskovits, M.; Ozin, G.A. Binary Carbonyls of Platinum, Pt(CO)n, (Where n = 1–4). A Comparative Study of the Chemical and Physical Properties of M(CO)n, (Where M = Ni, Pd, or Pt; n = 1–4). J. Am. Chem. Soc. 1973, 95, 7234–7241. [Google Scholar] [CrossRef]
  20. Longoni, G.; Chini, P. Synthesis and Chemical Characterization of Platinum Carbonyl Dianions [Pt3(C0)6]n2- (n = −10, 6, 5, 4, 3, 2, 1). A New Series of Inorganic Oligomers. J. Am. Chem. Soc. 1976, 98, 7225–7231. [Google Scholar] [CrossRef]
  21. Torigoe, K.; Remita, H.; Picq, G.; Belloni, J.; Bazin, D. Structural Characterization of Supported Platinum Carbonyl Clusters by X-ray Absorption Spectroscopy. J. Phys. Chem. B 2000, 104, 7050–7056. [Google Scholar] [CrossRef] [Green Version]
  22. Li, G.J.; Fujimoto, T.; Fukuoka, A.; Ichikawa, M. Ship-in-Bottle synthesis of Pt9-Pt15 carbonyl clusters inside NaY and NaX zeolites, in-situ FTIR and EXAFS characterization and the catalytic behaviors in 13CO exchange reaction and NO reduction by CO. Catal. Lett. 1992, 12, 171–186. [Google Scholar] [CrossRef]
  23. Bradford, C.W. The Carbonyls of the Platinum Group Metals. Platin. Metals Rev. 1972, 16, 50–55. [Google Scholar]
  24. Kessel, R.; Schmidt, M.W.; Ulmer, P.; Pettke, T. Trace element signature of subduction-zone fluids, melts and supercritical liquids at 120–180 km depth. Nature 2005, 437, 724–727. [Google Scholar] [CrossRef]
  25. Simakin, A.G.; Salova, T.P.; Gabitov, R.I.; Isaenko, S.I. Dry CO2–CO fluid as an important potential deep Earth solvent. Geofluids 2016, 16, 1043–1057. [Google Scholar] [CrossRef]
  26. Kerrick, D.M.; Jacobs, G.K. A modified redlich-kwong equation of state for H2O, CO2, and H2O–CO2 mixtures at elevated pressures and temperatures. Am. J. Sci. 1981, 281, 735–767. [Google Scholar]
  27. Shi, P.; Saxena, S.K. Thermodynamic modeling of the C–H–O–S fluid system. Am. Miner. 1992, 77, 1038–1049. [Google Scholar]
  28. Borisova, A.Y.; Toutain, J.-P.; Stefansson, A.; Gouy, S.; de Parseval, P. Processes controlling the 2010 Eyjafjallajökull explosive eruption. J. Geophys. Res. 2012, 117, B05202. [Google Scholar] [CrossRef]
  29. Jochum, K.P.; Weis, U.; Stoll, B.; Kuzmin, D.; Yang, Q.; Raczek, I.; Jacob, D.E.; Stracke, A.; Birbaum, K.; Frick, D.A.; et al. Determination of Reference Values for NIST SRM 610–617 Glasses Following ISO Guidelines. Geostand. Geoanal. Res. 2011, 35, 397–429. [Google Scholar] [CrossRef]
  30. Kubrakova, I.V.; Nabiullina, S.N.; Tyutyunnik, O.A. Au and PGE Determination in Geochemical Materials: Experience in Applying Spectrometric Techniques. Geochem. Int. 2020, 58, 377–390. [Google Scholar] [CrossRef]
  31. Burke, E.A.J. Raman microspectrometry of fluid inclusions. Lithos 2001, 55, 139–158. [Google Scholar] [CrossRef]
  32. Jégo, S.; Pichavant, M. Gold solubility in arc magmas: Experimental determination of the effect of sulfur at 1000 °C and 0.4 GPa. Geochim. Cosmochim. Acta 2012, 84, 560–592. [Google Scholar] [CrossRef] [Green Version]
  33. Albrecht, M.G.; Creighton, J.A. Anomalously Intense Raman Spectra of Pyridine at a Silver Electrode. J. Am. Chem. Soc. 1977, 99, 5215–5217. [Google Scholar] [CrossRef]
  34. Radzol, A.R.M.; Lee, K.Y.; Mansor, W.; Yahaya, S.R. Nano-Scale Characterization of Surface Enhanced Raman Spectroscopic Substrates. Procedia Eng. 2012, 41, 867–873. [Google Scholar] [CrossRef] [Green Version]
  35. Matricardi, C.; Hanske, C.; Garcia-Pomar, J.L.; Langer, J.; Mihi, A.; Liz-Marzán, L.M. Gold Nanoparticle Plasmonic Superlattices as Surface Enhanced Raman Spectroscopy Substrates. ACS Nano 2018, 12, 8531–8539. [Google Scholar] [CrossRef] [Green Version]
  36. Singh, N.B.; Sarkar, U. Structure, vibrational, and optical properties of platinum cluster: A density functional theory approach. J. Mol. Model 2014, 20, 2537. [Google Scholar] [CrossRef]
  37. Kloprogge, J.T.; Wood, B.J. X-ray photoelectron spectroscopy and Raman microscopy of ferroan platinum crystal from the Kondyor Massif, Russian Far East. Spectrosc. Lett. 2018, 52, 43–48. [Google Scholar] [CrossRef]
  38. Mountain, B.W.; Wood, S.A. Solubility and Transport of Platinum-Group Elements in Hydrothermal Solutions: Thermodynamic and Physical Chemical Constraints. In Geo-Platinum 87; Prichard, H.M., Potts, P.J., Bowles, J.F.W., Cribb, S.J., Eds.; Springer: Dordrecht, The Netherlands, 1988; pp. 57–82. [Google Scholar] [CrossRef]
  39. Sassani, D.C.; Shock, E.L. Solubility and transport of platinum-group elements in supercritical fluids: Summary and estimates of thermodynamic properties for ruthenium, rhodium, palladium, and platinum solids, aqueous ions, and complexes to 1000 °C and 5 kbar. Geochim. Cosmochim. Acta 1998, 62, 2643–2671. [Google Scholar] [CrossRef]
  40. Kubrakova, I.V.; Tyutyunnik, O.A.; Silantyev, S.A. Mobility of Dissolved Palladium and Platinum Species during the Water–Rock Interaction in a Chloride Environment: Modeling of PGE Behavior during Interaction between Oceanic Serpentinites and Seawater Derivatives. Geochem. Int. 2019, 57, 282–289. [Google Scholar] [CrossRef]
  41. Barnes, S.J.; Liu, W. Pt and Pd mobility in hydrothermal fluids: Evidence from komatiites and from thermodynamic modeling. Ore Geol. Rev. 2012, 44, 49–58. [Google Scholar] [CrossRef]
  42. Barnes, S.J.; Campbell, I.H. Role of late magmatic fluids in Merensky-type platinum deposits: A discussion. Geology 1988, 16, 488–491. [Google Scholar] [CrossRef]
  43. Khanchuk, A.I.; Plyusnina, L.P.; Ruslan, A.V.; Likhoidov, G.G.; Barinov, N.N. Nature of Graphitization and Noble Metal Mineralization in Metamorphic Rocks of the Northern Khanka Terrane, Primorye. Geol. Ore Depos. 2013, 55, 225–244. [Google Scholar] [CrossRef]
  44. Schouwstra, R.P.; Kinloch, E.D.; Lee, C.A. A Short Geological Review of the Bushveld Complex. Platin. Met. Rev. 2000, 44, 33–39. [Google Scholar]
  45. Johan, Z.; Ohnenstetter, M.; Slansky, E.; Barron, L.M.; Suppel, D. Platinum mineralization in the Alaskan-type intrusive complex near Fifield, New South Wales, Australia: Part 1. platinum group minerals in clinopyroxenites of the Kelvin Grove Prospect, Owendale Intrusion. Miner. Petrol. 1989, 40, 289–309. [Google Scholar] [CrossRef]
  46. Johan, Z.; Slansky, E.; Kelly, D.A. Platinum nuggets from the Kompiam area, Enga Province, Papua New Guinea: Evidence for an Alaskan-type complex. Miner. Petrol. 2000, 68, 159–176. [Google Scholar] [CrossRef]
  47. Ivanov, O.K. Concentrically Zoned Pyroxenite–Dunite Massifs of the Urals: Mineralogy, Petrology, and Genesis; UrGU: Yekaterinburg, Russia, 1997; 32p, ISBN 5-7525-0507-0. (In Russian) [Google Scholar]
  48. Tolstykh, N.; Krivenko, A.; Sidorov, E.; Laajoki, K.; Podlipsky, M. Ore mineralogy of PGM placers in Siberia and the Russian Far East. Ore Geol. Rev. 2002, 20, 1–25. [Google Scholar] [CrossRef]
Figure 1. Vapor pressures of carbonyls of the transient metals and PGE according to the experimental data [17,18]. Vertical lines depict decomposition temperature at P = 1 bar. Value of the partial pressure of Pt carbonyl is plotted in accordance to our experimental data. Crossed rectangle corresponds to the typical PT parameters of the cumulus processes in the ultramafic–mafic intrusions.
Minerals 11 00225 g001
Figure 2. The scheme of our experiments (a) oxalate or (and) carbonate were placed in the small open capsule within the welded larger one. On the bottom of the large capsule, fluid trap was placed. Fluid trap was a powder of albite or porous ceramics (b) SEM image of the piece of the quartz glass ceramics after experiment (qz98).
Minerals 11 00225 g002
Figure 3. Products of experiments with reduced carbonic fluid at P = 200 MPa and T = 950 °C (a) SEM micro-image of quenching glass balls with Pt, run ab84 on the bottom of the capsule; (b) SEM micro-image of Pt microparticles on the surface of quartz glass shreds of the fluid trap from experiment qz98.
Minerals 11 00225 g003
Figure 4. Raman spectrum of the same fluid bubble from AGT of the run ab108 recorded in two laboratories. CO band is near k = 2140 cm−1 and CO2 bands are at k = 1388 cm−1 and 1286 cm−1.
Minerals 11 00225 g004
Figure 5. Interpretation of the experimental data on the Pt solubility in CO-CO2 fluid at T = 950 °C. Circles are experimental points from Table 1. Curves plotted through the most reliable point P = 200 MPa and xCO = 0.14 (equilibrium CCO) are results of extrapolation for different formula of carbonyl complex Ptm(CO)n: n = 2; 3; 4; 5.5. Points beyond curves at P = 200 MPa are for different CO concentrations. Upper group (xCO = 0.19) short lines are calculated at n = 3 and 4.0 (best fit) and for the lower point (xCO = 0.09) at n = 3 and 4.5 (best fit). Point at P = 300 MPa is out of sequence.
Minerals 11 00225 g005
Figure 6. Platinum alloys in experimental samples (a) BSE micro-image of carbon and MgO coated platinum capsule wall from experiment qz121; Pt/Fe atomic ratio is 4.2 ± 0.6; different morphology of Pt particles from dot to hair-like can be seen (image width 76 µm) (b) BSE micro-image of carbon and MgO coated platinum capsule wall from experiment qz122 (image width 76 µm); platinum particle from the wall is labeled with an arrow.
Minerals 11 00225 g006
Figure 7. Spectra of the solution in acetone of quenched phases in periclase-carbon matrix from the runs O56 and O57 measured with red laser (spectrum of pure acetone is subtracted), dissolution time of a day; (a) fluorescence band with peaks, peaks of Pt carbonyl are labeled with vertical dashed lines; (b) peaks assignment for the O56 spectrum (broad fluorescence band is subtracted).
Minerals 11 00225 g007
Figure 8. Spectrum of the solution in acetone of quenched phases in periclase matrix from the runs O59 measured with green laser (spectrum of pure acetone is subtracted), dissolution time 15 min: (a) fluorescence band with acetone spectrum subtracted; small sharp peaks and negative peak around 2800 cm−1 are from not completely compensated acetone; (b) deconvolution of O59 spectrum minus fluorescence band; positions of peaks related to Pt carbonyls from Figure 7b are labeled by arrows.
Minerals 11 00225 g008
Table 1. Results of fluid traps analyses and Pt concentration in the fluid.
RunT/P
(°C/Kbar)
XCO/XCOeqLA-ICP-MS
(ppm)
ET-AAS
(ppm)
PorosityCfl/CCO2 2
ab86950/20.5/0.14109.5 ± 129.8335.50.35 1mechanical contamination
ab86950/20.5/0.1455.3 ± 53.0 3-0.35 1489.6/418.5
cor99950/20.5/0.14-27.50.4512.4/437.9
qz98950/20.5/0.14-57.70.35 1490.0/418.4
ab86950/20.5/0.1432.7 ± 33.7 4n.d.0.4 1289.5/247.5
qz98950/20.5/0.1422.1 ± 15.1n.d.0.30136.3/129.3
cor102950/20.33/0.14-11.50.4 1192.9/183.1
qz118950/20.15/0.14-22.9 ± 7.10.5141.0/133.8
ab108950/10.5/0.222.5 ± 2.0n.d.0.4520.5/18.0
cor105950/10.5/0.22-5.10.585.5/75.3
qz120950/10.21/0.22-10.20.6080.1/70.5
cor104950/0.50.5/0.31-1.40.6024.1/19.7
ab107950/0.50.5/0.310.22 ± 0.17n.d.0.6 16.3/5.16
qz119950/0.50.5/0.31-11.6/32.40.21114/93.6
cor1069500/30.5/0.10-5.00.4 1145.8/119.3
qz117950/2;1000/10.2/0.29-1.3/6.40.4 144.0/40.8
1 estimate of porosity; 2 solubility recalculated on pure CO2 fluid, 3 excluding largest particle, 4 excluding large particles.
Table 2. Content of acetone-soluble Pt form in fluid traps and in washes from capsule walls.
RunTime, HoursDissol. Time, hXCO/XCOeqPt in MgO ppmCommentsPt in Flush ppm 1
qz121210.50.5/0.141469MgO + acetone stirred8.8 2
qz12220.50.5/0.142393stirred48.2 2
qz12320.250.5/0.1417.4not stirred4.3
O56210.250.16/0.141.4no carbon21.5
O57210.250.16/0.143.4no carbon0.1
qz1142120.5/-21.8fluid with XH2O = 0.046-
1 recalculated for Cfl assuming half fluid was out of the trap; 2 walls were scrabbled at washing; all experiments were carried out at P = 200 MPa and T = 950 °C.
Publisher’s Note: MDPI stays neutral with regard to jurisdictional claims in published maps and institutional affiliations.

