Article

Contamination Alters the Physicochemical and Textural Characteristics of Clays in the Sediments of the Peri Urban Reconquista River, Affecting the Associated Indigenous Microorganisms

by
Ana E. Tufo
1,
Susana Vázquez
2,3,
Natalia F. Porzionato
1,
María Celeste Grimolizzi
1,
María Belén Prados
4,
Mauricio Sica
4 and
Gustavo Curutchet
1,*
1
Instituto de Investigación e Ingeniería Ambiental-IIIA, UNSAM, CONICET, Campus Miguelete, San Martín 1650, Argentina
2
Facultad de Farmacia y Bioquímica, Universidad de Buenos Aires, Buenos Aires 1113, Argentina
3
Instituto de Nanobiotecnología (NANOBIOTEC), CONICET-Universidad de Buenos Aires, Buenos Aires 1113, Argentina
4
Instituto de Energía y Desarrollo Sustentable, Centro Atómico Bariloche, Comisión Nacional de Energía Atómica, Consejo Nacional de Investigaciones Científicas y Técnicas (CONICET), San Carlos de Bariloche R8402AGP, Argentina
*
Author to whom correspondence should be addressed.
Submission received: 23 November 2020 / Revised: 28 January 2021 / Accepted: 31 January 2021 / Published: 26 February 2021
(This article belongs to the Special Issue Clay Minerals–Life Interplay)

Abstract

:
The physicochemical and textural characteristics of river sediments and, essentially, their clays, are at the center of a network of biological and geochemical factors that are mutually modifying. Therefore, the contamination, the characteristics of the clays, and the associated microorganisms strongly influence each other. In this work, sediments from two sites of the urban Reconquista River, near Buenos Aires City, Argentina, exposed to different environmental contexts were characterized. The huge differences in the organic matter content in the vertical profile between both sediments strongly evidenced the polluted status of San Francisco (SF) site as opposed to the Dique Roggero (DR) site. Thorough physicochemical and textural characterization of the sediments and their clay fraction performed by pH, Oxidation-reduction potential (ORP), spectrophotometry, XRD, laser diffraction, N2 adsorption–desorption isotherms, EDS, and SEM measurements revealed that organic matter (DR: 41 ± 5 g kg−1; SF: 150 ± 30 g kg−1) intervened in the retention of heavy metals (DR: 5.6 mg kg−1 Zn, 7 mg kg−1 Cu, 3.1 kg−1 Cr; SF: 240 mg kg−1 Zn, 60 mg kg−1 Cu, 270 mg kg−1 Cr) and affected the level of association and the formation of mineral–organic aggregates (DR: 15 ± 3 μm; SF: 23 ± 4 μm). This can be decisive in the surface interaction required for the establishment of bacterial assemblages, which determine the biogeochemical processes occurring in sediments and have a key role in the fate of contaminants in situ and in the remediation processes that need to be applied to restore the anoxic contaminated sediments.

Graphical Abstract

1. Introduction

The biogeochemical processes that occur in river sediments are mainly determined by the type of substrate, the electron acceptors, and other environmental parameters that together shape the indigenous microbial communities. These processes are responsible for ecosystem health and are affected by human activity, which introduces pollution into the waters. These contaminants accumulate in the sediments, drastically modifying these parameters and affecting the composition and functionality of the sediment microbiota. This is the case of many rivers and streams near Buenos Aires City in Argentina, such as the Reconquista River, where this study was focused.
Studying the interaction of microorganisms with the sediment clays and of both, in turn, with the contaminants, contributes to the understanding of the self-purification processes and the fate of the different pollutants discharged into the river. These pollutants (i.e., heavy metals, polycyclic aromatic hydrocarbons (PAHs), organic chlorine pesticides, phenols, inorganic N compounds) are composed of untreated domestic and industrial effluents [1,2,3,4,5,6]. The understanding of such dynamics is essential for the design of processes in bioreactors that are efficient for the on site remediation of the contaminated sediments [7]. In this sense, it is important to know how contamination affects the textural properties of the sediment, especially clays, and how this modifies the adherence of microorganisms, especially bacteria, for the initial formation of biofilms, which are relevant to the riverine biogeochemical cycles.
In highly contaminated environments, exobiological factors such as temperature, pH, the concentration of ions and organic compounds, the sediment type, and the sizes of the sediment particles determine the adsorption and loading of heavy metals in sediments [8]. In this sense, Saeddi et al. (2011) [9] reported that heavy metal sorption is mostly related to the load of organic matter (OM) in the Jajrood River sediments. In addition, when soils and sediments contain more than 25% of clay minerals, they are great adsorbents of heavy metals [10]. Particularly, montmorillonite is reported as a good adsorbent because of the existence of several types of active sites on the surface and ion-exchange sites [11]. Clay minerals influence the physical environment where microorganisms thrive, as certain characteristics of clay minerals such as a small particle size, large surface area, and combined hydrophilic and hydrophobic properties are necessary for the formation of organo-mineral aggregates and biofilm–mineral structures [12]. Several reports have described the idea that, in contaminated environments where the concentration of OM is very much higher than in other natural systems and the activity of iron reducing bacteria increases markedly, mineral transformations could be dramatically accelerated [7,13,14,15,16,17]. Furthermore, it is well documented that OM influences the structure of the minerals present in sediments [18,19,20,21,22,23,24] and the clay–microorganism interactions [25,26,27,28,29,30], but only few studies have been carried out to gain insights into the modifications that occur in the structure of natural clays under conditions of strong organic contamination [5,7]. The influence of the OM on the structure of sediments must be analyzed considering the indigenous microbial assemblages and the level of pollution as these can influence the mineral composition of sediments and their clays. Reciprocally, the type of clays and their physicochemical characteristics can favor the retention of heavy metals (zinc, copper, chromium, and lead, among others) and the agglomeration of particulate organic material in a highly contaminated environment [9,31,32], thus conducive to the development of characteristic microbial assemblages.
For all the above stated, the aim of this work was to characterize the sediments and clays extracted from different depths in the sediment vertical profile at two sites with different levels of pollution in the urban Reconquista River, and to understand if and how contamination affects the structure of the sediment and the interaction of microorganisms with their clays, a key factor for the establishment of stable biofilms. In this sense, studying the formation of biofilms by the indigenous microbes on reference natural clays was a starting point for the further comprehension of their interaction with sediment clays. Montmorillonite and illite, the reference clays included in this work, were the major components of the clay minerals in the sediments studied here and therefore, this study makes a notable contribution to the understanding of the influence of contamination on the physicochemical characteristics of sediments and clay particles and to the development of the microbial assemblages present in the sediments of the Reconquista River. These assemblages are in part determined by the sediment properties and are the main drivers of the biogeochemical processes, playing a crucial role in the fate of the contaminants discharged into watercourses.

2. Materials and Methods

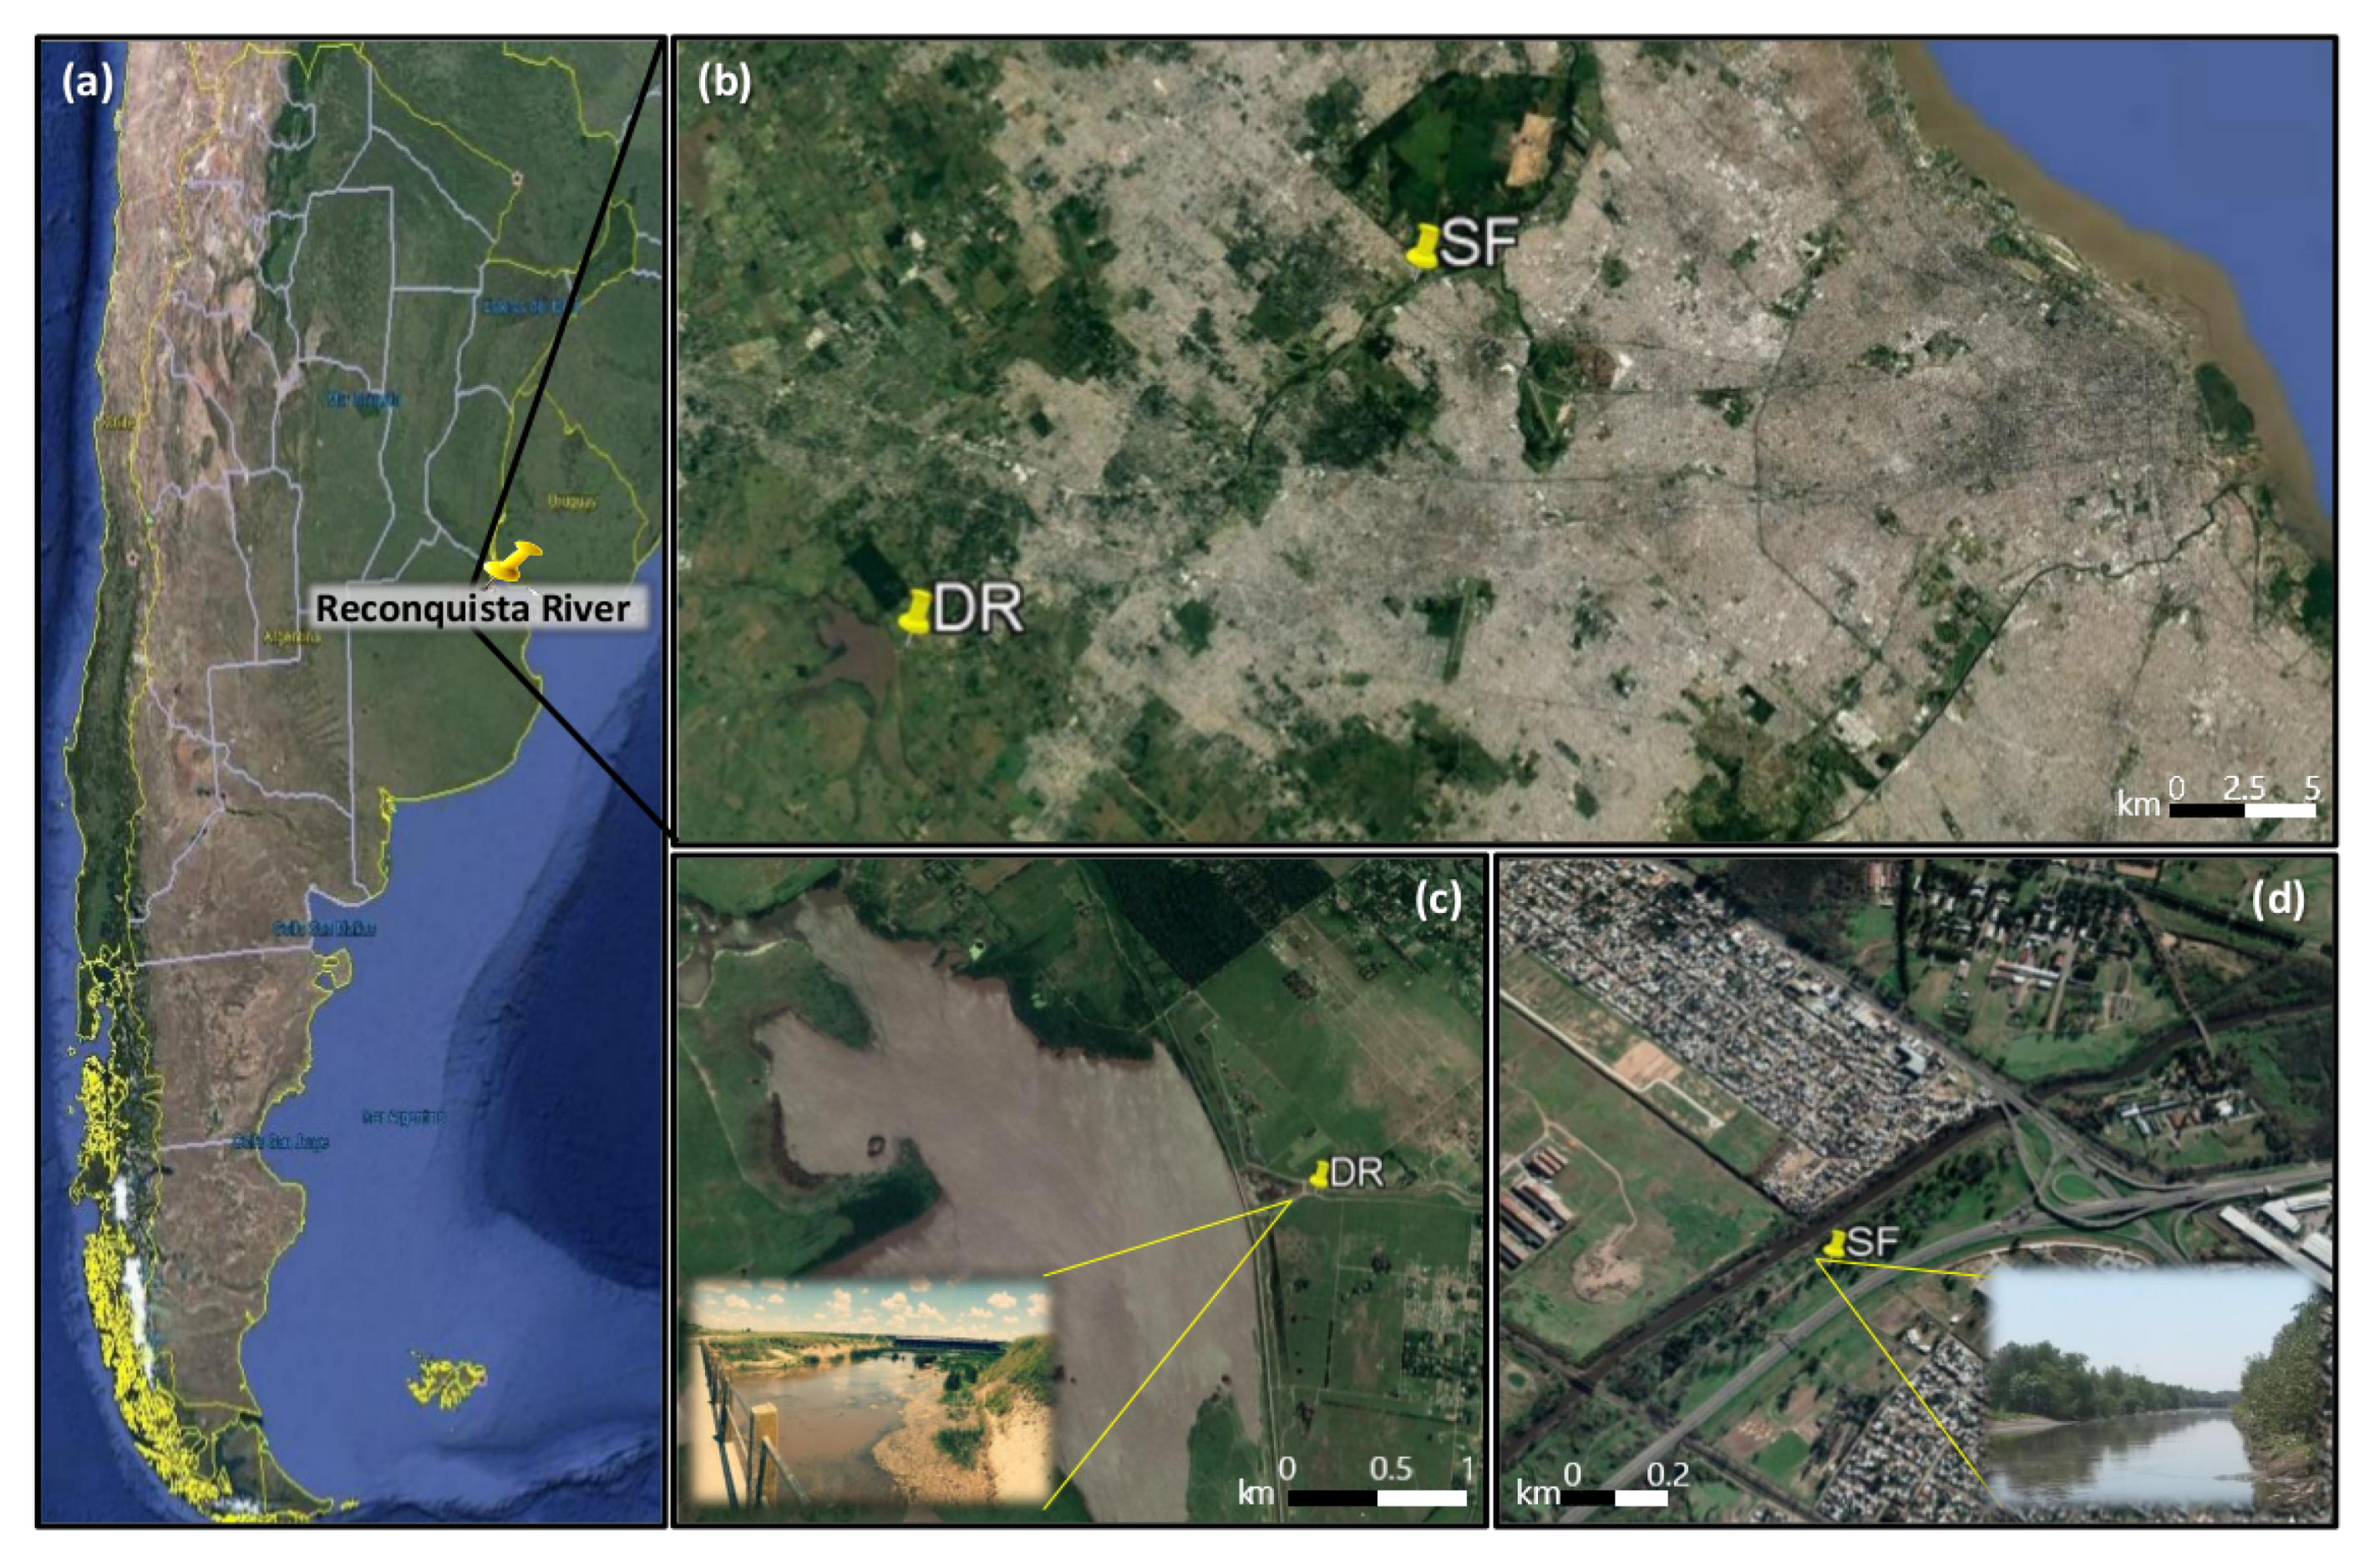
2.1. Description of the Study Sites

The sediments studied here were collected from two sites (DR and SF, 24 km apart) of the peri-urban Reconquista River, Buenos Aires, Argentina (Figure 1). The region is characterized by a temperate humid climate with an annual average temperature of 18 ± 1 °C and a rainfall of 1231 mm [33]. The Reconquista River is entrenched in a thick mantle of semi-consolidated Quaternary sediments called loess pampeano [34], where the La Plata Formation, Luján Formation, Buenos Aires Formation, and Ensenada Formation emerge [31,35]. Three areas (upper, middle, and lower) can be defined in its basin. Some aspects like land use, population density, urbanization, and industrialization, among others, vary between these areas, determining marked differences in the degree and type of their associated contamination. Site DR is located at the Dique Ingeniero Carlos F. Roggero (34°40′51.4″ S; 58°51′36.7″ W) in the proximities of a protected natural area, one of the places with the least anthropogenic impact along the riverbed. This site is in the upper basin, an area of agricultural use with a low population density and has a low degree of contamination. Therefore, for comparison purposes, it will be considered here as the uncontaminated control site. Conversely, the site SF is located at San Francisco Park, William Morris town (34°34′42.3″ S; 58°40′12.8″ W). This site is in the middle basin, nearby the lower basin, a heavily polluted area of the river, since it is a densely urbanized and industrialized area with a high population density (Figure 1). In this context, the middle and lower areas of the Reconquista River Basin receive untreated sewage and toxic effluents from the industrial belt and, as a consequence, a high content of heavy metals has been found in the waters at various points. Nader (2015) [2] reported values of 6 μg L−1 of chromium, 5 μg L−1 of copper, and 700 μg L−1 of zinc in the middle area (km 25.5, downstream Moron River) and 8 μg L−1 of chromium, 10 μg L−1 of copper, and 200 μg L−1 of zinc in the lower area (37.8 km). These metals arrive mainly as waste from industries such as electroplating, electrical materials, paints, etc., which are abundant in this region [36] as well as from untreated sewage from a variety of industries such as food, tanneries, chemical, and nonferrous smelting.
In a previous own study [37], the bacterial communities from the two sites were also found to differ in their structure, which can lead to differences in their functionality. Through 16S rRNA gene amplicon sequencing (V4 variable region, Illumina MiSeq platform), it was found that the bacterial assemblages from both sites did not differ substantially in their richness and diversity, which were slightly higher in SF than in DR. Nevertheless, both sites harbored very different bacterial assemblages in terms of composition and were highly dominated by a few, mostly unshared, populations (identified as operational taxonomic units, OTUs, clusters of similar 16S rDNA gene sequence variants defined here at 97% identity, intended to represent taxonomic units of bacteria at the genus level) accompanied by a high number of OTUs with very low abundance. The most abundant phylum found in both sites was Proteobacteria, a group with a great metabolic diversity including aerobic and anaerobic bacteria, which are mostly heterotrophs, although it also includes anoxygenic photosynthetic groups that use sulfide, sulfur, or hydrogen. At DR, the phyla Nitrospirota (aerobic chemolithoautotrophic nitrite-oxidizing bacteria), Acidobacterota (a physiologically diverse group of mostly aerobic chemoheterotrophs but including oligotrophic and acidophilic bacteria), and Cyanobacteria (oxygenic photosynthetic, mostly autotrophic bacteria) were highly abundant. On the contrary, different phyla were abundant in the SF microbiota: Bacteroidota (anaerobic chemoorganotrophs with a high nutritional flexibility, able to produce exoenzymes and use carbohydrates via a series of metabolic pathways), Chloroflexi (a physiologically diverse group of filamentous aerobic and anaerobic bacteria, some able to adapt to oligotrophic conditions including mostly heterotrophs, but also lithotrophs and anoxygenic phototrophs), and Desulfobacterota (anaerobic sulfate or sulfur reducing bacteria utilizing organic acids, with some groups occurring in methanogenic environments growing in syntrophic association with hydrogen or formate-utilizing microorganisms). The genus Nitrospira (aerobic nitrite and hydrogen oxidizer, able to fix carbon or use organic compounds) was dominant in DR assemblages, whereas SF was dominated by an unclassified member of the Comamonadaceae family (a diverse clade including aerobic organotrophs, anaerobic denitrifiers and iron-reducing bacteria, hydrogen oxidizers, and fermentative bacteria, with some able to use hydrocarbons). The versatile fermentative anaerobic bacterial Clostridium genus was detected in both assemblages, at times becoming a very abundant component. These differences in the bacterial communities from both sites led to the obtention of enrichment cultures to study their response in terms of biofilm formation and adherence to the clays from both uncontaminated and contaminated sediments.

2.2. Sampling

Water and sediment samples were taken on November 2016 at the DR and SF sites (Figure 1), when the precipitation recorded was about 113 mm and the mean temperature 20 ± 1 °C [34].
Surface water samples were collected in plastic bottles, transported with ice packs, and stored in the laboratory at 4 °C in the dark. An aliquot of each water sample was filtered through a 0.45-µm pore cellulose acetate membrane and the major conservative ions were quantified using a Dionex DRX-100 ion chromatography system (Dionex, Manasquan, NJ, USA) equipped with an AG22-AS22 column, conductivity detector, and a 25 μL injection loop [38]. For anion quantification (chloride and sulfate), a mixture of 4.5 mM Na2CO3 and 1.4 mM NaHCO3 was used as an eluent at a flow of 1 mL min−1. For cation quantification (sodium, potassium, magnesium, and calcium), a mixture of 40 mM HCl and 4 mM DL-2,3-aminopropanoic acid was used at a flow of 2 mL min−1. The uncertainty in the measurements was around 10% for each of the quantified ions. Nitrate and phosphate concentrations were determined by UV–Visible spectrophotometry using a PG70 UV-VIS spectrophotometer (T70+UV/Vis, PG Instruments Ltd., Leicestershire, UK). Physicochemical parameters were measured with a Horiba U-50 multiparametric probe for water analysis.
Sediment samples were manually collected from both the DR and SF sites in November 2016, at an ~50 cm water depth and close to the shore. At each site, one sediment core was extracted with a PVC push corer and transported to the laboratory at 4 °C, where the cores were carefully drilled every 5 cm to measure the oxidation-reduction potential (ORP) along the same sediment profile without altering its structure by using the HI 2211 pH/ORP Hanna Instruments equipment (Hanna Instruments Ltd., Bedfordshire, UK). After that, the cores were sliced into 5 cm sections from top to bottom, resulting in six sections for SF: SF1 (0–5 cm), SF2 (5–10 cm), SF3 (10–15 cm), SF4 (15–20 cm), SF5 (20–25 cm), SF6 (25–30 cm), and only four for DR: DR1 (0–5 cm), DR2 (5–10 cm), DR3 (10–15 cm) and DR4 (15–20 cm), as the rocky sediment prevented deeper coring. The bulk sediment samples (obtained from each core sections) were divided in two. On one fraction, pH, OM, acid volatile sulfide (AVS), and sulfate were measured (see below). The other fraction was air-dried, ground with an agate mortar and pestle, mixed to homogenize, passed through a 75 μm sieve (U.S. STD. Sieve N° 200), and split in sub-samples, which were kept at −80 °C for subsequent analyses. Clay-sized fraction (<2 μm) and coarse clay, silt, and sand-sized fraction (between 2 and 2000 μm) were separated by gravitational sedimentation in Atterberg tubes [39,40]. For this, the dry solids were resuspended in double-distilled water, dispersed by using an ultrasound probe, and sieved again to obtain the particles with a grain size lower than 75 μm. The suspension was placed into an Atterberg tube and the tube was filled up to 25 cm with double-distilled water, at 23 °C. The particles were left to settle for 18 h and the supernatant containing the clay-sized particles (<2 µm) was separated and allowed to evaporate (40 °C) until the volume was reduced by 90%. From the DR site, the clay-sized particles were extracted from the superficial, DR1 (0–5 cm) and deep, DR4 (15–20 cm) sections and from the SF contaminated site, from superficial, SF1 (0–5 cm); intermediate, SF3 (10–15 cm), and deep, SF6 (25–30 cm) sections. An identical procedure using Atterberg tubes was performed to separate the grain size <2 µm from natural clays that were tested in parallel as reference materials because they were the most abundant clay minerals in the studied sediments. Two reference clays were analyzed: a natural sample of montmorillonite (M) as a representative of the smectite group and a sample of illite (I) as representative of the micas group. The montmorillonite used was from Patagonia, Rio Negro Province, Argentina and was provided by Castiglioni Pes y Cia. and the illite was from the Tandilia System in the central area of Buenos Aires Province, Argentina, provided by the Centro de Tecnología de Recursos Minerales y Cerámica (CETMIC, UNLP-CONICET).

2.3. Sediment and Clay Characterization

Characterization of the sediments sampled at the DR and SF sites was performed both on the bulk sediment and the clay fraction obtained from each core section.
The pH, organic matter (OM), acid volatile sulfides (AVS), and sulfate contents were measured within 48 h after the sediment cores arrived at the laboratory. A suspension of 1 g of bulk sediment in 2 mL of distilled water was prepared, shaken vigorously, and left to settle for 2 h before the pH was measured using a Cole Parmer pH electrode. The OM content in the bulk sediments was determined as the gravimetric loss-on-ignition produced by ashing the samples (previously dried in an oven at 105 °C until reaching a constant weight) in a muffle furnace for 9 h at 550 °C. The AVS content was measured using the purge and trap method [41]. The sulfide content in the trap solution was determined colorimetrically at 670 nm using the methylene blue conversion method [42], with an overall measurement uncertainty of 5%. The sulfate content was determined by the turbidimetric method of the dissolved sulfate reaction with BaCl2 in excess [43] after extraction with HCl 1:20 (1 g of sediment in 15 mL), with an overall measurement uncertainty of around 3%. For both spectrophotometric determinations, a PG70 UV–Vis spectrophotometer (T70+UV/Vis, PG Instruments Ltd., Leicestershire, UK) was used. The methods used are described in Porzionato et al. (2017) [6].
The standard metal sequential BCR (Community Bureau of Reference, Commission of the European Communities) extraction procedure [44] was performed on each section of the bulk sediment. This sequential extraction avoids determining the concentration and distribution of metals like copper (Cu), zinc (Zn), and chromium (Cr) in different components of the sediment (fraction 1: exchangeable and water-acid-soluble-like carbonate- and silicate-associated metals; fraction 2: Mn oxide- and Fe oxide-bound metals; fraction 3: sulfides and OM-bound metals; fraction 4: residual fraction). Heavy metal concentration in each fraction was measured by atomic absorption spectrophotometry (AAS) with an EAA SenseAA (GBC Scientific Equipment, State St Hampshire, IL, USA), with an average uncertainty of 5% in each measurement as calculated from the calibration curves for each quantified metal.
X-ray diffraction (XRD) patterns were obtained with a Cu-Kα radiation filtered with a graphite monochromator (Siemens D5000). XRD patterns of the bulk sediments were measured in the 2θ range of 10–70°, in 0.02° steps, and using 3 s per step counting time. A voltage of 40 kV and a current of 35 mA were used. The bulk samples were packed into a 20 mm × 18 mm frame by side loading [41] to create a random preparation. Furthermore, a total of 60 mg of the clay-sized fractions (<2 μm) was mixed with 5 mL of deionized water and then deposited on a 25 × 50 mm2 slide glass to obtain an oriented slide. A representative air-dried oriented (N), glycolated (EG), and heat-treated (HT) of the clay-sized samples were prepared and the XRD was measured under the same conditions for that of the bulk sediments, but in the 2θ range of 3°–35°. The ethylene glycol solvation was accomplished by exposure to vapor at 25 °C for 24 h, whereas the heat-treated samples were kept at 550 °C for 1 h and, subsequently, examined by XRD. The data obtained were analyzed using the JADE software X-ray Diffractometry Pattern Processing software (Materials Data Inc. 2004, Livermore, CA, USA).
The specific surface area (SSA), the total pore volume (VTP), the mesopore volume (Vmes), the micropore volume (VμP) and the modal pore size (wP) were determined by N2 adsorption–desorption isotherms at 77 K, using a manometric adsorption apparatus (AccuSorb 2100, Micrometrics Instrument Corporation, Norcross, GA, USA). To prevent phase changes in the samples, the measurements were conducted on solids previously outgassed at 60 °C during 15 h. The SSA values were obtained by the Brunauer–Emmett–Teller method using a partial pressure range of 0.05–0.35 [45]. The VμP was estimated by the αS plot method [46] using a naturally calcined aluminum-substituted clay as a reference material [47]. The VTP was obtained by applying the Gurvich rule to the N2 adsorption data at a partial pressure of 0.99 [48]. The Vmes was obtained by differences between VTP and VμP. The pore size distributions (PoreSD) of the samples (micropores and mesopores) were obtained with the Villarroel–Barrera–Sapag macroscopic method (VBS) [46,49,50] using adsorption branch data and assuming slit pores. The particle size distribution (PSD) of the bulk sediments and clay fractions was determined with a laser diffraction particle size analyzer, SALD-3101, supplied by Shimadzu Corporation, Nishinokyo Kuwabara-cho, Nakagyo-ku, Kyoto, Japan. The procedure was carried out by direct pumping of a suspension of the clay-sized particles in distilled water under continuous sonication. No dispersing agents were used. Additionally, the particle morphology was characterized using scanning electron microscopy (SEM) and energy-dispersive X-ray spectroscopy (EDS) on a drop of suspension dried onto a carbon tape placed on top of a metallic aluminum support (ZeissSupra40 (field emission, gun scanning electron microscope), ZEISS, Oberkochen, Germany).

2.4. Bacterial Cultures

Bacterial enrichment cultures were obtained from the DR and SF bulk sediments under sulfate-reducing conditions (prevailing in the anoxic sediments affected by contamination) using a modified Postgate C medium [Na2SO4 4.5 g L−1; NH4Cl 1.0 g L−1; KH2PO4 0.5 g L−1; CaCl2·2H2O 0.04 g L−1; MgSO4.7H2O 0.06 g L−1; FeSO4.7H20 0.004 g L−1; sodium citrate dihydrate 0.23 g L−1; yeast extract 0.25 g L−1; sodium lactate 6 g L−1; anaerobic solution (ascorbic acid 20 g L−1; thioglycolic acid 20 mL L−1) 5 mL L−1; pH 7.5]. For the initial enrichment culture, an aliquot of bulk sediment was inoculated into 100-mL glass vials filled with 70 mL of anaerobically prepared medium, the vials were flushed with N2 gas, closed tightly with a butyl-rubber stopper and an aluminum cap, and incubated at 25 °C until turbidity and a black precipitate was observed. Then, for subculturing, 1 mL of enrichment culture was transferred to another vial using the same medium and incubation conditions. This was repeated three times and the final enrichment subcultures were maintained at 4 °C. Bacterial isolates were obtained in pure culture from both the DR and SF final enrichment cultures using a solid medium (Clostridium Differential Agar™, Britania, Buenos Aires, Argentina) to allow separate colonies to be obtained. The composition of this medium favors the growth of fermentative spore-forming anaerobes like members of the Clostridium genus and allows for them to be distinguished by a black precipitate produced due to their ability to reduce sulfite. An aliquot of each culture was heated for 30 min at 85 °C to kill actively growing vegetative cells and activate bacterial spores. Then, the aliquot was mixed in 100 mL glass vials with 30 mL of culture media preheated to 50 °C. The vials were placed horizontally until solidification of the agar, sealed, and flushed with N2 gas and incubated at 25 °C until colonies were observed. Isolated colonies were picked with a loop and amplified in modified Postgate C medium at 25 °C. Taxonomic identification of the isolates was achieved by partial sequencing of the 16S rRNA gene after DNA extraction using the Wizard® Genomic DNA Purification Kit (Promega) and PCR amplification with the universal primers 27F and 1492R.

2.5. Interaction of Microorganisms with Clays

The interaction of microorganisms with clays (adherence and biofilm formation) was studied in vitro in two separate experiments using the clay-sized fractions (particles <2 μm) obtained from the DR and SF sediments or the reference natural clays (M and I) and the sulfate-reducing microorganisms enriched from the contaminated SF sediments. This was done assuming that the SF sediment was once like the DR sediment and that the differences in the dominant microbes at each site responded to a dynamic selective enrichment process driven by fluctuations in the environment (here represented mainly by the organic contamination). Considering the intrinsic characteristics of the clay-sized fractions from each site (see the Results Section 3.4. Sediment and clay characterization) and to facilitate the comparison with the reference clays, for these experiments, the clays obtained from DR4 (15–20 cm) and SF6 (25–30 cm) were used. Control assays without microorganisms were also performed.

2.5.1. Adherence of Microorganisms to Clays

To study the first step of biofilm formation on clays, an aliquot of the final enriched culture from the SF sediment (Section 2.4) was grown anaerobically for three days at 25 °C in 750 mL of modified Postgate C medium. Then, the cells were collected by centrifugation at 3000 rpm for 15 min and the bacterial pellet was washed with distilled water and resuspended in 30 mL of Postgate C modified medium without a carbon source to obtain a suspension with 1 × 10⁹ cells mL−1. Then, 100 mg of each clay were placed in two 100-mL glass vials and suspended one fraction in 90 and the other in 99 mL of Postgate C without a carbon source using an ultrasonic bath and a volume of 10 mL or 1 mL of the cell suspension were added to each vial, respectively. After two hours of occasional manual shaking, the clays were separated from the supernatant by centrifugation (4000 rpm for 40 s), washed with 10 mL of fresh medium, and the cells that remained in the supernatant media were counted using a Petroff Hausser counting chamber and contrast phase microscopy. A small sample of the clays was deposited over coverslips and prepared for observation by scanning electron microscopy. For this, the sample was first dried at room temperature, then fixed in glutaraldehyde 2.5% overnight, dehydrated by immersion in a series of ethanol solutions (40, 60, 80, and 100% ethanol in ultra-pure water), air dried, and sputtered with gold for the observation in a FEI-Inspect S50 SEM (Thermo Fisher Scientific, Hillsboro, OR, USA) at an accelerating voltage of 5 kV.

2.5.2. Bacterial Growth and Biofilm Formation

To detect further biofilm formation after the initial adherence of microorganisms to clays, 100 mg of the different clays were suspended in 100 mL of modified Postgate C medium within independent hermetically sealed glass vials. Four parallel replicate vials were prepared for each clay. An ultrasonic bath was used to allow a homogeneous suspension of clays before the addition of microorganisms. Then, the vials were inoculated with 2 × 10⁶ cells mL−1 of the enriched culture, which was previously grown for three days at 25 °C in modified Postgate C medium and incubated at 25°C for nine days. A series of vials without microorganisms were also performed for each system as a control. Every 24 h, aliquots of 1 mL were taken from each vial after mixing by manual shaking and centrifuged to separate the cells. pH and lactate concentration were measured in the supernatant. When the lactate added as a carbon source was consumed, indicating that the microorganisms had grown sufficiently, an aliquot of clays was taken from the bottom of one of the replicate vials of each clay, and this vial was discarded. These samples were observed by SEM and performed as described above. In the remaining vials, 80% of the carbon-depleted medium was replaced with fresh medium to provide the cells with an additional carbon source and allow for another round of growth. Three rounds were performed, resulting in samples of clays at 6 (Cycle I), 8 (Cycle II), and 9 (Cycle III) days of culture including samples of their respective non-inoculated controls.

3. Results

3.1. Surface Waters and Sediments Characterization

The physicochemical parameters measured in the waters and sediments from the DR and SF sites are shown in Table 1. Water pH and conductivity were similar at both sites. Nevertheless, from the oxidation-reduction potentials and the dissolved oxygen, a marked difference between both sites was made evident since the surface waters at DR had oxidizing characteristics (ORP > 0) whereas the SF waters had a remarkably lower dissolved oxygen and reducing characteristics (ORP < 0). In addition, the concentrations of inorganic ions measured in both superficial waters confirmed the differences between both sites: nitrate, phosphate, potassium, and calcium were higher at SF, whereas sulfate, sodium and magnesium were higher at the uncontaminated site DR. Moreover, the differences between DR and SF were also reflected by some parameters measured in the surface sediments, with a negative ORP and a high content of OM, AVS, and sulfate in SF and a positive ORP, a lower content of OM and sulfate, and no AVS in DR.

3.2. Organic Matter, Acid Volatile Sulfide and Sulfate Content

The OM, AVS, and sulfate contents varied greatly between the DR and SF sediments (Table 2). The AVS content was zero in the DR sediments but in SF1 (0–5 cm), it reached a value of 2700 ± 600 mg kg−1, which decreased up to 1100 ± 200 mg kg−1 in the deep section SF6 (25–30 cm). Sulfate content in all sections of the DR core was similar (in the range of 150 ± 30 to 190 ± 20 mg kg−1). Conversely, in the SF core profile, the sulfate content was lowest in SF1 (2900 ± 30 mg kg−1) and increased with depth until reaching the highest value in the SF6 section (4750 ± 15 mg kg−1). The OM content was rather similar along the analyzed profile of the DR core. In contrast, the superficial section SF1 had an OM content of 180 ± 50 g kg−1, which decreased to 80 ± 4 g kg−1 in the deep section SF6, representing a reduction of approximately 60% along the stratified sediment core.

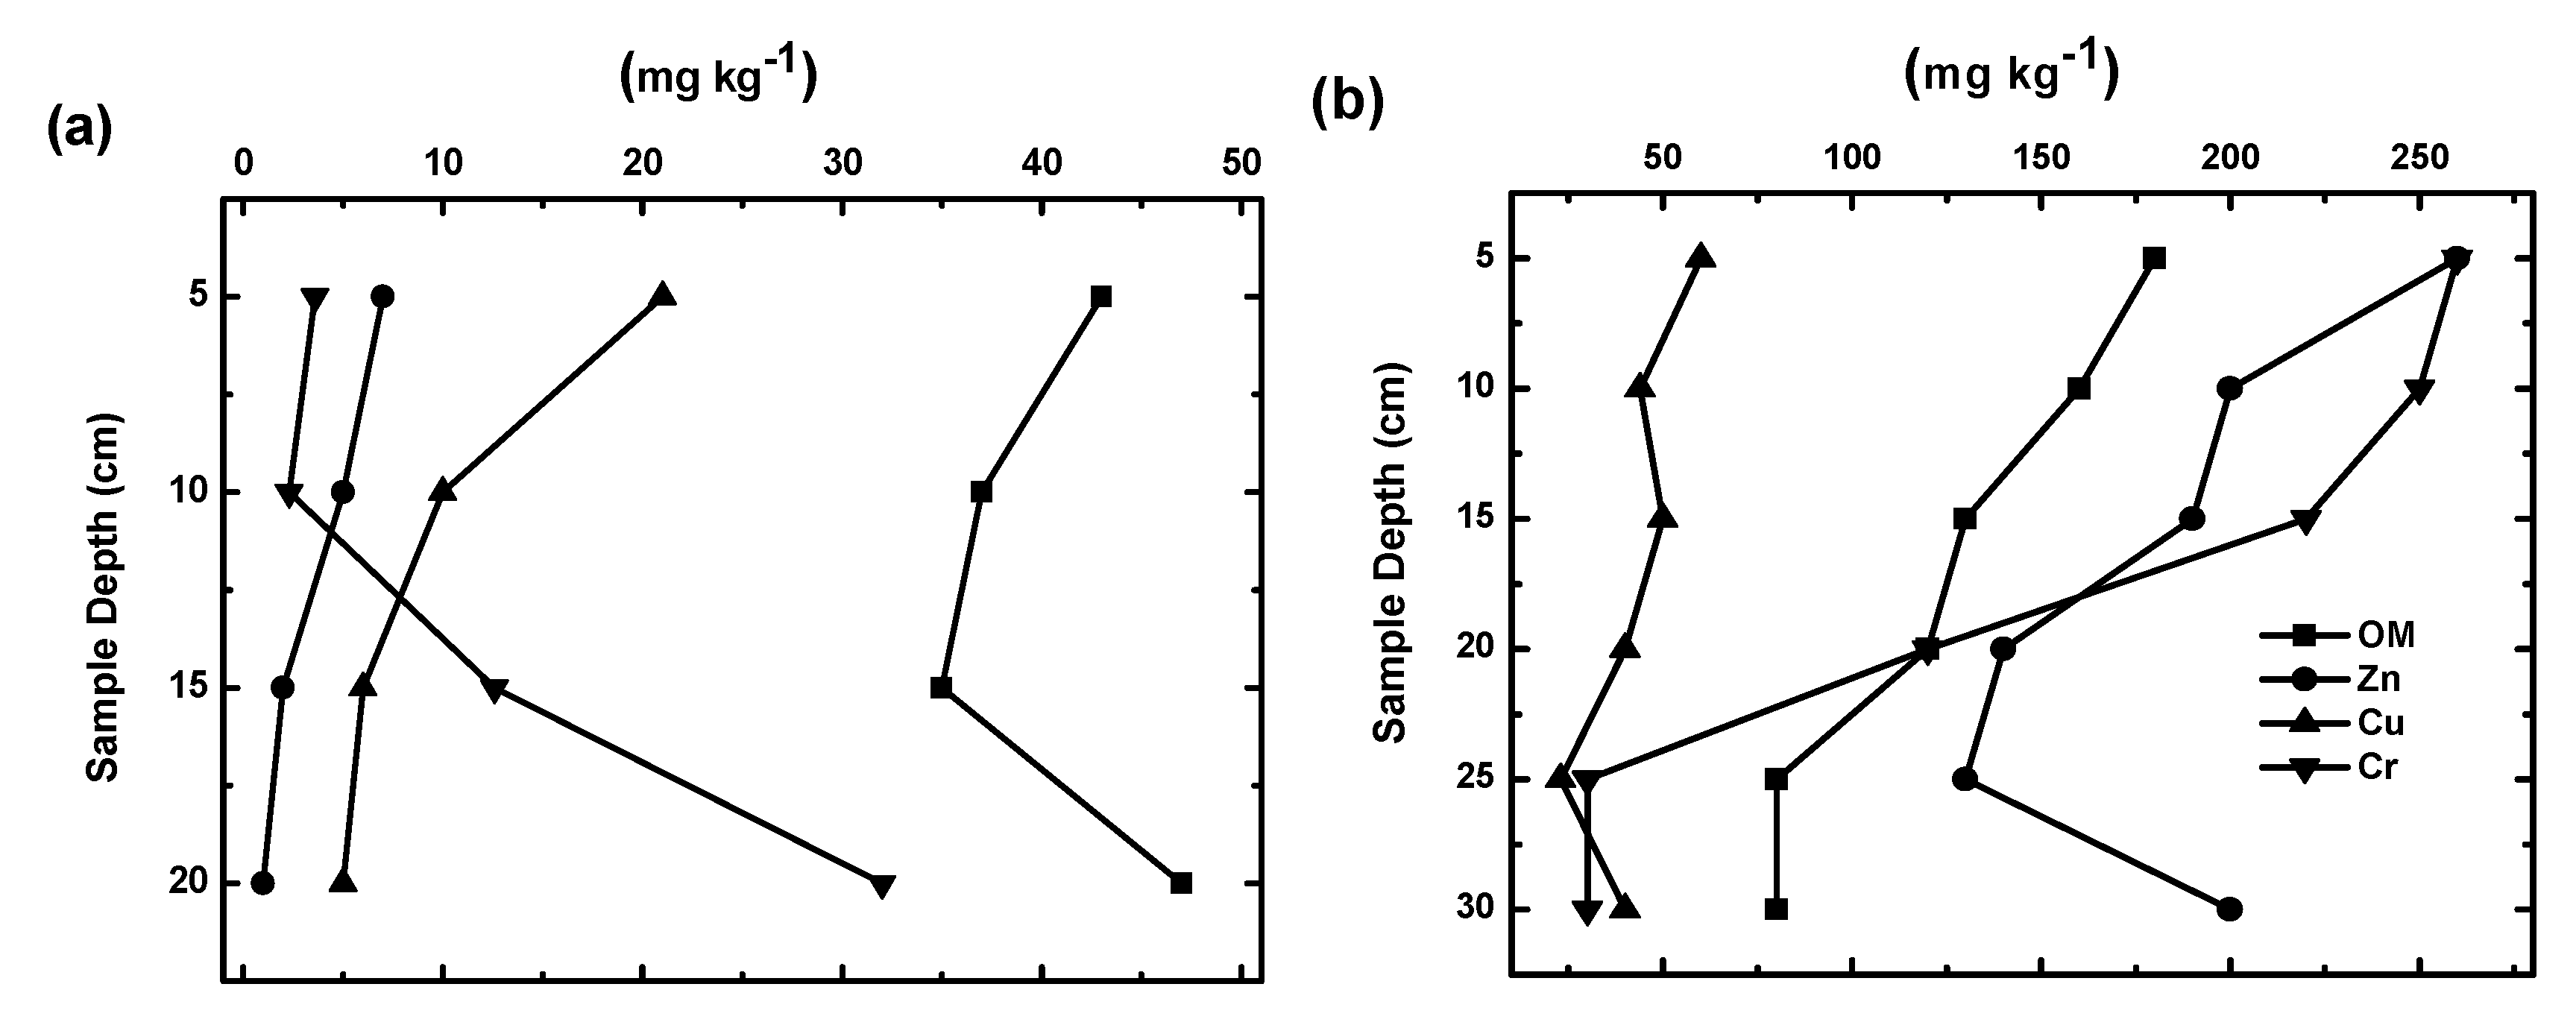
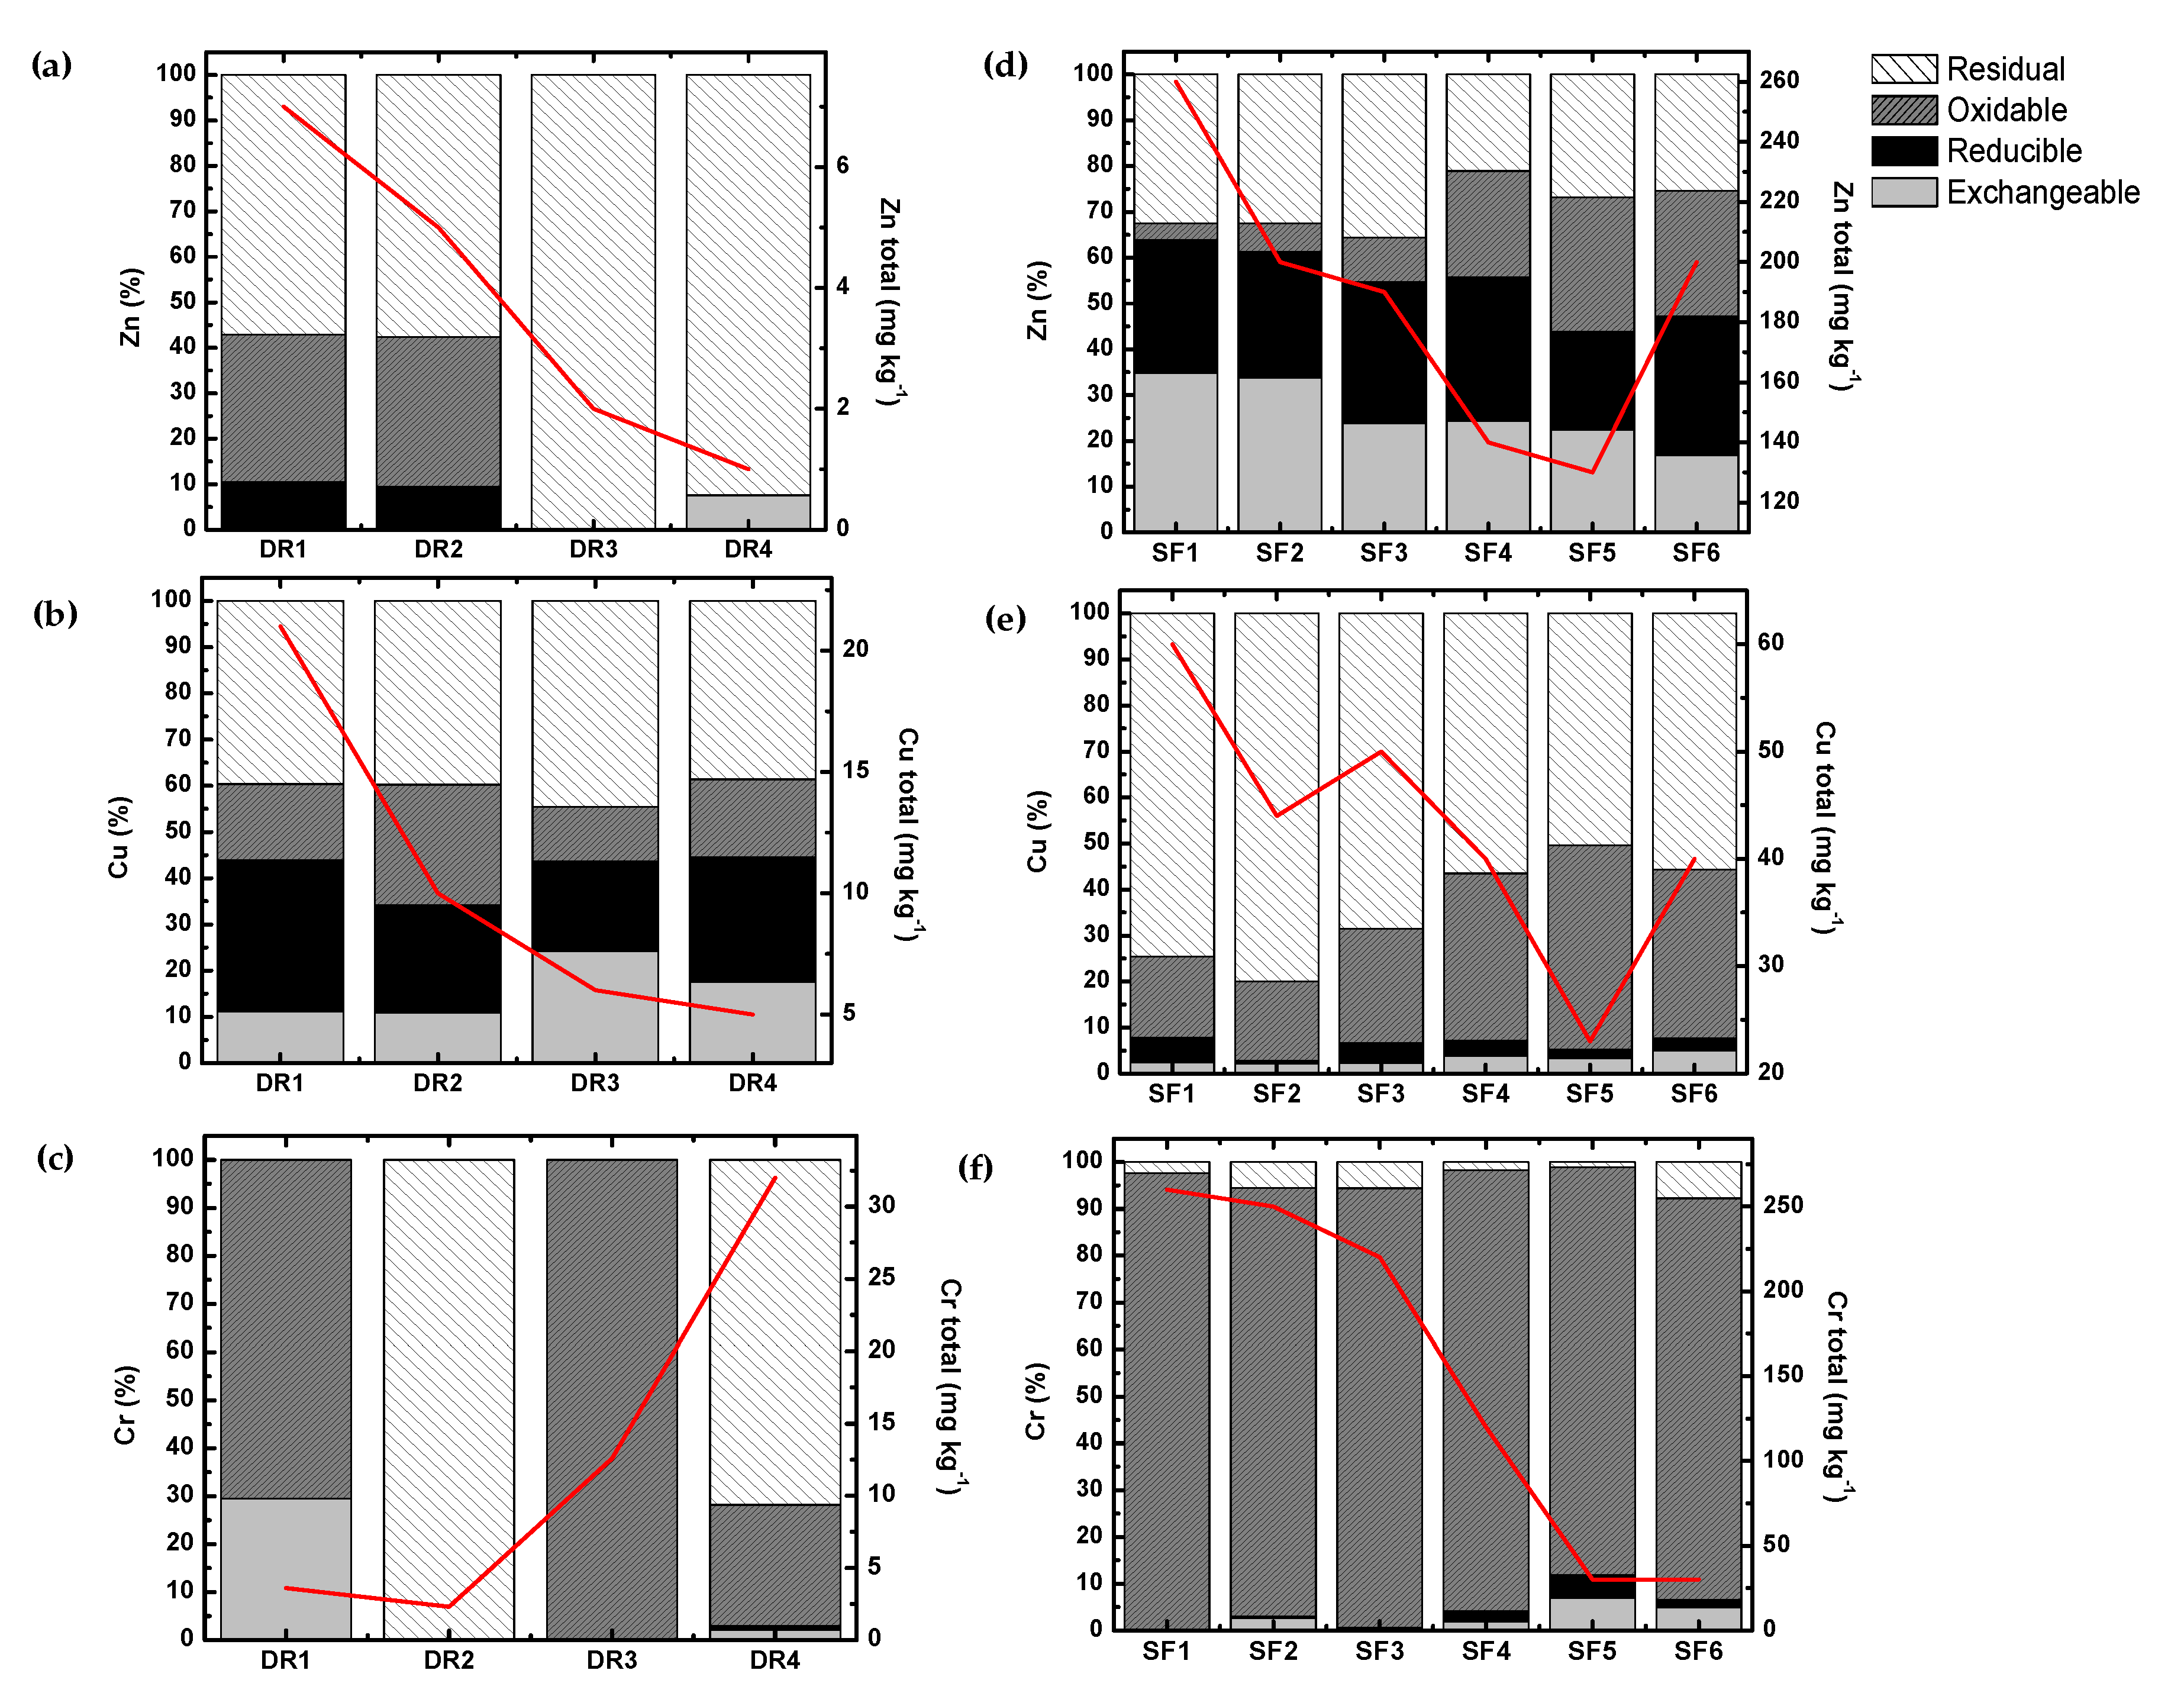
3.3. Zinc, Copper, and Chromium Content

The total heavy metal content for all sections from both sediment cores is shown in Supplementary Materials Table S1. The Zn, Cu, and Cr contents were low in the DR uncontaminated sediments, but considerably higher in all sections of the SF contaminated sediment. In Figure 2, the depth distribution profiles of the heavy metal contents are shown along with the OM content for both cores. The total Cr concentration decreased substantially in SF, but increased slightly in the deeper sections of the DR core. Despite the low content of OM, its distribution profile followed a trend like that observed for Cr (Figure 2a). Instead, for Zn and Cu, a marked decrease was observed from the surface up to 20 cm in DR and 25 cm in SF, and in the deepest section, a slight increase was observed (Figure 2b). In addition, the heavy metal profile distribution in both sites was similar to that followed by the OM content.
Accordingly, Figure 3 shows the metal concentrations within specific reservoirs as determined with BCR sequential extraction along both bulk sediment vertical profiles (Table S2). In the case of Zn in DR sediments, there was a differentiation between the first 10 cm (DR1 and DR2) and the deeper sections (DR3 and DR4), with this metal mostly retained by the residual and oxidable fractions and, to a lesser extent, by the reducible fraction in the surface, whereas in the deeper sections, Zn was almost totally associated with the residual fraction (Figure 3a). On the other hand, the differentiation between the fractions with respect to depth were not so marked for Cu (Figure 3b). In the SF core, the Zn content decreased with depth in both the exchangeable and the reducible fractions. Contrarily, a slight increase was observed in the oxidable fraction along the profile and finally, in the residual fraction, the Zn content varied without a defined trend. Elevated Zn concentrations were found in the surface sections (SF1 to SF3), where the Zn was mostly extracted from the interchangeable and reducible fractions, but the residual fraction remained within the same range for the deeper sections (Figure 3d). In contrast, the Cu content did not vary considerably along the SF profile, but there was an enrichment in the oxidable and residual fractions (Figure 3e). The high Cr content in the SF sediment was mostly related with the oxidable fraction in the entire profile (Figure 3). However, the association of this metal was not defined to a particular fraction in the DR sediment profile (Figure 3c).

3.4. Sediment and Clay Characterization

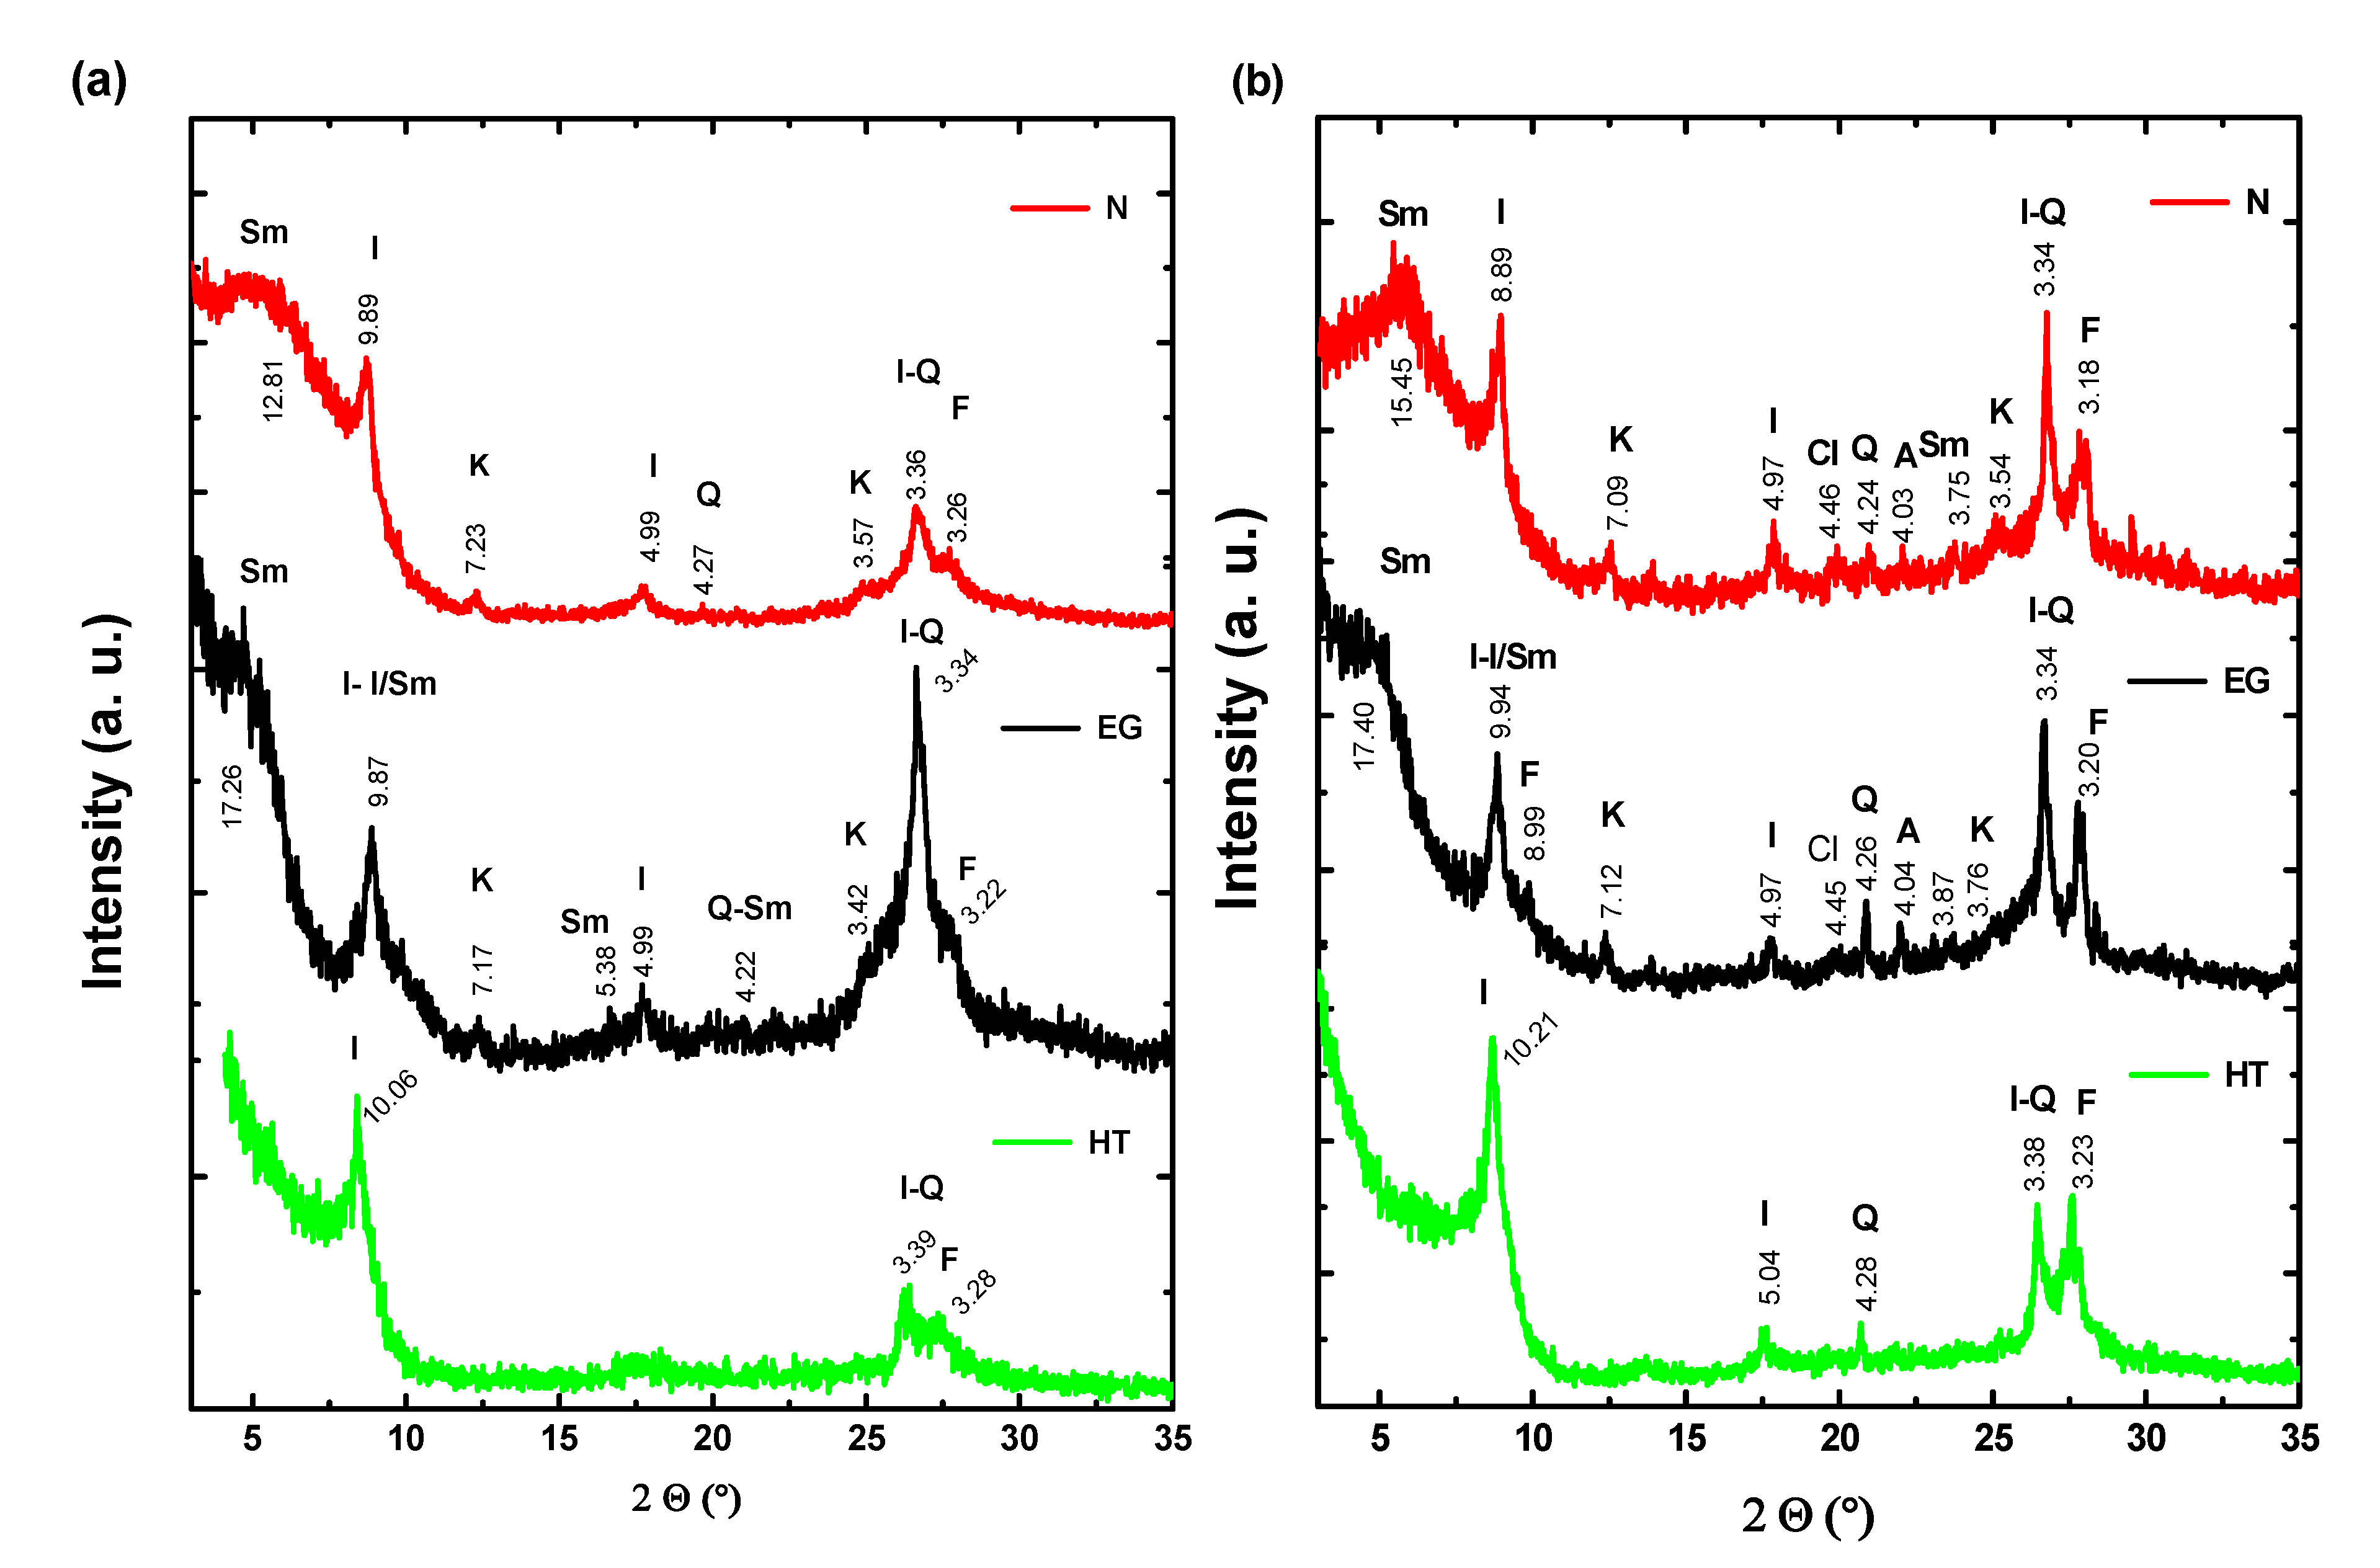
3.4.1. XRD Analysis of Bulk Sediments

The XRD patterns obtained from the bulk sediments of each profile section of the cores taken from both the uncontaminated DR and the highly contaminated SF sites are presented in Figure 4. In all samples of bulk sediments, the most intense peak was attributed to quartz (Q) and peaks corresponding to feldspars (F) and albite (A) were also identified. Faint peaks ascribable to clay minerals (Cl) (at ~10 and 4.5 Å) were also observed in all XRD patterns. Once the quartz peaks were identified, they were manually removed from the original diffraction pattern using the JADE software (Materials Data Inc. 2004, Livermore, CA, USA) to facilitate the identification of other crystalline phases, as shown in Figure S2.

3.4.2. XRD Analysis of Extracted Clay Fractions

The diffraction patterns determined for the DR1 and SF6 clays after undergoing air-drying (N), ethylene-glycol-solvated [46], and calcination at 550 °C (HT) treatments are shown in detail in Figure 5. The corresponding diffractograms for the DR4, SF1, and SF3 clays are shown in Figure S3. The joint analysis of these diffractograms allowed an integrated qualitative interpretation of the mineral composition. In Figure 5a, a shoulder around 3–7 °2θ (26–12 Å) for the air-dried surface sediment DR1 sample (N) was observed. Under ethylene glycol treatment, this shoulder was shifted to angles lower than 6 °2θ (higher than 16 Å) and after a high temperature treatment (HT), collapsed to 8.39 °2θ (10.5 Å). Moore and Reynolds (1997) [41] mentioned that this shoulder is characteristic of the smectite group. This is correlated with reflection (001), which generally appears at 5–8 °2θ (15–12 Å) in the N condition and after EG treatment shifted to a well-defined peak around 5 °2θ (~17 Å). In the HT condition, the 001 smectite peak collapsed to around 9 °2θ (10 Å), producing a diffraction pattern similar to that of illite. In our case, it was not possible to clearly observe the peaks corresponding to the characteristic basal reflection (001) of smectite in the air-dried and ethylene glycol treatments. However, slight changes were observed in the very wide shoulder detected below 8 °2θ. Therefore, it can be interpreted that the samples contained smectite, however, its presence cannot be assured. Furthermore, the presence of random interstratified illite/smectite (I/Sm) cannot be ruled out because in all cases, the peaks below 8 °2θ were very wide and there was a slight shift of the peak at ~10 A after EG and HT treatments [41,51]. Illite was identified by the reflection at 8.70 °2θ (10.2 Å) (001), which shifted slightly at 8.88 °2θ (9.9 Å) under EG treatment. After calcination (HT), the characteristic peak of the illite phase at 8.39 °2θ (10.5 Å) was identified. In addition, the peaks at 17.8 °2θ (5 Å) (002) and ~26.8 °2θ (3.33 Å) (003) did not show any alterations after the EG and HT treatments. Once again, this indicates that illite was present as both interstratified I/Sm and endmember mineral phases [46]. In the N and EG patterns, low intensity peaks could be seen at 12.3 °2θ (7.21 Å) (001) and 24.99 °2θ (3.56 Å) (002), which collapsed after treatment at 550 °C. In this way, it is also possible that kaolinite was interstratified with a few smectite layers. These reflections may also correspond to chlorite, or a mixture of chlorite (Ch) and kaolinite. However, the disappearance of the diffraction peaks after the HT treatment is diagnostic of kaolinite [41]. Finally, traces of quartz and feldspar were also identified [52]. Qualitative mineral analysis of the patterns for the deeper section of DR was virtually identical to that obtained for the clays extracted from the upper section (Figure S3). However, the intensity of the diffraction peak suggests slight increases in the content of quartz and feldspar. In SF fractions, a great similarity between the diffraction patterns indicating similar mineral composition was also observed. Like that detected for DR clays, the air-dried-oriented samples had a peak or a shoulder at about 3–7 °2θ (26–12 Å), which under EG treatment shifted toward <5 °2θ (~17 Å) (Figure 5b and Figure S3b,c). As with the DR clays, it was interpreted that smectite was present, possibly as I/Sm [41]. The illite peaks were also identified in all clays from the contaminated sediment. For both clays, the characteristic basal reflection (001) had a slight shift around of ~9.9–10.2 Å, but the peaks corresponding to the reflections (002) at 17.8 °2θ (4.99 Å) and (003) at 26.8 °2θ (3.34 Å) did not shift with the different treatments or between samples. The characteristic reflections for the identification of kaolinite, quartz, and feldspar were also found.

3.4.3. XRD Analysis of Reference Natural Clays

The XRD patterns of reference natural montmorillonite obtained under N, EG and HT conditions are shown in Figure S4a. An intense peak at 7.05 °2θ (12.55 Å) was identified for the oriented air-drying condition. After solvation with ethylene glycol, this peak shifted to 5.31 °2θ (16.67 Å) and an increase in intensity was observed, as with the other reflections. Under the HT condition, a marked decrease in intensity was observed and the main peaks shifted, indicating complete dehydration of the smectite interlayers. The low-intensity peaks in the N and HT diagrams are probably an artifact of the XRD analysis, representing the cut-off of the diffracted beam at very low angle. In the case of illite, no relevant changes were seen with the different treatments, because of its non-expandable nature (Figure S4b). Some small peaks could be observed in all XRD traces at 19.9 °2θ (4.46 Å, 21.0 °2θ (4.23 Å) and 25.4 °2θ (3.50 Å) for illite and at 25.4 °2θ (3.50 Å) and 31.7 °2θ (2.82 Å) for montmorillonite, which suggested the presence of other minerals such as kaolinite, albite, clay minerals, quartz, or feldspars.

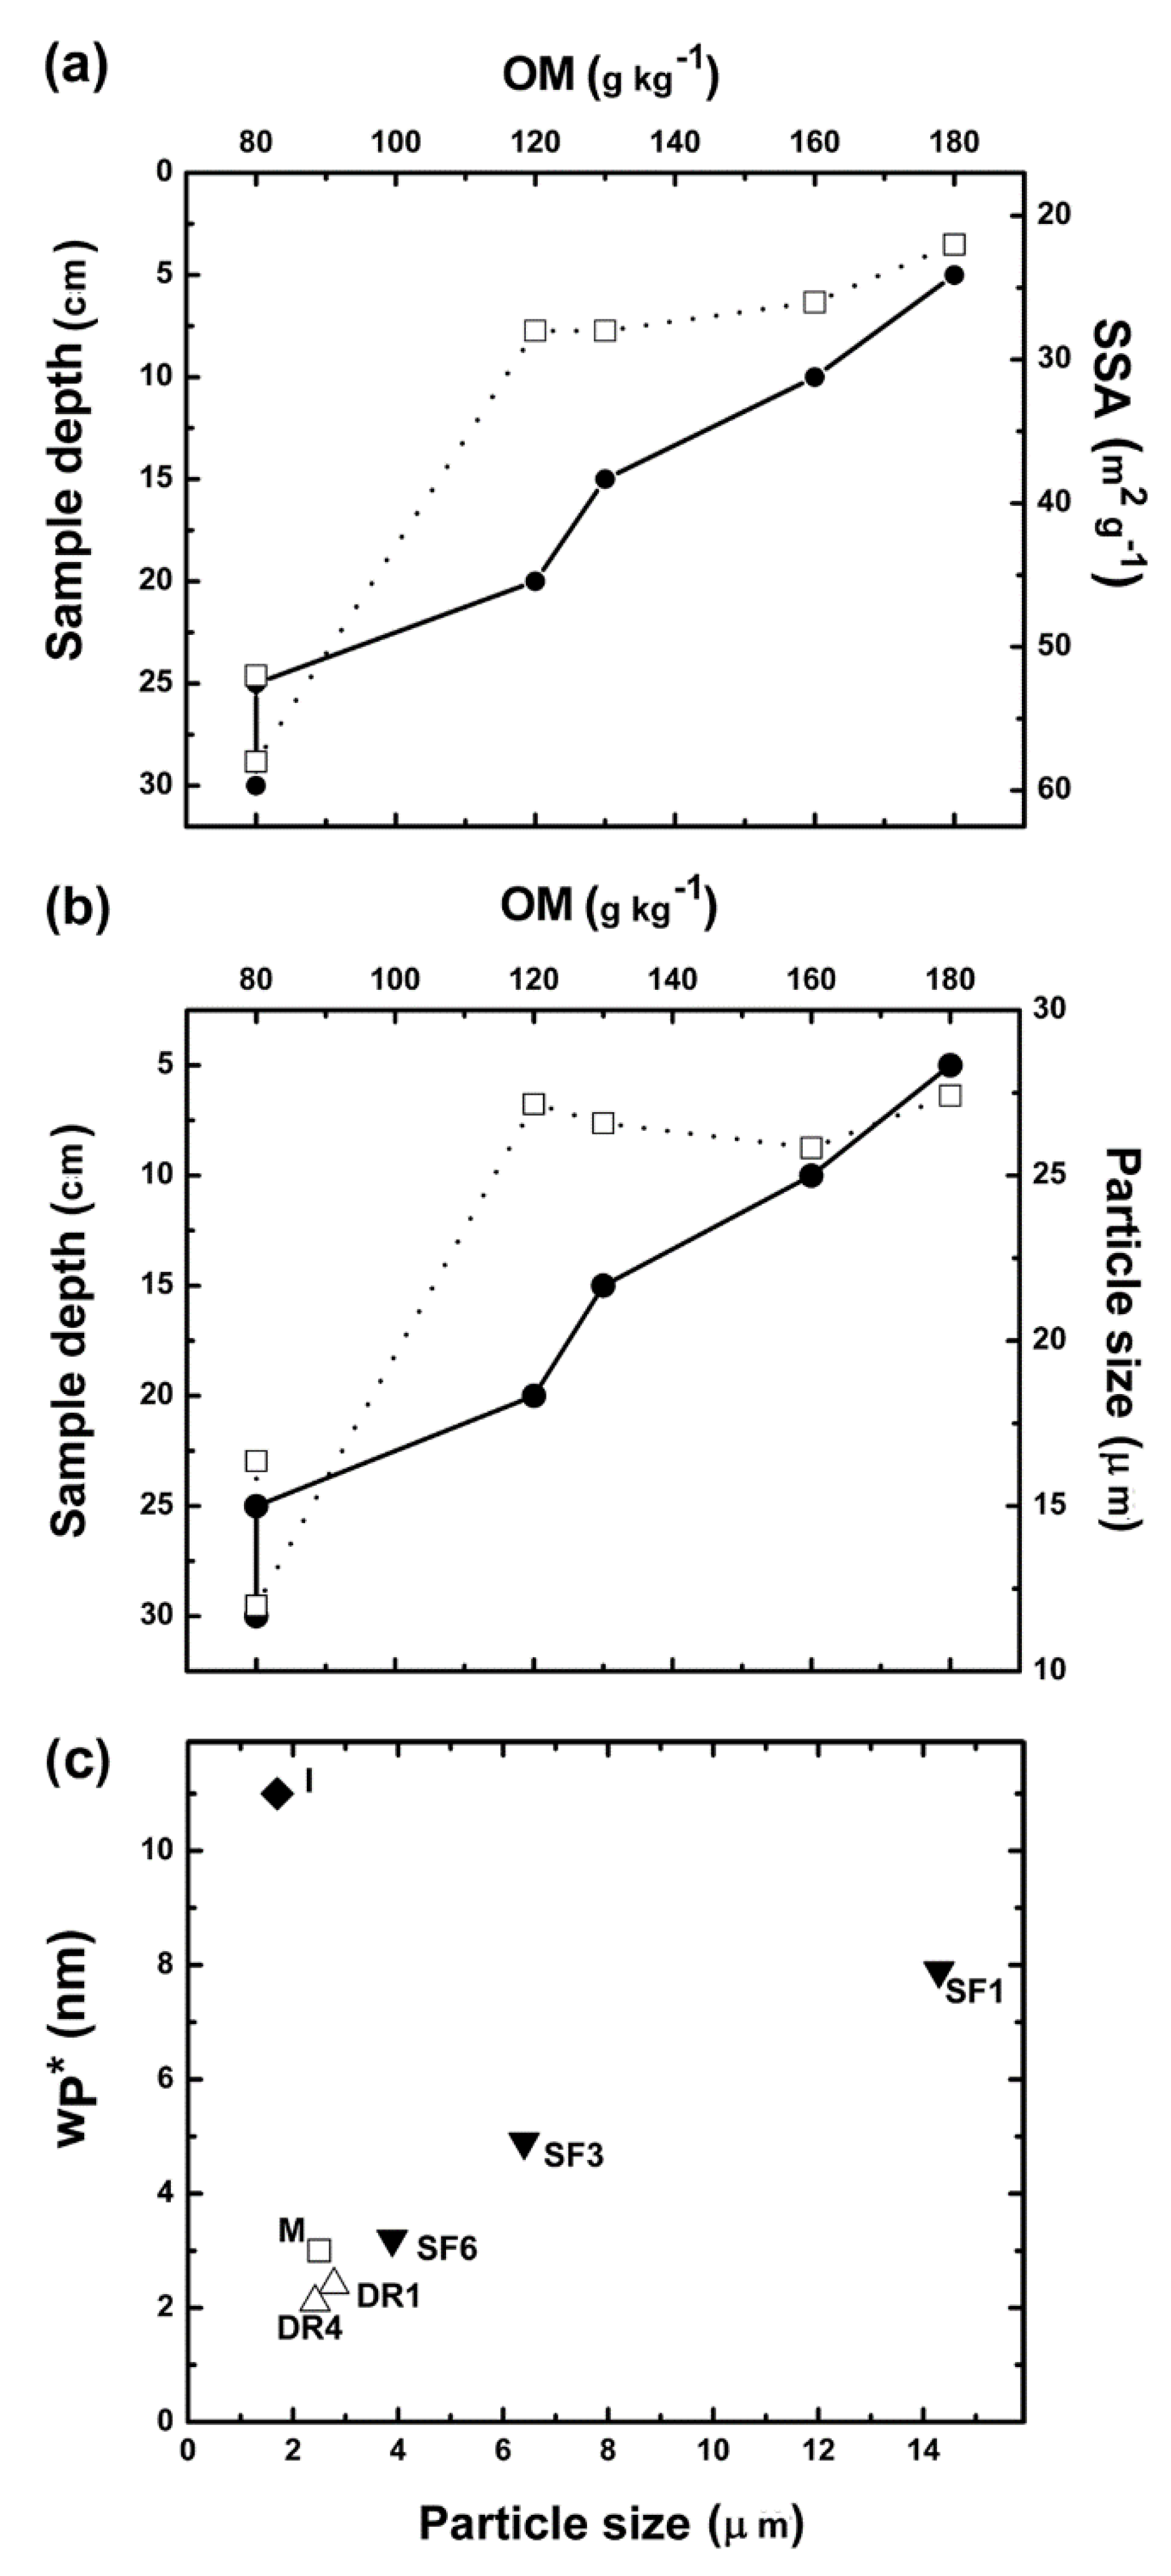
3.5. Grain Size, Surface, Textural, and Morphological Characterization

3.5.1. Grain Size

The particle sizes of the uncontaminated bulk sediments were smaller than those of the contaminated ones and all of them tended to decrease with depth (Table 3). The percentage of clay fraction extracted from the DR1 section was higher than that extracted from the contaminated SF1 and SF3 (Table 4). Additionally, in both deeper sections, the % of clay extraction was higher in DR4 than in SF6. It should be noted that for each core, the percentage of clay-sized particles increased with depth. The particle size was highest in surface section SF1 and showed a marked decrease with increasing depth. In the uncontaminated clay fraction, the decrease of particle size with depth was still high but less so (Table 3). This may be due to the agglomeration of the particles mainly related to the OM content. The grain size obtained for the montmorillonite and illite references are also presented in Table 4. Montmorillonite particles were larger than illite, but in both cases, the values obtained were within the expected range.

3.5.2. Surface Area and Textural Characteristics

Bulk Sediments and Clay Size Fractions

The textural characteristics were analyzed for all bulk sediment samples and the results are presented in Table 3. N2 adsorption–desorption isotherms at 77 K for DR and SF sediments are shown in Figure S5. In all cases, a type IV shape, and a type H3 hysteresis loop according to the International Union of Pure and Applied Chemistry (IUPAC) classification were found [46,48], in agreement with the adsorption–desorption curve previously reported for sediments from nearby sites on the same riverbed [6,7,32]. These features are typical of mesoporous materials and indicate that the particles are, in general, agglomerated and with pores between parallel plates (slit-shaped) [46,48,53]. The isotherms of bulk samples from both sediments also showed the “force closure” of the desorption branch at 0.35 < P/Po < 0.55 due to the tensile strength effect, indicative of a larger amount of small mesopores with a diameter of 4 nm [54] In both cases, the absence of a plateau at high P/Po also indicated the presence of macropores and the volume uptake at P/Po near 1.0 showed that the total pore size of these materials was up to ~ 200-nm range. According to the BET model, the SSA determined for the superficial uncontaminated sediment was higher than that of the contaminated sediment, where a slight increase in SSA with depth was observed (Figure 6a). The isotherms for all clay fractions were also identified as type IV and hysteresis H3 in all sections (Figure S6). Nevertheless, some characteristics were slightly different from those of the bulk sediments, showing an increase of the volume of nitrogen adsorbed and the shape of the hysteresis loop observed at higher p/p0 values. These changes indicated that, in the clay fractions, the interparticle porosity changes with respect to the bulk sediment and increases the size of the mesopores in the network. The SSA for DR clay fractions was rather similar, whereas SF clay fractions had a substantially smaller SSA which increased with depth, being SF1 < SF3 < SF6 (Table 4).
The quantitative estimations of the micropore and mesopore volumes obtained from the analysis of the isotherms showed similar values of VTP, Vmes and VµP for all DR sediments core sections (Table 3). Table 4 shows that in DR clay fractions, the values were higher than in bulk sediments. Also, the modal pore size (wP) had a constant value of 2 nm for all sections (in all sections from DR1 to DR4 of bulk sediments) and was slightly higher than the value measured in their respective clays (approx. 2.3 nm), which indicates that it is a material with very small mesopores, as occurs in clay minerals. In the case of SF contaminated sediments, the VTP were relatively lower in the superficial than in the deeper sections, but the Vmes values were similar along the vertical profile (Table 3). Like that found for bulk sediments, in the SF clay fractions there was also a difference in the first 20 cm (Table 4). Furthermore, the relationship between the VµP and VTP values for these sections was the same as that found for the sediments. The VTP and Vmes in SF1, SF3 and SF6 was comparable, but SF1 and SF3 had a negligible VµP value which increased slightly in the deeper SF6 fraction (Table 4). The wp for bulk sediment and clay fraction decreased with depth (Table 3 and Table 4). A linear relationship was observed between the particle size and the modal pore size for both DR and SF clay fractions (Figure 6c). The PoreSD for all sediments and their clay fractions, showed a broad PoreSD curve for both sediments (Figure S7).

Reference Clays

The textural characteristics of the reference clays are shown in Table 4. According to IUPAC classifications, a type IV shape and a H3 hysteresis loop was suggested for montmorillonite (M) and a type II(b) isotherm with a narrow hysteresis loop, also type H3, for illite (I) (Figure S8). The VµP of illite was low, but a relatively high VTP value was measured, indicating that mesopores were prevalent. In contrast, the VµP of montmorillonite was twice higher than that of illite but the VTP was lower. The differences between the two reference clays were also reflected in the values of w, which were 3 and 11 nm for montmorillonite and illite, respectively. In Figure 6c, the relationship between the particle size and wP for both reference clays were also included for comparison.

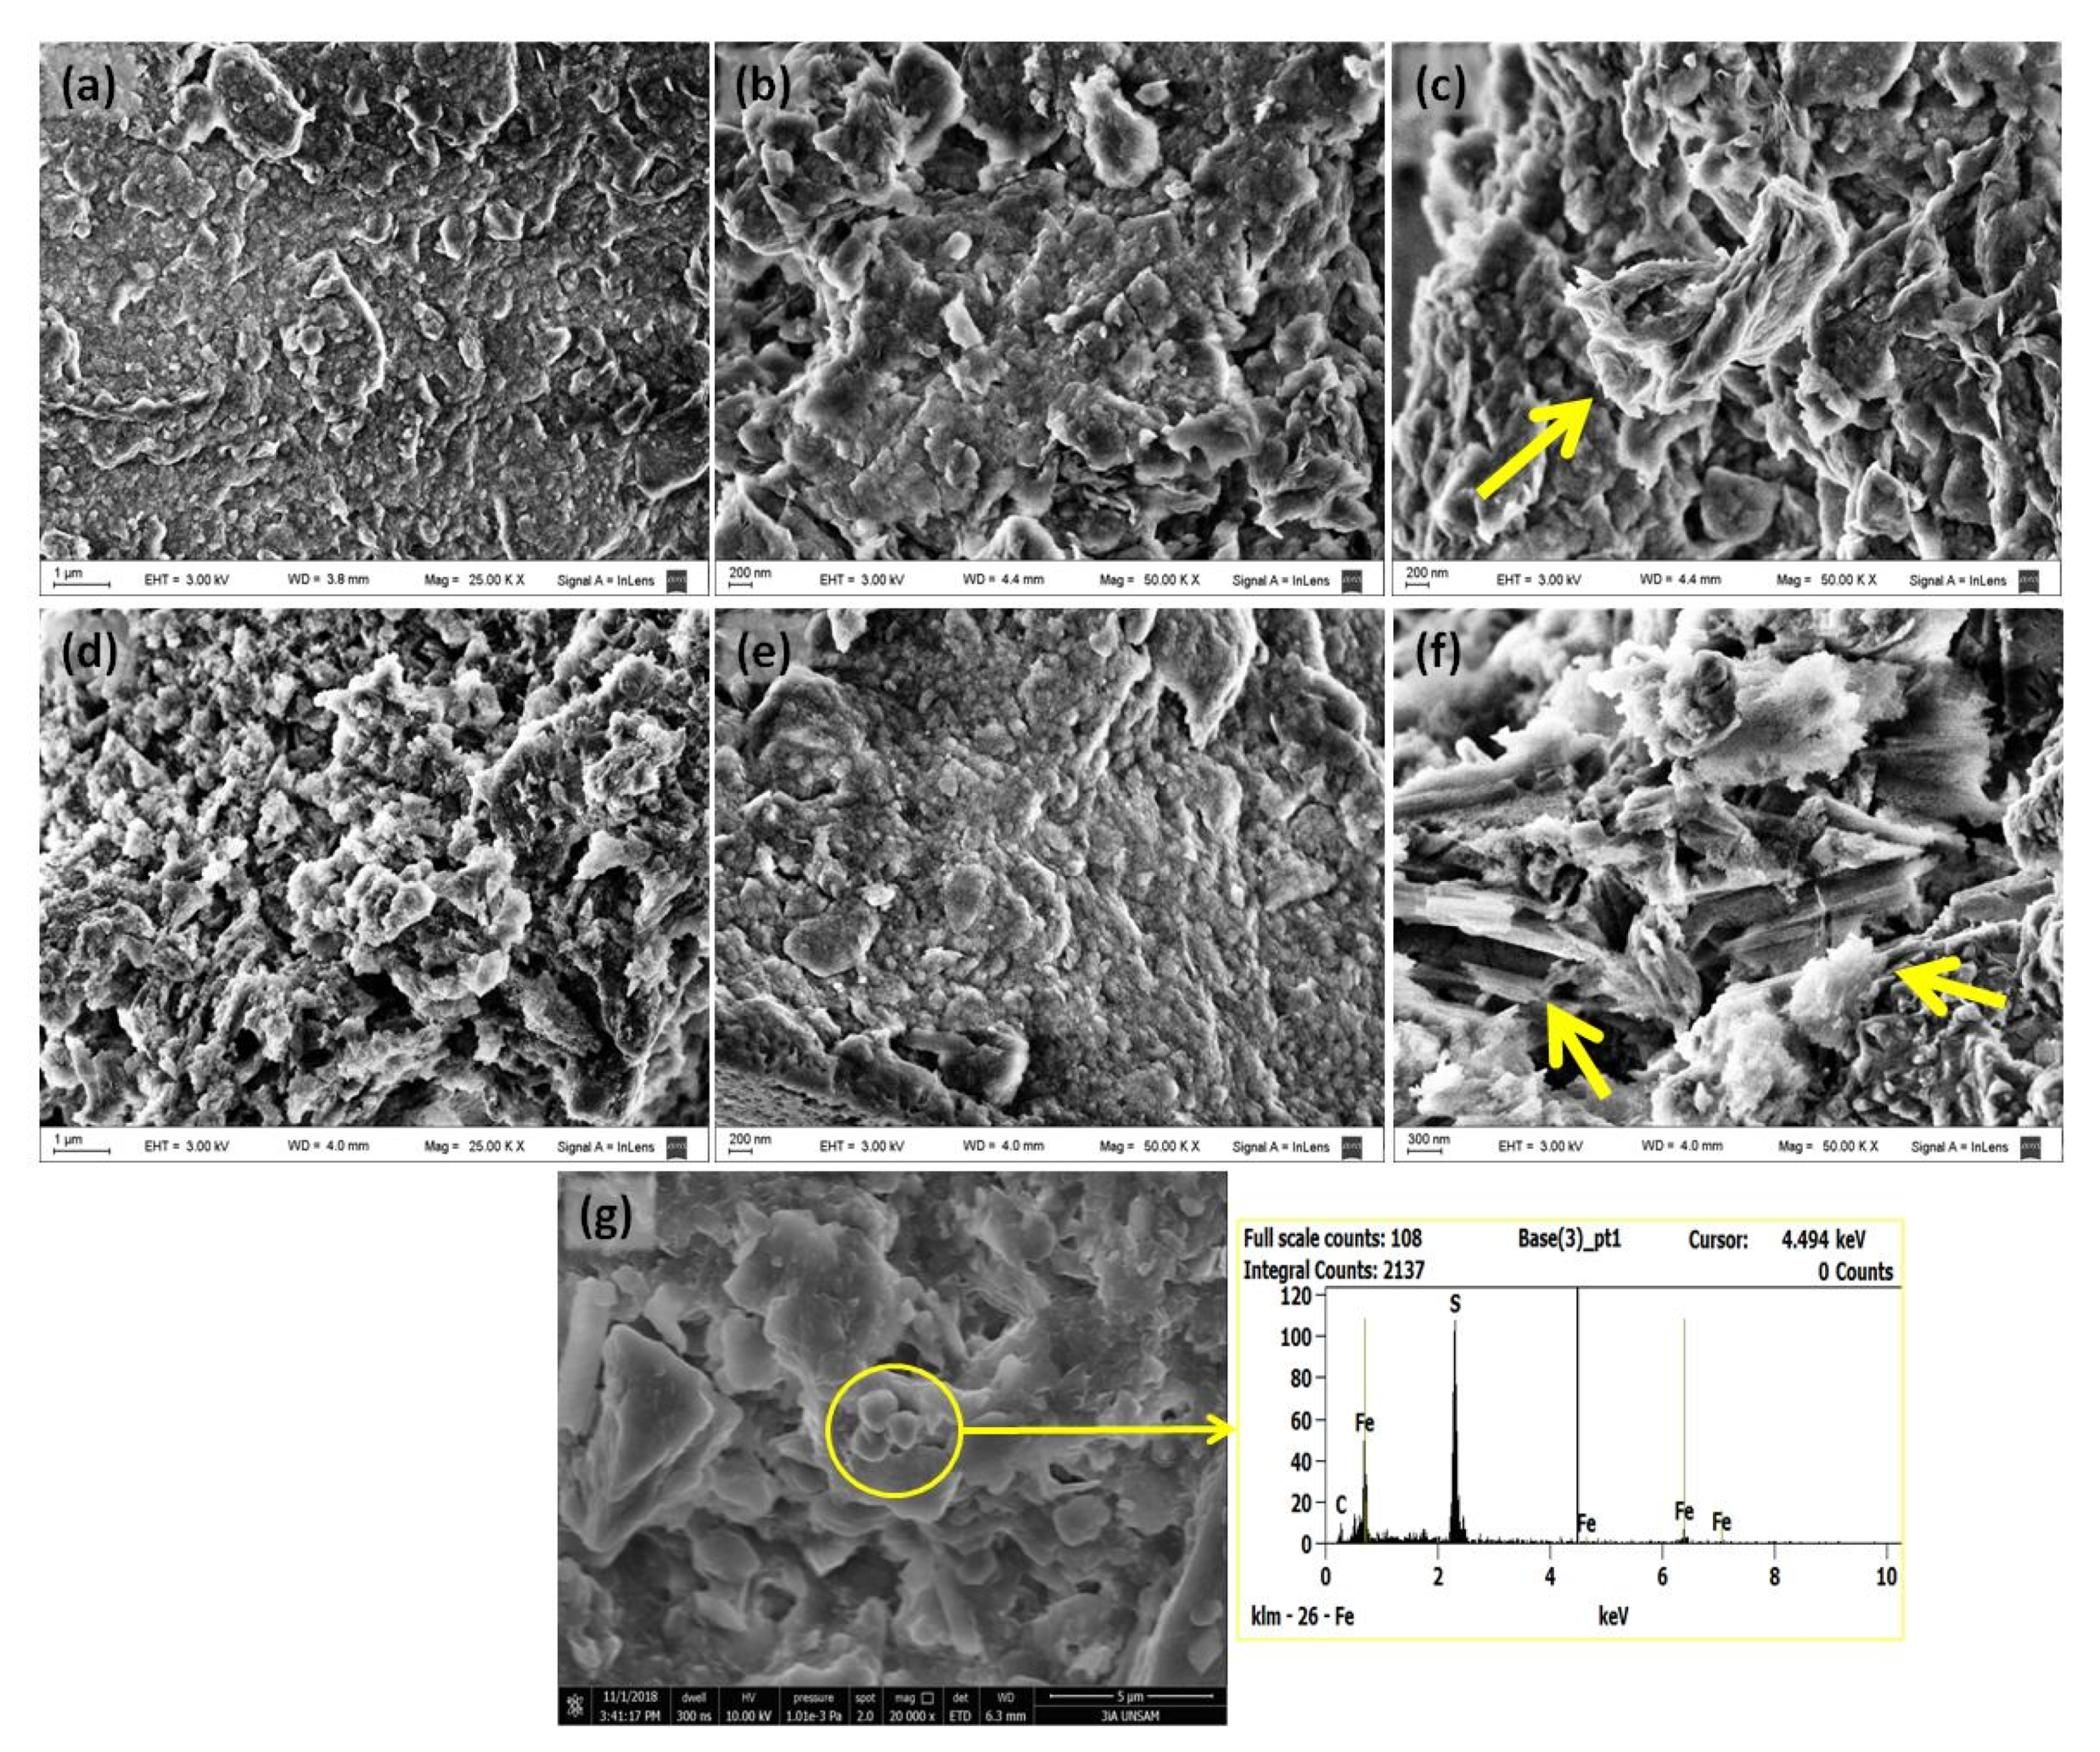
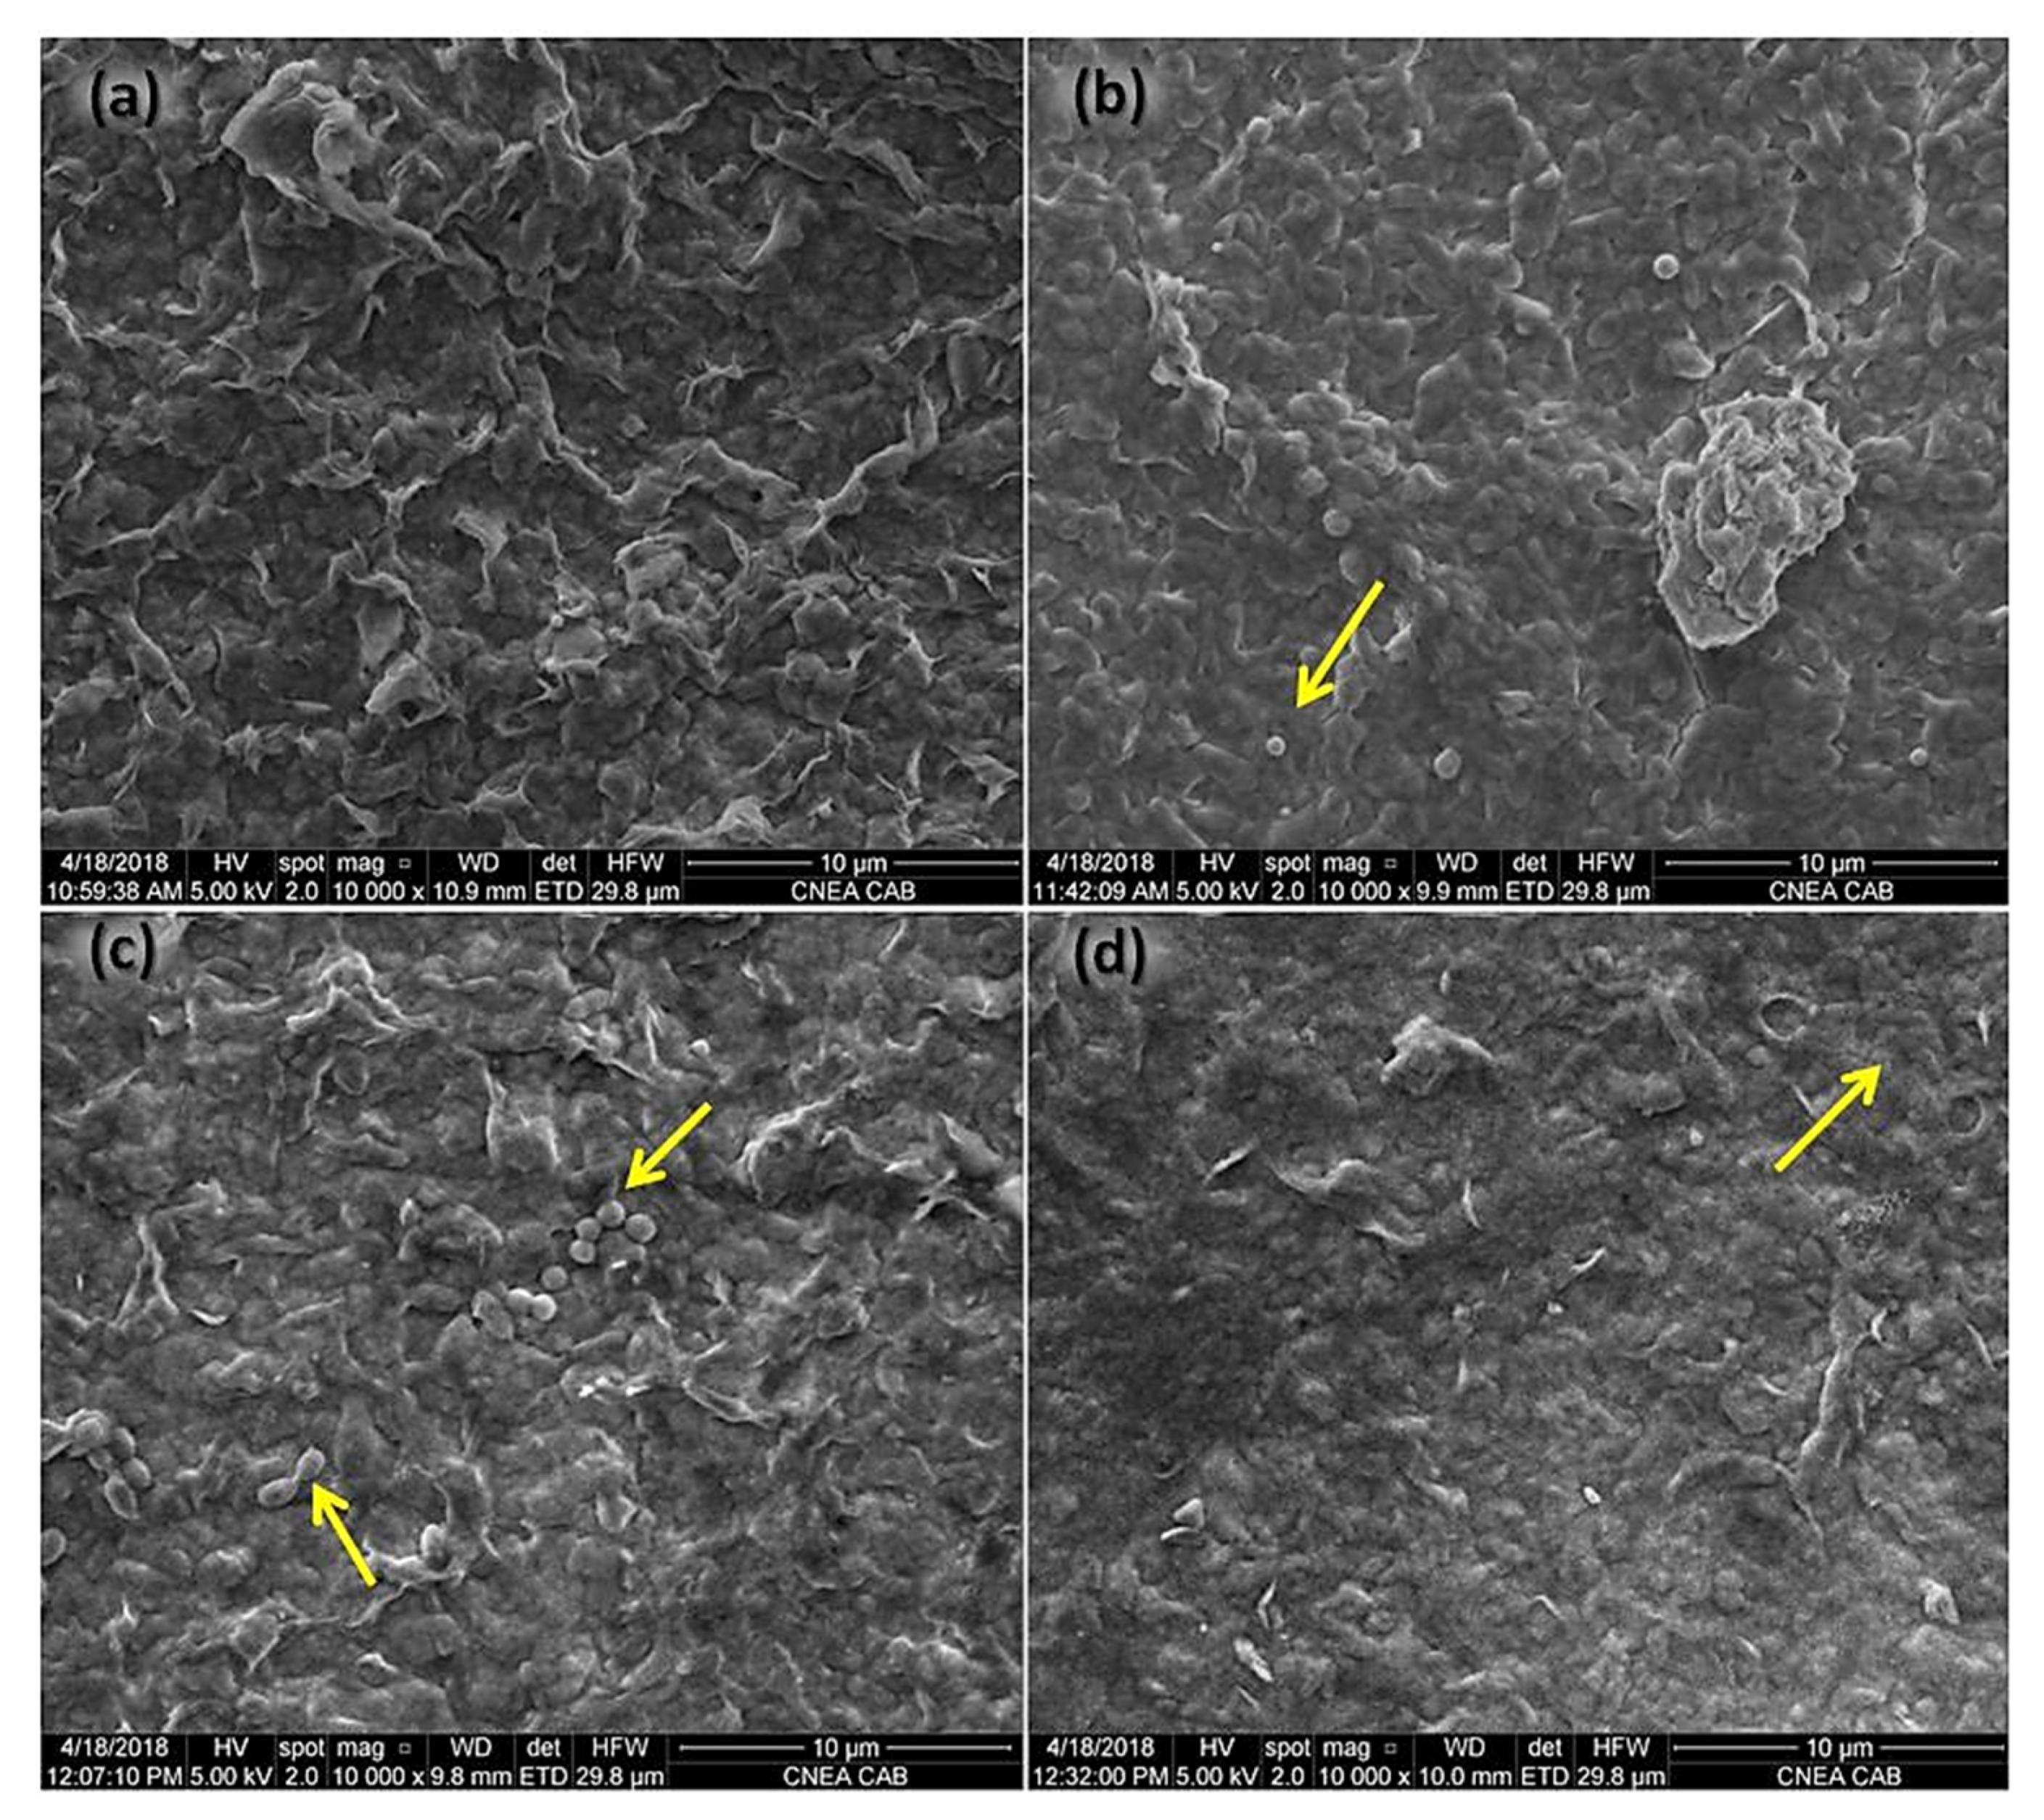
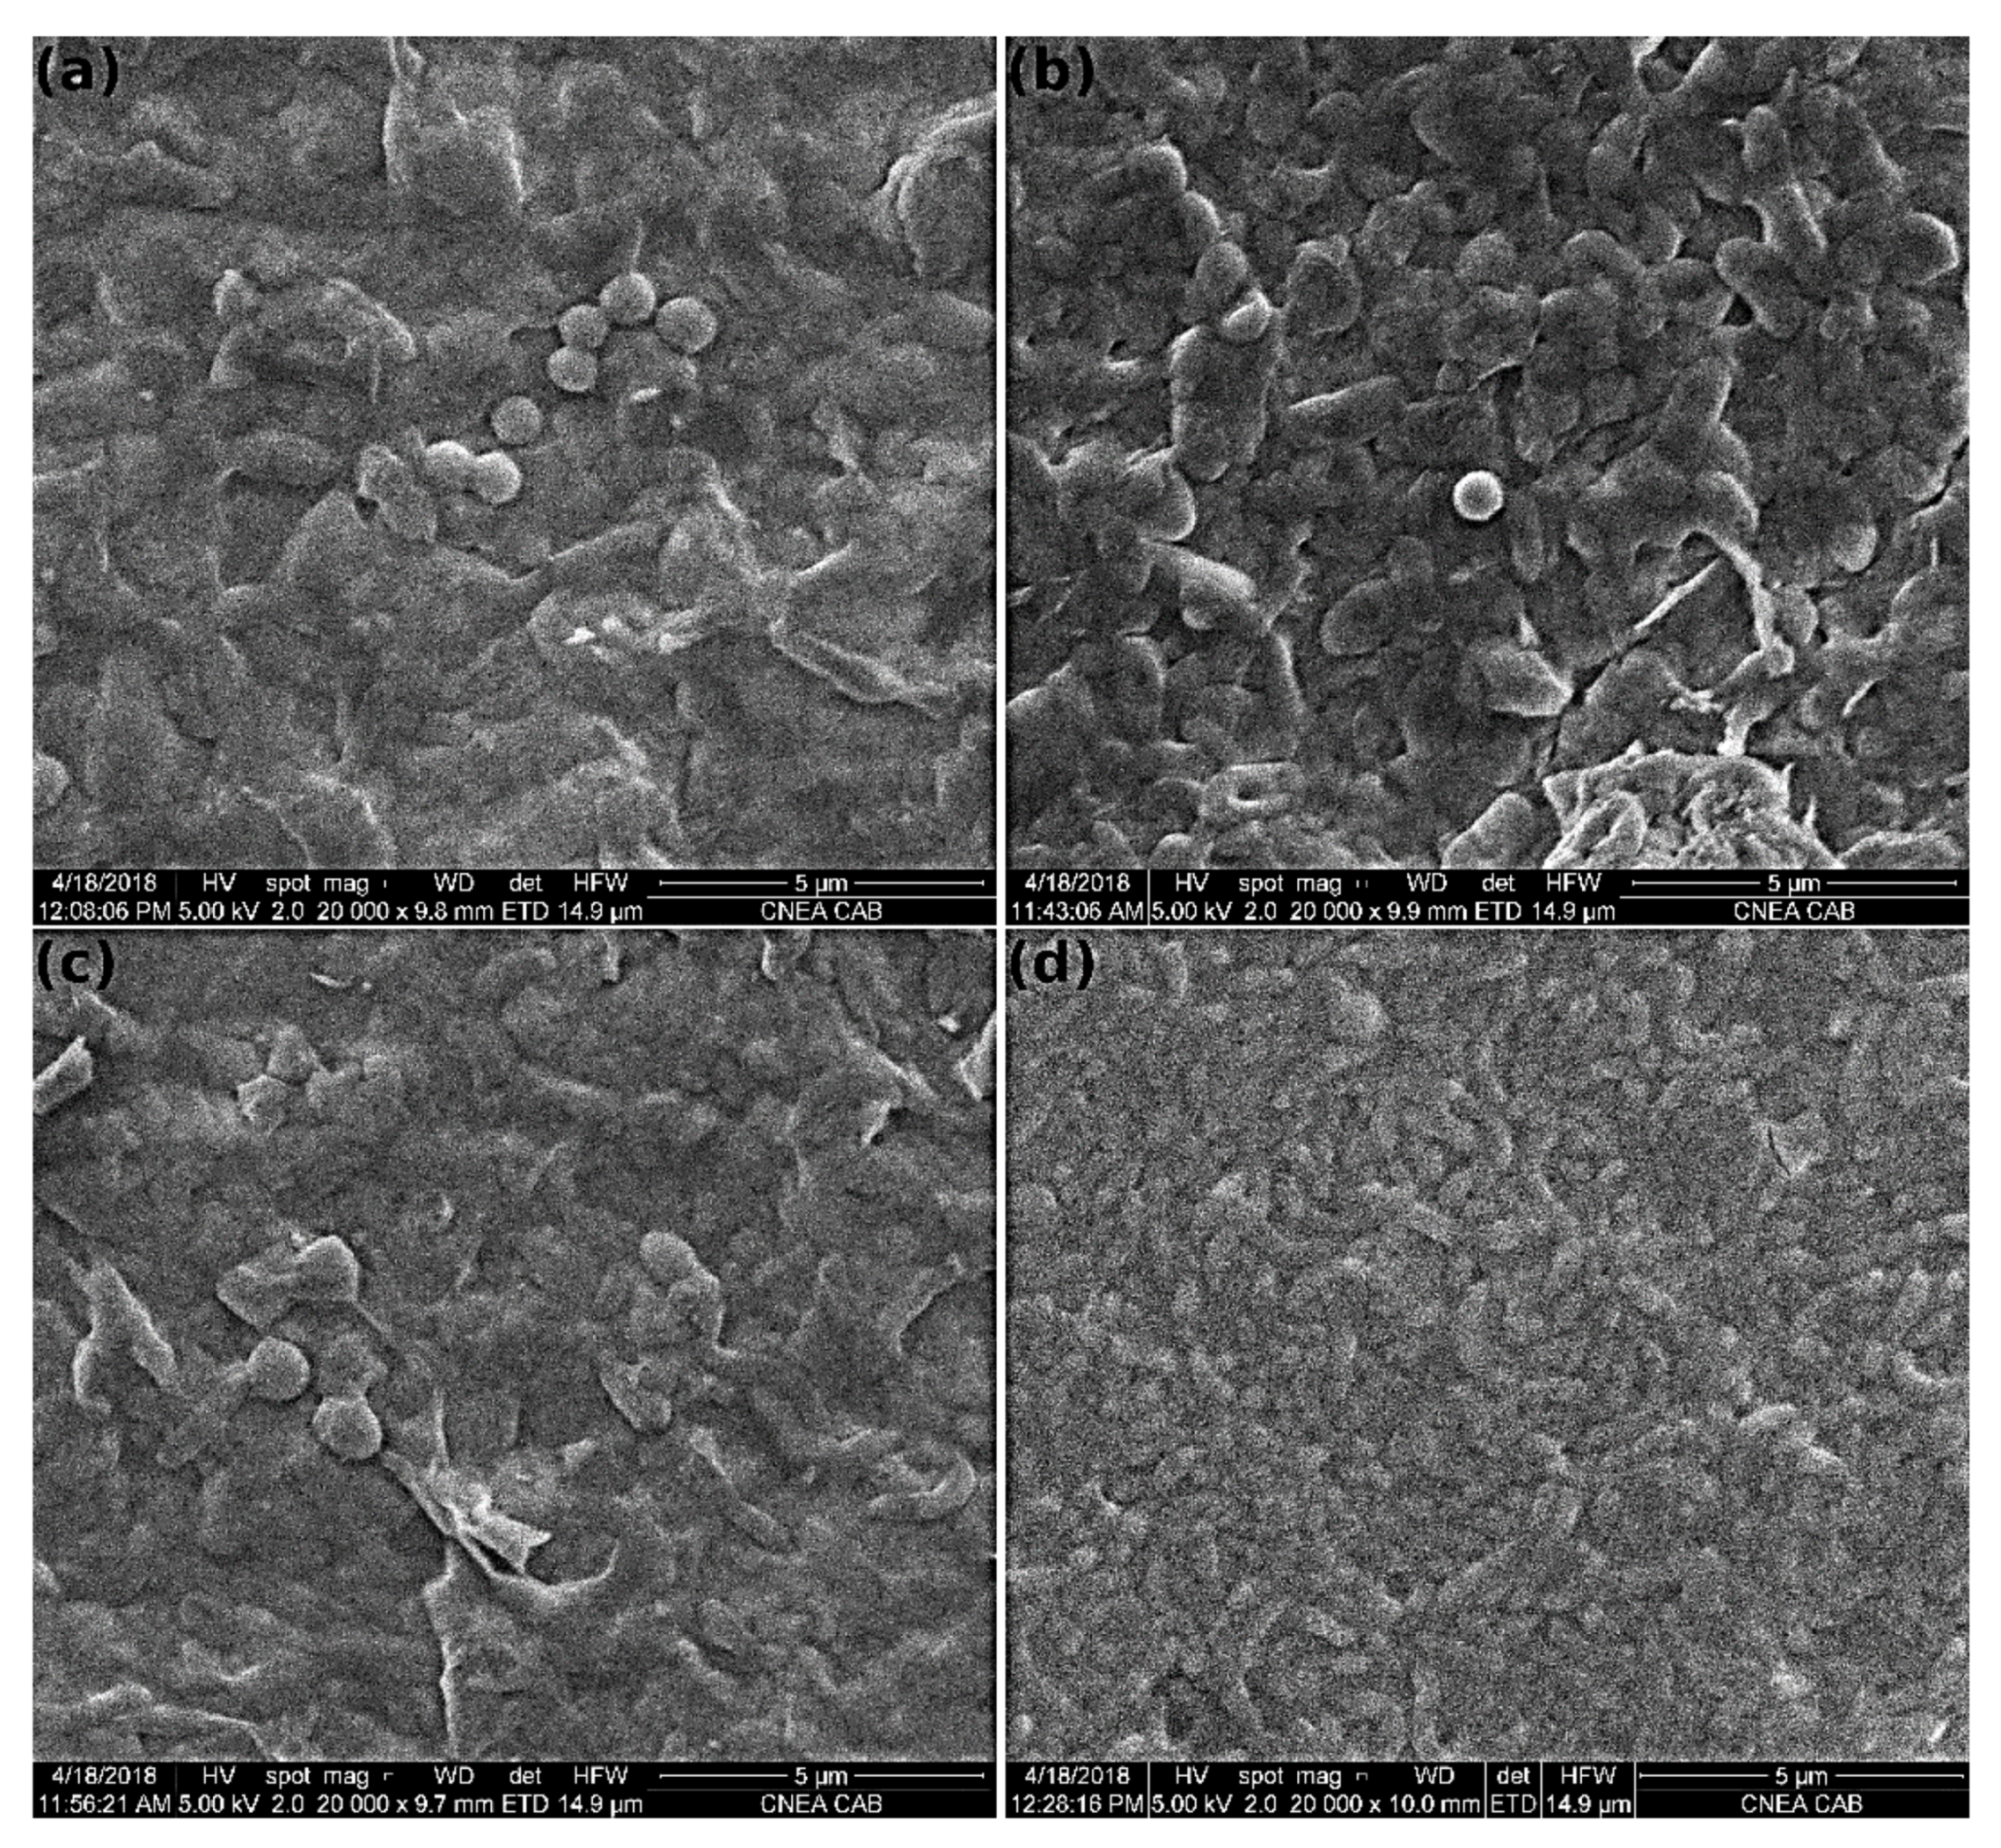
3.5.3. Morphological Characterization

The morphological features of mineral surfaces were investigated by scanning electron microscopy. SEM micrographs of bulk sediment samples for sections DR1 (0–5 cm) and DR4 (15–20 cm) (Figure 7a,b) showed a multitude of shapes and sizes. However, the basic morphology is essentially given by clay plates, as was previously reported at nearby sites [7]. On the other hand, SEM micrographs taken from SF sediments at different depths revealed a greater heterogeneity (Figure 7d,e). Crystal morphologies for natural clays from both uncontaminated and contaminated sites are shown in Figure 7c,f. Stacking layers like those described in the literature as kaolinites can be observed and the illite particles were revealed as platelike crystals stacked in the layer structure, which reflects the typical features of sheet silicates [54,55,56]. Crystals of pyrite were found in the contaminated sediments and the mineral composition was confirmed by EDS (Figure 7g). Moreover, the EDS analyses from several images of both DR and SF sediments in Figure S9 suggested the presence of minerals with the typical composition of phyllosilicates. SEM images of the reference clays of montmorillonite and illite showed the typical morphology. Flake-like structures and tightly interwoven flakes of smectite were observed and the mineral composition was confirmed by EDS (Figure S10).

3.6. Interaction of Microorganisms with Clays

To study if the changes induced by contamination in the texture of the sediments influenced the interaction of microorganisms with clays, we recovered bacterial cultures in the sediment samples collected at both sites looking for those able to grow in the anoxic and reducing conditions prevailing under contamination. Abundant bacterial growth was observed from both SF and DR sediments, as indicated by the high turbidity of the culture media. The presence of sulfate reducing bacteria was revealed by the distinct black color of the FeS precipitate produced by the reaction of the sulfide released by bacterial activity with the iron components of the culture media. The presence of accompanying fermentative bacteria was confirmed by isolating pure cultures affiliated to the Clostridium sensu stricto 2 and Clostridium sensu stricto 3 clusters (closest type strain sequences: C. cadaveris JCM 1392(T) (AB542932) and C. intestinale DSM 6191(T) (X76740)).
The initial adherence of microorganisms on the studied clays was low. The images of the reference clay illite were not of sufficient quality as to clearly observe the scarce microorganisms adhered and, therefore, in Figure 8, representative images of the reference clay montmorillonite are shown, where scattered cells can be seen adhered to the surface of the clay particles. In accordance with the existence of an electrostatic repulsion barrier between the bacterial and clay surfaces at neutral pH, the initial adherence of bacteria to the studied clays was low and could only be overcome by specialized structures (pili, flagella, proteins) and a strong component of hydrophobic interactions [57,58,59,60,61] to allow biofilm formation. The architecture of biofilms grown in culture is determined by biological, chemical, and physical conditions, like the type of microorganisms, the presence of surfactants, the medium composition, and perturbances like shaking or liquid addition or removal. In this work, experiments of biofilm formation over different clays were carried out in batch, employing in every case the same mixed bacterial culture and defined medium (described in detail in the Materials and Methods Section), which included lactate as the carbon source. Bacteria were able to grow and form distinct biofilms on all the clays assayed. Despite the initial low microbial attachment to the montmorillonite reference clay, evidence of incipient biofilm development was observed as determined by the presence of extracellular polymeric substances (EPS) (Figure S11). Interestingly, the initial bacterial growth in the presence of the natural clays of the bulk sediments from DR and SF was higher than that observed with the reference clays, as determined by the percentage of carbon source (lactate) consumption after three days of culture: montmorillonite 18%; illite 23%; DR 60% and SF 41%. No significant differences were observed between the biofilms grown over the reference clays tested. In Figure 9, the biofilm grown over montmorillonite at different cycles of batch culture media refreshments are shown, where the typical flake-like structures become more difficult to distinguish throughout the cycles. Furthermore, bacterial cells were seen from cycle I (Figure 9b), and the surface was finally covered by a flat biofilm at the end of cycle III (Figure 9d) where, in some cases, cell boundaries appeared diffuse, probably due to the EPS matrix formed during bacterial growth. Cells were either embedded or on the EPS matrix, probably because these substances are not equally produced by all members of the community. Additionally, different cellular morphologies can be distinguished in the biofilm, which was also the case with the natural clays extracted from SF and DR (Figure 10). Here, the typical characteristics previously described for each clay could not be easily distinguished due to the presence of the bacterial biofilm, which covered the surface of the clays, where bacterial cells could be observed instead.

4. Discussion

In this work, two regions of the Reconquista River immersed in different urban and industrial environments were studied. The observed contrast between them was related to relevant differences in the degree of contamination to which the watercourse is exposed. Sediments act as a sink for a large part of the pollutants that are discharged into the waters and, therefore, are greatly affected over time. The identification of point sources of pollutants in these waters is difficult due to the intermittent and irregular discharges [62], but the detection of heavy metal entry is feasible through the analysis of the anaerobic sediments, where the metals are rapidly incorporated and accumulated. In accordance with our previous reports [3,4,6,32,37,63], as shown in Table 1, the level of contamination of the superficial waters at the SF site was much higher than in the DR site. The very low values of DO and ORP, and high values of nitrates and phosphates measured in SF depict the anaerobic state of the waters due to oxygen depletion by microbial activity on reduced compounds. This contamination was also reflected in the sediments. Accordingly, we found that most inorganic anions and cations as well as OM and sulfides were higher in the SF contaminated site. Huge differences in the OM content were found at all depths of the vertical profile of the sediments from the two studied sites, strongly indicating the contaminated status of SF as opposed to DR. The decreasing content of OM in the vertical profile (as seen in Table 2) suggests that the input of the contamination detected comes from the waters. Although none of the measured parameters is a direct measure of the microbial load, the oxygen depletion and the huge sulfide concentration at the SF site is typical and indicative of an enhanced microbial activity because of higher substrate (OM) availability. In our previous research, we expanded the knowledge on the sediments of other sites in this same basin, which supports the observation that under the anoxic conditions of SF sediments, this microbial activity leads to the production of sulfides and probably also carbonates (like siderite) [3,4,6,37]. The presence of these mineral compounds was not confirmed here, but gave the SF sediments a black color and the appearance of a very thick plastic sludge that differed significantly from that of DR, which had a brownish color and a granular appearance, as seen in Figure S12. The main crystalline components here identified in both DR and SF sediments were quartz, feldspar, albite, and clay minerals, common in the outcrops of the riverbanks and found to also be present at other sites of the same river [6,7,32]. This evidenced a substantial similarity in the mineral composition of the pristine and contaminated sediments regardless of depth or contamination, with no major differences found between their clay fractions either. The fact that sediment samples from different riverbed sites have the same mineralogy indicates that there were no relevant changes in the geology of the studied area, and that there were no mineralogical modifications caused by contamination and microbial activity.
Regarding the content of heavy metals, as shown in Table 1 and Tables S1 and S2, a marked difference between both sites was also found, with a clearly higher content of Zn, Cu, and Cr in the entire vertical profile of the SF contaminated sediment (Figure 2). Argentina does not have legislation on the maximum concentrations of heavy metals in sediments, however, the total concentration of these metals in the upper 20 cm of the SF sediments did exceed the permissible limits according to the sediment quality guidelines from the Netherlands and Australia, which recommend maximum values of Zn: 140 mg kg−1, Cu: 36 mg kg−1, and Cr: 100 mg kg−1. As can be seen in Table S1, the maximum permissible content of Zn was exceeded with values of SF1: 260 ± 30, SF2: 200 ± 30, SF3: 190 ± 10, and right on the edge in SF4, with 140 ± 10 mg of Zn per kg of sediment. In the case of Cu, the maximum permissible contents were also exceeded, with values of SF1: 60 ± 9, SF2: 44 ± 4, SF3: 50 ± 10, and SF4: 40 ± 10 mg of Cu per kg of sediment. Finally, the same situation was found for Cr, which was also exceeded in the upper 20 cm of the SF sediments with values of SF1: 260 ± 20, SF2: 250 ± 30, SF3: 220 ± 50, and SF4: 120 ± 20 mg of Cr per kg of sediment. In contrast, the concentrations measured in DR sediments were within the permissible limits of the Dutch and Australian guidelines (Table S1). Interestingly, in the DR core, the total content of Cu and Zn decreased with depth, while the content of Cr increased without a clear trend in the OM content. Conversely, in the SF core, Zn, Cu, Cr, and OM all presented the same concentration trend with depth (Figure 2), which agrees with that reported for the Jajrood River where the adsorbabilities of heavy metals in sediments increased with increasing OM content [8]. All of the above stated show a link between high contents of OM and high concentrations of heavy metals in the sediments of the SF site, with average values of OM: 150 ± 30 g kg−1; Zn: 240 ± 20 mg kg−1; Cu: 60 ± 10 mg kg−1 and Cr: 270 ± 20 mg kg−1. Conversely, DR did not show the same, with average values of OM: 41 ± 5 g kg−1; Zn: 5.6 ± 0.4 mg kg−1; Cu: 7 ± 1 mg kg−1, and Cr: 3.1 ± 0.2 mg kg−1), suggesting that metals and OM mainly come from the contamination of superficial waters, emphasizing the risk that pollution poses to the ecosystem [3,64].
These notable differences in OM content were also closely related to the size and textural characteristics of the sediment and their clay particles [23,24]. Kaiser et al. (2003) [65] investigated the SSA from more of 100 mineral horizons of forest soils before and after removal of organic matter and found that the sorption of organic matter reduced the SSA, depending on the amount sorbed and the type of mineral. Therefore, the organic compounds may adsorb onto the surface of the particles, leading to lower SSA values and a greater particle size than expected.
As shown in Figure 6a,b, the SF sediments showed alterations in their characteristics such as the grain size and SSA. The particle size in the SF bulk sediment was larger than expected [24] and decreased with depth in the same way as the content of OM. Accordingly, an inverse tendency was observed for the SSA, which increased as the OM decreased, suggesting a considerable particle agglomeration. On the other hand, the OM content was rather similar along the analyzed profile of the DR core. The particle size of the DR bulk sediment decreased with depth from DR1 (19.72 μm) to DR4 (11.89 μm), but there was no clear trend for SSA (Table 3).
In the case of natural clays, the SSA values measured in the DR clay fractions were consistent with the particle size and corresponded to values typically found in clays with a mineral composition characterized by the presence of illite and smectite [7,32] and with a low content of OM [16,66,67]. Concerning the clays extracted from SF, we found that the upper section of the SF core (SF1: 0–5 cm) had particles of a smaller size than the respective sediment particles. However, the SSA in this section SF1 was similar in both the sediment and clay particles, suggesting that the differences could not only be determined by the OM content, but that here, the mineral composition could play a key role. Again, this is in agreement with that reported by Kaiser et al. (2003), who comment that the surface area as well as the sorption of organic matter varies strongly between different mineral phases [65]. In the rest of the SF core, from SF2 (5–10 cm) to SF 6 (30–35 cm), the SSA of the clays was higher than that of the sediments, although lower than expected.
Together with the aforementioned, we analyzed the porosity of the sediments and their respective clays and found that the OM content could affect the porosity of sediment particles and, as seen in Table 4, this was also observed in the clay particles of both cores (DR and SF). Despite the differences in the content of organic matter in both bulk sediments, the volume of mesopores in all sections of both cores was similar (the average values for DR and SF were 0.046 ± 0.002 and 0.043 ± 0.003, respectively) but the volume of micropores was notably lower in all sections of the SF core (see Table 3). This is interesting as it seems that a high OM content led to a decrease only in the volume of micropores. As can be seen in Table 4, this effect also occurred with the SF clay particles, since a slower volume of micropores was also observed on the surface and increased with depth, in correspondence with the decreased OM content. It should be noted that, according to Kaiser et al. (2003) [65], the loss of the SSA from pores of different sizes on the sorption of organic matter is highly variable even for the same mineral and that the micropores are also lost in the initial stages of the surface accumulation of organic matter. Then, considering that the particle size in the upper section of the core almost doubled that in the deeper section, it can be argued that pores < 2 nm are occluded [66]. However, this cannot be assured because other changes associated with the OM content could be taking place and lead to a decrease in microporosity and to an increase in the number of mesopores (2–50 nm) [12].
In Figure 6c, a clear tendency was observed between the wp of the clay fractions, which decreased with the particle size along the vertical profile of both sediments. Montmorillonite also followed this linear trend, with values like those obtained for the DR clay fractions, whereas illite had the highest wP and the smallest particle size of all the clays studied. Kuila et al. (2012) [66] demonstrated that depending on their maturity stage, organic materials can act as a pore blocking material within a clay matrix. Then, Kuila and Prasad (2013) [53] reported that, with similar mineral composition, the differences observed in pore volumes were given by the OM content, acting as a pore-blocking material within the clay package and reducing the fine mesopore volumes. All the above stated must be considered together, since the textural characteristics observed should not be attributed only to the content of OM and may also be associated with changes in the mineral composition, which is directly related to the geochemical conditions in which these clays formed. Unfortunately, it was not possible to detect by the XRD analysis, and therefore we did not confirm the existence of interstratified illite-smectites.
Organic matter is one of the most relevant factors shaping sediment microbial communities [1]. OM in river sediments is a complex mixture of different compounds originated in situ via biological activity or coming from an external input. In the Reconquista River, most of the OM is of anthropogenic origin and constitutes the main source of organic contamination of waters and sediments, leading to the growth of microbial biomass mainly in the form of biofilms [5,6]. In the sediments, the OM is consumed and transformed mostly through anaerobic processes mainly coupled to sulfur and iron reduction [3,4,5,64]. This gives evidence of the presence of microorganisms able to take over in the community if the status of the sediment shifts from pristine to polluted. Chemoheterotrophs (microorganisms that use chemical compounds as carbon and energy source) are diverse in taxonomy and metabolic function and play a key role in the initial degradation of the OM. In one of our previous works, these types of microorganisms were found to be abundant components of the bacterial assemblages in all the studied sediments [36]. Among them, Clostridium is a ubiquitous genus well recognized for its chemoheterotrophic fermentative metabolism and are relevant players in the degradation of organic macromolecules in anoxic sediments and are usually recovered from enrichment cultures performed under sulfate-reducing conditions [68], which was confirmed in this work.
When there is a large input of OM, it accumulates in the sediments and interacts with clays and metal oxides, becoming less bioavailable for most of the organisms [7,12,63]. There, the initial degradation carried out by the chemoheterotrophs provides substrates that are, in turn, used by sulfate and iron reducing microorganisms, ultimately leading to the accumulation of large amounts of sulfides in the sediments. Sulfides can react with metal ions, generating metal sulfides that are insoluble. Consequently, the combined inputs of heavy metals and OM from water discharges are responsible for the accumulation of heavy metals sulfides and the observed change in the visual appearance of the sediments, which acquire a dense black color due to the sulfides (Figure S12). Considering that the recycling of the OM determines the fate of persistent pollutants (i.e., degradation of toxic organic compounds and immobilization of heavy metals) in situ, we enriched in culture the sediment bacterial populations able to grow in the presence of the pollutants and under sulfate-reducing anaerobic conditions to study their interaction with clays. These groups of microorganisms and the way in which they interact with the sediment are crucial factors to consider when designing treatments for the remediation of the anoxic contaminated sediments and the leaching of heavy metals.
Initial adherence of microorganisms to the surface is a key step in the subsequent formation of biofilms and the establishment of bacterial assemblages that determine the biogeochemical processes occurring in sediments. Even though the initial attachment to surfaces and the quantitative differences between the biofilm growth on reference and natural clays could not be distinguished by SEM (Figure 8 and Figure S11), lactate consumption at the beginning of the experiment was higher for the natural clays, suggesting a differential interaction of the bacteria with the studied clays. The biofilms formed included a dense matrix of EPS, which are known to be effective nucleation agents for clay minerals, operate in iron homeostasis, and bind several cations [12,69]. As can be inferred by the different cellular morphologies observed, the formed biofilm is a complex structure produced by different taxa. Probably, these taxa have trophic interactions, which depend on the types of microorganisms and the relative size of their populations and determine the microbial turnover of organic matter and contaminants in the sediment.

5. Conclusions

In this work, we found important differences between two 24-km distant sites, DR (upper basin, not contaminated) and SF (middle basin, highly contaminated), of the urban Reconquista River concerning the quality of the surface waters and, mainly, the sediments. In particular, it was found that the untreated domestic and industrial effluents discharged upstream of the SF site contaminated the sediments with a high content of organic matter and heavy metals such as Zn, Cu, and Cr. The organic matter in the polluted sediments seemed to induce the accumulation of heavy metals through microbial activity. The microorganisms catalyze several chemical reactions that ultimately lead to the production of sulfides, which react with the metals in the surrounding water with the consequent precipitation of metal sulfides. Likewise, although no changes in the mineral composition between the sediments from both sites could be demonstrated by XRD, the high content of organic matter in SF might be responsible for the changes in the physicochemical characteristics of the sediments and their clays. These changes were reflected in alterations in the particle size, surface area, and porosity, which varied with respect to depth in the stratified vertical profile. The effect of contamination in the clay minerals occurs mainly at the level of particle association, where it induces the formation of aggregates. This effect is decisive for the surface interaction required for the initial steps in the formation of microbial biofilms, whose metabolic functionalities are involved in the biogeochemical cycles that occur in sediments as well as in the transformation and fate of the contaminants that may be present. Finally, these findings are also relevant for the design of remediation processes aimed at the recovery of immobilized metals and the restoration of the quality of the sediments in the polluted areas of the Reconquista River.

Supplementary Materials

The following are available online at https://0-www-mdpi-com.brum.beds.ac.uk/2075-163X/11/3/242/s1. Figure S1: Clay suspensions of (a) montmorillonite (M), (b) illite (I), (c) DR (uncontaminated site) and (d) SF; Figure S2: XRD patterns of bulk sediments of the (a) DR and (b) SF cores for the superficial (DR1, 0–5 cm and SF1, 0–5 cm), intermediate (SF3, 10–15 cm) and deep (DR4, 15–20 cm and SF6, 25–30 cm) sections of sediment; Figure S3: Diffractograms from the clay fractions (<2 µm) of DR core: (a) DR4 (15–20 cm) and SF core: (b) SF1 (0–5 cm) and (c) SF3 (10–15 cm). XRD patterns shown were obtained after the samples were air-dried (N), ethylene-glycol-solvated (EG) or heat-treated at 550 °C (HT). Main compounds that were identified are marked as Q (quartz), I (illite), Sm (smectite), K (kaolinite) and F (feldspar); Figure S4: Diffractograms from the reference clays: (a) montmorillonite (M) and (b) illite (I). XRD patterns shown were obtained after the samples were air-dried (N), ethylene-glycol-solvated (EG) or heat-treated at 550 °C (HT). Mineral traces of quartz (Q), kaolinite (K), calcite (C) and clay minerals (Cl) were observed in both patterns. The peaks that could not be recognized are labeled with (*). The low-intensity peaks in the N and HT diagrams, indicated with (**), are probably an artifact of the XRD analysis, representing the cut-off of the diffracted beam at a very low angle. Figure S5: N 2 adsorption–desorption isotherms for bulk sediments from (a) DR1 (squares) and DR4 (circles) core sections and (b) SF1 (circles), SF3 (squares) and SF6 (triangles). The quantity adsorbed was expressed as cm 3 g−1 STP (Standard Temperature and Pressure). In each case, the adsorption branch was represented with filled symbols and the desorption branch with hollow symbols; Figure S6: N 2 adsorption–desorption isotherms for clays fractions from (a) DR1 (squares) and DR4 (circles); and (b) SF1 (circles), SF3 (squares) and SF6 (triangles). The quantity adsorbed was expressed as cm 3 g−1 STP (Standard Temperature and Pressure). In each case, the adsorption branch was represented with filled symbols and the desorption branch with hollow symbols; Figure S7. Pore size distribution (PSD) of the bulk sediments from (a) DR (DR1: 0–5 cm and DR4: 15–20 cm) and (b) SF (SF1: 0–5 cm, SF3: 10–15 and SF6: 25–30 cm) and their respective clay fractions (c) and (d). Figure S8: N 2 adsorption–desorption isotherms for reference clays. M: montmorrillonite (squares) and I: illite (triangles). The quantity adsorbed was expressed as cm 3 g−1 STP (Standard Temperature and Pressure). In both cases, the adsorption branch was represented with filled symbols and the desorption branch with hollow symbols. Figure S9. Scanning electron microscopy images of both bulk sediments. In (a) the red circles indicate the zones were crystals similar to pyrite were found. In (b), a bigger crystal with different particle morphology is observed. (c) The mineral composition determined by energy dispersion X-ray spectroscopy (EDS) in this sample suggested that it is albite. In uncontaminated sediments (d and e), the typical mineral composition of phyllosilicates (most probably smectite or smectite-rich I/Sm) was also found by EDS analyses. These are representative images of the 3-6 images that were analyzed to confirm the observed features. Figure S10: Scanning electron microscopy images of reference clays (a1, a2) montmorillonite (M), (b1, b2) illite (I). The mineral composition of montmorillonite was determined by energy dispersion X-ray spectroscopy (EDS) (c). Figure S11. Evidence of incipient biofilm development on montmorillonite. The arrow indicates the presence of extracellular polymeric substances (EPS). Figure S12. Images showing the appearance of the sediments soon after being collected at (a) DR and (b) SF sites; after treatment by gravitational sedimentation and resuspended in double-distilled water [(c) DR and (d) SF]; and the clay fractions obtained after drying the solids at 40 °C [(e) DR and (f) SF]. Table S1. Heavy metals (Zn, Cu and Cr) content in the vertical profile of the sediments collected at DR and SF sites, Reconquista River. Table S2. Concentration of zinc (Zn), copper (Cu), and chromium (Cr) in the extracted fractions associated to the reservoires within the DR and SF sediments along the vertical profile.

Author Contributions

Conceptualization, G.C.; Data curation, A.E.T., S.V., N.F.P. and M.B.P.; Formal analysis, A.E.T. and S.V.; Investigation, A.E.T., S.V., N.F.P., M.C.G., M.B.P., M.S. and G.C.; Methodology, G.C.; Supervision, G.C.; Writing—original draft, A.E.T. and S.V.; Writing—review & editing, A.E.T., S.V., M.B.P. and G.C. All authors have read and agreed to the published version of the manuscript.

Funding

This research was funded by Agencia Nacional de Promoción Científica y Tecnológica ANPCyT, grant number PICT2017-2787, PICT2016-1698 and UNSAM-Dialogos entre las Ciencias 2015.

Institutional Review Board Statement

Not applicable.

Informed Consent Statement

Not applicable.

Data Availability Statement

The data presented in this study are available on request from the corresponding author.

Acknowledgments

The authors thank Roberto Candal for his valuable experimental support. A.E.T., S.V., N.F.P., M.B.P., M.C.G. and G.C. are researchers at CONICET. M.C.G. is a doctoral fellow at CONICET.

Conflicts of Interest

The authors declare no conflict of interest. The funders had no role in the design of the study; in the collection, analyses, or interpretation of data; in the writing of the manuscript, or in the decision to publish the results.

References

  1. Salibián, A. Ecotoxicological assessment of the highly polluted Reconquista River of Argentina. In Reviews of Environmental Contamination and Toxicology; Springer: Berlin/Heidelberg, Germany, 2006; pp. 35–65. [Google Scholar]
  2. Nader, G. Evaluación de la Calidad del Agua en un río Urbano. Ph.D. Thesis, Universidad Nacional de San Martín, Instituto de Investigación e Ingeniería Ambiental, Comisión Nacional de Energía Atómica, San Martín, Buenos Aires, Argentina, 2015. [Google Scholar]
  3. Porzionato, N.; Mantiñan, M.; Bussi, E.; Grinberg, S.; Gutiérrez, R.; Curutchet, G. Accumulation of pollutants, self-purification and impact on peripheral urban areas: A case study in shantytowns in Argentina. J. Environ. Ecol. Geol. Min. Eng. 2015, 9, 296–300. [Google Scholar]
  4. Porzionato, N.; Mellota, M.; Candal, R.; Curutchet, G. Acid drainage and metal bioleaching by redox potencial changes in heavy polluted fluvial sediments. In Proceedings of Advanced Materials Research; Trans Tech Publications Ltd.: Stafa-Zurich, Switzerland, 2013; pp. 496–499. [Google Scholar]
  5. Porzionato, N.; Tufo, A.; Candal, R.; Curutchet, G. Metal bioleaching from anaerobic sediments from Reconquista River basin (Argentina) as a potential remediation strategy. Environ. Sci. Pollut. Res. 2017, 24, 25561–25570. [Google Scholar] [CrossRef] [PubMed]
  6. Porzionato, N.F.; Candal, R.; Curutchet, G. Biocatalysed acidification and metal leaching processes in sediments of polluted urban streams. Int. J. Environ. Health 2014, 7, 3–14. [Google Scholar] [CrossRef]
  7. Tufo, A.E.; Porzionato, N.F.; Curutchet, G. Effects of pollution and bioleaching process on the mineral composition and texture of contaminated sediments of the Reconquista River, Argentina. Environ. Sci. Pollut. Res. 2018, 25, 21368–21384. [Google Scholar] [CrossRef]
  8. Zhou, X.; Kot, S. Heavy metal ion adsorption on sediments of the Weiho and Hanjiang rivers, China. J. Environ. Hydrol. 1995, 3, 1–5. [Google Scholar]
  9. Saeedi, M.; Hosseinzadeh, M.; Rajabzadeh, M. Competitive heavy metals adsorption on natural bed sediments of Jajrood River, Iran. Environ. Earth Sci. 2011, 62, 519–527. [Google Scholar] [CrossRef]
  10. Saeedi, M.; Li, L.; Karbassi, A.; Zanjani, A. Sorbed metals fractionation and risk assessment of release in river sediment and particulate matter. Environ. Monit. Assess. 2013, 185, 1737–1754. [Google Scholar] [CrossRef]
  11. Bhattacharyya, K.G.; Gupta, S.S. Adsorption of a few heavy metals on natural and modified kaolinite and montmorillonite: A review. Adv. Colloid Interface Sci. 2008, 140, 114–131. [Google Scholar] [CrossRef]
  12. Cuadros, J. Clay minerals interaction with microorganisms: A review. Clay Miner. 2017, 52, 235–261. [Google Scholar] [CrossRef] [Green Version]
  13. Bastami, K.D.; Neyestani, M.R.; Shemirani, F.; Soltani, F.; Haghparast, S.; Akbari, A. Heavy metal pollution assessment in relation to sediment properties in the coastal sediments of the southern Caspian Sea. Mar. Pollut. Bull. 2015, 92, 237–243. [Google Scholar] [CrossRef] [PubMed]
  14. Campana, O.; Blasco, J.n.; Simpson, S.L. Demonstrating the appropriateness of developing sediment quality guidelines based on sediment geochemical properties. Environ. Sci. Technol. 2013, 47, 7483–7489. [Google Scholar] [CrossRef] [Green Version]
  15. Campana, O.; Simpson, S.L.; Spadaro, D.A.; Blasco, J.N. Sub-lethal effects of copper to benthic invertebrates explained by sediment properties and dietary exposure. Environ. Sci. Technol. 2012, 46, 6835–6842. [Google Scholar] [CrossRef]
  16. Fonseca, R.; Pinho, C.; Oliveira, M. The influence of particles recycling on the geochemistry of sediments in a large tropical dam lake in the Amazonian region, Brazil. J. S. Am. Earth Sci. 2016, 72, 328–350. [Google Scholar] [CrossRef]
  17. Strom, D.; Simpson, S.L.; Batley, G.E.; Jolley, D.F. The influence of sediment particle size and organic carbon on toxicity of copper to benthic invertebrates in oxic/suboxic surface sediments. Environ. Toxicol. Chem. 2011, 30, 1599–1610. [Google Scholar] [CrossRef] [Green Version]
  18. Dong, H.; Jaisi, D.P.; Kim, J.; Zhang, G. Microbe-clay mineral interactions. Am. Mineral. 2009, 94, 1505–1519. [Google Scholar] [CrossRef]
  19. Dong, H.; Kukkadapu, R.K.; Fredrickson, J.K.; Zachara, J.M.; Kennedy, D.W.; Kostandarithes, H.M. Microbial reduction of structural Fe (III) in illite and goethite. Environ. Sci. Technol. 2003, 37, 1268–1276. [Google Scholar] [CrossRef] [Green Version]
  20. Koo, T.-H.; Jang, Y.-N.; Kogure, T.; Kim, J.H.; Park, B.C.; Sunwoo, D.; Kim, J.-W. Structural and chemical modification of nontronite associated with microbial Fe (III) reduction: Indicators of “illitization”. Chem. Geol. 2014, 377, 87–95. [Google Scholar] [CrossRef]
  21. Liu, D.; Dong, H.; Bishop, M.; Zhang, J.; Wang, H.; Xie, S.; Wang, S.; Huang, L.; Eberl, D. Microbial reduction of structural iron in interstratified illite-smectite minerals by a sulfate-reducing bacterium. Geobiology 2012, 10, 150–162. [Google Scholar] [CrossRef]
  22. Liu, D.; Zhang, Q.; Wu, L.; Zeng, Q.; Dong, H.; Bishop, M.E.; Wang, H. Humic acid-enhanced illite and talc formation associated with microbial reduction of Fe (III) in nontronite. Chem. Geol. 2016, 447, 199–207. [Google Scholar] [CrossRef]
  23. Liu, X.; Xiong, J.; Liang, L. Investigation of pore structure and fractal characteristics of organic-rich Yanchang formation shale in central China by nitrogen adsorption/desorption analysis. J. Nat. Gas Sci. Eng. 2015, 22, 62–72. [Google Scholar] [CrossRef]
  24. Zhang, G.; Kim, J.; Dong, H.; Sommer, A.J. Microbial effects in promoting the smectite to illite reaction: Role of organic matter intercalated in the interlayer. Am. Mineral. 2007, 92, 1401–1410. [Google Scholar] [CrossRef]
  25. Biswas, B.; Sarkar, B.; Rusmin, R.; Naidu, R. Bioremediation of PAHs and VOCs: Advances in clay mineral–microbial interaction. Environ. Int. 2015, 85, 168–181. [Google Scholar] [CrossRef]
  26. Koo, T.-H.; Lee, G.; Kim, J.-W. Biogeochemical dissolution of nontronite by Shewanella oneidensis MR-1: Evidence of biotic illite formation. Appl. Clay Sci. 2016, 134, 13–18. [Google Scholar] [CrossRef]
  27. Lee, K.; Kostka, J.E.; Stucki, J.W. Comparisons of structural Fe reduction in smectites by bacteria and dithionite: An infrared spectroscopic study. Clays Clay Miner. 2006, 54, 195–208. [Google Scholar] [CrossRef]
  28. Pentráková, L.; Su, K.; Pentrák, M.; Stucki, J. A review of microbial redox interactions with structural Fe in clay minerals. Clay Miner. 2013, 48, 543–560. [Google Scholar] [CrossRef]
  29. Stucki, J.W.; Kostka, J.E. Microbial reduction of iron in smectite. Comptes Rendus Geosci. 2006, 338, 468–475. [Google Scholar] [CrossRef]
  30. Wu, T.; Kukkadapu, R.K.; Griffin, A.M.; Gorski, C.A.; Konishi, H.; Xu, H.; Roden, E.E. Interactions between Fe (III)-oxides and Fe (III)-phyllosilicates during microbial reduction 1: Synthetic sediments. Geomicrobiol. J. 2016, 33, 793–806. [Google Scholar] [CrossRef]
  31. Cantera, C.G. Geoquímica y Procesos de Intercambio de Fosfatos en la Interfaz Sedimento/Agua en el río Reconquista y el Arroyo Las Catonas. Available online: https://ri.conicet.gov.ar/handle/11336/83441 (accessed on 25 March 2019).
  32. Cantera, C.G.; Scasso, R.A.; Tufo, A.; Villalba, L.B.; dos Santos Afonso, M. Mobility of trace elements between the river water, the sediments, and the pore water of Las Catonas Stream, Buenos Aires Province, Argentina. Environ. Earth Sci. 2018, 77, 535. [Google Scholar] [CrossRef]
  33. Instituto Nacional de Tecnología Agropecuaria (INTA). Atlas de Suelos de la República Argentina; INTA: Buenos Aires, Argentina, 1990; pp. 83–85. [Google Scholar]
  34. Instituto Nacional de Tecnología Agropecuaria. Sistema de Información y Gestión Agrometeorológica. 2015. Available online: http://siga2.inta.gov.ar/#/ (accessed on 2 October 2016).
  35. Toledo, M.J. El legado lujanense de Ameghino: Revisión estratigráfica de los depósitos pleistocenos-holocenos del valle del río Luján en su sección tipo. Registro paleoclimático en la pampa de los estadios OIS 4 al OIS 1. Rev. De La Asoc. Geol. Argent. 2011, 68, 121–167. [Google Scholar]
  36. Pescuma, A.; Guaresmi, M. Proyecto de Sanea Miento Ambiental y Control de Inundaciones de la Cuenca del Río Reconquista; Comité de Cuenca del Río Reconquista (COMIREC): Buenos Aires, Argentina, 1992. [Google Scholar]
  37. Porzionato, N.Z.A.; Grimolizzi, C.; Tufo, A.; Vázquez, S.; Cabezas Da Rosa, A.; Curutchet, G. Microbial Diversity and Contamination in Reconquista River Sediments: Detection of Bacteria with Potential Biotechnological Applications. Available online: https://www.itson.mx/eventos/6isebe/SiteAssets/Paginas/program/SYMPOSIA-6ISEBE-2018.pdf (accessed on 9 November 2018).
  38. Zhu, Y.; Zhang, F.; Tong, C.; Liu, W. Determination of glyphosate by ion chromatography. J. Chromatogr. A 1999, 850, 297–301. [Google Scholar] [CrossRef]
  39. Jackson, J.A. Glossary of Geology; Springer: Berlin, Germany, 2005. [Google Scholar]
  40. Laidlaw, I.; Steinmetz, M. Introduction to differential sedimentation. Anal. Ultracentrifugation Tech. Methods 2005, 31, 270–290. [Google Scholar]
  41. Moore, D.; Reynolds, R., Jr. X-ray Diffraction and the Identification and Analysis of Clay Minerals; Oxford University Press: Oxford, UK, 1997. [Google Scholar]
  42. Tabatabai, M. Sulfur. In Methods of Soil analysis, Part 2; American Society of Agronomy, Inc.: Madison, WI, USA, 1982; pp. 501–534. [Google Scholar]
  43. Reisman, D.J.; Sundaram, V.; Al-Abed, S.R.; Allen, D. Statistical validation of sulfate quantification methods used for analysis of acid mine drainage. Talanta 2007, 71, 303–311. [Google Scholar] [CrossRef]
  44. Ure, A.; Quevauviller, P.; Muntau, H.; Griepink, B. Speciation of heavy metals in soils and sediments. An account of the improvement and harmonization of extraction techniques undertaken under the auspices of the BCR of the Commission of the European Communities. Int. J. Environ. Anal. Chem. 1993, 51, 135–151. [Google Scholar] [CrossRef]
  45. Brunauer, S.; Emmett, P.H.; Teller, E. Adsorption of gases in multimolecular layers. J. Am. Chem. Soc. 1938, 60, 309–319. [Google Scholar] [CrossRef]
  46. Sing, K.S. Reporting physisorption data for gas/solid systems with special reference to the determination of surface area and porosity (Recommendations 1984). Pure Appl. Chem. 1985, 57, 603–619. [Google Scholar] [CrossRef]
  47. Villarroel-Rocha, J.; Barrera, D.; Blanco, A.A.G.; Jalil, M.E.R.; Sapag, K. Importance of the αs-plot method in the characterization of nanoporous materials. Adsorpt. Sci. Technol. 2013, 31, 165–183. [Google Scholar] [CrossRef] [Green Version]
  48. Rouquerol, J.; Rouquerol, F.; Llewellyn, P.; Maurin, G.; Sing, K.S. Adsorption by Powders and Porous Solids: Principles, Methodology and Applications; Academic Press: New York, NY, USA, 2013. [Google Scholar]
  49. Rocha, J.V.; Barrera, D.; Sapag, K. Improvement in the pore size distribution for ordered mesoporous materials with cylindrical and spherical pores using the Kelvin equation. Top. Catal. 2011, 54, 121–134. [Google Scholar] [CrossRef]
  50. Villarroel-Rocha, J.; Barrera, D.; Sapag, K. Introducing a self-consistent test and the corresponding modification in the Barrett, Joyner and Halenda method for pore-size determination. Microporous Mesoporous Mater. 2014, 200, 68–78. [Google Scholar]
  51. Lagaly, G.; Ogawa, M.; Dékány, I. Clay mineral organic interactions. Dev. Clay Sci. 2006, 1, 309–377. [Google Scholar]
  52. Heller-Kallai, L. Thermally modified clay minerals. Dev. Clay Sci. 2006, 1, 289–308. [Google Scholar]
  53. Kuila, U.; Prasad, M. Specific surface area and pore-size distribution in clays and shales. Geophys. Prospect. 2013, 61, 341–362. [Google Scholar] [CrossRef]
  54. Liu, W. Modeling description and spectroscopic evidence of surface acid–base properties of natural illites. Water Res. 2001, 35, 4111–4125. [Google Scholar] [CrossRef]
  55. Dudek, T.; Cuadros, J.; Huertas, J. Structure of mixed-layer kaolinite-smectite and smectite-to-kaolinite transformation mechanism from synthesis experiments. Am. Mineral. 2007, 92, 179–192. [Google Scholar] [CrossRef]
  56. El-Naggar, I.; Ahmed, S.A.; Shehata, N.; Sheneshen, E.; Fathy, M.; Shehata, A. A novel approach for the removal of lead (II) ion from wastewater using Kaolinite/Smectite natural composite adsorbent. Appl. Water Sci. 2019, 9, 7. [Google Scholar] [CrossRef] [Green Version]
  57. Alimova, A.; Katz, A.; Steiner, N.; Rudolph, E.; Wei, H.; Steiner, J.C.; Gottlieb, P. Bacteria-clay interaction: Structural changes in smectite induced during biofilm formation. Clays Clay Miner. 2009, 57, 205–212. [Google Scholar] [CrossRef]
  58. Alimova, A.; Roberts, M.; Katz, A.; Rudolph, E.; Steiner, J.; Alfano, R.; Gottlieb, P. Effects of smectite clay on biofilm formation by microorganisms. Biofilms 2006, 3, 47–54. [Google Scholar] [CrossRef]
  59. Ozkan, A.; Berberoglu, H. Cell to substratum and cell to cell interactions of microalgae. Colloids Surf. B Biointerfaces 2013, 112, 302–309. [Google Scholar] [CrossRef]
  60. Ozkan, A.; Kinney, K.; Katz, L.; Berberoglu, H. Novel algae biofilm photobioreactor for reduced energy and water usage. In Proceedings of the ASME International Mechanical Engineering Congress and Exposition, Vancouver, BC, Canada, 12–18 November 2010; pp. 75–80. [Google Scholar]
  61. Ozkan, A.; Kinney, K.; Katz, L.; Berberoglu, H. Reduction of water and energy requirement of algae cultivation using an algae biofilm photobioreactor. Bioresour. Technol. 2012, 114, 542–548. [Google Scholar] [CrossRef]
  62. Candal, R.; Senn, A.; Loveira, E.L.; Curutchet, G.; Guz, L.; Litter, M. Alternative Treatment of Recalcitrant Organic Contaminants by a Combination of Biosorption, Biological Oxidation and Advanced Oxidation Technologies; INTECH Open Access Publisher: Rijeka, Croatia, 2012. [Google Scholar]
  63. Tufo, A.P.N.; Ziliani, A.; Grimolizzi, C.; Curutchet, G. Effect of pollution on the physicochemical, structural and surface characteristics of the sediments of the Reconquista River, Argentina. In Book of Abstracts Environmental Biotechnology and Engineering; Rios-Vazquez, N.J., Ulloa-Mercado, R.G., Sánchez-Duarte, R.G., Correa-Murrieta, M.A., Gortarez-Moroyoqui, P., Eds.; Cuidad Obregon: Sonora, Mexico, 2019; p. 78. Available online: https://www.itson.mx/eventos/6isebe/SiteAssets/Paginas/documents/ABSTRACTS-BOOK-6ISEBE-2019.pdf (accessed on 9 November 2019).
  64. Di Nanno, M.P.; Curutchet, G.; Ratto, S. Anaerobic sediment potential acidification and metal release risk assessment by chemical characterization and batch resuspension experiments. J. Soils Sediments 2007, 7, 187–194. [Google Scholar] [CrossRef]
  65. Kaiser, K.; Guggenberger, G. Mineral surfaces and soil organic matter. Eur. J. Soil Sci. 2003, 54, 219–236. [Google Scholar] [CrossRef] [Green Version]
  66. Kuila, U.; Prasad, M.; Derkowski, A.; McCarty, D.K. Compositional controls on mudrock pore-size distribution: An example from Niobrara Formation. In Proceedings of the SPE Annual Technical Conference and Exhibition, San Antonio, TX, USA, 8–10 October 2012. [Google Scholar]
  67. Saidian, M.; Godinez, L.J.; Prasad, M. Effect of clay and organic matter on nitrogen adsorption specific surface area and cation exchange capacity in shales (mudrocks). J. Nat. Gas Sci. Eng. 2016, 33, 1095–1106. [Google Scholar] [CrossRef]
  68. Takahashi, Y.; Suto, K.; Inoue, C. Polysulfide reduction by Clostridium relatives isolated from sulfate-reducing enrichment cultures. J. Biosci. Bioeng. 2010, 109, 372–380. [Google Scholar] [CrossRef] [PubMed]
  69. Jittawuttipoka, T.; Planchon, M.; Spalla, O.; Benzerara, K.; Guyot, F.; Cassier-Chauvat, C.; Chauvat, F. Multidisciplinary evidences that Synechocystis PCC6803 exopolysaccharides operate in cell sedimentation and protection against salt and metal stresses. PLoS ONE 2013, 8, e55564. [Google Scholar] [CrossRef] [Green Version]
Figure 1. Satellite images of the peri urban Reconquista River location (a) and the two sampling sites (b): DR, Dique Ingeniero Carlos F. Roggero (34°40′51.4″ S, 58°51′36.7″ O) and SF, Parque San Francisco, William Morris, (34°34′42.3″ S, 58°40′12.8″ W) Buenos Aires, Argentina. Enlarged satellite images for each site: DR is located in the surroundings of a protected natural area (c), whereas SF is located in a densely populated area (d). North is at the top in all images.
Minerals 11 00242 g001
Figure 2. Heavy metals (Zn, Cu, and Cr) and organic matter content distribution with depth in DR (a) and SF (b) bulk sediment cores.
Minerals 11 00242 g002
Figure 3. Percentage distribution of Zn, Cu, and Cr from each of the reservoirs investigated in the sequential extraction of the uncontaminated DR (ac) and the contaminated SF, (df) sediment cores. The red line indicates the distribution of the total content of each metal with depth.
Minerals 11 00242 g003
Figure 4. X-ray diffraction (XRD) patterns of bulk sediments of the (a) DR and (b) SF cores for the superficial (DR1 and SF1: 0–5 cm), intermediate (SF3: 10–15 cm), and deep (DR4: 15–20 cm and SF6: 25–30 cm) sections of each core. Main minerals identified are marked as Q (quartz), F (feldspar), A (albite), and Cl (clay minerals). The numbers correspond to 2Θ characteristic positions of some peaks for each mineral identified expressed in Armstrong (Å).
Minerals 11 00242 g004
Figure 5. Diffractograms from the clay fractions (<2 µm) of (a) DR1 (0–5 cm) and (b) SF6 (25–30 cm). XRD patterns shown were obtained after the samples were air-dried (N), ethylene-glycol-solvated (EG), or heat-treated at 550 °C (HT). The main compounds identified are marked as Q (quartz), I (illite), Sm (smectite), K (kaolinite), A (albite), Cl (clay minerals), and F (feldspar).
Minerals 11 00242 g005
Figure 6. Depth distribution of (□) organic matter content (OM, g kg−1) in relation with (a) specific surface area [(●) SSA, m2 g−1)] and (b) particle size [(●) μm], for SF bulk sediment and (c) relationship between particle size (μm) and the modal pore size (wP, nm) for the clay fractions of DR (DR1: 0–5 cm and DR4: 15–20 cm) and SF (SF1: 0–5 cm, SF3: 10–15 cm, and SF6: 25–30 cm). The reference clays are indicated as (♦) illite (I) and (□) montmorillonite (M).
Minerals 11 00242 g006
Figure 7. Scanning electron microscopy micrographs for uncontaminated DR, (ac) and contaminated SF, (cf) sediments. The arrows in (c,f) indicate features compatible with clay particles as kaolinite, illite, or smectite, but these could not be confirmed by energy-dispersive x-ray spectroscopy (EDS). The presence of biological material cannot be ruled out. Crystals of pyrite were found in the contaminated sediments (g) and the mineral composition was confirmed by EDS, since iron and sulfur were detected as the main elements.
Minerals 11 00242 g007
Figure 8. Scanning electron microscopy images of the initial adherence of microorganisms to the reference clay montmorillonite. The arrows indicate some scattered bacterial cells found over the clay.
Minerals 11 00242 g008
Figure 9. Scanning electron microscopy images of biofilm formation onto the reference clay montmorillonite. (a) Control without microorganisms; and biofilm formation after successive growing cycles I (b), II (c) and III (d). The surface of montmorillonite particles after eight days of culture (Cycle II) was covered by the biofilm (see the text for further explanations). The arrows in (ac) indicate different microbial morphologies (cocci and bacilli).
Minerals 11 00242 g009
Figure 10. Scanning electron microscopy images taken after growth cycle II (eight days of culture) of biofilm formation on the different clays: (a) montmorillonite, (b) illite, (c) DR and (d) SF under sulfate-reducing anaerobic conditions.
Minerals 11 00242 g010
Table 1. Physicochemical parameters measured in the surface waters and sediments of the Dique Ingeniero Carlos F. Roggero (DR) and San Francisco Park, William Morris town (SF) sites.
MatrixParametersDRSF
Surface waterTemperature (°C)28.727.0
pH8.57.4
Conductivity (μS)10461500
Dissolved oxygen (DO, mg L−1)9.81.2
Oxidation-Reduction Potential (ORP, mV)+278−41
Chloride (mg L−1 of Cl)75.274.3
Phosphate (mg L−1 of PO43−)2.15.45
Sulfate (mg L−1 of SO42−)50.940.4
Nitrate (mg L−1 of NO3)3.123.25
Sodium (mg L−1)227.1189.4
Potassium (mg L−1)9.110.1
Magnesium (mg L−1)38.314.4
Calcium (mg L−1)24.838.3
Surface sedimentpH9.28.3
Organic Matter (OM, g kg−1)41 ± 5150 ± 30
Oxidation-Reduction Potential (ORP, mV)+160−280
Acid Volatile Sulfide (mg kg−1 of S2−)01800
Sulfate (mg kg−1 of SO42−)170 ± 203000 ± 600
Nitrate (mg kg−1 of NO3)14 ± 316 ± 3
Zn (mg kg−1)5.6 ± 0.4240 ± 20
Cu (mg kg−1)7 ± 160 ± 10
Cr (mg kg−1)3.1 ± 0.2270 ± 20
Table 2. Organic matter, acid volatile sulfide, and sulfate content in the vertical profile of the sediments collected at the DR and SF sites, Reconquista River.
SiteSampleOrganic Matter
(g kg−1)
Acid Volatile
Sulfide
(mg kg−1 of S2−)
Sulfate
(mg kg−1 of SO42−)
DRDR1 (0–5 cm) 43 ± 30180 ± 70
DR2 (5–10 cm)37 ± 20150 ± 30
DR3 (10–15 cm)35 ± 30155 ± 1
DR4 (15–20 cm)47 ± 20190 ± 20
SFSF1 (0–5 cm)180 ± 502700 ± 6002900 ± 30
SF2 (5–10 cm)160 ± 301800 ± 6002400 ± 200
SF3 (10–15 cm)130 ± 202000 ± 5003700 ± 500
SF4 (15–20 cm)120 ± 501500 ± 4003500 ± 90
SF5 (20–25 cm) 80 ± 20330 ± 703300 ± 500
SF6 (25–30 cm)80 ± 41100 ± 2004750 ± 15
Table 3. Particle size, surface (SSA), and textural properties (VTP; VμP; Vmes, and wp) of the sediments collected at the DR and SF sites in Reconquista River.
SiteSampleSSA
(m2 g−1)
VTP
(cm3 g−1)
VµP
(cm3 g−1)
Vmes
(cm3 g−1)
wp
(Slit Pore)
[40]
Particle
Size *
(μm)
DRDR1 (0–5 cm) 59.2 ± 0.30.0620.0170.0442.119.72
DR2 (5–10 cm)66.9 ± 0.30.0680.0190.0492.016.39
DR3 (10–15 cm)65.0 ± 0.30.0660.0180.0472.010.70
DR4 (15–20 cm)63.8 ± 0.30.0640.0190.0452.011.89
SFSF1 (0–5 cm)21.8 ± 0.10.0440.0050.0394.027.42
SF2 (5–10 cm)26.30 ± 0.040.0490.0060.0433.725.83
SF3 (10–15 cm)27.79 ± 0.050.0510.0060.0453.726.58
SF4 (15–20 cm)28.01 ± 0.040.0500.0070.0443.627.16
SF5 (20–25 cm) 57.5 ± 0.10.0650.0160.0492.311.98
SF6 (25–30 cm)52.0 ± 0.20.0570.0140.0432.216.36
* The particle size reported here was measured at 75% of the cumulative particle size distribution.
Table 4. Particle size, surface (SSA), textural properties (VTP; VμP; Vmes and wp) and the percent mass of sediment of reference clays and the clay fractions extracted from sediments collected at the DR and SF sites in Reconquista River.
Site/
Clay §
SamplePercent Mass of Sediment *SSA
(m2 g−1)
VTP
(cm3 g−1)
VµP
(α-plot)
(cm3 g−1)
Vmes
(cm3 g−1)
wp
(Slit Pore)
(nm)
Particle
Size **
(μm)
DRDR1 (0–5 cm)13.0144.8 ± 0.10.1730.0390.1332.42.78
DR4 (15–20 cm)21.3155.7 ± 0.10.1650.0440.1212.12.42
SFSF1 (0–5 cm)8.122.1 ± 0.10.0880.0040.0847.914.30
SF3 (10–15 cm)8.740.0 ± 0.10.0980.0080.0904.96.40
SF6 (25–30 cm)18.184.1 ± 0.10.0880.0200.0683.23.89
SmM-71.0 ± 0.10.0990.0200.0793.02.50
IlliteI-34.0 ± 0.10.1810.0080.17311.01.70
§ DR, SF (clay fractions from bulk sediments); Sm, Illite (reference clays). * Percent mass of sediment was defined considering the initial mass of sediment and the final mass for particles smaller than <2 µm (clay-sized) obtained after two cycles. ** The particle size reported here was measured at 75% of the cumulative particle size distribution.
Publisher’s Note: MDPI stays neutral with regard to jurisdictional claims in published maps and institutional affiliations.

