
Stratigraphic Variations of Fe–Mn Micronodules and Implications for the Formation of Extremely REY-Rich Mud in the Western North Pacific Ocean

 ,
, 
Abstract
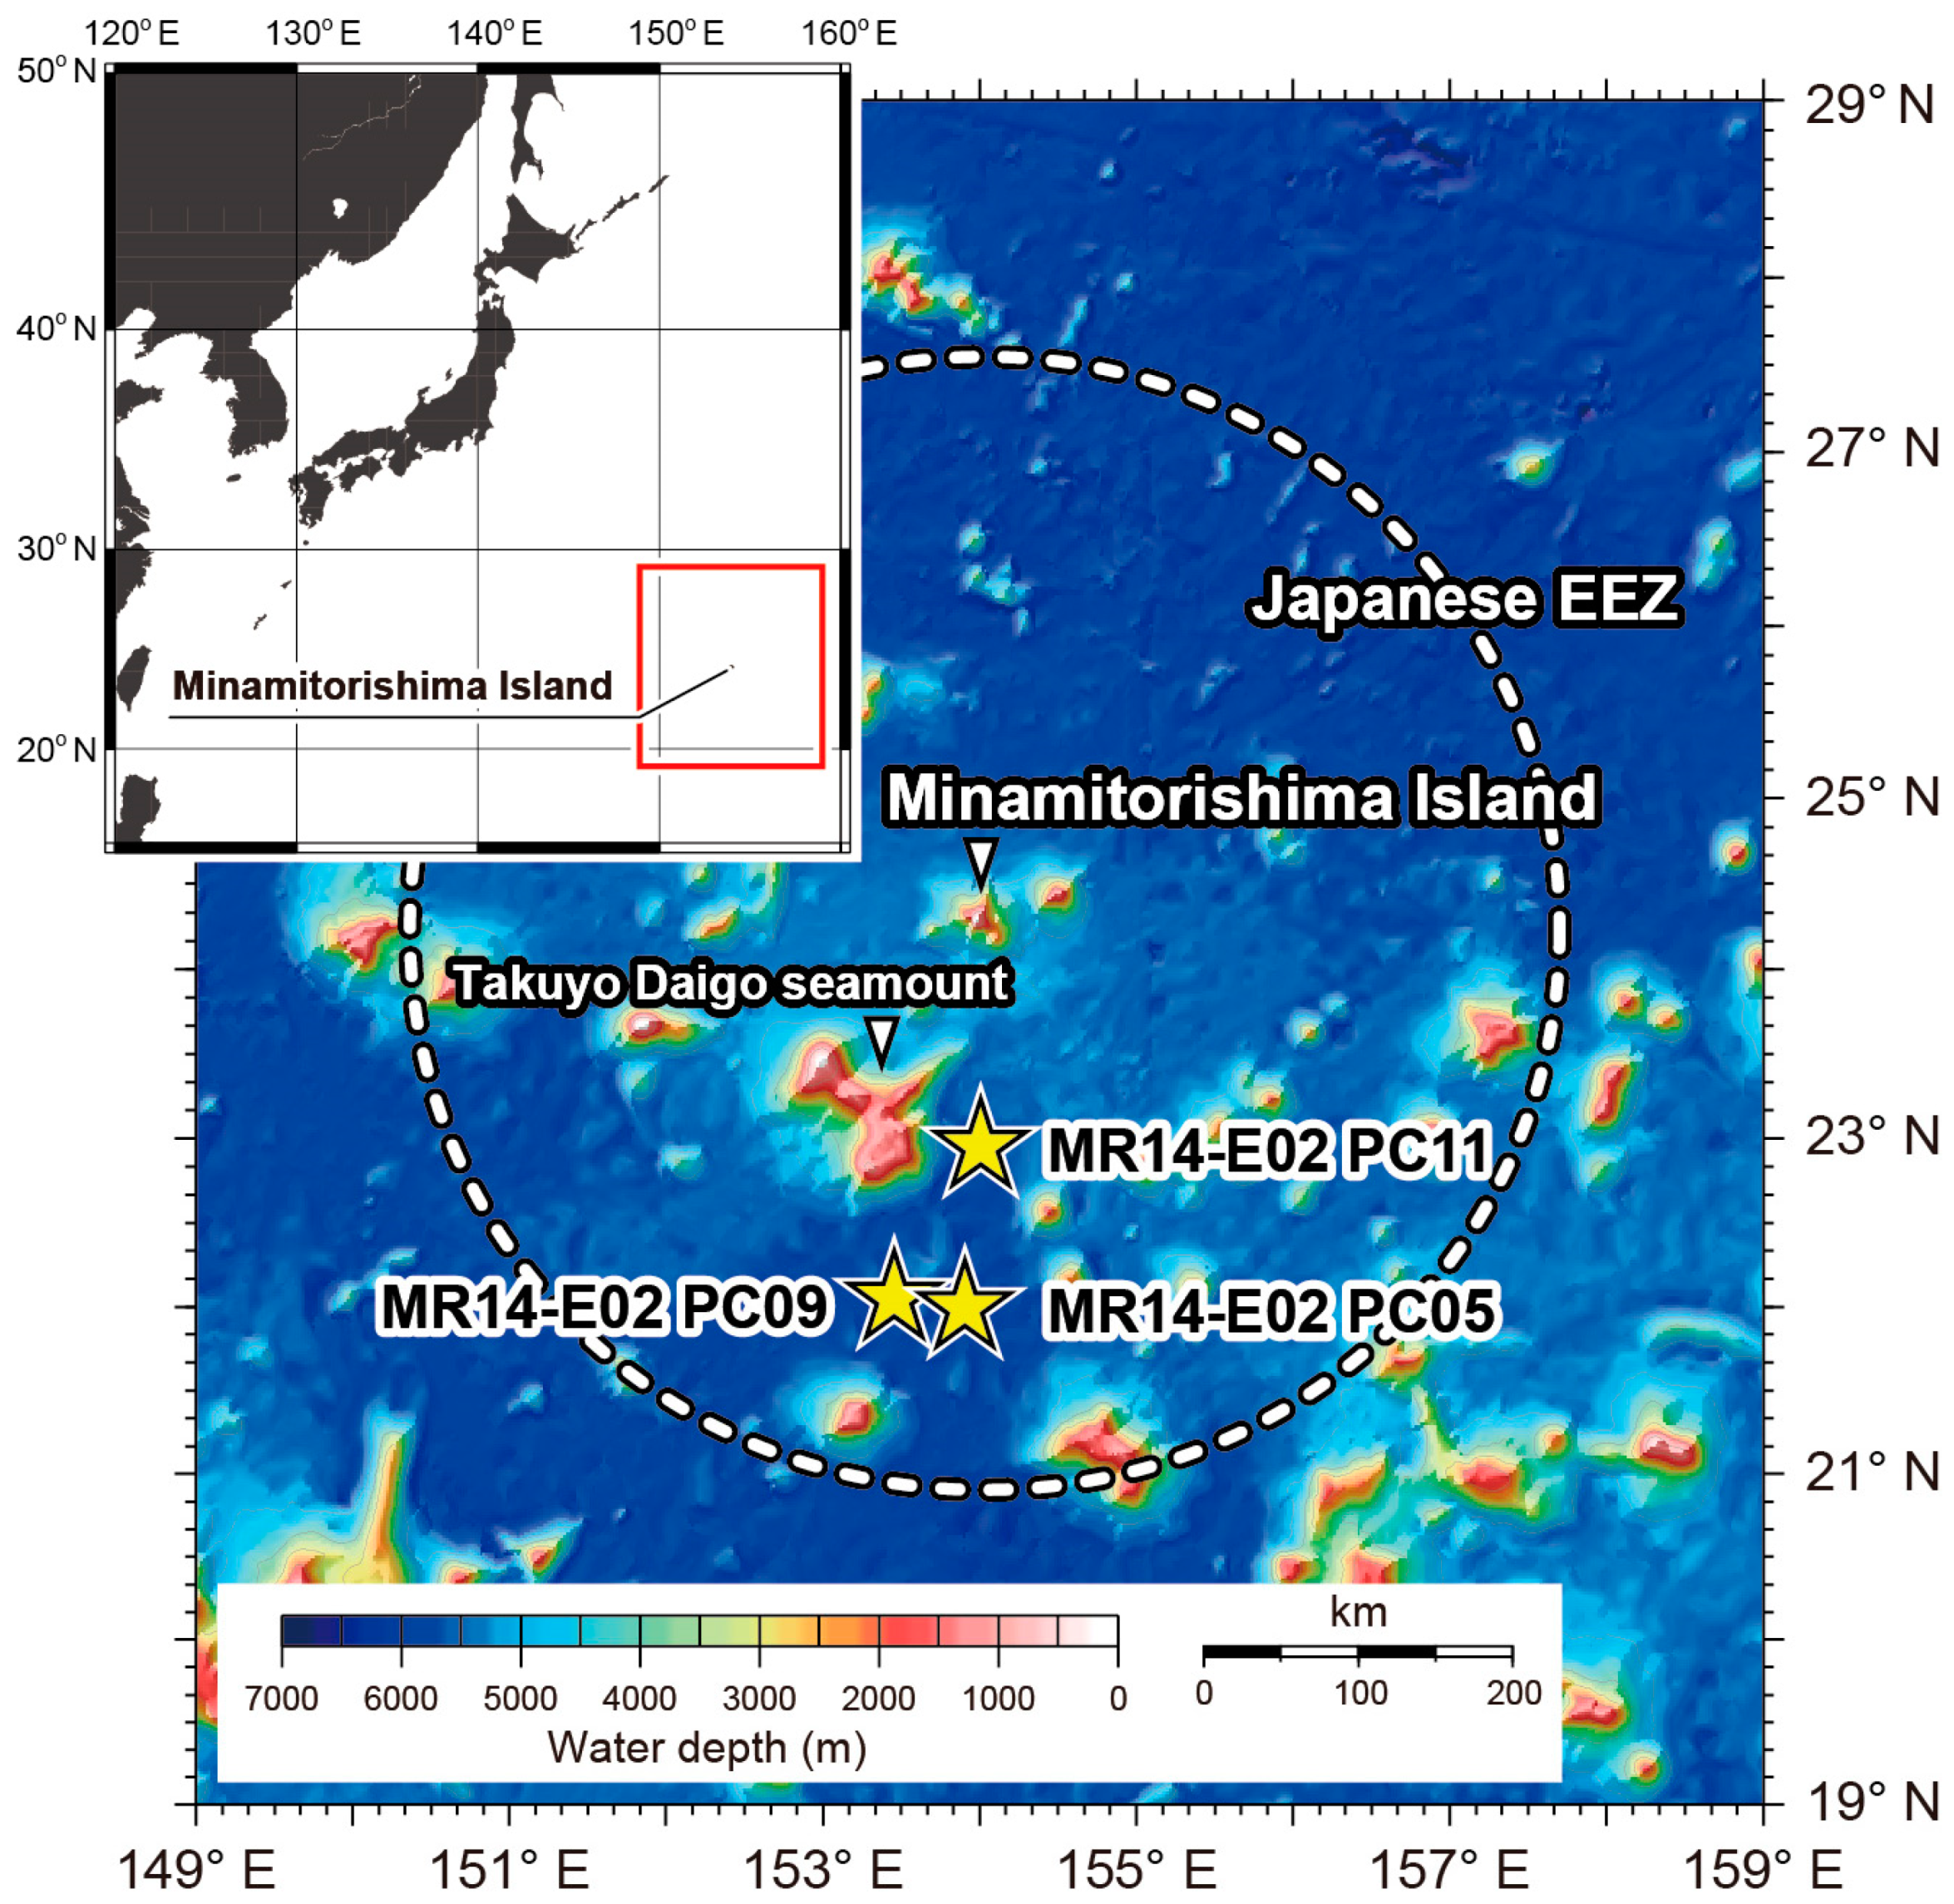
:1. Introduction
2. Materials and Methods
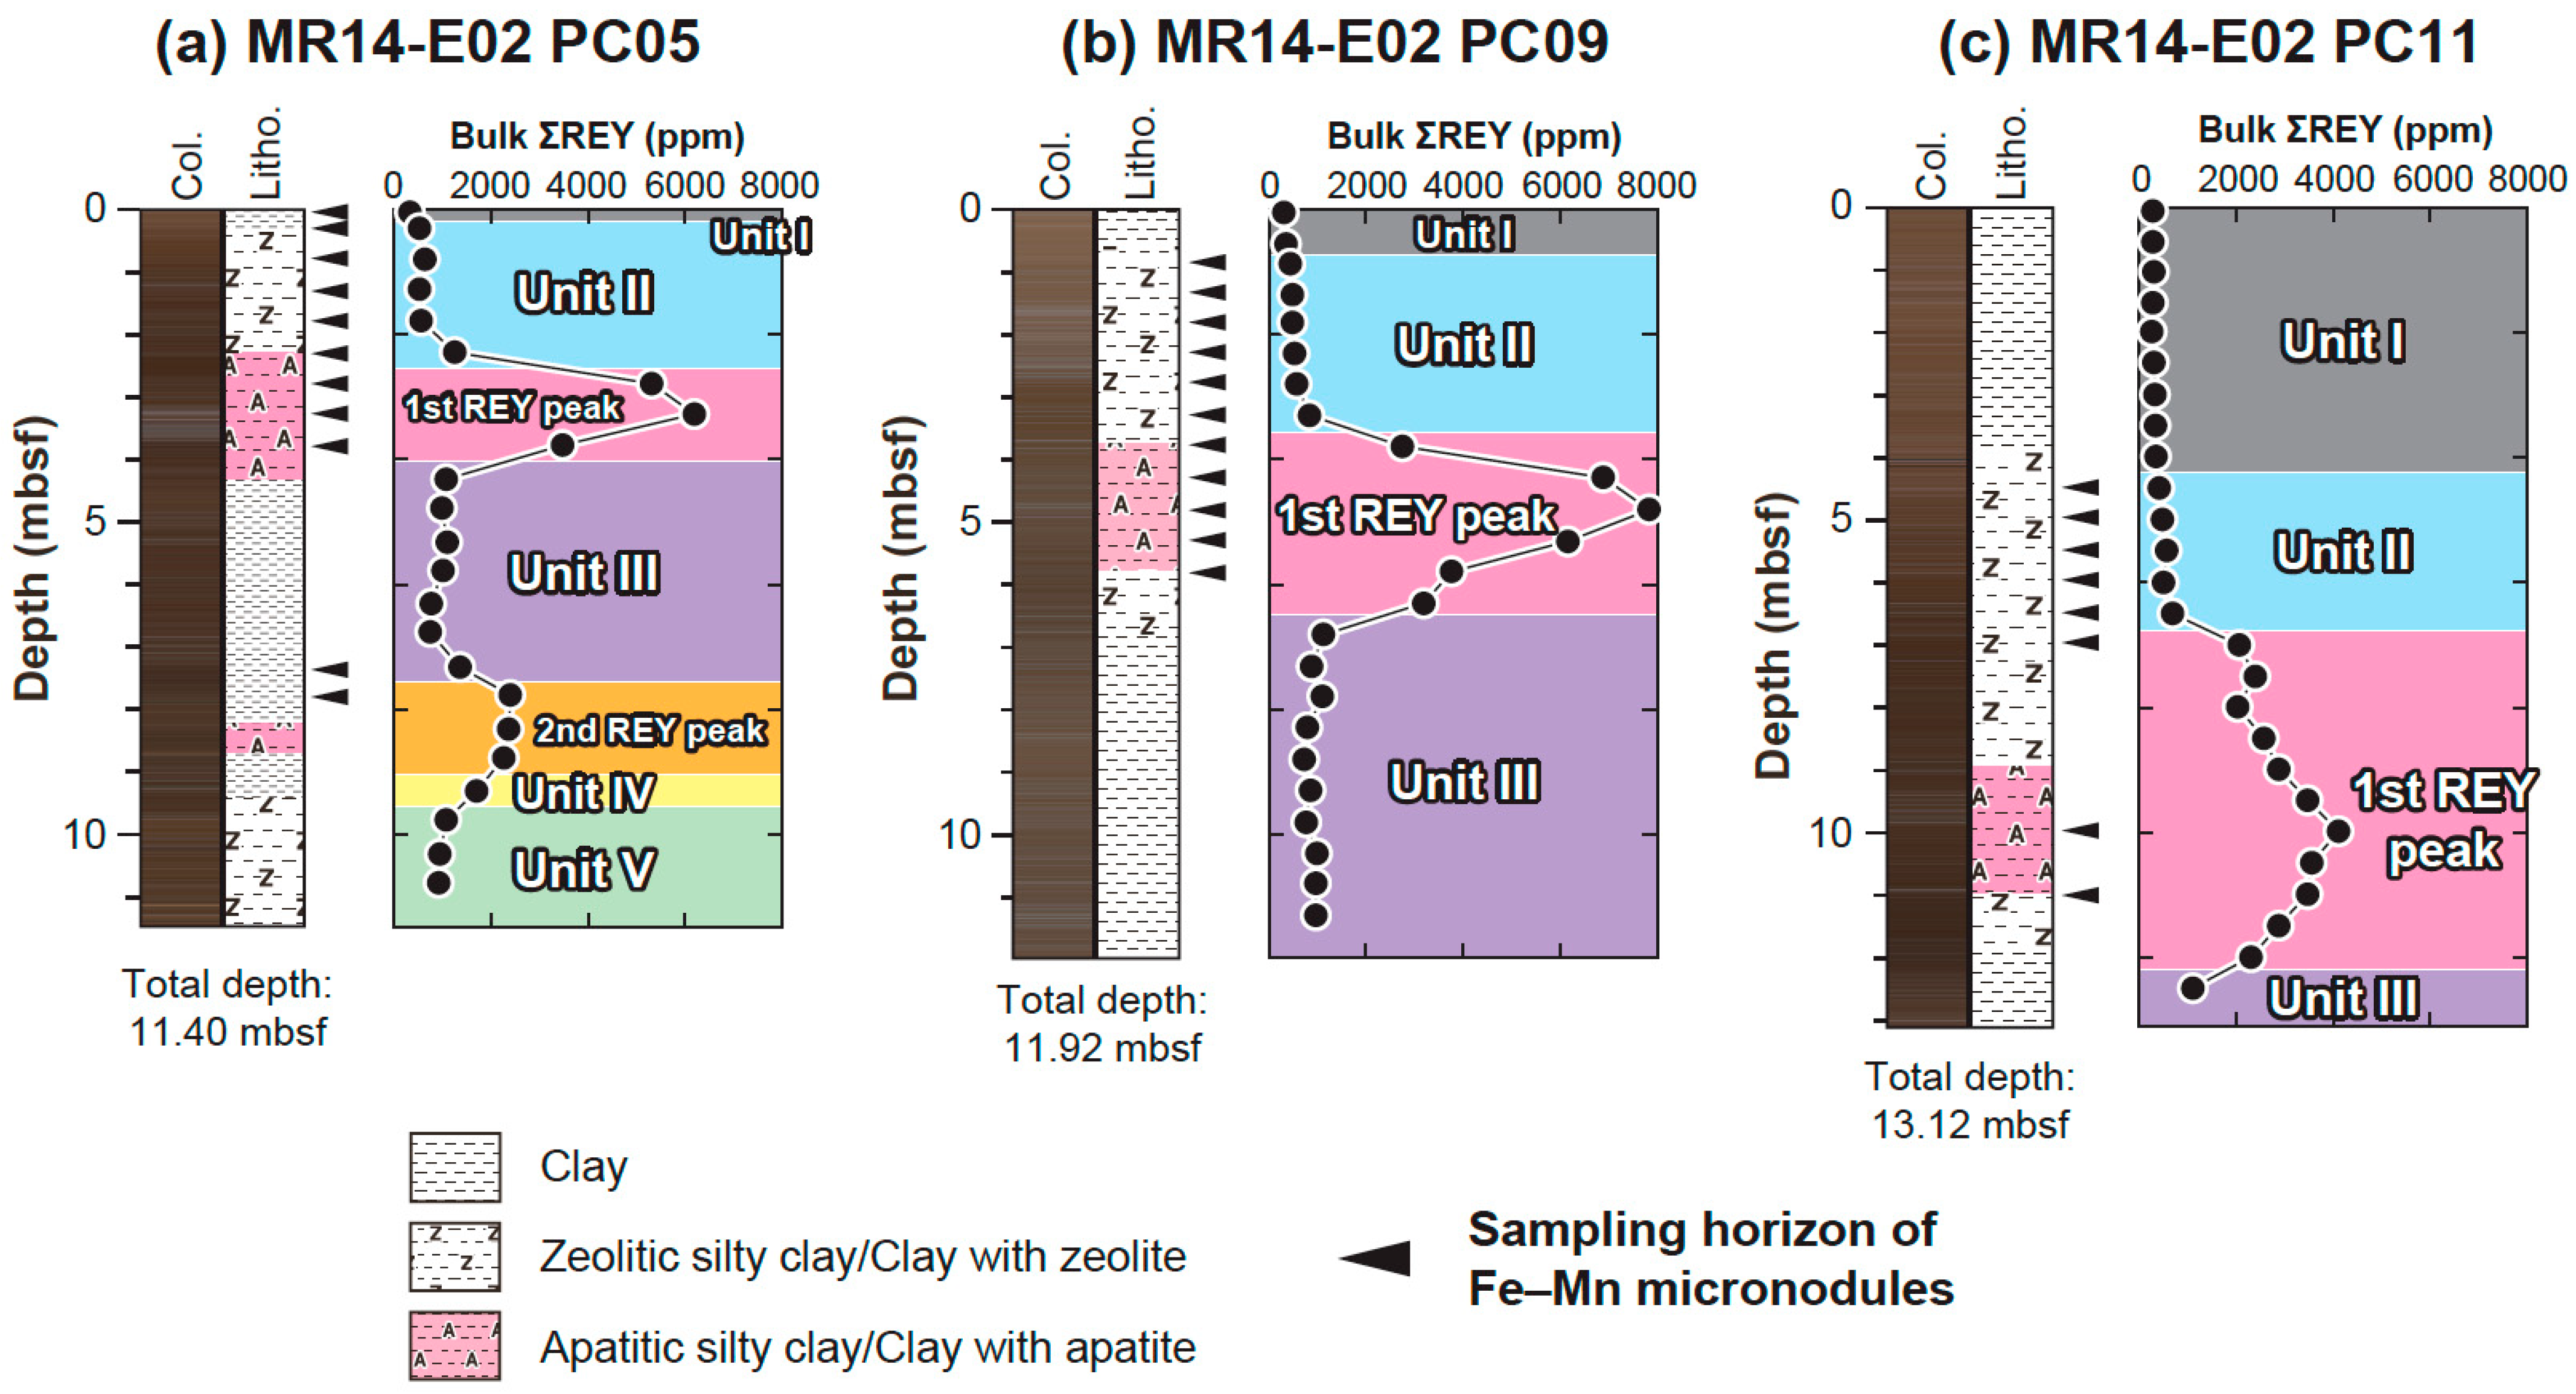
2.1. Samples and Data
2.2. Statistical Classification
3. Results and Discussion
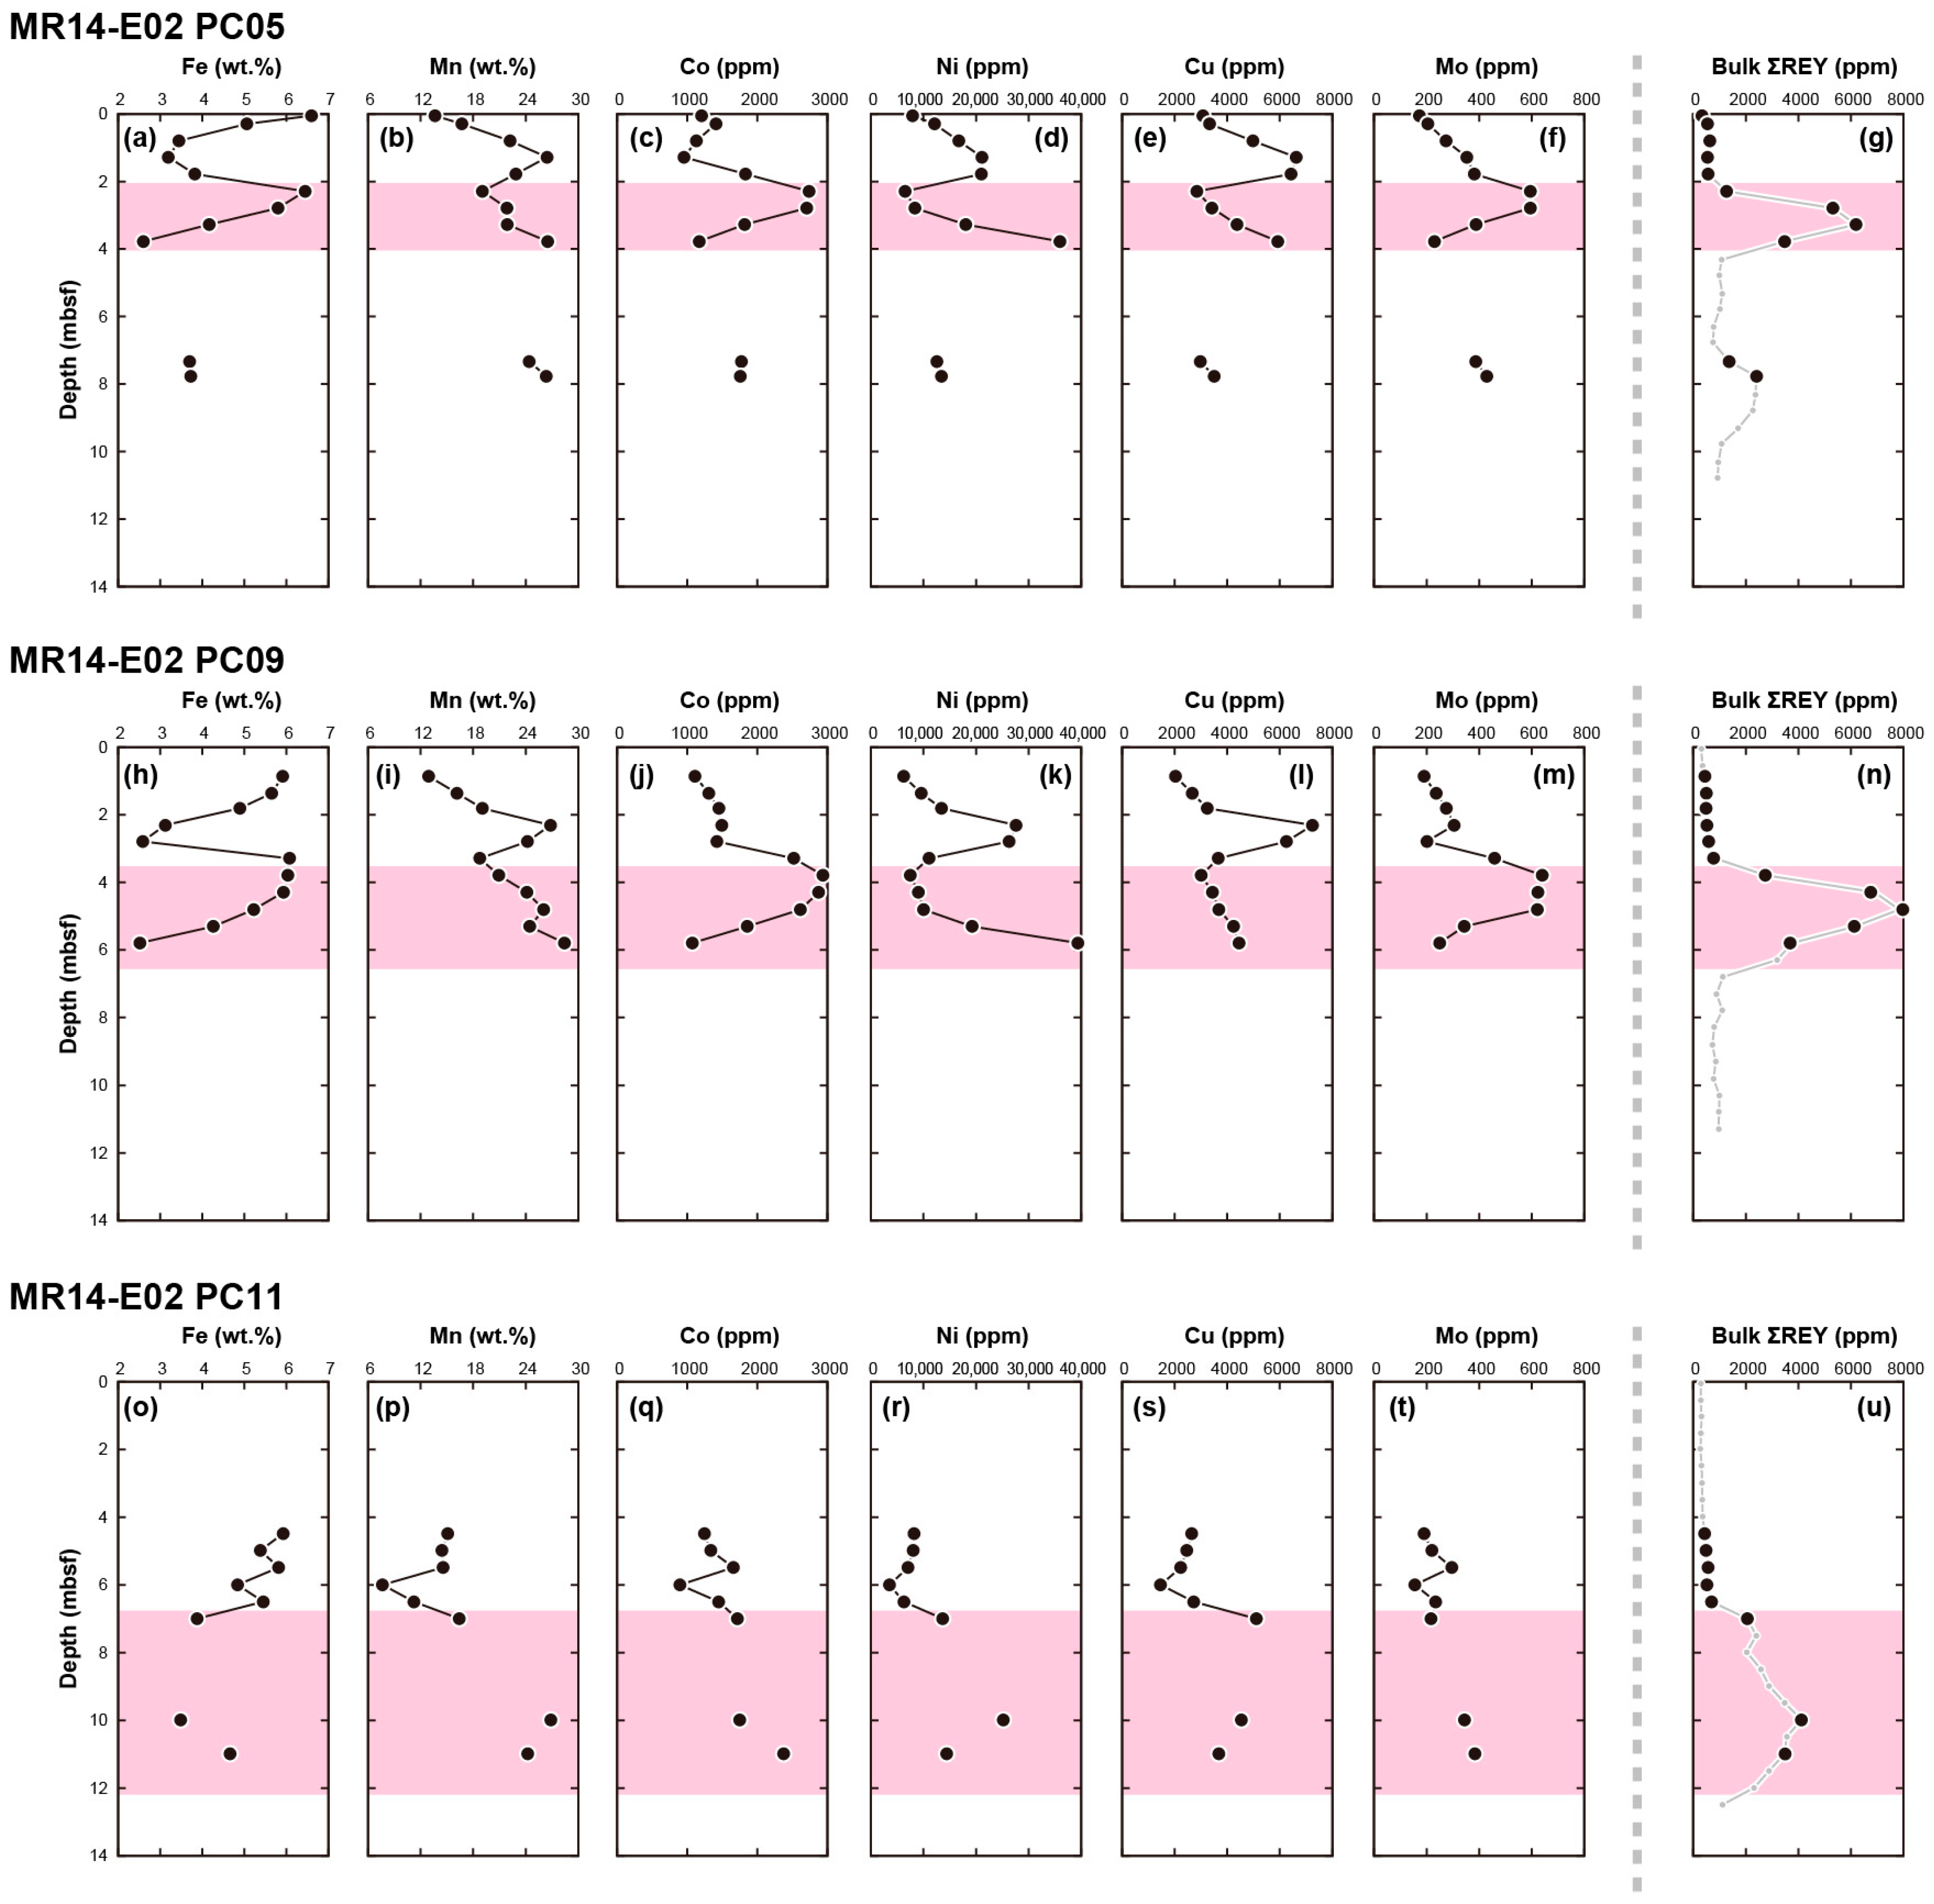
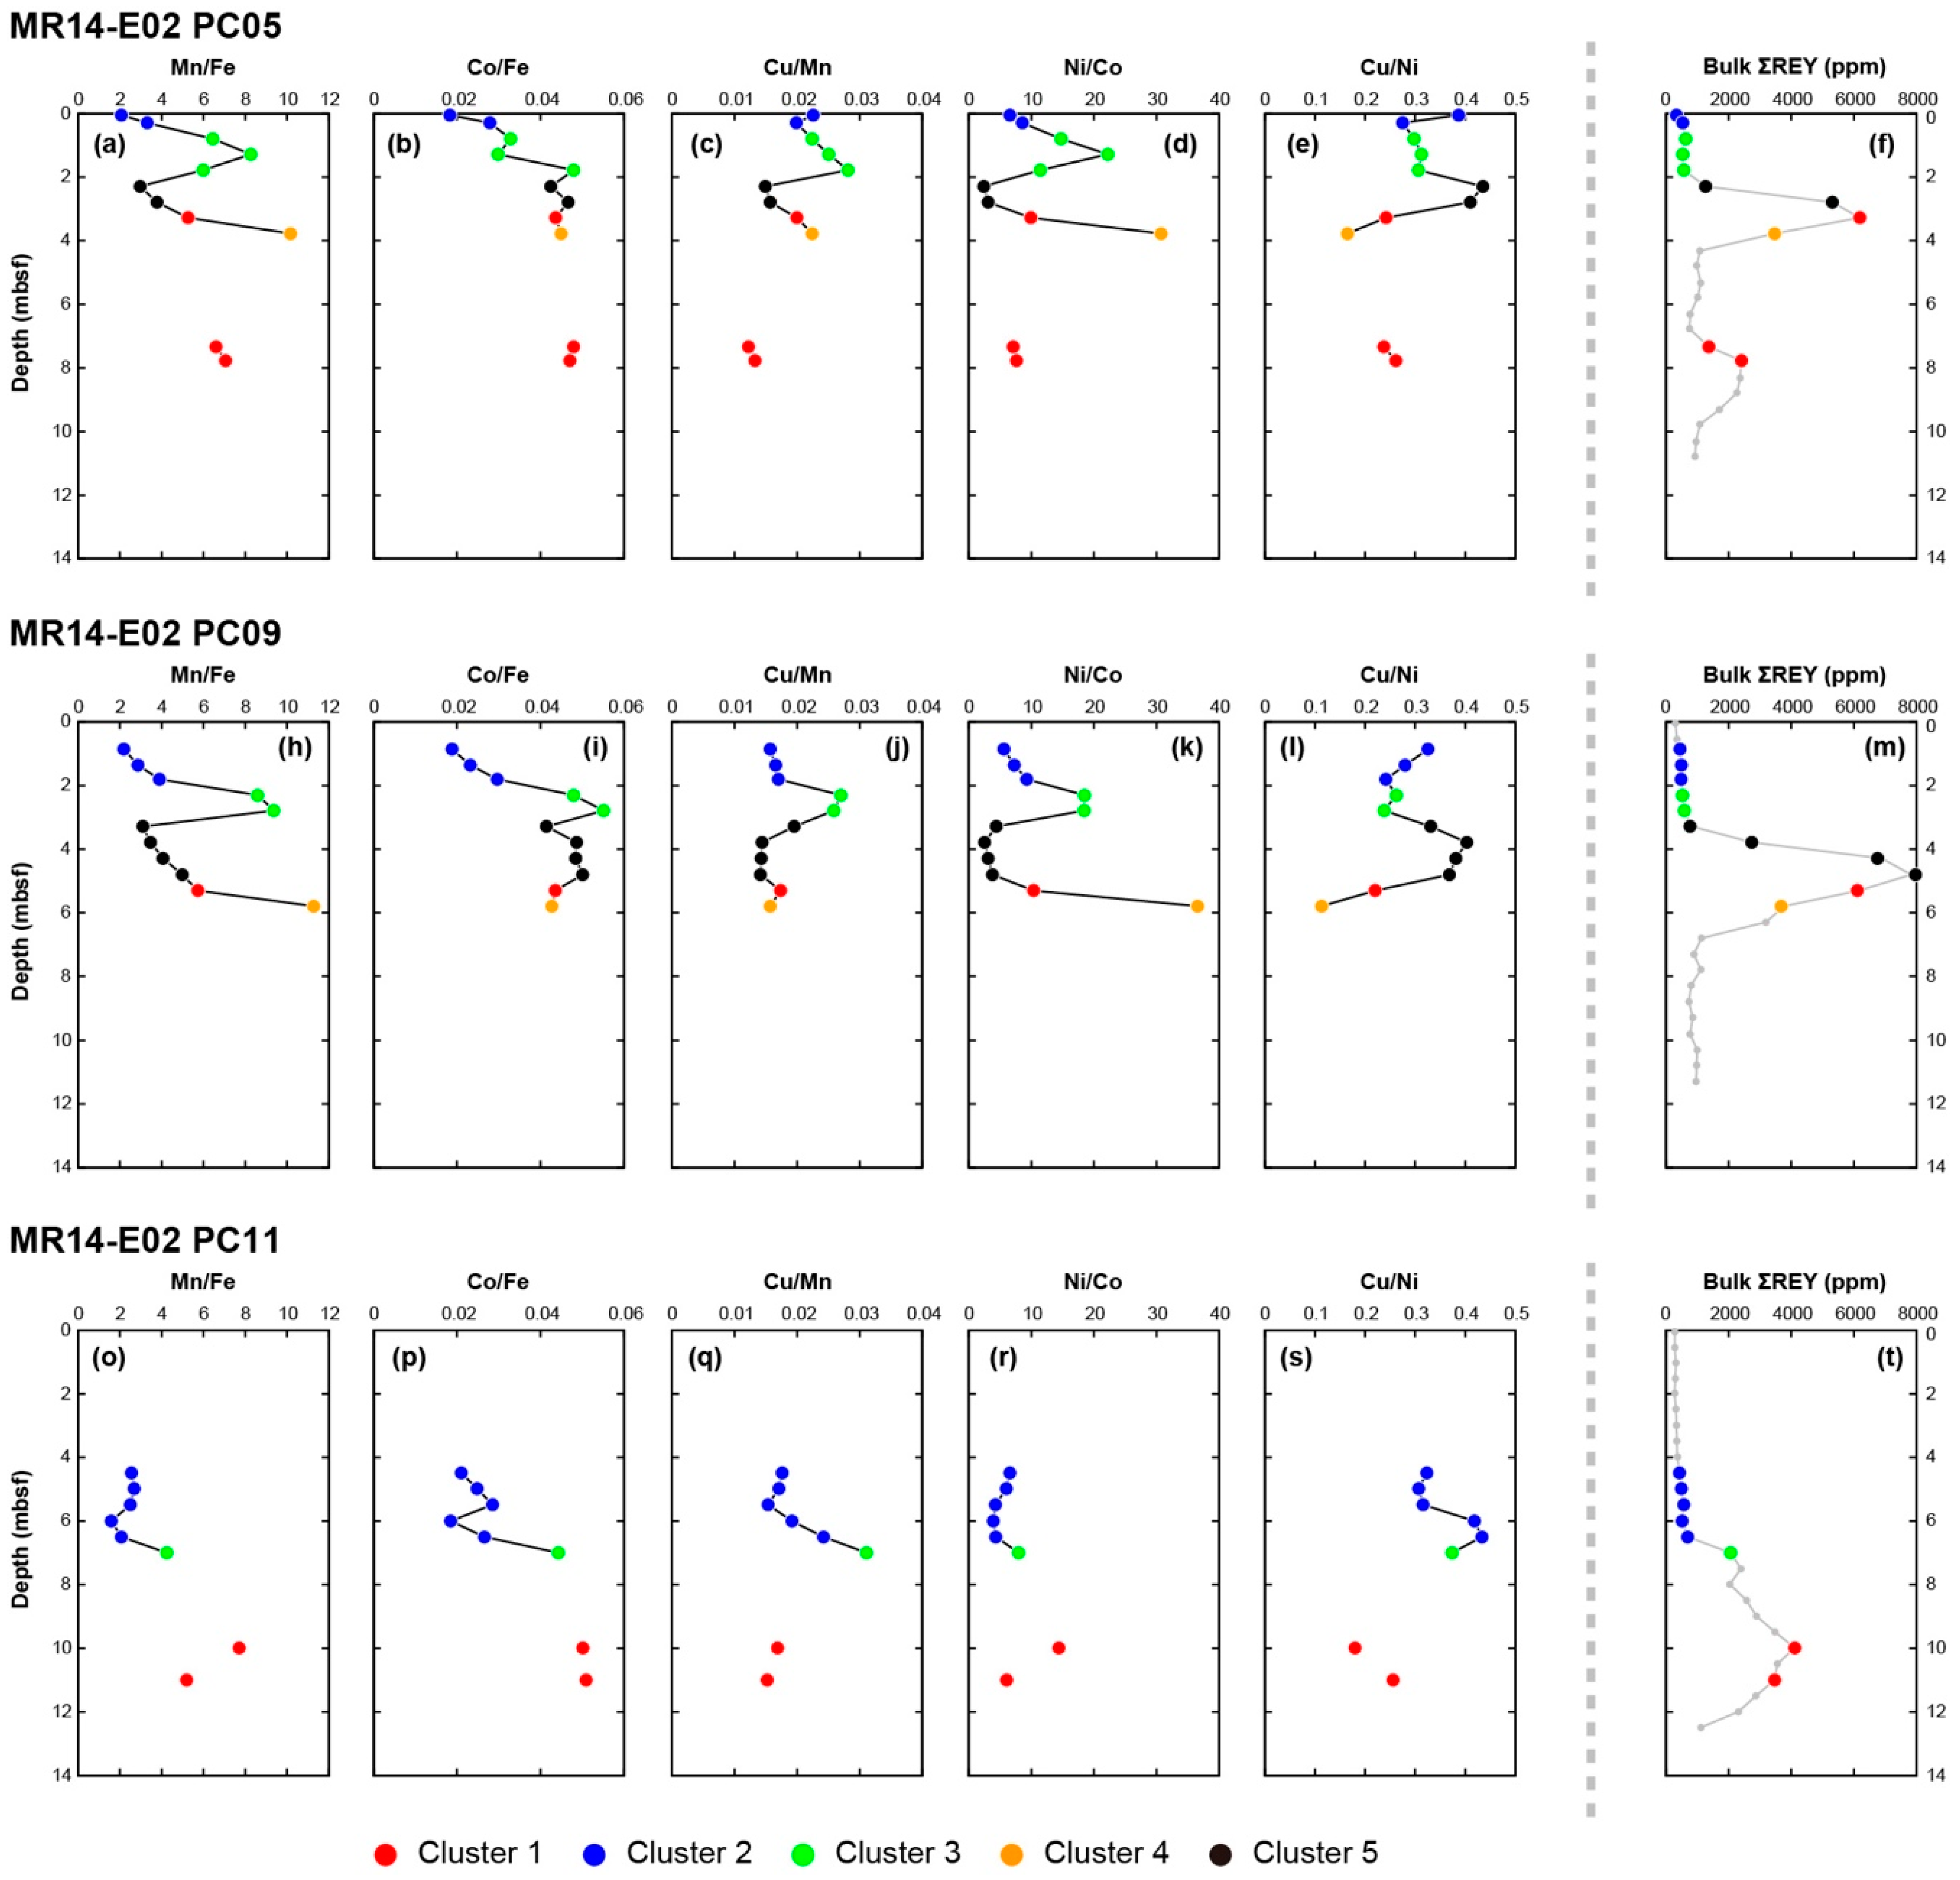
3.1. Downcore Geochemical Variations of the Fe–Mn Micronodules
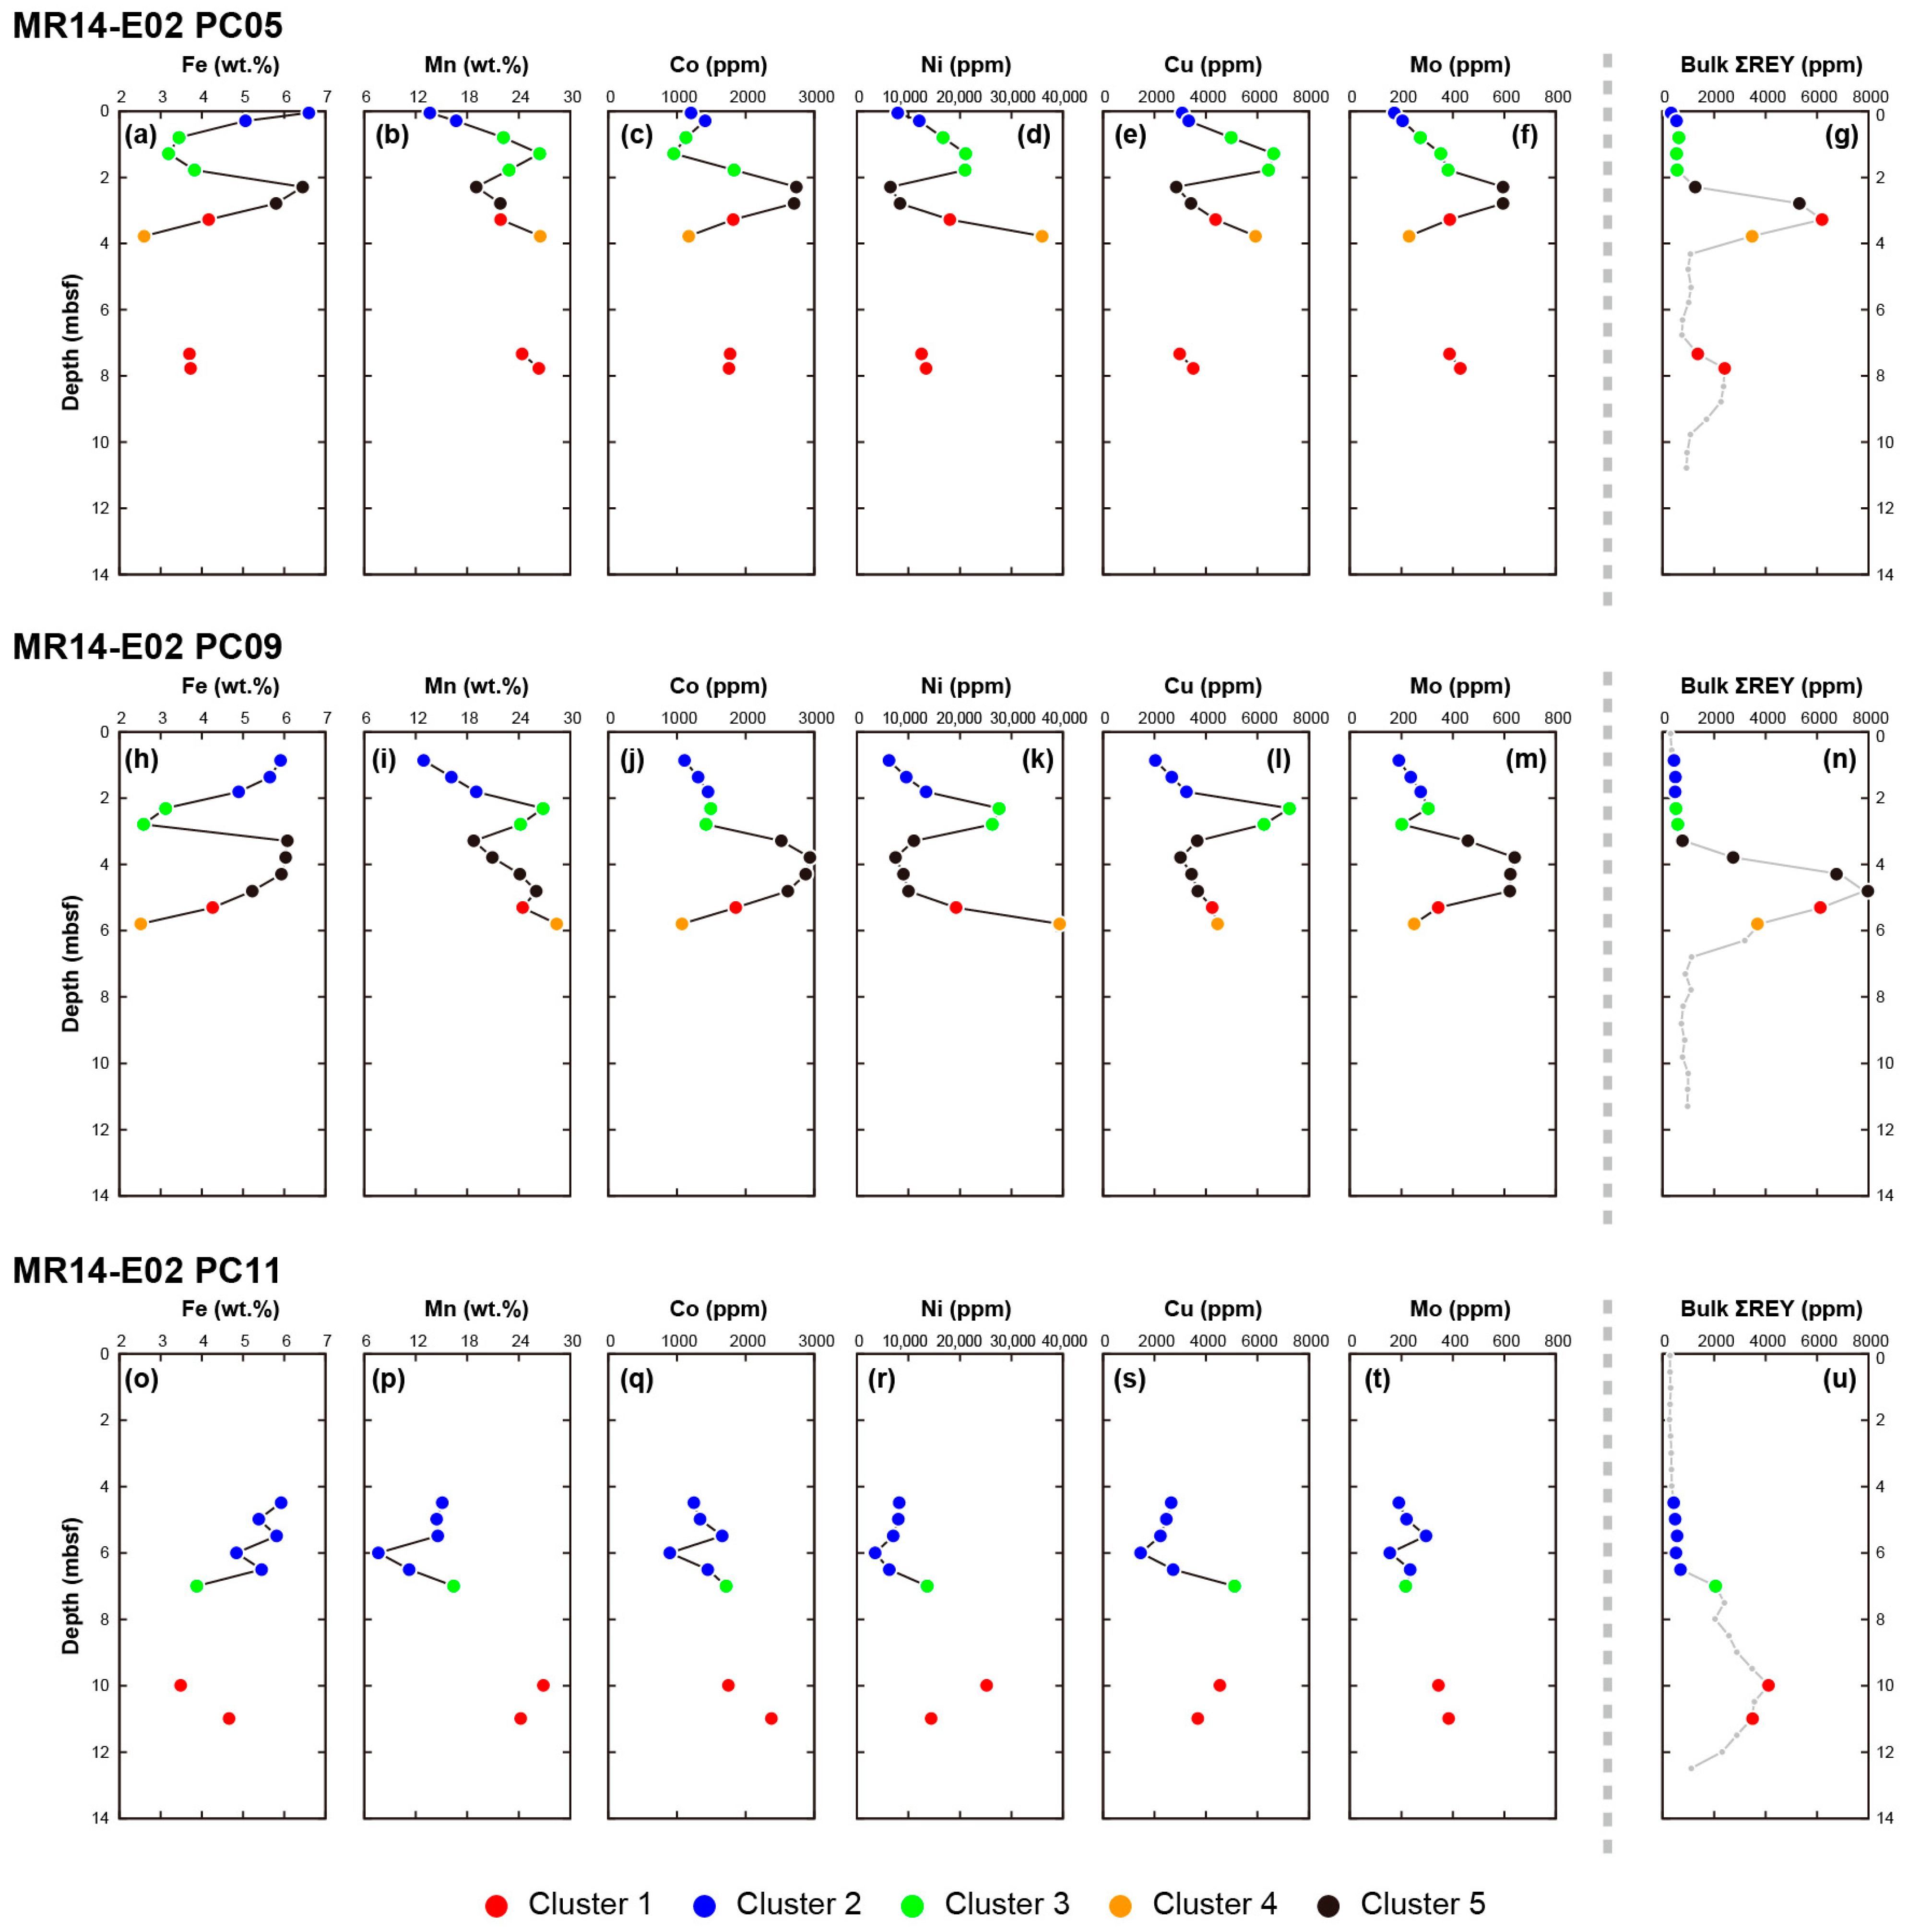
3.2. Results of the KCA
3.3. Geochemical Characteristics of the Classified Fe–Mn Micronodules
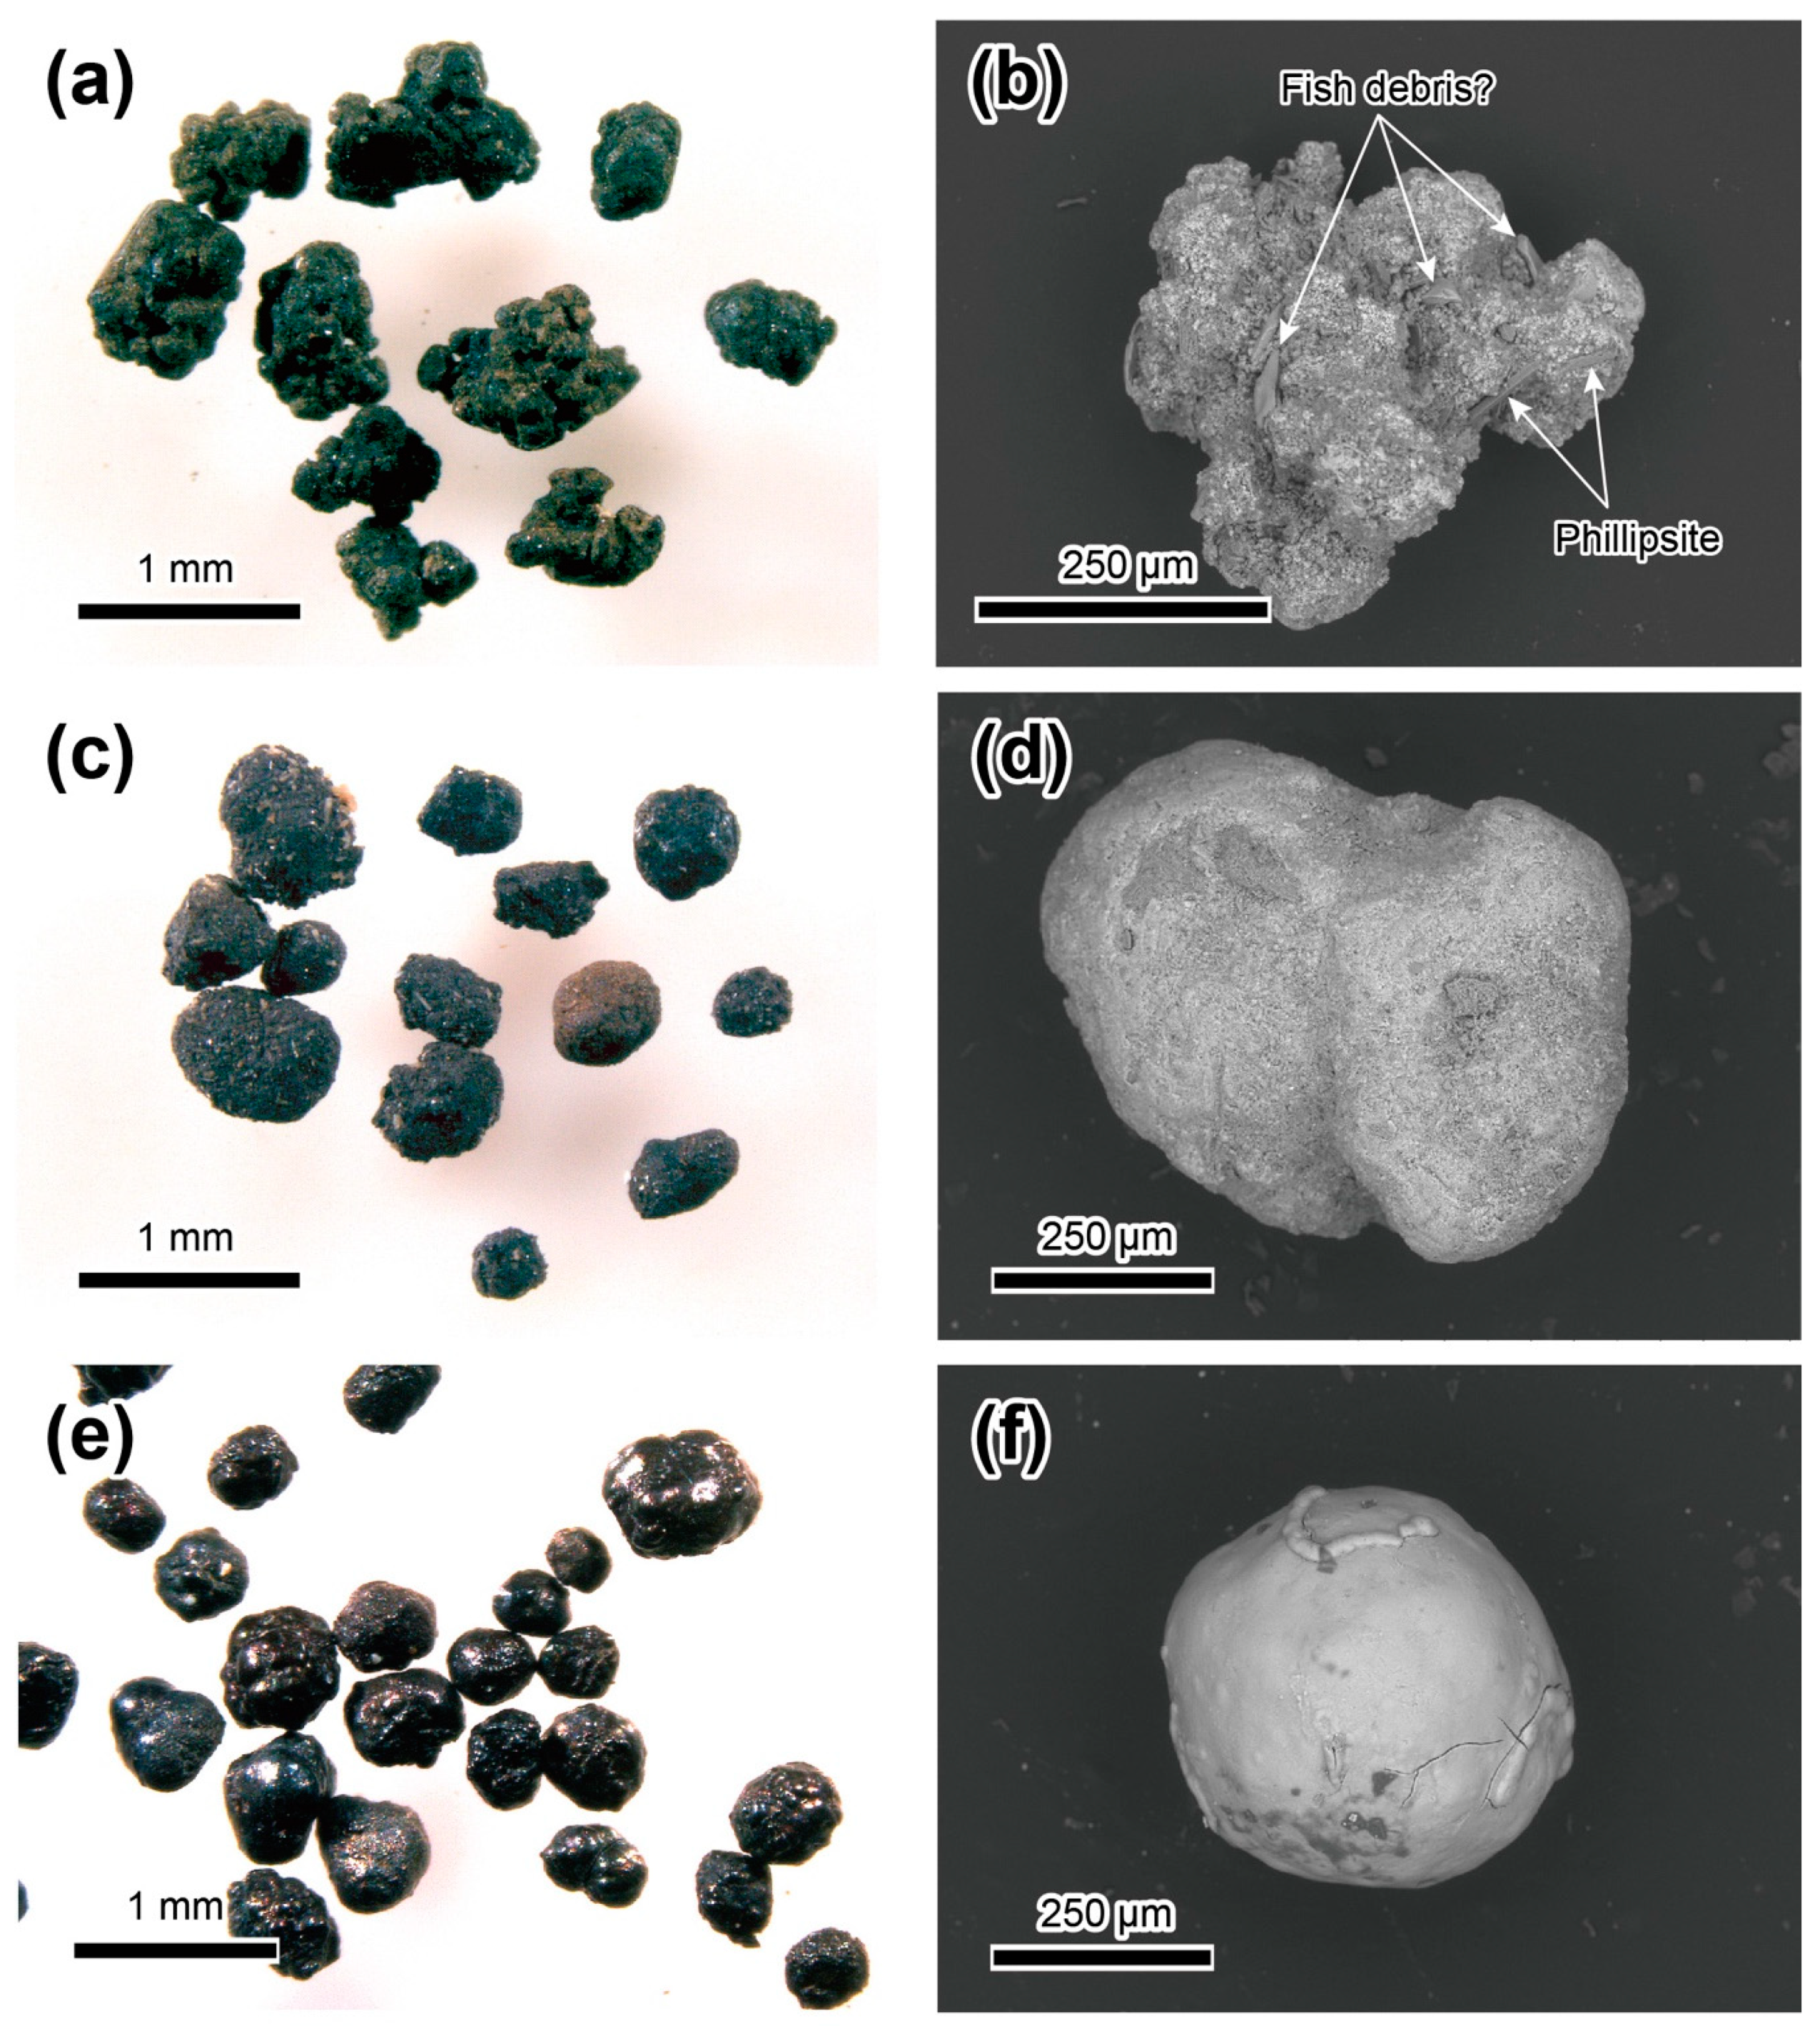
3.4. Morphological Characteristics and Surficial Textures of Fe–Mn Micronodules
3.5. Changes in the Sedimentary Environment during and after the Formation of Extremely REY-Rich Mud
3.6. Implications for the Genesis of Extremely REY-Rich Mud
4. Conclusions
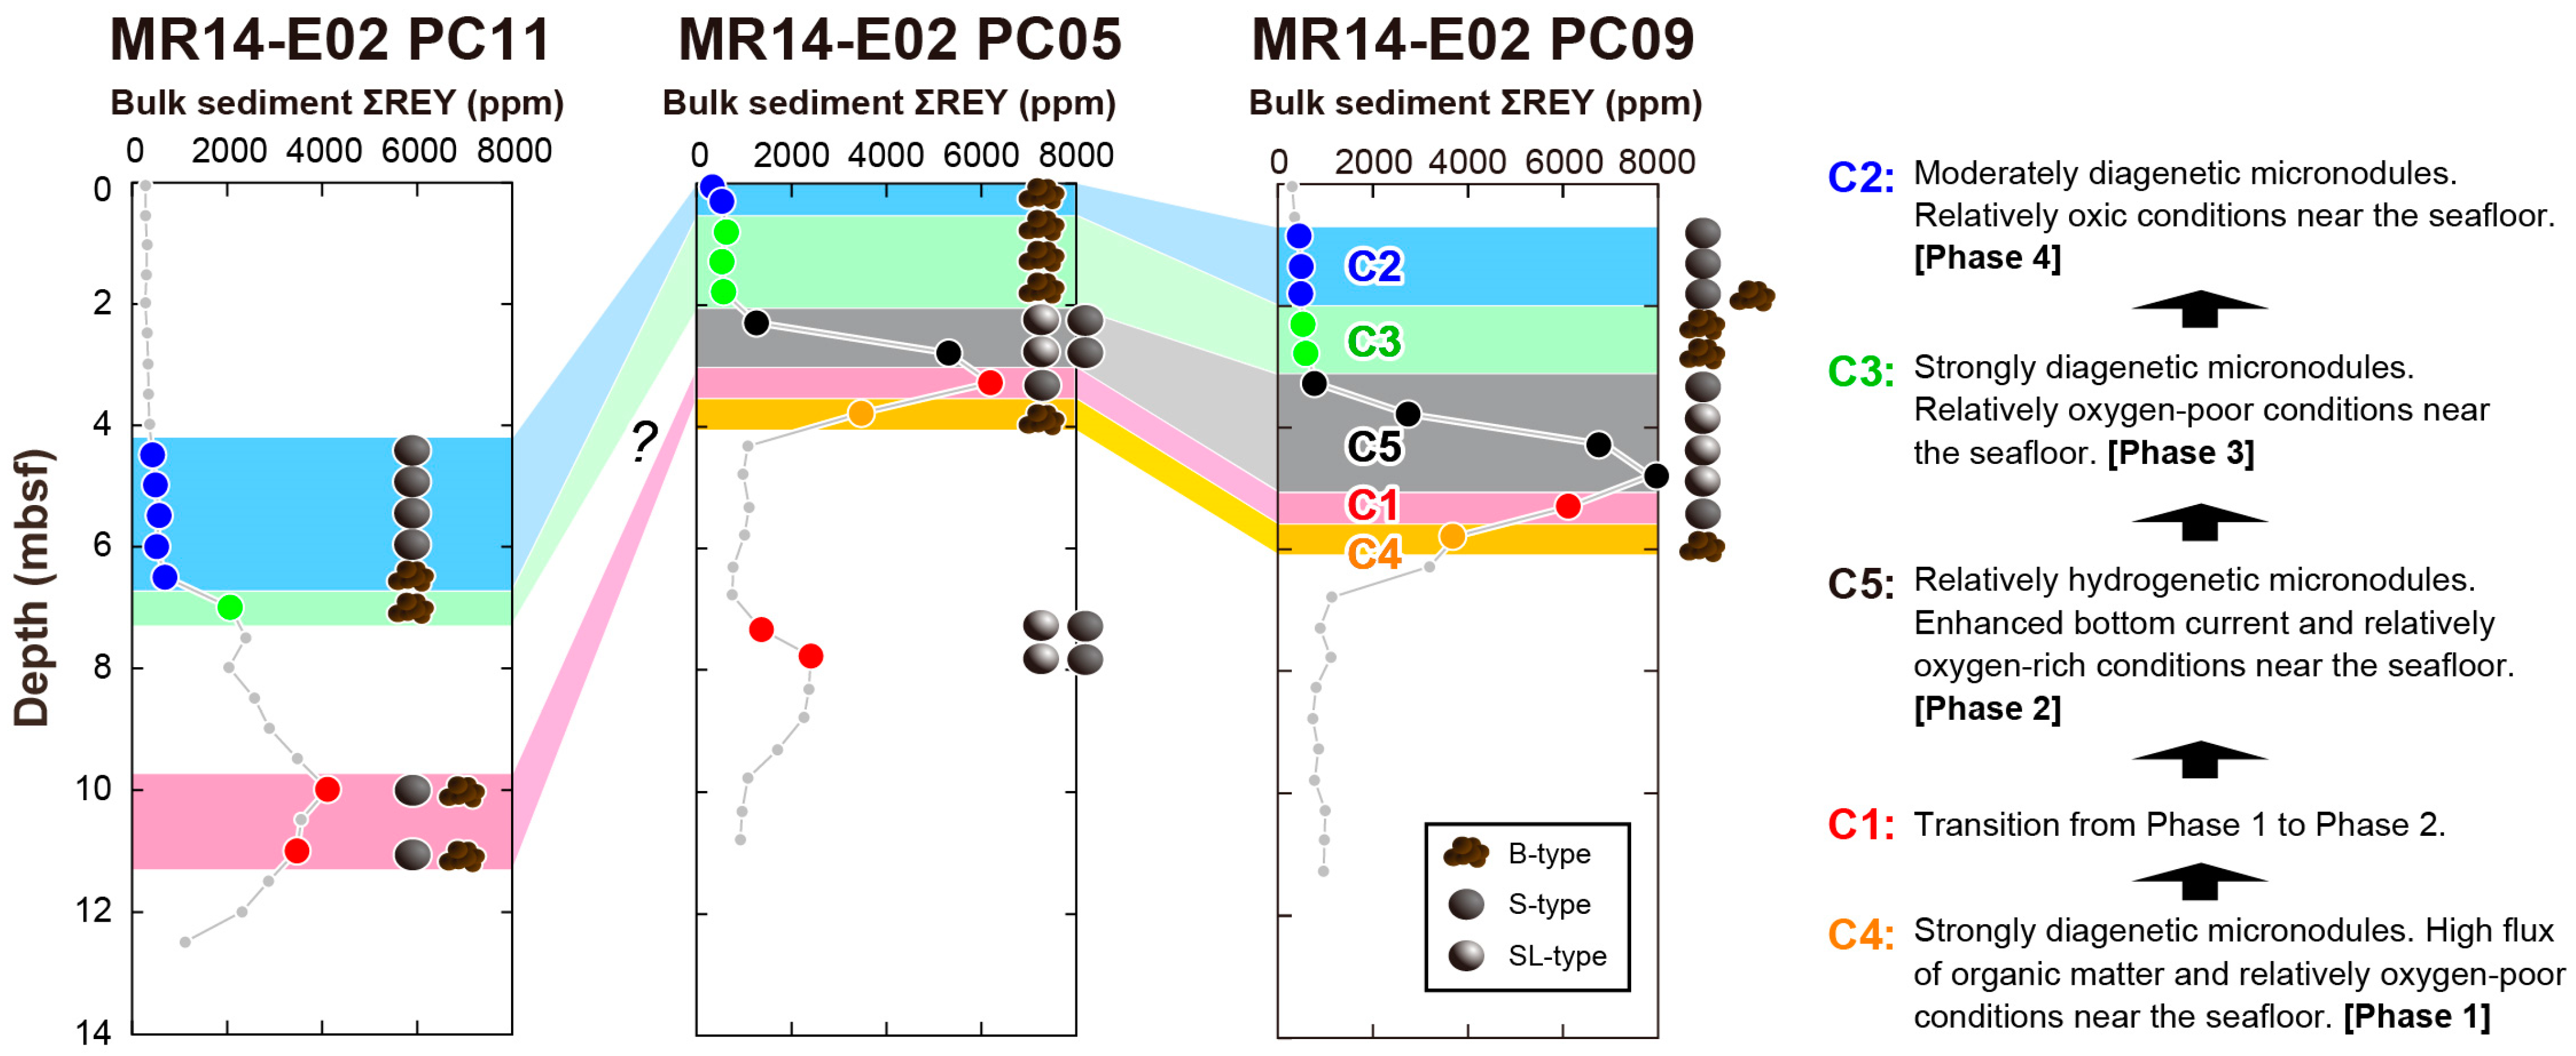
- The studied Fe–Mn micronodule samples can be classified into five clusters based on KCA of whitened data of the Fe, Mn, Co, Ni, Cu, and Mo contents. These five clusters are systematically distributed in the sediment column of all studied cores. The order from the bottom to the top is as follows: C4, C1, C5, C3, and C2.
- Although all Fe–Mn micronodules investigated in this study are generally of diagenetic origin, C5 micronodules show relatively hydrogenetic features, such as high Co contents (>2500 ppm). In contrast, C3 and C4 micronodules with high Cu (≥5000 ppm) and very high Ni (>36,000 ppm) contents seem to be almost pure diagenetic endmembers of Fe–Mn (oxyhydr)oxides. The C1 micronodules show transitional features between two distinct clusters (C4 and C5). The C2 micronodules seem to be enriched in Fe associated with detrital material such as clay minerals.
- The morphological and textural features of the Fe–Mn micronodules can be categorized into three types: B-type (botryoidal), S-type (spherical), and SL-type (spherical with metallic luster). The B-type micronodules are mainly classified into strongly diagenetic C3 and C4, showing Cu- and Ni-enrichment with relatively high Mn/Fe ratios (>5). The B-type micronodules are likely comparable to rough-type macro-sized Fe–Mn nodules on the seafloor. The S-type micronodules occur as C1, C5, and partially as C2 micronodules, showing features of relatively oxic conditions compared with C3 and C4. The SL-type micronodules can only be found in C5 samples that occur in the upper half of the extremely REY-rich mud. The SL-type micronodules exhibit geochemical features, such as high Co contents and low Ni/Co ratios (<5), similar to those of smooth-type seafloor macronodules.
- Based on the stratigraphic changes of the Fe–Mn micronodules, we suggest that the sedimentation environment has changed since the formation of the 1st REY peak of the bulk sediment. At the onset of the 1st REY peak, the organic matter supply and consumption of dissolved oxygen by the oxic degradation of organic matter increased near the sediment–water interface due to the enhanced bottom current that caused the upwelling of deep-sea nutrients and an increased pelagic fish productivity. At the culmination and in the upper half of the 1st REY peak of the bulk sediment, the further activation of ocean overturning and strengthened bottom current supplied oxygen-rich bottom water. After the formation of the extremely REY-rich mud, the sedimentation environment became relatively oxygen-poor. Subsequently, the sedimentation environment shifted toward relatively oxic conditions.
- The absence of a bulk REY peak above the 1st REY peak implies that the enhancement of the bottom current is not sufficient for the formation of the extremely REY-rich mud. A significantly increased supply flux of fish debris to the sediment surface, which is probably induced by the upwelling of deep-sea nutrients to the surface ocean, might be essential for the accumulation of REY in deep-sea sediments.
Supplementary Materials
Author Contributions
Funding
Institutional Review Board Statement
Informed Consent Statement
Data Availability Statement
Acknowledgments
Conflicts of Interest
References
- Kunzendorf, H.; Gwozdz, R.; Glasby, G.P.; Stoffers, P.; Renner, R.M. The distribution of rare earth elements in manganese micronodules and sediments from the equatorial and southwest Pacific. Appl. Geochem. 1989, 4, 183–193. [Google Scholar] [CrossRef]
- Sawada, M. Internal texture and chemical composition of manganese micronodules in deep sea sediments from the Central Pacific Basin. Mining Geol. 1988, 38, 27–37, (In Japanese with English abstract). [Google Scholar] [CrossRef]
- Sawada, M. Internal texture and chemical composition of manganese micronodules in the zeolitic sediments from the Penrhyn Basin. Mining Geol. 1989, 39, 21–31, (In Japanese with English abstract). [Google Scholar] [CrossRef]
- Pattan, J.N. Manganese micronodules: A possible indicator of sedimentary environments. Mar. Geol. 1993, 113, 331–344. [Google Scholar] [CrossRef]
- Dubinin, A.V.; Sval’nov, V.N. Geochemistry of the manganese ore process in the ocean: Evidence from rare earth elements. Lithol. Miner. Resour. 2003, 38, 91–100. [Google Scholar] [CrossRef]
- Dubinin, A.V.; Sval’nov, V.N.; Berezhnaya, E.D.; Rimskaya-Korsakova, M.N.; Demidova, T.P. Geochemistry of trace and minor elements in sediments and manganese micronodules from the Angola Basin. Lithol. Miner. Resour. 2013, 48, 175–197. [Google Scholar] [CrossRef]
- Dubinin, A.V.; Uspenskaya, T.Y.; Rimskaya-Korsakova, M.N.; Demidova, T.P. Rare elements and Nd and Sr isotopic composition in micronodules from the Brazil Basin, Atlantic Ocean. Lithol. Miner. Resour. 2017, 52, 81–101. [Google Scholar] [CrossRef]
- Liao, J.; Sun, X.; Wu, Z.; Sa, R.; Guan, Y.; Lu, Y.; Li, D.; Liu, Y.; Deng, Y.; Pan, Y. Fe-Mn (oxyhydr)oxides as an indicator of REY enrichment in deep-sea sediments from the central North Pacific. Ore Geol. Rev. 2019, 112, 103044. [Google Scholar] [CrossRef]
- Li, D.; Fu, Y.; Liu, Q.; Reinfelder, J.R.; Hollings, P.; Sun, X.; Tan, C.; Dong, Y.; Ma, W. High-resolution LA-ICP-MS mapping of deep-sea polymetallic micronodules and its implications on element mobility. Gondwana Res. 2020, 81, 461–474. [Google Scholar] [CrossRef]
- Iijima, K.; Yasukawa, K.; Fujinaga, K.; Nakamura, K.; Machida, S.; Takaya, Y.; Ohta, J.; Haraguchi, S.; Nishio, Y.; Usui, Y.; et al. Discovery of extremely REY-rich mud in the western North Pacific Ocean. Geochem. J. 2016, 50, 557–573. [Google Scholar] [CrossRef] [Green Version]
- Fujinaga, K.; Yasukawa, K.; Nakamura, K.; Machida, S.; Takaya, Y.; Ohta, J.; Araki, S.; Liu, H.; Usami, R.; Maki, R.; et al. Geochemistry of REY-rich mud in the Japanese Exclusive Economic Zone around Minamitorishima Island. Geochem. J. 2016, 50, 575–590. [Google Scholar] [CrossRef] [Green Version]
- Takaya, Y.; Yasukawa, K.; Kawasaki, T.; Fujinaga, K.; Ohta, J.; Usui, Y.; Nakamura, K.; Kimura, J.-I.; Chang, Q.; Hamada, M.; et al. The tremendous potential of deep-sea mud as a source of rare-earth elements. Sci. Rep. 2018, 8, 5763. [Google Scholar] [CrossRef] [PubMed] [Green Version]
- Yasukawa, K.; Ohta, J.; Mimura, K.; Tanaka, E.; Takaya, Y.; Usui, Y.; Fujinaga, K.; Machida, S.; Nozaki, T.; Iijima, K.; et al. A new and prospective resource for scandium: Evidence from the geochemistry of deep-sea sediment in the western North Pacific Ocean. Ore Geol. Rev. 2018, 102, 260–267. [Google Scholar] [CrossRef]
- Yasukawa, K.; Ohta, J.; Miyazaki, T.; Vaglarov, B.S.; Chang, Q.; Ueki, K.; Toyama, C.; Kimura, J.-I.; Tanaka, E.; Nakamura, K.; et al. Statistic and isotopic characterization of deep-sea sediments in the western North Pacific Ocean: Implications for genesis of the sediment extremely enriched in rare-earth elements. Geochem. Geophys. Geosyst. 2019, 20, 3402–3430. [Google Scholar] [CrossRef] [Green Version]
- Kyte, F.T.; Leinen, M.; Heath, G.R.; Zhou, L. Cenozoic sedimentation history of the central North Pacific: Inferences from the elemental geochemistry of core LL44-GPC3. Geochim. Cosmochim. Acta 1993, 57, 1719–1740. [Google Scholar] [CrossRef]
- Plank, T.; Langmuir, C.H. The chemical composition of subducting sediment and its consequences for the crust and mantle. Chem. Geol. 1998, 145, 325–394. [Google Scholar] [CrossRef]
- Kato, Y.; Fujinaga, K.; Nakamura, K.; Yakaya, Y.; Kitamura, K.; Ohta, J.; Toda, R.; Nakashima, T.; Iwamori, H. Deep-sea mud in the Pacific Ocean as a potential resource for rare-earth elements. Nat. Geosci. 2011, 4, 535–539. [Google Scholar] [CrossRef]
- Yasukawa, K.; Liu, H.; Fujinaga, K.; Machida, S.; Haraguchi, S.; Ishii, T.; Nakamura, K.; Kato, Y. Geochemistry and mineralogy of REY-rich mud in the eastern Indian Ocean. J. Asian Earth Sci. 2014, 93, 25–36. [Google Scholar] [CrossRef]
- Yasukawa, K.; Nakamura, K.; Fujinaga, K.; Machida, S.; Ohta, J.; Takaya, Y.; Kato, Y. Rare-earth, major, and trace element geochemistry of deep-sea sediments in the Indian Ocean: Implications for the potential distribution of REY-rich mud in the Indian Ocean. Geochem. J. 2015, 49, 621–635. [Google Scholar] [CrossRef]
- Yasukawa, K.; Nakamura, K.; Fujinaga, K.; Iwamori, H.; Kato, Y. Tracking the spatiotemporal variations of statistically independent components involving enrichment of rare-earth elements in deep-sea sediments. Sci. Rep. 2016, 6, 29603. [Google Scholar] [CrossRef]
- Nakamura, K.; Fujinaga, K.; Yasukawa, K.; Takaya, Y.; Ohta, J.; Machida, S.; Haraguchi, S.; Kato, Y. REY-rich mud: A deep-sea mineral resource for rare earths and yttrium. In Handbook on the Physics and Chemistry of Rare Earths; Elsevier: Amsterdam, The Netherlands, 2015; Volume 46, pp. 79–127. [Google Scholar] [CrossRef]
- Zhang, X.; Tao, C.; Shi, X.; Li, H.; Huang, M.; Huang, D. Geochemical characteristics of REY-rich pelagic sediments from the GC02 in central Indian Ocean Basin. J. Rare Earth. 2017, 35, 1047–1058. [Google Scholar] [CrossRef]
- Menendez, A.; James, R.H.; Roberts, S.; Peel, K.; Connelly, D. Controls on the distribution of rare earth elements in deep-sea sediments in the North Atlantic Ocean. Ore Geol. Rev. 2017, 87, 100–113. [Google Scholar] [CrossRef]
- Sa, R.; Sun, X.; He, G.; Xu, L.; Pan, Q.; Liao, J.; Zhu, K.; Deng, X. Enrichment of rare earth elements in siliceous sediments under slow deposition: A case study of the central North Pacific. Ore Geol. Rev. 2018, 94, 12–23. [Google Scholar] [CrossRef]
- Zhou, T.; Shi, X.; Huang, M.; Yu, M.; Bi, D.; Ren, X.; Yang, G.; Zhu, A. The influence of hydrothermal fluids on the REY-rich deep-sea sediments in the Yupanqui Basin, eastern South Pacific Ocean: Constraints from bulk sediment geochemistry and mineralogical characteristics. Minerals 2020, 10, 1141. [Google Scholar] [CrossRef]
- Mimura, K.; Nakamura, K.; Yasukawa, K.; Machida, S.; Ohta, J.; Fujinaga, K.; Kato, Y. Significant impacts of pelagic clay on average chemical composition of subducting sediments: New insights from discovery of extremely rare-earth elements and yttrium-rich mud at Ocean Drilling Program Site 1149 in the western North Pacific Ocean. J. Asian Earth Sci. 2019, 186, 104059. [Google Scholar] [CrossRef]
- Arrhenius, G.; Bramlette, M.N.; Picciotto, E. Localization of radioactive and stable heavy nuclides in ocean sediments. Nature 1957, 180, 85–86. [Google Scholar] [CrossRef]
- Bernat, M. Les isotopes de l’uranium et du thorium et les terres rares dans l’environment marin. Cah. Orstom. Sér. Géol. 1975, 7, 65–83. [Google Scholar]
- Elderfield, H.; Pagett, R. Rare earth elements in ichthyoliths: Variations with redox conditions and depositional environment. Sci. Total Environ. 1986, 49, 175–197. [Google Scholar] [CrossRef]
- Toyoda, K.; Tokonami, M. Diffusion of rare-earth elements in fish teeth from deep-sea sediments. Nature 1990, 345, 607–609. [Google Scholar] [CrossRef]
- Toyoda, K.; Nakamura, Y.; Masuda, A. Rare earth elements of Pacific pelagic sediments. Geochim. Cosmochim. Acta 1990, 54, 1093–1103. [Google Scholar] [CrossRef]
- Kashiwabara, T.; Toda, R.; Fujinaga, K.; Honma, T.; Takahashi, Y.; Kato, Y. Determination of host phase of lanthanum in deep-sea REY-rich mud by XAFS and μ-XRF using high-energy synchrotron radiation. Chem. Lett. 2014, 43, 199–200. [Google Scholar] [CrossRef]
- Kashiwabara, T.; Toda, R.; Nakamura, K.; Yasukawa, K.; Fujinaga, K.; Kubo, S.; Nozaki, T.; Takahashi, Y.; Suzuki, K.; Kato, Y. Synchrotron X-ray spectroscopic perspective on the formation mechanism of REY-rich muds in the Pacific Ocean. Geochim. Cosmochim. Acta 2018, 240, 274–292. [Google Scholar] [CrossRef]
- Ohta, J.; Yasukawa, K.; Machida, S.; Fujinaga, K.; Nakamura, K.; Takaya, Y.; Iijima, K.; Suzuki, K.; Kato, Y. Geological factors responsible for REY-rich mud in the western North Pacific Ocean: Implications from mineralogy and grain size distributions. Geochem. J. 2016, 50, 591–603. [Google Scholar] [CrossRef] [Green Version]
- Tanaka, E.; Nakamura, K.; Yasukawa, K.; Mimura, K.; Fujinaga, K.; Iijima, K.; Nozaki, T.; Kato, Y. Chemostratigraphy of deep-sea sediments in the western North Pacific Ocean: Implications for genesis of mud highly enriched in rare-earth elements and yttrium. Ore Geol. Rev. 2020, 119, 103392. [Google Scholar] [CrossRef]
- Ohta, J.; Yasukawa, K.; Nozaki, T.; Takaya, Y.; Mimura, K.; Fujinaga, K.; Nakamura, K.; Usui, Y.; Kimura, J.-I.; Chang, Q.; et al. Fish proliferation and rare-earth deposition by topographically induced upwelling at the late Eocene cooling event. Sci. Rep. 2020, 10, 9896. [Google Scholar] [CrossRef]
- Yasukawa, K.; Kino, S.; Azami, K.; Tanaka, E.; Mimura, K.; Ohta, J.; Fujinaga, K.; Nakamura, K.; Kato, Y. Geochemical features of Fe-Mn micronodules in deep-sea sediment of the western North Pacific Ocean: Potential for co-product metal extraction from REY-rich mud. Ore Geol. Rev. 2020, 127, 103805. [Google Scholar] [CrossRef]
- MacQueen, J. Some methods for classification and analysis of multivariate observations. In Proceedings of the Fifth Berkeley Symposium on Mathematica Statistics and Probability; Le Cam, L.M., Neyman, J., Eds.; University of California Press: Berkeley, CA, USA, 1967; Volume 1, pp. 281–297. [Google Scholar]
- Iwamori, H.; Yoshida, K.; Nakamura, H.; Kuwatani, T.; Hamada, M.; Haraguchi, S.; Ueki, K. Classification of geochemical data based on multivariate statistical analyses: Complementary roles of cluster, principal component, and independent component analyses. Geochem. Geophys. Geosyst. 2017, 18, 994–1012. [Google Scholar] [CrossRef]
- Iwamori, H.; Nakamura, H.; Chang, Q.; Morikawa, N.; Haraguchi, S. Multivariate statistical analyses of rare earth element compositions of spring waters from the Arima and Kii areas, Southwest Japan. Geochem. J. 2020, 54, 165–182. [Google Scholar] [CrossRef]
- Nakamura, H.; Iwamori, H.; Nakagawa, M.; Shibata, T.; Kimura, J.-I.; Miyazaki, T.; Chang, Q.; Vaglarov, B.S.; Takahashi, T.; Hirahara, Y. Geochemical mapping of slab-derived fluid and source mantle along Japan arcs. Gondwana Res. 2019, 70, 36–49. [Google Scholar] [CrossRef]
- Hamada, M.; Iwamori, H.; Brandl, P.A.; Ushikubo, T.; Shimizu, K.; Ito, M.; Li, H.; Savov, I.P. Temporal evolution of proto-Izu-Bonin-Mariana arc volcanism over 10 Myr: Constraints from statistical analysis of melt inclusion compositions. J. Petrol. 2020, 61, egaa022. [Google Scholar] [CrossRef] [Green Version]
- Josso, P.; Pelleter, E.; Pourret, O.; Fouquet, Y.; Etoubleau, J.; Cheron, S.; Bollinger, C. A new discrimination scheme for oceanic ferromanganese deposits using high field strength and rare earth elements. Ore Geol. Rev. 2017, 87, 3–15. [Google Scholar] [CrossRef] [Green Version]
- Wegorzewski, A.V.; Kuhn, T. The influence of suboxic diagenesis on the formation of manganese nodules in the Clarion Clipperton nodule belt of the Pacific Ocean. Mar. Geol. 2014, 357, 123–138. [Google Scholar] [CrossRef]
- Wegorzewski, A.V.; Grangeon, S.; Webb, S.M.; Heller, C.; Kuhn, T. Mineralogical transformations in polymetallic nodules and the change of Ni, Cu, and Co crystal-chemistry upon burial in sediments. Geochim. Cosmochim. Acta 2020, 282, 19–37. [Google Scholar] [CrossRef]
- Halbach, P.; Scherhag, C.; Hebisch, U.; Marchig, V. Geochemical and mineralogical control of different genetic types of deep-sea nodules from the Pacific Ocean. Miner. Deposita 1981, 16, 59–84. [Google Scholar] [CrossRef]
- Usui, A. Regional variation of manganese nodule facies on the Wake–Tahiti transect: Morphological, chemical and mineralogical study. Mar. Geol. 1983, 54, 27–51. [Google Scholar] [CrossRef]
- Usui, A.; Nishimura, A.; Tanahashi, M.; Terashima, S. Local variability of manganese nodule facies on small abyssal hills of the Central Pacific Basin. Mar. Geol. 1987, 74, 237–275. [Google Scholar] [CrossRef]
- Hein, J.R.; Koschinsky, A.; Kuhn, T. Deep-ocean polymetallic nodules as a resource for critical materials. Nat. Rev. Earth Environ. 2020, 1, 158–169. [Google Scholar] [CrossRef]
- Machida, S.; Fujinaga, K.; Ishii, T.; Nakamura, K.; Hirano, N.; Kato, Y. Geology and geochemistry of ferromanganese nodules in the Japanese Exclusive Economic Zone around Minamitorishima Island. Geochem. J. 2016, 50, 539–555. [Google Scholar] [CrossRef] [Green Version]
- Nozaki, T.; Tokumaru, A.; Takaya, Y.; Kato, Y.; Suzuki, K.; Urabe, T. Major and trace element compositions and resource potential of ferromanganese crust at Takuyo Daigo Seamount, northwestern Pacific Ocean. Geochem. J. 2016, 50, 527–537. [Google Scholar] [CrossRef] [Green Version]
- Azami, K.; Hirano, N.; Machida, S.; Yasukawa, K.; Kato, Y. Rare earth elements and yttrium (REY) variability with water depth in hydrogenetic ferromanganese crusts. Chem. Geol. 2018, 493, 224–233. [Google Scholar] [CrossRef]
- Tanaka, E.; Nakamura, K.; Yasukawa, K.; Mimura, K.; Fujinaga, K.; Ohta, J.; Iijima, K.; Nozaki, T.; Machida, S.; Kato, Y. Chemostratigraphic correlations of deep-sea sediments in the western North Pacific Ocean: A new constraint on the distribution of mud highly enriched in rare-earth elements. Minerals 2020, 10, 575. [Google Scholar] [CrossRef]
- Hein, J.R.; Koschinsky, A. Deep-ocean ferromanganese crusts and nodules. In Treatise on Geochemistry, 2nd ed.; Holland, H.D., Turekian, K.K., Eds.; Elsevier: Amsterdam, The Netherlands, 2014; Volume 13, pp. 273–291. [Google Scholar] [CrossRef]
- Chester, R.; Jickells, T. Marine Geochemistry, 3rd ed.; John Wiley & Sons, Ltd.: West Sussex, UK, 2012. [Google Scholar]
- Goldner, A.; Herold, N.; Huber, M. Antarctic glaciation caused ocean circulation changes at the Eocene-Oligocene transition. Nature 2014, 511, 574–577. [Google Scholar] [CrossRef] [PubMed]
- Borrelli, C.; Katz, M.E. Dynamic deep-water circulation in the northwestern Pacific during the Eocene: Evidence from Ocean Drilling Program Site 884 benthic foraminiferal stable isotopes (δ18O and δ13C). Geosphere 2015, 11, 1204–1225. [Google Scholar] [CrossRef] [Green Version]
- Hein, J.R.; Bohrson, W.A.; Schulz, M.S.; Noble, M.; Clague, D.A. Variations in the fine-scale composition of a central Pacific ferromanganese crust: Paleoceanographic implications. Paleoceanography 1992, 7, 63–77. [Google Scholar] [CrossRef]
- Han, X.; Jin, X.; Yang, S.; Fietzke, J.; Eisenhauer, A. Rhythmic growth of Pacific ferromanganese nodules and their Milankovitch climatic origin. Earth Planet. Sci. Lett. 2003, 211, 143–157. [Google Scholar] [CrossRef]


| Sample (Core, Section, Interval) | Depth (mbsf) | Mn (wt.%) | Fe (wt.%) | Co (ppm) | Ni (ppm) | Cu (ppm) | Mo (ppm) | Cluster (K = 5) | Texture of Micronodules | Note |
|---|---|---|---|---|---|---|---|---|---|---|
| MR14-E02 PC05 | ||||||||||
| Sec. 1, 4–6 cm | 0.05 | 13.6 | 6.60 | 1206 | 7955 | 3078 | 172 | 2 | B | - |
| Sec. 2, 4–6 cm | 0.30 | 16.7 | 5.06 | 1408 | 12,082 | 3324 | 205 | 2 | B | - |
| Sec. 2, 54–56 cm | 0.80 | 22.2 | 3.45 | 1132 | 16,684 | 4971 | 274 | 3 | B | - |
| Sec. 3, 4–6 cm | 1.28 | 26.4 | 3.20 | 953 | 21,158 | 6620 | 353 | 3 | B | - |
| Sec. 3, 54–56 cm | 1.78 | 22.9 | 3.82 | 1835 | 20,997 | 6435 | 381 | 3 | B | - |
| Sec. 4, 4–6 cm | 2.29 | 19.1 | 6.44 | 2739 | 6545 | 2846 | 595 | 5 | S and SL | Mixed. |
| Sec. 4, 54–56 cm | 2.79 | 21.9 | 5.80 | 2706 | 8357 | 3427 | 595 | 5 | S and SL | S is dominant. |
| Sec. 5, 4–6 cm | 3.28 | 21.9 | 4.17 | 1818 | 18,036 | 4371 | 388 | 1 | S | - |
| Sec. 5, 54–56 cm | 3.78 | 26.5 | 2.60 | 1171 | 35,979 | 5932 | 229 | 4 | B | - |
| Sec. 9, 10–12 cm | 7.33 | 24.4 | 3.70 | 1770 | 12,547 | 2982 | 387 | 1 | S and SL | S is dominant. |
| Sec. 9, 54–56 cm | 7.77 | 26.3 | 3.73 | 1754 | 13,425 | 3504 | 429 | 1 | S and SL | S is dominant. |
| MR14-E02 PC09 | ||||||||||
| Sec. 2, 4–6 cm | 0.86 | 12.9 | 5.91 | 1110 | 6225 | 2027 | 190 | 2 | S | - |
| Sec. 2, 54–56 cm | 1.36 | 16.2 | 5.65 | 1309 | 9546 | 2676 | 236 | 2 | S | - |
| Sec. 3, 4–6 cm | 1.81 | 19.0 | 4.89 | 1449 | 13,430 | 3241 | 275 | 2 | B and S | Mixed. |
| Sec. 3, 54–56 cm | 2.31 | 26.8 | 3.12 | 1494 | 27,635 | 7247 | 305 | 3 | B | - |
| Sec. 4, 4–6 cm | 2.79 | 24.2 | 2.58 | 1424 | 26,270 | 6259 | 201 | 3 | B | - |
| Sec. 4, 54–56 cm | 3.29 | 18.8 | 6.07 | 2519 | 11,072 | 3666 | 459 | 5 | S | - |
| Sec. 5, 4–6 cm | 3.79 | 20.9 | 6.04 | 2937 | 7474 | 3014 | 640 | 5 | SL | - |
| Sec. 5, 54–56 cm | 4.29 | 24.1 | 5.93 | 2875 | 9022 | 3440 | 624 | 5 | SL | - |
| Sec. 6, 4–6 cm | 4.81 | 26.1 | 5.23 | 2617 | 10,000 | 3683 | 621 | 5 | SL | - |
| Sec. 6, 54–56 cm | 5.31 | 24.4 | 4.26 | 1856 | 19,225 | 4241 | 343 | 1 | S | - |
| Sec. 7, 4–6 cm | 5.80 | 28.4 | 2.52 | 1076 | 39,338 | 4453 | 249 | 4 | B | - |
| MR14-E02 PC11 | ||||||||||
| Sec. 5, 54–56 cm | 4.48 | 15.1 | 5.92 | 1244 | 8217 | 2654 | 190 | 2 | S | - |
| Sec. 6, 4–6 cm | 4.98 | 14.4 | 5.38 | 1334 | 8027 | 2466 | 220 | 2 | S | - |
| Sec. 6, 54–56 cm | 5.48 | 14.6 | 5.82 | 1659 | 7079 | 2236 | 295 | 2 | S | - |
| Sec. 7, 4–6 cm | 6.00 | 7.7 | 4.84 | 894 | 3519 | 1472 | 156 | 2 | S | - |
| Sec. 7, 54–56 cm | 6.50 | 11.3 | 5.45 | 1447 | 6281 | 2723 | 235 | 2 | B | - |
| Sec. 8, 4–6 cm | 7.00 | 16.4 | 3.88 | 1716 | 13,658 | 5108 | 217 | 3 | B | - |
| Sec. 11, 4–6 cm | 9.98 | 26.9 | 3.49 | 1750 | 25,157 | 4532 | 343 | 1 | B, S, SL | Mixed; SL is less abundant. |
| Sec. 12, 4–6 cm | 10.99 | 24.2 | 4.66 | 2374 | 14,419 | 3688 | 384 | 1 | S, B | S is dominant. |
Publisher’s Note: MDPI stays neutral with regard to jurisdictional claims in published maps and institutional affiliations. |
© 2021 by the authors. Licensee MDPI, Basel, Switzerland. This article is an open access article distributed under the terms and conditions of the Creative Commons Attribution (CC BY) license (http://creativecommons.org/licenses/by/4.0/).
Share and Cite
Yasukawa, K.; Kino, S.; Ohta, J.; Azami, K.; Tanaka, E.; Mimura, K.; Fujinaga, K.; Nakamura, K.; Kato, Y. Stratigraphic Variations of Fe–Mn Micronodules and Implications for the Formation of Extremely REY-Rich Mud in the Western North Pacific Ocean. Minerals 2021, 11, 270. https://0-doi-org.brum.beds.ac.uk/10.3390/min11030270
Yasukawa K, Kino S, Ohta J, Azami K, Tanaka E, Mimura K, Fujinaga K, Nakamura K, Kato Y. Stratigraphic Variations of Fe–Mn Micronodules and Implications for the Formation of Extremely REY-Rich Mud in the Western North Pacific Ocean. Minerals. 2021; 11(3):270. https://0-doi-org.brum.beds.ac.uk/10.3390/min11030270
Chicago/Turabian StyleYasukawa, Kazutaka, Satoshi Kino, Junichiro Ohta, Keishiro Azami, Erika Tanaka, Kazuhide Mimura, Koichiro Fujinaga, Kentaro Nakamura, and Yasuhiro Kato. 2021. "Stratigraphic Variations of Fe–Mn Micronodules and Implications for the Formation of Extremely REY-Rich Mud in the Western North Pacific Ocean" Minerals 11, no. 3: 270. https://0-doi-org.brum.beds.ac.uk/10.3390/min11030270