Review

Noble Metal Speciations in Hydrothermal Sulphides

1
Institute of Geology of Ore Deposits, Petrography, Mineralogy, and Geochemistry, Russian Academy of Sciences, 119017 Moscow, Russia
2
Department of Geology, Mining and Oil&Gas Engineering, Academy of Engineering, Peoples’ Friendship University of Russia (RUDN University), 117198 Moscow, Russia
3
Scientific Geoinformation Centre, Russian Academy of Sciences, 119019 Moscow, Russia
4
Institute of Mineralogy, Geochemistry and Crystal Chemistry of Rare Elements, 121357 Moscow, Russia
5
Department of Geology, Lomonosov Moscow State University, 119992 Moscow, Russia
6
Sobolev Institute of Geology and Mineralogy, Siberian Branch of the Russian Academy of Sciences, 630090 Novosibirsk, Russia
7
Department of Geology and Geophysics, Novosibirsk State University, 630090 Novosibirsk, Russia
*
Author to whom correspondence should be addressed.
Submission received: 28 February 2021 / Revised: 27 April 2021 / Accepted: 28 April 2021 / Published: 3 May 2021

Abstract

:
A significant part of the primary gold reserves in the world is contained in sulphide ores, many types of which are refractory in gold processing. The deposits of refractory sulphide ores will be the main potential source of gold production in the future. The refractory gold and silver in sulphide ores can be associated with micro- and nano-sized inclusions of Au and Ag minerals as well as isomorphous, adsorbed and other species of noble metals (NM) not thoroughly investigated. For gold and gold-bearing deposits of the Urals, distribution and forms of NM were studied in base metal sulphides by laser ablation-inductively coupled plasma mass spectrometry and by neutron activation analysis. Composition of arsenopyrite and As-pyrite, proper Au and Ag minerals were identified using electron probe microanalysis. The ratio of various forms of invisible gold—which includes nanoparticles and chemically bound gold—in sulphides is discussed. Observations were also performed on about 120 synthetic crystals of NM-doped sphalerite and greenockite. In VMS ores with increasing metamorphism, CAu and CAg in the major sulphides (sphalerite, chalcopyrite, pyrite) generally decrease. A portion of invisible gold also decreases—from ~65–85% to ~35–60% of the total Au. As a result of recrystallisation of ores, the invisible gold is enlarged and passes into the visible state as native gold, Au-Ag tellurides and sulphides. In the gold deposits of the Urals, the portion of invisible gold is usually <30% of the bulk Au.

1. Introduction

Considering the “visible” gold occurrence in gold deposits, it has long been noted that the association of native gold with sulphides is the most sustainable (e.g., [1,2]). However, gold invisible to optical methods also commonly associates with sulphides, notably pyrite [3,4,5]. The presence of invisible gold is established by chemical and assay analyses of bulk samples as well as by sensitive and relatively local LA-ICPMS analysis (e.g., [6,7,8]). Such invisible gold can be extracted from sulphides by repeated heating (up to 850 °C; cf. during metamorphism of sulphide ore [9]), resulting in enlargement of gold particles [3,10]. The mechanism of this process was unclear, and Bürg [11] introduced the concept of “self-cleaning of the crystal lattice” of pyrite.
The form in which gold occurs in sulphides of the Fe-As-S system, which are key minerals within the deposits of Au, Cu ± Au, Fe, Mo, U, Zn attracted enormous attention in the last quarter of the 20th century. From an experimental point of view, the limits of invisible gold in sulphides are defined over a wide temperature range [6,8,12,13,14,15,16,17,18]. It is also determined experimentally that sulphide heating, as an analogue of metamorphic transformation, leads to release of chemically bound gold from the crystal lattice of host minerals (such as pyrite, arsenopyrite) and to the formation of elemental microparticles (for example, see the review of the problem in [15] and also the experimental data review in [19]).
The behaviour of gold is most representatively characterised for high-temperature sulphide systems: gold-copper-porphyry and gold-copper (and Fe-Cu-Au, Fe-Au, subtypes) skarn deposits. Deposits of the copper–porphyry family represent some of the greatest gold concentrations in the Earth crust. In addition, these deposits are possibly the sources of gold for epithermal and other related deposits. Experimental data show that bornite and chalcopyrite, formed under high-temperature conditions (about 600–700 °C) typical for deep zones of copper–porphyry deposits, may contain about 1000 ppm of gold. Saturation of these minerals with gold, however, occurs only at much lower (200–300 °C) temperatures, corresponding to low-temperature minerlisation stages [20]. Thus, these deposits reveal a wide range of sulphides with different contents of gold, varying from its disseminated form to the larger “visible” native gold [20,21]. In addition, during the formation of these deposits, the processes of extraction and redistribution of gold and copper occur within immiscible sulphide melt and gas fluid at different levels (or alteration zones) of the unified systems, resulting in different Cu/Au ratios both in the gold-copper-porphyry and skarn systems.
In other high-temperature sulphide systems—magmatic (or orthomagmatic) ones—the behaviour of platinum-group elements (PGE) is important because of their high cost and scarcity on the global metal market. The authors partially summarised information about PGE in sulphides of magmatic and hydrothermal systems in papers (for pyrite [22] and pyrrhotite [23]). For hydrothermal deposits of the Urals, data were published in [24,25,26,27,28]. A much more complete review of the data is given in [29], devoted to magmatic sulphides.
In the ores of gold and gold-bearing deposits, Au occurs as: (1) own Au-Ag solid solution (rarer with Cu, Pd and Hg), i.e., native gold (with Ag content up to 50 wt% and fineness of 500–1000‰ in mole fractions Au1–0.35Ag0–0.65) and native silver (with an Ag content higher than 50 wt% and fineness of 0–500‰, in mole fractions Ag1–0.65Au0–0.35), compounds with Te or with other chalcogens (S, Se) and metalloids (As, Sb, Bi), and (2) the invisible (or fine dispersed) state. Invisible Au cannot be identified by conventional optical microscopes or scanning electronic techniques, being scattered in the host sulphides as nano-scale particles (“nanoparticles”) and/or in chemically bound state. Visible segregations of native gold (called “nuggets” when becoming millimetre-sized and larger) and as discrete Au minerals can be effectively extracted from the ore. In fairly common cases, where Au is present in invisible form, processing results in the loss of most gold to tailings. In many gold-bearing volcanogenic massive sulphide (VMS) deposits, the proportion of invisible gold can be very high. For example, in the Uchaly VMS deposit in the South Urals, it reaches 85% [15].
The mineral balance of the NM forms in ore sulphides is essential for evaluating the NM recovery, i.e., their output into technological products and concentrates and, as for Au, the possibility of its leaching by the cyanide solution (the most cheap and effective method for extraction of fine-grained gold).
In many cases, the direct correlation between the concentrations of As and invisible Au in hydrothermal pyrite is observed (e.g., [30]; see [15] for discussion). However, As-poor pyrites can also demonstrate high gold concentrations. For example, the colloform pyrites in the large Agua Rica Cu (+Mo, Au) porphyry deposit, Argentina, are As-poor (<30 ppm) but rich in Au (up to 6.7 ppm) and Ag (up to 136 ppm) ([31]). No correlation between Au and As in pyrite occurs in the ores of the shear-hosted gold-vein system of the Fairview mine, South Africa [32], VMS La Zarza, Migollas and Sotiel deposits, the Iberian Pyrite Belt [33], multistage sedimentary-metamorphic (orogenic) sediment-hosted Sukhoi Log gold deposit, South Siberia ([6]), “orogenic” gold deposits of the northern margin of the North China Craton, China [8], intrusion-related lode gold deposits of the Xiaoqinling–Dabie Orogenic Belt, China [34], and sediment-hosted (siltstone, shale and limestone) Qiuling gold deposit in the West Qinling orogenic belt, China ([35]). There is no correlation between As and Au in pyrites from most of the Au-bearing deposits of the Urals: the VMS deposits [15,36,37], the Novogodnee-Monto Fe-Au-skarn deposit [38], the Petropavlovsk gold-porphyry deposit [39,40] and the Svetlinsk Au-Te deposit [41,42]. Binary diagrams show the low correlation between Au and As for pyrite of the Zn-Pb-Se-Bi-Au-rich VMS Falun deposit, Sweden ([43]).
Understanding of the chemical state of Au in sulphide ores reached a new level when it became possible to study Au-bearing minerals synthesised at the contrasting TP conditions using different experimental techniques [13,44,45] and analytical methods [12,16,17,46,47,48,49,50,51,52]. The chemical state of Au in sulphides, i.e., its position in the host mineral structure, valence state and local atomic environment, can be determined using spectroscopic methods [19]. The spectroscopic studies of the sulphides rich in Au were performed using X-ray photoelectron spectroscopy (XPS, see [16,46,47] and references cited), Mössbauer spectroscopy [12,48,49] and X-ray absorption near-edge structure (XANES) spectroscopy [16,17,50,51,52].
The main problems preventing the determination of the chemical state of Au are: (1) relatively low concentrations of Au in natural sulphides, and hence the inability to use the mentioned physical (spectroscopic) methods for gold identification, and (2) limitations existing for the synthesis methods: (i) it is difficult to recreate the entire T/f S2 range of natural sulphide formation, (ii) the variability of the composition and thin zoning of sulphide grains with respect to the main components, especially for arsenopyrite and As-pyrite, and (iii) the presence of a large number of other trace elements in addition to gold in the natural sulphides, which partly calls into question the complete analogy of synthetic and natural mineral grains.
In comparison with other precious metals in hydrothermal deposits, gold is the most important, so it is the focus of this study. Gold is among the rarest elements in the Earth’s crust [53] and reserves of its largest deposits do not exceed first thousands of tons, however, the high economic and social-political significance of this metal requires sustainable reproduction and increase of gold natural resources. The increase in metal prices during the last 20 years favours the growth of gold supply and exploration in the world, but, taking into account an exhaustion of brown field resources and traditionally mined types of mineralisation, the further development of the resource base needs to be supported with new ideas based on a comprehensive level of knowledge. A forecasting geological model is one of the major requirements of successful exploration [54].
The purpose of this paper is to review the distribution and forms of NM in contrasting types of mineralisation on the example of one of the largest ore belts in the world. Distribution and structural-chemical state of Au and Ag in sulphides through the ore deposits from late-magmatic to low-temperature hydrothermal are considered as indicators of the conditions of mineralisation and metamorphism of ores (e.g., [9,15]). Thus, NM forms are regarded as one of the key aspects of the general model of the evolution of ore-forming systems related to fluid activity (from high- to low-temperature).
The research results contribute to fundamental knowledge on NM forms of occurrence in ores and minerals, and concentration levels of NM in sulphides. Our data can be useful in the analysis of the distribution of NM in the Earth’s crust and will add data into the experimental database to support the thermodynamic models. Moreover, the data obtained on the contents and forms of NM accumulation in base metal sulphides are an important practical result of the work. They will help to develop ore processing.
The present research is based on studies of NM distribution and speciation in gold and gold-bearing deposits of the Urals. The gold deposits include Au-sulphide-quartz (mesothermal intrusion-related, “traditional” type for the Urals) Berezovsk, Au-telluride mesothermal Svetlinsk and Au-sulphide-realgar Carlin-style Vorontsovka (both are large but are seen as unconventional for the Urals types [55]) (Table 1). Other types include VMS deposits (Cu-dominated Gai and Zn-dominated Uchaly, Uzelga, Galka) and the skarn-porphyry family (Novogodnee-Monto Au-magnetite-skarn and Petropavlovsk Au-porphyry deposits). The mentioned gold and gold-bearing deposits together provide about 95% of the production of Au of the Urals. The paper proposes an application of the modern achievements in the field of the analytical techniques for advancing the theoretical basis of the NM behaviour in hydrothermal ore mineralising systems with emphasises on economically significant genetic types of ore deposits.

2. Geological Framework

The Urals is the largest single ore belt in the world, and it contains 5.0 Bt non-ferrous metal ore (80 Mt of Cu + Zn), 4,900 t Au and 41,000 t Ag reserves in endogenous ore deposits. The bulk of Uralian gold is produced from sulphide ores containing large gold deposits (Berezovsk, Kochkar, Svetlinsk, etc., [55]) and giant Cu-Zn-Au-Ag VMS deposits [56,57], with reserves of 50–500 t Au for each deposit of both types. Most gold-bearing (VMS, etc.) deposits and some gold deposits are located on the eastern slope of the Urals (Figure 1), within the Main Greenstone Belt of the Urals—the Tagil-Magnitogorsk synclinorium zone [56,58,59]. Major large gold deposits occur inside of the East Uralian anticlinorium zone [55,60].
The Urals is the oldest (275 years, from 1745) gold-mining province of Russia [55]. The four largest gold deposits and nine gold-bearing deposits of the Urals contribute about 45% (2220 t Au) of proven gold reserves, adding to the past production of this province (4900 t Au).

2.1. Gold Deposits

The objects of this study are the large gold deposits of different genetic types [59]: Vorontsovka (Au-As-Sb-Hg-Tl, Carlin-style), Berezovsk (Au, mesothermal intrusion-related), Svetlinsk (Au-telluride mesothermal) and Petropavlovsk (Au-porphyry) (Table 1 and Table 2). The Vorontsovka deposit (101 t Au) is located in the Tagil zone, while the Berezovsk (~490 t Au) and Svetlinsk (~135 t Au) deposits are located in the East Uralian zone (Figure 1).
Specific features of the Vorontsovka deposit [62,63] are as follows: thinly disseminated sulphide mineralisation in carbonate-clastic sequence; quartz-sericite, argillic (clay-quartz-carbonate) and jasperoid types of alteration; abundance of As and Fe sulphides (pyrite, arsenopyrite, realgar); correlation of Au (r > 0.5) with Ag, As, Hg, Co, Ni, Pb and Ba in the ores; geochemical types of mineralisation: As-Hg-Tl-Sb (the early stage) and Ag-Pb-Zn-Cu-Sb (the late stage); Au/Ag ratio ≥ 1 in ore. Our genetic model for the Vorontsovka gold deposit suggests that the gold mineralisation is coeval with the formation of the Auerbakh volcano-plutonic complex. Low-sulphide gold-bearing assemblages were deposited at lower temperatures on the periphery of the skarn zones (Table 1 and Table 3).
Quartz-sulphide veins of the Berezovsk deposit (about 55% of total gold reserves) contain 90–95 vol% of quartz, 5–10 vol% of sulphides and average 18–20 g/t Au [64]. Impregnated sulphide ores—hydrothermal-altered granitoid dykes (“beresite”)—contain 1–2 vol% of pyrite and 0.1–5 g/t Au (commonly 0.2–1.3 g/t) (Table 1 and Table 2).
The Svetlinsk deposit is represented by the system of sulphide-quartz veins, veinlets and large lens-shaped vein-disseminated zones of quartz-pyrite (± pyrrhotite) mineralisation. The deposit is located within the strongly metamorphosed (up to amphibolitic facies) volcano-sedimentary series: metabasite, terrigenous/volcaniclastic sediments and marble (D-C). The average gold content is not high (2–3 g/t). Native gold in sulphide-quartz veins is closely associated with tellurides [65,66].
The Petropavlovsk deposit is located in the Silurian-Devonian island-arc volcanic complexes of the Polar Urals [40]. It tends to the apical part of a large polyphase (with dominating diorite) pluton and is closely related to porphyritic diorite. The ore body is a large isometric stockwork composed of gold-sulphide (low-sulphide) stringer-disseminated ore associated with albitisation zones, intersected by moderately Au-rich, late quartz veins [39,40]. Gold, finely dispersed in pyrite (<0.1 mm), predominates in the ore bodies and is associated with Ag, W, Mo, Cu, As, Te and Bi in geochemical haloes. The Novogodnee-Monto iron-gold-skarn deposit (7 t by-product Au reserves) is located on the east flank of the Petropavlovsk deposit, 0.5 km away. They both probably represent a single ore-magmatic system of porphyry type [40], and their features are compiled in Table 1, Table 2 and Table 4.

2.2. VMS Deposits

VMS deposits of the Urals began to play a major role in its gold industry in the middle of the 20th Century. The VMS deposits belong to Uralian (or Cu-Zn-pyritic) type (the major one for the Urals), which can be divided into two subtypes: Cu>>Zn and Zn>>Cu, and two minor types: copper (Dombarovsk type) and gold-barite-copper-zinc or Au-polymetallic (Baimak type). Among the Uralian type, ten deposits contain >100 t Au and/or >1000 t Ag—the largest, Gai, Uchaly, Novo-Uchaly and Uzelga, together amount to 1000 t Au and ~13,200 t Ag [57,67,68]. According to the modern genetic model, the formation of these deposits was related to a shallow chamber of acidic magma formed as a result of the differentiation of mantle-derived basalt [69,70].
The study of modes in which gold occurs in sulphides (including invisible gold) covers two large, slightly metamorphosed volcanogenic massive sulphide deposits: Uchaly and Uzelga, as well as the giant intensively deformed Gai VMS deposit (Figure 1, Figure 2 and Figure 3; Table 1 and Table 5). Massive sulphide ores predominate in these deposits with a subordinate contribution of disseminated ores (commonly 5–15 vol%). Au and Ag are relatively uniformly distributed in massive sulphide ores (av. values are 0.5–1.5 g/t Au, 5–50 g/t Ag), but local enrichment occurs (up to 10–90 g/t Au and up to 1000–3000 g/t Ag). The specific feature of Uchaly and Uzelga deposits (Zn-dominated subtype) is the uplifted levels of Au, Ag, Pb, Se, Te, Sb, As, Sn and Cd comparing to most of the other VMS districts of the Urals [71,72].
During 60 years, two hundred million tonnes of ore have been mined from the Gai deposit (Cu-dominated subtype), and ~45% of initial reserves contained about 10 million tonnes of non-ferrous metals (Cu:Pb:Zn = 1:0.03:0.49), 520 t Au and 6300 t Ag (Au/Ag = 0.08). The annual output of the underground mine reached 5 Mt of Cu and Cu-Zn ore (>70 Kt Cu) [9,73,74]. The deposit consists of a package of steeply dipping sheet-like bodies, from 40 up to 1300 m down the dip, with a thickness of the large lodes up to 150 m in bulges. Together, the ore bodies comprise a lineal mineral zone (thickness ~300 m, up to 800 m). The ore zone extends for 3.7 km along the strike and more than 1.7 km down the dip, remaining not contoured at a depth. The deposit was affected by regional metamorphism (greenschist facies), strike-slip deformations and folding. Therefore, ore structures and textures observed are mostly epigenetic (e.g., [9,74,75]). Massive, breccia-like, impregnated and stringer-impregnated structures are dominant. Gneissose, foliated and banded structures often occur in the outer parts of massive sulphide lodes and are found within narrow zones controlled by later steeply dipping normal and strike-slip faults [57,74].
The Uchaly deposit also demonstrates one of the largest potentials if the Novo-Uchaly deposit located directly to the south of the Uchaly deposit is considered as its separate ore body. Therefore, the total reserves of metals contained in the two ore bodies—the northern one, Uchaly, and the southern one, Novo-Uchaly—will amount to 9.96 million tonnes Cu + Pb + Zn, with Cu:Pb:Zn = 1:0.17:3.12, 344 t Au and 4381 t Ag (Au/Ag = 0.08) [15,36,76]. The Uchaly lode comprises a single subvertical thick (up to 180 m in bulges) lens of solid Cu–Zn ore, approximately 1.2 km in the lateral direction and 1.3 km along the dip. The Novo-Uchaly lode (1250 m × 900 m) reaches 186 m thick and comprises a steeply dipping VMS lens, crumpled into an anticlinal fold. The deposit was affected by regional metamorphism (subgreenschist facies). The ore body reveals complex lenticular contours complicated by pinch and swell areas. The primary ores—brecciated and rhythmically foliated—are preserved only as relics. Gneissose and folded varieties of ore occur along the contacts of the ore body and in zones of postmineral faults.
The total reserves of the Uzelga deposit range 81 million tonnes of ore, containing 3.43 million tonnes Cu + Pb + Zn (Cu:Pb:Zn = 1:0.22:1.90), 137 t Au and 2495 t Ag (Au/Ag = 0.05) [9,67,68]. Paleovolcanic structures are mostly gentle and weakly deformed [69,76]. Bodies of VMS solid ores occur at two hypsometric levels, 130–380 m from day surface (body Nos. 1, 5, 6, 9) and 420–640 m (body Nos. 2–4, 7, 8), with ~300 m between the levels [25,77]. Ore bodies are represented by thick lenses, sometimes by irregular ellipsoidal and isometric ones with obtuse terminations (ore body 4) or ball-shaped ones (ore body 3). Ores are commonly slightly recrystallised: cryptograined and hypidiomorphic-granular textures predominate in ores [78,79]. There are spherolitic and radial fabrics in kidney aggregates. Rhythmic zonality of pyrite is often marked by bands or fine inclusions of chalcopyrite, sphalerite, tennantite, tetrahedrite or a member of the tetrahedrite-tennantite series (further “fahlore”). Cataclastic texture often occurs in pyrite grains. Framboidal, metaglobular pyrite is sometimes found.
The Galka deposit is small (Table 5) and comprises gentle VMS lenses (max. 2000 m × 350 m; thickness up to 30 m) of veinlet-impregnated Au–pyrite–polymetal ores [80,81]. Locally semi-massive and massive sulphide ore forms thin (up to 1 m) lenses in interlayers of carboniferous fineclastic sedimentary rocks. The abundant veinlet-impregnated ores are hosted by argillic (illite/smectite–sericite–quartz and kaolinite) alteration, formed after cement of rhyodacitic breccia [82]. The ores are almost unaffected by any metamorphism, so colloform structures, and fine-grained textures of ores, are widespread, and sulphides carry a high proportion of invisible gold [15].
During processing, most of the total amount of trace elements is not extracted (Au, Ag, Pt, Pd, Pb, Se, Te, Sb, As, Bi, Sn, Co, Ni and Hg), and many of them (Pb, Se, Te, Sb, As, Co, Ni and Hg) become pollutants (together with sulphur dioxide and Fe) [72,83]. The increasing volume of processed VMS ores has aggravated the problem of gold recovery: while copper and zinc are taken in concentrates almost completely (75–85%), integrated gold recovery into the copper and zinc concentrates ranges from 20% (Uchaly) up to 50% (Gai). The loss of gold into the pyritic concentrate and tailings exceeds 15 tonnes (up to 20 t) annually, which is three times more than Au recovery from massive sulphide ores of the Urals. Therefore, tailing dumps of ore-processing plants can be compared with large gold deposits: for example, the Gai (110 t Au in the tailing dump) and Uchaly (90 t Au) concentrating mills.
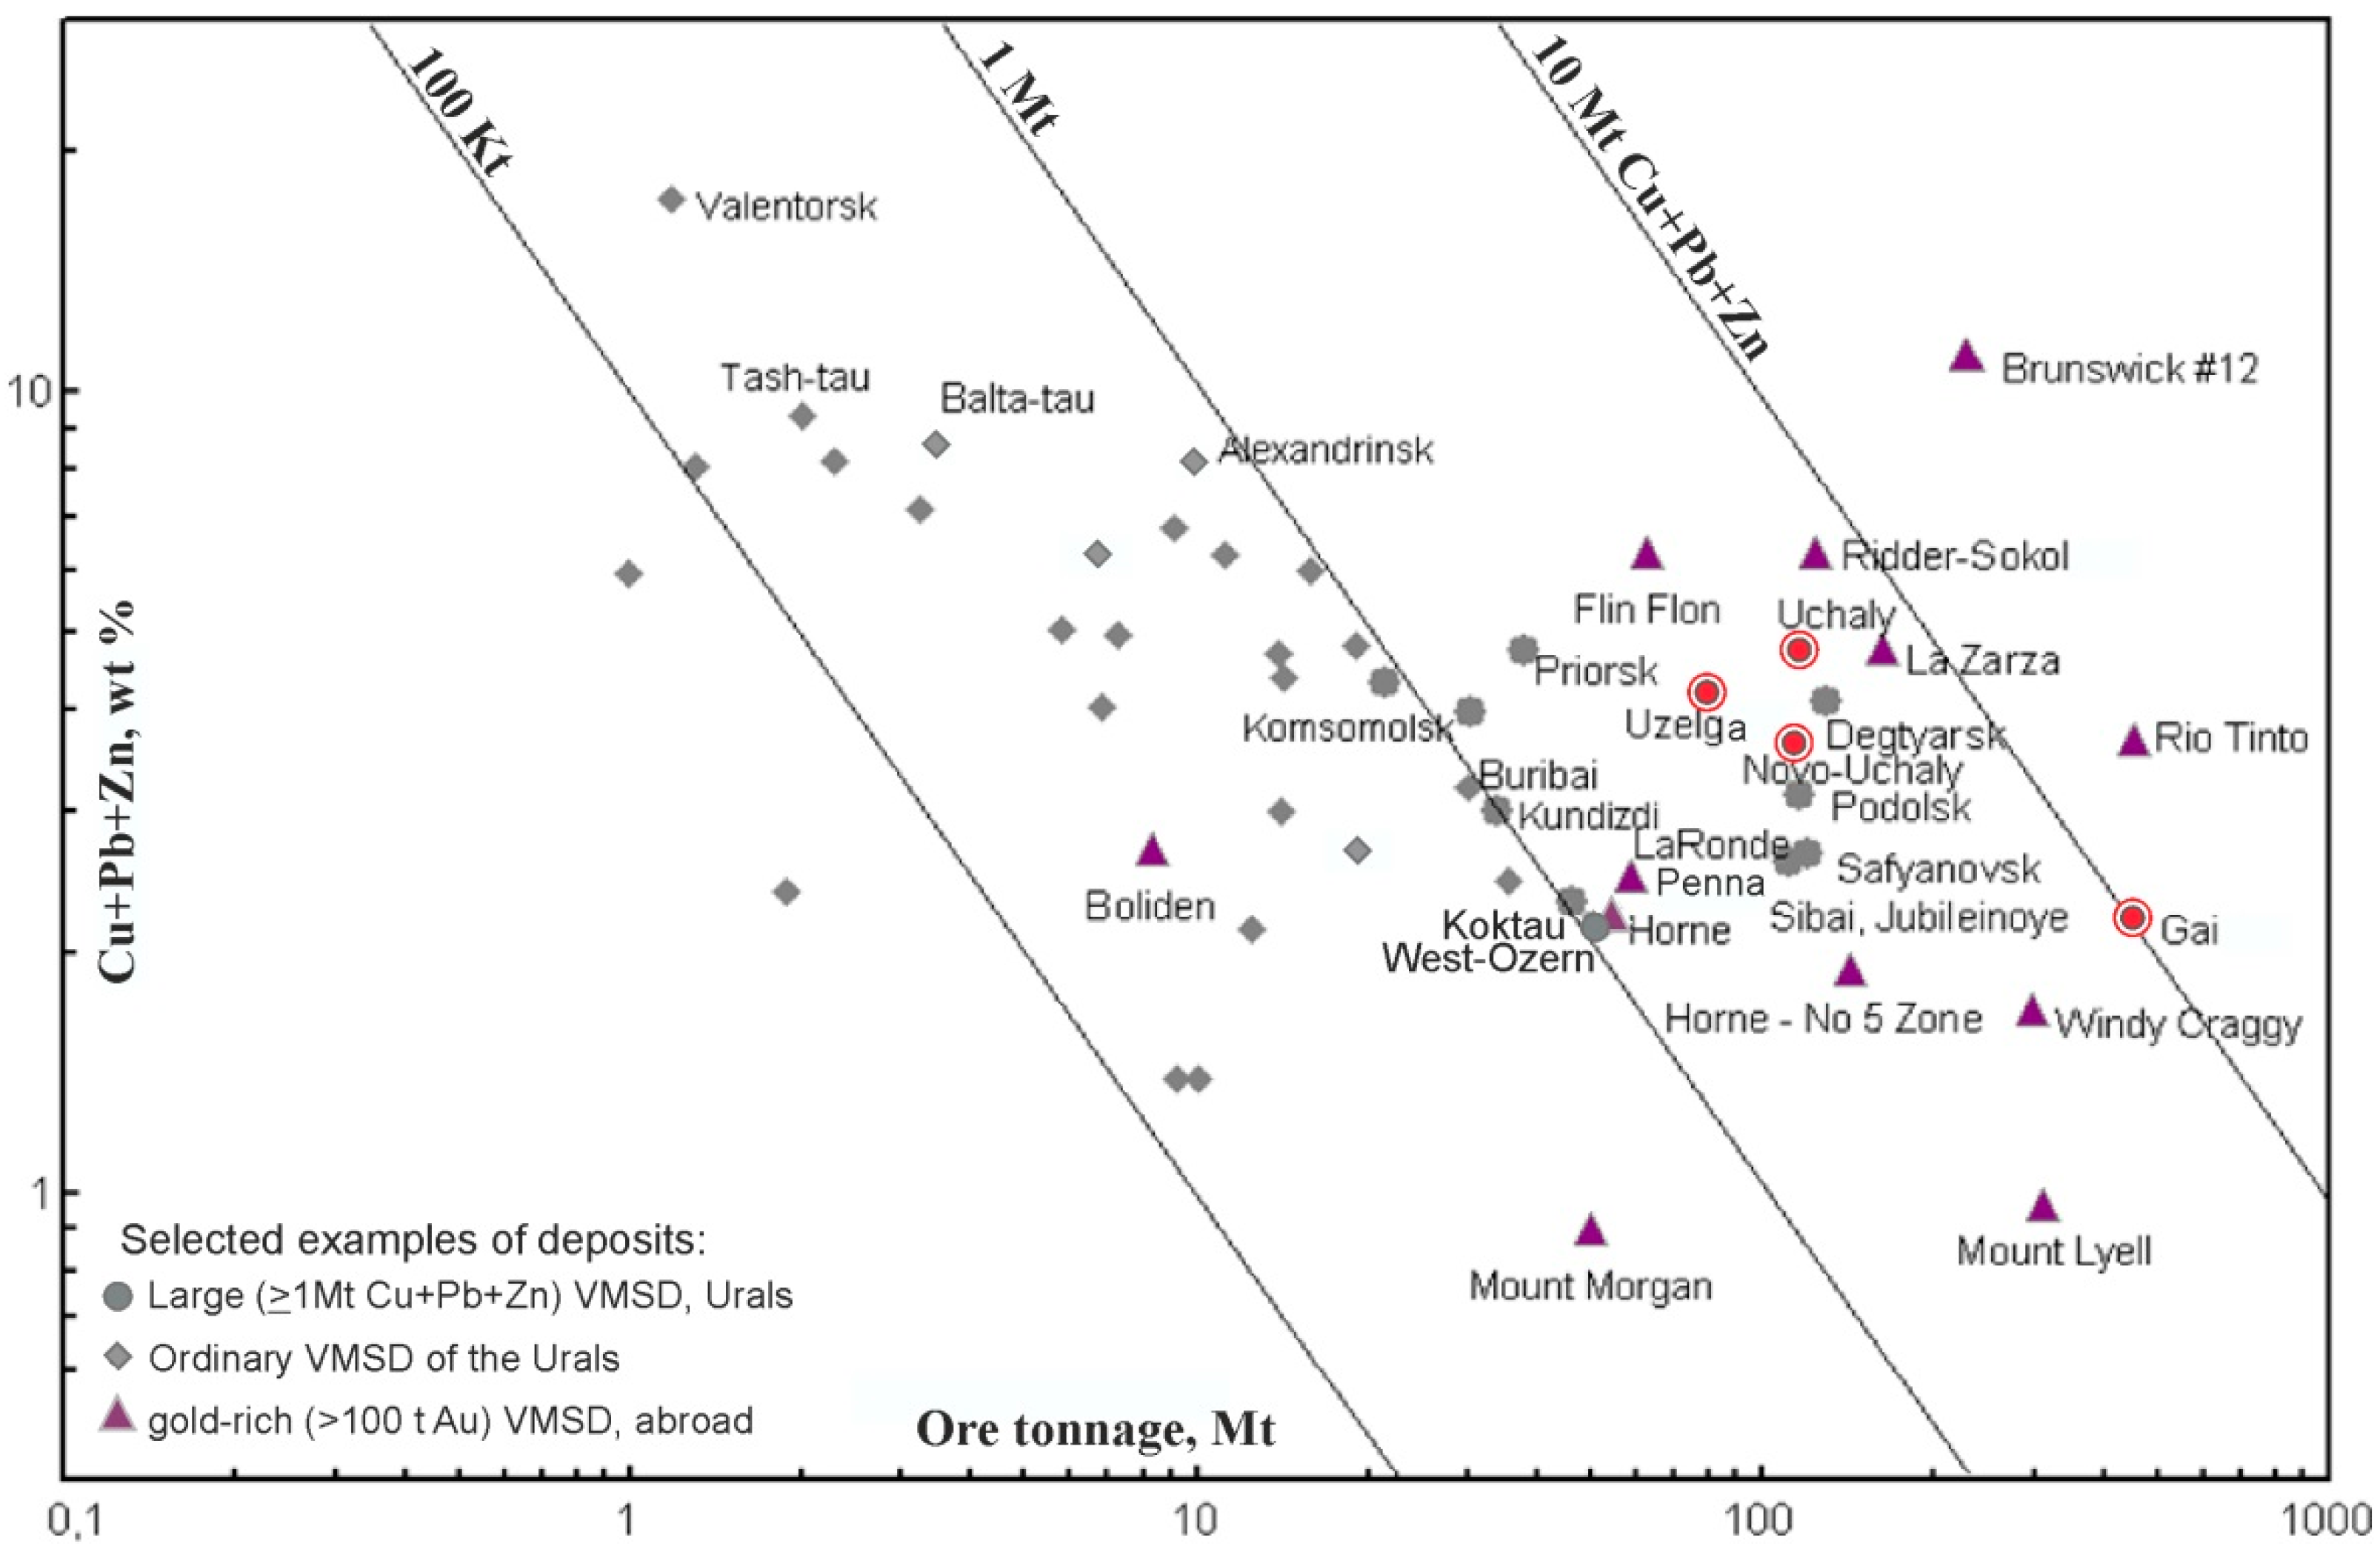
Figure 2. Parameters of VMS deposits of the Urals in terms of ore and base metal tonnage and their comparison with large, Au-rich VMS deposits of the world (>100 t Au); red circles—deposits under consideration. Parameters for other deposits were selected from the review in [84].
Minerals 11 00488 g002
Figure 3. Parameters of VMS deposits of the Urals, in terms of ore and gold tonnage, and their comparison with major Au-bearing VMS deposits of the world; red circles with a red ring—deposits under consideration. Design and parameters for other deposits were adapted from the review in [84].
Minerals 11 00488 g003

3. Materials and Methods

The study was based on mapping and sampling of drill core and open pits. Collections of ores include 100–300 samples for each deposit, and 150–500 polished sections were studied for each deposit. Mineralogical observations, electron probe microanalyses (EPMA) and a study using the scanning electron microscope (SEM) with an EDS were carried out for polished sections as well as for sulphide and heavy concentrates prepared from ores and, in some cases, from tailings. Manually selected sulphide monomineral fractions and sulphides from heavy concentrates by separating dozens of samples for each deposit were studied.
EPMA: The analyses were performed in IGEM RAS on the JXA-8200 Jeol, JEOL Ltd., Tokyo, Japan, electron microprobe equipped with five WD spectrometers and one ED spectrometer. The major constituents were determined at an accelerating voltage of 20 kV, current intensity on the Faraday cup of 20 nA, 10 s counting time and beam diameter of 1 μm. Conditions of analysis are provided in Appendix A Table A1. The AuMα line was chosen for Au analysis in arsenopyrite and pyrite (with 100–200 s counting time for PGE and Au) because it was established that the signal/background ratio of M series lines is better than that of L series lines [18]. These operating conditions and correctly selected background points made it possible to decrease the detection limit (3σ) down to 45 ppm for line AuMα.
SEM/EDS: The JSM-5610LV electron microscope (JEOL Ltd., Tokyo, Japan) equipped with an X-Max 100 energy dispersive spectrometer (IGEM RAS) was used for the studies.
INAA: For instrumental neutron activation analysis, sulphide separates of 20 to 50 mg weight were handpicked under a binocular microscope. The purity of separation was tested with the help of the X-ray powder diffraction technique. The fraction of a sulphide examined in a sample analysed was more than 90%. The grains of sulphides selected for analysis were sealed in polyethylene film. For activation, the polyethylene packages were wrapped in filter paper and aluminium foil. Samples, standardised by the State Geological Survey of the USSR (State Standard Samples 3593–86; 3594; 3595; RUS 1 ÷ 4) and the United States (USGS: BHVO-1; Mag-1; QLO-1; RGM-1, SCo-1, SDC-1, SGR-1), were prepared for irradiation in the same manner. The samples were activated for 15 to 17 h in the IRT reactor at the Moscow Engineering Physical Institute with a neutron flux of 1 × 10¹³ s cm−2. Measurements of induced activity were carried out in IGEM RAS with a gamma spectrometer: the analyser was the 919+GEM45190 ORTEC (AMETEK ORTEC, Oak Ridge, TN, USA)(HPGe coaxial detector; the range of energy measured was from 100 to 1800 KeV, with a resolution of 1.8 KeV at the line of 1332 KeV). The nuclide and the gamma line used for the analyses (KeV) were: 198Au (412), 122Sb (564), 124Sb (602 and 1691), 60Co (1332), 76As (559), 110MAg (657), 59Fe (1099), 65Zn (1115), 115Cd (336 and 528). The measurements were conducted in two stages: in 7 to 10 days after activation, As, Cd and Au concentration were detected, and in 25 to 30 days after activation, Fe, Co, Zn, Ag and Sb were analysed (see details in [12]). INAA examined the contents of NM, base metals and some rare elements in the bulk samples, ultra-heavy concentrates and hand-made mineral concentrates.
LA-ICPMS: The high-sensitivity mass-spectrometer laser ablation method (LA-ICPMS, ThermoXSeries, NewWave 213 device, AMETEK, Berwyn, PA, USA) was chosen as a key analytical method for trace element analysis of sulphides, including determination of noble metals [39]. Primary determination of major components was carried out on EPMA. For the LA-ICPMS method, sulphide reference material MASS-1 [85] was used as an external calibration standard together with in-house pyrrhotite-based standard Fe0.9S (20 ppm PGE, gold and silver, synthesised at IGEM RAS using the method from [86]) and calibrated in the LabMaTer at the Université du Québec à Chicoutimi (Chicoutimi, QC, Canada) for to the concentration of Au against a standard prepared by J.H.G. Laflamme. The analysis of sulphide grains was realised using spot and profile ablation. The diameter of the laser beam was 30–60 μm. The laser pulse frequency was 10 Hz, and the energy at the sample surface was 7–8 J/cm2. The detection limit for most elements was 0.02–0.05 ppm. Investigations were carried out in IGEM RAS, and a part of LA-ICPMS control analyses was also done in the LabMaTer at the Université du Québec à Chicoutimi. We used the thermochemical method to determine the ionic form of gold according to [87,88,89].
To study the form of invisible Au in sulphides, we and our colleagues synthesised the Au-bearing chalcogenides using different methods (hydrothermal and gas transport methods and salt flux technique [44,45,90]) at contrasting T/f S2 conditions and addressed the Au local environment using XAS [16,91,92]. High Au, Pt, Pd and other metals’ contents intentionally introduced into the synthetic phases allowed using the spectroscopic methods to determine the structural-chemical state of the NM in sulphides using first-principles quantum chemical calculations and Bader charge analysis (e.g., [19]).
The microanalyses of natural sulphides for all deposits under consideration were accompanied by studies on conditions of ore formation based on fluid inclusion data and mineral geothermometry, and they are partly implied but not discussed in detail in this paper. The regime of volatiles was also briefly discussed.

4. Noble Metal Distribution and Speciations

4.1. Gold Deposits

4.1.1. The Vorontsovka Gold Deposit

The Vorontsovka deposit is mainly comprised of vein-disseminated zones with rare gold-quartz veinlets. Ore contains pyrite, arsenopyrite, chalcopyrite, sphalerite, galena, hessite Ag2Te, coloradoite HgTe, alabandine MnS, native gold (fineness 910–998 for early and 680–690 for late generations) (Table 6; Figure 4) and various As-Sb mineralisation: native As, realgar AsS, orpiment As2S3, tennantite, tennantite-tetrahedrite, aktashite Cu6Hg3As4S12, cinnabar HgS, alabandine MnS, clerite MnSb2S4, routhierite TlHgAsS3, pierrotite Tl2(Sb,As)10S17, stibnite Sb2S3, zinkenite Pb9Sb22S42, chalcostibite CuSbS2, boulangerite Pb5Sb4S11, jamesonite Pb4FeSb6S14, bournonite PbCuSbS3, plagionite Pb5Sb8S17 and geocronite Pb14(Sb,As)6S23 [63]. There are four groups of mineral assemblages in the ore bodies. The later assemblages often overprint the early ones: (1) VMS-like (with low Au content), (2) gold-pyrite-arsenopyrite (gold fineness 910–998), (3) magnetite and epidote-garnet skarn and skarnoid (with low gold content) and (4) gold-pyrite-realgar (gold fineness 680–690) [63].
Invisible gold in arsenopyrite and As-pyrite: The study of gold modes in arsenopyrite is particularly important and relevant. This mineral is widespread in the dominant—in terms of gold reserves—black-shale-hosted gold deposits. This particular mineral demonstrates peak concentrations of invisible gold, as well as a exceptionally high resistance to endogenous and exogenous epigenetic processes. Simultaneously, arsenopyrite is “refractory” in hydrometallurgy processing ([51]; cf., [94]). One of the most relevant for the study of invisible gold is the Carlin deposit type [7,50,51,95,96,97], where gold-bearing arsenopyrite is the predominant host mineral for gold in the ore (i.e., Au-concentrator, along with As-pyrite) with up to sub-wt% level of Au content. In this paper, we conducted a comparative study of the distribution of gold in ‘Carlin’ and ‘pre-Carlin’ arsenopyrites on the example of the Vorontsovka gold deposit in the Urals [18,63,80] (Figure 5). Studied arsenopyrite-bearing mineral assemblages were crystallised at the contrast TPX conditions (Table 3).
With more detail, we studied arsenopyrite from the arsenopyrite-sulphosalt-polymetallic assemblage of the skarn group (Apy-1) and arsenopyrite from the later As-löllingite-arsenopyrite assemblage (Apy-2) by INAA and EPMA [80]. Moreover, As-rich arsenopyrite (Apy-2) grows orthogonally on the elongated prismatic relics of the S-rich arsenopyrite (Apy-1) that appears to be the earlier arsenopyrite from the previous mineralisation stage (Figure 5d).
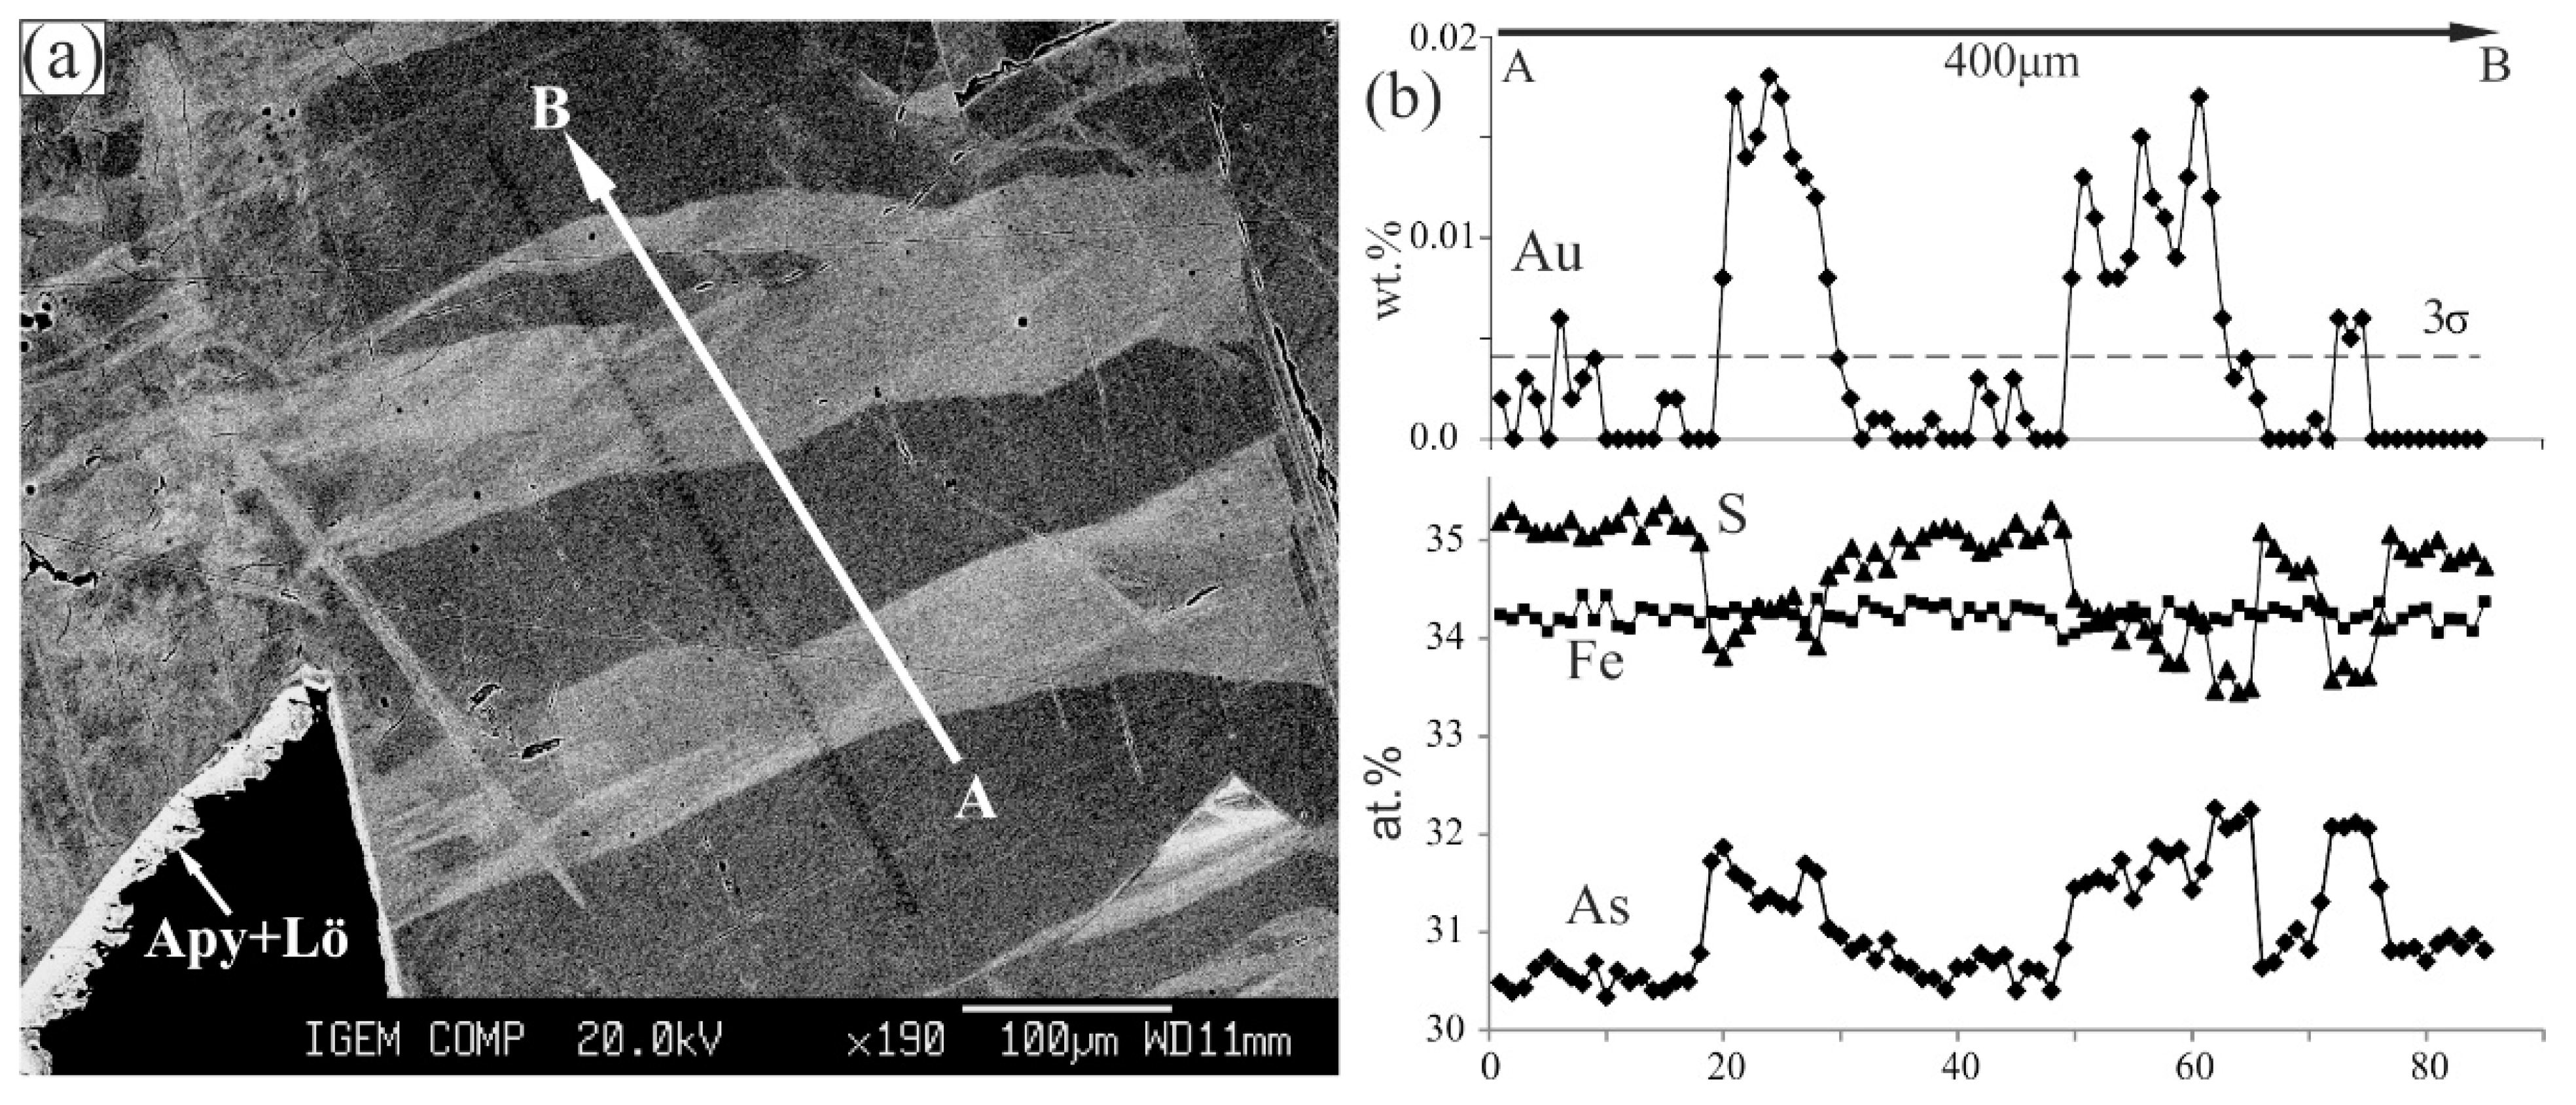
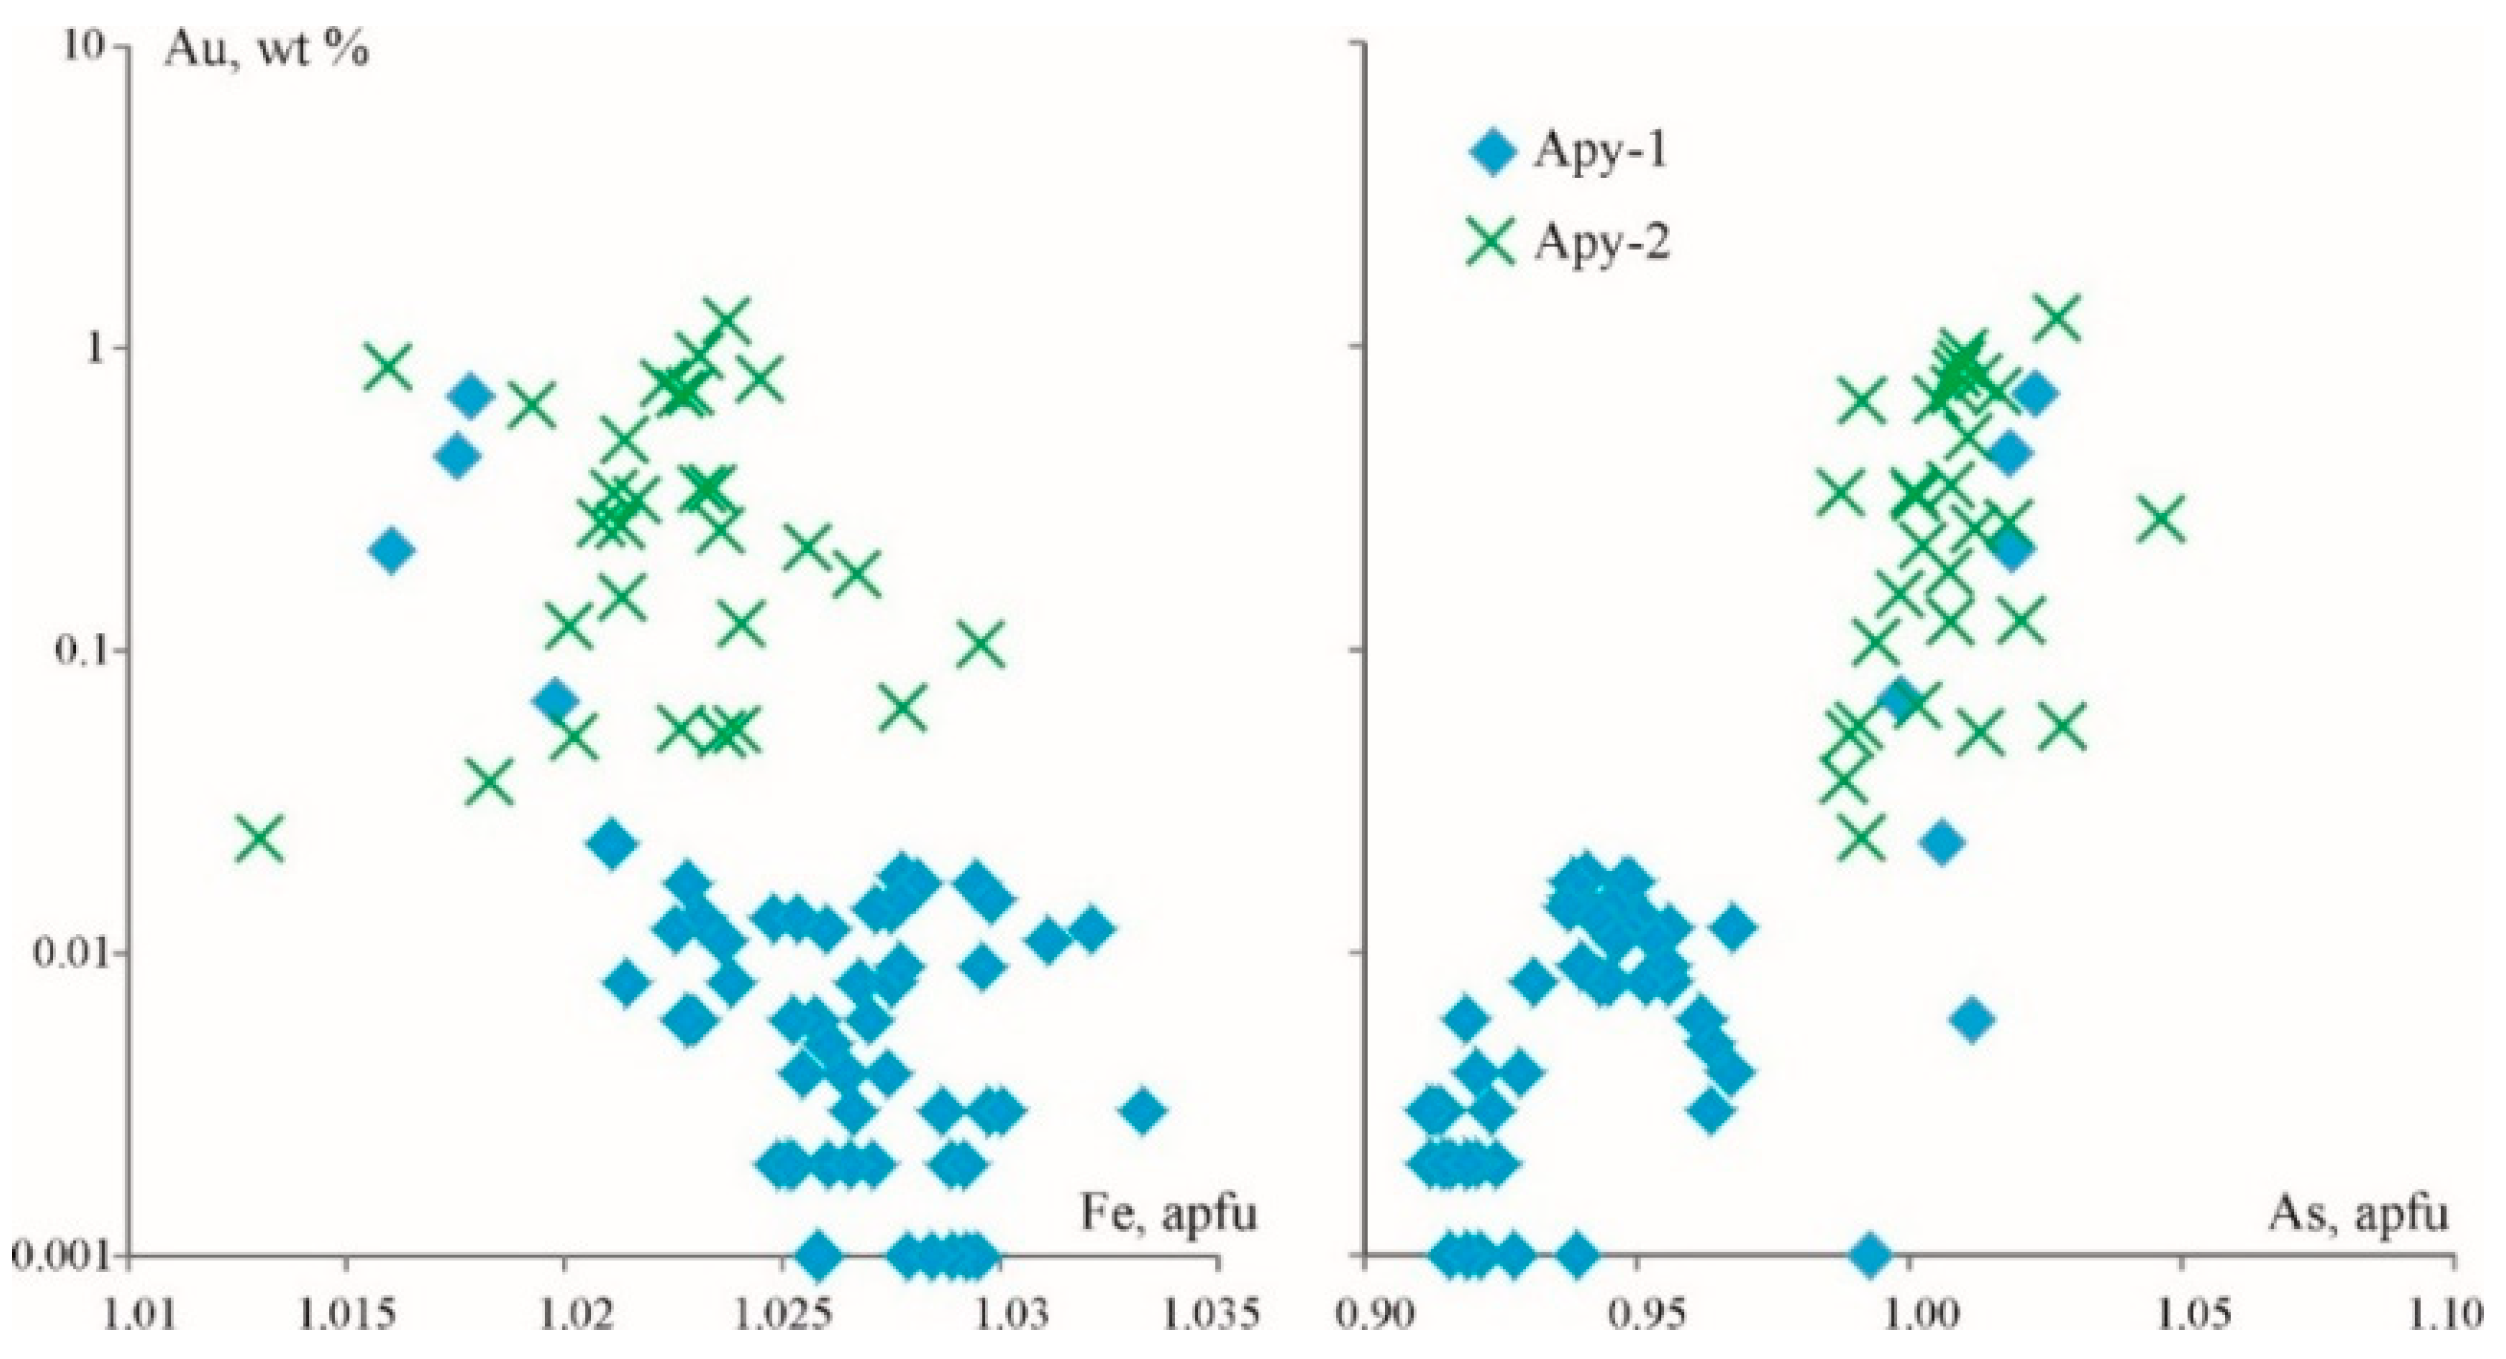
Both arsenopyrite generations are characterised by zonal structure (Figure 5, Figure 6, Figure 7 and Figure 8). Apy-1 contains ~28.9 at% As and As/S is 0.89 ± 0.04, while CAu varies from the detection limit to 0.25 wt%. CAu increases to 170 ppm in the lighter zones of the S-rich arsenopyrite (Figure 7). In contrast, the outer high-arsenic rim of this arsenopyrite crystal (the lightest in BSE zones on the Figure 7a,b) contains no gold (Au < 45 ppm, EPMA).
Apy-2 has the average ratio As/S = 1.04 ± 0.03, and the Au content in Apy-2 varies from the detection limit to 1.23 wt% (Figure 8). The average gold content is 5–6 ppm. Typomorphic impurities for this arsenopyrite are Te (up to 1.2 wt%, mainly 400–500 ppm) and Tl (up to 43 ppm), and the Au content fluctuations correlate with the thallium variations. Gold distribution in the late arsenopyrite demonstrates a absence of positive Au–As correlation (Figure 8).
Early ore assemblages of the Vorontsovka gold deposit were formed at 510–240 °C (including magnetite skarn and later arsenopyrite-sulphosalt-polymetallic assemblage), whereas late Carlin-style gold-(Fe, As, Hg)-sulphide-quartz mineralisation was deposited at decreasing temperatures from ~350 to 100 °C [63,80,98]. In general, crystallisation of the arsenopyrite-bearing mineral assemblages occurs as temperature and, especially, f S2 (from 10-7 to 10-17) decrease [63,80].
According to INAA data, pyrite from the sample Vr10–17 of the gold-skarn ore of the Vorontsovka deposit contains: As 4.3 wt%, Co 215 ppm, Sb 259 ppm, Ag 104 ppm and Au 2777 ppm. In this sample, a precision study of the relationship between the contents of Au and the main components of pyrite was performed by the EPMA method under conditions similar to those described in [18]. The correlation coefficient of As and Au in the pyrite crystal is 0.91 (N = 143). Figure 9 clearly shows two groups of impurity contents in the pyrite: one group has low As contents and close to Au detection limit (≤0.004 wt%). In contrast, the second group ranges from ~2 wt% As and with increasing its concentration, the Au impurity increases linearly to 0.036 wt%.

4.1.2. The Berezovsk Gold Deposit

The dominant opaque minerals commonly filling the fractures in quartz are pyrite, tetrahedrite, aikinite, galena and chalcopyrite. The sulphide contents range from 2 to 10 vol%. Major Au mineral is native gold (Table 3; Figure 4), bearing 85–100 wt% of its total balance. Early dust-like (<10 μm) gold-I grains are included in pyrite, and gold fineness ranges 863–984. The size of later gold-II grains is larger (commonly 0.05–0.5 mm, up to 1 mm, and rarely more). Gold fineness ranges 729–904 [64]. The contents of Au and Ag in sulphides are as follows: pyrite 0.18–73.5 ppm Au and <0.2–92 ppm Ag; galena 0.15–2.96 ppm Au, 0.1–2.51 ppm Ag, INAA; pyrite 0.01–21.8 ppm Au and galena 0.05–0.3 ppm Au, LA-ICPMS; chalcopyrite 0.06–0.32 wt% Au, 0.07–0.18 wt% Ag, EPMA.
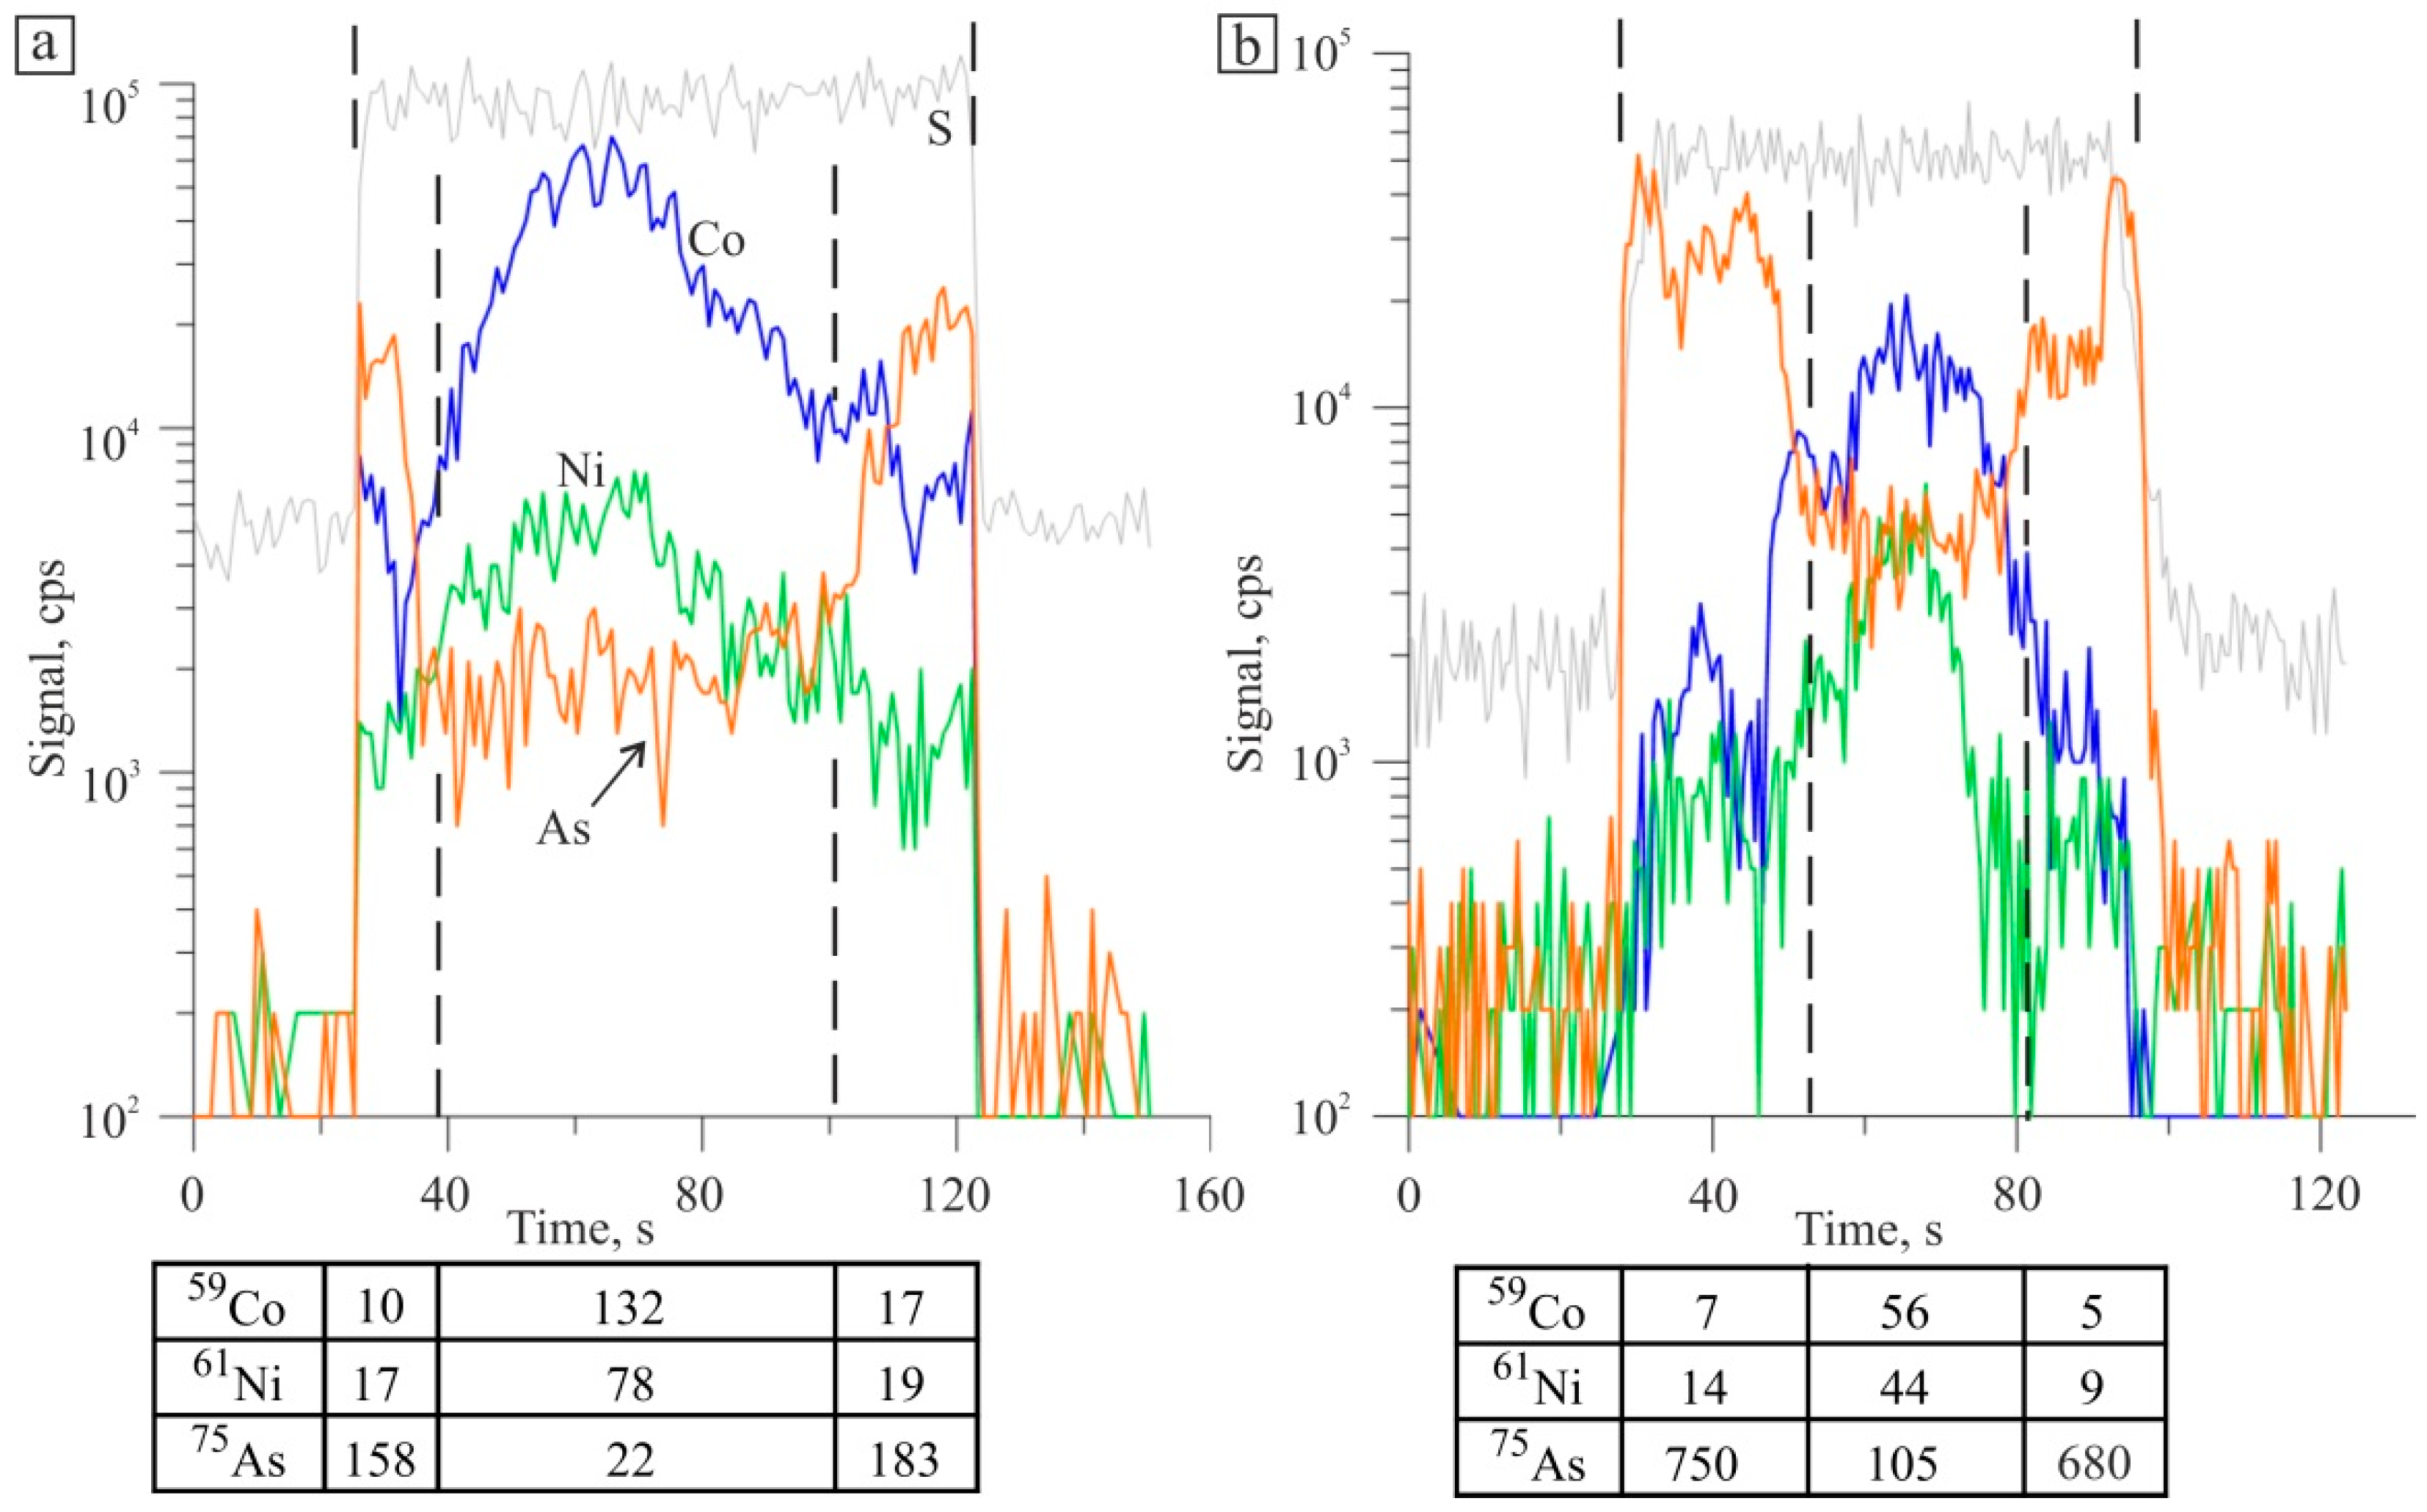
In most pyrite crystals, the main impurity elements are Co (0.09–4180; geometric mean (geom. mean) 16 ppm), Ni (1.2–244; geom. mean 21 ppm) and As (14–1486; geom. mean 388 ppm), and their distribution is zonal with an increase in the amount of Co and Ni and a decrease of As from the margin to the centre of the grain (Figure 10). Less common impurities are: Cu (1–560; geom. mean 14 ppm), Zn (0.5–113; geom. mean 4.3 ppm), Pb (0.1–1090; geom. mean 2.4 ppm) and Bi (0.01–84; geom. mean 0.3 ppm). Rare impurities are Mn (0.7–14 ppm), Ga (0.06–0.2 ppm), Ge (0.3–1.2 ppm), Ag (0.03–40 ppm), Cd (0.01–1.8 ppm), Sn (0.05–0.7 ppm), Sb (0.03–15 ppm), Te (0.5–10 ppm) and Hg (0.4–6 ppm). In this pyrite, CAu ranges 0.08–0.1 ppm and Au occurs as single peaks of the Ag-Pb-Cu-Sb group.
Au-bearing pyrite (CAu varies from 1 to 22 ppm) was found in two adjacent ladder veins of the Pervopavlovsk dyke [99]. An inhomogeneity was revealed in the pyrite (Figure 11a,c) in the form of irregular dark areas on the BSE images, in which small (from less than 1 to 10 × 1 microns) inclusions of bright (in reflected electrons) Sn-containing mineral phases, presumably stannite, were detected.
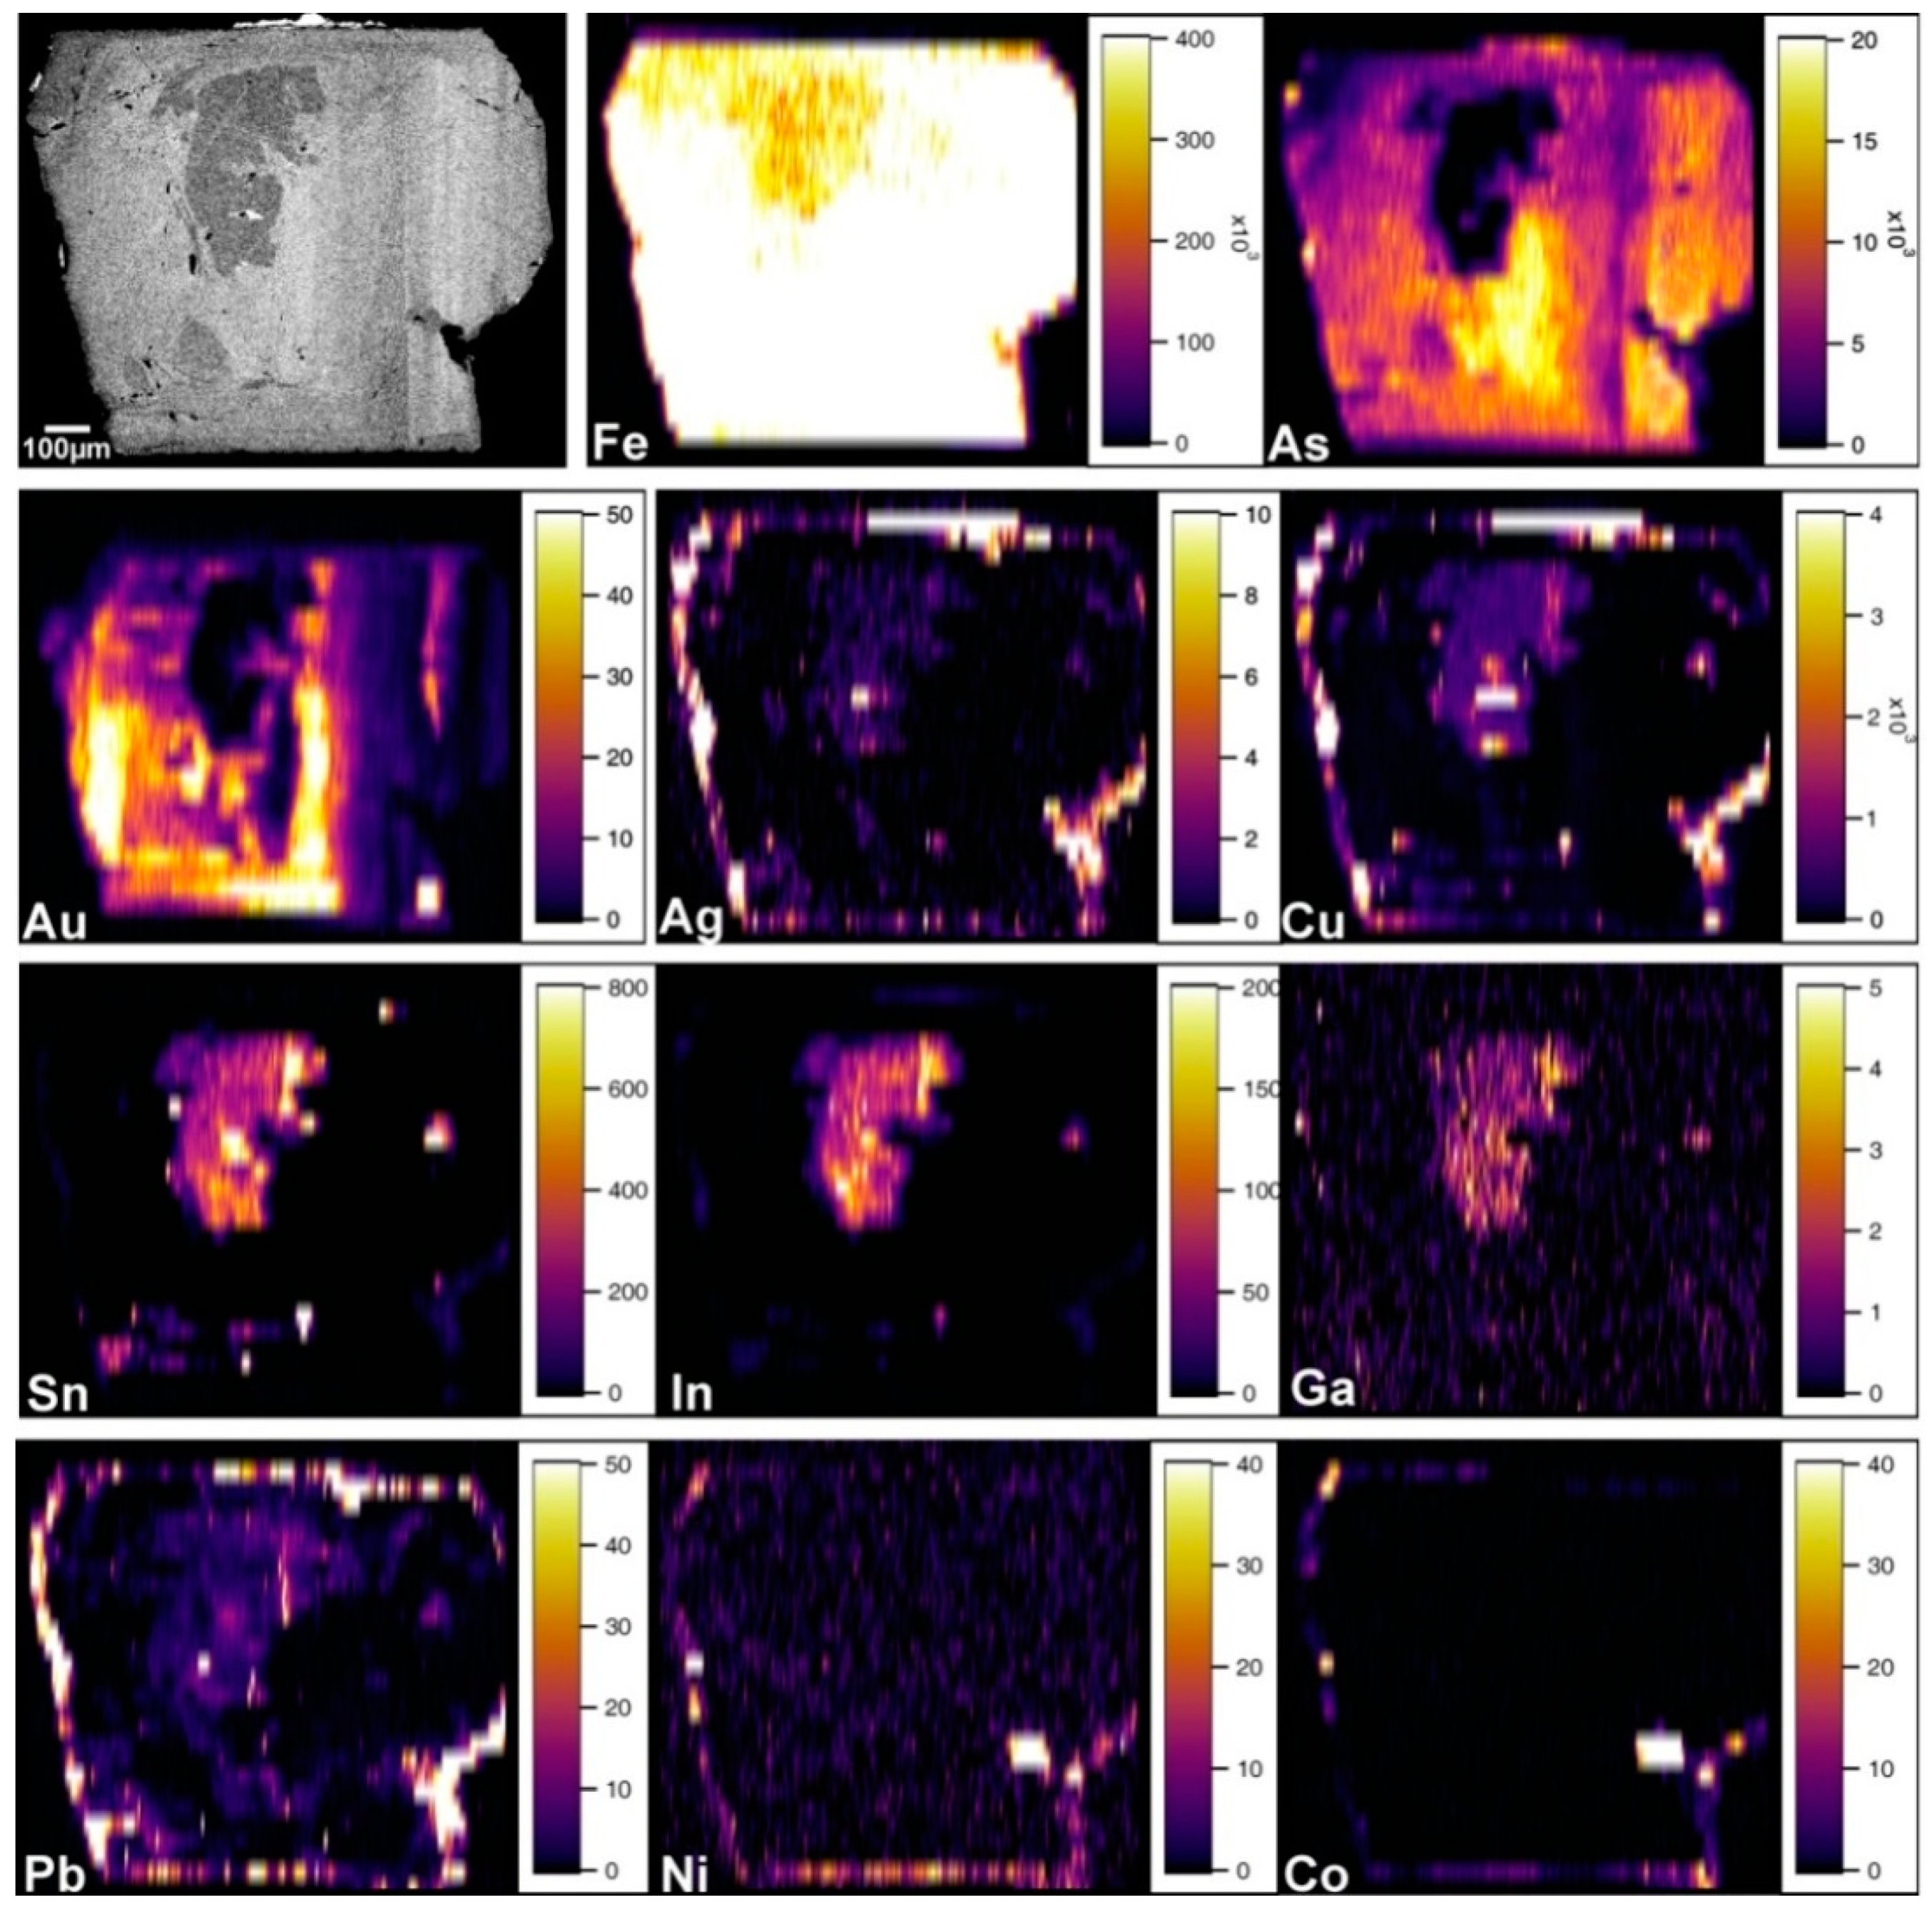
Profile analysis of the pyrite grains (Figure 11) revealed that light in BSE parts of the grains are enriched in As and Au, and the dark ones in BSE—Sn, Cu, Zn, Pb, Cd, In, Ag, Ga, Ge. The high CAu are only partially consistent with the regions of CAs peaks, since the invisible gold was found only in pyrite crystals containing sub-millimetre domains with small inclusions (from less than 1 to 10 × 1 microns) of stannite. These areas are Au-poor and rich in Sn, Ag, Bi, Cd, Cu, Ga, In, Pb and Zn (Figure 12). The Au-bearing variety of pyrite is characterised by a low content of Co (<0.16 ppm) and Ni (<0.3 ppm) and increased As (51–8277, geom. mean 1325 ppm). The point-like increased contents of Ni and Co on the element maps is probably associated with relict inclusions of the pyrite-2. The “synchronous” increased contents of impurity elements (Ag, Cu, Pb, Zn, Bi, Sb, Co, Ni) at the grain edges probably reflects the presence of thin film of their sulphides and sulphosalts on the surface of the pyrite grain.
Figure 10. Graphic images of two probing profiles for the pyrite crystals from the sulphide-quartz veins of the Ilyinskaya dyke, the Berezovsk deposit. Here, and in the Figure 11 and Figure 13, the y-axis is signal (counts per second) and x-axis is time (in seconds). Profiles length: (a) 482 μm, (b) 330 μm. Average content of elements (ppm) in the profile intervals in the table below each figure is indicated (here and in Figure 11 and Figure 13).
Minerals 11 00488 g010
Figure 11. Graphic images of the two probing profiles for the pyrite crystals from the sulphide-quarts veins of the Pervopavlovsk dyke, the Berezovsk deposit. BSE images (a,c), cursors indicate the location of the probing profiles, LA-ICPMS profile length (b,df): left—842 μm, right—330 μm. Frames in (a,c) indicate the areas with stannite (small, elongated) and chalcopyrite (Ccp) inclusions, see the insets.
Minerals 11 00488 g011
Figure 12. The pyrite crystal BSE image (top left) and the element distribution maps; semi-quantitative analysis, scales in ppm.
Minerals 11 00488 g012
Figure 13. Graphic images of the two probing profiles for the galena crystals from quarts veins of the gumbeites from the Shartash massive, the Berezovsk ore field. Profile length: left—1031 μm, right—728 μm.
Minerals 11 00488 g013
The LA-ICPMS method revealed an inhomogeneous distribution of Au (0.01–0.04 ppm) in galena from the sulphide-quartz veins of the gumbeite alteration (quartz + orthoclase + dolomite-ankerite ± scheelite) of the Shartash granite massif, south of the Berezovsk deposit, with an increase in the crystal periphery to 0.59 ppm (Figure 13). Together with Au, the Cu (up to 241 ppm, geom. mean 22 ppm) and Sb (up to 680 ppm) contents increase to the grain edges, which may be due to fine inclusions of bournonite CuPbSbS3, possibly Au-containing. This pattern is traced in all the grains of the mineral (the total number of ablation test points is 33). The distribution of other elements’ impurities is homogeneous within single grain with arithmetic mean values (in ppm): Zn—2.5, As—11, Se—4.6, Ag—927, Cd—130, Sn—0.4, Te—150, Tl—2.8 and Bi—2154. Their contents have minor variations in galena from different veins.

4.1.3. The Svetlinsk Gold-Telluride Deposit

The Svetlinsk gold-telluride deposit contains the gold ores, which can be divided into two types (except for ore in regolith): (1) disseminated pyrite-pyrrhotite in the host rocks (CAu up to 1 g/t), and (2) sulphide-quartz veins and veinlets, superimposed on the disseminated mineralisation (average CAu = 0.8–2.5 g/t). Sulphides are typically about 3–5 vol% (sometimes up to 20 vol%) of the bulk gold-bearing ore. Native gold (fineness 618–964; single value 485) in sulphide-quartz veins forms inclusions in pyrite, tetrahedrite and quartz, as well as is closely associated with tellurides: melonite NiTe2, frohbergite FeTe2, altaite PbTe, tellurantimony Sb2Te3, Ag- and Au-Ag-tellurides (Table 2, Figure 14) [41]. The bulk ore analyses revealed that vein-disseminated gold ores (Au~2–4 ppm) contained (in ppm) 5–17 Sb, 4–7.3 Te and 2.5–4 Se. For the Svetlinsk deposit, native (Au0.48–0.96Ag0.02–0.49) and telluride (calaverite AuTe2, montbrayite ((Au,Sb)2Te3), sylvanite AuAgTe4, krennerite (Au,Ag)Te2, petzite Ag3AuTe2, hessite Ag2Te and γ-hessite Ag1,9Te) forms of manifestation prevail among the Au and Ag minerals (Table 3).
Many Te minerals are important carriers of Au in sulphide-bearing ore [67,100]. The minerals found in the deposit contain up to 1 wt% Au (altaite—up to 0.6 wt%, tellurantimony—from 0.3 to 1 wt%, and tetradymite—up to 0.2 wt%, EPMA). EPMA revealed the presence of Ag in the sulphides of early associations of the quartz-sulphide veins (wt%): chalcopyrite 0.02–0.48, pyrite up to 0.05 and pyrrhotite up to 0.02.
The LA-ICPMS data have been obtained for pyrite and chalcopyrite from the disseminated pyrite-pyrrhotite mineralisation (Py I) and from the gold-sulphide-telluride-quartz veins (Py II). Py I is enriched in Au, Ag, Pd, Sb, Bi and Te and contains (ppm): Au 0.1–33.8, Ag 0.1–146, Pt 0.01–0.03, Pd up to 0.1, In up to 4.2, Te 2.2–192, Sb 0.1–50.8, Co 11.7–833 (for 1 sample—6088), Ni 2.5–648 (1 sample—2382), Ga 0.1–47, Ge 0.1–5.3, Se 2.2–71, Bi 0.1–5.3; Py II: Au 0.01–3.4, Ag 0.1–3.4, Pt 0.01–0.09, Pd up to 0.03, In is below the detection limit, Te 1.9–152, Sb 0.1–8.7, Co 0.05–1019 (2 samples—1.2 wt%), Ni 1.8–587.4 (2 samples—0.1 wt%), Ga 0.1–3.4, Ge 0.2–0.5, Se 3.5–52 and Bi up to 0.6 (Figure 15b). Vein-chalcopyrite contains (ppm): 0.1–0.2 Au, 0.9–441 Ag, 1.4–2.5 Pd, 11.8–41 In, 3.3–11 Te, 0.3–130 Sb, 0.6–1.0 Ga and 38–63 Se.
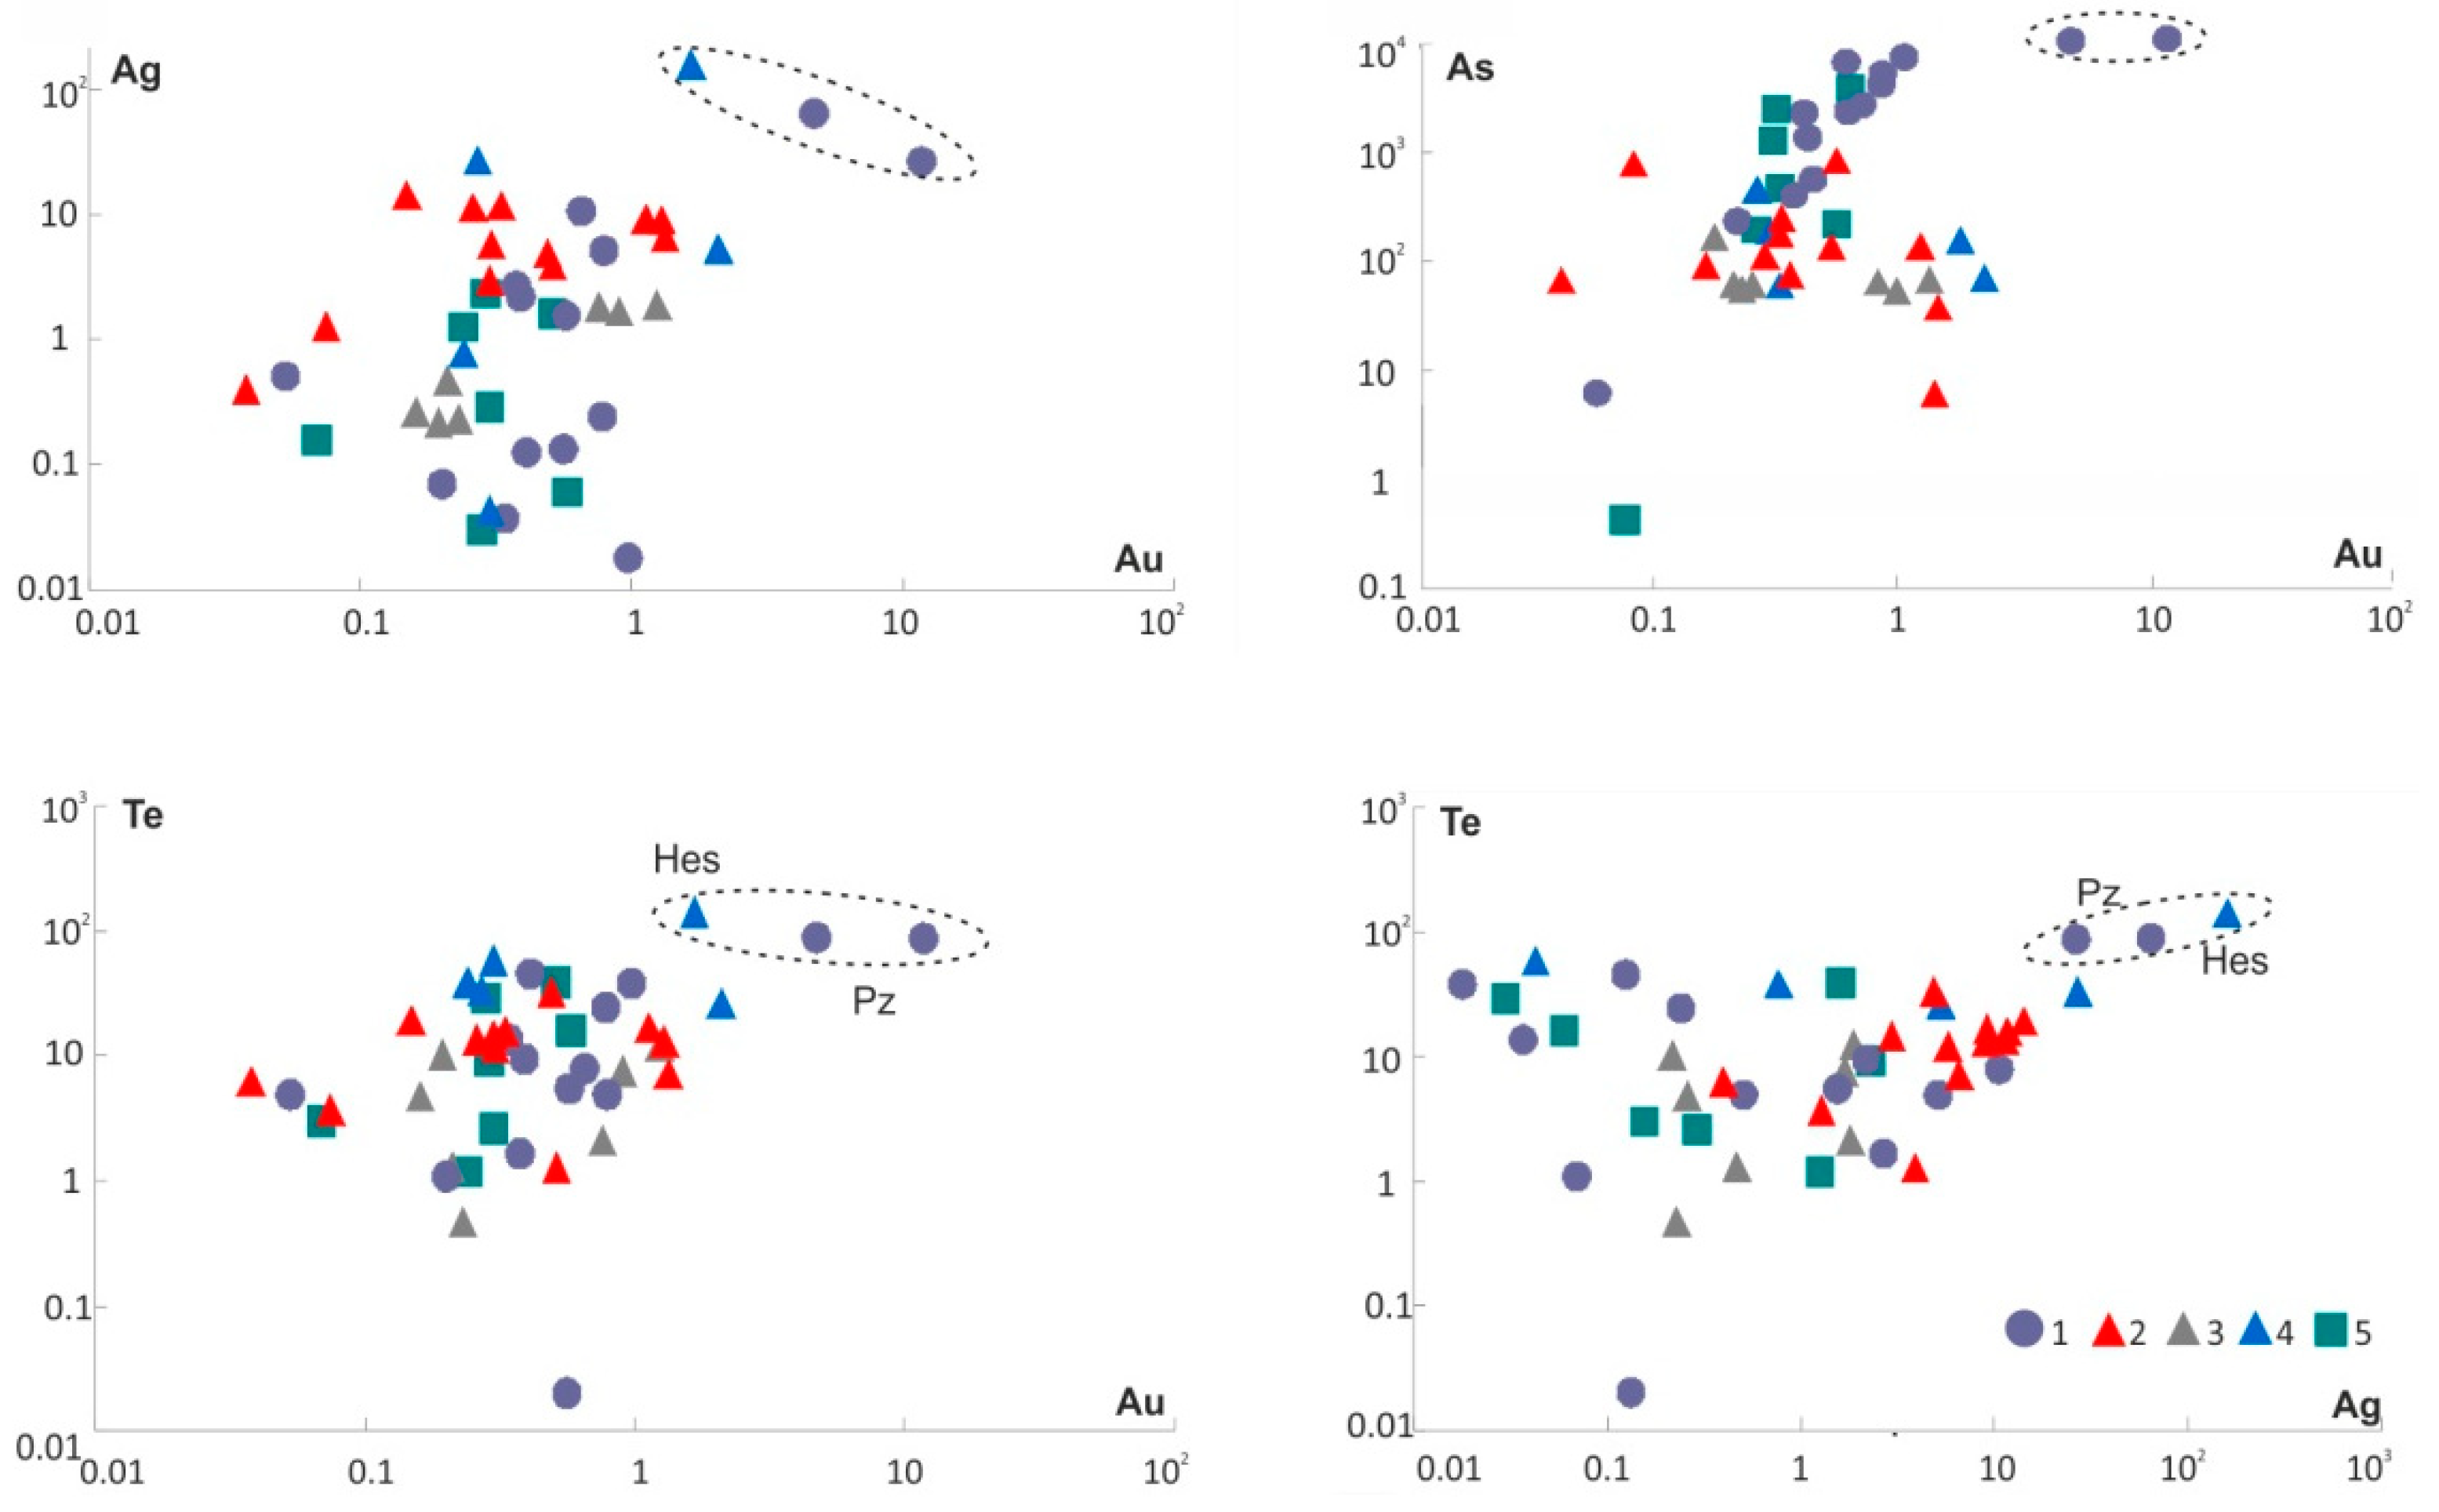
At Au ≤ 10 ppm, the direct correlation between the contents of Au and Ag (Figure 15a), as well as that of Au and Ag with Te was found for early pyrite. This data may indicate the presence of nano-scale inclusions of petzite Ag3AuTe2 and hessite Ag2Te in pyrite. At higher concentrations (Au > 10 ppm), the gold nanoparticles probably occur in both pyrite varieties. At Au from 0.01 to 0.1 ppm, Au–As correlation possibly suggests structurally bound Au in pyrite. The lower Au and Ag concentrations in the late pyrite are probably related to the deposition of their own mineral forms at this mineral formation stage. In contrast, for the early pyrite, an incorporation of Au into the pyrite structure can be suggested. Cu-rich pyrite (I and II) and Ni-rich Py II contain a detectable value of Pd.

4.1.4. The Petropavlovsk Gold-Porphyry Deposit
Pyrite from the skarn-magnetite assemblage contains peak concentrations of Co up to 17,141 ppm, Ni 3738 ppm and elevated As content of 1944 ppm according to LA-ICPMS data (see Table 7 and Table 8). Pyrite from the gold-sulphide assemblage contains maximum Te up to 650 ppm, Au 80 ppm, Bi 116 ppm and elevated Ag 105 ppm and Pb (up to 838 ppm). The peak contents of Pb up to 4.80 wt%, Zn 8.6 wt%, 0.7 wt%, Ni 0.38 wt%, Se 223 ppm, Ag up to 111 ppm, Sb 10.5 ppm and Sn 4.4 ppm, as well as increased Te up to 137 ppm, Au 66 ppm and Bi 5 ppm are found in pyrite from the gold-telluride assemblage. The presence of high “spot” occurrences of Pb and Zn in some samples is commonly associated with tiny inclusions of galena and sphalerite. The contents of most impurity elements (Au, Ag, Te, Sb, As, Co, Bi) decrease—usually an order of magnitude—in the pyrite of the latest quartz-carbonate assemblage.
According to LA-ICPMS data, a positive linear relationship between the Au and Ag contents in pyrite is observed for the gold-bearing ore: correlation coefficient (r) is 0.99 for the skarn-magnetite assemblage, for gold-sulphide, r = 0.89, for gold-telluride, r = 0.9, and for quartz-carbonate, r = 0.84 (Figure 16). Positive correlation of these elements corresponds to the occurrence of invisible gold, mainly represented by submicroscopic and nano-sized native gold (electrum).
A negative correlation is observed for Te with Au and Ag in pyrite for the gold-sulphide assemblage (−0.4 and −0.44, respectively) and a positive correlation for Ag/Te (0.46) and Au/Te (0.4) for the gold-telluride assemblage. The presence of a positive connection between Ag and Te can be explained by the occurrence of submicroscopic and nano-scale inclusions of Ag telluride (hessite) and Au-Ag telluride (petzite) in the pyrite of the last assemblage.
There is a correlation between Co and Ni for the gold-sulphide assemblage (r = 0.46). A positive correlation is also observed between Co and As for the following assemblages: skarn-magnetite (r = 0.98) and quartz-carbonate (r = 0.5), and it commonly corresponds to small cobaltite inclusions. A significant correlation between Au and As, but negative (r = –0.6), is observed for the pyrite of the gold-sulphide assemblage. Correlation Au/As is absent for other assemblages.
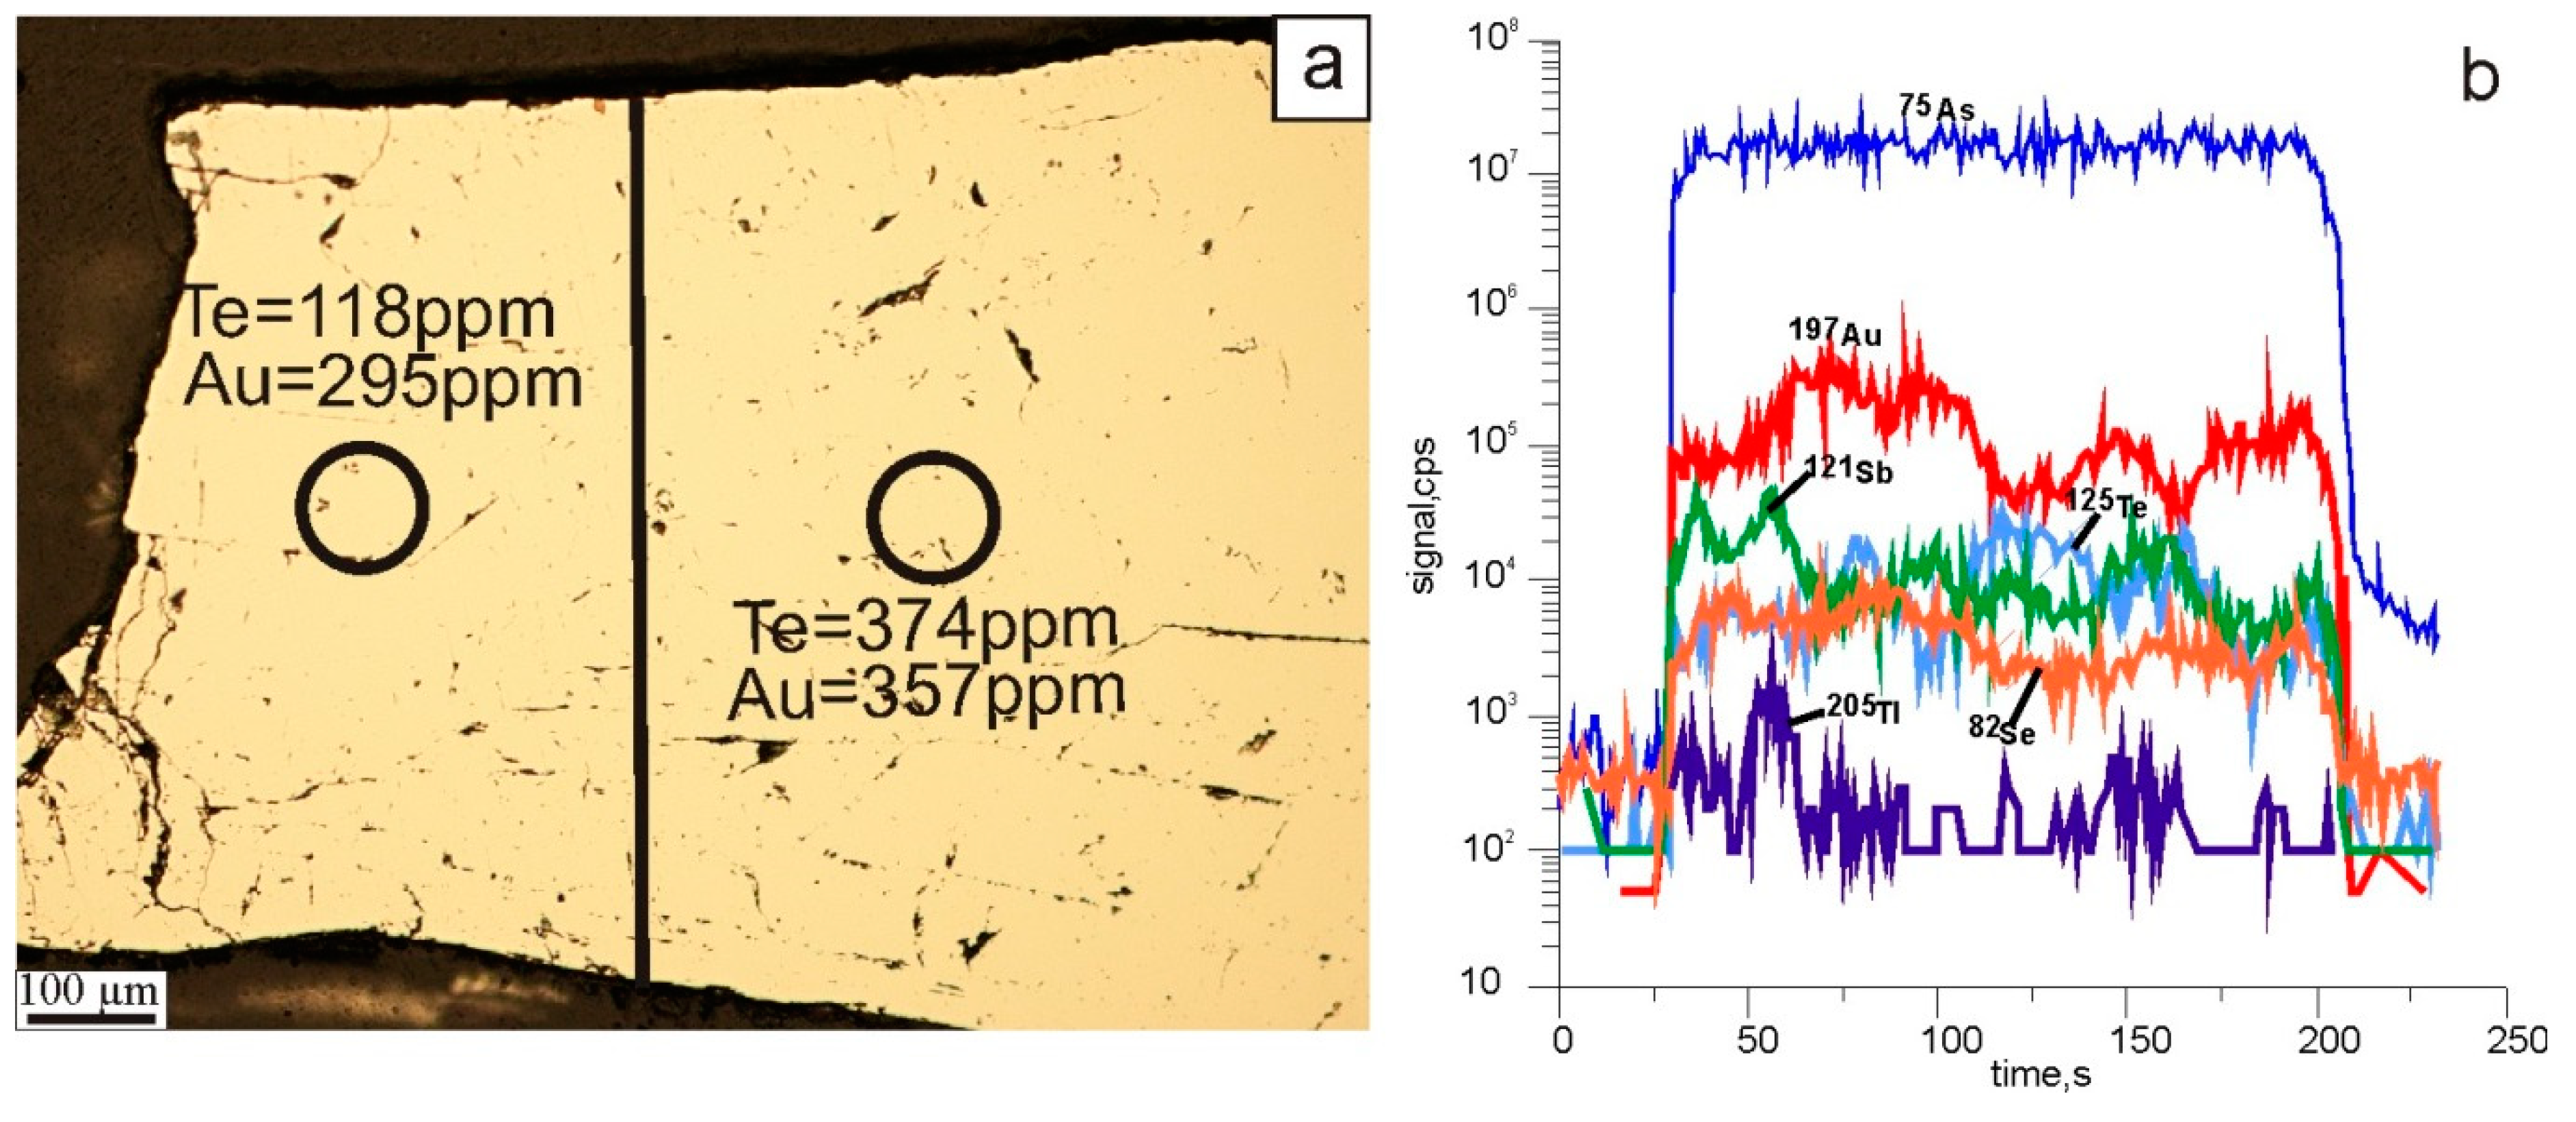
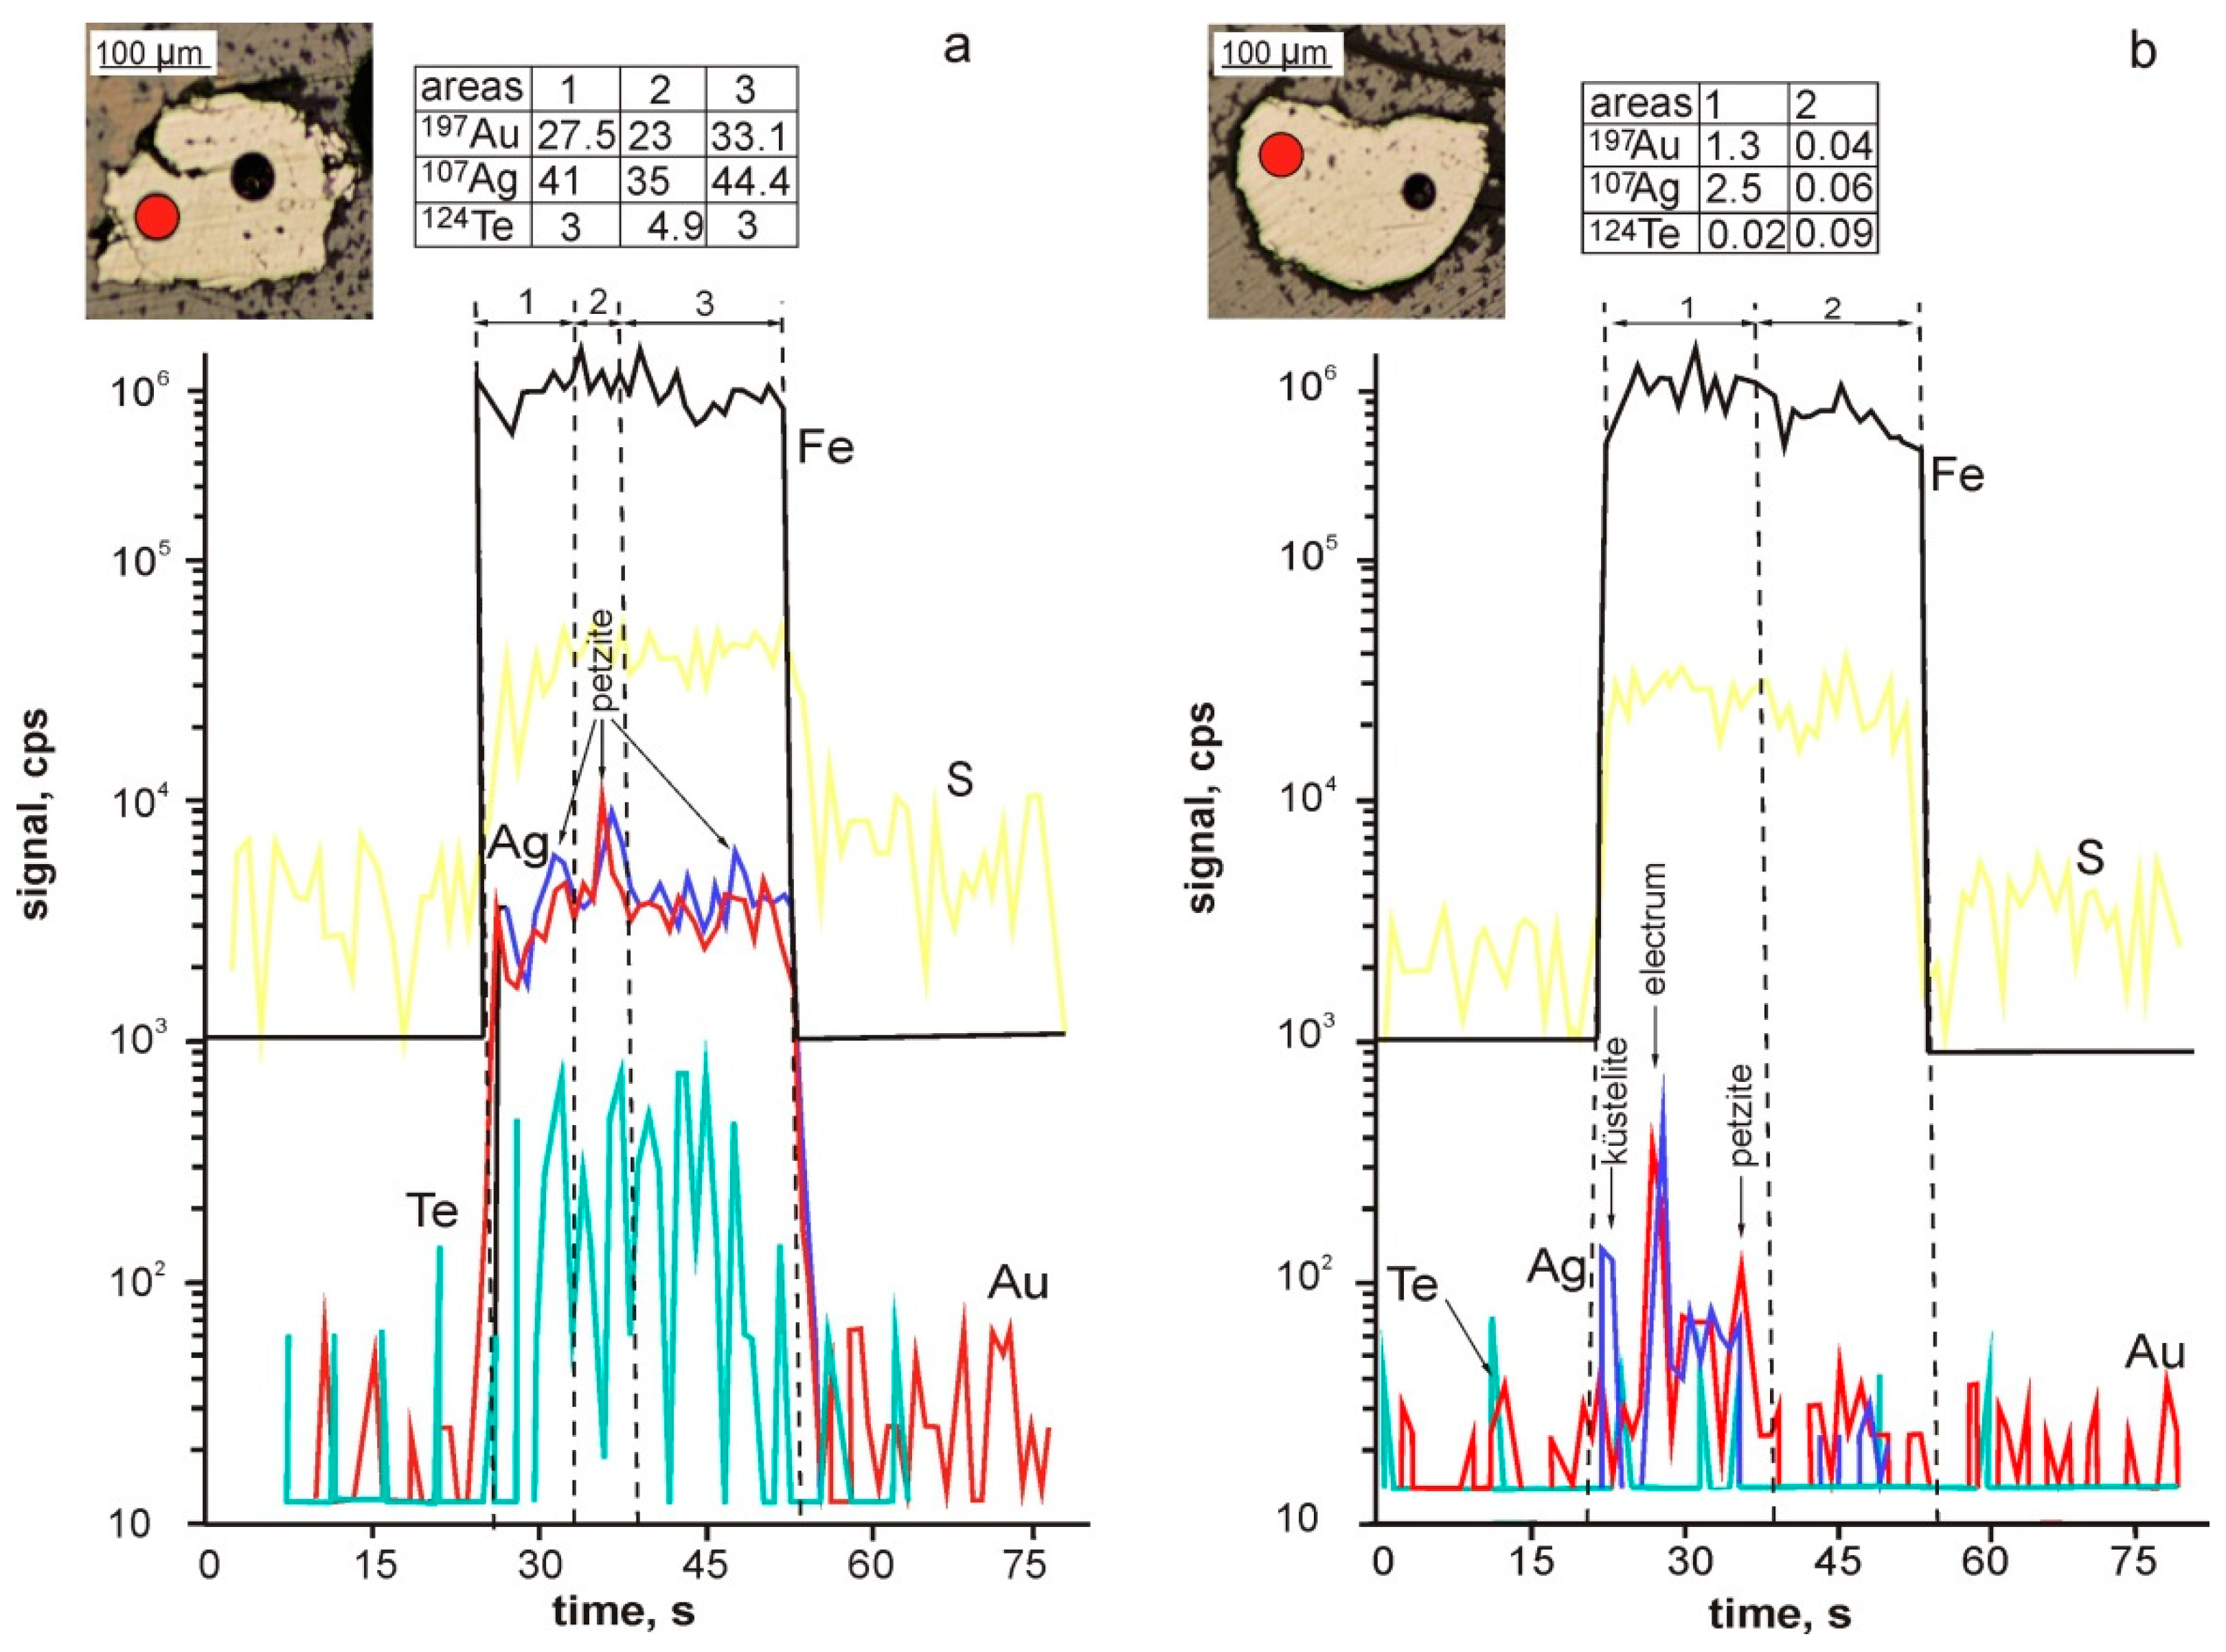
The examples of the spot analyses of two grains of anhedral and subhedral pyrites (gold-sulphide and gold-telluride assemblages, correspondingly) are demonstrated in Figure 17. Gold concentration ranges from 0.3 to 31 ppm (anhedral pyrite) and from 0.06 to 1 ppm for the subhedral pyrite crystal (profile ablation). The contents of silver and tellurium are from 0.6 to 45 ppm and from 0.3 to 8.3 ppm, respectively (sample PP 308/2). Nano-sized petzite inclusions probably occur in the pyrite from the gold-sulphide assemblage (Figure 17a).
Tiny isolations of petzite are often observed microscopically in close intergrowths with native gold, native silver and galena in this assemblage. Inclusions in another anhedral pyrite grain (from the gold-telluride assemblage, PP 309/5) are unevenly distributed. They are present in both areas and probably represented by küstelite, electrum and petzite (see Figure 17b).
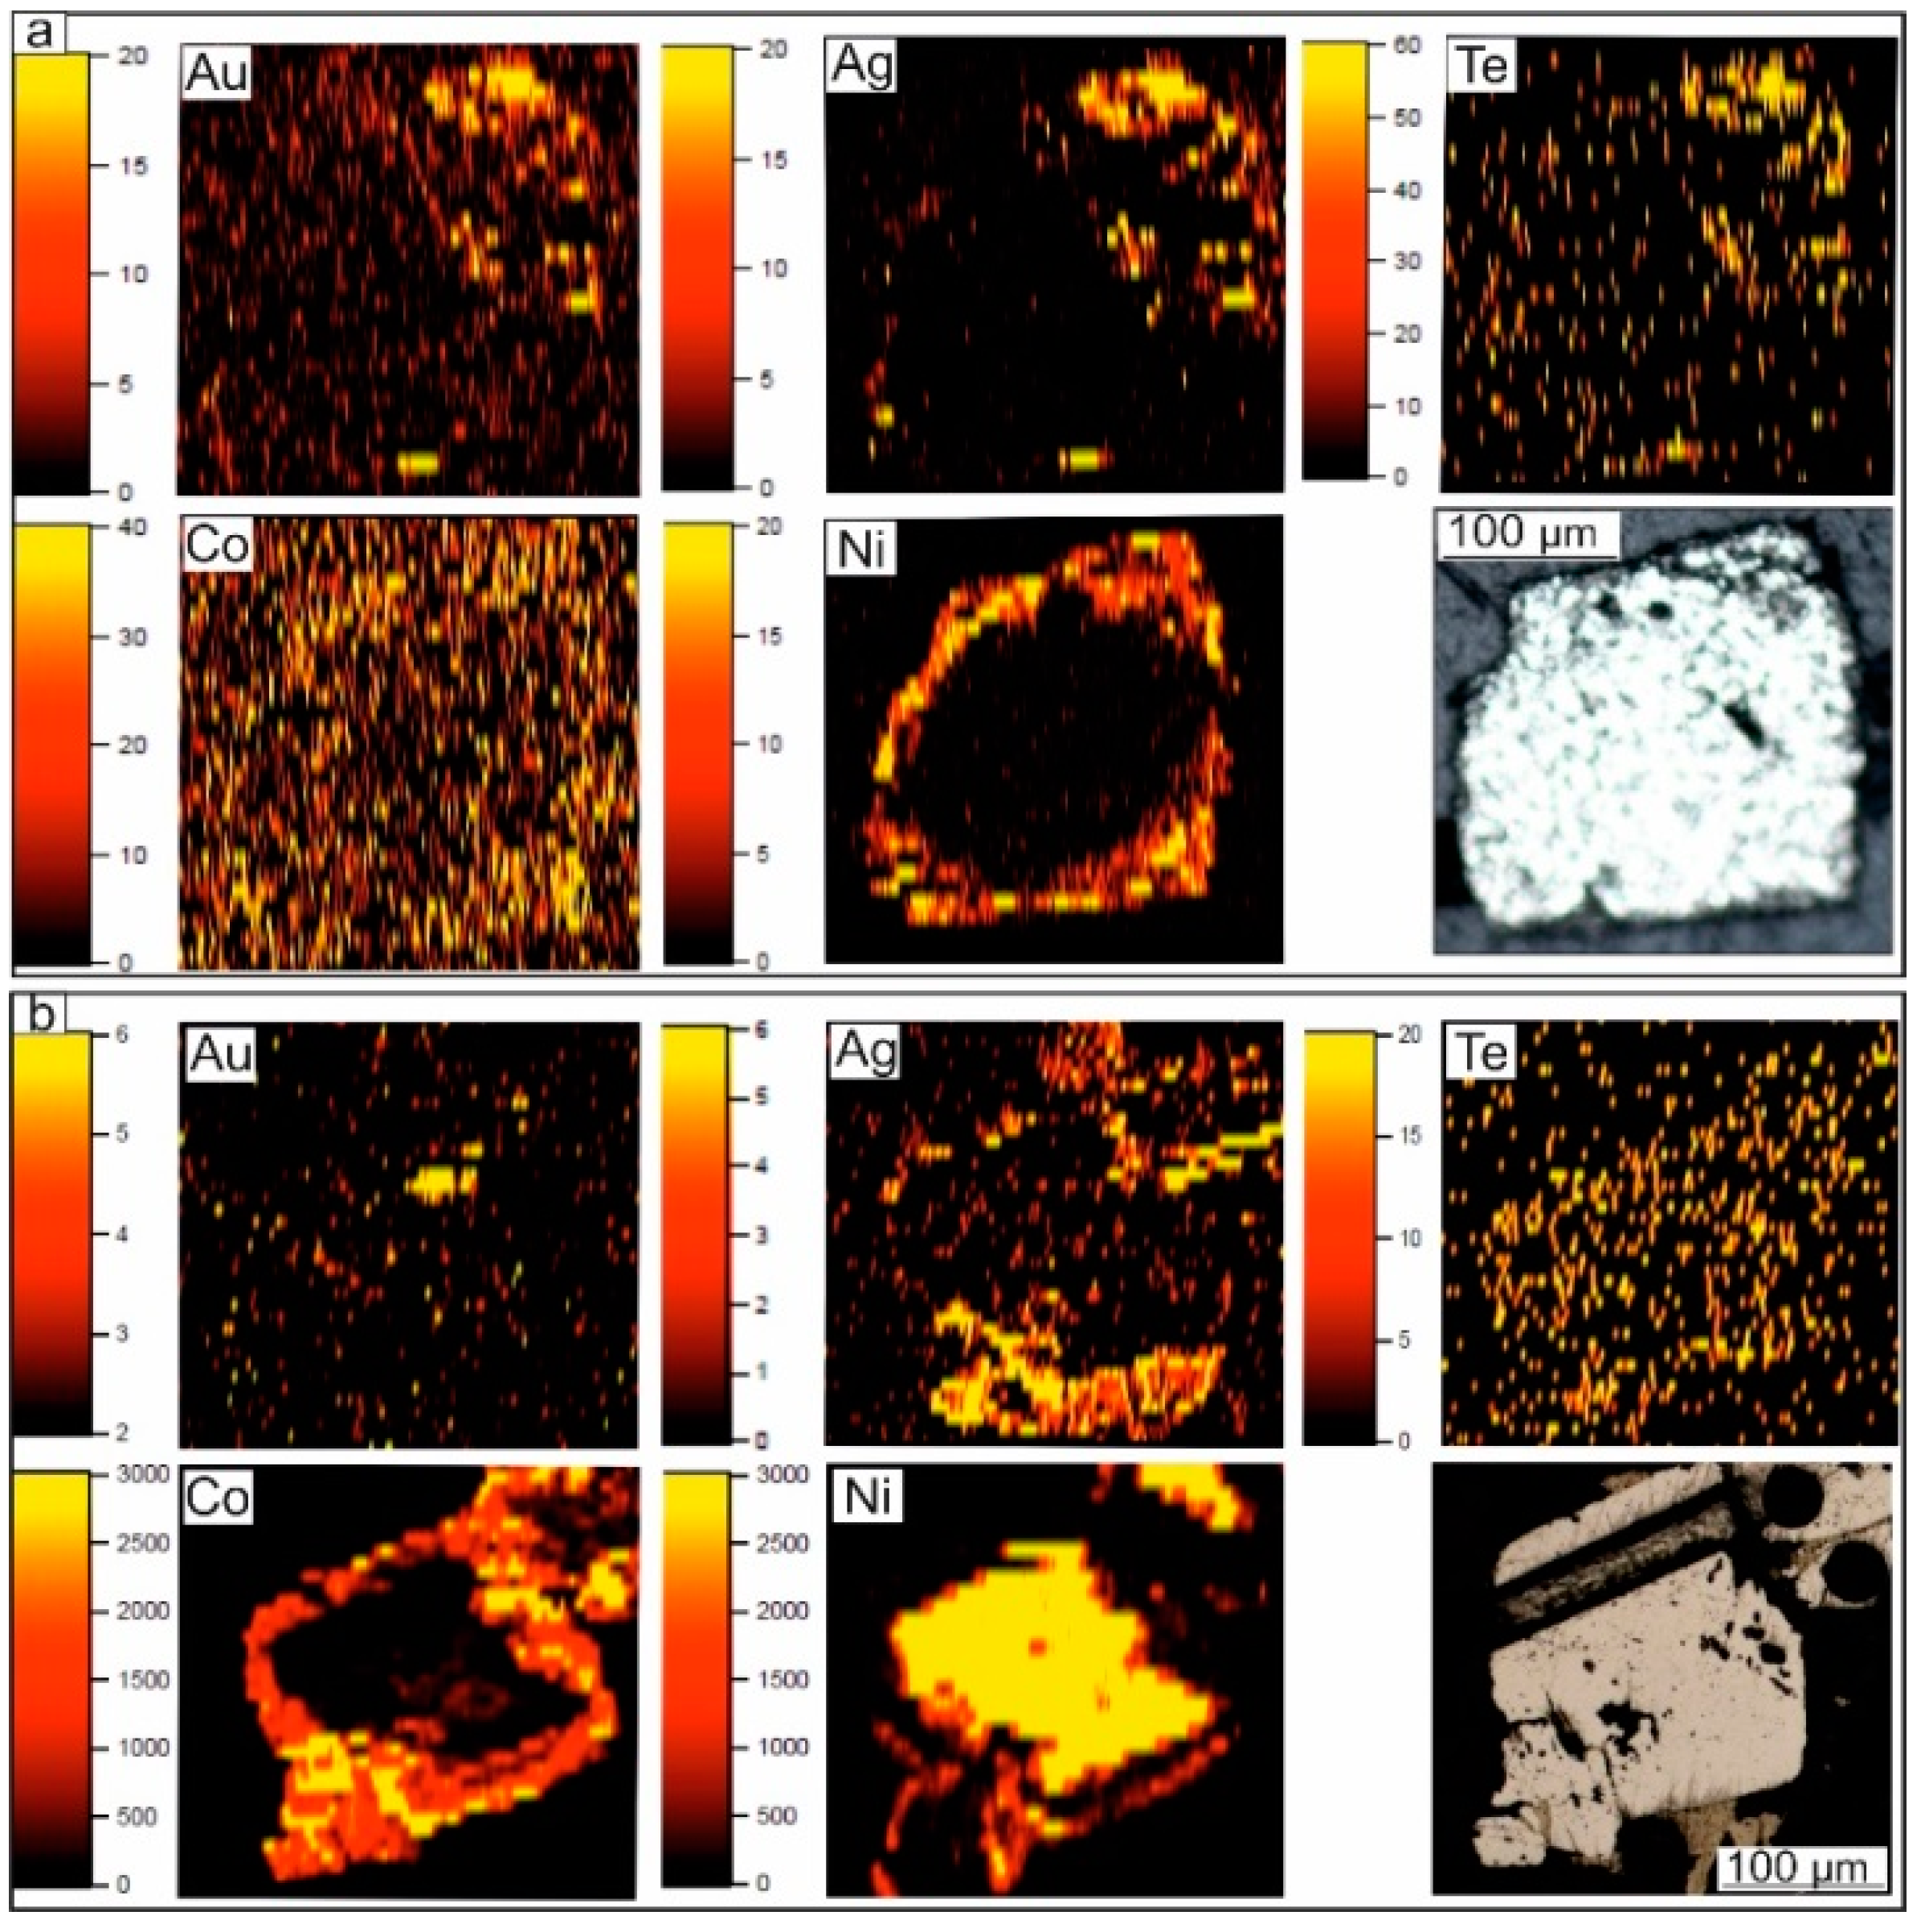
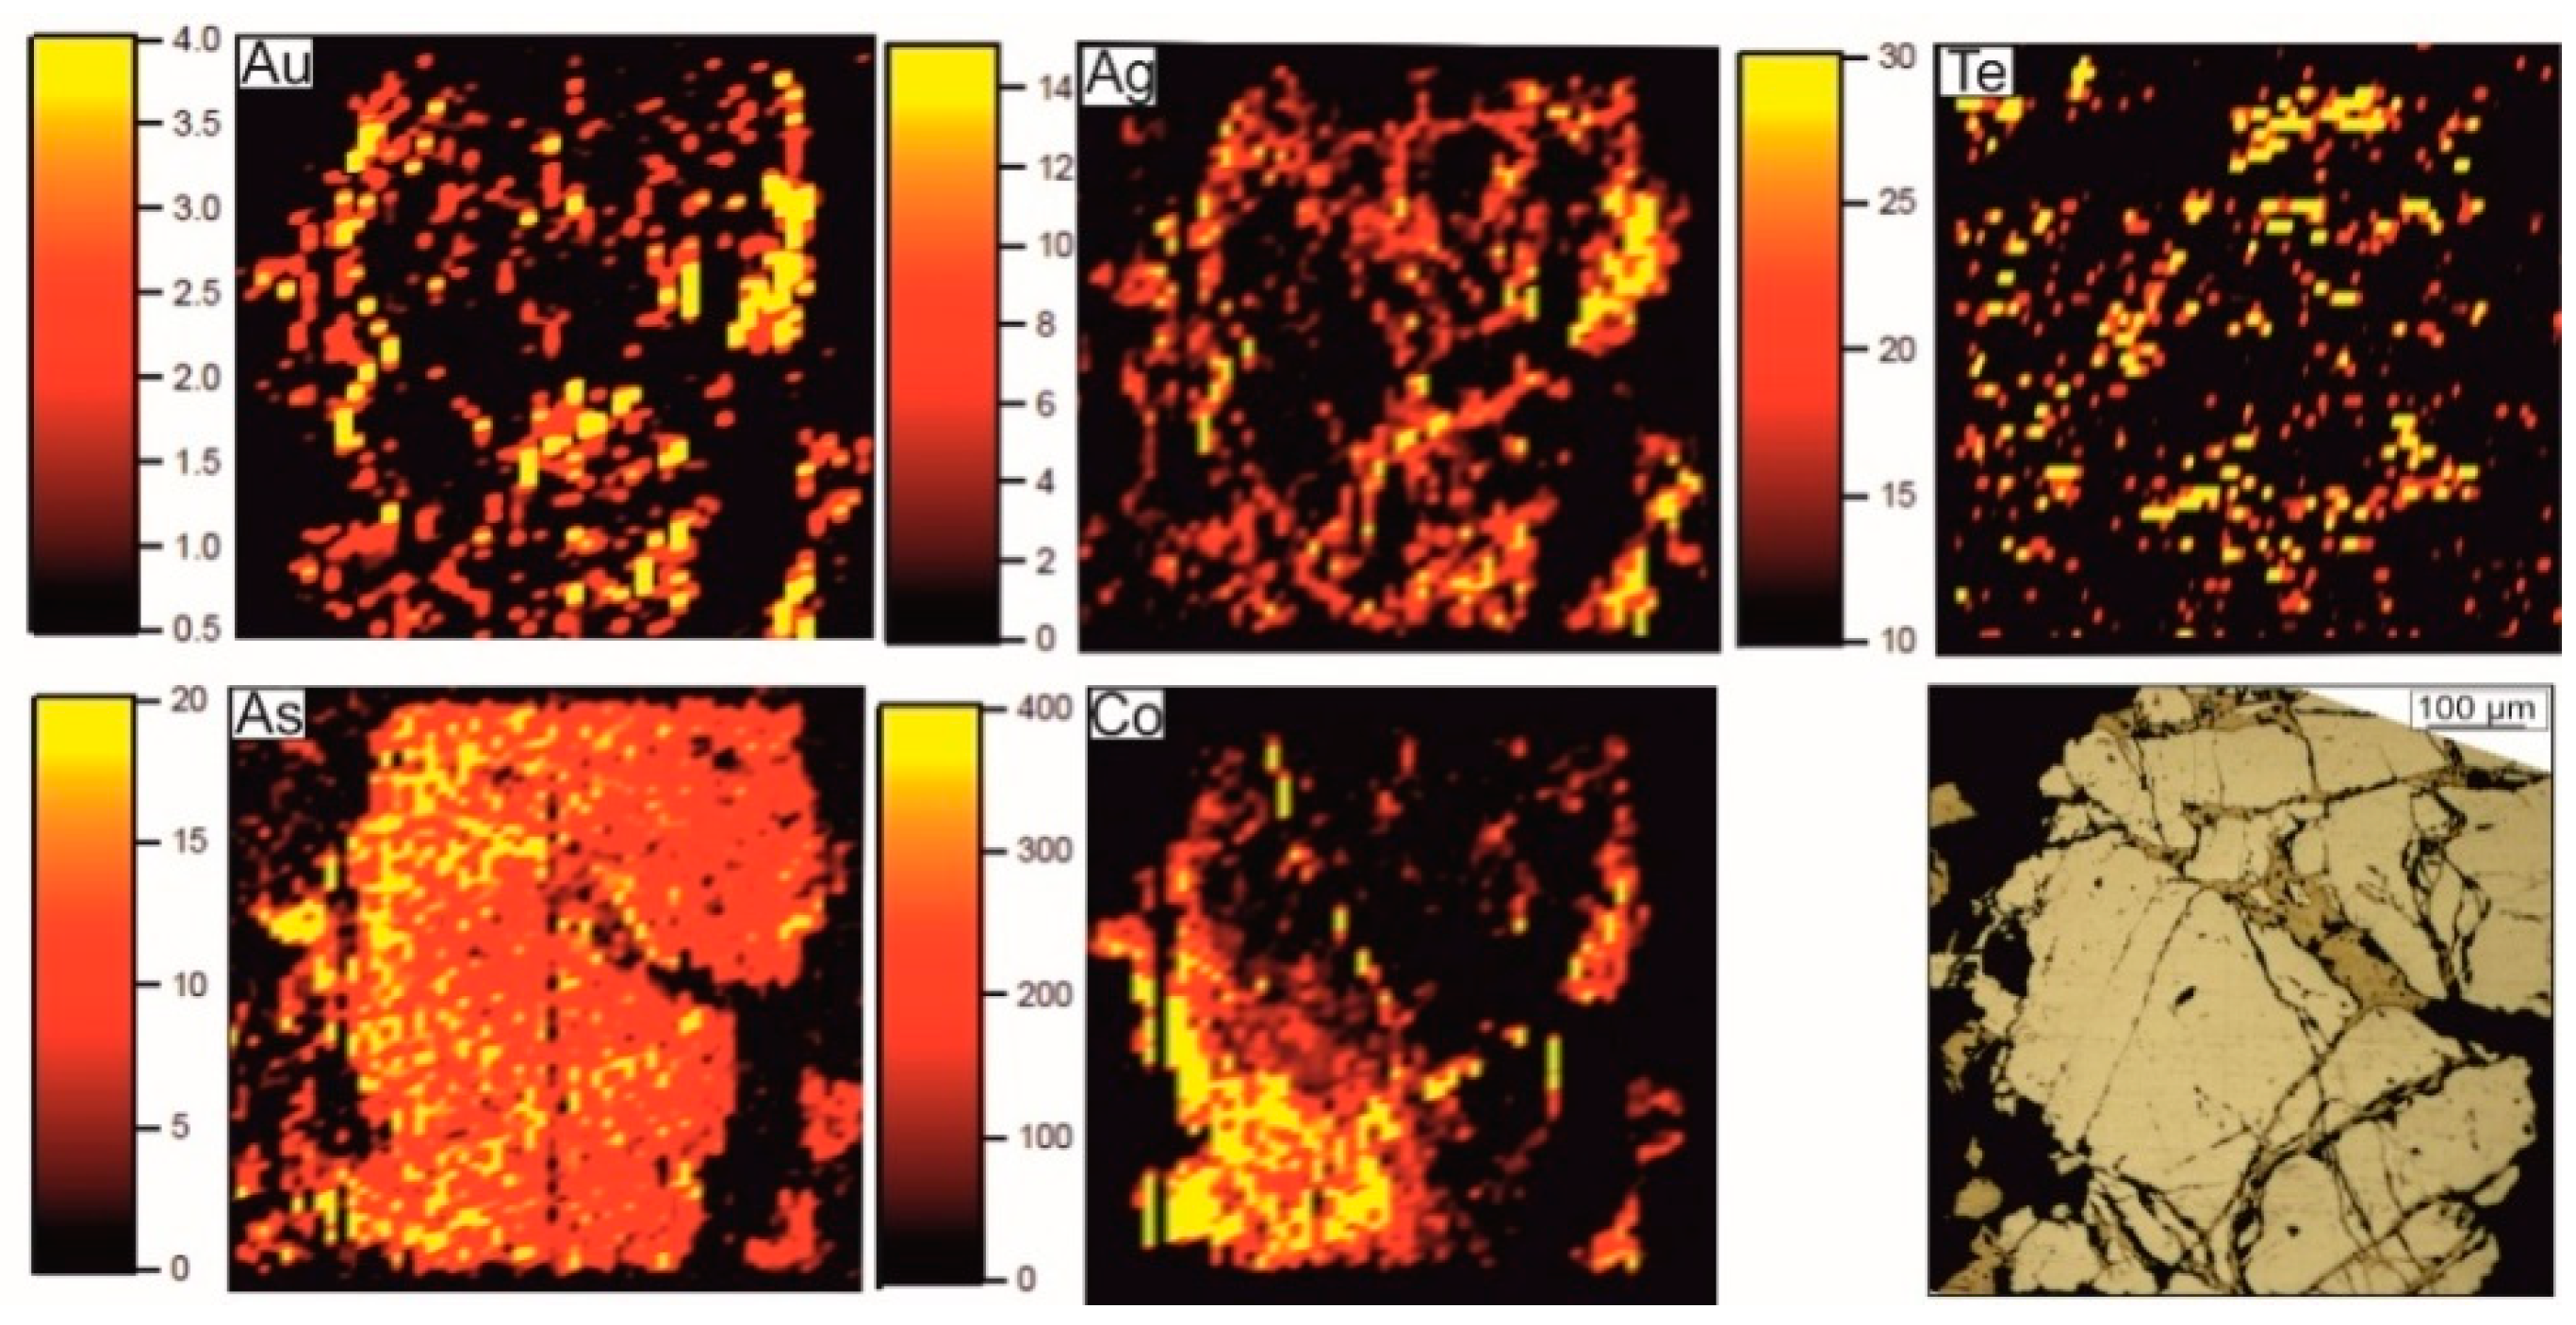
An on-site study of the same pyrite grain (“mapping” mode of LA-ICPMS analysis) shows that increased concentration of Au, Ag and Te corresponds to one of its marginal parts. Dense clusters of bright points with their increased contents (Figure 18a) create an irregular, “fine-spotted” picture of their distribution, indicating the possible occurrence of nano-sized inclusions of Au-Ag tellurides (mainly petzite?) here. Elevated contents of Ni and Co belong to the edge zone of the pyrite crystal. Analysis reveals average contents (excluding peak areas): Au 0.6 ppm, Ag 2 ppm, Te 1.2 ppm, Co 3.4 ppm, Ni 16 ppm and As 23 ppm (Figure 18a).
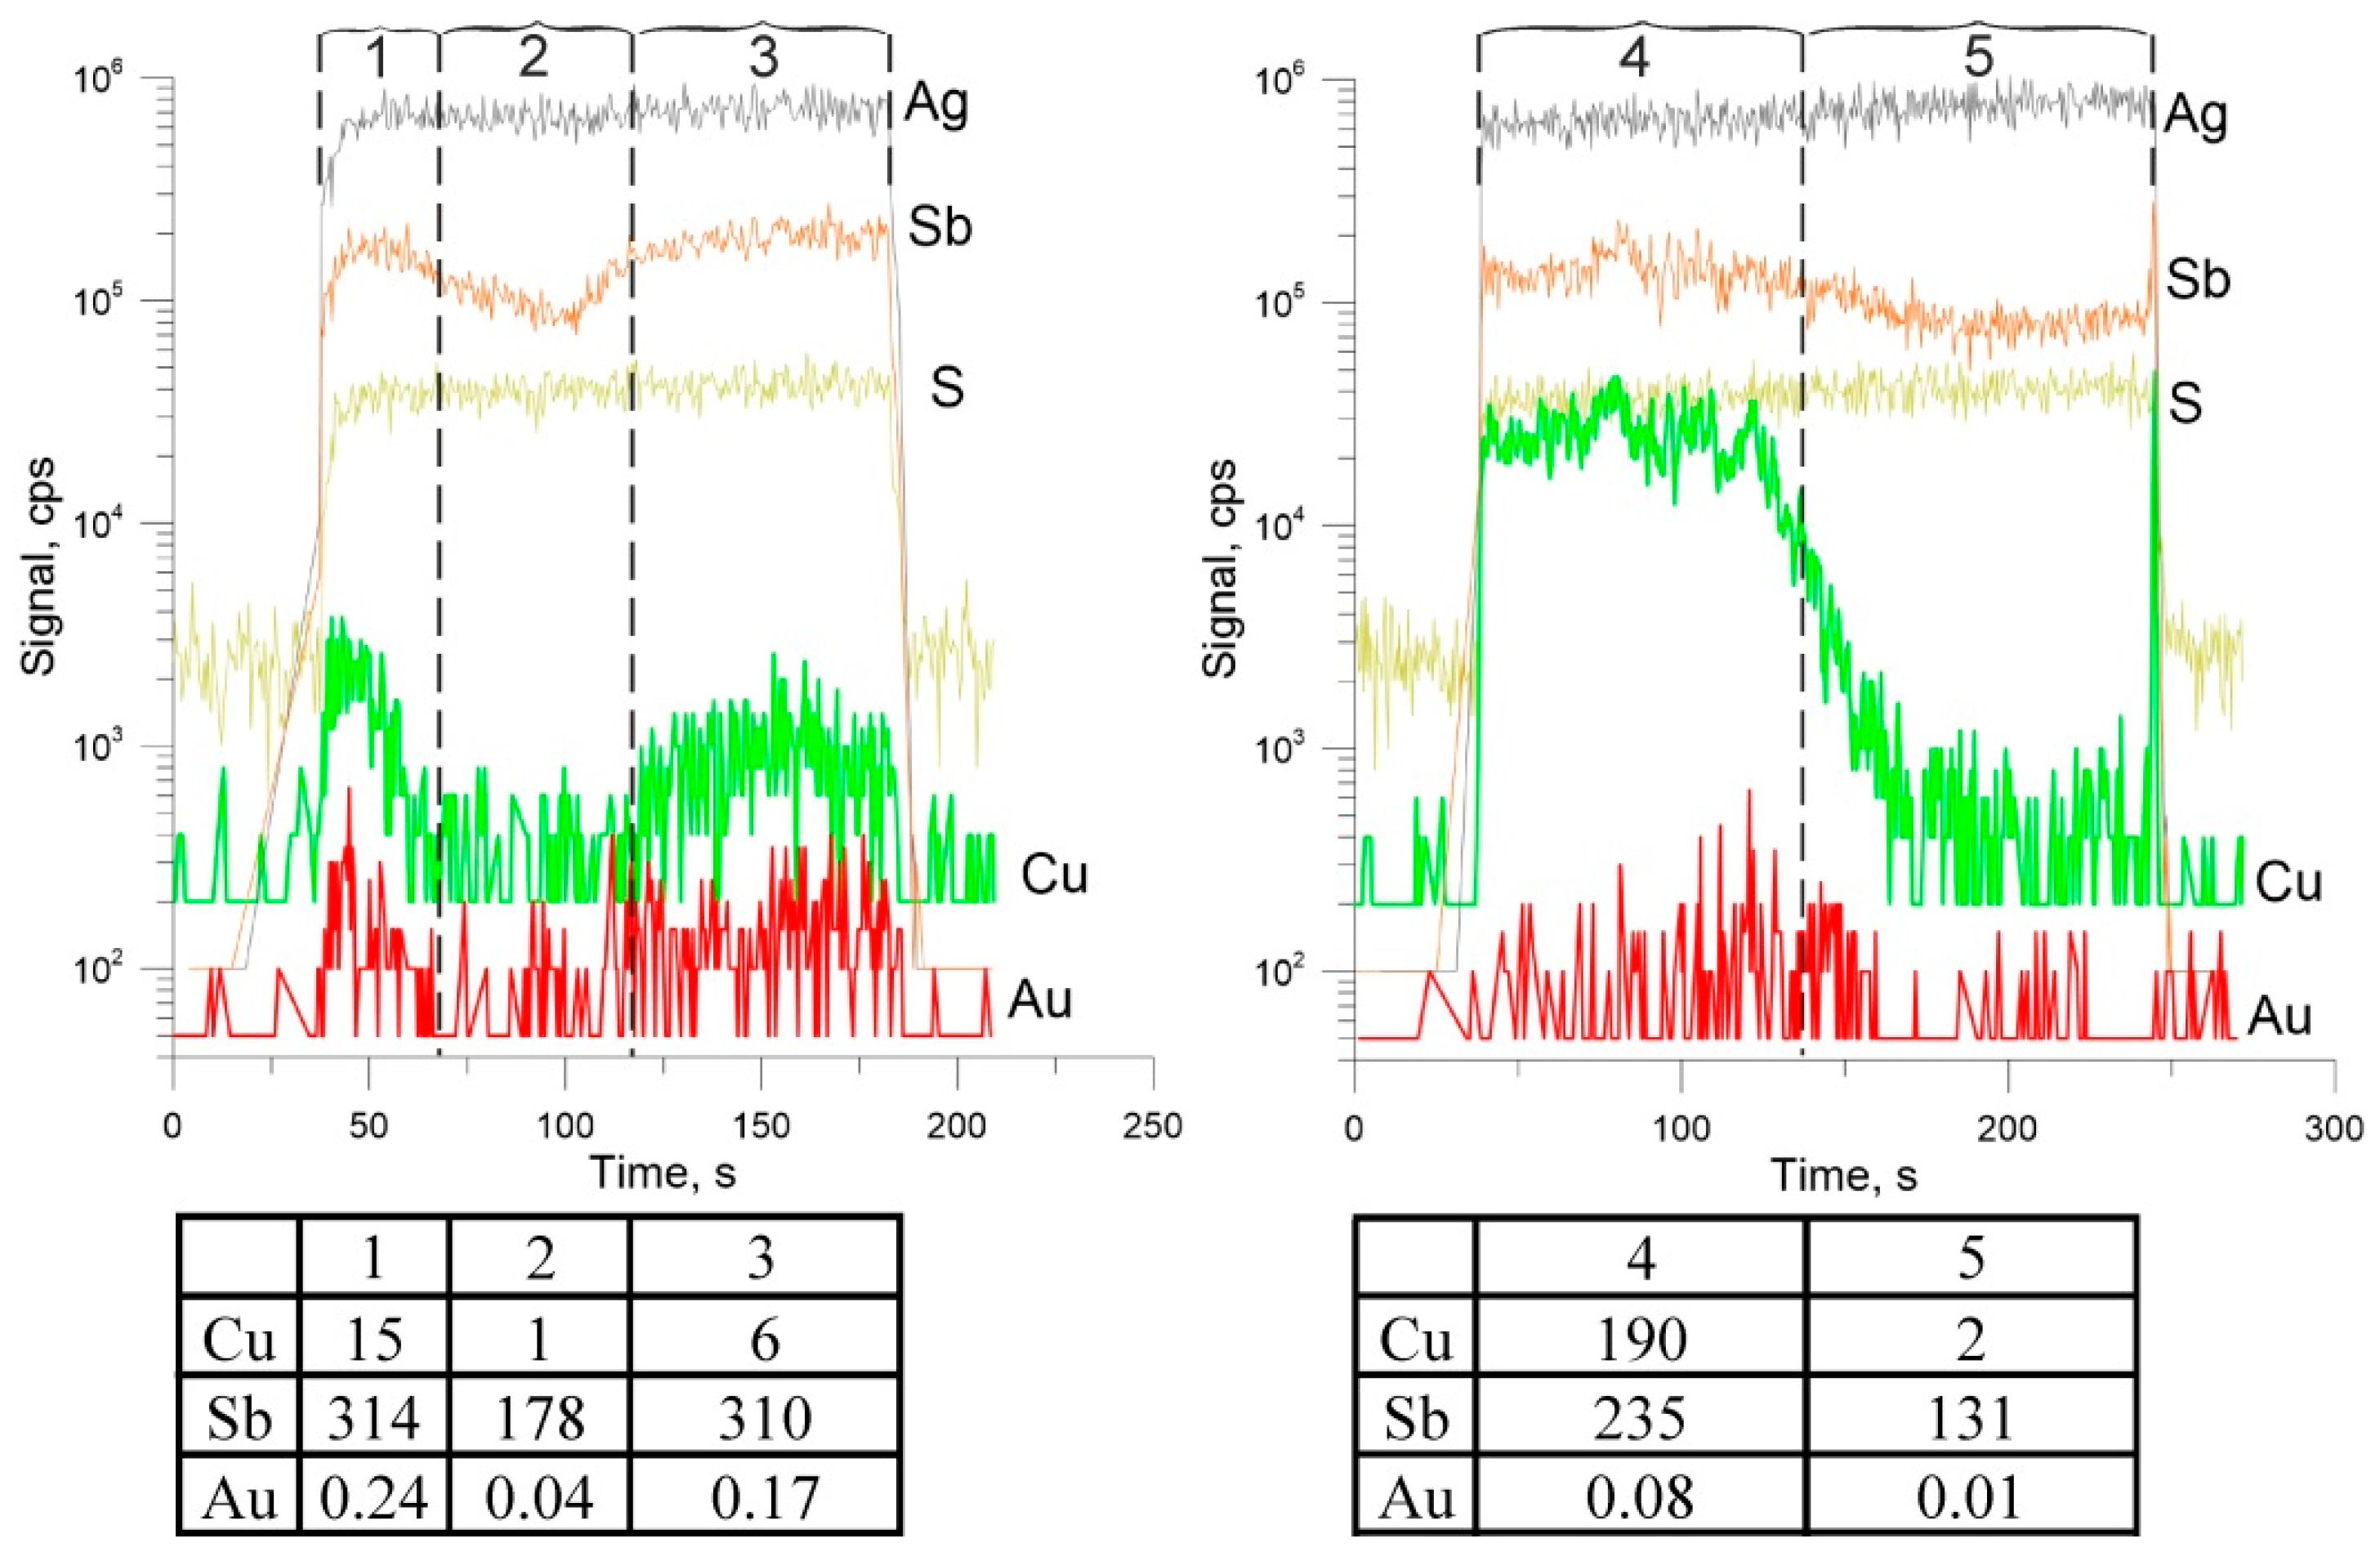
Laser ablation of another pyrite grain (Figure 18b) demonstrates a different picture of the distribution of impurity elements with maxima, ppm: Au 0.43, Ag 0.34, Te 6, Co 118, Ni 117 and As 318. Gold contents do not correlate with Te and Ag, and Te and Ag peaks belong to only one of the crystal margins, which is possibly also associated with the abundance of nano-sized inclusions of silver tellurides (hessite?) here. Elevated Co contents belong to the entire edge zone, and Ni, on the contrary, belongs to the central part of the pyrite crystal. Figure 19 shows an example of a LA-ICPMS profile across an idiomorphic pyrite grain from the gold-sulphide assemblage (PP 309/10), which also showed a generally uneven distribution of impurity elements in pyrite. We divided the ablation time-profile into 5 areas: Au, Ag and Te are evenly distributed in all zones. The elements form peaks probably due to submicron inclusions of native gold, küstelite and hessite (Table 9).
Figure 17. Composition of pyrite from the gold-telluride assemblage obtained by the LA-ICPMS method for the Petropavlovsk deposit: (a) tiny inclusions of native gold and petzite are evenly distributed, the gold-sulphide assemblage, sample PP 308/2. (b) A few peaks are probably related with inclusions of native gold or küstelite and petzite, the gold-telluride assemblage, sample PP 309/5. Note (here and in Figure 19): the graphs show the main (Fe, S) and some minor (Au, Ag, Te) elements in pyrite.
Minerals 11 00488 g017
Figure 18. LA-ICPMS distribution maps of impurity elements in pyrite crystals from the gold-telluride assemblage of the Petropavlovsk gold-porphyry deposit: sample PP 309/5 (a) and sample PP 1444/71 (b), scales in ppm.
Minerals 11 00488 g018
Figure 19. Composition of pyrite of the gold-sulphide assemblage from the Petropavlovsk deposit, LA-ICPMS profile (sample PP 309/10). Submicron inclusions of native gold, küstelite and hessite are probable. For average content of elements in the profile intervals, see Table 9.
Minerals 11 00488 g019
Chalcopyrite: Elevated concentrations of Co (143 ppm), Ni (242 ppm), As (80 ppm), Se (194 ppm), Sb (20.4 ppm) and Sn (4 ppm) are found in chalcopyrite-1 and Te (up to 4200 ppm), and those of Au (up to 25 ppm), Ag (up to 7600 ppm) and Bi (11 ppm) in chalcopyrite-2 (Table 10 and Table 11). It is probably associated with the capture of nano-scale inclusions of cobaltite (Co, As, Ni), fahlore (Cu, Ag, As, Sb), altaite (Pb, Te), as well as petzite (Ag3AuTe2), calaverite (AuTe2), native gold, native silver and hessite (Ag2Te).
Galena: Elevated concentrations of Co (up to 1060 ppm), Ni (670 ppm), As (93 ppm), Se (407 ppm), Sb (8.6 ppm) and Sn (0.8 ppm) are recorded in galena-1, and those of Te (up to 1770 ppm), Au (980 ppm), Ag (2050 ppm) and Bi (62 ppm) in galena-2 (Table 12 and Table 13).
Generally, the gold content in the sulphides of the deposit is maximum in galena (980 ppm), followed by pyrite (80 ppm) and chalcopyrite (25 ppm). According to the LA-ICPMS method, the pyrite of the early ore assemblages of the Petropavlovsk deposit is characterised by high contents of Co, Te, Au, Ag and Bi, increased Ni, As and Se and noticeable Sb and Sn. For the pyrite of later assemblages, elevated Zn, Pb, As, Ni, Se, Sb and Sn are found. The maximum Au was established in pyrite from the gold-telluride assemblage (up to 80 ppm). Minimal Au concentration was established in the pyrite of the latest quartz-carbonate assemblage (up to 1.7 ppm). Detectable admixtures of tellurium characterise the pyrite of all mineral assemblages. Proper mineral forms of the trace elements are presented, including Te compounds with Au (± Ag) in late mineral assemblages.
According to the LA-ICPMS analyses, gold in sulphides of the deposit is present mainly in the invisible form (from 0.02 to 80 ppm). It mainly associates with pyrite-2. At least part of such gold probably occurs as nano-scale inclusions of native gold (close in composition to AuAg) as well as Au- and Au-Ag-tellurides [39].
The data obtained suggest that the gold was evenly distributed in pyrite crystals in the early assemblages of the Petropavlovsk deposit. Gold was further enlarged and partly redeposited in pyrite defects at the final stages of mineralisation.
A close relationship is observed between Au and Ag (correlation coefficient r > 0.7), as well as between Ag and Te (r = 0.46) for the gold-telluride assemblage. It can be explained that these elements are present in the deposit in the form of tiny inclusions of native gold, hessite and petzite. Au–As correlation is not traced in pyrite. The uneven distribution of Au, Ag and Te over the area of pyrite grains with “spots” of their peak concentrations probably indicates the presence of clusters of nano-sized inclusions of Au-Ag tellurides.
The concentrations of trace elements in galena and chalcopyrite (as well as in pyrite) change with the evolution of ore formation. The contents of Ni, Co, As, Se and Sb are maximum in the main gold stage. The concentrations of Au, Ag, Te and Bi increase at the end of this stage. In general, the gold content in the sulphides of the deposit reaches highs in galena (up to 980 ppm). Next are pyrite (49 ppm) and chalcopyrite (25 ppm).

4.1.5. The Novogodnee-Monto Iron-Gold-Skarn Deposit

Pyrite of the magnetite-pyrite assemblage is characterised by impurity concentrations peaking in As (11,050 ppm), Co (up to 3530 ppm), Ni (774 ppm), Au (12 ppm) and elevated of Te (up to 89 ppm) (Table 14). Pyrite of the polymetallic assemblage contains the maximum concentrations of Zn (3130 ppm) and Sn (0.4 ppm). Pyrite from the gold-sulphide and gold-telluride assemblages is characterised by the highest values of Cu (4520 ppm), Ag (159 ppm), Te (141 ppm) and Bi (15 ppm). Pyrite from the quartz-carbonate assemblage contains the maxima of Sb (98 ppm) and Se (363 ppm). It is possible that high concentrations of some elements are associated with the capture of nano-scale inclusions of chalcopyrite, sphalerite, hessite (Ag2Te), petzite (Ag3AuTe2), empressite (AgTe) and cobaltite (Co, As, Ni) (Table 15). It is confirmed by synchronous peaks of individual chemical elements on the profiles of laser ablation or in the form of bright point “inclusions” on bitmaps during analysis in the mapping mode [39,101].
According to the LA-ICPMS data, a positive relationship occurs between Au and Ag in magnetite-pyrite (0.6) and gold-sulphide-magnetite (0.9) assemblages (Figure 20). A positive correlation is observed between Au and Te in pyrite of the magnetite-pyrite (0.8) and quartz-carbonate assemblages (0.6). A stronger correlation between Ag and Te is found in pyrite of magnetite-pyrite (0.78) and gold-telluride (0.9) assemblages. A notable relationship between Au and As is observed only for the magnetite-pyrite assemblage (0.7). A positive correlation between the Co and Ni is revealed in pyrite for magnetite-pyrite (0.7) and polymetallic (0.7) assemblages. The negative correlation between the Co and Ni is observed in pyrite for the gold-sulphide-magnetite assemblage (−0.6). A positive correlation between Co and As is also found in pyrite for magnetite-pyrite (0.5) and gold-telluride (0.5) assemblages.
The profile ablation of pyrite grains from the polymetallic assemblage by the LA-ICPMS method showed an uneven distribution of the majority of impurity elements in pyrite, with average contents (geom. mean., excluding peak areas): 1.3 ppm Au, 9 ppm Ag, 13.1 ppm Te, 177 ppm Co, 132 ppm Ni and 6 ppm As (Figure 21). Confined to the marginal parts of the pyrite grain, high Au concentrations correlate with elevated Ag contents but do not correlate with Te. An on-site study of the same pyrite grain in mapping mode shows close for Au and Ag areas of the increased concentrations, gravitated to the edge parts of the pyrite grain, while Te-maxima are localised separately. The increased contents of As and Co belong to the marginal zones of the pyrite grain.
Chalcopyrite: Peak concentrations of As (up to 3230 ppm), Pb (up to 1050 ppm), Co (up to 887 ppm), Se (up to 109 ppm), Ag (up to 88 ppm), Au (up to 13 ppm), Ni (up to 9 ppm) and Sn (up to 2 ppm) are found in chalcopyrite-1 (Table 16 and Table 17). Maxima of Zn (up to 145 ppm), Sb (up to 37 ppm), Te (up to 15 ppm) and Bi (up to 3 ppm) occur in chalcopyrite-2. The peaks of Pb, As, Zn, Te, Ag and Au on the LA-ICPMS profiles are probably related to the capture of small inclusions of galena, arsenopyrite, sphalerite, altaite, calaverite, native gold, hessite and petzite, which were found microscopically.
Native gold in the ore is associated mainly with pyrite impregnations. It is characterised by high fineness (893) in the gold-sulphide-magnetite assemblage in skarns. The Au contents in pyrite are significantly reduced in the later gold-telluride assemblage. Native gold from this assemblage has a size from 2–5 to 10–20 μm and fineness from 750 to 893. The size of the segregations and fineness of gold increase (up to 40–50 μm and up to 893, respectively) in contact with the late dyke. Pyrrhotite appears in the gold-pyrite-magnetite assemblage. The gold concentrations in pyrite of the early magnetite-pyrite assemblage belong to the limits of possible uniformly distributed gold (for a pyrite crystal with a size of 0.5 mm, the maximum value of uniformly distributed gold detected by the method in [102] is about 12.3 ppm). These researchers evaluated the structural gold contribution as 1–10% of the bulk uniformly distributed gold. The peak Te contents (up to 141 ppm) were established in the pyrite of the gold-telluride assemblage, in some cases probably due to submicron inclusions of calaverite AuTe2.
In general, gold of the early assemblages was evenly distributed in pyrite crystals at the Novogodnee-Monto deposit, and that at the Petropavlovsk deposit. Later, at the final stages of mineral formation, invisible gold (submicron native gold isolations, nano-scale domains and isomorphic gold in pyrite) was enlarged and redeposited in pyrite defects.
It is possible that high concentrations of some elements are associated with the capture of nano-scale inclusions of chalcopyrite, sphalerite, hessite (Ag2Te), petzite (Ag3AuTe2), muthmannite (AuAgTe2), sylvanite ((Au,Ag)2Te4), krennerite (Au3AgTe8), empressite (AgTe) and cobaltite ((Co,Ni)AsS) during alalysis. It is confirmed by the appearance of synchronous peaks of individual chemical elements on the laser ablation profiles or in the form of bright dot-like “inclusions” on bitmaps during analysis in the mapping mode [40]. It is also confirmed by strong (r > 0.7) bonds between Au and Te (0.8), Au and As (0.7), Co and Ni (0.7) and Ag and Te (0.8) for the magnetite-pyrite, Ag and Te for the gold-telluride (0.9), Au and Ag (0.9) for the gold-sulphide-magnetite and Co and Ni (0.7) for the polymetallic assemblages. The uneven distribution of Au, Ag and Te over the pyrite grain area with “spots” of their peak concentrations probably indicates, as in the Petropavlovsk deposit, the presence of dense clusters of nano-scale inclusions of Au-Ag tellurides, as well as cobaltite. Moreover, the Novogodnee-Monto deposit is characterised by increased concentrations of Au and Ag. These concentrations are consistent with each other, while Te is localised separately.
Concentrations of trace elements in chalcopyrite also change along with the ore formation. The contents of Ni, Co, As, Se, Au and Bi reach their maximum values in the earlier polymetallic assemblages. The concentrations of Te, Sn, Ag, Zn, Sb and Pb increase for chalcopyrite of the gold-sulphide-magnetite assemblage in skarn. In general, the gold concentration in chalcopyrite is slightly lower (geom. mean 0.22 ppm) than in pyrite (geom. mean 0.6 ppm). The gold concentration in magnetite does not exceed tenths of a ppm (up to 0.2 ppm, geom. mean 0.11 ppm).

4.2. The VMS Deposits of the Urals

Pyrite is the dominant mineral of the VMS ores (40–90 vol%). Chalcopyrite and sphalerite are the major economic minerals (1–10, up to 30 vol%), and fahlore (mainly tennantite) is a common mineral (0.1–1 vol%). Occurrence of some minerals is locally significant: bornite for Gai, pyrrhotite (up to 20 vol%) and fahlore for Uzelga (up to 10 vol%), galena for Uchaly and Uzelga (up to 2 vol%), magnetite for Uchaly and arsenopyrite for Uchaly and Gai (up to 1 vol%) deposits. The ore samples which are anomalous in terms of gold concentration commonly contain Ag-bearing fahlore, Ag-bearing galena (±Ag-bearing bornite) with subordinated sulphosalts of silver (pyrargyrite, freibergite, stephanite, polybasite, pyrostilpnite, argentotetrahedrite, pearceite, proustite), tellurides (altaite, hessite, stützite, empressite, petzite, krennerite, sylvanite, montbrayite, muthmannite), sulphotellurides (tetradymite), Au-Ag-sulphides (petrovskaite, uytenbogaardtite, acanthite) and native elements (native gold, native silver, native tellurium) [9,15,71,103] (Table 18, Figure 22).
We will consider the mineral composition of ores and the behaviour of precious metals in their minerals on the example of the largest deposits of the Urals: Gai (Cu-dominant subtype), Uchaly and Uzelga (Zn-dominant subtype).

4.2.1. The Gai Deposit

In the Gai deposit, pyrite is the dominant mineral of ores (50–95 vol%), and it contains ~3.8 ppm Au and ~8 ppm Ag (Table 19 and Table 20; Figure 23). Chalcopyrite with ~0.06 ppm Au (Table 21; Figure 24) and low Fe (0.12–2.8 wt%) sphalerite, with ~0.02 ppm Au (Table 22; Figure 25), are the major economic minerals (1–10 vol%, up to 50 vol%). Tennantite-tetrahedrite and bornite are common ore minerals (0.1–1 vol%). Fahlore (low-iron tennantite is the dominant variety) contains up to (wt%, EPMA) Te 2.18, Hg 1.07, Bi 0.98, Se 0.33 and Pt 0.26. Bornite, usually pseudomorphically replacing chalcopyrite, is Ag-rich (0.16–3.53 wt%, in most analyses >0.4 wt%, EPMA), the Ag content in bornite is 2–3 times higher than in coexisting tennantite [73], however according to LA-ICPMS data, CAg in these minerals are lower: ~0.02 wt% in bornite and ~0.03 wt% in fahlore (Table 20). Galena, marcasite, digenite, magnetite and arsenopyrite are notable in some places. Altaite, tellurobismuthite, coloradoite, V-As-germanite, Ag-betekhtenite, mawsonite, Ge-stannoidite, native gold, acanthite, hessite and Au-Ag tellurides are rare [9,74,75]. Among Te minerals, altaite is the most abundant and forms the impregnation of about 20 microns within chalcopyrite and tennantite in the late paragenesis, together with hessite, coloradoite and Au-Ag tellurides. Admixtures of up to (wt%, EPMA) Hg 0.76, Bi 0.69, Cu 0.47, Au 0.62 and Ag 0.07 were detected in altaite [9]. Hessite containing 0.26 wt% Au, 0.41 wt% Hg and 0.27 wt% Pb occurs as idiomorphic grains in intergrowth with native gold and galena. Coloradoite sometimes contains Ag (4.24 wt%). Sn-Ge sulphosalts, betekhtenite (0.95 wt% Ag) and digenite can be found only in bornite-bearing ores.

4.2.2. The Uzelga Deposit

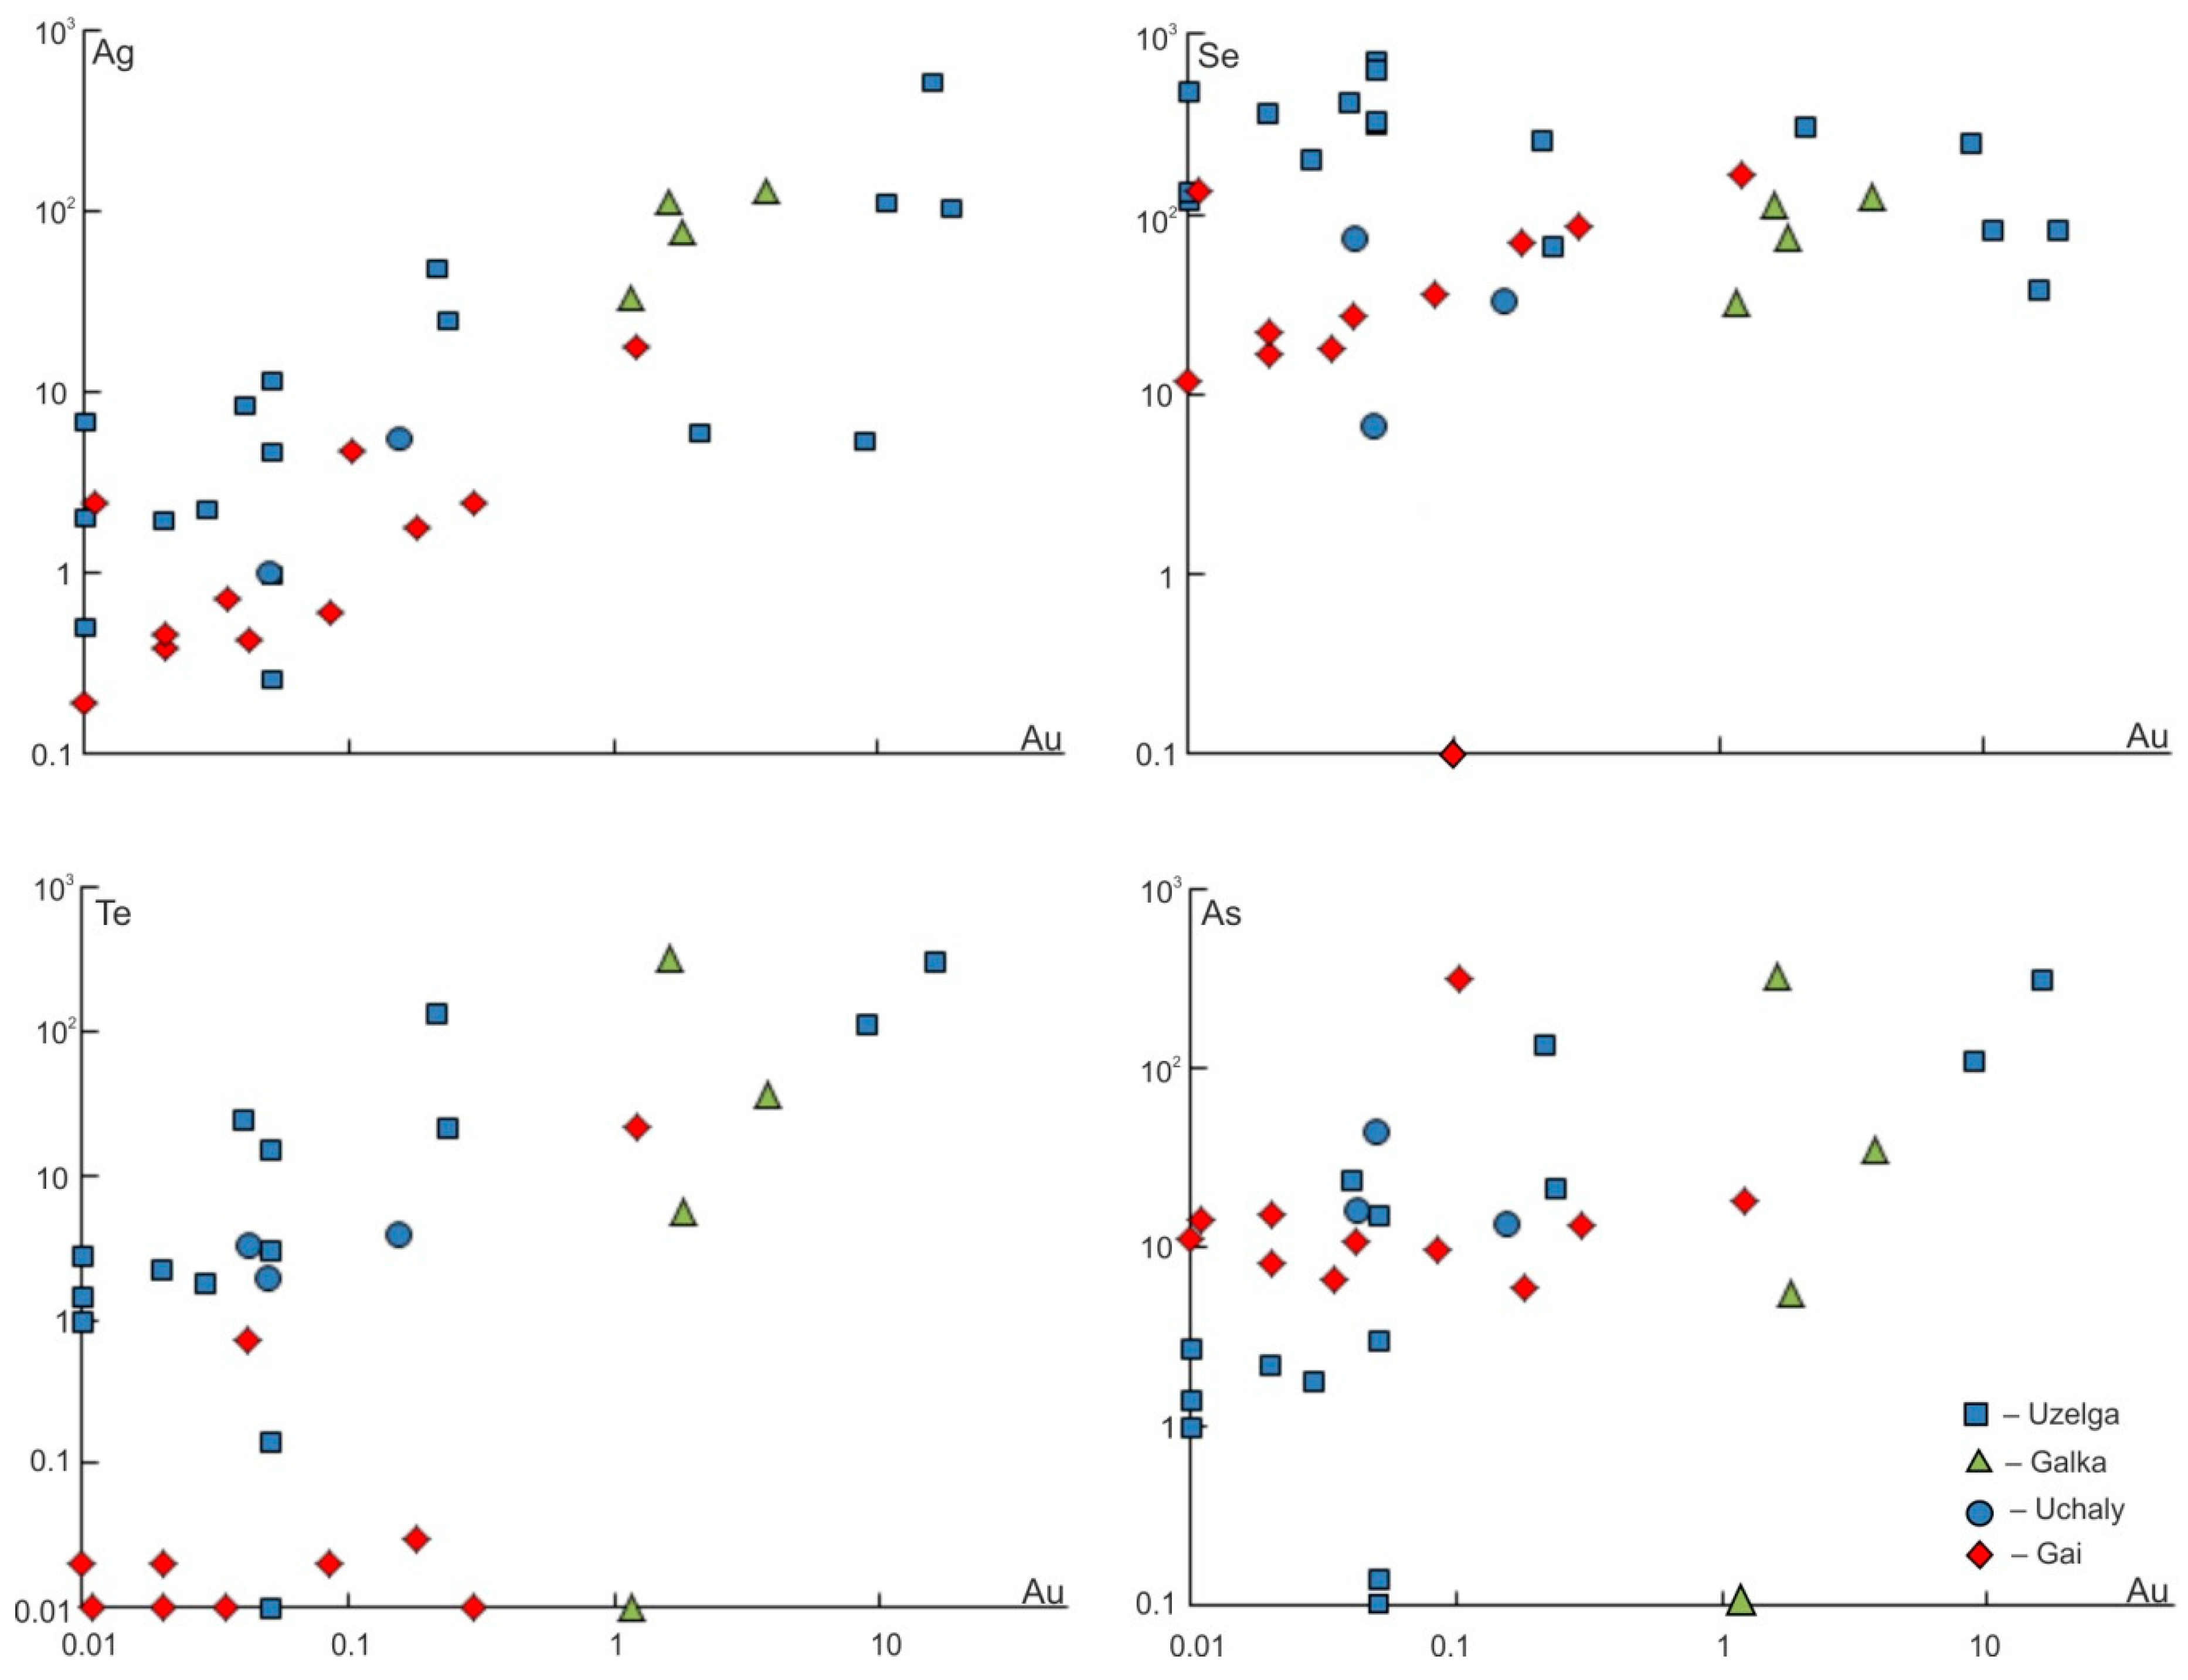
Pyrite is the dominant mineral of the ores (40–90 vol%). Chalcopyrite and sphalerite are the major economic minerals (1–10, up to 15 vol% for chalcopyrite and up to 60 vol% for sphalerite). Fahlore (usually tennantite) is a common mineral in the lower-level ore bodies and is a widespread one (0.5–5 vol%) (Table 20) in the upper ore level predominating above chalcopyrite. Galena also occurs widely but in smaller quantities (up to 0.5 vol%). Pyrrhotite is abundant in the axial zone of the southern part of the largest ore body of the deposit (body 4, see [77]). Hessite, altaite, coloradoite and other Te minerals [25,78] are rare. Gold occurs predominantly in pyrite and chalcopyrite (0.1–20 ppm Au in the mode of “invisible” gold) (Table 19 and Table 20; Figure 23). Au enrichment in reniform pyrite (5.5–19.6 ppm) also exists [25]. The euhedral pyrite associated with this variety is characterised by an order of magnitude lower concentrations of Au, Ag and As. Ag content in pyrite ranges 0.3–204 ppm. Gold contents in chalcopyrite average 1.5–3 ppm (total ranges 0.001–19 ppm Au and 0.5–511 ppm Ag) (Table 21; Figure 24).
Sphalerite that contains emulsion-like inclusions of chalcopyrite contains 1.8 to 11 ppm Au (Table 22; Figure 25). The gold content in pure grains of sphalerite is 0.02 to 5.5 ppm. Therefore, gold-bearing chalcopyrite inclusions in sphalerite are considered to be responsible for an essential part of bulk gold. Galena contains various combinations of Au 0.05–0.41 wt%, Ag 0.01–0.34 wt%, Se 0.1–0.2 wt% and Te 0.1–0.14 wt% (EPMA). Additionally, Au is present as a trace element in some tellurides, such as altaite (0.02–5.2 wt%) and hessite (0.02–0.63 wt%).
Fahlore is the main concentrator of Ag. Its dominant variety is a tennantite-(Zn). Tetrahedrite grains are commonly inhomogeneous with internal mosaic texture or regular growth-zoning. The Ag content in tennantite from the upper-level ores ranges from 0.1 to 0.6 wt% (average 0.4 wt%), whereas tennantite from the lower ore level commonly contains <0.2 wt% Ag. The largest concentration of Ag (0.2–0.5 wt%) and Hg (up to 1–2 wt%) in fahlore of the lower ore bodies (bodies 3 and 4) was found near contacts with mafic dykes and near the obtuse east end of the ore body 4.

4.2.3. The Uchaly Deposit

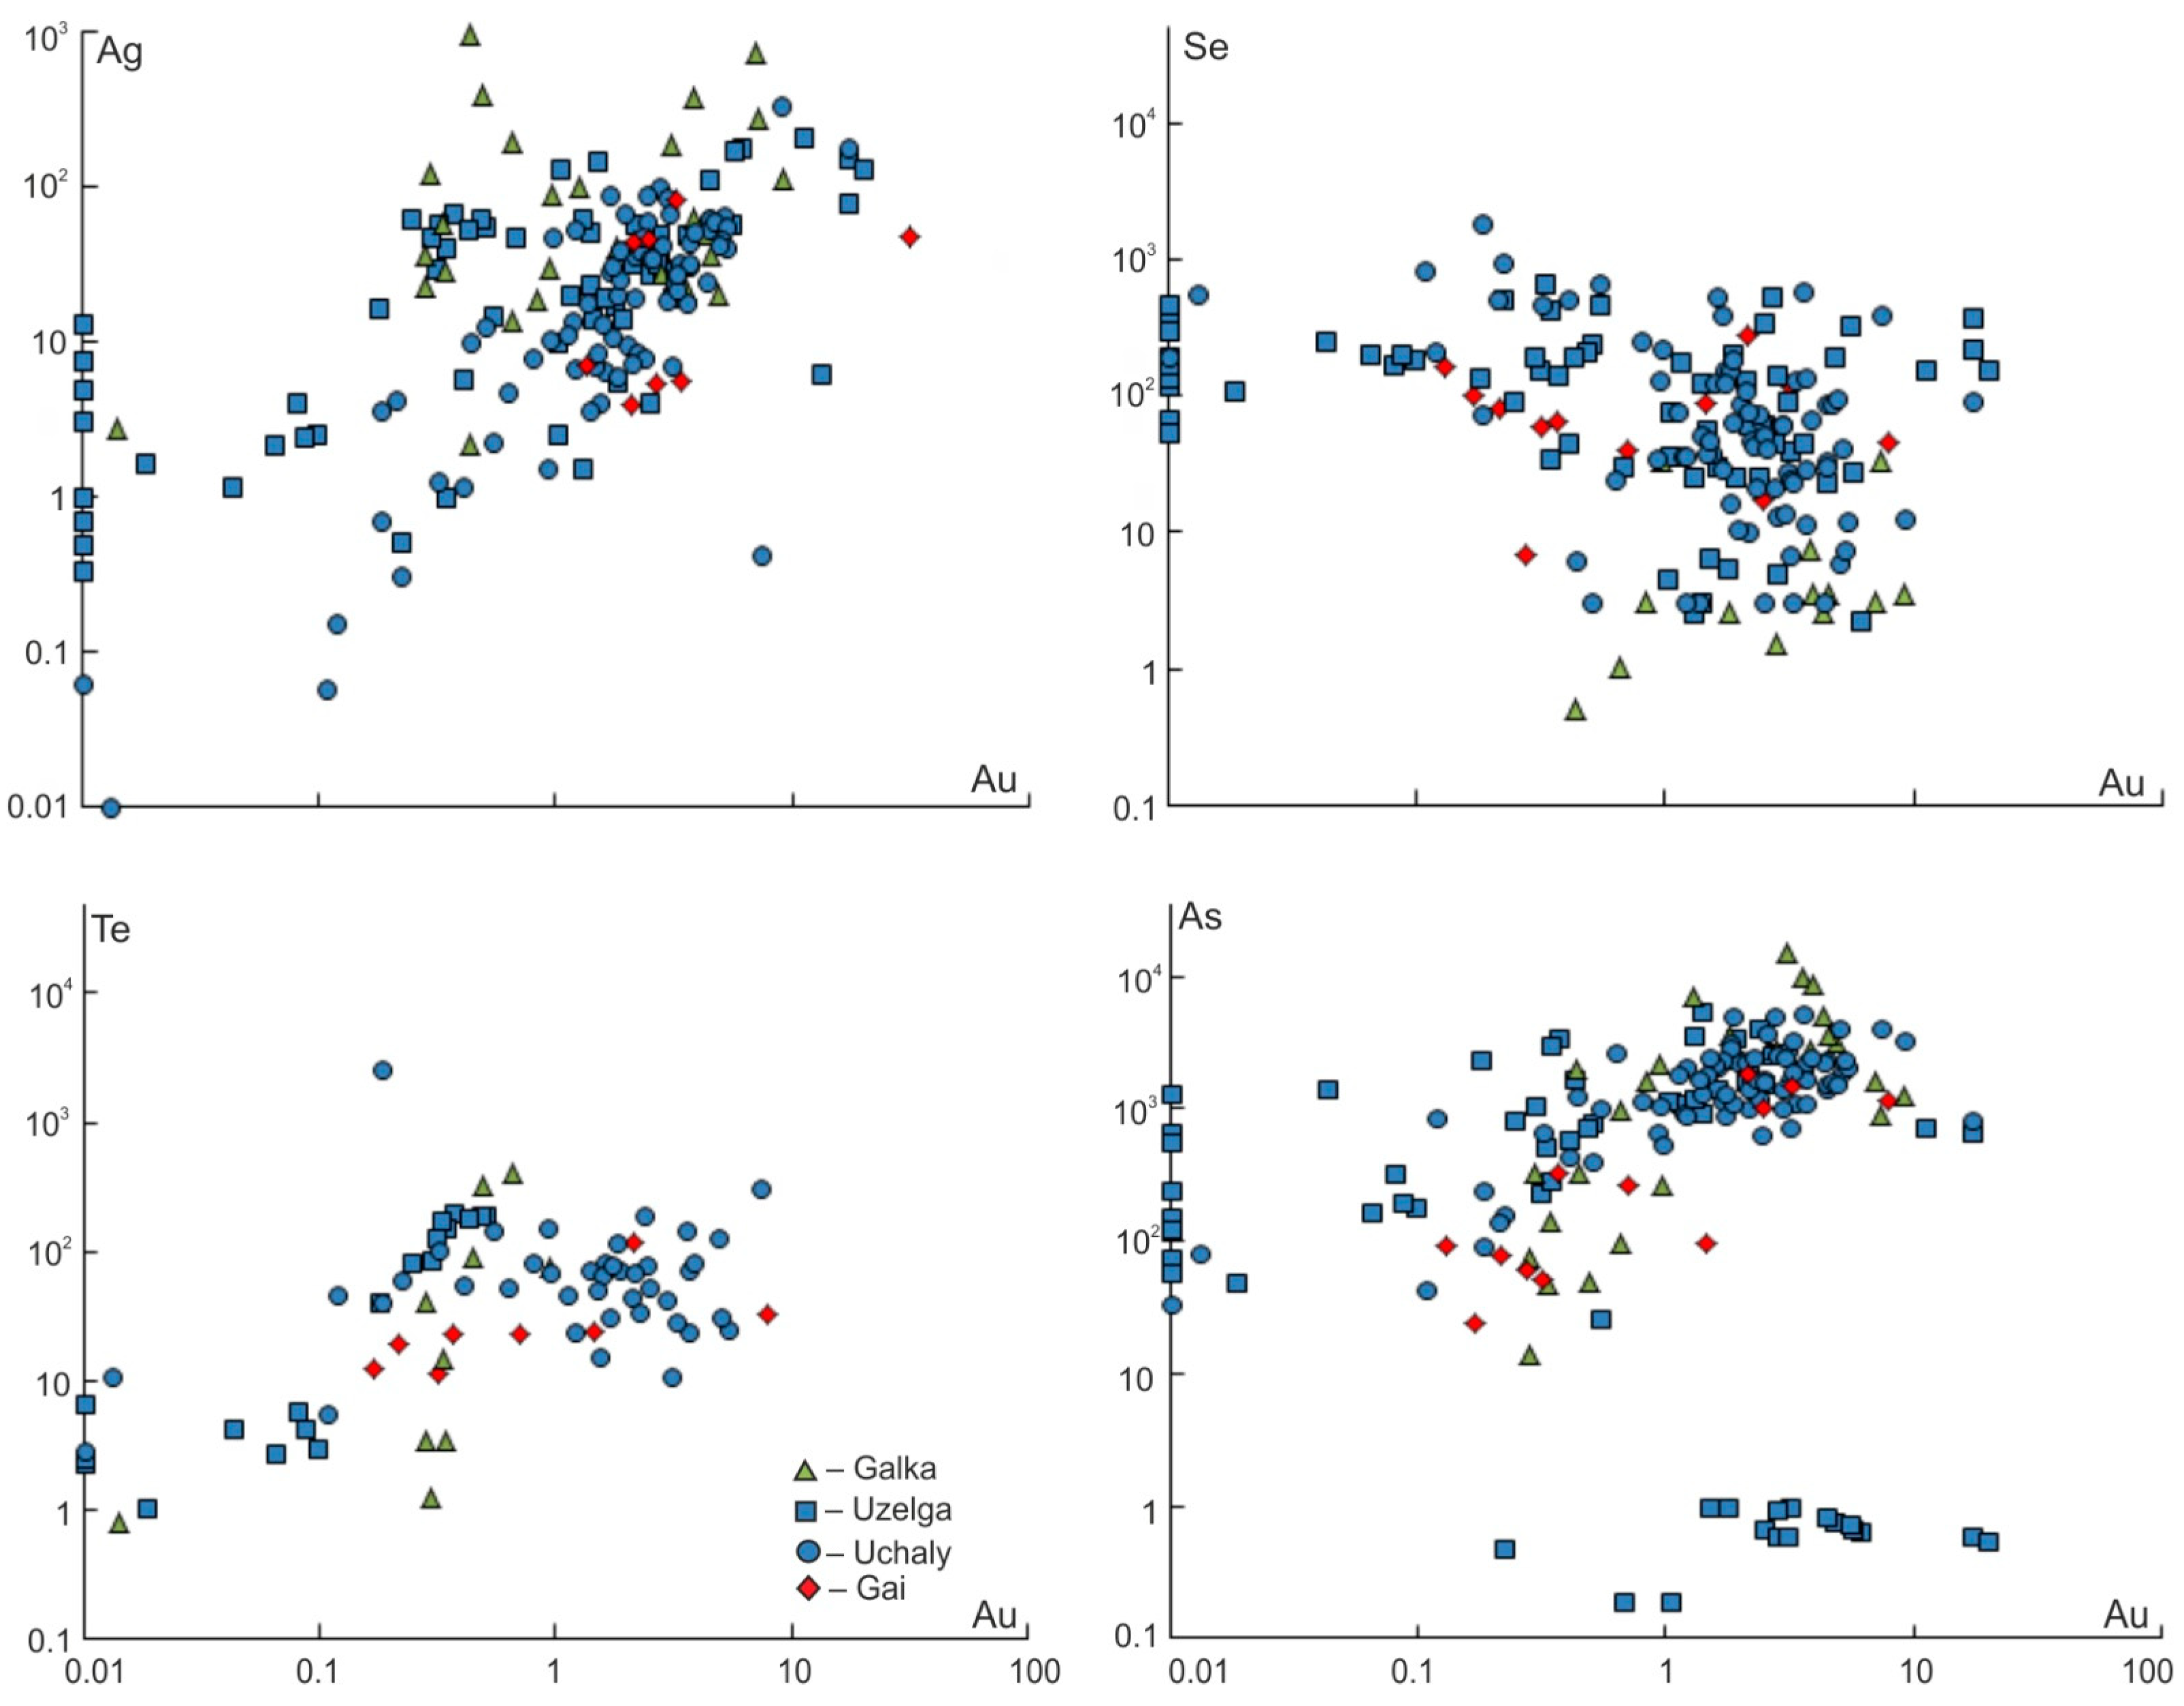
In the Uchaly deposit, the bulk of Au and Ag occurs in pyrite (Figure 23), with average contents ~1.6 ppm Au and ~13 ppm Ag (Table 19 and Table 20; Figure 23). Most of the gold (approximately 85%) is represented by dispersed and finely impregnated Au in pyrite, while free gold constitutes only 16% [15,88,89]. Gold occurs mainly in the zinc, copper and pyrite concentrates (4.0, 2.5 and 1.5 g/t, respectively). Contents of Au and trace elements in sulphides are the following (ppm): pyrite—Au 0.01–29.4, Ag 0.01–326, As 93–5370, Sb 1–990; chalcopyrite—Au 0.04–0.15, Ag < 2–5.7; tennantite—Au < 0.5, Ag 3000 (LA-ICPMS, Table 19, Table 20, Table 21 and Table 22; Figure 23, Figure 24 and Figure 25); sphalerite—Au 0.01–1.78, Ag 6–20 (INAA).
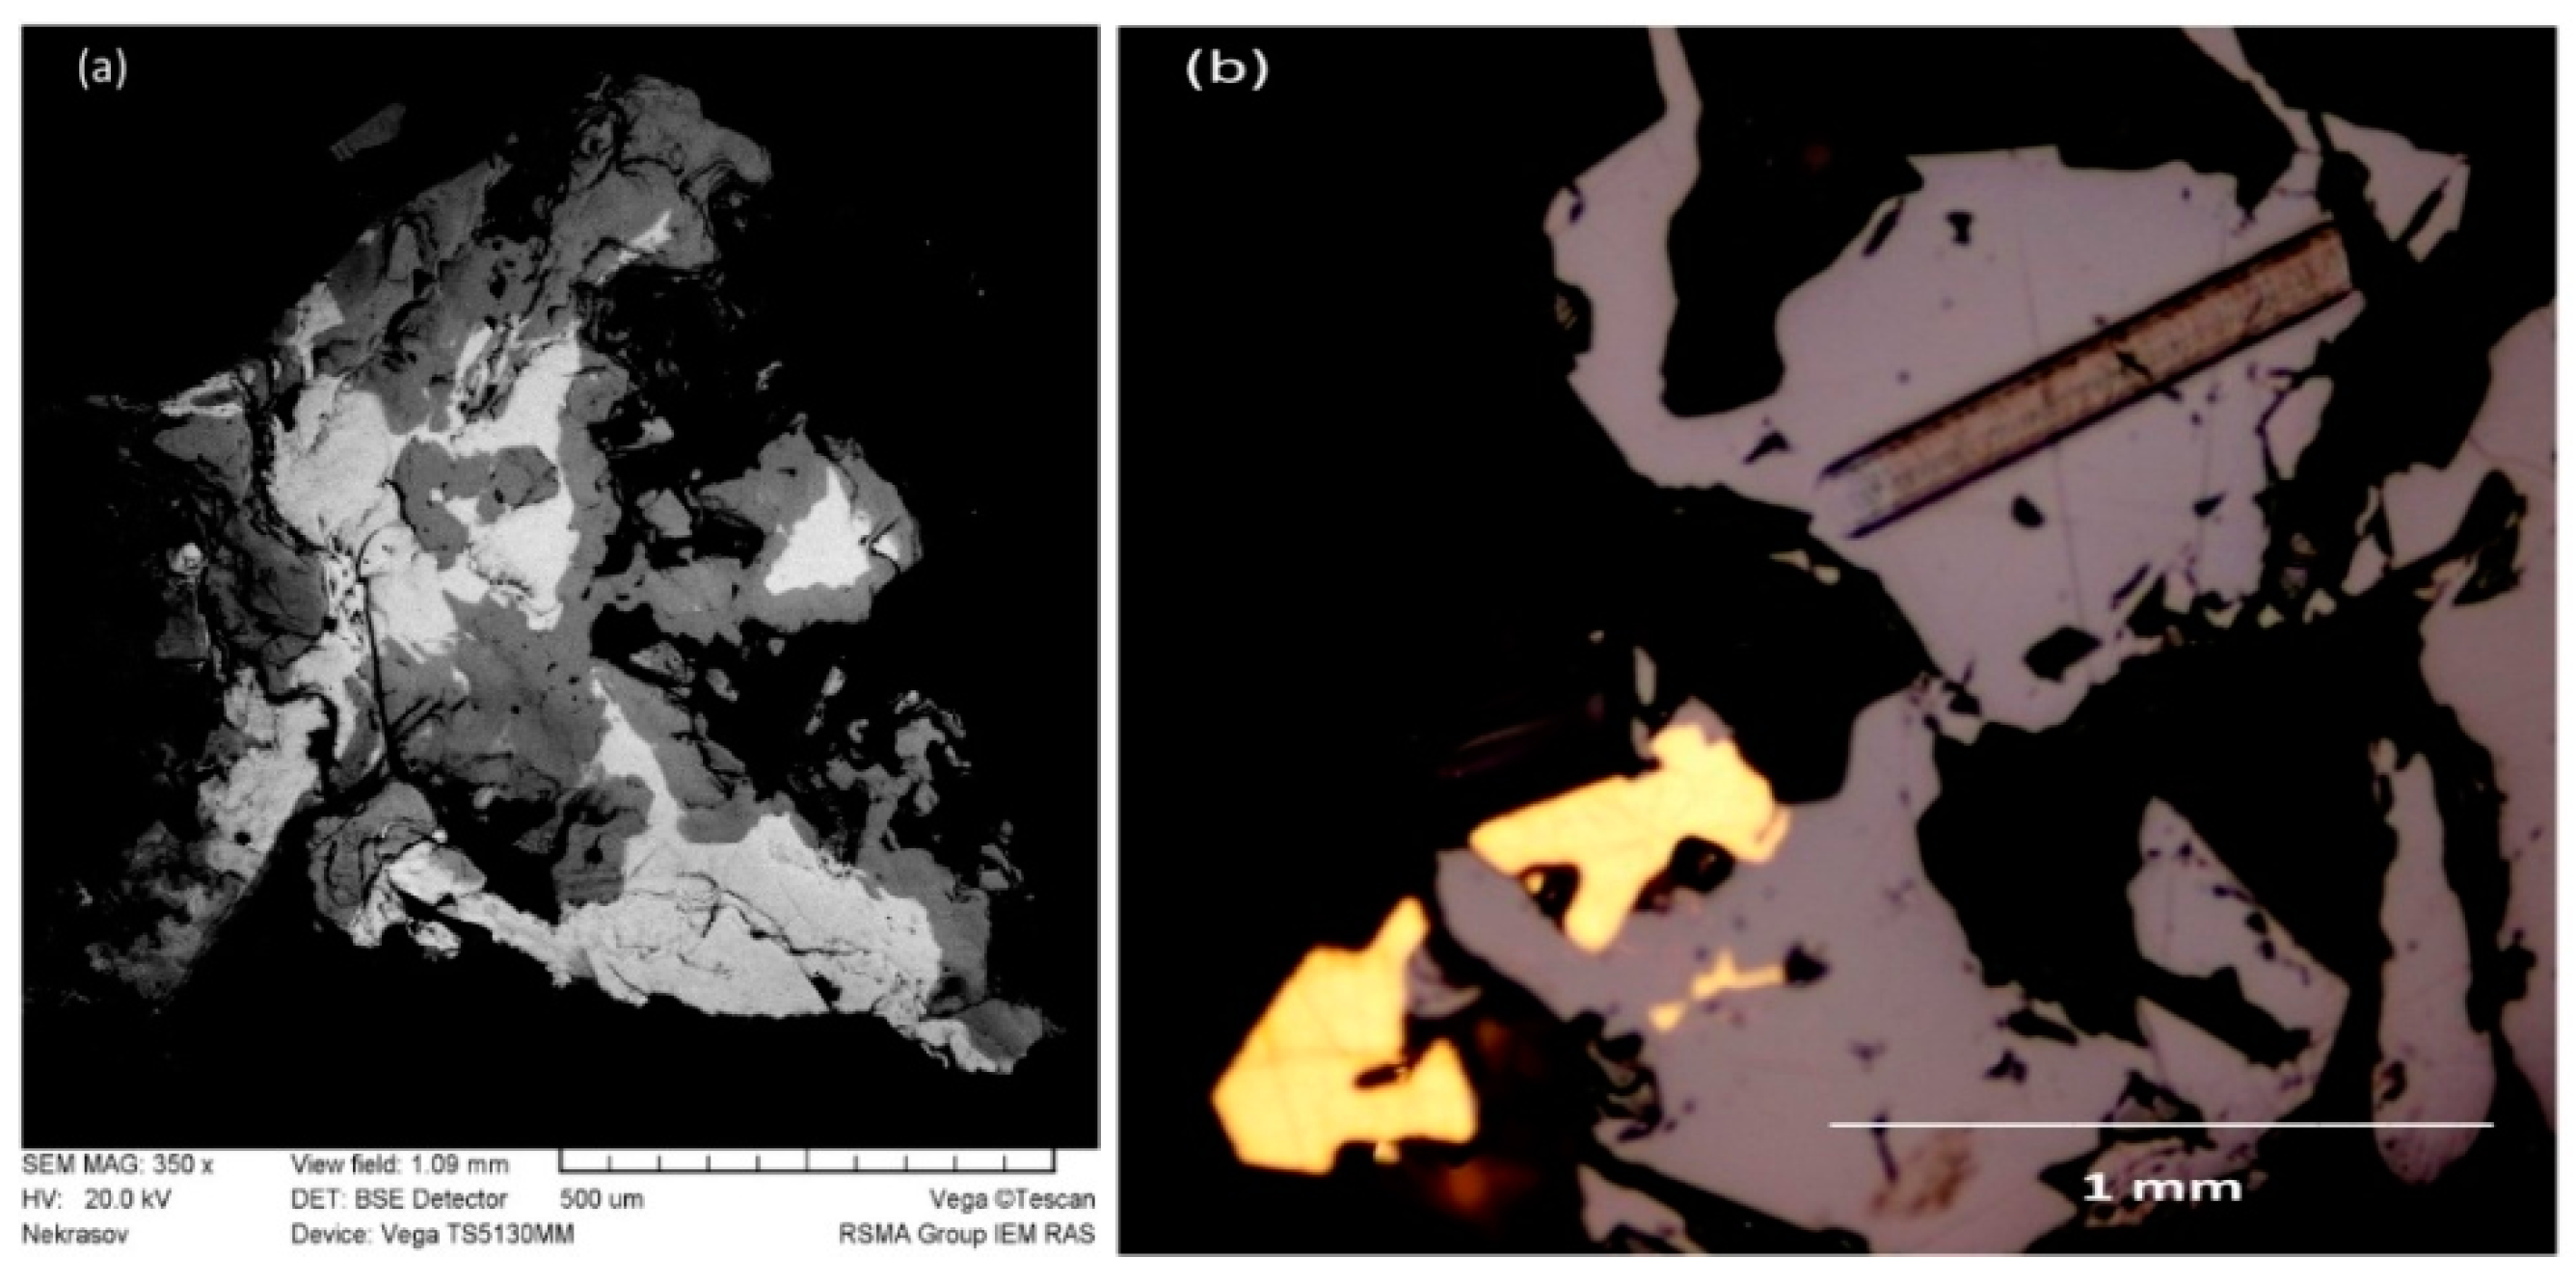
In the massive ores, visible gold was found in near-contact zones with a gabbro-diorite dyke (up to 20 m thick) or in areas that experienced local dynamometamorphism and tectonic flow. The gold aggregates (Figure 26a) have a fineness of 610–640 and 724–735 and are usually found in intergrowth with galena, chalcopyrite and tennantite-(Zn). As a rule, this mineral association cements recrystallised coarse-grained pyrite, often cataclased.
The mineral forms of silver (Table 18) are represented by Ag-containing tetrahedrite and tennantite (Figure 26b), and rarer electrum, silver tellurides (hessite, empressite), sulphides (acanthite, uytenbogaardtite, petrovskaite) and sulphosalts (freibergite, polybasite and pearceite; Figure 27). Silver impurity in pyrite (up to 400 ppm, EPMA) was also recorded. A strong positive correlation of silver and antimony was found for the fahlore (Figure 27).

4.2.4. The Galka Deposit

Along with the usually predominant pyrite, sphalerite, marcasite, chalcopyrite and less often galena, arsenopyrite, pyrrhotite, native gold, native silver, acanthite, freibergite, argentotetrahedrite, pyrargyrite, stephanite, proustite, polybasite and rare Au-Ag minerals petrovskaite, uytenbogaardtite and kurilite appear at the Galka deposit [15]. A special feature of pyrite of the Galka deposit is the increased content of As (0.027–0.878 wt%, avaverage 0.26 wt%, INAA; up to 1.5 wt%, average 0.05 wt%, LA-ICP-MS, Table 19) and Sb (7.4–873.4 ppm, average 184.2 ppm). The Sb content directly correlates with Au in pyrite (0.44–9.59 ppm, average 4.16 ppm), and Au is also directly related to Te (2.4–453.9 ppm, average 70.05 ppm) and Ag (2.15–711.7 ppm, average 137.0 ppm).
PGE shows extremely low concentrations in the sulphides of VMS ores (Table 23), although ores and industrial products contain a noticeable amount of PGE [24,25,28]. In the common VMS ores (Au 0.2–3 ppm) of the Urals, essential parts (47–87%, Figure 28a and Figure 29) of gold are incorporated in the sulphides in the form of invisible gold. Thus, Au fails to tailings with pyrite and partly with other sulphides [15,72]. The fraction of native gold as an Au-concentrator ranges 13–90%, but this number decreases to 13–53% if the technological bulk probes enriched in Au (7.9–21.2 ppm) are excluded (Figure 28a). Native gold and other gold minerals occur in ore samples with bulk Au content higher than 3 g/t [37,67,104,105].
In the VMS deposits of the Urals, native gold forms grains and aggregates with size of about 1–50 μm and up to 150 μm. Larger grains are rare [103]. The fineness of gold ranges from 340 to 900 for slightly transformed deposits and from 500 to 980 for highly metamorphosed deposits (Figure 28b and Figure 30). Ag content varies from 11.88 to 39.45 wt%, and admixtures (wt%) of Pt up to 2.23, Pd up to 0.85, Te up to 1.17, Hg up to 0.89, Fe up to 0.5 and Se up to 0.49 are found. Hg-bearing native gold (8–11 wt% Hg) rarely occurs. According to the high-resolution transmission electron microscopy (HR-TEM) data, nano-sized particles of native gold (1–50 nm) occur in pyrite of the VMS ores [15].
Characterising native Au-Ag solid solution, we adhere to the terminology adopted in early publications [106,107]: native silver, Ag1.0Au0.0–Ag0.94Au0.06 (0–100‰); küstelite, Ag0.94Au0.06–Ag0.85Au0.15 (100–250‰); electrum, Ag0.85Au0.15–Ag0.44Au0.56 (250–700‰); high-fineness gold, Ag0.44Au0.56–Ag0.0Au1.0 (700–1000‰). Native gold with fineness ~780–860 is commonly dominated in VMS deposits of the Urals (Figure 30), but more low-fineness gold is found in some VMS deposits of the Urals, the Galka, for example (fineness ~640–720).

4.3. Experimental Results

4.3.1. Geochemistry of Au in Sulphides

An experimental study of concentration mechanisms of NM in base metal sulphides was conducted in the frame of the Russian Scientific Foundation grant No. 14–17-00693 “Distribution and structural-chemical state of noble metals in sulphides through the ore deposits from magmatic to hydrothermal as an indicator of the conditions of mineralisation” (2014–2018), led by the first author. As a result of work on the sources of synchrotron radiation measurement, X-ray absorption spectra (XANES/EXAFS) and interpretation of the resulting data, and using X-ray photoelectron spectroscopy, the position of gold in the structure of sulphides was revealed. Main results were published in a series of papers devoted to Au in covellite CuS [16,17], in Fe-S and Fe-As-S minerals [19,52], in sphalerite (e.g., [92]), Au, Ag, Pt and Pd in pyrite and pyrrhotite [91], Pt in pyrite [22] and pyrrhotite [23].
Gold can form a solid solution with Fe-S and Cu-Fe-S minerals. When pyrite is heated, chemically bound Au, even in the presence of liquid sulphur, is released as a metal, while in copper minerals, heating, on the contrary, promotes the transition of the metal into a “chemically bound” form. In general, results [17,19,22,52,91,92] suggest that Au and other NM (PGE, Ag) can occur in the chemically bound state in the Cu-Fe and Cu-Zn-Fe sulphide ores.
Below, we will focus on zinc sulphide and its close crystal-chemical “relative” greenockite. Both minerals—unlike pyrite and arsenopyrite (see, e.g., [19,52,91] and references within)—are much less studied experimentally (e.g., [108]). Zinc sulphide occurs in nature in two polytypes—sphalerite and würtzite—or their mixture. These phases have different chemical elements’ solubility limits. Both forms of ZnS are important in mineralogy as many minerals crystallise in the same structures. For example, there are würtzite and sphalerite forms of AgI (iodargyrite and miersite) and CdS (greenockite and hawleyite) [109]. Most of our gas vapour transport and salt flux experiments led to the formation of pure cubic sphalerite. The existence of minor amounts of würtzite in sphalerite crystals, probably arising due to the changes in the sulphur fugacity in the system, contributed to the formation of low-Au-saturated ZnS (<50 ppm Au) with inhomogeneity distribution of all the admixtures. However, we never obtained pure würtzite using the mentioned methods. To supplement missing data on Au solubility, we used synthetic crystals of greenockite as a model compound for the würtzite-type structure.

4.3.2. Noble Metal Speciations in Synthetic Sphalerite and Greenockite

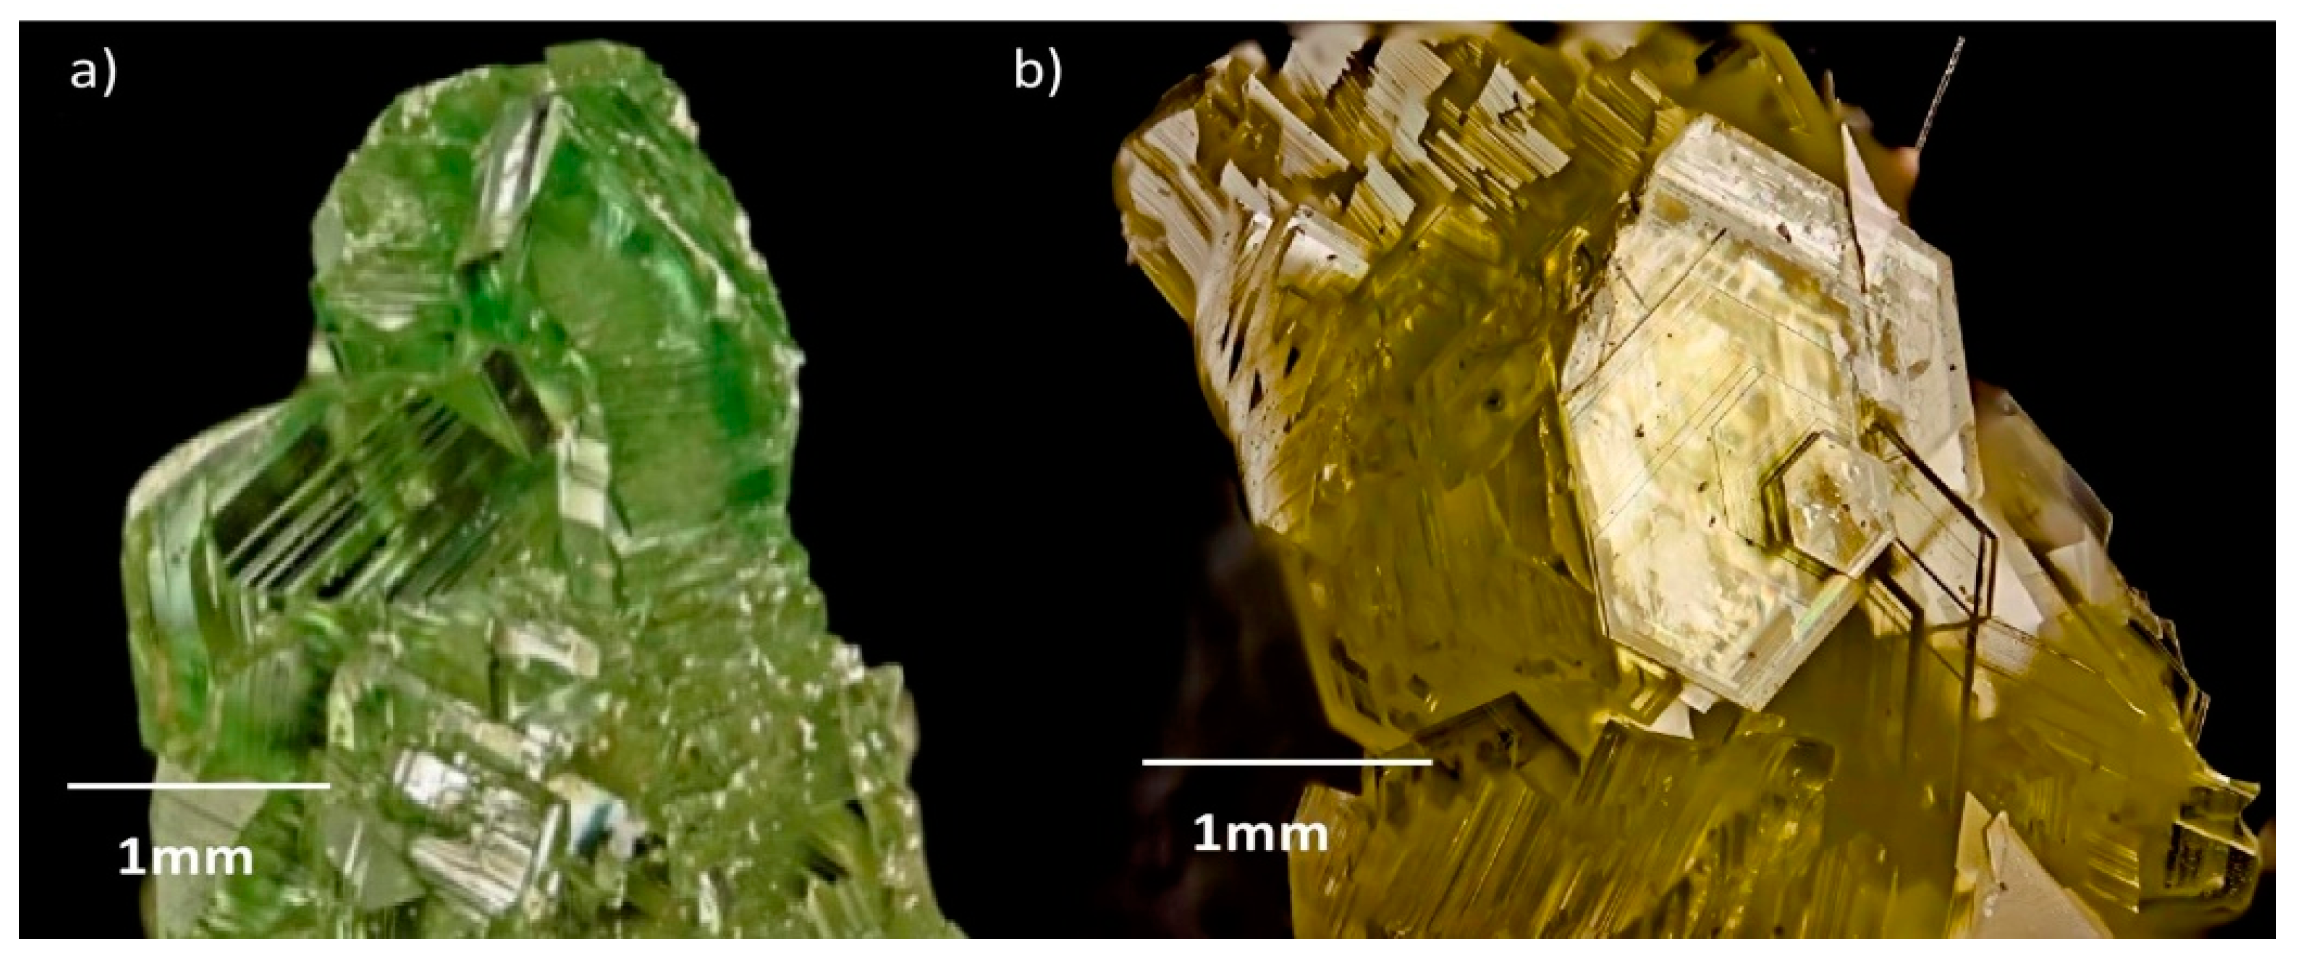
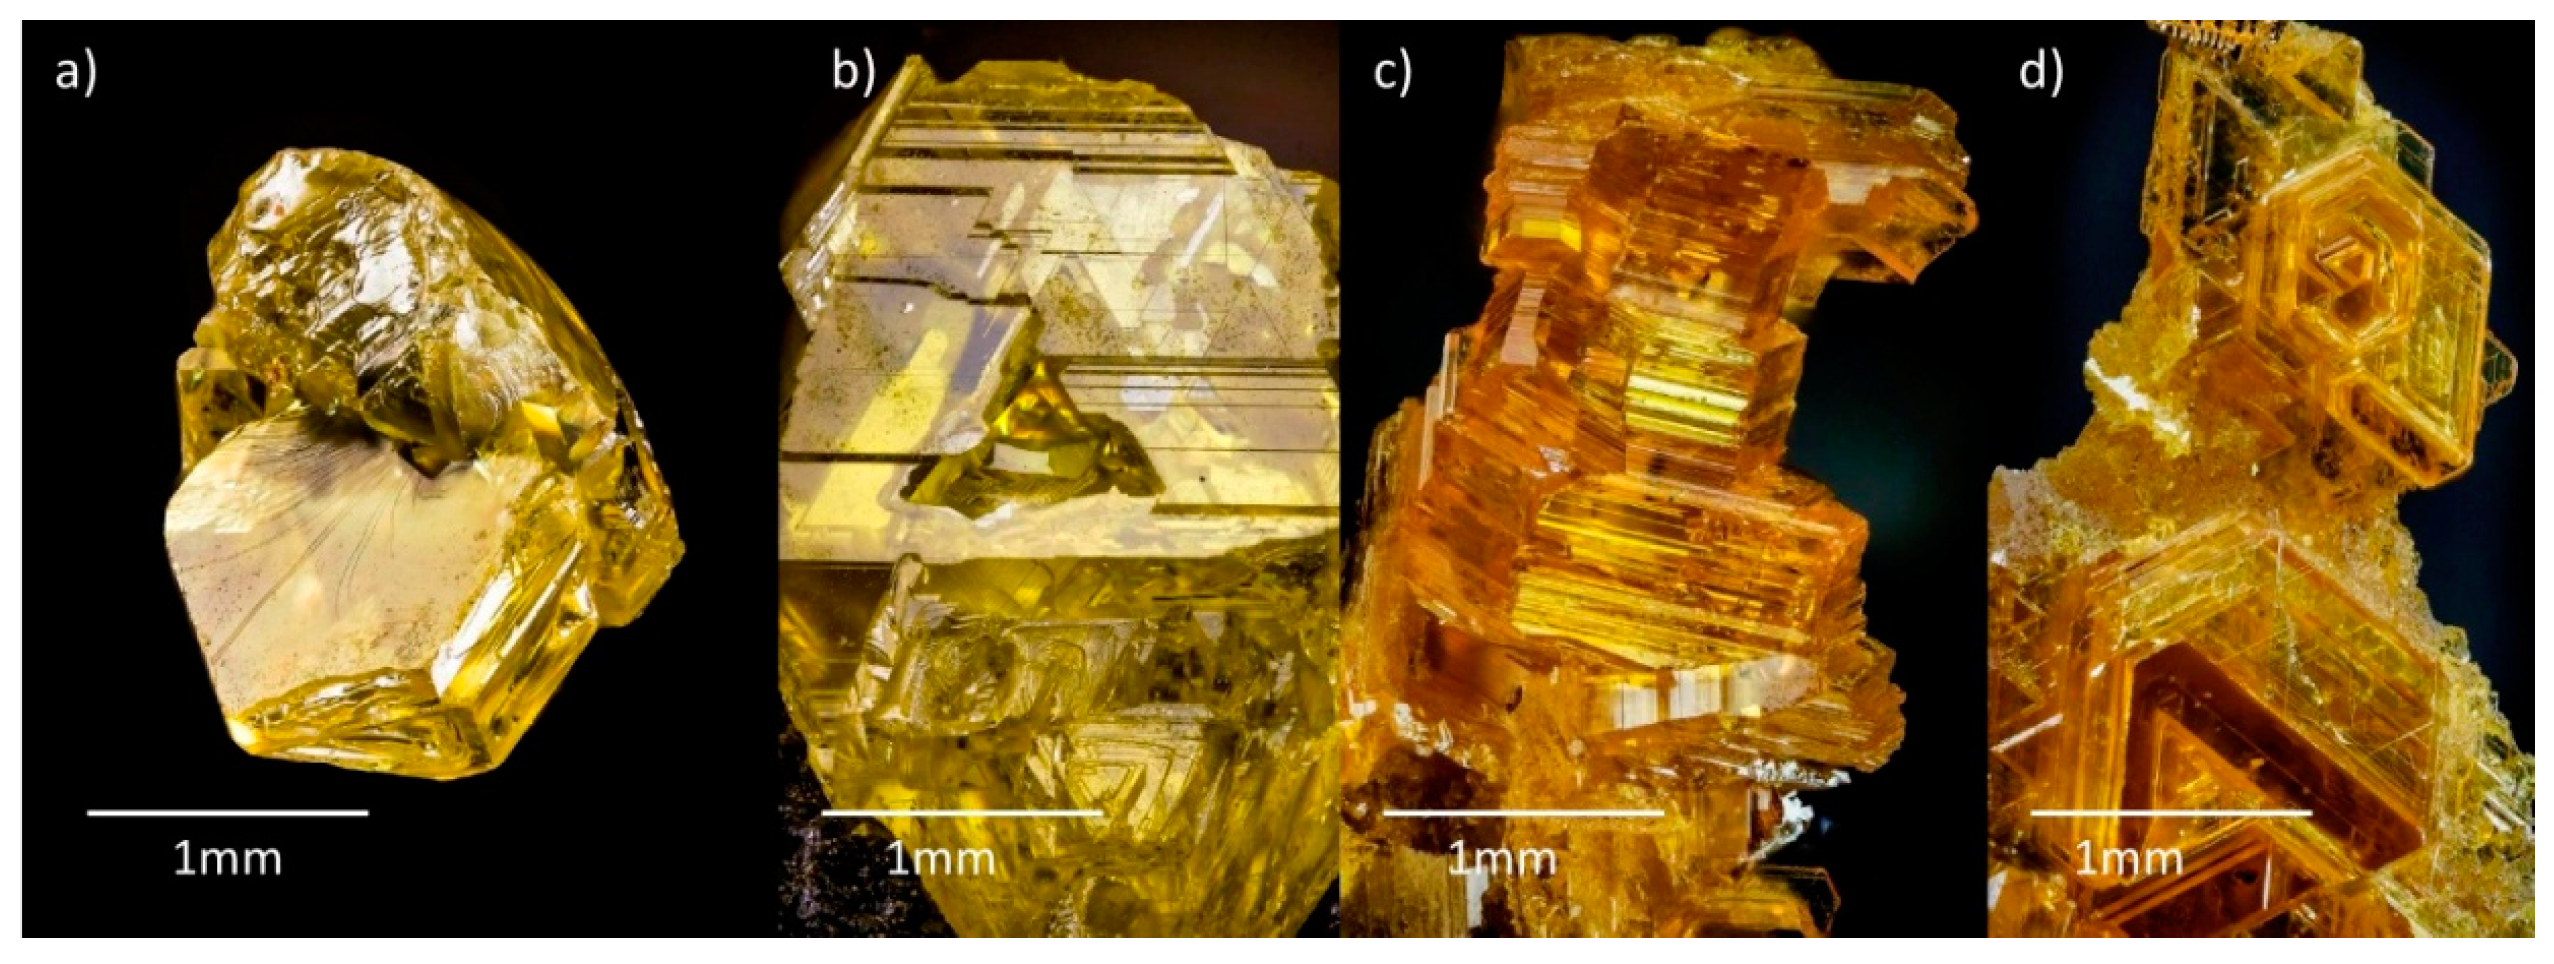
For synthesis experiments, the starting mixtures were pure ZnS (würtzite) or CdS, and several milligrams of In2S3, FeS and MnS for sphalerite or greenockite. The initial phases were powdered in the agate mortar and then loaded into silica glass ampoules (10–11 mm outer diameter, 8 mm inner diameter and ~110 mm length) together with Au metal wire and transport agent or salt mixture. We used mainly the eutectic mixture of NaCl/KCl in the salt flux experiments, and the amount of salt flux melt was approximately 50–65% of the ampoule volume. We used both I2 and NH4Cl as transport agents in chemical vapour transport experiments. The total quantity of the obtained crystals was higher when we used NH4Cl compared to I2. It is important to note that we control the activity of gold by the presence of pure metal wire inside the ampoule. Therefore, the concentration of gold in sphalerite represents the maximum possible value for the given parameters. In one series of chemical vapour transport experiments, a tiny piece of sulphur was added before sealing. Then, we performed a synthesis without adding any additional sulphur. To understand the influence of f S2 on the concentration of gold in the final crystals, different amounts (from 0 to 0.035 g) of sulphur were added to the ampoules of the chemical vapour transport suite. The loaded ampoules were evacuated up to 10-4 bar, sealed with an oxygen-gas burner and placed into a horizontal tube furnace that was then heated to the synthesis temperature over 2–3 h and then kept at this temperature during 16–30 days. The temperature gradient in the furnace was 50–100 °C, and the measured temperature at the hot end of the ampoules was 850 °C. At the end of the experiment, the ampoules were quenched in cold water. Sphalerite crystals were found in the cold end of the ampoules (Figure 31, Figure 32 and Figure 33). It is important to note that the attempts to synthesise Au-bearing sphalerite at the lower temperatures using other salt mixtures (e.g., CsCl/NaCl/KCl mixture at 645 and 555 °C at the hot and cold end of the ampoule respectively, and LiCl/RbCl mixture at 470 and 340 °C, respectively) led to the formation of tiny crystals of sphalerite with the gold content < 5 ppm. These crystals cannot be used for the XAFS study due to the difficulties in measuring low amounts of the impurities. Therefore, we did not use these samples in our further observations. Only high-temperature synthesis (≥850 °C in the hot end of the ampoule) led to the crystallisation of Au-rich crystals.
The synthesis of Ag-bearing sphalerite using the gas transport method and silver wire led to the formation of Ag-bearing sphalerite with heterogeneous distribution of the dopant in some cases. We also tried to grow crystals of Ag-bearing sphalerite at low temperatures in an eutectic mixture of LiCl/RbCl at 550 and 460 °C at the hot and cold ends of the ampoule, respectively. The products of the synthesis contained the needles of Ag2S. According to the phase diagram, the optimal way of Ag-bearing sphalerite synthesis is conducted by the calculated amount of Ag2S as a dopant source instead of Ag wire for such experiments.
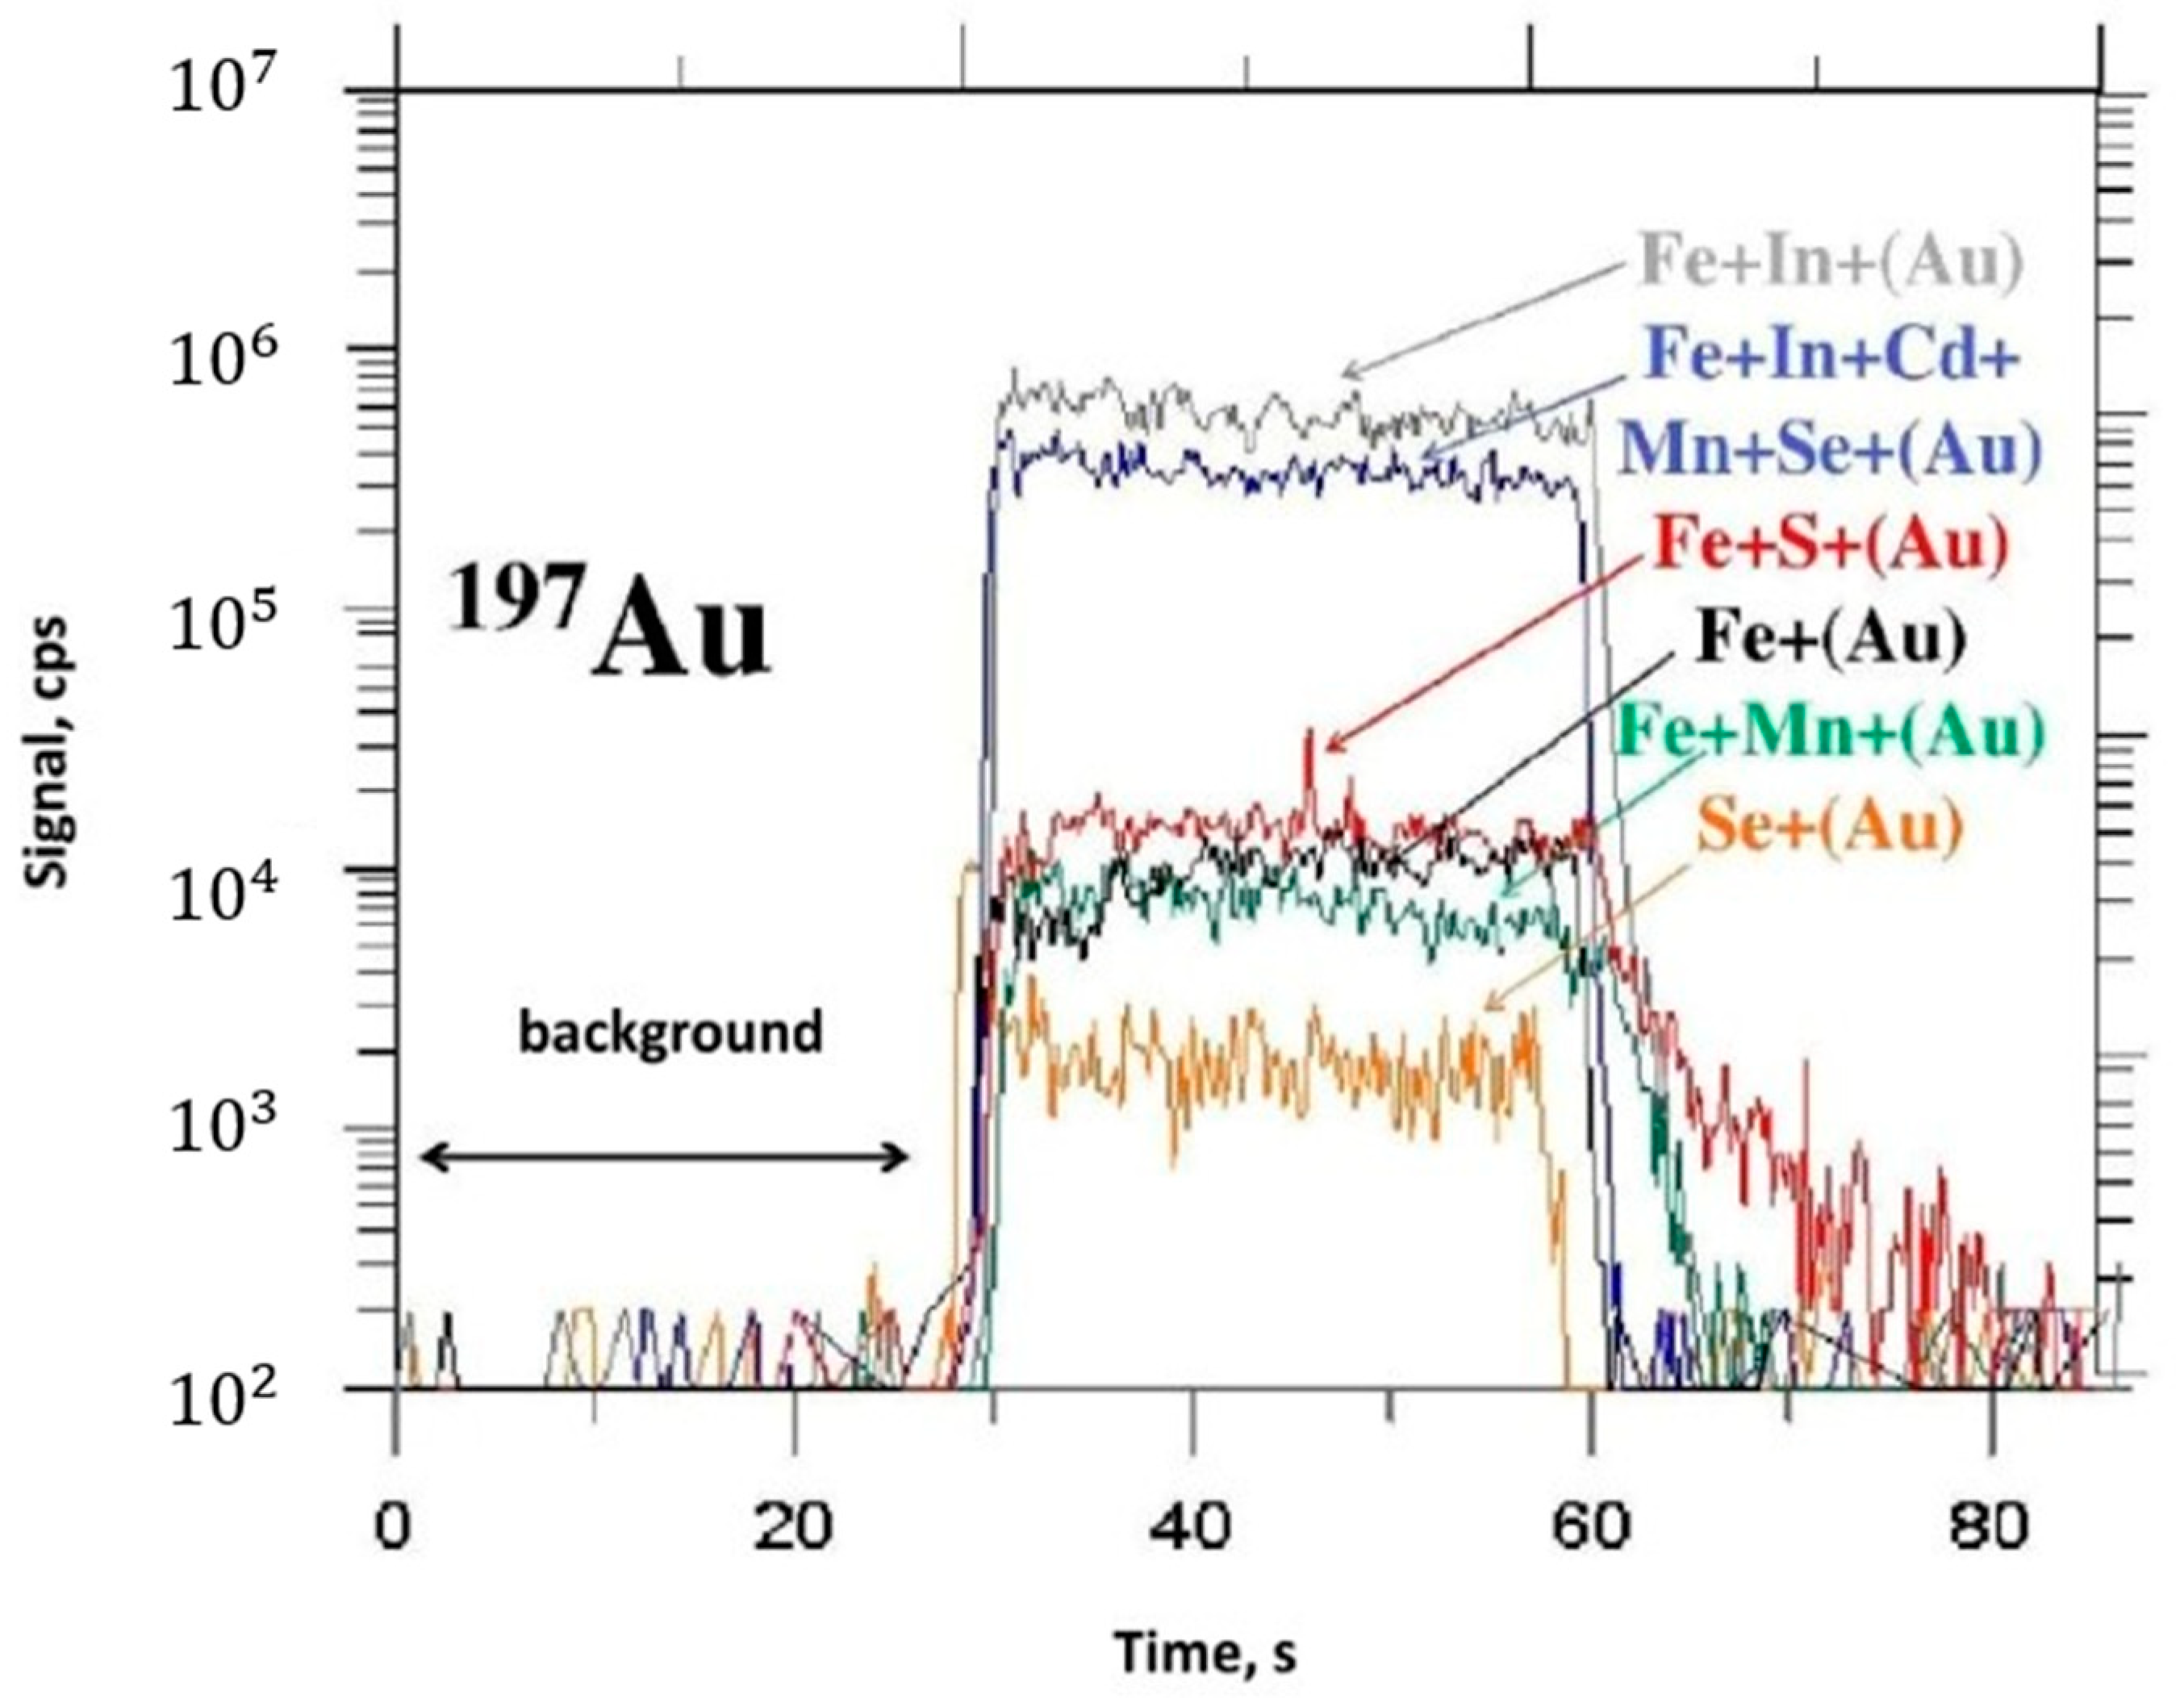
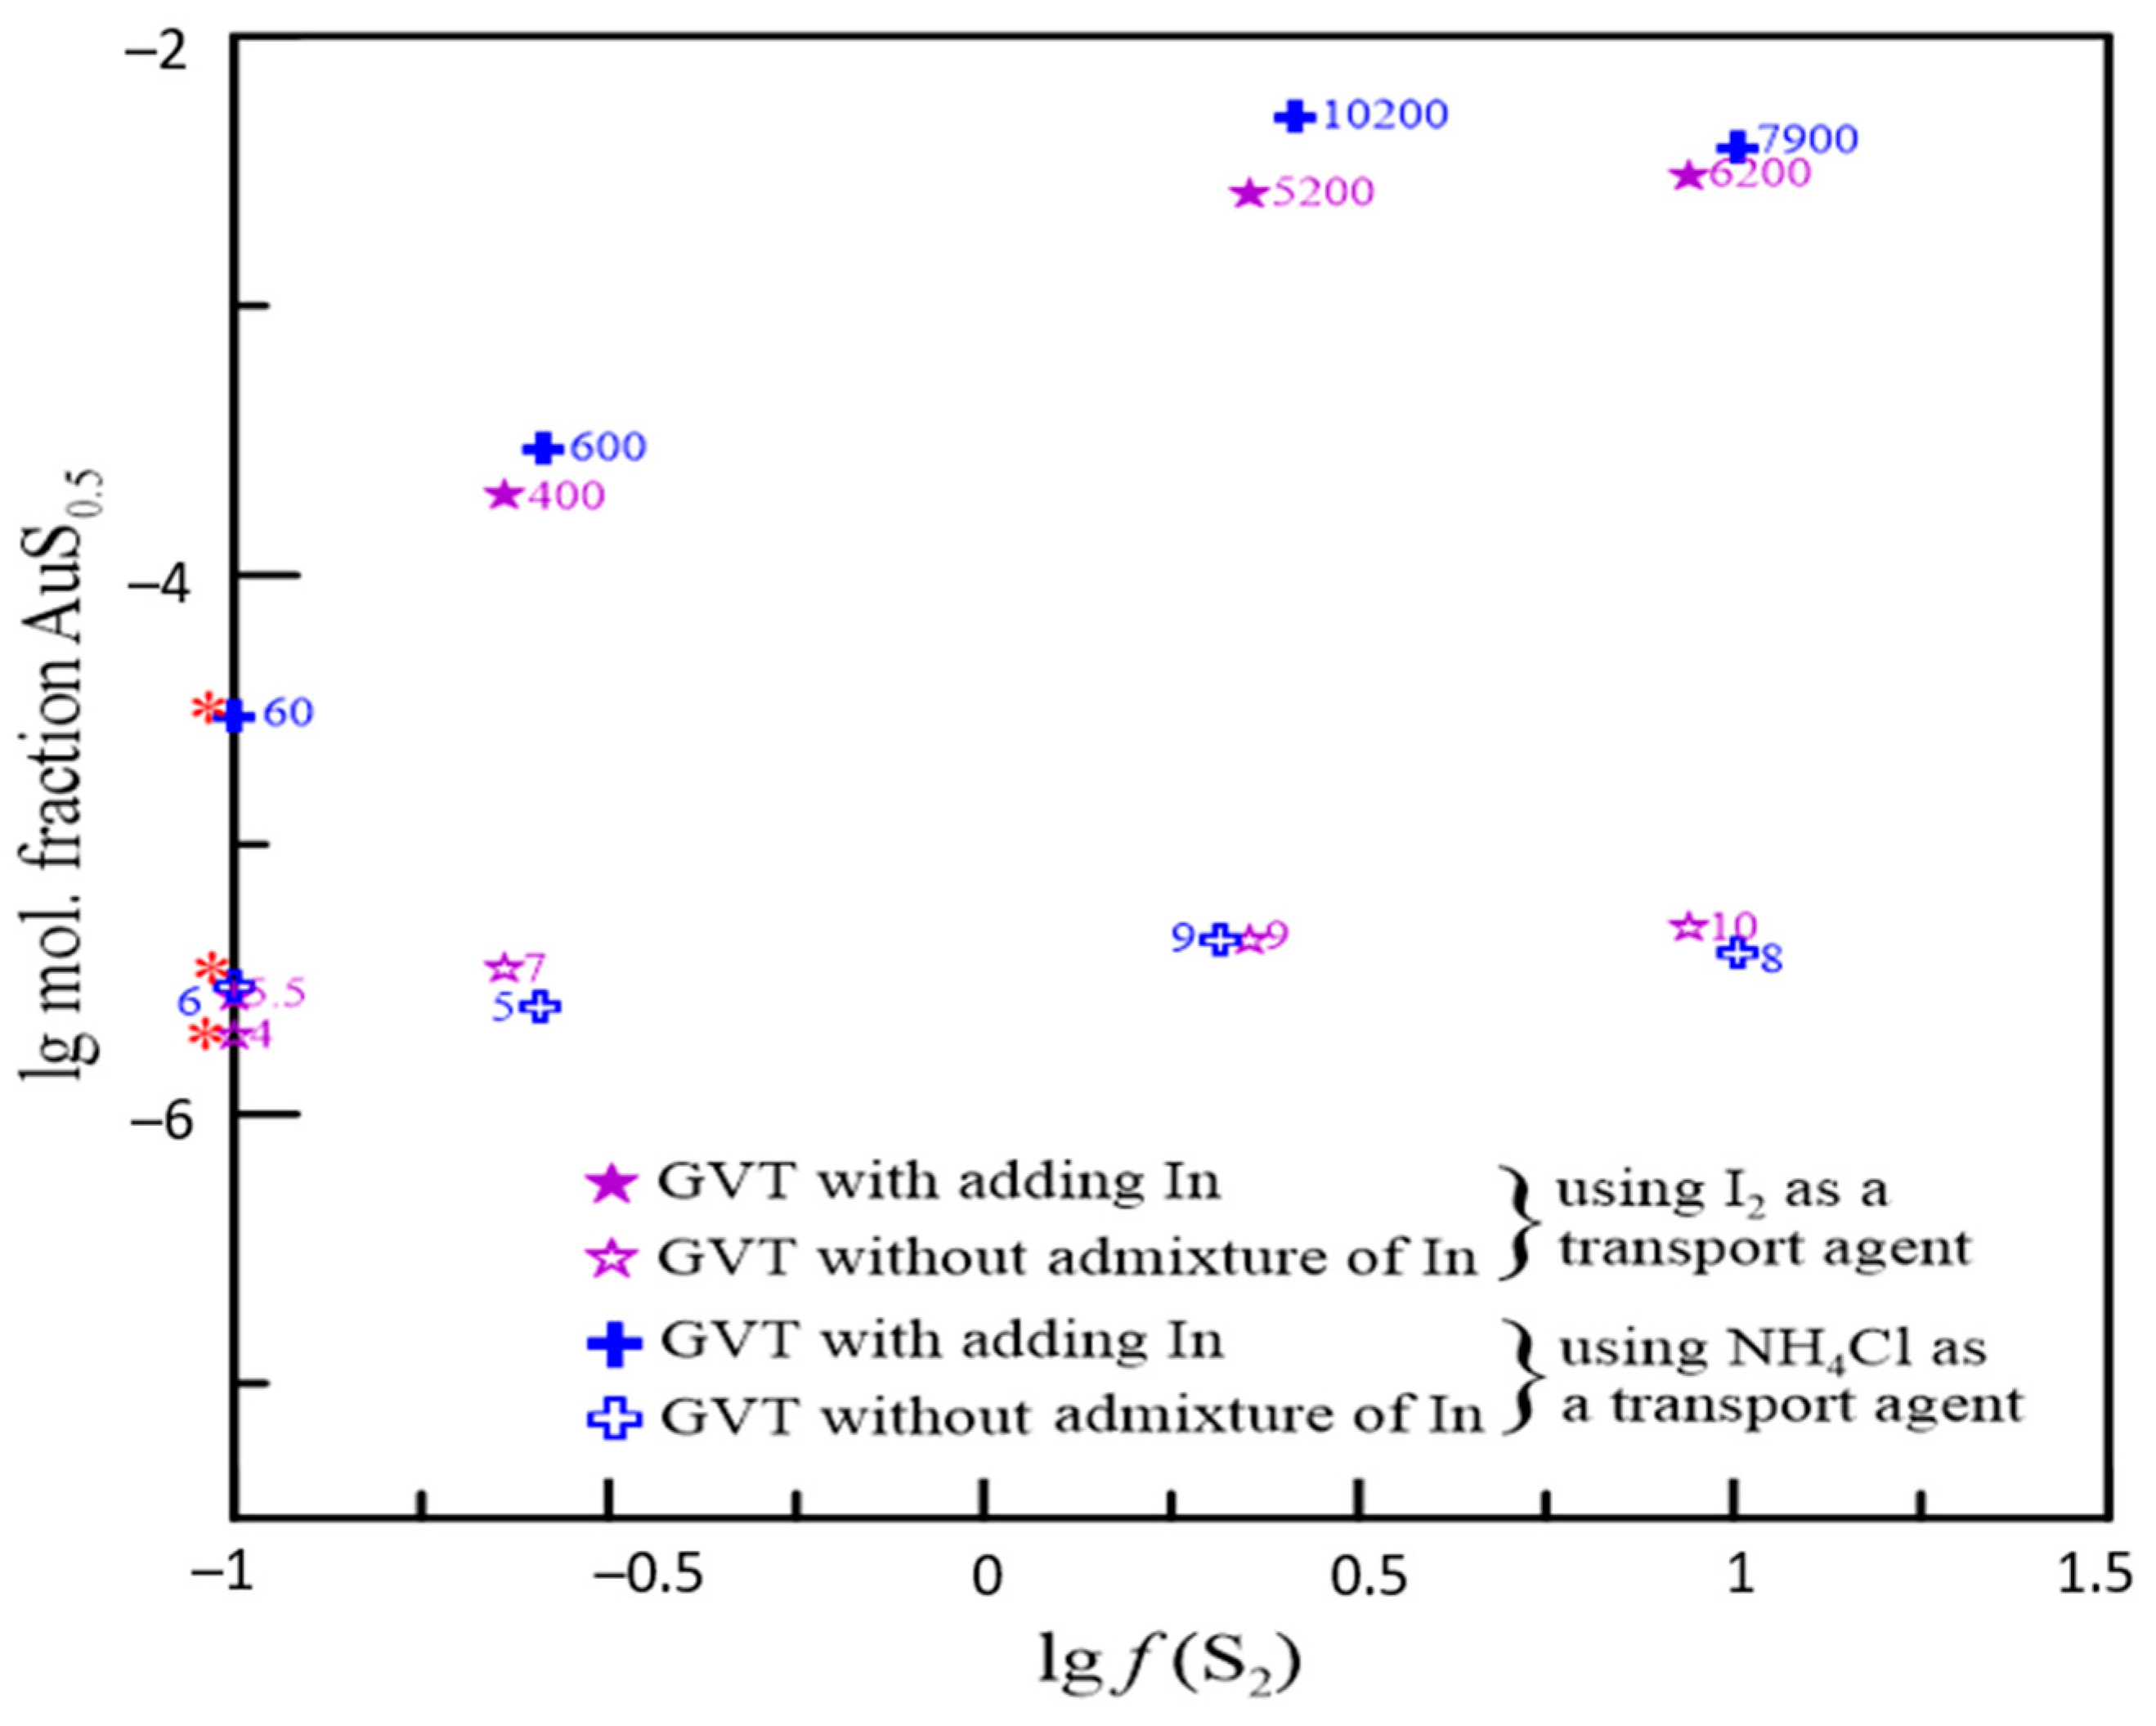
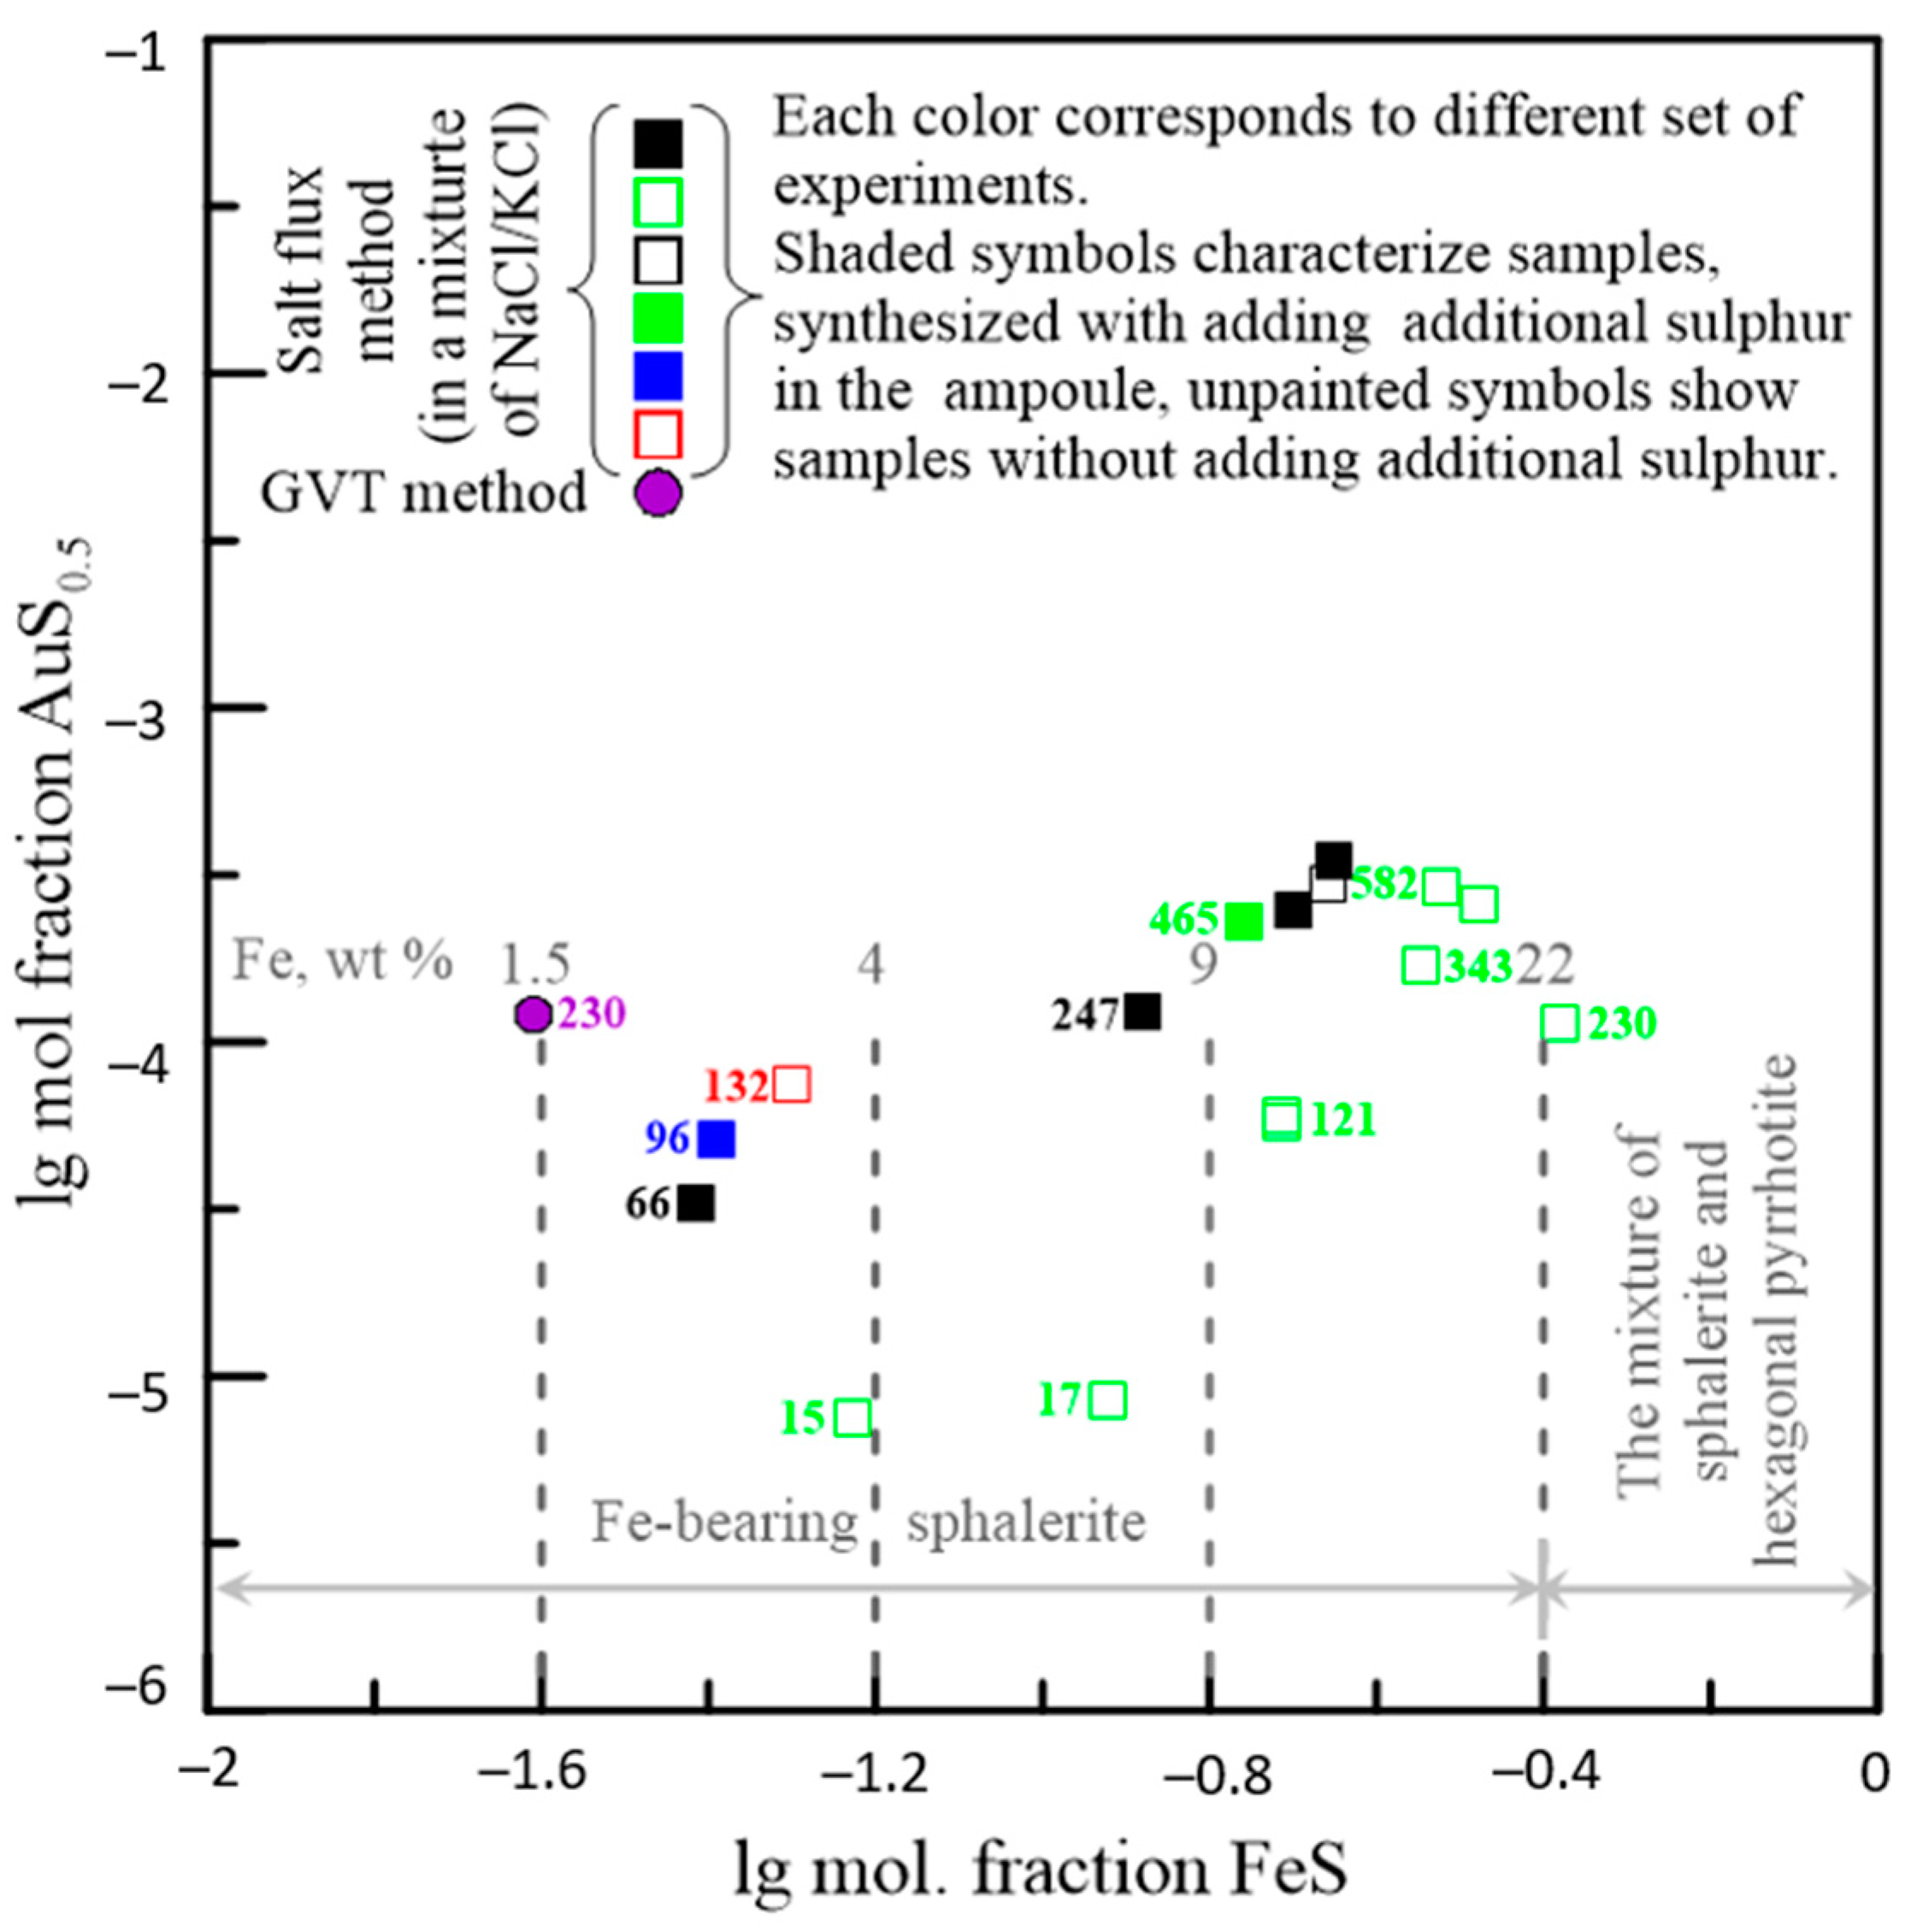
The chemical composition of the final crystals was studied both by EPMA (for the major and minor elements) and by LA-ICPMS (for the trace elements). Experiments show that in simulated conditions, as in nature (e.g., [15]), sphalerite can incorporate more Au in the presence of admixtures of other elements. Natural sphalerite can contain Au, Ag, Cu, Tl, Hg, Fe, Mn, Cd, In, Ga, Ge, As, Bi, Pb, etc. [8]. Some of these chemical elements are presented in the form of mineral microinclusions (e.g., Pb, Bi, etc.), while others can substitute Zn2+ (e.g., Cd, Mn, Fe, etc.) in the crystal structure of sphalerite [8]. We prepared the sample with admixtures typical for the natural environments: Fe, Mn, Se, In and Cd, together with gold, which were added one by one, in pairs, or simultaneously. The elements are evenly distributed inside the sphalerite (Figure 34 and Figure 35; [110]). In the resulting crystals, we observed an extremely high concentration of gold (up to 3000 ppm) in comparison with the sample of the Fe-bearing sphalerite with Au (up to 250 ppm) (Figure 35, Figure 36, Figure 37, Figure 38 and Figure 39).
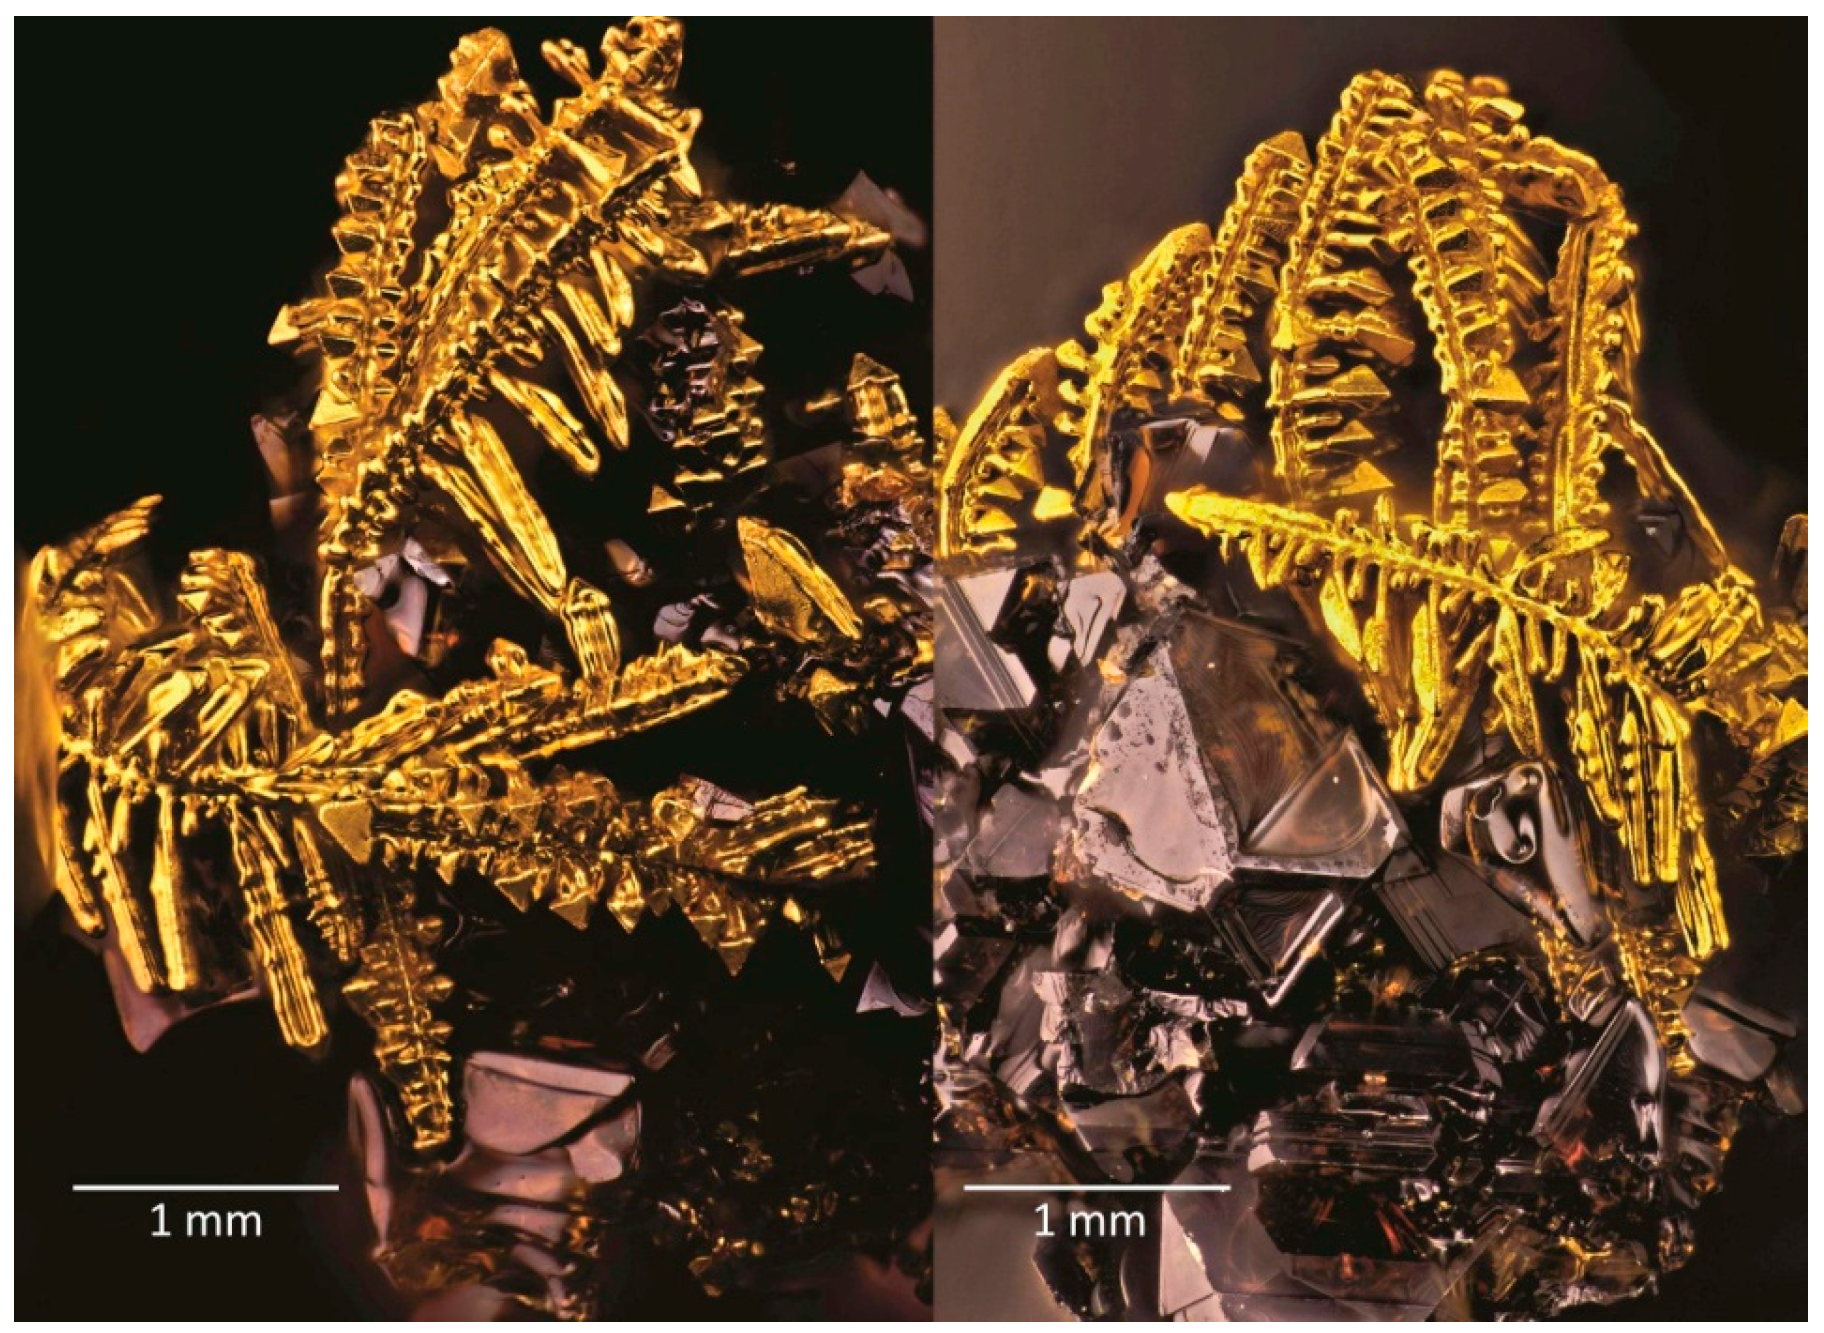
According to chemical analysis, the amount of Au increases instantly with the increase of the sulphur fugacity in cases when In was added to the system (Figure 36 and Figure 37, shaded symbols). In some synthesis experiments, adding more than 2.28 wt% In leads to the formation of intergrowths of sphalerite and sulphospinel phase of the approximate composition ZnIn2S4 (Figure 38a). In the absence of indium, CAu does not exceed 10 ppm (Figure 37, non-shaded symbols). In the synthesis experiments, the close coalescence of sphalerite crystals with native gold dendrites (Figure 40) indirectly confirms that we are probably dealing with the maximum values of Au impurity that can enter the composition of sphalerite under these conditions.
Our experiments on solubility of Pt, Pd, Os and Ir in sphalerite show that these noble metals cannot penetrate into the structure of zinc sulphide, even in the low amounts.
The presence of In and/or Fe admixtures also affects the concentration of Au in synthetic crystals of greenockite (Table 28; Figure 41 [111]). The concentration of Au in In- and Fe-doped greenockite is ten-fold higher in comparison with pure CdS. The distribution of Au, Ag, In, Cd, Se, Fe and Mn in sphalerite and greenockite is homogeneous according to the LA-ICPMS line mode spectra (Figure 34, Figure 35 and Figure 41).

5. Discussion

A significant part of the primary gold reserves in Russia and the world are sulphide ores ([112,113,114] and references cited therein). Many sulphide ores are classified as refractory by technologists. It is the deposits of refractory sulphide ores that are the main potential source of gold production. The refractory gold and silver in sulphide ores can be associated with micro- and nanoinclusions of gold and silver minerals as well as isomorphous, colloidal, surface and adsorbed species of NM. However, the forms of invisible gold and other NM are still insufficiently investigated.
A series of authors’ papers [9,15,24,25,39,63,67,80] were devoted to the problem of invisible and microscopic gold in sulphides. Based on the study of the VMS ores of the Urals (e.g., [15,25,67,115]), Rudny Altai [76,116] and modern hydrothermal systems of the ocean floor [76,117,118,119], it was concluded that gold was primarily manifested in an invisible form, mainly in iron and copper sulphides. Gold enlargement with its release in the form of its own minerals occurred during later epigenetic hydrothermal processes and metamorphism. Native gold and Au-Ag tellurides, sulphides and selenides are found as microinclusions in base metal sulphides, particularly in pyrite, marcasite, chalcopyrite, sphalerite and arsenopyrite sulphosalts [112]. The size and shape of gold particles and their 3D mineral associations within ore samples were established by X-ray tomography [120].
Invisible gold should include gold in the form of a solid solution or an isomorphous impurity that is part of the structure of the Au-Ag-bearing matrix minerals. Invisible gold also includes fullerenes, colloids, clusters and surface-bound gold < 1 nm [15,121,122].
In gold deposits of the Urals, the portion of invisible gold is usually small, for example, only 1–16% in the mesothermal Berezovsk deposit and ~20–30% of the bulk Au in the Vorontsovka Carlin-style gold deposit [9,63,105], but it can also be very high. The data of local analyses (LA-ICPMS, INAA, EPMA, SEM/EDS) allow us to estimate the portion of bound Au in pyrite ~60% of the bulk Au of ores from the Novogodnee-Monto gold-skarn deposit [40], and even more, ~80% of the bulk Au for the Petropavlovsk gold-porphyry deposit [39,40].
Based on the composition, pyrites of the Berezovsk deposit can be divided into two groups: (1) Au-bearing, and (2) virtually Au-free. Pyrite of the second group prevails; in this pyrite, Au occurs in the amount of 0.08–0.1 ppm in the mode of single peaks of the group of Ag-Pb-Cu-Sb, probably in the form of microinclusions of native gold in pyrite in intergrowths with galena and fahlore. The Au-bearing variety of pyrite of the first group may contain structurally bound Au (CAu up to 73.5 ppm, INAA; 21.8 ppm, LA-ICPMS). It is generally accepted that all gold in the deposit is free, i.e., it is found exclusively in the form of native gold. The new data obtained indicate, although rarely, the presence of finely dispersed, possibly chemically bound gold in pyrite. Such pyrite could be formed during late, relatively low-temperature processes, later than “ordinary” pyrite with a zonal distribution of Co, Ni and As, which carries gold only in the form of native gold inclusions.
In galena from the sulphide-quartz veins of the Shartash granite massif, Berezovsk gold field, there are correlations in the Ag-As-Se-Bi-Sn series (r = 0.8–0.9) and in the Bi-Te (r = 0.84) and Bi-Tl (r = 0.7) pairs. Since the distribution of the elements is uniform, we can assume that they enter the galena isomorphic according to the schemes: (Ag,Tl,Cu)+ + (Bi,As,Sb,In)3+ ↔ 2Pb2+, (Sn)4+ + 2(Ag,Tl,Cu)+ ↔ 3Pb2+, (Se,Te)2– ↔ S2–. A high degree of correlation is observed in the Cu-Sb (r = 0.87), Cu-Ag (r = 0.72) and Ag-Sb (r = 0.89) pairs. The inhomogeneous joint distribution of Au with Cu and Sb may be related to the finely dispersed inclusions of bournonite CuPbSbS3 since the latter is a characteristic common humbeite mineral, and its presence could contribute to the deposition of submicroscopic native gold.
In the Urals, about 25 million tons of VMS ores are processed per year, only 15–40% (for various plants) of the total gold is extracted and losses with pyrite concentrate and in the tailings of enrichment amount to 13–15 tonnes of Au per year [77].
For weakly metamorphosed VMS deposits, the following sequence of decrease in the invisible gold concentration in sulphides is observed: galena (up to 122 ppm, geom. mean 90.5 ppm)–chalcopyrite (40/9.6)–pyrite (10/1)–marcasite (5/0.6)–sphalerite (6/0.4). For highly metamorphosed VMS objects: pyrite (31/2.3)–chalcopyrite (8/0.65)–sphalerite (0.7/0.4)–arsenopyrite (0.7/0.2)–fahlore (3.3/0.12)–bornite (3.2/0.06)–pyrrhotite (0.1/0.05)–galena (0.1/0.04), and, in general, Cinvis. Au is noticeably lower.
Estimates of the portion of invisible gold in VMS deposits in the Urals vary widely (within 30–90% of the total gold of ores) at a concentration of such fine gold from 0.8 to 5 g/t [9,72]. Higher values (~65–85% of the bulk Au of ores) are typical for the portion of invisible gold of weakly metamorphosed ores [15,36]. With increasing metamorphism [57], the contents of Au and Ag in the main ore-forming sulphides (sphalerite, chalcopyrite, pyrite) generally decrease [25,112]. In most cases, the portion of invisible gold also decreases (~35–60% of the total ore volume), so there is an inverse correlation between the proportion of invisible gold and the increase in the degree of metamorphism of ores [9,57,89]. As a result of the recrystallisation of ores, the invisible gold is enlarged and passes into the visible state [67,94].
For the VMS deposits of the Urals, the Z-shaped variation of native gold composition (Figure 30) probably reflects the continuous-discrete character of the Au-Ag solid solution. The presence of possible miscibility gaps in this binary system was discussed in [106,123,124]. Independent mineral phases with contrasting compositions were clearly recorded in the Ag-rich zone [123]. In [124], species with Ag < 25 wt% are referred to the zone of stable solid solutions, but at least two phases (Au3Ag and AuAg) are believed to be present in the Ag-depleted zone. According to [106], the existence of the Au2Ag compound is the most probable in nature. Our data obviously confirm these assumptions, although the occurrence frequency of electrum (AuAg) in the VMS deposits of the Urals is lower than that of Au3Ag and Au2Ag.
However, only in the last two decades, with the broad involvement of the LA-ICPMS method and other spectroscopic methods ([6,7,14,17,19,92,119,120,121,125,126,127,128], etc.), did a breakthrough in studying the forms of noble metal occurrence in sulphides become possible. LA-ICPMS or EPMA correlation analysis of the concentrations in a particular mineral usually gives uncertain conclusions. However, these methods predominate in ore geology (see, e.g., [129] or [130]). X-ray absorption fine structure spectroscopy allows getting more definite results, especially for synthesised sulphides [17,19,52,92], but the beam-time is more expensive and data processing is complicated by concentration levels of NM impurities in studied sulphides (see [15] for a discussion).
Below, we will focus on our data on the noble metal speciation in synthetic sphalerite and greenockite.

5.1. Conditions Conducive to the Formation of Au-Saturated Sphalerite

Sphalerite is not considered as a significant source of Au production during the mining and processing of ore deposits [8]. However, a noticeable amount of gold can enter sphalerite in an invisible form [15,25,117], especially in relatively high-temperature conditions realised in medium- and high-temperature types of deposits. The typical contents for natural sphalerite are in the range of 0.1–10 ppm Au [8,15,117,131]. It can contain micro-inclusions of native gold, especially at the deposits that have undergone syn-metamorphic remobilisation [25,71]. Pure sphalerite, in contrast to bornite and chalcopyrite, is one of the weakest Au absorbers [128]. Using the phase composition correlation principle, Lipko and co-authors calculated the solubility of Au in pure and Fe-bearing sphalerite, and the latter is 3.5 times higher than in pure mineral [128]. Thus, the goal of the first experimental study was to find suitable conditions for the formation of Au-bearing sphalerite. Thus, we also addressed the evaluation of the exact chemical form of Au in synthesised specimens.
In general, the results of our experiments ([110], this study) clearly show that the concentration of Au is higher in sphalerite containing different impurity components than in its pure crystals. A similar pattern is observed in ore deposits ([15,25,37], etc.) and modern hydrothermal fields on the oceanic floor ([118,131,132], etc.). The entry of Au into sphalerite is favoured not so much by the low-temperature conditions of its crystallisation but by the supersaturated nature of the evolved magmatic fluids and the co-deposition with Au of other chemical elements, especially In, Cu and Mn.
For sphalerite, after a few series of synthesis experiments, we conclude that the main element that favours gold to “intrude” in the crystal structure of ZnS is indium [92,108,110]. Iron also affects the concentration of Au but to a lesser degree. We infer that it may be related to the valence state of the elements. Indium is a trivalent element and some recent works of our colleagues suggest that a minor fraction of iron in sphalerite is also trivalent (e.g., [133]). We propose that the same mechanism of coupled substitution as in the case of Cu [134,135] occurs in the Au-bearing-sphalerite: Au+ + In3+ ↔ 2Zn2+. Our recent XAFS results demonstrate that at high concentrations (0.03–0.2 wt% In), Au can exist in sphalerite in two forms: primarily as a nano-sized Au2S (or AuInS2) cluster and secondarly, in the form of a solid solution (e.g., (Zn,Au)InS2); according to the spectroscopic study, all trivalent In in sphalerite substitutes Zn, without any Au-In clustering [92]. Unfortunately, we were not able to observe the Fe3+ in the sphalerite using synchrotron methods due to the extremely low concentration of this isotope.
The EPMA and LA-ICPMS data do not provide univocal information regarding the chemical state of Au and In in ZnS. However, the XAFS method is inadequate at concentrations below hundreds of ppm. Therefore, in contrast to arsenian pyrite and arsenopyrite, due to the low CAu in natural sphalerite, it is generally impossible to study the chemical state of NM in the mineral by this method (cf., [134]). EPMA and LA-ICPMS data complement the existing results (Figure 38, Figure 39 and Figure 41; Table 27 and Table 28) since they do not contradict the conclusion that at least part of the gold in sphalerite exists in the form of solid solution [136]. This form may predominate at low concentrations of gold in sphalerite, especially in nature.
According to chemical analysis, the amount of Au increases instantly with the increase of the sulphur fugacity in cases when In was added to the system (Figure 38 and Figure 39). This fact proves the mechanism of vacancies formation in cation subcell leading to the accumulation of additional gold and the existence of the following isomorphous scheme: 3Zn2+ ↔ 2In3+ + □, described in [137]. In our synthesis experiments, adding more than 2.28 wt% indium leads to the formation of intergrowths of sphalerite and sulphospinel ZnIn2S4 phase (Figure 40. In the absence of indium or any other impurities, CAu does not exceed 10 ppm (Figure 37 and Figure 39).
Divalent elements (notably Fe, Cd and Mn) commonly enter the sphalerite structure by isomorphic substitution of Zn (e.g., [129,138]). Other elements, for example, In, Cu and Ag, replace Zn in heterovalent coupled and/or multiple substitutions, such as: 2Zn2+ ↔ Cu+ + In3+, 2Zn2+ ↔ Cu+ + Fe3+ and 4Zn2+ ↔ 2Cu+ + Fe3+ + (Sn,Ge)4+ [8,129,139,140]. The latter mechanism may have played a fundamental role in the crystallisation of Au-bearing sphalerite from fluids of postmagmatic volcanic-arc systems, usually enriched in Au, other metals and metalloids (e.g., [141]).
Like natural samples of more chemically pure sphalerite, usually with minimal CAu (e.g., [15,25]), pure synthetic sphalerite is usually unsaturated by Au compared to the specimens with admixtures ([128], this study). Tauson and co-authors [142] linked this phenomenon to the variation of the chemical bonding parameters due to incorporating of the additional metals in the structure (cf., [128]).
For synthetic crystals of Ag-bearing sphalerite doped by In (or without In), the XAFS data revealed that Ag exists in sphalerite mainly in the form of a solid solution according to the scheme 2Zn2+ ↔ Ag+ + In3+, also suggested for natural sphalerite; however, a part of Ag (<5%) exist in the Ag-bearing sphalerite in the sulphide form Ag2S ([108]; cf., [130]). In the absence of In, XANES spectra show Ag mainly in the native element mode (formal oxidation state 0) and sulphide forms. At high sulphur fugacity in the experimental system, sulphide form Ag2S predominates [108]. Presence of submicron inclusions of laforêtite AgInS2 in Ag-, In-bearing sphalerite is probable. This mineral has the same sphalerite structure and may form a solid solution series in ZnS-AgInS2 system. Occurrence of AuInS2 in Au-, In-bearing sphalerite can also be assumed. Solid solution ZnS–AuInS2 is also possible in nature.
Thus, gold and silver both prefer accumulation in In-bearing sphalerite as a solid solution. However, in the absence of In, their dominant forms are Au2S, native Ag and Ag2S, respectively. This fact corresponds to the low solubility of Au and Ag in sphalerite solid solution [128].

5.2. Correlation of As and Au Contents in Pyrite

The positive correlation of the As and Au contents in As-pyrite is noteworthy (Figure 9), which can be considered as evidence of an isomorphic substitution of the Fe position in the As-pyrite lattice (cf., [143,144]). In recent years, this has been interpreted as Au sorption on the growing faces of pyrite crystals [143,145,146]. For example, at sediment-hosted Carlin-type ore, invisible gold in arsenic disulphides represents Au deposited from the metal-bearing fluid by chemisorption at As-rich, Fe-deficient growth surfaces and incorporated into the sulphide crystals in the mode of metastable solid solution [96]. It corresponds to our data for the Vorontsovka Carlin-style deposit (Figure 9).
However, in other cases, there is a weak negative correlation of Au with As according to LA-ICPMS data for pyrite of the Geita Hill, Kumtor and Witwatersrand Carbon Leader Reef giant gold deposits [127]. A similar situation (there is no positive Au/As correlation in pyrite or it is very feeble) is observed for many deposits everywhere [6,8,31,32,33,34,35,43], as well as for many sulphide deposits of the Urals [36,37,38,39,40,41,42].
When analysing As-pyrite, two aspects should be considered: As and Au impurities in pyrite and their relationship. Thus, the maximum solubility of As in pyrite at 600 °C according to the experimental data of Clark [147] is 0.53 wt%, and As content reaches 9.3 wt% in natural pyrites [96,148], and some researchers detected up to 14 wt% As in pyrite (e.g., [149]). Moreover, most researchers note that the sum of the S and As contents in pyrite remains ~66.7 at%, and they interpret low As concentrations (up to ~1.2 wt% As) as a solid solution with local clustering of As atoms. However, at higher concentrations of As in pyrite (6–9 wt%), arsenopyrite domains were detected on the HRTEM images [150,151]. Another feature of the As-pyrites that should be noted is the inhomogeneity and, more often, zoning in the distribution of As, which can be caused by changes in the crystallographic orientation of the phase (different interplanar distances and changing parameters of the solid solution) and fluctuations in the contents of not only sulphur but also iron [18,152] as well as other impurities (see [15] for discussion). Perhaps this is consistent with the inhomogeneous type of conductivity in a single crystal [153].
In many cases, there is a linear positive dependence of the increase in the gold content in pyrite on the level of arsenic concentrations (e.g., [143]). Simultaneously, there are two clusters of Au content points in this dependence: in the range of 2–5 wt% As and 6 and above [149]. This fact, as well as in the case of the entry of only As impurities into pyrite [40], can probably be explained by a change in the structural form of the entry of Au into As-pyrite: at relatively low concentrations of As (2–5 wt%), gold enters the solid solution S22−AsS AsS3−, and at high concentrations of As, gold enters the pyrite and marcasite-structural (arsenopyrite) domains.
Unlike arsenic, the situation with tellurium in pyrite is quite different. Tellurium is also a common isomorphic impurity in pyrite, but its abnormally high contents are due to the occurrence of submicroscopic and nano-scale inclusions of Au-Ag tellurides (mainly hessite and petzite) in this mineral. For the Petropavlovsk gold-porphyry and Novogodnee-Monto Fe-Au-skarn deposits, similarly to in [143], a positive correlation of Au and Ag with Te in pyrite corresponds to the probable occurrence of tiny telluride grains in the smallest defects in the mineral (Figure 16 and Figure 20). It is also proven by the presence of synchronous peaks of Te, Au and Ag on the graphs during laser ablation by the profile sampling mode (Figure 17 and Figure 19) or bright points of their segregations on Te distribution pictures during mapping mode analysis (Figure 18a and Figure 21).

5.3. Forms of Gold in Arsenopyrite

Intensive debates about the forms of gold in arsenopyrite of 1988–1989 ([95,154,155], etc.) remain unsettled (see reviews in [19,51], cf., [156,157]). Gold in the chemically bound, structural form commonly reaches its maximum values in this mineral (e.g., [12,128,155]). Simultaneously, there are opposite opinions on the peculiarities of the chemical composition of Au-rich arsenopyrite. In most studies, the ratio As/S>1 is noted in the composition of Au-bearing arsenopyrite [63,96,97,154,158]. However, in other papers, sulphuric (deficient in As) arsenopyrite is richer in Au [12,156,159,160,161,162]. Some authors reported about As- and S-rich arsenopyrites both rich in gold.
For the Vorontsovka deposit, the data obtained for arsenopyrite crystals in Carlin-style gold-sulphide assemblage indicate the presence of an inverse correlation between the Au and Fe contents and a direct correlation for Au/As (Figure 42; cf., [96]). Besides, this dependence is manifested not only at the local level within a single crystal, but also in the whole deposit, because more arsenic Apy-2, according to the point analysis by the LA-ICPMS method, contains more gold (4–315 ppm, mean geom. 24.3 ppm, [63]). The LA-ICPMS profiles for pyrite showed that high Au concentrations commonly correlate with higher contents of As, Ag, Sb, Se or Tl (Figure 6, Figure 7 and Figure 8; cf., [63]).
In general, the set of data obtained for the samples of synthetic [18] and natural ([63], this study) arsenopyrites shows a weak positive correlation of Au contents with the As/S ratio and a clear negative correlation between Au and Fe. The higher Au contents are typical for the As-rich and close to stoichiometric late arsenopyrite generation, while in S-rich early arsenopyrite, the Au content normally does not exceed 0.02 wt%. However, overall, early generation arsenopyrite (Apy-1) also contains fairly high CAu. Gold is mainly concentrated in the As-rich, low-thickness zones of its prismatic crystals (Figure 7 and Figure 8).
The incorporation of lattice-bound Au into arsenopyrite is resulted from the substitution of Fe by Au as both elements show negative correlation (cf., [5,157,160,161]). Au-bearing arsenopyrite is commonly thinly zonal. Unstable conditions with short-period oscillations of local disequilibrium and some fluctuations in the fluid component fugacities (f S2, f Te2, f O2, f As2) contributed to the crystallisation of the mineral with a less perfect structure, which in turn favoured the entry of gold into the composition of arsenopyrite. Auriferous zones of arsenopyrite can contain nm-sized gold particles: TEM study in FIB foils [162] identified two types of nm-sized gold particles—elongated, rod-like (or disc-shaped?) Au grains about 35 nm in length and 5 nm in thickness, and roundish gold (or disc-shaped?) grains about 10 nm in diameter.

5.4. Crystal-Chemical Basics of Noble Metal Speciation in Sulphides

Several concepts are employed to describe crystal chemistry and to build structural classification schemes of the sulphides. Since the aim of this review is not a detailed analysis of the crystal structures of sulphides, we will only briefly describe the structures of the considered minerals with some preliminary analysis of the possibilities of isomorphic substitution of cations with noble metals (mainly Au, Ag, Pd and Pt). Table 29 lists the main crystallographic features of the studied minerals. With the exception of arsenopyrite FeAsS and chalcopyrite CuFeS2, all the studied minerals are binary compounds. Pyrite and galena belong to the structure type of NaCl, marcasite and arsenopyrite to the structure type of TiO2-rutile, sphalerite and chalcopyrite to the structure type of sphalerite, greenockite and würtzite to the structure type of ZnO and pyrrhotite to the structure type of NiAs.
Principle schemes of the crystal structures of the considered minerals are shown in Figure 43.
The coordination of cations in the structures of sulphides depends on their size, charge and electron configuration [163,164]. Table 30 lists the hybridisation type and coordination numbers of the cations in the structures of sulphides. The coordination polyhedra of cations in the considered minerals are tetrahedra (sphalerite and ZnO structure types, CN = 4) and octahedra (rutile, NaCl and NiAs structure types, CN = 6).
Table 31 lists the main structural characteristics of the sulphides of Au, Ag, Pd and Pt, and corresponding crystal structures are shown in Figure 44. Me-S chains are the main structural elements in the structures of Au2S and Ag2S. Me-S chains in the structure of Au2S form a three-dimensional framework. The whole structure can be considered as an anti-cristobalite structure, i.e., a three-dimensional framework of anion-centered vertex-sharing SAu4 tetrahedra. Ag in the structure of Ag2S occupies two positions. AgI forms Ag-S chains along direction b of the unit cell. These chains are linked by AgII ions.
The coordination polyhedra of AgII is a coplanar triangle (Figure 44d). In terms of anion-centered polyhedra, the structure of α-Ag2S is a set of layers composed of vertex-shared SAgI2AgII3 tetragonal pyramids. The layers are connected into a three-dimensional framework by AgI atoms. Two types of coordination polyhedra appear in the structures of Pt and Pd sulphides—a planar square in the PtS and PdS structures and an octahedron in the PtS2 and PdS2 structures (Figure 44e,g).
Speaking of isomorphic substitution, one must consider a difference in the sizes (ionic or atomic radii) and interatomic distances of host cations and their substitutes. The ionic radii of metals under question with coordination number 6 increases in the following order [180]: Pt < Pd < Ag <Au, which implies that Pt should be the most favourable and, probably, the most abundant admixture in the sulphides, while Au should be hypothetically the less probable isomorphic admixture. In addition, we have to compare Me-S and Me-Me (next nearest cation) distances in the structures of host sulphides and sulphides of the considered noble metals. Me-S distances in the sulphides listed in Table 29 vary between 2.231 Å (arsenopyrite) and 2.903 Å (galena), while Me-S distances in the sulphides of noble metals listed in Table 30 vary between 2.174 Å (Au2S) and 2.699 Å (α-Ag2S). It is worth noting that Me-Me distances are not correlated with the Me-S distance, i.e., Fe-S distance in pyrite equals ~2.26 Å, and the Fe-Fe distance equals ~3.83 Å, while Fe-S distance in arsenopyrite equals ~2.23 Å and Fe-Fe distance equals ~2.73 Å. However, in both base metal sulphides (except for galena) and noble metal sulphides (except for PdS2), larger values of Me-Me distances correspond to smaller values of Me-S distances. The effect is not pronounced but can be detected.
X-ray absorption spectroscopy (XAS) investigations of minerals and their synthetic analogues showed that Au, Ag and Pt could form solid solutions with covellite [17], pyrite [19,22], arsenopyrite [18,19], pyrrhotite [23] and sphalerite [19,92]. However, the concentration of the admixtures is small. Thus, the measured maximum content of Au in natural and synthetic pyrite is ~300 and ~90 ppm accordingly. The concentration of Au in löllengite is about 800 ppm. The concentration of Ag in sphalerite is no more than 5 wt%. Synthetic pyrite hosts up to 7 wt% of Pt in the solid solution state. The measured concentrations of the considered admixtures in base metal sulphides correlate well with the ionic radii of the admixtures: the smaller the cation is, the higher its content in a host mineral. However, some experimental facts cannot be solely explained by the size factor. For example, the maximum content of Pt (the Pt2+-S distance equals 2.31 Å, Table 30) in the solid solution state in pyrite is 7 wt% and is only 0.5 wt% in pyrrhotite [23], while the Fe-S distance is ~2.26 Å in pyrite and ~2.52 Å in pyrrhotite. Besides, the formation of the solid solution depends on the conditions of synthesis: Au forms a solid solution with pyrite in hydrothermal experiments only, and in the pyrites obtained using the salt flux technique, Au forms metal particles.

6. Conclusions

(1) For VMS and Carlin-style deposits as well as for gold-porphyry systems, avalanche deposition of sulphides on geochemical barriers in shallow-depth conditions from moderate- and high-concentrated solutions contributed to the rapid growth of imperfect and thin-zoned crystals, providing the entry of NM in sulphides in finely dispersed form (in the invisible state). Admixtures of metals and metalloids supplied both the increased defectiveness of crystal structure of the minerals (making them chemically more capacious in relation to NM), and the entry of NM impurities into sulphides by the mechanism of heterovalent isomorphism.
(2) For weakly metamorphosed VMS deposits, the following sequence of decrease in invisible gold concentration in sulphides was revealed: galena–chalcopyrite–pyrite– marcasite–sphalerite, in entire agreement with the hydrothermal experiments on the solubility of Au in sulphides (galena–bornite–chalcopyrite–pyrrhotite–pyrite–sphalerite). For highly metamorphosed VMS lodes, such sequence is pyrite–chalcopyrite–sphalerite/arsenopyrite–fahlore–bornite–pyrrhotite–galena, and, in general, the concentration of Cinvis. gold in sulphides is noticeably lower.
(3) In arsenopyrite crystals, the contents of invisible gold reach their maxima, and Fe is negatively correlated with Au. The ionic form of gold probably prevails in this mineral. Thin compositional zoning reflects short-period oscillations of local disequilibrium during crystal growth and some fluctuations in the fluid component fugacities (f S2, f Te2, f Se2, f O2, f As2).
(4) Epigenetic hydrothermal and metamorphic processes, as well as the slower crystallisation of sulphides, favoured the nucleation of gold, coalescence of its clusters and enlargement of nano-sized NM isolations, and supported the formation of relatively large nuggets as a result of collective recrystallisation. Most Au deposits (except for Carlin-type and gold-porphyry deposits) originated at considerable depths, and the crystallisation of sulphides was in relatively stable conditions, providing the formation of more perfect sulphide crystals as well as co-crystallisation of proper NM minerals (except for the strongly scattered PGE), and a small fraction of NM remains in the sulphides in finely dispersed form (in the invisible state).
(5) Proper NM minerals are represented by groups of minerals that are similar, both for VMS and large gold deposits of the Urals: native gold (high-fineness gold and electrum), with sharply subordinated Ag-sulphosalts, Ag-, Au- and Au-Ag-tellurides, and to a lesser extent, native silver, Au-Ag-sulphides (petrovskaite, uytenbogaardtite, acanthite), Au-antimonide (aurostibite), Ag-sulphobismuthite (matildite) and Ag-selenotelluride (kurilite). In very sporadic cases, abundant NM-tellurides are comparable as host NM-minerals with native gold, in bulk ore composition (Svetlinsk deposit, etc.).
(6) Our experiments showed that admixture of In increases the solubility of Au in sphalerite up to 1 wt%. CAu in sphalerite is higher (up to 1000 times) in samples synthesised at a higher (up to 10 bar) f S2 in the system. Fe impurity also promotes the incorporation of Au in sphalerite (CAu up to 0.01 wt%). In sphalerite synthesised under the same conditions without In, Fe, etc., CAu does not exceed 0.001 wt% and does not depend on f S2. EPMA and LA-ICP-MS analyses, revealing a homogeneous distribution of all studied elements, showed a clear positive correlation between the In, Fe and Au contents in sphalerite, as well as X-ray absorption spectroscopy confirmed the isomorphic entry of these elements according to the following scheme: Au+ + In3+ (Fe3+) ↔ 2 Zn2+. A positive effect of f S2 on the solubility of Au indicates the formation of vacancies in the cation sublattice, proving the existence of the second isomorphic scheme: 3Zn2+ ↔ 2In3 + + □. A part of Au doped in ZnSIn forms Au2S clusters, according to the XAFS study. In general, the same pattern was noted for Ag in sphalerite, where Ag2S and Ag0 forms oCCur. Greenockite samples were used as model crystals for the würtzite type of structure, and the results confirm the same behaviour of Au in the presence of In and Fe as in sphalerite. In the samples consisting of both ZnS polytypes, CAu does not exceed 50 g/t, and the distribution of doped elements is inhomogeneous.

Author Contributions

Conceptualisation, I.V.; Methodology, I.V., O.V. and E.T.; Field work and sampling, I.V., O.V., E.T., N.S., V.B. and A.S.; Synthesis experiments, D.T.; Laboratory investigations, I.V., O.V., E.T., J.I., D.T., D.B. and V.A.; Formal crystal chemical analysis, M.N.; Writing—original draft preparation, I.V., O.V., E.T., M.N., J.I., D.T. and N.S.; Reviewed and edited the draft, I.V., O.V., D.T. and G.P.; Discussion, I.V., O.V. and G.P.; Project leadership, I.V. All authors have read and agreed to the published version of the manuscript.

Funding

This study began with the support of the Russian Scientific Foundation grant No. 14–17-00693 (2014–2018—methodological approach, synthesis of Au/Ag-doped sulphides), and the Ministry of Science and Higher Education of the Russian Federation (field work, sampling, XRD and INAA study) and the Russian Foundation for Basic Research, projects No. 18–05-70041, 19-35-90115 (deposits of the Polar and North Urals; field work, sampling, SEM/EDS and LA-ICPMS study) and No. 20–05-00849 (ore deposits of the Middle and South Urals; field work, sampling, EPMA, SEM/EDS and LA-ICPMS study) funded this research. The present study contains parts of the PhD Theses of V.B., D.T., N.S., A.S. and D.B.

Data Availability Statement

Not applicable.

Acknowledgments

Experimental studies on the geochemistry of NM were carried out by the authors together with a group of our colleagues under the direction of B. Tagirov, the synthesis of chalgenides was performed according to the original method and under the supervision of D. Chareev with the participation of O. Filimonova. Some aspects of this work were fruitfully discussed with N. Bortnikov, V. Murzin, and B. Tagirov. We thank V. Sazonov, V. Murzin, V. Moloshag and A. Kisin, the managers and geological staff of the Uralian Mining and Metallurgical Company (Gai, Uchaly, Uzelga, Berezovsk Mines), JSC Uzhuralzoloto Group of Companies (UGC), CJSC Gold of Northern Urals (Polymetal), OJSC Yamalzoloto (YZC), for their assistance during fieldwork. Additionally, we thank S. Borisovsky, E. Kovalchuk, A. Tsepin, A. Kerzin, A. Mokhov, N. Trubkin, O. Doynikova, L. Magazina and N. Nekrasov for the analytical procedures, Timofey Pashko for preparing macrophotos, Anna Vikenteva for translation issues and Thomas Henderson for proofreading of the manuscript. EPMA, SEM/EDS and LA-ICPMS analyses were carried out at “IGEM-Analytics” Multi-User Centre and part of LA-ICPMS analyses in Université du Québec à Chicoutimi, Canada. The manuscript was improved through constructive and helpful reviews from the Academic Editor and anonymous reviewers.

Conflicts of Interest

The authors declare no conflict of interest.

Appendix A

Table A1. Standards used for routine mineral analysis by EPMA (I = 20 nA).
ElementX-rayCrystalStandardTimeDetection Limit,
3 σ(wt%)
PeakBack
Py, Apy
AsLαTAPGaAs30150.05
FeKαLIFPyrite1050.06
SKαPETHPyrite1050.02
NiKαLIFNiSbS1050.04
CuKαLIFCuFeS21050.07
SbLαPETHNiSbS1050.05
CoKαLIFCo30150.06
CCp
AsLαTAPGaAs30150.05
CuKαLIFCuFeS21050.06
SKαPETHCuFeS21050.02
ZnKαLIFZnS1050.08
FeKαLIFCuFeS21050.06
CdLαPETHCdS1050.05
NiKαLIFNi1050.06
MnKαLIFMn1050.06
CoKαLIFCo30150.06
Sp
CdLαPETJCdS30150.11
FeKαLIFPyrite20100.05
SKαPETHZnS1050.02
ZnKαLIFZnS1050.1
InLαPETJInSb1050.08
MnKαLIFMn20100.04
AgLαPETHAg1050.04
CuKαLIFCuFeS220100.06
HgMαPETHHgS20100.06
SnLαPETHSn20100.04
Tnt
SbLαPETJSb2S31050.10
AsLαTAPGaAs1050.10
ZnKαLIFZnS1050.09
SKαPETHCuFeS21050.02
AgLαPETJAg1050.16
SeLαTAPCdSe1050.07
CuKαLIFCu1050.08
HgMαPETHHgS1050.09
TeLαPETJTe1050.11
FeKαLIFCuFeS21050.06
BiMαPETHBi2Te31050.09
CdLβPETJCdSe1050.20
PbMαPETHPbS1050.09
Gn
PbMαPETJPbS20100.22
SeLαTAPCdSe1050.09
CuKαLIFCuFeS220100.09
SKαPETHPbS1050.02
SbLαPETJSb2S320100.09
AsLαTAPGaAs20100.09
FeKαLIFCuFeS220100.06
AgLαPETHAg1050.06
BiMβPETHBi30150.10

References

  1. Lincoln, F.C. Certain natural associations of gold. Econ. Geol. 1911, 6, 247–302. [Google Scholar] [CrossRef] [Green Version]
  2. Schwartz, G.M. Host minerals of native gold. Econ. Geol. 1944, 39, 371–411. [Google Scholar] [CrossRef]
  3. Burg, G.H. Sichtbarmachumg des Feinverteilten Goldes in Goldhoffigen Erzen und Ihre Wirtschaftliche Bedeutung. Metall Erz. 1930, 27, 333–338. [Google Scholar]
  4. Bortnikov, N.S.; Genkin, A.D.; Chryssoulis, S. Deposition environment of gold–bearing arsenopyrite in mesothermal deposits. In Current Research in Geology Applied to ore Deposits; SGA: Granada, Spain, 1993; pp. 419–422. [Google Scholar]
  5. McClenaghan, S.H.; Lentz, D.R.; Cabri, L.J. Abundance and speciation of gold in massive sulphides of the Bathurst Mining Camp, New Brunswick, Canada. Can. Mineral. 2004, 42, 851–871. [Google Scholar] [CrossRef]
  6. Large, R.R.; Maslennikov, V.V.; Robert, F.; Danyushevsky, L.V.; Chang, Z. Multistage sedimentary and metamorphic origin of pyrite and gold in the giant Sukhoi Log deposit, Lena gold province, Russia. Econ. Geol. 2007, 102, 1233–1267. [Google Scholar] [CrossRef]
  7. Large, R.R.; Danyushevsky, L.V.; Hollit, C.; Maslennikov, V.V.; Meffre, S.; E Gilbert, S.; Bull, S.W.; Scott, R.J.; Emsbo, P.; Thomas, H.; et al. Gold and trace element zonation in pyrite using a laser imaging technique: Implications for the timing of gold in orogenic and Carlin-style sediment-hosted deposits. Econ. Geol. 2009, 104, 635–668. [Google Scholar] [CrossRef]
  8. Cook, N.J.; Ciobanu, C.L.; Mao, J. Textural control on gold distribution in As-free pyrite from the Dongping, Huangtuliang and Hougou gold deposits, North China Craton (Hebei Province, China). Chem. Geol. 2009, 264, 101–121. [Google Scholar] [CrossRef]
  9. Vikent’ev, I.V.; Moloshag, V.P.; Yudovskaya, M.A. Speciation of noble metals and conditions of their concentration in massive sulphide ores of the Urals. Geol. Ore Dep. 2006, 48, 77–107. [Google Scholar] [CrossRef]
  10. Kreiter, V.M. Gold particle sizes in sulphide deposits as a sign of postore metamorphosis. Russ. Izv. Akad. Nauk SSSR Ser. Geol. 1948, 1, 159–162. [Google Scholar]
  11. Bürg, G.H. Natur des in den Pyriten nicht sichtbar enthaltenen Goldes. Zeitschr. Prakt. Geol. 1935, 43, 17–26. [Google Scholar]
  12. Genkin, A.D.; Bortnikov, N.S.; Cabri, L.J.; Wagner, F.E.; Stanley, C.J.; Safonov, Y.G.; McMahon, G.; Friedl, J.; Kerzin, A.L.; Gamyanin, G.N. A multidisciplinary study of invisible gold in arsenopyrite from four mesothermal gold deposits in Siberia, Russian Federation. Econ. Geol. 1998, 93, 463–487. [Google Scholar] [CrossRef]
  13. Tauson, V.L.; Pastushkova, T.M.; Bessarabova, O.I. On the limit and speciation of gold in hydrothermal pyrite. Russ. Geol. Geophys. 1998, 39, 924–933. [Google Scholar]
  14. Tauson, V.L.; Kravtsova, R.G.; Smagunov, N.V. Structural and surface–bond gold in pyrite from deposits of various genetic types. Russ. Geol. Geophys. 2014, 55, 350–369. [Google Scholar] [CrossRef]
  15. Vikentyev, I.V. Invisible and microscopic gold in pyrite: Methods and new data for massive sulfide ores of the Urals. Geol. Ore Depos. 2015, 57, 237–265. [Google Scholar] [CrossRef]
  16. Tagirov, B.R.; Dikov, Y.P.; Buleev, M.I.; Koval’chuk, E.V.; Kokh, M.A.; Borisovskii, S.E.; Abramova, V.D.; Garas’ko, M.I.; Kovalenker, V.A.; Bortnikov, N.S.; et al. “Invisible” gold in covellite (CuS): Synthesis and studies by EPMA, LA–ICP–MS, and XPS techniques. Dokl. Earth Sci. 2014, 459, 1381–1386. [Google Scholar] [CrossRef]
  17. Tagirov, B.R.; Trigub, A.L.; Kvashnina, K.O.; Shiryaev, A.A.; Chareev, D.A.; Nickolsky, M.S.; Abramova, V.D.; Kovalchuk, E.V. Covellite CuS as a matrix for “invisible” gold: X-ray spectroscopic study of the chemical state of Cu and Au in synthetic minerals. Geochim. Cosmochim. Acta 2016, 191, 58–69. [Google Scholar] [CrossRef]
  18. Kovalchuk, E.V.; Tagirov, B.R.; Vikentyev, I.V.; Chareev, D.A.; Tyukova, E.E.; Nickolsky, M.S.; Borisovsky, S.E.; Bortnikov, N.S. «Invisible» gold in synthetic and natural crystals of arsenopyrite (Vorontsovka deposit, North Ural). Geol. Ore Dep. 2019, 61, 62–83. [Google Scholar] [CrossRef]
  19. Trigub, A.L.; Tagirov, B.R.; Chareev, D.A.; Nickolsky, M.S.; Shiryaev, A.A.; Kovalchuk, E.V.; Mokhov, A.V.; Kvashnina, K.O.; Baranova, N.N. X–Ray spectroscopy study of the chemical state of “invisible” Au in synthetic minerals in the Fe–As–S system. Am. Mineral. 2017, 102, 1057–1065. [Google Scholar]
  20. Kesler, S.E. Copper, molybdenum and gold abundances in porphyry copper deposits. Econ. Geol. 1973, 68, 106–112. [Google Scholar] [CrossRef]
  21. Sillitoe, R.H. Gold–rich porphyry deposits: Descriptive and genetic models and their role in exploration and discovery. Econ. Geol. Rev. 2000, 13, 315–345. [Google Scholar]
  22. Filimonova, O.N.; Nickolsky, M.S.; Trigub, A.L.; Chareev, D.A.; Kvashnina, K.O.; Kovalchuk, E.V.; Vikentyev, I.V.; Tagirov, B.R. The state of platinum in pyrite studied by X-ray absorption spectroscopy of synthetic crystals. Econ. Geol. 2019, 114, 1649–1663. [Google Scholar] [CrossRef]
  23. Filimonova, O.N.; Trigub, A.L.; Nickolsky, M.S.; Chareev, D.A.; Kvashnina, K.O.; Kovalchuk, E.V.; Vikentyev, I.V.; Tagirov, B.R. The state of platinum in pyrrhotite: X-ray absorption spectroscopy study and implications for the role of Fe sulfides as plati-num carriers. Ore Geol. Rev. 2021. in preparation. [Google Scholar]
  24. Vikent’ev, I.V.; Moloshag, V.P.; Yudovskaya, M.A. Platinum group elements in ores of massive sulfide deposits of the Urals. Dokl. Earth Sci. 2002, 385, 488–492. [Google Scholar]
  25. Vikentyev, I.V.; Yudovskaya, M.A.; Mokhov, A.V.; Kerzin, A.L.; Tsepin, A.I. Gold and PGE in sulphide massive sulphide ore of the Uzelginsk deposit, Southern Urals, Russia. Can. Mineral. 2004, 42, 651–665. [Google Scholar] [CrossRef] [Green Version]
  26. Vikentyev, I.V.; Grabezhev, A.I.; Moloshag, V.P.; Novokreschenov, S.M.; Neustroeva, I.I. PGE in the ores of magnet-ite-copper-skarn deposits of the Urals. In Yearbook-2004; Zavaritsky Institute of Geology and Geochemistry, Uralian Branch, RAS: Yekaterinburg, Russia, 2005; pp. 328–331. (In Russian) [Google Scholar]
  27. Murzin, V.V.; Varlamov, D.A.; Vikentyev, I.V. Copper-cobalt mineralization of the Pyshminsk-Klyuchevsk deposit in the Middle Urals: Mineral composition of ore and metasomatites, stages, P-T conditions of mineral formation. Lithosphere 2011, 6, 103–122. [Google Scholar]
  28. Vikentyev, I.V.; Abramova, V.D.; Moloshag, V.P.; Shangguo, S. PGE in minerals of volcanogenic massive sulfide deposits of the Urals: Ore geochemistry and first LA-ICP-MS data. In Abs.12th International Platinum Symposium; Zavaritsky Institute of Geology and Geochemistry: Yekaterinburg, Russia, 2014; pp. 326–327. [Google Scholar]
  29. Mansur, E.T.; Barnes, S.-J.; Duran, C.J. An overview of chalcophile element contents of pyrrhotite, pentlandite, chalcopyrite, and pyrite from magmatic Ni-Cu-PGE sulfide deposits. Miner. Depos. 2021, 56, 179–204. [Google Scholar] [CrossRef]
  30. Reich, M.; Kesler, S.E.; Utsunomiya, S.; Palenik, C.S.; Chryssoulis, S.L.; Ewing, R.C. Solubility of gold in arsenian pyrite. Geochim. Cosmochim. Acta 2005, 69, 2781–2796. [Google Scholar] [CrossRef]
  31. Franchini, M.; McFarlane, C.; Maydagán, L.; Reich, M.; Lentz, D.R.; Meinert, L.; Bouhier, V. Trace metals in pyrite and mar-casite from the Agua Rica porphyry–high sulphidation epithermal deposit, Catamarca, Argentina: Textural features and metal zoning at the porphyry to epithermal transition. Ore Geol. Rev. 2015, 66, 366–387. [Google Scholar] [CrossRef]
  32. Fleet, M.E.; Chryssoulis, S.L.; MacLean, P.J.; Davidson, R.; Weisener, C.G. Arsenian pyrite from gold deposits; Au and As distribution investigated by SIMS and EMP, and color staining and surface oxidation by XPS and LIMS. Can. Mineral. 1993, 31, 1–17. [Google Scholar]
  33. Leistel, J.M.; Marcoux, E.; Deschamps, Y.; Joubert, M. Antithetic behavior of gold in the volcanogenic massive sulphide de-posits of the Iberian Pyrite Belt. Mineral. Dep. 1997, 33, 82–97. [Google Scholar] [CrossRef]
  34. Bi, S.-J.; Li, J.-W.; Zhou, M.-F.; Li, Z.-K. Gold distribution in As-deficient pyrite and telluride mineralogy of the Yangzhaiyu gold deposit, Xiaoqinling district, southern North China craton. Miner. Depos. 2011, 46, 925–941. [Google Scholar] [CrossRef]
  35. Chen, L.; Li, X.; Li, J.; Hofstra, A.H.; Liu, Y.; Koenig, A.E. Extreme variation of sulphur isotopic compositions in pyrite from the Qiuling sediment–hosted gold deposit, West Qinling orogen, central China: An in situ SIMS study with implications for the source of sulphur. Mineral. Dep. 2015, 50, 643–656. [Google Scholar] [CrossRef]
  36. Vikentyev, I.V. Invisible and microscopic gold in pyrite: New data for volcanogenic massive sulphide ores of the Urals. In Mineral Resources in a Sustainable World; Andre-Mayer, A.S., Ed.; SGA: Nancy, France, 2015; pp. 2113–2116. [Google Scholar]
  37. Tseluyko, A.S.; Maslennikov, V.V.; Ayupova, N.R.; Maslennikova, S.P.; Danyushevsky, L.V. Tellurium–bearing minerals in clastic ores of Ybileynoe massive sulphide deposit (South Urals). Geol. Ore Dep. 2019, 61, 133–161. [Google Scholar] [CrossRef]
  38. Ivanova, J.N.; Tykova, E.E.; Abramova, V.D.; Kovalchuk, E.V.; Vikentyev, I.V. Ores mineralogy and first data about “in-visible” form of Au in pyrite of the Novogodnee–Monto deposit (the Polar Urals, Russia). In Mineral Resources in a Sustainable World; Andre–Mayer, A.S., Ed.; SGA: Nancy, France, 2015; pp. 121–125. [Google Scholar]
  39. Vikentiev, I.V.; Abramova, V.D.; Ivanova, Y.N.; Tyukova, E.E.; Kovalchuk, E.V.; Bortnikov, N.S. Trace elements in pyrite from the Petropavlovsk gold–porphyry deposit (Polar Urals): Results of LA-ICP-MS analysis. Dokl. Earth Sci. 2016, 470, 977–981. [Google Scholar] [CrossRef]
  40. Vikentyev, I.V.; Mansurov, R.K.; Ivanova, Y.N.; Tyukova, E.E.; Sobolev, I.D.; Abramova, V.D.; Vykhristenko, R.I.; Trofimov, A.P.; Khubanov, V.B.; Groznova, E.O.; et al. Porphyry-style Petropavlovskoe gold deposit, the Polar Urals: Geological position, mineralogy, and formation conditions. Geol. Ore Depos. 2017, 59, 482–520. [Google Scholar] [CrossRef]
  41. Vikent’eva, O.V.; Bortnikov, N.S. The large Svetlinsk Au-Te deposit, South Urals: Telluride mineralization for genetic recon-structions. In Mineral Resources in a Sustainable World; Andre-Mayer, A.S., Ed.; SGA: Nancy, France, 2015; pp. 851–854. [Google Scholar]
  42. Vikent’eva, O.; Vikentev, I. Occurrence modes of As, Sb, Te, Bi, Ag in sulphide assemblages of gold deposits of the Urals. In IOP Conference Series: Materials Science and Engineering; IOP Publishing: Bristol, UK, 2016; Volume 123, pp. 1–4. [Google Scholar] [CrossRef]
  43. Kampmann, T.C.; Jansson, N.F.; Stephens, M.B.; Olin, P.H.; Gilbert, S.; Wanhainen, C. Syn-tectonic sulphide remobilization and trace element redistribution at the Falun pyritic Zn-Pb-Cu-(Au-Ag) sulphide deposit, Bergslagen, Sweden. Ore Geol. Rev. 2018, 96, 48–71. [Google Scholar] [CrossRef]
  44. Chareev, D.A. General principles of the synthesis of chalcogenides and pnictides in salt melts using a steady-state temperature gradient. Crystallogr. Rep. 2016, 61, 506–511. [Google Scholar] [CrossRef]
  45. Chareev, D.A.; Volkova, O.S.; Geringer, N.V.; Koshelev, A.V.; Nekrasov, A.N.; Osadchii, V.O.; Osadchii, E.G.; Filimonova, O.N. Synthesis of chalcogenide and pnictide crystals in salt melts using a steady-state temperature gradient. Crystallogr. Rep. 2016, 61, 682–691. [Google Scholar] [CrossRef]
  46. Widler, A.M.; Seward, T.M. The adsorption of gold(I) hydrosulphide complexes by iron sulphide surfaces. Geochim. Cosmochim. Acta 2002, 66, 383–402. [Google Scholar] [CrossRef]
  47. Laptev, Y.V.; Rozov, K.B. Interaction of gold with sulphide surface as a factor of its concentration in hydrothermal ore formation. Dokl. Earth Sci. 2006, 411, 1229–1232. [Google Scholar] [CrossRef]
  48. Cardile, C.M.; Cashion, J.D.; McGrath, A.C.; Renders, P.; Seward, T.M. 197Au Mössbauer study of Au2S and gold adsorbed onto As2S3 and Sb2S3 substrates. Geochim. Cosmochim. Acta 1993, 57, 2481–2486. [Google Scholar] [CrossRef]
  49. Kozerenko, S.V.; Wagner, F.E.; Friedl, J.; Fadeev, V.V. Gold in pyrite formation processes: 3. Mössbauer study of synthetic gold–bearing iron sulphides. Geochem. Intern. 2001, 39, S167–S172. [Google Scholar]
  50. Simon, G.; Huang, H.; Penner–Hahn, J.E.; Kesler, S.; Kao, L.S. Oxidation state of gold and arsenic in gold–bearing arsenian pyrite. Am. Mineral. 1999, 84, 1071–1079. [Google Scholar] [CrossRef]
  51. Cabri, L.J.; Newville, M.; Gordon, R.A.; Crozier, E.D.; Sutton, S.R.; McMahon, G.; Jiang, D.-T. Chemical Speciation of Gold in Arsenopyrite. Can. Miner. 2000, 38, 1265–1281. [Google Scholar] [CrossRef] [Green Version]
  52. Filimonova, O.N.; Tagirov, B.R.; Trigub, A.L.; Nickolsky, M.S.; Rovezzi, M.; Belogub, E.V.; Reukov, V.L.; Vikentyev, I.V. The state of Au and as in pyrite studied by X-ray absorption spectroscopy of natural minerals and synthetic phases. Ore Geol. Rev. 2020, 121, 103475. [Google Scholar] [CrossRef]
  53. Taylor, S.R.; McLennan, S.M. The Continental Crust: Its Composition and Evolution; Blackwell Scientific: Oxford, UK, 1985; pp. 1–190. [Google Scholar]
  54. Sillitoe, R.H. Gold deposit types: An overview. In Geology of the World’s Major Gold Deposits and Provinces; Spec. Publ. No. 23; Society of Economic Geologists Inc.: Littleton, CO, USA, 2020; pp. 1–28. [Google Scholar]
  55. Sazonov, V.N.; Van Herk, A.H.; de Boorder, H. Spatial and temporal distribution of gold deposits in the Urals. Econ. Geol. 2001, 96, 685–703. [Google Scholar] [CrossRef]
  56. Prokin, V.A.; Buslaev, F.P. Massive copper–zinc sulphide deposits in the Urals. Ore Geol. Rev. 1998, 14, 1–69. [Google Scholar] [CrossRef]
  57. Vikentyev, I.V.; Belogub, E.V.; Novoselov, K.A.; Moloshag, V.P. Metamorphism of volcanogenic massive sulphide deposits in the Urals. Ore geology. Ore Geol. Rev. 2017, 85, 30–63. [Google Scholar] [CrossRef]
  58. Herrington, R.; Zaykov, V.V.; Maslennikov, V.V.; Brown, D.; Puchkov, V.N. Mineral deposits of the Urals and links to geo-dynamic evolution. Econ. Geol. 2005, 100, 1069–1095. [Google Scholar]
  59. Bortnikov, N.S.; Vikentyev, I.V. Endogenous metallogeny of the Urals. In Mineral Deposit Research for a High-Tech World Proceedings of the 12th Biennial SGA Meeting; Jonsson, E., Ed.; SGA: Uppsala, Sweden, 2013; pp. 1508–1511. [Google Scholar]
  60. Puchkov, V.N. General features relating to the occurrence of mineral deposits in the Urals: What, where, when and why. Ore Geol. Rev. 2017, 85, 4–29. [Google Scholar] [CrossRef]
  61. Puchkov, V.N. Geology of Urals and Cis–Urals (Actual Problems of Stratigraphy, Tectonics, Geodynamics and Metallogeny); Design Poligraph Service Publ.: Ufa, Russia, 2010. (In Russian) [Google Scholar]
  62. Sazonov, V.N.; Murzin, V.V.; Grigor’ev, N.A. Vorontsovsk gold deposit: An example of Carlin–type mineralization in the Urals, Russia. Geol. Ore Dep. 1998, 40, 139–151. [Google Scholar]
  63. Vikentyev, I.V.; Tyukova, E.E.; Vikent’eva, O.V.; Chugaev, A.V.; Dubinina, E.O.; Prokofiev, V.Y.; Murzin, V.V. Vorontsovka Carlin–style gold deposit in the north Urals: Mineralogy, fluid inclusion and isotope data for genetic model. Chem. Geol. 2019, 508, 144–166. [Google Scholar] [CrossRef]
  64. Vikent’eva, O.V.; Bortnikov, N.S.; Vikentyev, I.V.; Groznova, E.O.; Lyubimtseva, N.G.; Murzin, V.V. The Berezovsk giant intrusion-related gold-quartz deposit, Urals, Russia: Evidence for multiple magmatic and metamorphic fluid reservoirs. Ore Geol. Rev. 2017, 91, 837–863. [Google Scholar] [CrossRef]
  65. Sazonov, V.N.; Popov, V.A.; Grigoryev, N.A.; Murzin, V.V.; Metsner, E.I. Crust–Mantle Mineralisation in the Salic Blocks of Eugeosyncline; UrO USSR AN: Sverdlovsk, Russia, 1989. (In Russian) [Google Scholar]
  66. Vikent’eva, O.; Prokofiev, V.; Borovikov, A.; Kryazhev, S.; Groznova, E.; Pritchin, M.; Vikentyev, I.; Bortnikov, N. Contrasting fluids in the Svetlinsk gold-telluride hydrothermal system, South Urals. Minerals 2020, 10, 37. [Google Scholar] [CrossRef] [Green Version]
  67. Vikentyev, I.V. Precious metal and telluride mineralogy of large volcanic–hosted massive sulphide deposits in the Urals. Mineral. Petrol. 2006, 87, 305–326. [Google Scholar] [CrossRef]
  68. Seravkin, I.B. Correlation of compositions of ore and host rocks in volcanogenic massive sulphide deposits (on the samples of South Urals). Geol. Ore Dep. 2013, 55, 68–83. [Google Scholar] [CrossRef]
  69. Karpukhina, V.S.; Naumov, V.B.; Vikent’ev, I.V. Genesis of massive sulphide deposits in the Verkhneural’sk ore district, the South Urals, Russia: Evidence for magmatic contribution of metals and fluids. Geol. Ore Dep. 2013, 55, 125–143. [Google Scholar] [CrossRef]
  70. Seravkin, I.B.; Kosarev, A.M.; Puchkov, V.N. Geodynamic conditions of formation of massive sulfide deposits in the Magnitogorsk Megazone, Southern Urals, and prospection criteria. Geol. Ore Depos. 2017, 59, 227–243. [Google Scholar] [CrossRef]
  71. Vikentyev, I.V.; Simonov, V.A.; Borisova, A.Y.; Karpukhina, V.S.; Naumov, V.B. Volcanic–hosted massive sulphide deposits of the Urals, Russia: Evidence for a magmatic contribution of metals and fluid. In Mineral Deposit Research for a High–Tech World; Jonsson, E., Ed.; SGA: Uppsala, Sweden, 2013; pp. 1526–1529. [Google Scholar]
  72. Vikentev, I. Selenium, tellurium and precious metal mineralogy in Uchalinsk copper-zinc-pyritic district, the Urals. In IOP Conference Series: Materials Science and Engineering; IOP Publishing: Bristol, UK, 2016; Volume 123, p. 012027. [Google Scholar]
  73. Prokin, V.A.; Buslaev, F.P.; Vinogradov, A.M.; Moloshag, V.P.; Kuznetsov, S.I. Gaisk Mining and Processing Company: Geology of Gaisk and Podolsk Copper-Zinc Pyritic Deposits on the Urals; Nauka: Yekaterinburg, Russia, 2004; 148p. (In Russian) [Google Scholar]
  74. Vikentyev, I.; Seravkin, I.; Moloshag, V.; Skuratov, V.; Yudovskaya, M.; Mokhov, A.; Kerzin, A.; Tsepin, A. Au and Ag in ores of the Gaisk giant VHMS deposit, South Urals. Extended Abs.12th IAGOD Symp. In Understanding the Genesis of Ore Deposits to Meet the Demands of the 21st Century; Elsevier: Amsterdam, The Netherlands, 2006; pp. 1305–1308. [Google Scholar]
  75. Pshenichny, G.N. Gai Copper–VMS Deposit of the South Urals; Nauka: Moscow, Russia, 1975; 188p. (In Russian) [Google Scholar]
  76. Vikentyev, I.V. Formation Conditions and Metamorphism of Pyrite Ores; Nauch: Moscow, Russia, 2004; 344p. (In Russian) [Google Scholar]
  77. Yakubovich, O.V.; Podolskaya, M.M.; Vikentyev, I.V.; Fokina, E.L.; Kotov, A.B. U-Th-He geochronology of pyrite from the Uzelga VMS deposit (South Urals)—new perspectives for direct dating of the ore-forming processes. Minerals 2020, 10, 629. [Google Scholar] [CrossRef]
  78. Vikentyev, I.; Chugaev, A.; Karpukhina, V.; Nosik, L.; Rimskaya–Korsakova, M. Origin of Uzelginsk Zn–Cu–Ag VHMS deposit, Southern Urals. Extended abs. In: 12th IAGOD Symp. In Understanding the Genesis of ore Deposits to Meet the Demands of the 21st Century; Elsevier: Amsterdam, The Netherlands, 2006; pp. 1233–1236. [Google Scholar]
  79. Vikentyev, I.V.; Karpukhina, V.S. Uzelginsk Zn–Cu–Ag VMS deposit, South Urals: Genetic aspect. In Applied Mineralogy; Rammlmair, Ed.; Balkema: Rotterdam, The Netherlands, 2000; pp. 455–459. [Google Scholar]
  80. Vikentyev, I.V.; Tyukova, E.E.; Murzin, V.V.; Vikent’eva, O.V.; Pavlov, L.G. Vorontsovka Gold Deposit. Geology, Gold Modes, Genesis; FortDialogIset Publ.: Ekaterinburg, Russia, 2016; 204p. (In Russian) [Google Scholar]
  81. Akinfiev, N.N.; Vikentyev, I.V. Physicochemical modeling of ore formation at the gold and volcanogenic massive sulfide deposits of the Northern Urals. Geochem. Int. 2020, 58, 1437–1442. [Google Scholar] [CrossRef]
  82. Zhukhlistov, A.P.; Vikent’ev, I.V.; Rusinova, O.V. Electron diffraction study of 1 M illites with interstratified trans- and cis-vacant 2:1 layers. Crystallogr. Rep. 2012, 57, 270–276. [Google Scholar] [CrossRef]
  83. Udachin, V.; Williamson, B.J.; Purvis, O.W.; Spiro, B.; Dubbin, W.; Brooks, S.; Coste, B.; Herrington, R.; Mikhailova, I. As-sessment of environmental impacts of active smelter operations and abandoned mines in Karabash, Ural Mountains, Russia. J. Sustain. Dev. 2003, 11, 133–142. [Google Scholar] [CrossRef]
  84. Mercier–Langevin, P.; Hannington, M.D.; Dubé, B.; Bécu, V. The gold content of volcanogenic massive sulphide deposits. Mineral. Dep. 2011, 46, 509–539. [Google Scholar] [CrossRef] [Green Version]
  85. Wilson, S.A.; Ridley, I.; Koenig, A.E. Development of sulphide calibration standards for the laser ablation inductively–coupled plasma mass spectrometry technique. J. Anal. At. Spec. 2002, 17, 406–409. [Google Scholar] [CrossRef]
  86. Wohlgemuth–Ueberwasser, C.C.; Ballhaus, C.; Berndt, J.; Stotter née Paliulionyte, V.; Meisel, T. Synthesis of PGE sulphide standards for laser ablation inductivelycoupled plasma mass spectrometry (LA-ICP-MS). Contrib. Mineral. Petrol. 2007, 154, 607–617. [Google Scholar] [CrossRef]
  87. Vinokurov, S.F.; Vikentyev, I.V. Ionic mode of gold in sulphide ores. Dokl. Earth Sci. 2008, 422, 1062–1064. [Google Scholar] [CrossRef]
  88. Vinokurov, S.F.; Vikent’ev, I.V. Quantifying the ionic form of gold in sulfide ores. Her. Russ. Acad. Sci. 2009, 79, 462–467. [Google Scholar] [CrossRef]
  89. Vinokurov, S.F.; Vikent’ev, I.V.; Sychkova, V.A. Determining ionic gold species in massive sulphide ores. Geochem. Intern. 2010, 48, 510–516. [Google Scholar] [CrossRef]
  90. Chareev, D.A.; Osadchii, V.O.; Shiryaev, A.A.; Nekrasov, A.N.; Koshelev, A.V.; Osadchii, E.G. Single-crystal Fe-bearing sphalerite: Synthesis, lattice parameter, thermal expansion coefficient and microhardness. Phys. Chem. Miner. 2017, 44, 287–296. [Google Scholar] [CrossRef]
  91. Filimonova, O.N.; Minervina, E.A.; Kovalchuk, E.V.; Abramova, V.D.; Vikent’iev, I.; Tagirov, B.R.; Chareev, D.A.; Chvosti-cov, V.A. An experimental study of noble and base metals (Au, Ag, Pt, Pd, Zn) distribution in pyrite and pyrrhotite. In Mineral Resources in a Sustainable World; Andre–Mayer, A.S., Ed.; SGA: Nancy, France, 2015. [Google Scholar]
  92. Filimonova, O.N.; Trigub, A.L.; Tonkacheev, D.E.; Nickolsky, M.S.; Kvashnina, K.O.; Chareev, D.A.; Chaplygin, I.V.; Kovalchuk, E.V.; Lafuerza, S.; Tagirov, B.R. Substitution mechanisms in In-, Au-, and Cu-bearing sphalerites studied by X-ray absorption spectroscopy of synthetic compounds and natural minerals. Miner. Mag. 2019, 83, 435–451. [Google Scholar] [CrossRef]
  93. Vikentyev, I.V.; Vikentyeva, O.V. Precious metal minerals and «invisible» gold in sulfide ores of Urals. Mater. of XII Int. sci. conf. «Advanced technologies, equipment and analytical systems for materials and nano-materials». Ust-Kamenogorsk East-Kazakhstan State Tech. Univ. 2015, 3, 33–41. [Google Scholar]
  94. Rogozhnikov, D.A.; Shoppert, A.A.; Dizer, O.A.; Karimov, K.A.; Rusalev, R.E. Leaching kinetics of sulfides from refractory gold concentrates by nitric acid. Metals 2019, 9, 465. [Google Scholar] [CrossRef] [Green Version]
  95. Cabri, L.J.; Chryssoulis, S.L.; De Villiers, J.P.R.; Laflamme, J.H.G.; Buseck, P.R. The nature of “invisible” gold in arsenopyrite. Can. Mineral. 1989, 27, 353–362. [Google Scholar]
  96. Fleet, M.E.; Mumin, A.H. Gold-bearing arsenian pyrite and marcasite and arsenopyrite from Carlin Trend gold deposits and laboratory synthesis. Am. Miner. 1997, 82, 182–193. [Google Scholar] [CrossRef]
  97. Cepedal, A.; Fuertes–Fuente, M.; Martin-Izard, A.; González-Nistal, S.; Barrero, M. Gold–bearing As–rich pyrite and arsenopy-rite from the El Valle gold deposit, Asturias. Northwest Spain. Can. Mineral. 2008, 46, 233–247. [Google Scholar] [CrossRef]
  98. Murzin, V.V.; Naumov, E.A.; Azovskova, O.B.; Varlamov, D.A.; Rovnushkin, M.Y.; Pirajno, F. The Vorontsovskoe Au-Hg-As ore deposit (Northern Urals, Russia): Geological setting, ore mineralogy, geochemistry, geochronology and genetic model. Ore Geol. Rev. 2017, 85, 271–298. [Google Scholar] [CrossRef]
  99. Sidorova, N.V.; Vikent’ev, I.V.; Abramova, V.D.; Koval’chuk, E.V. Gold and other impurity elements in pyrite from the Berezovskoe deposit in the Middle Urals. Lithosphere 2019, 2, 327–336. [Google Scholar] [CrossRef] [Green Version]
  100. Ciobanu, C.L.; Cook, N.J.; Pring, A.; Brugger, J.; Danyushevsky, L.V.; Shimizu, M. ‘Invisible gold’ in bismuth chalcogenides. Geochim. Cosmochim. Acta 2009, 73, 1970–1999. [Google Scholar] [CrossRef]
  101. Steadman, J.A.; Large, R.R. Synsedimentary, diagenetic, and metamorphic pyrite, pyrrhotite, and marcasite at the Homestake BIF-Hosted gold deposit, South Dakota, USA: Insights on Au-As ore genesis from textural and LA-ICP-MS trace element studies. Econ. Geol. 2016, 111, 1731–1752. [Google Scholar] [CrossRef]
  102. Tauson, V.L.; Babkin, D.N.; Pastushkova, T.M.; Krasnoshchekova, T.S.; Lustenberg, E.E.; Belozerova, O.Y. Dualistic distribution coefficients of elements in the system mineral-hydrothermal solution. I. Gold accumulation in pyrite. Geochem. Int. 2011, 49, 568–577. [Google Scholar] [CrossRef]
  103. Vikent’ev, I.V. Composition of native gold in massive sulphide ores of the Urals. Dokl. Earth Sci. 2003, 393, 1284–1288. [Google Scholar]
  104. Maslennikov, V.V.; Lein, A.Y.; Maslennikova, S.P.; Bogdanov, Y.A. Phanerozoic “black smokers” as indicator of host rocks composition. Lithosphere 2010, 10, 153–162. [Google Scholar]
  105. Zaykov, V.V.; Melekestseva, I.Y. Gold and silver minerals in the ore facies from gold–polymetallic deposits of Baimak ore district, the South Urals. Lithosphere 2011, 11, 71–90. [Google Scholar]
  106. Petrovskaya, N.V. Native Gold; Nauka Publ.: Moscow, Russia, 1973. (In Russian) [Google Scholar]
  107. Boyle, R.W. The Geochemistry of Gold and Its Deposits. Bull. Geol. Surv. Can. 1979, 280, 584. [Google Scholar]
  108. Trofimov, N.D.; Trigub, A.L.; Tagirov, B.R.; Filimonova, O.N.; Evstigneeva, P.V.; Chareev, D.A.; Kvashnina, K.O.; Nickolsky, M.S. The state of trace elements (In, Cu, Ag) in sphalerite studied by X-ray absorption spectroscopy of synthetic minerals. Minerals 2020, 10, 640. [Google Scholar] [CrossRef]
  109. Pring, A.; Wade, B.; McFadden, A.; Lenehan, C.E.; Cook, N.J. Coupled substitutions of minor and trace elements in co-existing sphalerite and wurtzite. Minerals 2020, 10, 147. [Google Scholar] [CrossRef] [Green Version]
  110. Tonkacheev, D.E.; Chareev, D.A.; Abramova, V.D.; Yudovskaya, M.A.; Minervina, E.A.; Tagirov, B.R. Sphalerite as a matrix for noble, non–ferrous metals and semimetals: A EPMA and LA–ICP–MS study of synthetic crystals. In Mineral Resources in a Sustainable World; Andre–Mayer, A.S., Ed.; SGA: Nancy, France, 2015; pp. 847–850. [Google Scholar]
  111. Tonkacheev, D.E.; Chareev, D.A.; Abramova, V.D.; Trofimov, N.D.; Tagirov, B.R. “Invisible” gold and PGE elements in synthetic crystals of sphalerite, greenockite and covellite: A EPMA, LA–ICP–MS and XAFS study. In Proceedings of the Fifteenth International Symposium on Experimental Mineralogy, Petrology and Geochemistry (EMPG-XV), ETH Zurich, Switzerland, 5–8 June 2016. [Google Scholar]
  112. Palyanova, G.A. Gold and silver minerals in sulfide ore. Geol. Ore Deposits 2020, 62, 383–406. [Google Scholar] [CrossRef]
  113. Safonov, Y.G. Topical issues of the theory of gold deposit formation. Geol. Ore Deposits 2010, 52, 438–458. [Google Scholar] [CrossRef]
  114. Simmons, S.F.; Tutolo, B.M.; Barker, S.L.L.; Goldfarb, R.J.; Robert, F. Hydrothermal gold deposition in epithermal, Carlin, and orogenic deposits. In Geology of the World’s Major Gold Deposits and Provinces; Spec. Publ. No. 23; Society of Economic Geologists Inc.: Littleton, CO, USA, 2020; pp. 823–845. [Google Scholar]
  115. Vikent’ev, I.V.; Belen’kaya, Y.A.; Ageev, B.I. The Aleksandrinsk polymetallic massive sulphide deposit (the Urals, Russia). Geol. Ore Dep. 2000, 42, 221–246. [Google Scholar]
  116. Ganzhenko, G.D.; Yudovskaya, M.A.; Vikentyev, I.V. Gold–polymetallic mineralization of the Ridder–Sokolnoye deposit in the Rudny Altai (Eastern Kazakhstan). Mineralogy 2018, 4, 8–34. [Google Scholar]
  117. Bortnikov, N.S.; Cabri, L.; Vikent’ev, I.V.; McMahon, G.; Bogdanov, Y.A. Invisible gold in sulphides from recent submarine hydrothermal mounds. Dokl. Earth Sci. 2000, 373, 863–866. [Google Scholar]
  118. Bortnikov, N.S.; Cabri, L.J.; Vikentiev, I.V.; Tagirov, B.R.; Mc Mahon, G.; Bogdanov, Y.A.; Stavrova, O.O. Invisible gold in sulphides from seafloor massive sulphide edifices. Geol. Ore Dep. 2003, 45, 201–212. [Google Scholar]
  119. Bortnikov, N.S.; Vikent’ev, I.V. Modern base metal sulphide mineral formation in the world ocean. Geol. Ore Dep. 2005, 47, 13–44. [Google Scholar]
  120. Sayab, M.; Suuronen, J.-P.; Molnar, F.; Villanova, J.; Kallonen, A.; O’Brien, H.; Lahtinen, R.; Lehtonen, M. Three-dimensional textural and quantitative analyses of orogenic gold at the nanoscale. Geology 2016, 44, 739–742. [Google Scholar] [CrossRef]
  121. Chryssoulis, S.L.; McMullen, J. Mineralogical investigation of gold ores. Dev. Miner. Process. 2005, 15, 21–71. [Google Scholar]
  122. Tauson, V.L.; Lipko, S.V.; Smagunov, N.V.; Kravtsova, R.G. Trace element partitioning dualism under mineral–fluid interaction: Origin and geochemical significance. Minerals 2018, 8, 282. [Google Scholar] [CrossRef] [Green Version]
  123. Novgorodova, M.I. Native Metals in Hydrothermal Ores; Nauka Publ.: Moscow, Russia, 1983. (In Russian) [Google Scholar]
  124. Nekrasov, I.Y. Geochemistry, Mineralogy, and Origin of Gold Ore Deposits; Nauka Publ.: Moscow, Russia, 1991; 304p. (In Russian) [Google Scholar]
  125. Pal’yanova, G.; Mikhlin, Y.; Kokh, K.; Karmanov, N.; Seryotkin, Y. Experimental constraints on gold and silver solubility in iron sulfides. J. Alloys Compd. 2015, 649, 67–75. [Google Scholar] [CrossRef]
  126. Pal’yanova, G.A.; Mikhlin, Y.L.; Karmanov, N.S.; Kokh, K.A.; Seryotkin, Y.V. Visible and “invisible” forms of gold and silver in the products of melt crystallization in the Fe–S–Ag–Au system: Experimental data. Dokl. Earth Sci. 2017, 474, 636–640. [Google Scholar] [CrossRef]
  127. Large, R.R.; Maslennikov, V.V. Invisible gold paragenesis and geochemistry in pyrite from orogenic and sediment-hosted gold deposits. Minerals 2020, 10, 339. [Google Scholar] [CrossRef] [Green Version]
  128. Lipko, S.; Tauson, V.; Bychinskii, V. Gold partitioning in a model multiphase mineral-hydrothermal fluid system: Distribution coefficients, speciation and segregation. Minerals 2020, 10, 890. [Google Scholar] [CrossRef]
  129. Johan, Z. Indium and germanium in the structure of sphalerite: An example of coupled substitution with Copper. Miner. Pet. 1988, 39, 211–229. [Google Scholar] [CrossRef]
  130. Murakami, H.; Ishihara, S. Trace elements of Indium-bearing sphalerite from tin-polymetallic deposits in Bolivia, China and Japan: A femto-second LA-ICPMS study. Ore Geol. Rev. 2013, 53, 223–243. [Google Scholar] [CrossRef]
  131. Zhang, Y.; Chu, F.; Li, Z.; Dong, Y.; Wang, H.; Li, X.; Long, J. Gold enrichment in hydrothermal sulfides from the Okinawa Trough: An in situ LA-ICP-MS study. Ore Geol. Rev. 2020, 116, 103255. [Google Scholar] [CrossRef]
  132. Wohlgemuth-Ueberwasser, C.C.; Viljoen, F.; Petersen, S.; Vorster, C. Distribution and solubility limits of trace elements in hydrothermal black smoker sulfides: An in-situ LA-ICP-MS study. Geochim. Cosmochim. Acta 2015, 159, 16–41. [Google Scholar] [CrossRef]
  133. Osadchii, V.O. Trivalent iron in the structure of sphalerite. In Lomonosov Reading–2016; Moscow State University: Moscow, Russia, 2016; Available online: https://istina.msu.ru/conferences/presentations/19830602/ (accessed on 26 April 2021). (In Russian)
  134. Cook, N.J.; Ciobanu, C.L.; Brugger, J.; Etschmann, B.; Howard, D.L.; De Jonge, M.D.; Ryan, C.; Paterson, D. Determination of the oxidation state of Cu in substituted Cu-In-Fe-bearing sphalerite via XANES spectroscopy. Am. Miner. 2012, 97, 476–479. [Google Scholar] [CrossRef]
  135. Belissont, R.; Muñoz, M.; Boiron, M.-C.; Luais, B.; Mathon, O. Distribution and oxidation state of Ge, Cu and Fe in sphalerite by μ-XRF and K-edge μ-XANES: Insights into Ge incorporation, partitioning and isotopic fractionation. Geochim. Cosmochim. Acta 2016, 177, 298–314. [Google Scholar] [CrossRef]
  136. Tonkacheev, D.E.; Chareev, D.A.; Abramova, V.D.; Kovalchuk, E.V.; Vikentyev, I.V.; Tagirov, B.R. The substitution mechanism of Au in In–, Fe– and In–Fe–bearing synthetic crystals of sphalerite, based on the data from EPMA and LA–ICP–MS study. Lithosphere 2019, 19, 148–161. [Google Scholar] [CrossRef]
  137. Koelmans, H. Association and dissociation of centres in luminescent ZnS-In. J. Phys. Chem. Solids 1960, 17, 69–79. [Google Scholar] [CrossRef]
  138. Pattrick, R.A.D.; Mosselmans, J.F.W.; Charnock, J.M. An X-ray absorption study of doped sphalerites. Eur. J. Miner. 1998, 10, 239–250. [Google Scholar] [CrossRef] [Green Version]
  139. Di Benedetto, F.; Bernardini, G.P.; Costagliola, P.; Plant, D.; Vaughan, D.J. Compositional zoning in sphalerite crystals. Am. Miner. 2005, 90, 1384–1392. [Google Scholar] [CrossRef]
  140. Lin, Y.; Cook, N.J.; Ciobanu, C.L.; Liu, Y.P.; Zhang, Q.; Liu, T.G.; Gao, W.; Yang, Y.L.; Danyushevskiy, L. Trace and minor elements in sphalerite from base metal deposits in South China: A LA-ICPMS study. Ore Geol. Rev. 2011, 39, 188–217. [Google Scholar]
  141. Pokrovski, G.S.; Akinfiev, N.N.; Borisova, A.Y.; Zotov, A.V.; Kouzmanov, K. Gold speciation and transport in geological fluids: Insights from experiments and physical-chemical modelling. Geol. Soc. Lond. Spéc. Publ. 2014, 402, 9–70. [Google Scholar] [CrossRef]
  142. Tauson, V.L.; Mironov, A.G.; Smagunov, N.V.; Bugaeva, B.G.; Akimov, V.V. Gold in sulphides: State of the art of occurrence and horizons of experimental studies. Rus. Geol. Geophys. 1996, 37, 1–11. [Google Scholar]
  143. Pals, D.W.; Spry, P.G.; Chryssoulis, S. Invisible gold and tellurium in arsenic-rich pyrite from the Emperor gold deposit, Fiji: Implications for gold distribution and deposition. Econ. Geol. 2003, 98, 479–493. [Google Scholar] [CrossRef]
  144. McClenaghan, S.H.; Lentz, D.R.; Martin, J.; Diegor, J. Gold in the Brunswick No. 12 volcanogenic massive sulphide deposit, Bathurst Mining Camp, Canada: Evidence from bulk–ore analysis and laser–ablation ICP–MS–data on sulphide phases. Mineral. Dep. 2009, 44, 523–557. [Google Scholar] [CrossRef]
  145. Tauson, V.L.; Lustenberg, E.K. Quantitative determination of modes of gold occurrence in minerals by the statistical analysis of analytical data samplings. Geochem. Int. 2008, 46, 423–428. [Google Scholar] [CrossRef]
  146. Economou–Eliopoulos, M.; Eliopoulos, D.G.; Chryssoulis, S. A comparison of high–Au massive sulphide ores hosted in ophiolite complexes of the Balkan Peninsula with modern analogues: Genetic significance. Ore Geol. Rev. 2008, 33, 81–100. [Google Scholar] [CrossRef]
  147. Clark, L.A. The Fe-As-S system; phase relations and applications. Econ. Geol. 1960, 55, 1631–1652. [Google Scholar] [CrossRef]
  148. Arehart, G.B.; Chryssoulis, S.L.; Kesler, S.E. Gold and arsenic in iron sulfides from sediment-hosted disseminated gold deposits; implications for depositional processes. Econ. Geol. 1993, 88, 171–185. [Google Scholar] [CrossRef]
  149. Palenik, C.S.; Utsunomiya, S.I.; Reich, M.; Kesler, S.E.; Wang, L.; Ewing, R.C. “Invisible” gold revealed: Direct imaging of gold nanoparticles in a Carlin-type deposit. Am. Miner. 2004, 89, 1359–1366. [Google Scholar] [CrossRef]
  150. Griffin, W.L.; Ashley, P.M.; Ryan, C.G.; Sie, S.H.; Suter, G.F. Pyrite geochemistry in the North Arm Epitermal Ag–Au deposit, Queensland, Australia. A Proton microprobe study. Can. Mineral. 1991, 29, 185–198. [Google Scholar]
  151. Aylmore, M.G. Distribution and Agglomeration of Gold in Arsenopyrite and Pyrite. Ph.D. Thesis, Curtin University of Technology, Perth, Australia, 1995; 209p. [Google Scholar]
  152. Su, W.; Zhang, H.; Hu, R.; Ge, X.; Xia, B.; Chen, Y.; Zhu, C. Mineralogy and geochemistry of gold–bearing arsenian pyrite from the Shuiyindong Carlin–type gold deposit. Guizhou. China: Implications for gold depositional processes. Mineral. Dep. 2012, 47, 653–662. [Google Scholar] [CrossRef]
  153. Sack, P.J.; Large, R.R.; Gregory, D.D. Geochemistry of shale and sedimentary pyrite as a proxy for gold fertility in the Selwyn basin area, Yukon. Miner. Depos. 2018, 53, 997–1018. [Google Scholar] [CrossRef]
  154. Cathelineau, M.; Boiron, M.-C.; Holliger, P.; Marion, P.; Denis, M. Gold in arsenopyrites: Crystal chemistry, location and state, physical and chemical conditions of deposition. Econ. Geol. Monogr. 1989, 6, 328–341. [Google Scholar]
  155. Cook, N.; Chryssoulis, S. Concentration of “invisible” gold in the common sulphides. Can. Mineral. 1990, 28, 1–16. [Google Scholar]
  156. Vaughan, J.P.; Kyin, A. Refractory gold ores in Archaean greenstones, Western Australia: Mineralogy, gold paragenesis, metallurgical characterization and classification. Miner. Mag. 2004, 68, 255–277. [Google Scholar] [CrossRef]
  157. Kovalev, K.R.; Kalinin, Y.A.; Naumov, E.A.; Kolesnikova, M.K.; Korolyuk, V.N. Gold–bearing arsenopyrite in eastern Kazakhstan gold–sulfide deposits. Russ. Geol. Geophys. 2011, 52, 178–192. [Google Scholar] [CrossRef]
  158. Benzaazoua, M.; Marion, P.; Robaut, F.; Pinto, A. Gold–bearing arsenopyrite and pyrite in refractory ores: Analytical refinements and new understanding of gold mineralogy. Mineral. Mag. 2007, 71, 123–142. [Google Scholar] [CrossRef]
  159. Mumin, A.H.; Fleet, M.E.; Chryssoulis, S.L. Gold mineralization in As-rich mesothermal gold ores of the Bogosu-Prestea mining district of the Ashanti gold belt, Ghana: Remobilization of ‘invisible’ gold. Mineral. Dep. 1994, 29, 445–460. [Google Scholar] [CrossRef]
  160. Yang, S.; Blum, N.; Rahders, E.; Zhang, Z. The nature of invisible gold in sulfides from the Xiangxi Au-Sb-W ore deposit in North-western Hunan, People’s republic of China. Can. Mineral. 1998, 36, 136l–1372. [Google Scholar]
  161. Sung, Y.-H.; Brugger, J.; Ciobanu, C.L.; Pring, A.; Skinner, W.; Nugus, M. Invisible gold in arsenian pyrite and arsenopyrite from a multistage Archaean gold deposit: Sunrise Dam, Eastern Goldfields province, Western Australia. Miner. Depos. 2009, 44, 765–791. [Google Scholar] [CrossRef]
  162. Goldmann, S.; Junge, M.; Wirth, R.; Schreiber, A. Distribution of trace elements in sphalerite and arsenopyrite on the nano-metre scale — Discrete phases versus solid solution. Europ. J. Miner. 2019, 31, 325–333. [Google Scholar] [CrossRef] [Green Version]
  163. Belov, N.V.; Godovikov, A.A.; Bakakin, V.V. Ocherki po Teoreticheskoy Mineralogii (Essays on Theoretical Mineralogy); Publ. House Nauka: Moscow, Russia, 1982. (In Russian) [Google Scholar]
  164. Makovicky, E. Crystal structures of sulphides and other chalcogenides. Rev. Mineral. Geochem. 2006, 61, 7–125. [Google Scholar] [CrossRef]
  165. Rieder, M.; Crelling, J.C.; Šustai, O.; Drábek, M.; Weiss, Z.; Klementová, M. Arsenic in iron disulphides in a brown coal from the North Bohemian Basin, Czech Republic. Inter. J. Coal Geol. 2007, 71, 115–121. [Google Scholar] [CrossRef]
  166. Bindi, L.; Moelo, Y.; Léone, P.; Suchaud, M. Stoichiometric arsenopyrite, FeAsS, from La Roche–Balue Quarry, Loire–Atlantique, France: Crystal structure and Mössbauer study. Can. Mineral. 2012, 50, 471–479. [Google Scholar] [CrossRef]
  167. Lutz, H.D.; Jung, M.; Wäschenbach, G. Kristallstrukturen des Löllingits FeAs2 und des Pyrits RuTe2. Z. Anorg. Allg. Chem. 1987, 554, 87–91. [Google Scholar] [CrossRef]
  168. Slipukhina, I.V.; Bercha, D.M. Elementary energy bands in isovalent IV–VI orthorhombic and cubic crystals and their solid solutions. Phys. Status Solidi 2007, 244, 650–668. [Google Scholar] [CrossRef]
  169. Sidhu, S.S.; Heaton, L.; Mueller, M.H. Neutron diffraction techniques and their applications to some problems in physics. J. Appl. Phys. 1959, 30, 1323. [Google Scholar] [CrossRef]
  170. Kratz, T.; Fuess, H. Simultane Strukturbestimmung von Kupferkies und Bornit an einem Kristall. Z. Krist. 1989, 186, 167. [Google Scholar]
  171. Sowa, H. On the mechanism of the pressure–induced würtzite–to NaCl–type phase transition in CdS: An X–ray diffraction study. Solid State Sci. 2005, 7, 73–78. [Google Scholar] [CrossRef]
  172. Jamieson, J.C.; Demarest, H.H., Jr. A note on the compression of cubic ZnS. J. Phys. Chem. Solids 1980, 41, 963–964. [Google Scholar] [CrossRef]
  173. Kisi, E.H.; Elcombe, M.M. U parameters for the wurtzite structure of ZnS and ZnO using powder neutron diffraction. Acta Crystallogr. Sect. C Cryst. Struct. Commun. 1989, 45, 1867–1870. [Google Scholar] [CrossRef]
  174. Ishikawa, K.; Isonaga, T.; Wakita, S.; Suzuki, Y. Structure and electrical properties of Au2S. Solid State Ionics 1995, 79, 60–66. [Google Scholar] [CrossRef]
  175. Sadanaga, R.; Sueno, S. X–ray study on the α–β transition of Ag2S. Mineral. J. 1967, 5, 124–143. [Google Scholar] [CrossRef] [Green Version]
  176. Kjekshus, A.; Skansen, T.; Ehrenberg, L.; Brunvoll, J.; Bunnenberg, E.; Djerassi, C.; Records, R. On the homogeneity range of the PtS phase. Acta Chem. Scand. 1966, 20, 577–579. [Google Scholar] [CrossRef]
  177. Furuseth, S.; Selte, K.; Kjekshus, A.; Gronowitz, S.; Hoffman, R.A.; Westerdahl, A. Redetermined crystal structures of NiTe2, PdTe2, PtS2, PtSe2, and PtTe2. Acta Chem. Scand. 1965, 19, 257–258. [Google Scholar] [CrossRef]
  178. Brese, N.E.; Squattrito, P.J.; Ibers, J.A. Reinvestigation of the structure of PdS. Acta Crystallogr. Sect. C Cryst. Struct. Commun. 1985, 41, 1829–1830. [Google Scholar] [CrossRef]
  179. Grønvold, F.; Røst, E. The crystal structure of PdSe2 and PdS2. Acta Crystallogr. 1957, 10, 329–331. [Google Scholar] [CrossRef]
  180. Shannon, R.D. Revised effective ionic radii and systematic studies of interatomic distances in halides and chalcogenides. Acta Crystallogr. A 1976, 32, 751–767. [Google Scholar] [CrossRef]
Figure 1. Structural zones of the Urals and the position of Au- and Cu-bearing deposits (on the tectonic base of [61]). Ore deposits: 1 Novogodnee-Monto, 2 Pervopavlovsk, 3 Vorontsovka, 4 Berezovsk, 5 Bereznyakovsk, 6 Kochkar, 7 Svetlinsk, 8 Varvarinskoe, 9 Murtikty, 10 Chudnoe, 11 Uchaly, 12 Novo-Uchaly, 13 Uzelga, 14 Molodeznoe, 15 Aleksandrinskoe, 16 Sibai, 17 Bakr-Tau, Balta-Tau, Uvarjazh, Tash-Tau, 18 Maiskoe, 19 Yubileynoye, 20 Podolskoe, 21 Oktyabrskoe, 22 Gai, 23 Bl’ava, Komsomolskoe, Yaman-Kasy, 24 Dzhusa, 25 Barsytchiy Log, 26 Letnee, Osenee, Levobereznoe, 27 Vesenee, 28 Priorsk, 29 50-let Oktjabrja, 30 Kundizdi, 31 Degtyarsk, 32 Safyanovsk, 33 San-Donato, 34 Krasnogvardeysk, 35 Levikha, 36 Kaban, 37 Galka, 38 Valentorskoe, 39 Tur’a, 40 Tarnjer, 41 Volkovskoe, 42 Gumeshevskoe, 43 Tominskoe, Kalinovskoe, 44 Tarutinskoe, 45 Mikheevskoe, 46 Sokolovskoe, 47 Sarbai, 48 Benkala, 49 Yubileinoe (Au). Bold—deposits under consideration.
Minerals 11 00488 g001
Figure 4. Native gold in the Vorontsovka (af) and Berezovsk deposits (gk). (af) Inhomogeneous native gold in quartz veinlet (c—details of b, f—details of e). (g,h) Macroscopic native gold: (g) native gold 1.5 × 8 mm near the contact of quartz and beresite (Ber), (h) native gold 1–4 mm associated with aikinite in quartz-carbonate vein. (ik) Native gold in pyrite (i,j) and tennantite (k). Ccp—chalcopyrite, Tnt—tennantite, Gn—galena, Sp—sphalerite, Aik—aikinite, Qz—quartz. (b,c,e,f) BSE images, (d,e) details of (c).
Minerals 11 00488 g004
Figure 5. Carlin-style gold-bearing mineralisation, Vorontsovka gold deposit: (A) argillised volcaniclastic rock with “spots” and zonal veinlets: argillisite → quartz → carbonate → realgar, (B) carbonated layered volcano-sedimentary rock with thick impregnation of realgar (± orpiment), and disseminated pyrite, arsenopyrite and stibnite along layers. (C) Aggregate of small (less than 20 µm) needle-shaped crystals of arsenopyrite, (D) zonal pyrite crystals: pyrite without As admixture occurs in the central part, the next zone contains 1.8 wt% As. (E,F) Intergrowths of arsenopyrite of different composition and morphology in the gold-pyrite-realgar assemblage: (E) idiomorphic crystals of arsenopyrite and a felt-like aggregate of thin needle-like arsenopyrite and interstitial gold inclusions (Au), (F) aggregates of parallel elongated zonal crystals of As-rich arsenopyrite (Apy-2) overgrowing the prismatic crystal of the earlier S-rich arsenopyrite (Apy-1). (CF) BSE images.
Minerals 11 00488 g005
Figure 6. Arsenopyrite in skarnoid of the Vorontsovka deposit: (a) grain of Apy-1 from marble (skarnoid) with impregnation of arsenopyrite and sulphosalts in micro-veinlets, (b) LA-ICPMS profile; Co, Ni, Ag, Hg, Tl—not detected. Au is distributed zonally across the profile, as well as Sb and Te, but there is no correlation between the peaks of these element contents across the profile.
Minerals 11 00488 g006
Figure 7. Compositional zoning of the S-rich arsenopyrite Apy-1, EPMA. (a) Zonal structure of arsenopyrite with the outer rim of As-rich arsenopyrite with microinclusions of löllingite, BSE image. (b) Distribution of CAu (wt%) and S, Fe and As (at%) along the profile (A–B). CAu was measured by precision microprobe analysis with detection limit 45 ppm.
Minerals 11 00488 g007
Figure 8. Variations of Fe, As, S (at%) and Au (wt%) in Apy-2, EPMA. Left—BSE image with an indication of the profiles A–B and C–D used to measure the composition of arsenopyrite. Note that profile A–B starts in Apy-2, replaced the relict Au-poor Apy-1, and finished in Au-rich Apy-2.
Minerals 11 00488 g008
Figure 9. Pyrite from the gold-skarn ore of the Vorontsovka deposit. (a) A crystalline granular aggregate of pyrite of different generations (Py1 and Py2), and arsenopyrite crystallises in the intergranular space of these pyrite generations. (a, b) BSE images, Jeol JXA-8200. (b) An aggregate of zonal pyrite crystals: in bright zones, the As content is about 4 wt%. (c) Distribution of As and Au contents (EPMA, wt%) in pyrite; the dashed line is Au detection limit.
Minerals 11 00488 g009
Figure 14. Au and Ag minerals in quartz veins of the Svetlinsk deposit. Qz—quartz, Trd—tetrahedrite.
Minerals 11 00488 g014
Figure 15. Trace element distribution in pyrite of the Svetlinsk gold deposit according to LA-ICPMS analyses. (a) Correlation of Au, Ag and As contents in the disseminated (1) and vein (2) pyrite, (b) nonuniform Au distribution in the pyrite crystal according to ablation profile data: I—zone with uniform distribution, probably indicating the entry of Au into the pyrite structure, II—zone with inclusions of Au-Ag-Sb-Te phases and III—zone with gold content below the detection limit.
Minerals 11 00488 g015
Figure 16. Binary diagrams of the contents of Au, Ag, Te and As in pyrite of the Petropavlovsk gold-porphyry deposit according to LA-ICPMS analyses. Mineral assemblages in ores: 1—skarn-magnetite; 2—gold-sulphide; 3—gold-telluride; 4—quartz-carbonate. The dashed line counters the probable submicroscopic inclusions of altaite (CPb = 104–838 ppm) and petzite.
Minerals 11 00488 g016
Figure 20. Binary diagrams of the contents of Au, Ag, Te and As (ppm) in pyrite of the Novogodnee-Monto Fe-Au-skarn deposit according to the LA-ICPMS data. Mineral assemblages in the ores: 1—magnetite-pyrite, 2—polymetallic, 3—gold-sulphide-magnetite in skarns, 4—gold-sulphide and gold-telluride, 5—quartz-carbonate. The dashed counter shows probable inclusions of petzite and hessite.
Minerals 11 00488 g020
Figure 21. LA-ICPMS distribution map of impurity elements in pyrite grain from the polymetallic assemblage of the Novogodnee-Monto deposit (sample NM 46), scales in ppm.
Minerals 11 00488 g021
Figure 22. Solid Cu-Zn VMS ore with the late Au-polymetallic assamblege overprinted on the recrystallised early pyrite and native gold (Au) occurred in its interstices, the Novo-Uchaly lode, the Uchaly field: (a) Au + galena (Gn) + chalcopyrite (Ccp) + sphalerite (Sp), (b) Au + chalcopyrite + sphalerite.
Minerals 11 00488 g022
Figure 23. Binary diagrams of the contents of Au, Ag, Se, Te and As (ppm) in pyrite of the VMS deposits of the Urals according to the LA-ICPMS data.
Minerals 11 00488 g023
Figure 24. Binary diagrams of the contents of Au, Ag, Se, Te and As (ppm) in chalcopyrite of the VMS deposits of the Urals according to the LA-ICPMS data.
Minerals 11 00488 g024
Figure 25. Binary diagrams of the contents of Au, Ag, Se, Te and As (ppm) in sphalerite of the VMS deposits of the Urals according to the LA-ICPMS data.
Minerals 11 00488 g025
Figure 26. Gold and silver minerals in massive ore of the Novo-Uchaly lode. (a) Gold and galena inclusions in chalcopyrite, (b) Ag-bearing tetrahedrite and galena symplectites in pyrite.
Minerals 11 00488 g026
Figure 27. Dependence of the silver concentration on the arsenic and antimony contents in the fahlore and silver sulphosalts, the Novo-Uchaly lode.
Minerals 11 00488 g027
Figure 28. Gold in sulphide ores of the Berezovsk and VMS deposits of the Urals. (a) Gold occurrence forms in the ore, based on the results of step-by-step autoclave leaching of technological bulk probes; (b) gold fineness, microprobe data.
Minerals 11 00488 g028
Figure 29. Correlation between the portion of native gold and the gold content in the ores of the highly and weakly metamorphosed VMS deposits of the Urals.
Minerals 11 00488 g029
Figure 30. Composition range of native gold in massive sulphide ores of the Urals.
Minerals 11 00488 g030
Figure 31. Microphotos of the light-green synthetic sphalerite with admixture of In and Au. (a) Sample 2027, (b) sample 2032; see Table 24 for details. Figure 31, Figure 32, Figure 33 and Figure 40—photos prepared by Timofey Pashko.
Minerals 11 00488 g031
Figure 32. Microphotos of the yellowish sphalerite crystals with admixture of In and Au, synthesised at various f S2, see Table 25 for details. (a) Sample 2289, (b) sample 2290, (c) sample 2291, (d) sample 2292.
Minerals 11 00488 g032
Figure 33. Microphotos of the synthetic sphalerite crystals with admixtures of Ag and In, synthesised using the gas transport method (sample 4197). According to EPMA [108], CAg = 4.74 ± 0.82 wt%, CIn = 5.15 ± 0.46 wt%. However, according to (N. Trofimov, pers. com.), CAg(min) = 3.41 wt%; CAg(max) = 75.99 wt%, because of the capture of the tiny Ag2S inclusions in the analysis, and CIn(min) = 0.64 wt%, CIn(max) = 5.85 wt%.
Minerals 11 00488 g033
Figure 34. LA-ICPMS profile through sphalerite containing Fe, Mn, In, Cd, Se and Au. (a)—signals for Mn, Cd, In, S, Se; (b)—signals for Au, S. See Table 26 for details.
Minerals 11 00488 g034
Figure 35. LA-ICPMS profile through sphalerite containing Au and different additional impurities. Salt flux synthesis at 850/750 °C, see Table 27 for details.
Minerals 11 00488 g035
Figure 36. Graph showing the relation between the In and Au concentrations in the synthetic crystals of sphalerite. Numbers near the marks correspond to CAu, ppm. GVT (gas vapour transport)—gas transport method. Synthesis procedure is described in [90].
Minerals 11 00488 g036
Figure 37. Chemical composition (in mol. fraction AuS0.5) of sphalerite crystals doped in In and without admixture of In synthesised at various activity of sulphur f S2. Here, and in Figure 39, numbers near the marks show the concentration of Au in ppm. Red asterisks (*) indicate samples whose fugacity is conditionally shown as minimal in these systems.
Minerals 11 00488 g037
Figure 38. The internal structure of the synthesised crystals of sphalerite (polished sections). (a) Intergrowth of sphalerite (dark grey in BSE) with sulphospinel (light grey) with the approximate composition ZnIn2S4, (b) intergrowths of sphalerite with native gold, reflected light. There is also a LA-ICPMS pathway (width of the ablated zone is 60 μm) in the right corner of the image.
Minerals 11 00488 g038
Figure 39. Relation between the Fe and Au concentrations in the synthetic crystals of sphalerite. Crystals were synthesised at ~850 °C at the hot and ~750 °C at the cold end of the ampoule. Grey lines show the concentration of Fe (wt%, EPMA) for some samples.
Minerals 11 00488 g039
Figure 40. Microphotos of the synthetic sphalerite crystals with native gold dendrites, synthesised using the salt flux method (sample 1662).
Minerals 11 00488 g040
Figure 41. LA-ICPMS line mode spectra of the line ablated through the samples of CdS with admixtures of gold (a) sample 5457, indium and gold (b) sample 5459, iron and gold (c) sample 5458.
Minerals 11 00488 g041
Figure 42. Relationship of Au content with the main elements (Fe and As) in the studied arsenopyrite samples of the Vorontsovka Carlin-style deposit. Blue diamonds—arsenopyrite from skarn complex (Apy-1); green crosses indicate highly arsenic arsenopyrite of the gold-pyrite-realgar assemblage (Apy-2).
Minerals 11 00488 g042
Figure 43. Crystal structures of sulphides: (a) pyrrhotite, (b) marcasite, löllengite, arsenopyrite, (c) pyrite, (d) sphalerite, chalcopyrite, (e) greenockite, würtzite. Green balls are cations, yellow balls are anions. In the structure of arsenopyrite, half of the anions are S ions, and half are As ions. In the structure of chalcopyrite, half of the cations are Cu ions and half are Fe ions.
Minerals 11 00488 g043
Figure 44. Crystal structures of NM-sulphides: (a) anion-centered polyhedra in the structure of Au2S, (b) three-dimensional framework of Au-S bonds in the Au2S, (c) anion-centered polyhedra in the structure of Ag2S, (d) cation-centered polyhedra in the structure of Ag2S, (e) crystal structure of PtS, (f) crystal structure of PtS2, (g) crystal structure of PdS, (h) crystal structure of PdS2.
Minerals 11 00488 g044
Table 1. Main endogenous Au- and Cu-bearing deposits of the Urals.
Geodynamic
Environments
Ore Deposit TypeOre-Bearing Magmatic ComplexesMain Ore ElementsExamples of Ore Deposits
Oceanic spreading O1–2Co-Ni-sulphideUltramafic, tholeiite-basaltCo, Ni (As, Au)Ivanovka, Dergamysh
Island arc (O3-D1)primitiveCu VMS
(Dombarovsk)
Tholeiite-basaltCu (Zn, Co)Mauk, Letnee, Buribai, Koktau
Cu-Zn VMS (Uralian)Sodium rhyolite-basaltCu, Zn (Au)Gai, Safyanovka, Yubileynoe, Priorskoe
Sodium basalt-rhyoliteZn, Cu (Au, Ag, Se, Te)Uchaly, Novo-Uchaly, Sibai, Uzelga, Degtyarsk, Podolsk
Cu-barite-Cu-Zn VMS (Baimak)Potassium-sodium
andesite-dacite
Cu, Zn, Au, Ba (Pb, Ag)Bakr-Tau, Balta-Tau, Maiskoe, Tash-Tau, Uvarjazh, Galka
Cu-titanomagnetite-apatiteGabbro-noriteCu, Fe (Au, Pd, Pt, Ti, V, P)Volkovskoe
matureCu-porphyryAndesite-dioriteCuTominskoe
Au-porphyryPlagiograniteAu, CuYubileinoe (Au)
Au-epithermalAndesite-dioriteAu, Cu (Pb, Zn, Se, Te)Bereznyakovskoe
Cu-skarn (porphyry)Rhyolite-basalt,
gabbro-diorite
Cu, Fe (Au)Gumeshki
Au-polymetallicAndesite-daciteAu, Ag (Pb, Zn)Murtykty
Arc-continent collision and active margin of continent
(D3-C1)
Skarn-magnetiteSodium andesite-basalt, gabbro-dioriteFe (Cu, Au)Sokolovskoe, Sarbay
Potassium-sodium
andesite-basalt,
gabbro-diorite-granite
Fe (Cu, Co, Au)Vysokogorsk, Goroblagodat
Cu-magnetite skarnCu, Fe (Au, Co)Tur’insk group
Au-sulphide-realgarAu, Ag (Hg, Sb,Tl)Vorontsovka
Au-magnetite-skarnPotassium-sodium andesite-basalt, gabbro-dioriteFe, Au (Cu, Mo, Co, Ag)Novogodnee-Monto
Au-porphyryAu (Ag, Te, W)Petropavlovsk
Au-skarn (porhyry)Diorite-granodioriteAu, CuVarvarinskoe
Cu-porphyry (Mo)Cu (Mo, Au, Re)Mikheevskoe
Cu-porphyryCu (Mo, Au)Benkala
The main collision (C/P)Au-sulphide-quartzTonalite-granodioriteAu(Cu,Pb,Zn,Ag)Berezovsk
Au (As)Kochkar’
Au-tellurideGabbro-diabase,
plagiogranite
Au (Te, Ag)Svetlinsk
Bold—deposits under consideration.
Table 2. Characteristics of studied gold deposits.
Deposit, RegionSvetlinsk,
South Urals
Berezovsk,
Middle Urals
Vorontsovka,
North Urals
Petropavlovsk,
Polar Urals
Host rocksMetamorphosed volcaniclastic (D-C)Volcaniclastic (O-S), gabbro, serpentinite, graniteVolcaniclastic (S2-D1)Volcaniclastic (S2-D1)
Geochemical typeAu-TeAu, Ag (W, Bi)Au-As-Sb-Hg-TlAu (Ag, Te, Bi, W)
Ore bodiesVein-disseminated zones; veinsSuits of veins
usually occurred inside of dykes
Vein-disseminated zones; rare veinletsStockwork, vein-disseminated zones
Wall rock alterationQuartz-biotite (with amphibole), quartz ± biotite-sericiteBeresite, listvenitePropylitic, quartz-sericite,
argillic, jasperoid
Silicification, albitisation, chloritisation, sericitisation
Stage of mineral formationQuartz-pyrite→ Au-Te-polymetalic→ Quartz-carbonate-sulphideAnkerite-quartz → Pyrite-quartz → Polymetalic → CarbonateArsenopyrite-pyrite → Pyrite-realgar → Sulphosalt-
polymetalic → Polymetalic
Pyrite-magnetite → Pyrite (± chalcopyrite, sphalerite, pyrrhotite) → Gold–telluride → Quartz–carbonate
Au reserves (CAu)~135 t (1.8–2.8 g/t)490 t (2.4 g/t)~101 t (2.8 g/t)26 t (1.4 g/t)
Table 3. Arsenopyrite-bearing mineral assemblages of the Vorontsovka gold deposit.
Mineral Ore TypeOre Mineral Assemblaget, °CP, kbarlog f S2
Iimpregnated gold-polymetallicarsenopyrite-sulphosalts-
polymetallic
400–2700.6–0.2−7 to −9
IIfinely disseminated gold-pyrite-realgararsenic-löllingite-
arsenopyrite
370–2500.2–0.15−12 to −17
Table 4. Mineral assemblages and physicochemical parameters of mineral-forming fluids of the Petropavlovsk gold field.
Ore DepositMineral Assemblage (and Gold Mineralisation)Thom, °CSalt CompositionCsalt, wt%-eq. NaCl
Novogodnee-Monto Fe-Au-skarnChalcopyrite-pyrite-quartz, early stage430–300(Na, Mg)Cl10–12.9
Pyrite-chalcopyrite-quartz (with Au)315–270(Na, K)Cl4.5–12.2
Chalcopyrite-pyrite-magnetite (with Co and Au)230–215NaCl3.4–9.2
Pyrite-chalcopyrite-telluride (with Au)210–180NaCl10.5–13.9
Polysulphide-quartz-carbonate170–140(Na, K)Cl6.0–8.0
Petropavlovsk Au-porphyryChalcopyrite-pyrite-magnetite (with Au)250 *no data
Polysulphide-quartz (with Au)260–245no phase transitions were observed
Pyrite-chalcopyrite-telluride (with Au)200(Na, K)Cl11
Polysulphide-quartz-carbonate (with Au)160–150(Na, K)Cl14
* Co geothermometer (coexisting pyrite and chalcopyrite).
Table 5. Characteristics of the studied VMS deposits.
Deposit, RegionGaiUchaly, Novo-UchalyUzelgaGalka,
North Urals
South Urals
Host rocksBimodal-mafic (with minor chert)Bimodal-felsic (with minor chert)Bimodal-felsic (with minor chert, limestone, andesite and dacite)Bimodal-felsic (with minor andesite and dacite)
Geological ageEmsianMid-EifelianLate Eifelian–Early GivetianLate Ordovician–Early Llandoverian
Geochemical typeZn-Cu (Au, Ag)Cu-Zn (Au, Ag)Cu-Zn (Au, Ag)Zn-(Cu-Pb-Ag-Au)
Metamorphic grade
(t, °C)
Greenschist, 250–450Prehnite-pumpellyite, 150–350 (locally up to 400)Prehnite-pumpellyite, 180–350 (locally up to 450)Zeolite, 100–200
Dominant ore-host structuresSteeply dipping to vertical, pseudomonoclinal shear-related structuresSteeply dipping to vertical; limb of large anticlinal foldGentle doms and trenchsGentle doms and trenchs
Ore bodiesPlatelike, podiformLensoid, antiformLensoidStockwork, vein-disseminated zones; (minor lensoid)
Wall rock alterationAlbitisation, silicification, chloritisation, sericitisation (±pyrophyllite)Silicification, sericitisation, albitisation, chloritisationSilicification, sericitisation, carbonation, albitisation, chloritisationArgillic, silicification, sericitisation
Ore reserves450 Mt *230.4 (116 + 114.4) Mt *80.7 Mt *4.3 Mt
Cu + Pb + Zn, wt%2.24.3 (4.8 and 3.6)4.23.3
Au reserves520 t *344 (180 + 164) t *136.6 t *6 t
CAu, g/t1.21.51.71.35
Ag reserves6,300 t *4,381 t *2,495 t *200 t
CAg, g/t14193146.5
* including past production.
Table 6. Mineral forms of Au and Ag in the large gold deposits of the Urals, modified after [93].
VorontsovkaBerezovskSvetlinskPetropavlovsk
Hessite Ag2Te, native gold, küstelite, Ag-tetrahedrite, freibergite (Ag,Cu)12Sb4S13Native silver, native gold, freibergite (Ag,Cu)12Sb4S13, matildite AgBiS2, hessite Ag2Te, acanthite Ag2SNative gold, calaverite AuTe2, aurostibite AuSb2, montbrayite (Au,Sb)2Te3, krennerite (Au,Ag)Te2, sylvanite AuAgTe4, petzite Ag3AuTe2, volynskite AgBiTe2, maldonite Au2Bi, hessite Ag2Te, γ-hessite Ag1.9Te, acanthite Ag2SNative gold, hessite Ag2Te, petzite Ag3AuTe2, calaverite AuTe2, sylvanite AuAgTe4
Table 7. Contents of trace elements in pyrite (ppm) of different assemblages of the Petropavlovsk gold-porphyry deposit according to LA-ICPMS data.
nConcentrationCoNiAsSeAgAuSnTeBi
Pyrite-1 (skarn-magnetite assemblage)
25min3.48181.60.030.020.030.030.03
max17,141373819444216130.4663
geom. mean2505255150.30.20.1480.4
Pyrite-2 (gold-sulphide assemblage)
15min24.51121420.03650.03
max753721126105800.4650116
geom. mean1810401147180.11200.34
Pyrite-3 (gold-telluride assemblage)
70min0.20.029.63.20.020.030.020.020.03
max223437917048223111664.41375
geom. mean171256131.30.60.160.5
Pyrite-4 (quartz-carbonate assemblage)
30min0.07351.40.020.020.020.020.02
max73770417404.21.71.6282.3
geom. mean272137140.50.30.340.3
n—number of analysis points.
Table 8. Occurrence forms of main and trace elements and their mineral inclusions in pyrite of different assemblages at the Petropavlovsk gold-porphyry deposit.
MineralMain Trace ElementsMinor Elements (<50 ppm)Mineral Inclusions
CommonRareSubmicroscopic *
Py-1Cu, Co, As, Ni, Zn, TeSn, Bi, Se, Ag, Au, PbSp, MtHem, Rt
Py-2Pb, Te, Bi, Au, Co, Zn, As, AgSe, Ni, Sn, CuCcp, SpMt, PoAu
Py-3Ni, As, Zn, Se, Ag, Sn, Cu, Au, Te, PbBiCcp, Gn, Hs, Pz, Alt, Cal, Syl, Au, SpPoKs, Cal, Pz, Hs
Py-4Co, NiSe, Ag, Au, Sn, Te, Bi, Zn, Pb, CuCcp
* Here and in Tables 11, 13, 15 and 17 minerals are indicated as probable forms of concentration of a group of chemical elements in submicroscopic and nano-scale inclusions, assumed by their co-occurrence of “synchronous” peaks of impurity elements in host base metal sulphide. Mineral abbreviations (italics) here and in Tables 11, 13, 15 and 17: Ccp—chalcopyrite, Sp—sphalerite, Mt—magnetite, Gn—galena, Hs—hessite, Pz—petzite, Cal—calaverite, Syl—sylvanite, Au—native gold, electrum, Hem—hematite, Po—pyrrhotite, Rt—rutile, Alt—altaite, Ks—küstelite, Fhl—fahlore, Cbt—cobaltite, Em—empressite.
Table 9. Average concentration of Au, Ag and Te (ppm) in the zones of the pyrite grain.
Chemical ElementZones
12345
197Au0.520.062.70.031
107Ag2.50.68.61.142.4
124Te0.880.70.230.190.3
Note: Peak concentrations are excluded from calculation of average values.
Table 10. The limits and average values of the contents of trace elements (ppm) in chalcopyrite of different assemblages of the Petropavlovsk gold-porphyry deposit according to LA-ICPMS data.
nConcentrationCoNiAsSeAgAuSnTeBi
Chalcopyrite-1 (gold-sulphide assemblage)
2min0.020.034140.70.010.070.026
max14327280194632.54688
geom. mean0.415304370.310.87
Chalcopyrite-2 (gold-telluride assemblage)
21min0.080.032628870618700.05
max0.145744327600251.8420011
geom. mean0.111.333.830257112.31.419120.3
Table 11. Occurrence forms of main and trace elements and their mineral inclusions in chalcopyrite of different assemblages of the Petropavlovsk gold-porphyry deposit.
MineralMain trace ElementsMinor Elements (<50 ppm)Mineral Inclusions
MainRareSubmicroscopic
Ccp-1Co, Ni, As, Se, Sn, Ag, TeBi, AuSp, Py Cbt, Fhl
Ccp-2Ag, Au, Te, Bi NiAs, Se, SnSpHs, AuAlt, Pz, Au, Hs, Cal
Table 12. The limits and average values of the contents of trace elements in galena (ppm) of different assemblages of the Petropavlovsk gold-porphyry deposit according to LA-ICPMS data.
nConcentrationCoNiAsSeAgAuSnTeBi
37Galena-1 (gold-sulphide assemblage)
min0.020.020.81.20.70.090.030.030.01
max1060670934074250.87302.7
geom. mean0.63101970.60.311.40.2
6Galena-2 (gold-telluride assemblage)
min0.133.12.52.423130.13560.01
max1030252735820509800.4177062
geom. mean200703116263740.22521
Table 13. Occurrence forms of main and trace elements and their mineral inclusions in galena of different assemblages of the Petropavlovsk gold-porphyry deposit.
MineralMain Trace ElementsMinor Elements (<50 ppm)Mineral Inclusions
CommonRareSubmicroscopic
Gn-1Co, Ni, As, Se, Sn, TeAg, Au, BiSp, Py, Ccp Hs, Em
Gn-2Ag, Au, Te, Bi, Co, Ni, As, SeSnAltPz, Au, Hs
Table 14. The trace element contents (ppm) in pyrite of different assemblages of the Novogodnee-Monto deposit according to LA-ICPMS data.
nConcentrationCoNiAsSbAgAuSnTeBi
Pyrite-1 (magnetite-pyrite assemblage)
14min1443.360.060.020.050.080.020.02
max353077411,0501564120.3894.5
geom. mean19383416250.70.80.60.270.15
Pyrite-2 (polymetallic assemblage)
12min0.80.020.60.050.160.040.091.30.02
max9222528760141.30.4335
geom. mean288797351360.440.2110.8
Pyrite-3 (gold-sulphide-magnetite assemblage in skarns)
7min145530.050.20.160.130.50.03
max5921841680.321.20.3120.6
geom. mean9011700.20.60.40.23.50.1
Pyrite-4 (gold-sulphide and gold-telluride assemblage)
5min14611600.080.040.30.12260.03
max7074164550.6515920.314115
geom. mean378571420.240.60.23500.51
Pyrite-5 (quartz-carbonate assemblage)
7min0.80.30.60.020.030.070.21.20.02
max9202513830982.30.60.36390.8
geom. mean177142840.40.30.30.27.70.1
Table 15. Occurrence forms of main and trace elements and their mineral inclusions in pyrite of different assemblages at the Novogodnee-Monto deposit.
MineralMain Trace Elements *Minor Elements (<50 ppm)Minerals Inclusions
Maximum, ppmHigh Values, ppmMainRareSubmicroscopic
Py-1Co, Ni, As, Au, Zn, CuAg, TeSb, Sn, BiMt, CcpCbtCbt, As
Py-2Sb, SnCo, As, CuNi, Ag, Au, Te, Bi, ZnCcp, Sp, GnHem, Cbt, Apy, Po
Py-3 Co, AsNi, Sb, Sn, Au, Ag, Te, Bi, Cu, ZnCcpCbt, Ag
Py-4Ag, Te, BiCo, Ni, As, CuAu, Sb, Sn, ZnPt, Hs, AltAu, AgPz, Clc, Gt, Ccp, Dg
Py-5SbCo, Ni, As, CuAg, Au, Sn, Te, Bi, ZnBn, Cv, Clc, Gt, Dg, Cu
Designation here and in Table 17: Apy—arsenopyrite, Ag—native silver, Bn—bornite, Cv—covellite, Clc—chalcocite, Gt—goethite, Dg—digenite.
Table 16. The trace element contents (ppm) in chalcopyrite of different assemblages of the Novogodnee-Monto deposit according to LA-ICPMS data.
nConcentrationCoNiAsSbAgAuSnTeBi
22Chalcopyrite-1 (polymetallic assemblage)
min0.020.022.80.040.20.020.060.070.02
max8878.832303788132.149.10.4
geom. mean1.30.31730.82.340.220.150.50.04
Chalcopyrite-2 (gold-sulphide-magnetite assemblage in skarns)
4min0.020.10.90.030.030.060.25.71.03
max505.7233.511.310.6153
geom. mean1.3250.751.70.40.491.8
Table 17. Occurrence forms of main and trace elements and their mineral inclusions in chalcopyrite of different assemblages at the Novogodnee-Monto deposit.
MineralMain Trace ElementsMinor Elements (<50 ppm)Mineral Inclusions
Maximum, ppmHigh Values, ppmMainRareSubmicroscopic
Ccp-1Co, Ni, As, Sb, Ag, Au, Sn Te, BiPo, Sp, Gn Cal, Alt, Au,
Hs, Pz
Ccp-2Te, BiCoNi, As, Sb,
Ag, Au, Sn
Au
Table 18. Mineral forms of Au and Ag in the largest VMS deposits of the Urals, modified after [93].
Highly MetamorphosedWeakly MetamorphosedNon-Metamorphosed
GaiUchalyUzelgaGalka
Hessite Ag2Te, native gold
(710–980), native silver (100–0), calaverite AuTe2, sylvanite AuAgTe4, krennerite (Au,Ag)Te2, petzite Ag3AuTe2, montbrayite (Au,Sb)2Te3, muthmannite AuAgTe2, acanthite Ag2S, Ag-betekhtenite (Ag,Cu,Fe)21Pb2S15
Hessite Ag2Te, empressite AgTe, electrum (340–690), freibergite Ag12Sb4S13, petrovskaite AuAg(S,Se), acanthite Ag2S, pearceite [Ag9CuS4][(Ag,Cu)6(As,Sb)2S7],
polybasite [(Ag,Cu)6(Sb,As)2S7][Ag9CuS4], ytenbogaardtite AuAg3S2
Hessite Ag2Te, stützite Ag5Te3, native gold (770–870), native silver, acanthite Ag2S, sylvanite AuAgTe4, petzite Ag3AuTe2Native gold (700–1000), electrum (250–700), acanthite Ag2S, freibergite Ag12Sb4S13, argentotetrahedrite, pyrargyrite Ag3SbS3, stephanite Ag5SbS4, proustite Ag3AsS3, polybasite [(Ag,Cu)6(Sb,As)2S7][Ag9CuS4], petrovskaite AuAg(S,Se), ytenbogaardtite AuAg3S2, kurilite Ag8Te3Se
Table 19. Contents of Au, Ag and some impurities in pyrite of VMS deposits according to LA-ICP-MS data (ppm).
DepositnCiAuAgSeTeAs
Gai17min1.43.8 (8)711 (8)25
max3147.52671151901
geom. mean3.886124226
k (Au) 0.27−0.050.20.64
Uzelga67min0.010.32 (66)1 (19)0.2 (66)
max202046571975599
geom. mean0.5158322114
k (Au) 0.570.020.96−0.13
Galka27min0.012.20.5 (13)0.8 (10)14 (26)
max99343239215,486
geom. mean1.2573.519450
k (Au) 0.170.490.230.13
Uchaly79min0.010.0133 (42)34
max29326180025005370
geom. mean1.61354541311
k (Au) 0.67−0.26−0.110.3
Here and in Table 21 and Table 22, the number of values below the detection limit is shown in parentheses; k (Au)—pair correlation coefficient; n—number of analysis points.
Table 20. Summary data on contents of Au and Ag in ore minerals of VMS deposits according to LA-ICP-MS analysis.
DepositnMineralsAu, ppmAg, ppm
MinMaxgeom. meanMinMaxgeom. mean
Gai17pyrite1.4313.83.847.58
11chalcopyrite0.011.20.060.19181.2
4sphalerite0.010.030.0162.45.53.2
10bornite0.010.990.045.31250223
16fahlore0.011.40.05132432285
Uzelga67pyrite0.01200.50.320415
17chalcopyrite0.01190.20.35117.4
14sphalerite0.01110.41.320721.5
Galka27pyrite0.0191.22.293457
4chalcopyrite1.23.71.93212776
21sphalerite0.01320.641.216751
5marcasite0.0250.676022
1galena0.05153
Uchaly79pyrite0.01291.60.0132613
3chalcopyrite1630.040.150.07
Table 21. Contents of Au, Ag and some impurities in chalcopyrite of VMS deposits according to LA-ICP-MS data (ppm).
DepositnCiAuAgSeTeAs
Gai11min0.010.190.01 (10)0.01 (10)6
max1.21816722.05312
geom. mean0.061.2190.0215
k (Au) 0.960.70.97−0.05
Uzelga17min0.010.3390.01 (14)9 (7)
max195117143141530
geom. mean0.27.42174.7109
k (Au) 0.87−0.520.9−0.48
Galka4min1.232-0.01556
max3.7127-3264058
geom. mean1.976-51615
Uchaly3min10.047214
max60.1573445
geom. mean30.07252.922
Dash—no data.
Table 22. Contents of Au, Ag and some impurities in sphalerite of VMS deposits according to LA-ICP-MS data (ppm).
DepositnCiAuAgSeTeAs
Gai4min0.012.40.010.012
max0.035.52.30.033.6
geom. mean0.0163.20.40.192.8
Uzelga14min0.011.30.011.1 (9)2.8 (8)
max1120747013671195
geom. mean0.421.5134781
k (Au) 0.80.10.990.7
Galka21min0.011.20.3 (22)0.4 (15)1.2 (20)
max32167942585426
geom. mean0.64511115139
k (Au) 0.89−0.60.380.1
Table 23. Contents of PGE in ore minerals of VMS deposits, LA-ICP-MS data, ppm.
DepositMineralsPtPdRhRuOsIr
Gaifahlore--12.60.0620.0050.01–0.07
sphalerite0.016-----
Uchalypyrite-0.03–0.20.04–0.26---
Table 24. Concentration of In (CIn) and Au (CAu) in the crystals grown at 850 °C using gas transport method and NH4Cl as a transport agent (LA-ICPMS data, ppm ± 2σ).
Sample20272032
CIn86 ± 55400 ± 200
CAu5 ± 384 ± 10
Table 25. Concentration of In and Au according to LA-ICPMS data (ppm ± 2σ) in the crystals grown using the gas transport method with various fugacity of sulphur at 850 °C.
Samples2289229022912292
CIn64 ± 141913 ± 1136914 ± 2127012 ± 201
CAu6 ± 13314 ± 1125142 ± 2246033 ± 511
f S2, bar0.1 10.232.268.72
1 Sulphur fugacity of this sample is conditionally calculated as minimal in this system.
Table 26. Chemical composition of ZnS sample 1450 (EPMA) synthesised at 850 °C using the gas transport method with I2 as a transport agent.
FeS, mol%wt% ± 2σ
ZnSFeMnCdSeInAuTotal
2.8063.95 ± 0.5133.73 ± 0.321.62 ± 0.130.24 ± 0.050.48 ± 0.110.13 ± 0.070.32 ± 0.030.30 ± 0.05100.77
Table 27. Concentration of Au in the samples of synthetic sphalerite doped by different admixtures, grown using the salt flux method (in eutectic melts of NaCl/KCl) at 850 °C.
Sample (color 1)FeS,
mol.%
EPMA, wt% ± 2σTotalFormulaLA-ICPMS, wt% ± 2σ
ZnSFeMnCdSeInAu
1660
(blue)
3.7064.15
(0.50)
33.72
(0.11)
2.15
(0.07)
0.12
(0.02)
0.50
(0.04)
0.25
(0.03)
0.17
(0.02)
0.20
(0.01)
101.26Zn0.94Fe0.04S1.010.1892
(0.0112)
1661
(grey)
3.2465.08
(0.43)
33.82
(0.49)
1.89
(0.06)
---0.22
(0.03)
0.20
(0.01)
101.21Zn0.95Fe0.03S1.010.2092
(0.0082)
1662
(black)
1.6764.77
(1.61)
33.37
(0.85)
0.96
(0.01)
-----99.66Zn0.96Fe0.02
Cu0.02S1.01
0.0077
(0.0046)
1663
(green)
4.2064.17
(0.89)
33.51
(0.39)
2.44
(0.08)
0.50
(0.10)
----100.62Zn0.94Fe0.04S1.010.0094
(0.0012)
1665 2
(red)
4.3363.29
(1.45)
33.33
(0.71)
2.48
(0.22)
-----99.10Zn0.94Fe0.04S1.010.0096
(0.0046)
1666
(yellow)
-67.09
(0.64)
33.19
(0.23)
---0.94
(0.06)
--101.22Zn0.99SSe0.010.0014
(0.0007)
1 Colour on graph (Figure 35); 2 Synthesis with adding a few mg of additional sulphur in the ampoule.
Table 28. Chemical composition of greenockite crystals with admixtures of Fe, In and Au, synthesised using the gas transport method at 850 °C.
SampleEPMA, wt% (±2σ)LA-ICPMS
Au, wt% (±2σ)
CdSFeInAuTotal
545778.18
(0.07)
22.23
(0.17)
--bdl100.41
(0.24)
0.0015 (±0.0005)
545874.78
(0.22)
22.84
(0.29)
2.84
(0.04)
-bdl100.46
(0.55)
0.0410 (±0.0005)
545977.76
(0.62)
22.27
(0.23)
-0.73
(0.03)
bdl100.77
(0.88)
0.0311 (±0.0020)
bdl—below the detection limit.
Table 29. Crystal chemical parameters of the main sulphides.
MineralFormulaSpace GroupLattice Constants (Å)Structure TypeMe-Me
Distance
Me-S
Distance
CNMeCPMeRef
PyriteFeS2Pa-3a = 5.416NaCl3.8302.2636Octahedron[165]
MarcasiteFeS2Pnnma = 4.445
b = 5.425
c = 3.386
Rutile3.3862 × 2.239
4 × 2.252
6Octahedron[165]
ArsenopyriteFeAsSP21/ca = 5.761
b = 5.684
c = 5.767
β = 111.7210°
Rutile2.734S: 2.229, 2.230, 2.233
As: 2.370, 2.409, 2.412
6Octahedron[166]
LollengiteFeAs2Pnnma = 5.300
b = 5.984
c = 2.882
Rutile2.8822 × 2.361
4 × 2.388
6Octahedron[167]
GalenaPbSFm-3ma = 5.805NaCl4.1052.9036Octahedron[168]
PyrrhotiteFenSn+1P63/mmca = 3.446
c = 5.743
NiAs2.8712.4536Octahedron[169]
ChalcopyriteCuFeS2I-42da = 5.277
c = 10.441
ZnS3.712Cu: 2.295
Fe: 2.259
4Tetrahedron[170]
GreenockiteCdSP63mca = b = 4.136
c = 6.716
ZnO4.1213 × 2.527
1 × 2.532
4Tetrahedron[171]
SphaleriteZnSF-43ma = b = c = 5.410ZnS3.8262.3434Tetrahedron[172]
WürtziteZnSP63mca = b = 3.823
c = 6.261
ZnO3.8233 × 2.342
1 × 2.347
4Tetrahedron[173]
Table 30. Coordination number and type of hybridisation of some metals.
CNType of HybridisationElements
2sp; p2Cu+, Cu2+, Ag+, Au+
4tetrsp3Cu+, Ag+, Au+, Zn2+, Fe2+
4sqdsp2Pd2+, Pt2+, Cu2+, Fe3+
6d2sp3Pt4+, Fe2+
Table 31. Crystal chemical parameters of some noble metal sulphides.
MineralFormulaSpace GroupLattice Constants (Å)Structure TypeMe-Me DistanceMe-S DistanceCNMeCPMeRef
n/aAu2SPn-3m5.0206Cu2O3.5502.1742Dumbbell[174]
Acanthiteα-Ag2SP121/c1a = 4.231
b = 6.930
c = 8.293
β = 110.71°
Ag2S3.084AgI: 2.475, 2.511
AgII: 2.547, 2.563, 2.699
AgI: 2
AgII: 3
AgI: dumbbell
AgII: coplanar triangle
[175]
CooperitePtSP42/mmca = 3.4701
c = 6.1092
PtS3.4702.3114Square[176]
n/aPtS2P-3m1a = 3.5432
c = 5.0388
CdI23.5432.4216Octahedron[177]
n/aPdSP42/ma = 6.429
c = 6.611
PdSPdI-PdI: 3.305
PdII-PdIII: 3.389
PdIII-PdIII: 2.337
PdI: 2.341
PdII: 2.318
PdIII: 2 × 2.337,
2.346
4Square[178]
n/aPdS2Pbcaa = 5.460
b = 5.541
c = 7.531
PdSe23.889PdI: 2 × 2.298,
2 × 2.304, 2 × 3.312
6Octahedron[179]
Publisher’s Note: MDPI stays neutral with regard to jurisdictional claims in published maps and institutional affiliations.