
Recovery of Iron from Mill Scale by Reduction with Carbon Monoxide


1
Department of Production Engineering, Faculty of Materials Engineering, Silesian University of Technology, Akademicka 2A Street, 44-100 Gliwice, Poland
2
Department of Metallurgy and Recycling, Faculty of Materials Engineering, Silesian University of Technology, Akademicka 2A Street, 44-100 Gliwice, Poland
*
Author to whom correspondence should be addressed.
Minerals 2021, 11(5), 529; https://0-doi-org.brum.beds.ac.uk/10.3390/min11050529
Submission received: 22 April 2021
/
Revised: 10 May 2021
/
Accepted: 15 May 2021
/
Published: 17 May 2021
(This article belongs to the Special Issue Valorization of Metallurgical and Mining Residues and Wastes)
Abstract
:The mill scale is a waste from the iron and steel industry. Due to the high content of iron in the form of oxides, it is an attractive material for the recovery of metallic iron by reduction. The product of mill scale reduction is an iron with a very extended surface and a high affinity for oxygen. The smaller iron particles are, the easier it is for spontaneous rapid oxidation, which can be linked to pyrophoricity. This article presents results of experiments using the TG/DTA thermal analysis method aimed at verifying the possibility of recovering iron from the mill scale by a reduction with carbon monoxide at 850 °C, 950 °C, and 1050 °C, taking into account the phenomenon of secondary oxidation in contact with oxygen from air at temperatures of 300 °C, 350 °C, and 400 °C. Two forms of mill scale were used for tests, in the original state and after grinding to develop the surface.
1. Introduction
Protection of the natural environment is one of the biggest challenges for human civilization. Constantly growing demand for construction materials causes an increase in the amount of industrial waste. In the European Union, the concept of waste is defined in Directive 2008/98/EC [1]. The term “waste” is defined as any substance or object which the owner disposes of, intends to dispose of, or is obliged to dispose of. The waste owner is obliged, in the first place, to prevent the generation of waste, and then prepare for the re-use of waste, production of which could not be prevented. Reducing waste generation together with waste disposal is the basic principle of rational use of natural and anthropogenic resources.
One industrial branch that generates large amounts of waste is metallurgy, especially iron and steel metallurgy, which is the largest producer of semi-finished and finished products [2,3]. As a result of enormous metallurgical production, significant amounts of waste are generated, such as blast furnace and converter slag, various types of dust and sludge, scale, and gases [4,5,6,7,8,9]. Many metallurgical wastes contain a large amount of iron and can be subjected to the processes of this element’s recovery. Wastes containing less iron or impurities go to other recycling processes or are landfilled.
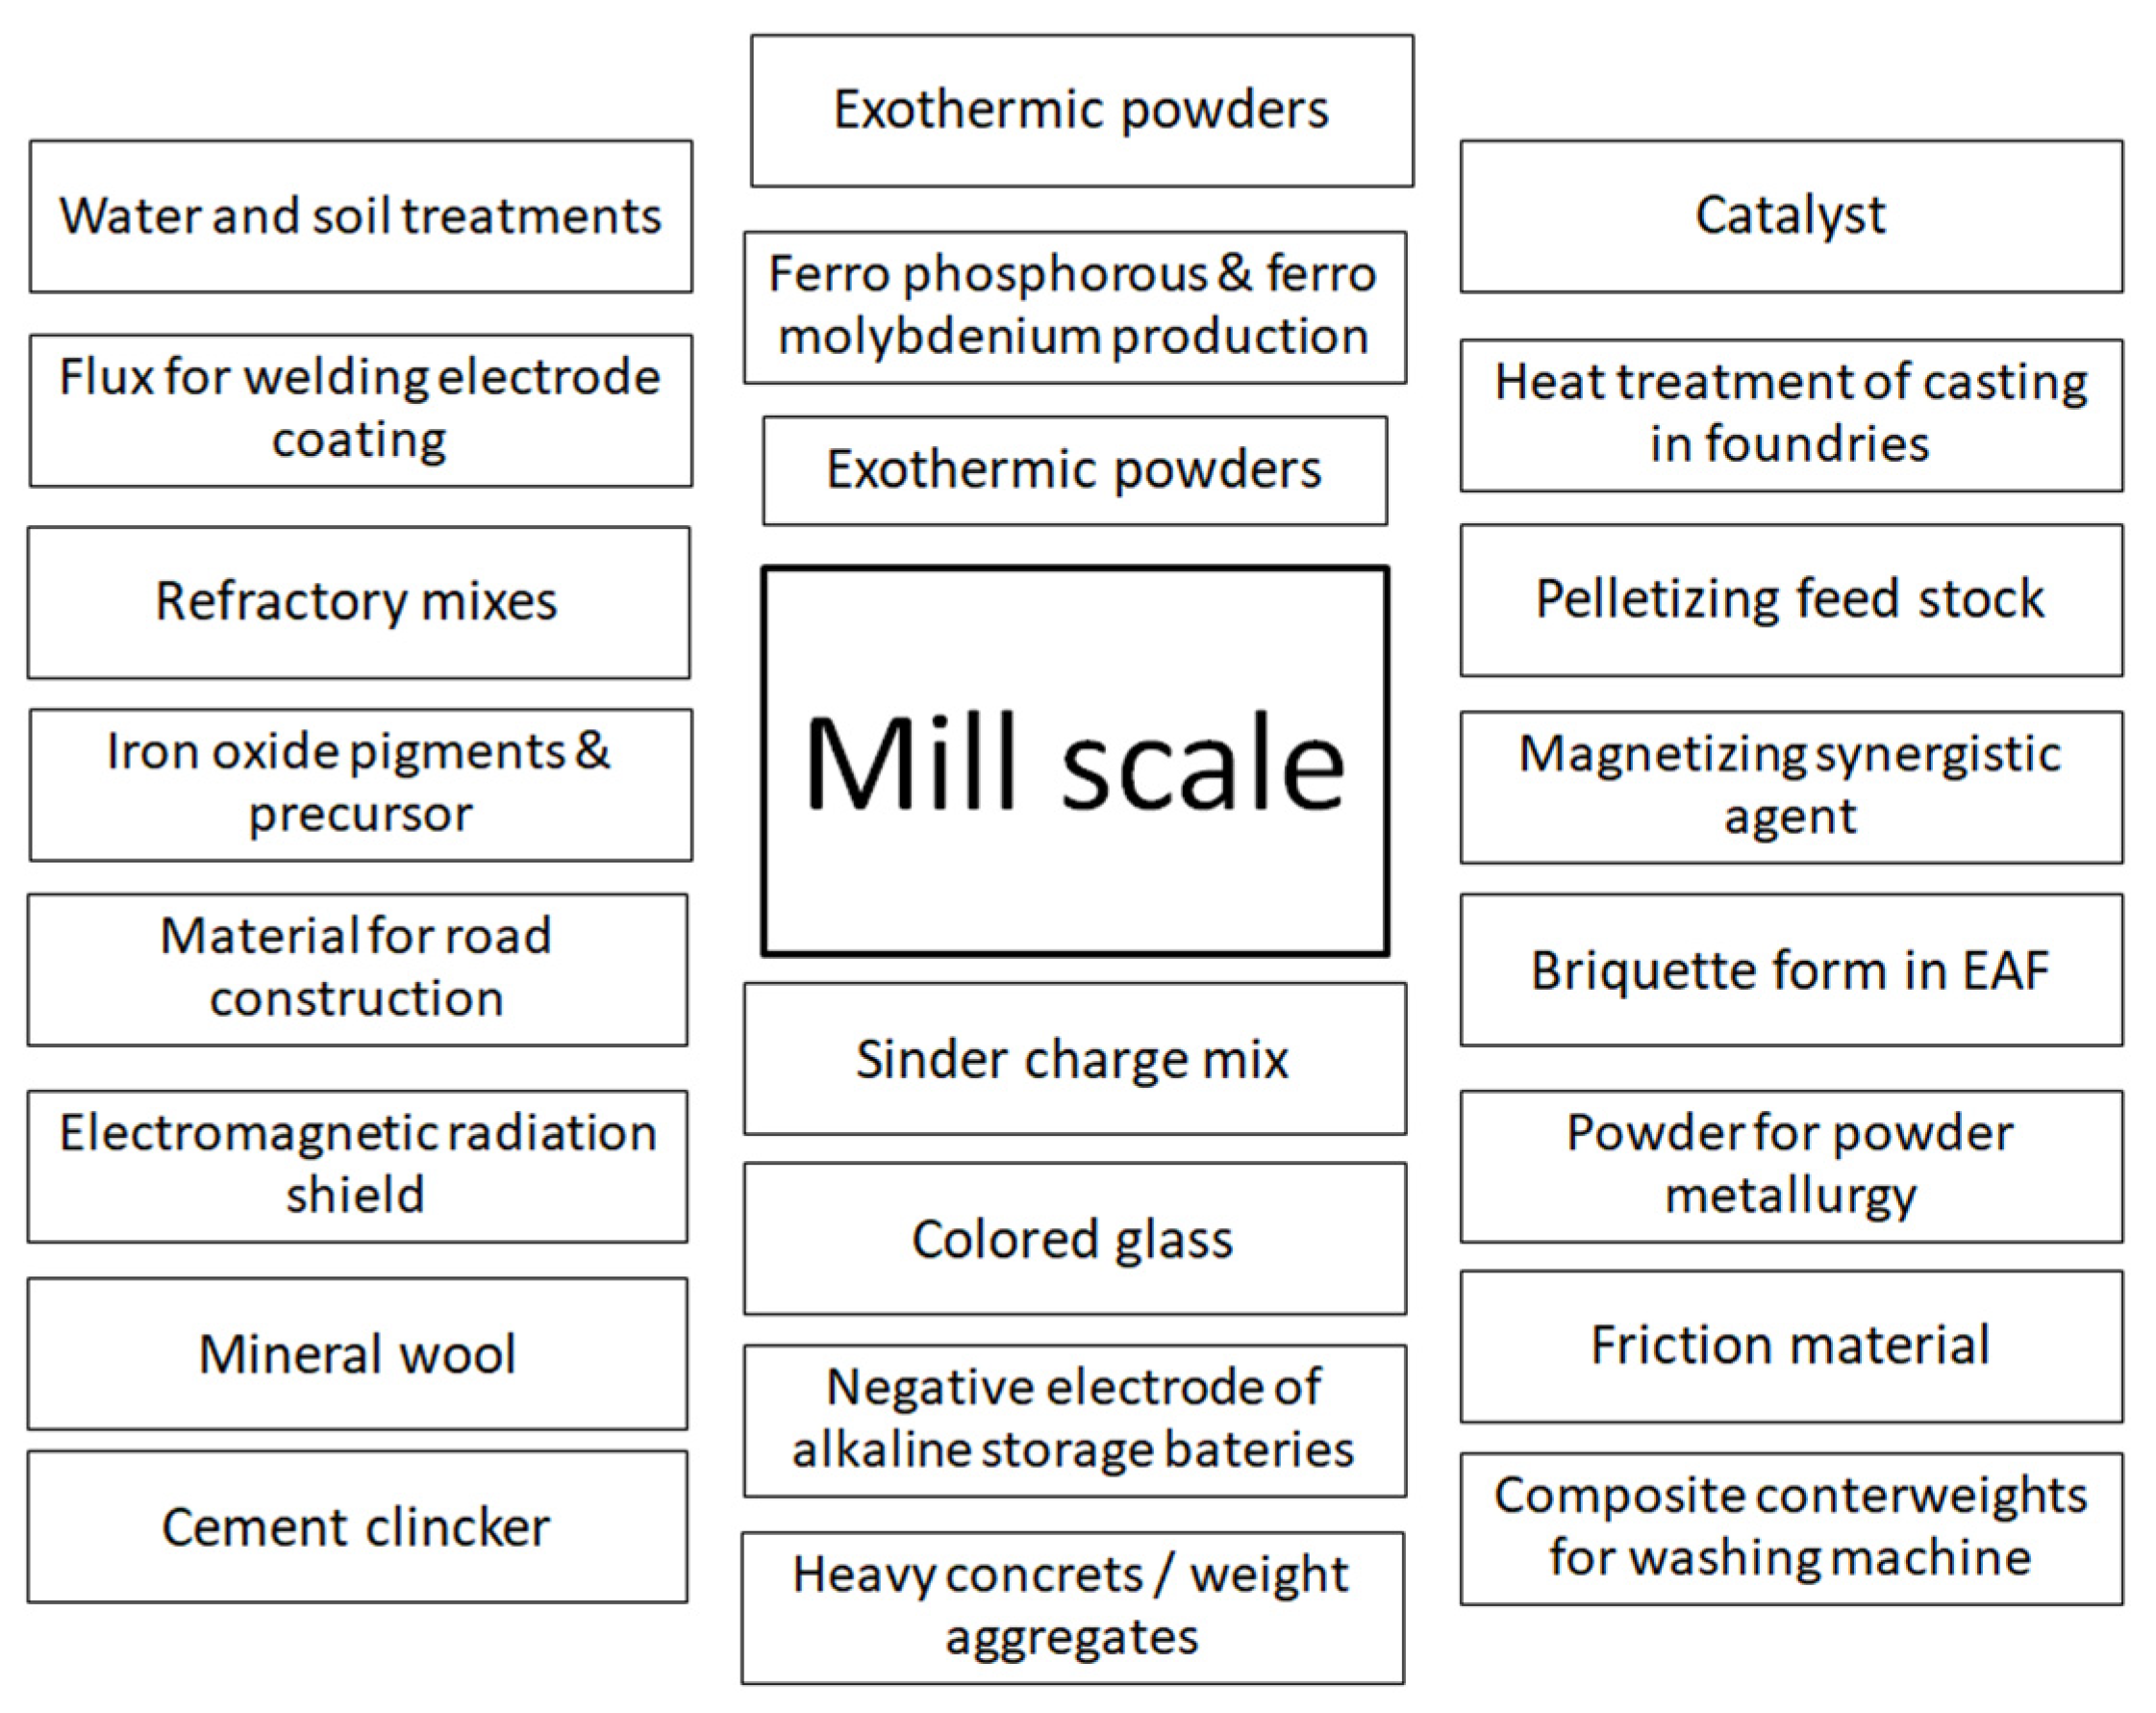
This paper presents research related to the reduction of mill scale. Oxidation and formation of scale is an inevitable phenomenon during the hot rolling process of steel [8]. Mill scale harms the surface quality of steel products and mill rolls durability. Moreover, its formation causes material loss, which, depending on the used rolling technique, ranges from 1% to 3% [9,10]. Structurally, the rolling scale is a layered and brittle material consisting of iron oxides (wustite—FeO, magnetite—Fe3O4, hematite—Fe2O3), with the predominant phase in the form of wustite. It comes as a powder composed of small particles, flakes, and chips. In addition to iron compounds, the mill scale may also contain C, Si, Ca, Ni, Al, Mn, S, P, and other metal oxides [10,11]. It is related to the type of production in the steelworks. Mill scale is generally free from hazardous, flammable, radioactive, or explosive substances. The permissible limit for oil content in the mill scale is less than 1%. As a waste, the mill scale is used in several ways (Figure 1). Some of these applications are widely used, others are still being developed [12,13,14,15,16,17,18].
The problem of the management of metallurgical waste, including mill scale, is now an important issue in Poland. For this reason, a project was undertaken to develop a method of managing the oily rolling scale with the simultaneous use of gases generated during the pyrolysis of polymers, e.g., carbon monoxide. Due to the high iron content (68–72%) and the need to use thermal methods in the case of oily mill scale, it was decided to investigate the direct reduction of scale using CO. The main aim of the research was to check the possibility of iron recovery and to investigate the susceptibility to re-oxidation of reduced Fe and FeO in contact with air. Iron resulting from the reduction of rolling scale has a porous structure, as does the sponge iron directly reduced from the ores in the metallurgical process (DRI), with a specific surface area that is typically around 1 m²/g [20,21]. This is because reduction reaction with CO takes place in a solid-state, hence the shape of mill scale pieces is maintained, and their mass is reduced due to the removal of oxygen. Consequently, reduced iron has a large surface area in relation to its mass, which increases its reactivity. Works devoted to the direct reduction of rolling scale, either with carbon monoxide, hydrogen or solid substances (coal, coke), do not describe the problem of low-temperature oxidation [6,18,22,23,24,25,26,27,28,29,30]. We find works describing the so-called low-temperature oxidation of iron and steel, but most often from the point of view of applications for waste tanks [31,32,33]. The phenomenon of rapid oxidation of finely divided iron in contact with air should be taken into account when designing technological processes related to the reduction of mill scale. In this work, thermal analysis methods were used to simulate the process of mill scale reduction using CO at 850 °C, 950 °C, and 1050 °C, followed by synthetic air oxidation at 300 °C, 350 °C, and 400 °C. The process was carried out on material in its original form, i.e., with the fragmentation obtained in the metallurgical process and mill scale subjected to grinding to facilitate particle size reduction and increase the reaction surface. The chemical composition of mill scale was also analyzed before and after the process in terms of iron content.
2. Materials and Methods
The study’s research material was iron-containing metallurgical waste in the form of oily mill scale (oil content > 3% by mass), from one of the steelworks located in Poland. Several methods were used for an analysis of the scale chemical composition. Carbon determination was performed with a LECO CS844 analyzer (LECO, St. Joseph, MI, USA), oxygen with a LECO ONH836 analyzer (LECO, St. Joseph, MI, USA), and the remaining elements using a Hitachi S-3400N scanning microscope (HITACHI, Tokyo, Japan) equipped with an EDS and WDS detector.
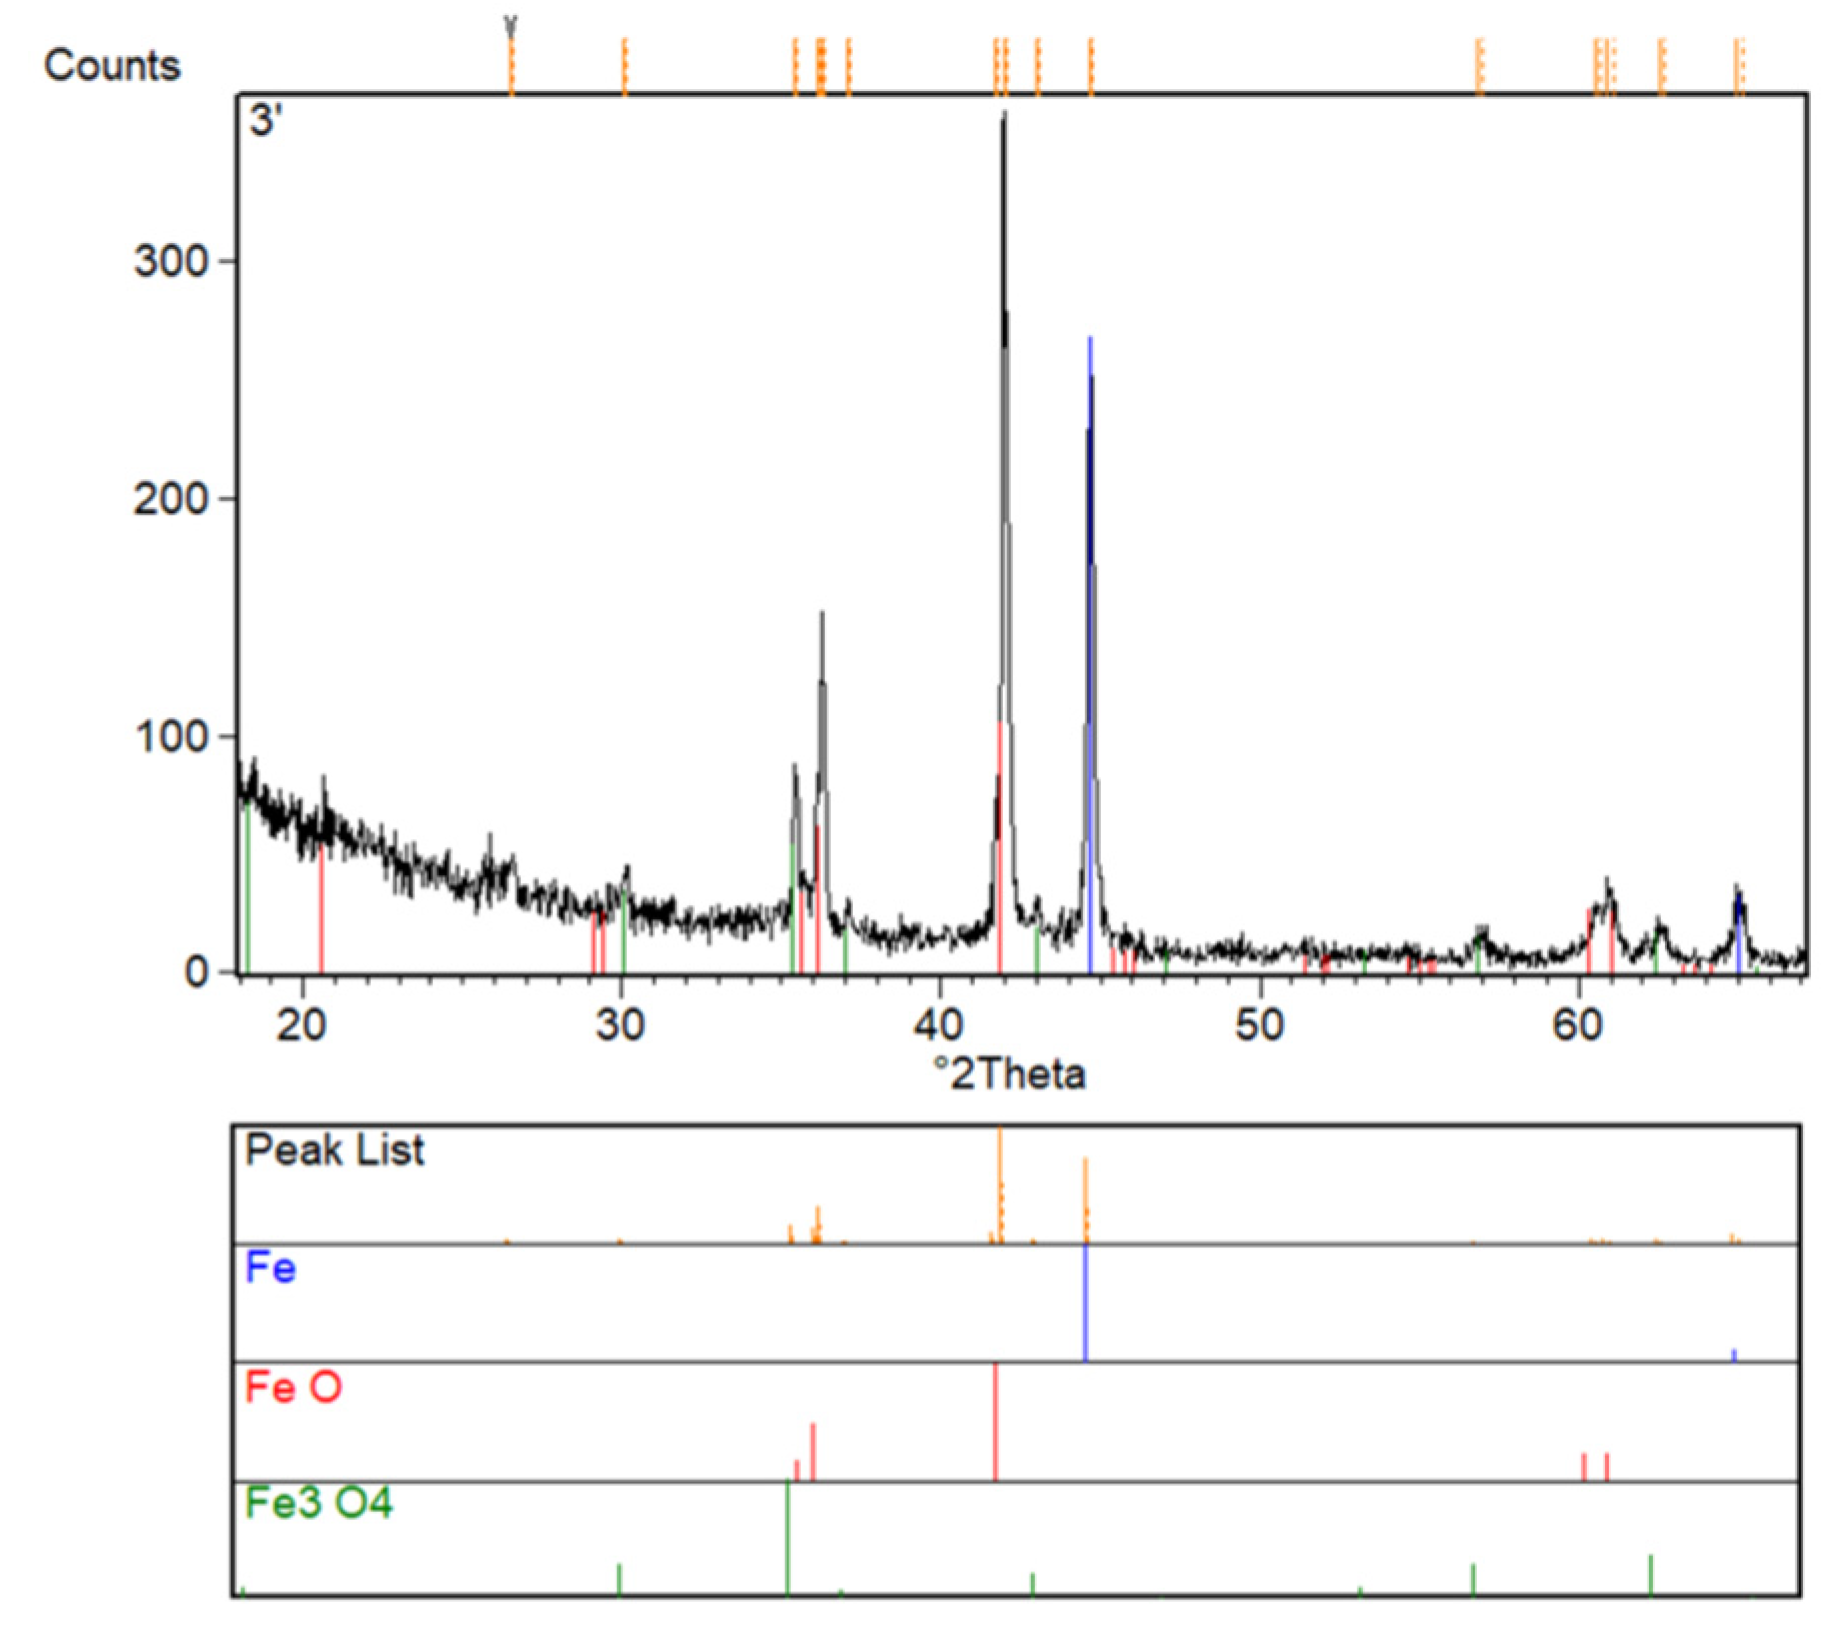
Since the iron in mill scale is in oxide form, phase analysis was performed on the X-ray diffractometer X’Pert 3 (Philips, Amsterdam, The Netherlands). The phases were identified based on the ICCD PDF-2 and COD Database. Mass fractions of individual phases were calculated using the external standard method (corundum).
Two forms of scale were used for the thermal analysis method, in fraction, in which it is collected in a metallurgical process (denoted as A) and, in ground (powdered) form, to obtain a larger reaction surface during the experiment (denoted as B). Bulk density and grain composition were determined for both fractions. Bulk density was defined as the ratio of the weight of loose powder to the volume of the vessel in which it was located. Grain composition was determined using sieve analysis, consisting of sifting 100 g of powder through a set of sieves, and then determining the masses and percentages of individual fractions.
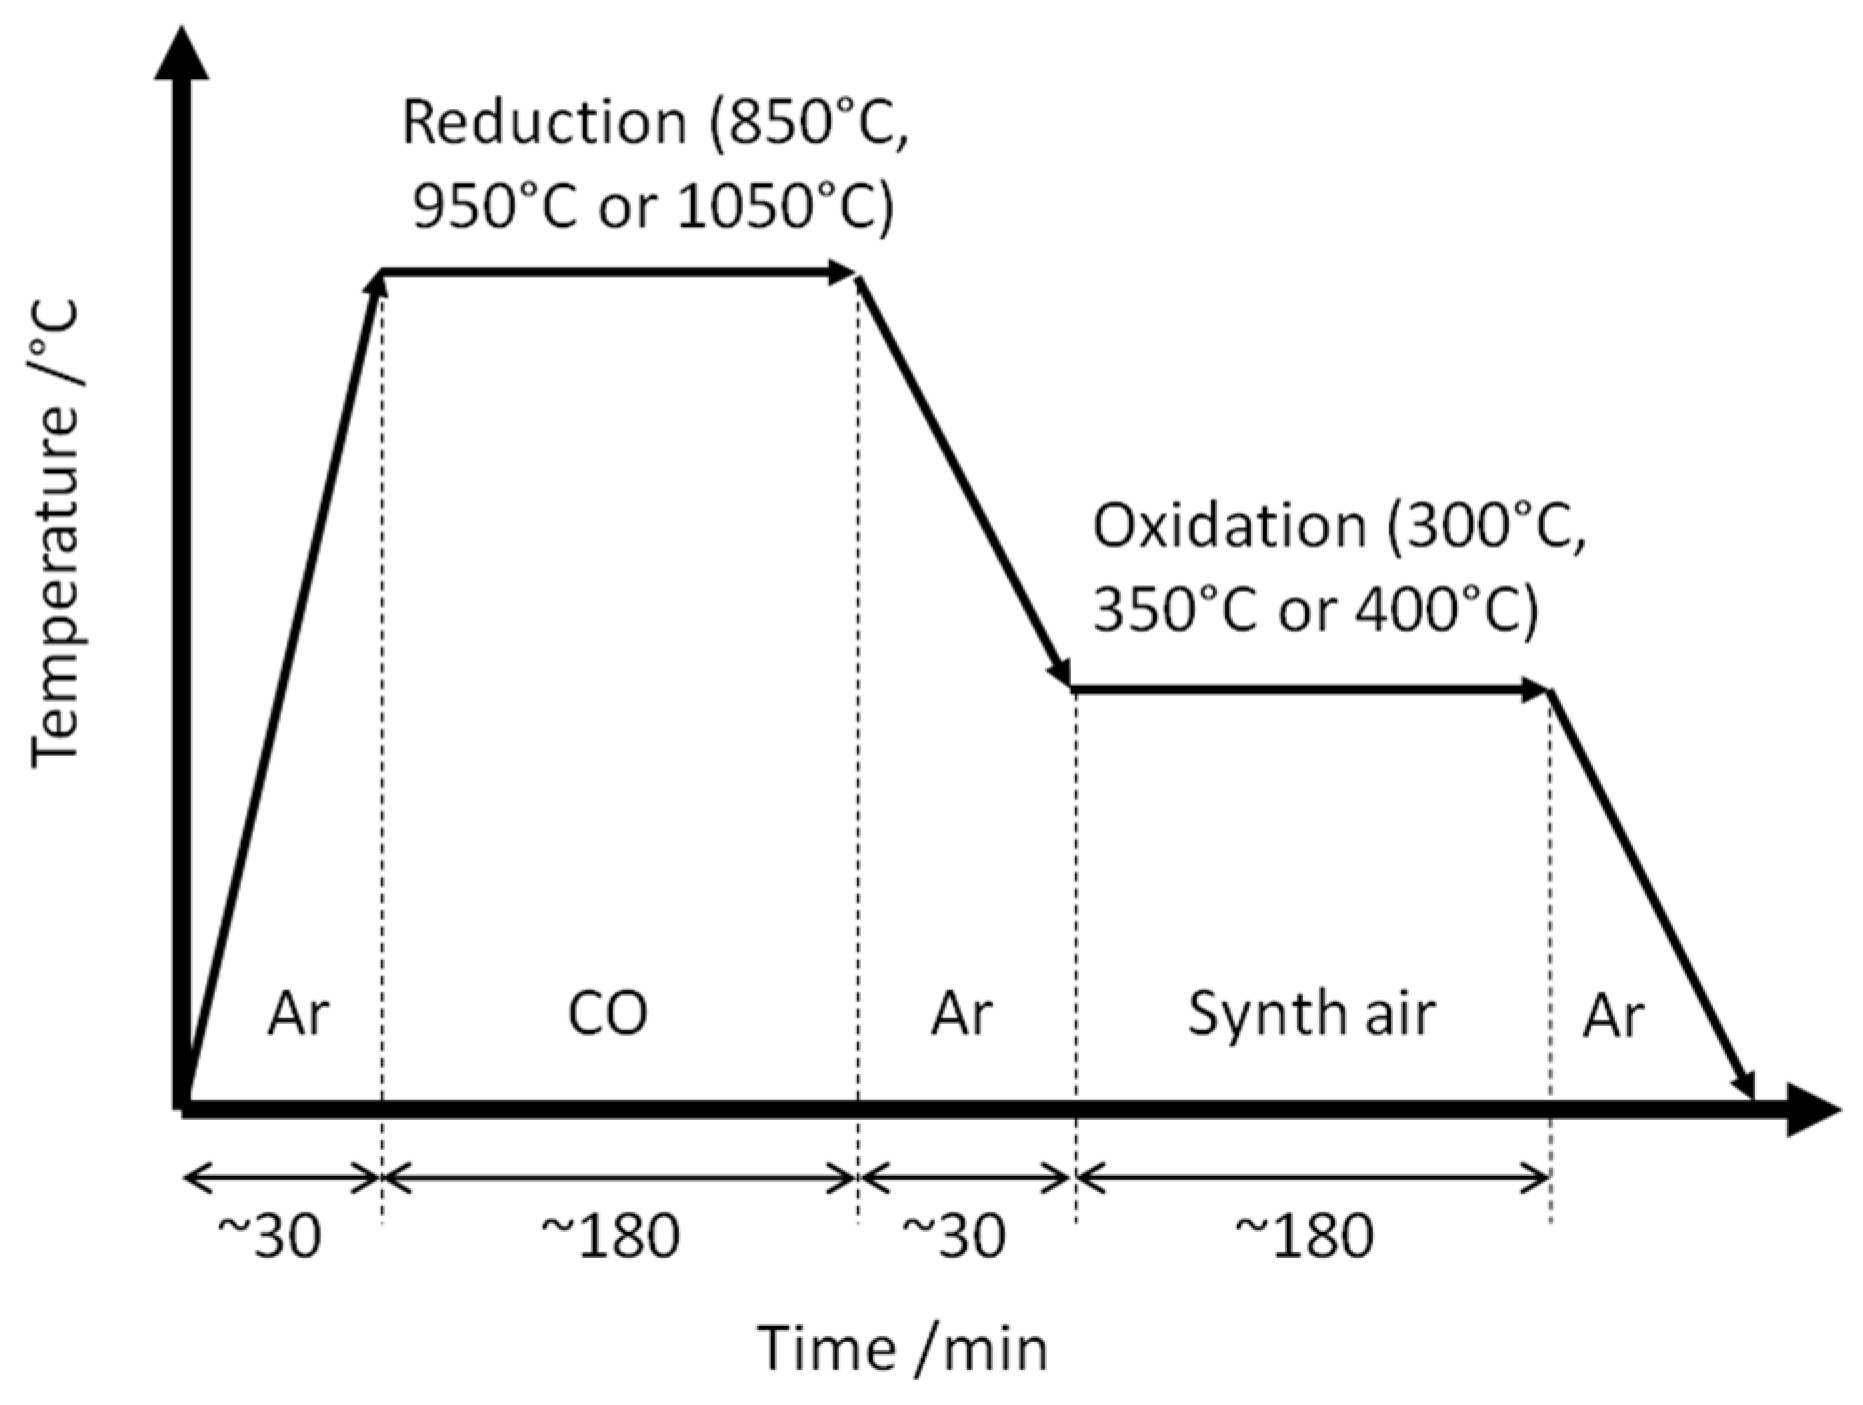
Thermal analysis of mill scale in the form of fractions A and B was performed on the STA 449 Jupiter F3 thermal analyzer from NETZSCH (NETZSCH Holding, Selb, Germany). The device enables measurement of the DTA (Differential Thermal Analysis) signal with simultaneous continuous measurement of sample mass TG (Thermogravimetric Analysis). Each time, samples weighing about 0.2 g were placed in alundum crucibles (Al2O3 content 99.7%) with a capacity of 0.3 mL and tested according to the scheme presented in Figure 2. A heating chamber of the device after placement of crucible was pumped out and filled with high purity argon (N6.0). Then, samples were heated to the selected reduction temperature (850 °C, 950 °C, or 1050 °C) with an argon flow of 50 mL/min. The reduction was carried out by purging the heating chamber with pure CO (flow 60 mL/min). The reduction time was selected experimentally by observing the TG curve, the flat course of which indicated the end of the process. After the reduction was completed, samples were cooled under argon (flow 50 mL/min) until the planned oxidation temperature was reached (300 °C, 350 °C or 400 °C). Oxidation was carried out using synthetic air with a flow of 60 mL/min. Oxidation time was taken as similar to reduction. Finally, samples were cooled freely to room temperature under an argon atmosphere.
After thermal analysis, the samples were subjected to further chemical composition analyses. Total iron content was determined by Atomic Absorption Spectrometry (ASA). The samples were measured with the AAS 30 Carl Zeiss apparatus (Jena, Germany), with a lamp current for iron of 8 mA, aperture of 0.30 mm, measuring the wavelength of Fe-248.3 nm, reading the absorbance, and calculating the iron content from the standard curve. Determination of Fe(II) ions was carried out by reaction with the batophenanthroline solution. Measurement was made with the HP 8452 A spectrometer at a wavelength λ = 534 nm. Contents were calculated from the standard curve of the absorbance value versus the concentration of Fe (II) ions in complex with batophenanthroline. Determination of Fe(III) ions was carried out by reaction with thiocyanate ions. Measurement was made with the HP 8452 A spectrometer (HP Inc., Palo Alto, CA, USA) at the wavelength λ = 476 nm. Contents were calculated from the standard curve of the absorbance value versus the concentration of Fe (III) ions in complex with thiocyanates.
3. Results and Discussion
Results of chemical analysis of the tested scale are presented in Figure 3. In Table 1, the value of averaged chemical composition with the standard deviation of elements concentration in mill scale is shown. Figure 4 presents the result of qualitative XRD phase analysis, and in Table 2, the result of the quantitative analysis. Results of chemical composition analysis confirmed high iron content in tested mill scale (approx. 85%), which is a strong argument for attempts to recover iron from this waste. Almost all of the iron in scale is in the oxide form, and not more than 1% is metallic. The studied scale is also characterized by a low content of impurities (S and P) and other elements, the presence of which could not be clearly confirmed during XRD phase analysis.
Part of the scale was subjected to additional grinding in a porcelain mortar (fraction B). The size reduction was to expand the surface of the material and examine the effect of such treatment on reduction and oxidation reactions taking place during the thermal analysis experiment. The bulk density of the primary fraction (A) and a ground fraction (B) was determined, with the results per ton of 1.67 Mg/m3 and 2.80 Mg/m3, respectively. Bulk density is one of the core technological properties and depends on the condition in which material is stored. Therefore, an increase in the value of bulk density along with an increase in mass of stored mill scale should be expected, in which the space between particles will be reduced due to the effect of its own weight. Bulk density of thickened mill scale reaches 5.7 Mg/m3 [34]. The differences in the structure of fractions A and B are shown even more clearly by the grain size result (Figure 5). Sieve analysis showed that approximately 90% of the A fraction grains belong to a size class above 0.5 mm, including over 20% to the 2.0–5.0 mm class. In the case of the B fraction, almost 80% belonged to a size class below 0.5 mm, and for the classes higher than 2 mm, no shares were found.
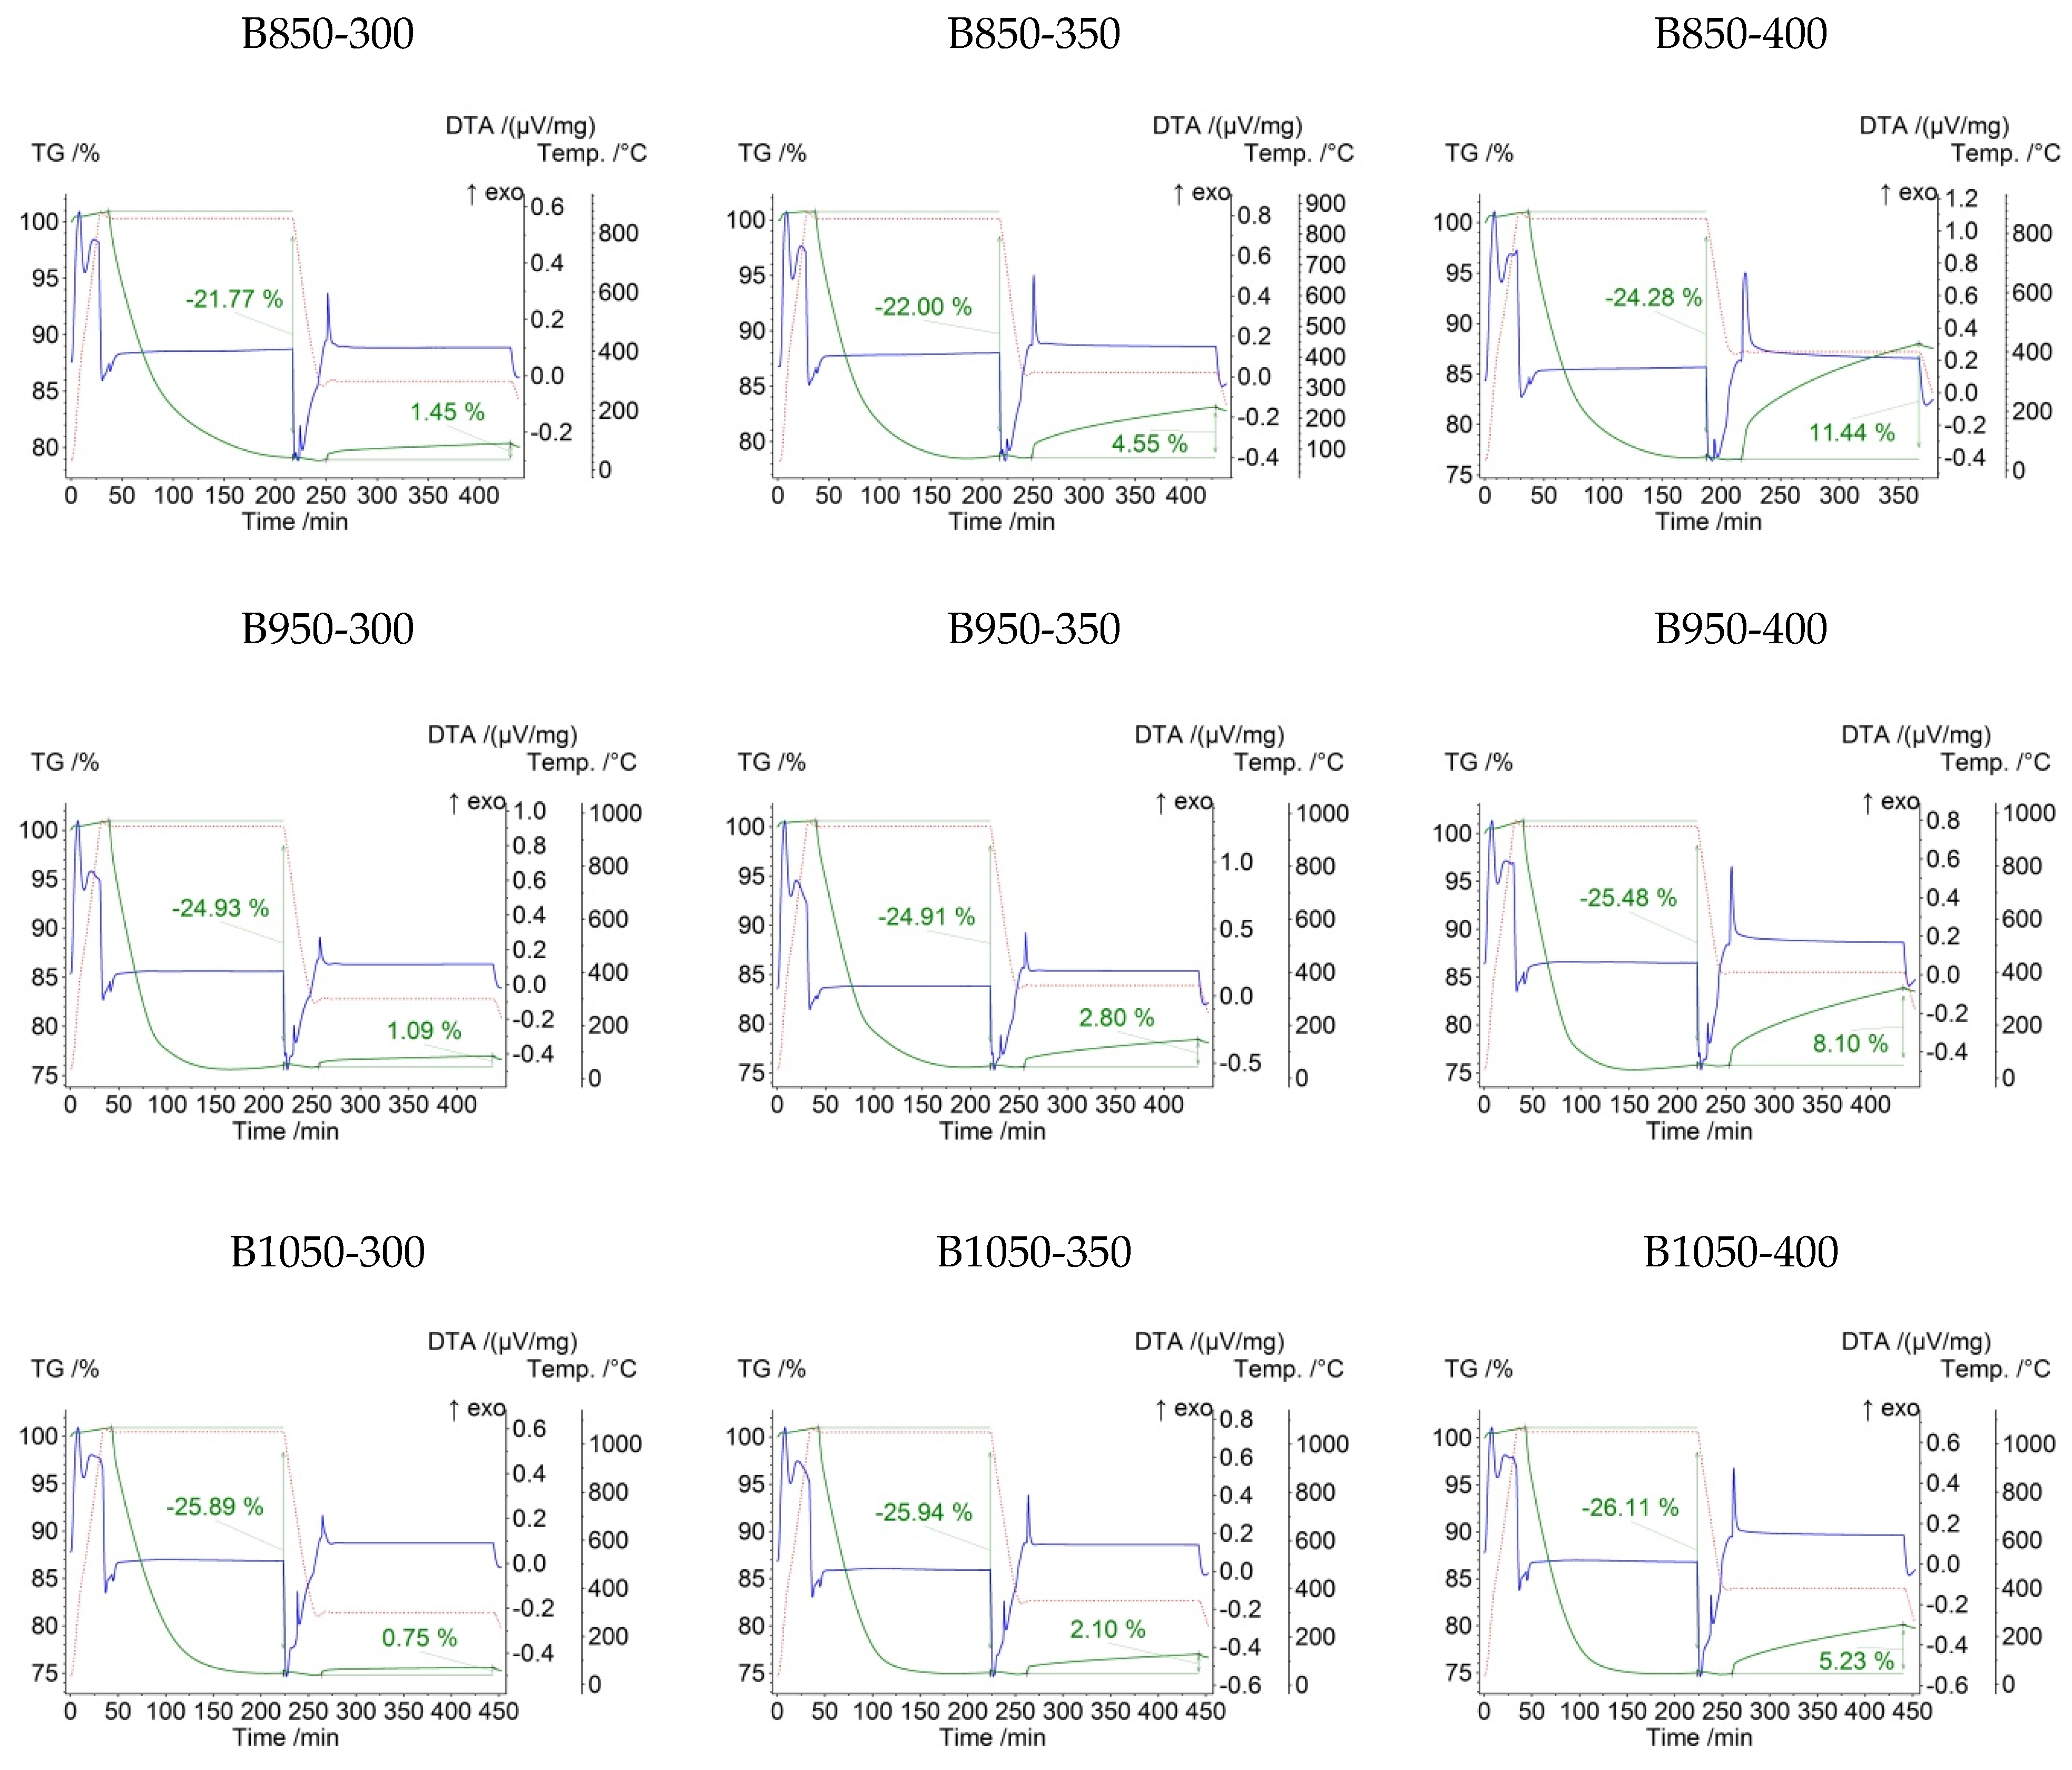
Table 3 summarizes the denotations and mass change of samples that took part in the experiment of reduction and oxidation during thermal analysis measurement. The curves recorded during the TG/DTA analysis are shown in Figure 6 and Figure 7.
The reduction of iron oxides is carried out through the reaction of heterogeneous solid, liquid, and gas phases. Reduction mechanisms consist of surface processes that accompany the removal of oxygen from reduced oxide and transport processes related to the flow of gaseous reagents and mass transfer inside the solid [35,36,37]. Due to the influence of several factors, such as temperature, vapor pressure, by reducing the agent composition or the degree of phase contact, the mechanism of reducing iron oxides is complicated and not fully understood [37,38,39]. It is commonly assumed that a reduction of iron oxides at temperatures below 560 °C occurs in several stages Fe2O3 → Fe3O4 → Fe, and at temperatures above 560 °C according to Fe2O3 → Fe3O4 → FeO → Fe [40,41]. The process of reducing iron oxides with carbon monoxide is illustrated by the following reactions:
3Fe2O3 + CO → 2Fe3O4 + CO2
Fe3O4 + CO → 3FeO + CO2
FeO + CO → Fe + CO2
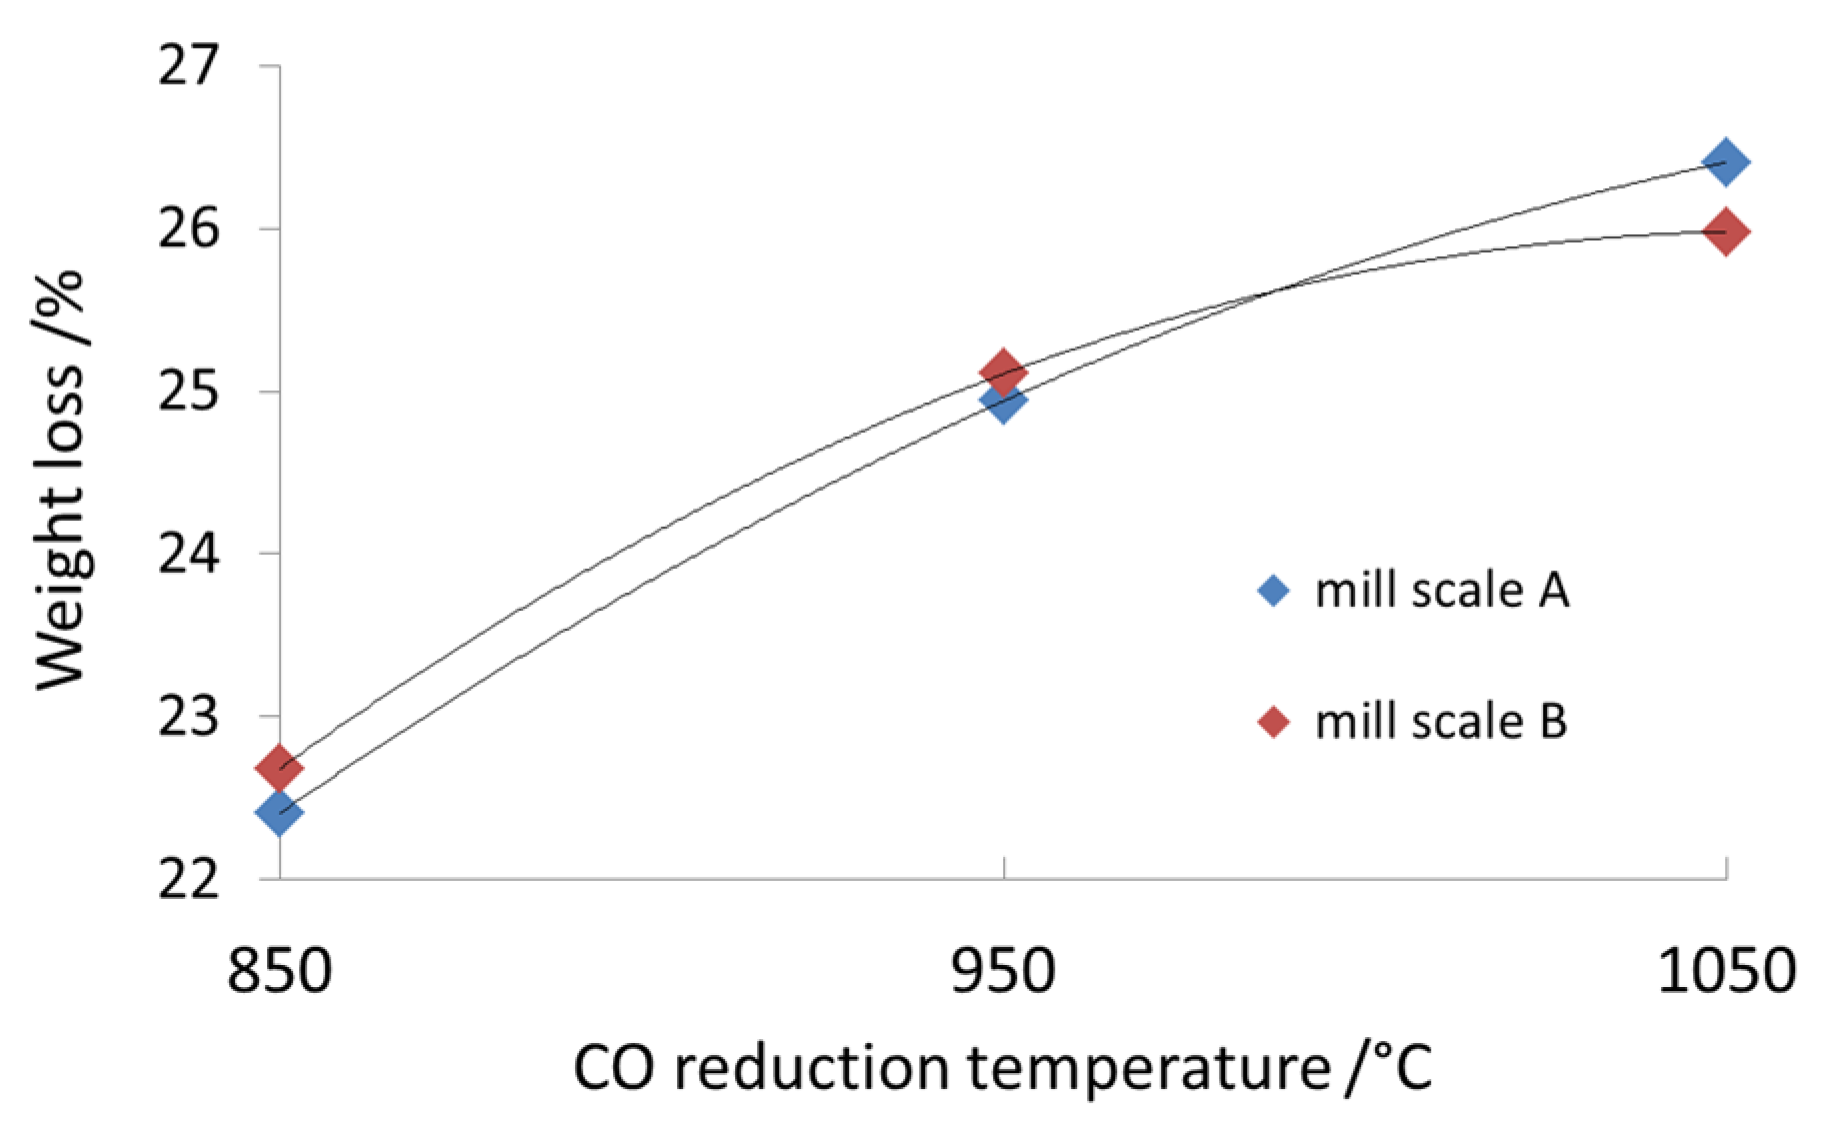
Results of the TG analysis showed that with an increase of temperature at which the reduction of mill scale with CO was carried out, loss of sample mass increased, and thus, its reducibility. Average weight loss during reduction for fractions A and B is presented in Figure 8. It is similar for both tested fractions and varies from approximately 22.5% at 850 °C to approx. 26.2% at 1050 °C.
The time when the reduction process was completed is more important from the point of view of the application in the technological process. It revealed itself in the achievement of a horizontal course on the TG curve recorded during reduction. For mill scale A at 850 °C, the reduction lasted approximately 180 min, while at 950 °C and 1050 °C, stabilization took place after approximately 90 min. Grinding the scale to fraction B resulted in shortening of reduction time at 850 °C to approximately 120 min; however, it did not significantly change reduction time at temperatures of 950 °C and 1050 °C.
After heating in a reducing atmosphere, samples were cooled to a temperature of 300 °C, 350 °C, or 400 °C, where they were subjected to heating in an atmosphere of synthetic air for 180 min. The product of the mill scale reduction process is iron in a spongy form, similar to industrial iron obtained by direct reduction from ores, the so-called DRI (Direct Reduced Iron). As a result of oxygen removal, it has a highly porous structure and is very reactive with moisture and oxygen. The re-oxidation process revealed itself in THE form of an increase in mass recorded on the TG curve. Unlike mill scale, which is non-flammable, finely divided reduced iron can oxidize rapidly when in contact with a sufficient amount of oxygen. This phenomenon is called pyrophoric, from “pyro” (fire) + “phor” (carry) and literally means “fire bearing” [42]. Pyrophoricity is one of the chemical properties of an element and determines the powder’s tendency to self-ignition or rapid oxidation associated with the release of significant amounts of heat. Atoms forming the subsurface layer take part in the oxidation reaction, and due to the good thermal conductivity of metal and bad of gas atmosphere, practically all the heat generated during oxidation is used to heat particles, which may consequently lead to its ignition [43,44,45]. Most often, for such a phenomenon to occur, the substance must be finely divided, and the smaller the powder particles, the higher temperature they heat up. Apart from many metals, including iron, one of the materials showing pyrophoric properties is FeO [46,47]. To reduce the oxidation of DRI, one can turn to industrial practice, where we can find methods such as DRI passivation by blowing with a nitrogen mixture with a small amount of oxygen, coating DRI with protective substances, or reducing the surface area of DRI by densifying it in form of briquettes [48].
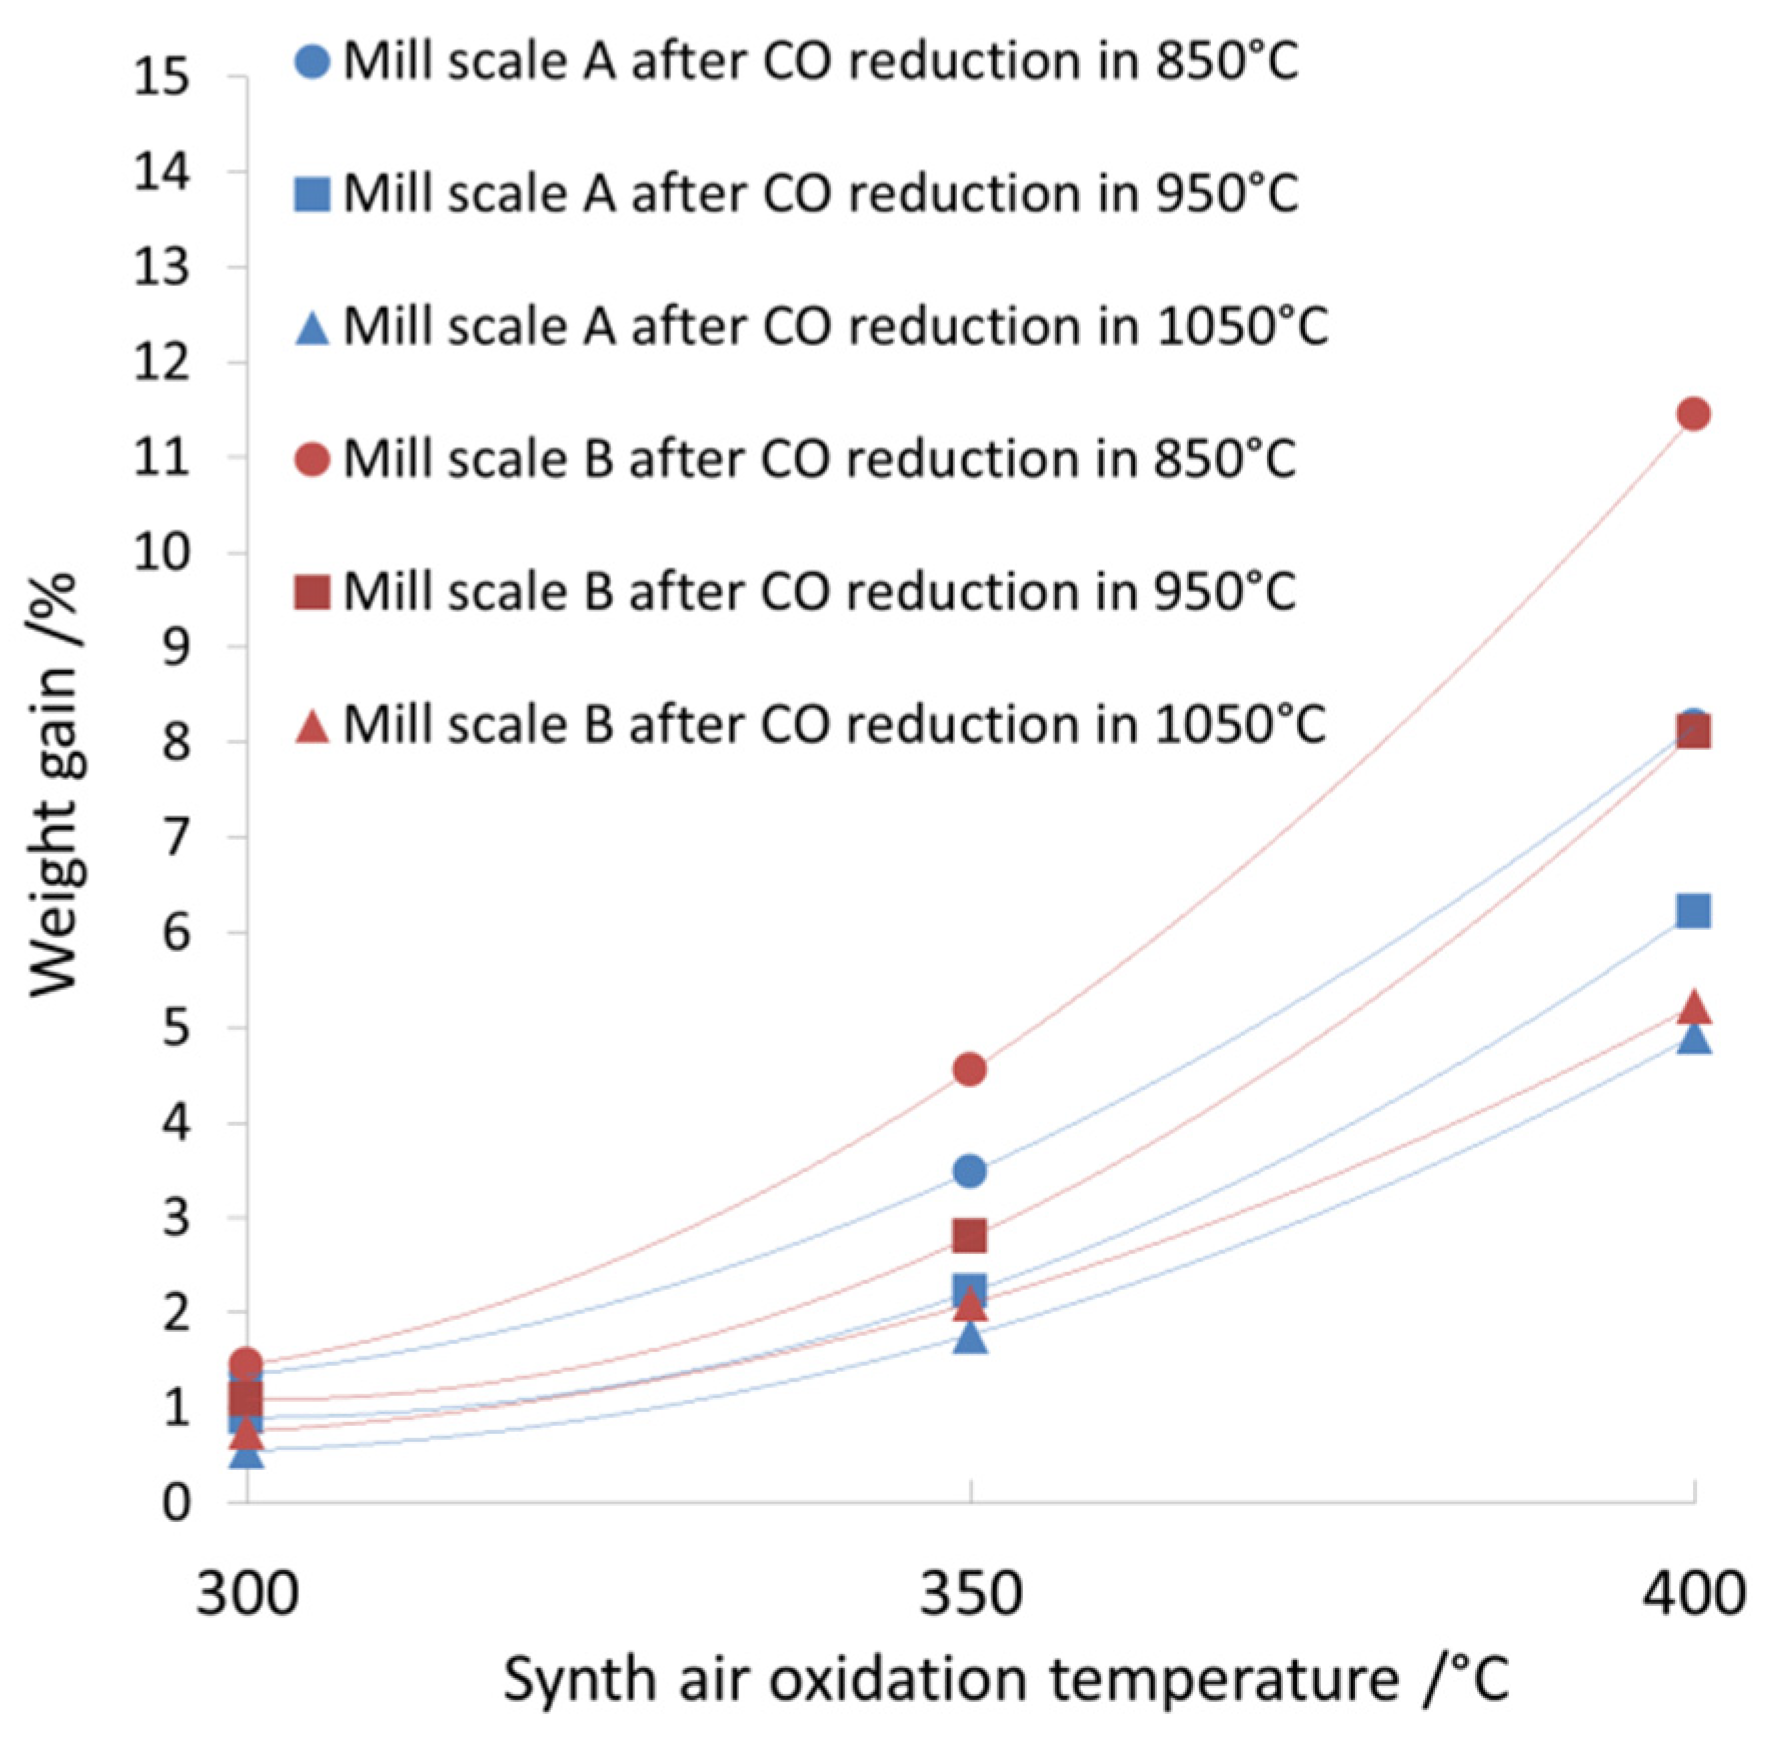
With the increase of temperature at which oxidation was carried out, the weight gain also increased. The intensity of the process was revealed in the form of an increase in exothermic peak area accompanying oxidation reaction and recorded on the DTA curve. At the same time, it was found that the higher the reduction temperature was, the smaller the weight increase during oxidation follow. Again, this is related to both fractions A and B, with the weight increase of fraction B being higher. The explanation for this phenomenon is the sintering of finely divided iron obtained by reducing the mill scale. Sintered particles have a smaller reaction surface. Tendency to sintering increases with the temperature and time of reduction as stated in Reference [49].
Weight gain during oxidation of samples from fractions A and B at 300 °C, 350 °C, and 400 °C during 180 min is shown in Figure 9. The smallest weight increase of 0.55% was recorded for sample from fraction A oxidized at 300 °C after reduction at a temperature of 1050 °C, and highest (11.44%) for sample from B fraction oxidized at 400 °C after reduction at 850 °C.
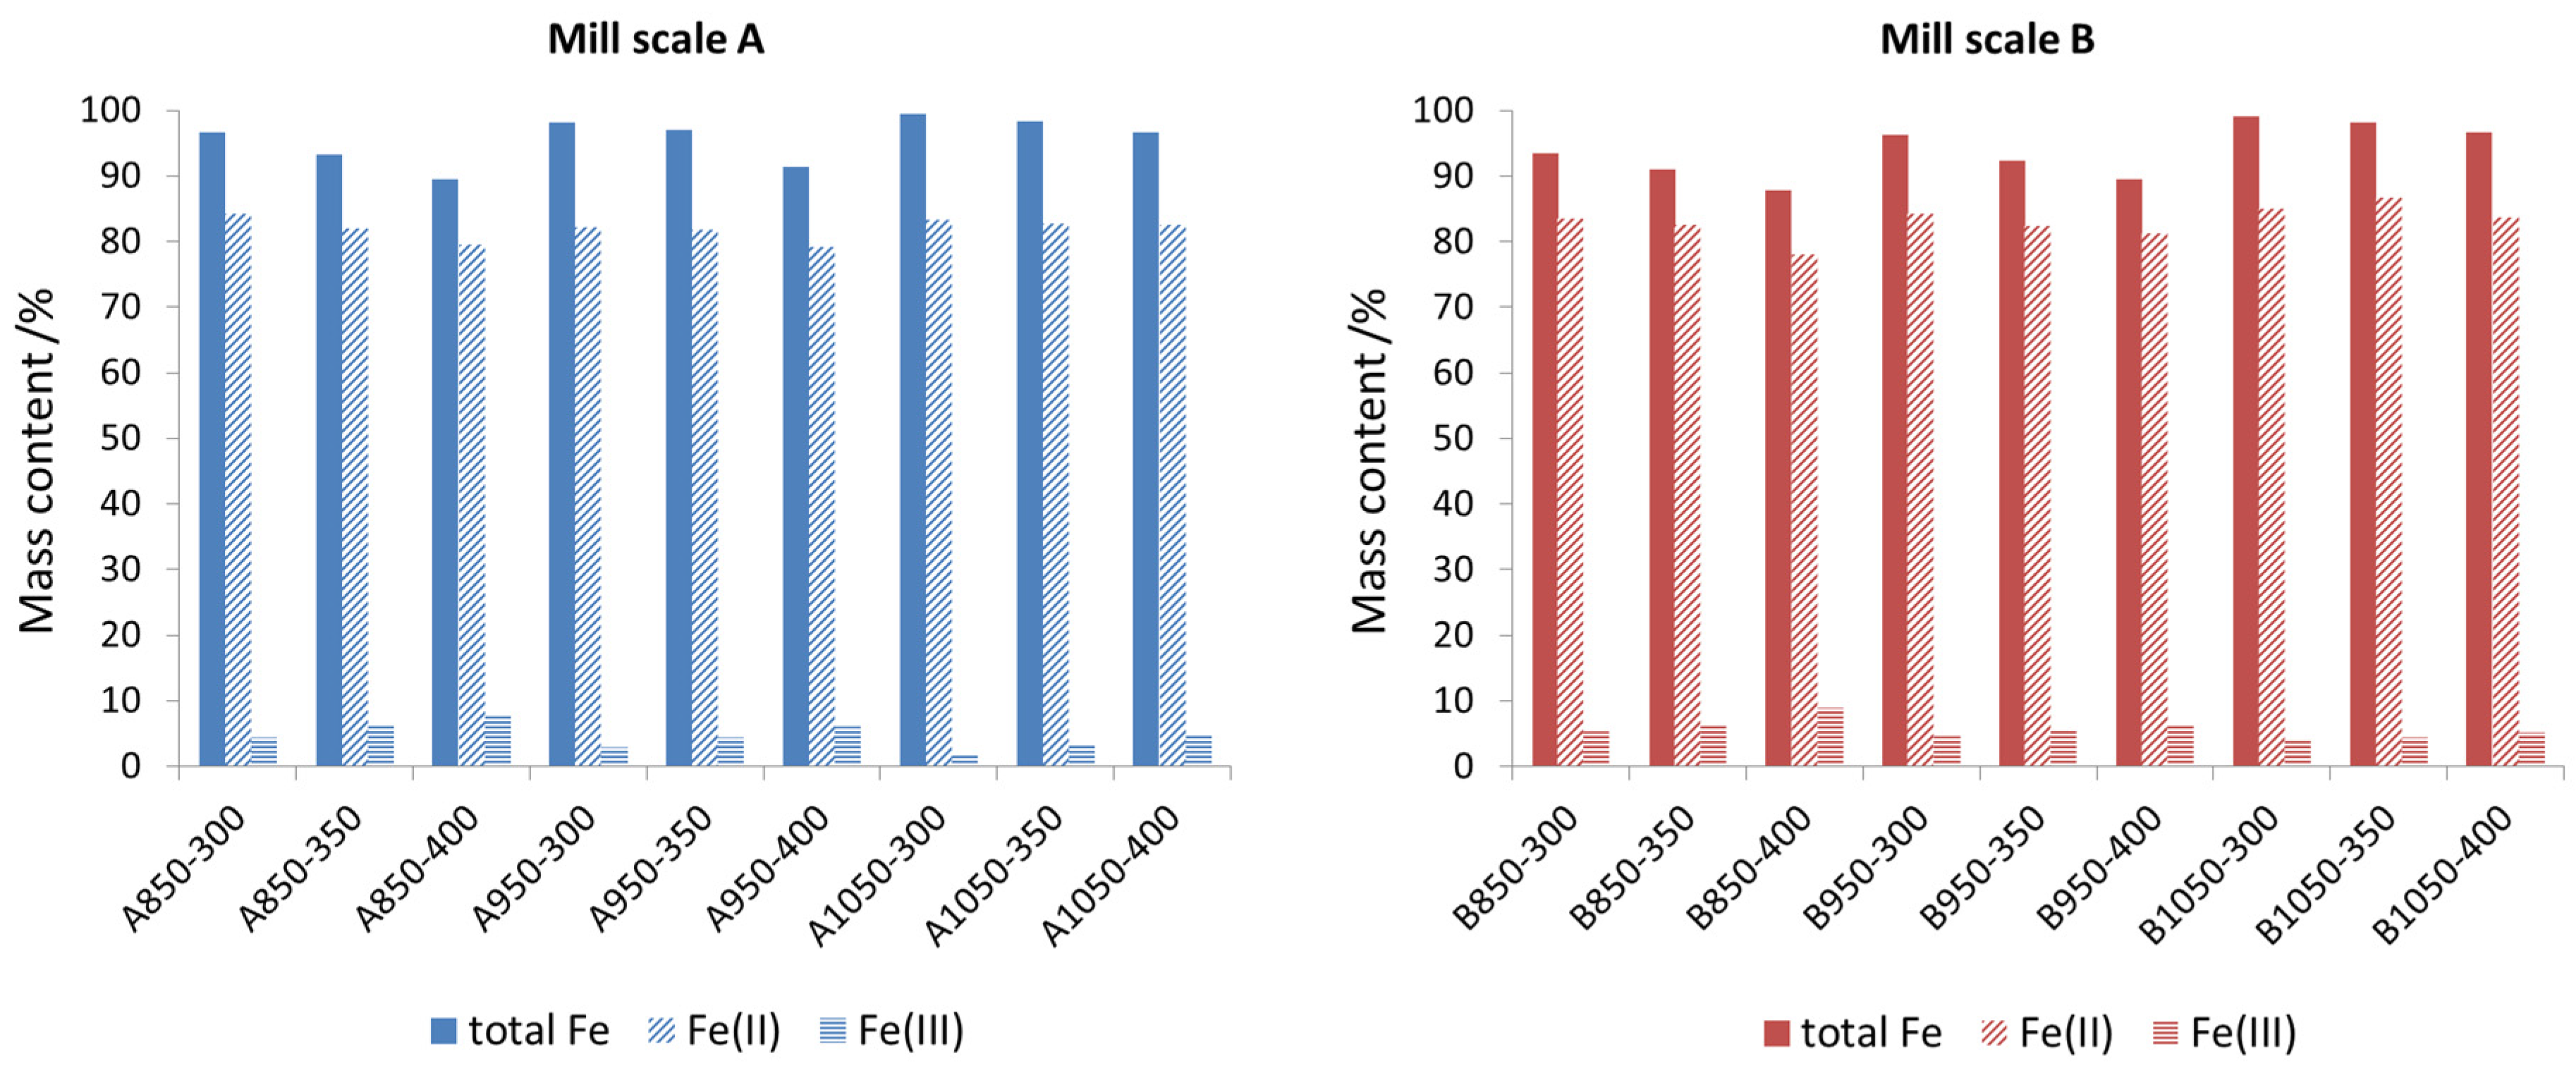
In order to check the influence of the accomplished thermal analysis research program on the state of the tested mill scale, samples after the experiment were subjected to chemical analysis for iron determination. Total iron content was determined by Atomic Absorption Spectrometry (ASA), while iron ions were determined by spectrophotometric methods (iron (II) ions in reaction with batophenanthroline solution, and iron (III) ions in reaction with thiocyanate ions). The results of the chemical analysis of both fractions are shown in Figure 10. The mass fraction of individual components of the mill scale changed significantly. The average iron (II) content for both fractions was about 82%. The difference between A and B fractions was shown by a lower total iron content and a higher iron (III) content in the case of scale B. This is reflected in the results of thermal analysis, which showed that the development of scale B surface by grinding increased its susceptibility to oxidation.
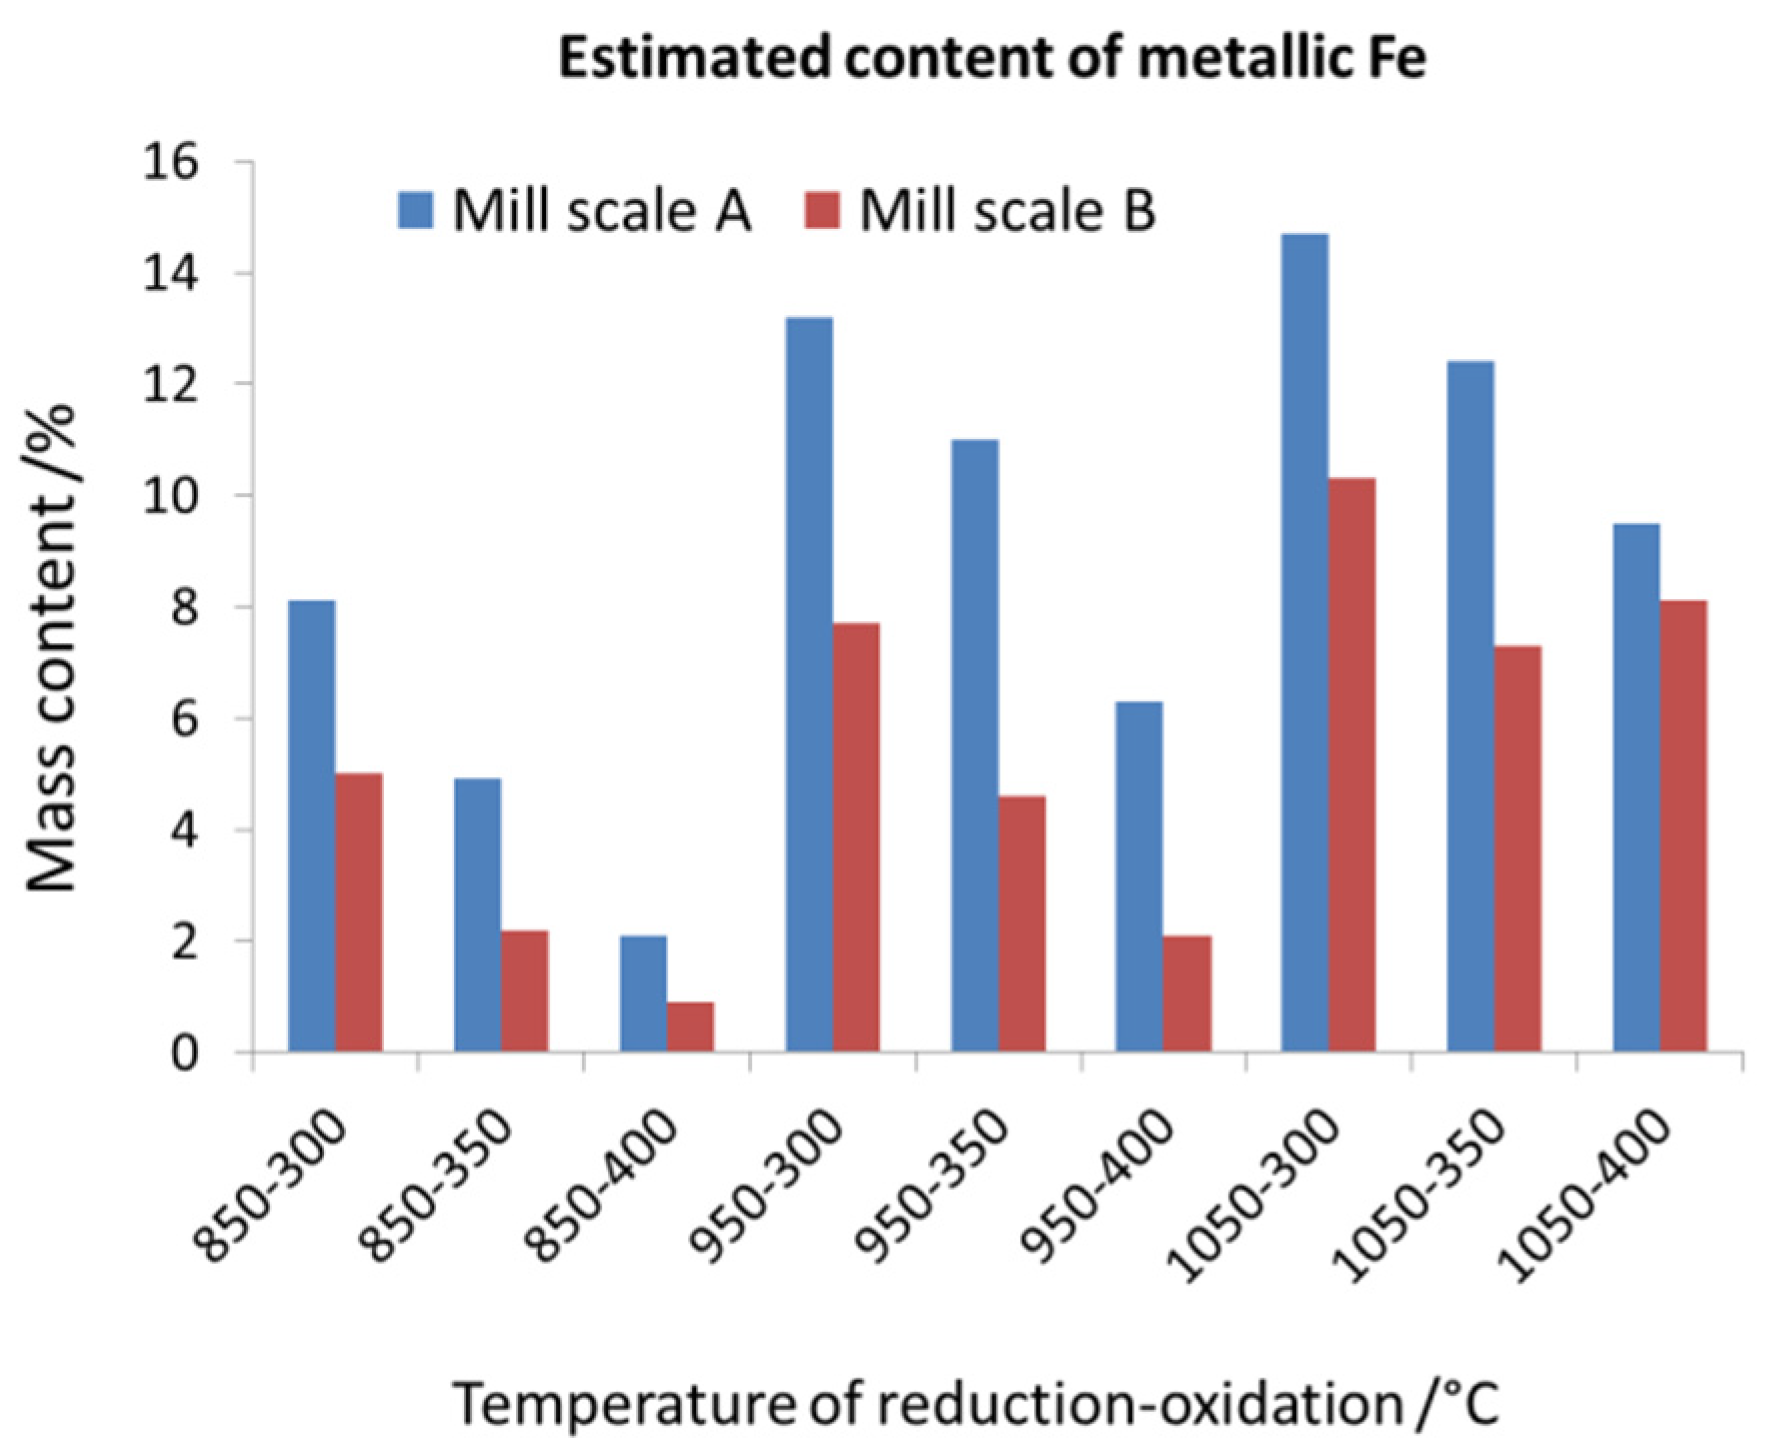
The content of metallic iron estimated based on the above results in samples subjected to thermal analysis is shown in Figure 11. It clearly shows that the content of metallic iron is each time lower in mill scale of fraction B. The highest share, which amounted to approximately 15%, was found for the sample, which was reduced with carbon monoxide at a temperature of 1050 °C and oxidized in synthetic air at a temperature of 300 °C (A1050-300). The lowest quantity of metallic iron (0.9%) was found for scale samples subjected to reduction at 850 °C and oxidation at 400 °C (B850-400). This value is almost identical to the metallic iron content determined by XRD phase analysis for the primary mill scale (Table 2).
4. Conclusions
This work presents the results of experiments aimed at checking the possibility of recovering iron from oily mill scale by reducing with carbon monoxide and taking into account the phenomenon of secondary oxidation in contact with oxygen from air. Analysis of chemical and phase composition showed that the examined mill scale contained about 85% of the iron in the form of oxides (FeO, Fe3O4).
The main research was carried out with the use of the thermal analysis methods on the mill scale in primary form (fraction A) and ground to extend their surface (fraction B). Bulk density of fraction A and fraction B was determined, with the results per ton of 1.67 Mg/m3 and 2.80 Mg/m3, respectively. Sieve analysis was also performed.
The reduction was carried out for approximately 180 min at temperatures of 850 °C, 950 °C, and 1050 °C. The course of the TG curves showed that the degree of mill scale reduction increases with temperature, while the kinetics of the process changes as well. The smallest weight loss and the lowest reaction rate were found for the reduction of mill scale with carbon monoxide at 850 °C while the highest weight loss and the highest reaction rate were found during the reduction of scale at 1050 °C. This applies to the mill scale in both fractions (A and B).
Re-oxidation effect was observed during exposition of reduced mill scale to synthetic air at a temperature of 300 °C, 350 °C, and 400 °C for 180 min. Each time fraction B, due to a more unfolded surface, was characterized by a higher weight gain due to oxidation than fraction A. The smallest weight increase of 0.55% was recorded for the sample from fraction A oxidized at 300 °C after reduction at temperature 1050 °C, and highest (11.44%) for sample from fraction B oxidized at 400°C after reduction at 850 °C. At the same time, the tendency for sintering of reaction products with increasing temperature was confirmed.
Thermal analysis results was also reflected in iron content analysis after the process, where each time samples of fraction B had a higher content of iron in II and III degrees of oxidation and a lower metallic iron content compared to samples of fraction A.
The occurrence of secondary oxidation of reduced iron should be taken into account when designing technological processes related to the recovery of iron from metallurgical waste by reduction. Most favorable results in this work were obtained for the reduction of mill scale in the primary form (fraction A) at a temperature of 1050 °C. The authors emphasize the need for further research, going beyond the limitations of the used research methods and supplementing the results obtained here with a more complex analysis of mill scale reduction products.
Author Contributions
Conceptualization, K.N., T.M., T.L.; methodology, T.M.; validation, T.M., K.N.; formal analysis, T.L.; resources, K.N., T.M.; writing—original draft preparation, K.N., T.M.; writing—review and editing, K.N., T.M., T.L.; visualization, T.M.; supervision, T.M.; funding acquisition, K.N. All authors have read and agreed to the published version of the manuscript.
Funding
The Silesian University of Technology (Faculty of Materials Engineering, Department of Production Engineering) supported this work as a part of Statutory Research BK-229/RM1/2021 (11/010/BK_21/0032).
Conflicts of Interest
The authors declare no conflict of interest.
References
- EU Commission. Directive 2008/98/EC of the European Parliament and of the Council of 19 November 2008 on Waste and Repealing Certain Directives (Waste Framework Directive, R1 Formula in Footnote of Attachment II). Available online: http://eur-lex.Europa.Eu/lexuriserv (accessed on 4 March 2021).
- Sellitto, M.A.; Murakam, F.K. Destination of the waste generated by a steelmaking plant: A case study in Latin America. Aestimum 2020, 77, 127–144. [Google Scholar] [CrossRef]
- Stecko, J.; Stachura, R.; Niesler, M.; Bernasowski, M.; Klimczyk, A. Utilisation of metallurgical sludge by multi-layer sintering. Ironmak. Steelmak. 2017, 45, 1–8. [Google Scholar] [CrossRef]
- Lobato, N.C.C.; Villegas, E.A.; Mansur, M.B. Management of solid wastes from steelmaking and galvanizing processes: A brief review. Resour. Conserv. Recycl. 2015, 102, 49–57. [Google Scholar] [CrossRef]
- Richards, I.G.; Palmer, J.P.; Barratt, P.A. 9 Steel Industry Raw Materials and Wastes. Stud. Environ. 1993, 56, 253–279. [Google Scholar] [CrossRef]
- Branca, T.A.; Colla, V.; Algermissen, D.; Granbom, H.; Martini, U.; Morillon, A.; Pietruck, R.; Rosendahl, S. Reuse and Recycling of By-Products in the Steel Sector: Recent Achievements Paving the Way to Circular Economy and Industrial Symbiosis in Europe. Metals 2020, 10, 345. [Google Scholar] [CrossRef] [Green Version]
- Dong, K.; Wang, X. CO2 Utilization in the Ironmaking and Steelmaking Process. Metals 2019, 9, 273. [Google Scholar] [CrossRef] [Green Version]
- Jikar, P.; Dhokey, N. Overview on production of reduced iron powder from mill scale waste. Mater. Today Proc. 2021, 44, 4324–4329. [Google Scholar] [CrossRef]
- Binnemans, K.; Jones, P.T.; Fernández, Á.M.; Torres, V.M. Hydrometallurgical Processes for the Recovery of Metals from Steel Industry By-Products: A Critical Review. J. Sustain. Met. 2020, 6, 505–540. [Google Scholar] [CrossRef]
- Krzyzanowski, M.; Beynon, J.H.; Farrugia, D.C.J. Oxide Scale Behavior in High Temperature Metal Processing; Wiley: Weinheim, Germany, 2010; ISBN 978-3-527-32518-4. [Google Scholar]
- Sen, R.; Dehiya, S.; Pandel, U.; Banerjee, M. Utilization of Low Grade Coal for Direct Reduction of Mill Scale to Obtain Sponge Iron: Effect of Reduction Time and Particle Size. Procedia Earth Planet. Sci. 2015, 11, 8–14. [Google Scholar] [CrossRef] [Green Version]
- Umadevi, T.; Brahmacharyulu, A.; Karthik, P.; Mahapatra, P.C.; Prabhu, M.; Ranjan, M. Recycling of steel plant mill scale via iron ore sintering plant. Ironmak. Steelmak. 2012, 39, 222–227. [Google Scholar] [CrossRef]
- Eissa, M.; Ahmed, A.; El-Fawkhry, M. Conversion of Mill Scale Waste into Valuable Products via Carbothermic Reduction. J. Met. 2015, 2015, 1–9. [Google Scholar] [CrossRef] [Green Version]
- Roy, B.N. Conversion of rolling mill scale into sponge iron powder. Int. J. Curr. Res. 2016, 8, 31348–31351. [Google Scholar]
- Murthy, Y.I.; Agarwal, A.; Pandey, A. Characterization of Mill Scale for Potential Application in Construction Industry. Indian J. Eng. 2017, 14, 71–76. [Google Scholar]
- Khaerudini, D.S.; Chanif, I.; Insiyanda, D.R.; Destyorini, F.; Alva, S.; Pramono, A. Preparation and Characterization of Mill Scale Industrial Waste Reduced by Biomass-Based Carbon. J. Sustain. Met. 2019, 5, 510–518. [Google Scholar] [CrossRef]
- Sanin, V.N.; Ikornikov, D.M.; Andreev, D.E.; Sachkova, N.V.; Yukhvid, V.I. Mill scale recycling by SHS metallurgy for production of cast ferrosilicon and ferrosilicoaluminium. IOP Conf. Ser. Mater. Sci. Eng. 2019, 558, 012041. [Google Scholar] [CrossRef]
- Martín, M.I.; López, F.A.; Torralba, J.M. Production of sponge iron powder by reduction of rolling mill scale. Ironmak. Steelmak. 2012, 39, 155–162. [Google Scholar] [CrossRef] [Green Version]
- Available online: https://www.iron-consortium.org/assets/files/sief/UsesDescription_MillScale_20140108.pdf (accessed on 9 May 2021).
- Available online: https://www.koeppern-international.com/uploads/media/HBI_-_Hot_Briquetting_of_Direct_Reduced_Iron.pdf (accessed on 9 May 2021).
- Morris, A. Iron Resources and Direct Iron Production. Encycl. Mater. Sci. Technol. 2001, 4302–4310. [Google Scholar] [CrossRef]
- Jozwiak, W.; Kaczmarek, E.; Maniecki, T.; Ignaczak, W.; Maniukiewicz, W. Reduction behavior of iron oxides in hydrogen and carbon monoxide atmospheres. Appl. Catal. A Gen. 2007, 326, 17–27. [Google Scholar] [CrossRef]
- Gaballah, N.M.; Zikry, A.F.; Khalifa, M.G.; Farag, A.B.; El-Hussiny, N.A.; Shalabi, M.E.H. Production of Iron from Mill Scale Industrial Waste via Hydrogen. Open J. Inorg. Non-Met. Mater. 2013, 03, 23–28. [Google Scholar] [CrossRef] [Green Version]
- Benchiheub, O.; Mechachti, S.; Serrai, S.; Khalifa, M.G. Elaboration of iron powder from mill scale. J. Mater. Environ. Sci. 2010, 1, 267–276. [Google Scholar]
- Ye, Q.; Zhu, H.; Peng, J.; Kannan, C.S.; Chen, J.; Dai, L.; Liu, P. Preparation of Reduced Iron Powders from Mill Scale with Microwave Heating: Optimization Using Response Surface Methodology. Met. Mater. Trans. A 2013, 44, 1478–1485. [Google Scholar] [CrossRef]
- Ye, Q.; Zhu, H.; Zhang, L.; Ma, J.; Zhou, L.; Liu, P.; Chen, J.; Chen, G.; Peng, J. Preparation of reduced iron powder using combined distribution of wood-charcoal by microwave heating. J. Alloys Compd. 2014, 613, 102–106. [Google Scholar] [CrossRef]
- Mechachti, S.; Benchiheub, O.; Serrai, S.; Shalabi, M.E.H. Preparation of iron Powders by Reduction of Rolling Mill Scale. Int. J. Sci. Eng. Res. 2013, 4, 1467–1472. [Google Scholar]
- Joshi, C.; Dhokey, N.B. Study of Kinetics of Mill Scale Reduction: For PM Applications. Trans. Indian Inst. Met. 2015, 68, 31–35. [Google Scholar] [CrossRef]
- Jie, S.; De-Ren, W.; Ye-Dong, H.; Hui-Bin, Q.; Gao, W. Reduction of oxide scale on hot-rolled strip steels by carbon monoxide. Mater. Lett. 2008, 62, 3500–3502. [Google Scholar] [CrossRef]
- Guan, C.; Li, J.; Tan, N.; He, Y.-Q.; Zhang, S.-G. Reduction of oxide scale on hot-rolled steel by hydrogen at low temperature. Int. J. Hydrogen Energy 2014, 39, 15116–15124. [Google Scholar] [CrossRef]
- Bertrand, N.; Desgranges, C.; Poquillon, D.; Lafont, M.-C.; Monceau, D. Iron Oxidation at Low Temperature (260–500 °C) in Air and the Effect of Water Vapor. Oxid. Met. 2010, 73, 139–162. [Google Scholar] [CrossRef] [Green Version]
- Henshall, G.A. Numerical Predictions of Dry Oxidation of Iron and Low-Carbon Steel at Moderately Elevated Temperatures. MRS Proc. 1996, 465, 667. [Google Scholar] [CrossRef] [Green Version]
- Krungkarnchana, H.; Kongvarhodom, C. Low Temperature Corrosion: Oxidation of Carbon Steel and Stainless Steel in Air. Appl. Sci. Eng. Prog. 2018, 12, 44–51. [Google Scholar] [CrossRef]
- Available online: https://www.ispatguru.com/mill-scale/ (accessed on 4 March 2021).
- Stephenson, R.L. Direct Reduced Iron—Technology and Economics of Production and Use; The Iron and Steel Society of AIME: Warrendale, PA, USA, 1980. [Google Scholar]
- Patisson, F.; Mirgaux, O. Hydrogen Ironmaking: How it Works. Metals 2020, 10, 922. [Google Scholar] [CrossRef]
- Sheshukov, O.; Mikheenkov, M.; Vedmid’, L.; Nekrasov, I.; Egiazaryan, D. Mechanism of Ion-Diffusion Solid-Phase Reduction of Iron Oxides of Technogenic Origin in the Presence of the Liquid Phase and without it. Metals 2020, 10, 1564. [Google Scholar] [CrossRef]
- Tleugabulov, S.M.; Abikov, S.B.; Koishina, G.M.; Tatybaev, M.K. Fundamentals and Prospects of the Development of Reduction Steelmaking. Russ. Met. (Metally) 2018, 2018, 282–286. [Google Scholar] [CrossRef]
- Chufarov, G.I.; Men, A.N.; Balakirev, V.F. Thermodynamics of Metal Oxide Reduction Processes; Metallurgy: Moscow, Russia, 1970. [Google Scholar]
- Longbottom, R.J.; Kolbeinsen, L. Iron Ore Reduction with CO and H2 Gas Mixtures—Thermodynamic and Kinetic Modelling. In Proceedings of the 4th Ulcos Seminar—New Direct Reduction (DR), Essen, Germany, 1–2 October 2008. [Google Scholar]
- Sun, G.; Li, B.; Guo, H.; Yang, W.; Li, S.; Guo, J. Thermodynamic Study on Reduction of Iron Oxides by H2 + CO + CH4 + N2 Mixture at 900 °C. Energies 2020, 13, 5053. [Google Scholar] [CrossRef]
- Thorpe’s Dictionary of Applied Chemistry, 4th ed.; Longmans, Green and Co.: London, UK, 1950; Volume X, pp. 327–329.
- Hosseini, S.G.; Eslami, A. Investigation on the Reaction of Powdered Tin as a Metallic Fuel with Some Pyrotechnic Oxidizers. Propellants Explos. Pyrotech. 2011, 36, 175–181. [Google Scholar] [CrossRef]
- Gorrie, T.M.; Kopf, P.W.; Toby, S. Kinetics of the reaction of some pyrophoric metals with oxygen. J. Phys. Chem. 1967, 71, 3842–3845. [Google Scholar] [CrossRef]
- Evans, J.P.; Borland, W.; Mardon, P.G. Pyrophoricity of Fine Metal Powders. Powder Met. 1976, 19, 17–21. [Google Scholar] [CrossRef]
- Angelo, P.C.; Subramanian, R. Powder Metallurgy: Science, Technology and Applications; PHI Learning Private Limited: Delhi, India, 2014. [Google Scholar]
- Ellern, H. Military and Civilian Pyrotechnics; Chemical Publishing Company INC: New York, NY, USA, 1968. [Google Scholar]
- Available online: https://www.ispatguru.com/direct-reduced-iron/ (accessed on 4 March 2021).
- Sista, K.S.; Dwarapudi, S.; Nerune, V.P. Direct Reduction Recycling of Mill Scale through Iron Powder Synthesis. ISIJ Int. 2019, 59, 787–794. [Google Scholar] [CrossRef] [Green Version]
Figure 1.
Different uses of mill scale [19].
Figure 1.
Different uses of mill scale [19].

Figure 2.
Diagram of the reduction and oxidation process of mill scale realized during thermal analysis.
Figure 2.
Diagram of the reduction and oxidation process of mill scale realized during thermal analysis.

Figure 3.
Result of measurement on a scanning microscope Hitachi S-3400N (HITACHI, Tokyo, Japan) equipped with an EDS and WDS detector. On the left, an image of mill scale, on the right, the spectrum of the chemical composition obtained after analysis of the entire area.
Figure 3.
Result of measurement on a scanning microscope Hitachi S-3400N (HITACHI, Tokyo, Japan) equipped with an EDS and WDS detector. On the left, an image of mill scale, on the right, the spectrum of the chemical composition obtained after analysis of the entire area.

Figure 4.
Result of qualitative XRD analysis of examined mill scale.

Figure 5.
Size composition of A and B fractions of tested mill scale.

Figure 6.
TG/DTA curves recorded during the thermal analysis of mill scale from metallurgical process (fraction A) subjected to reduction (carbon monoxide) at 850 °C, 950 °C, and 1050 °C, followed by exposure to an oxidizing atmosphere (synthetic air) at temperatures of 300 °C, 350 °C, and 400 °C.
Figure 6.
TG/DTA curves recorded during the thermal analysis of mill scale from metallurgical process (fraction A) subjected to reduction (carbon monoxide) at 850 °C, 950 °C, and 1050 °C, followed by exposure to an oxidizing atmosphere (synthetic air) at temperatures of 300 °C, 350 °C, and 400 °C.

Figure 7.
TG/DTA curves recorded during the thermal analysis of ground mill scale (fraction B) subjected to reduction (carbon monoxide) at 850 °C, 950 °C, and 1050 °C, followed by exposure to an oxidizing atmosphere (synthetic air) at temperatures of 300 °C, 350 °C, and 400 °C.
Figure 7.
TG/DTA curves recorded during the thermal analysis of ground mill scale (fraction B) subjected to reduction (carbon monoxide) at 850 °C, 950 °C, and 1050 °C, followed by exposure to an oxidizing atmosphere (synthetic air) at temperatures of 300 °C, 350 °C, and 400 °C.

Figure 8.
Average weight loss of studied mill scale during reduction with carbon monoxide at 850 °C, 950°C and 1050 °C—fractions A and B.
Figure 8.
Average weight loss of studied mill scale during reduction with carbon monoxide at 850 °C, 950°C and 1050 °C—fractions A and B.

Figure 9.
Mass increase during oxidation of samples at 300 °C, 350 °C, and 400 °C over 180 min—fractions A and B.
Figure 9.
Mass increase during oxidation of samples at 300 °C, 350 °C, and 400 °C over 180 min—fractions A and B.

Figure 10.
Summary of chemical composition analysis results of mill scale (fractions A and B) subjected to reduction and secondary oxidation process.
Figure 10.
Summary of chemical composition analysis results of mill scale (fractions A and B) subjected to reduction and secondary oxidation process.

Figure 11.
Estimated content of metallic iron in scale samples A and B subjected to thermal analysis.
Figure 11.
Estimated content of metallic iron in scale samples A and B subjected to thermal analysis.


Table 1.
Average chemical composition of tested mill scale.
| Element | C | O | Al | Si | Ca | Mn | Fe | Cr | Cu | Ti | S | P |
|---|---|---|---|---|---|---|---|---|---|---|---|---|
| Mass/% | 0.03 | 12.23 | 0.13 | 0.47 | 0.40 | 0.53 | 85.38 | 0.10 | 0.43 | 0.30 | 0.07 | 0.03 |
| σ | ±0.01 | ±2.66 | ±0.06 | ±0.12 | ±0.10 | ±0.06 | ±0.20 | ±0.02 | ±0.06 | ±0.08 | ±0.01 | ±0.01 |
Table 2.
Mass fraction of phases identified in examined mill scale.
| Phase | Fe | FeO | Fe3O4 |
|---|---|---|---|
| Average mass fraction/% | 0.85 | 47.81 | 51.34 |
Table 3.
Denotations and mass change of mill scale fractions A and B during thermal analysis.
| Sample Denotation | Sample Weight /g | Temperature /°C | Mass Change /% | ||
|---|---|---|---|---|---|
| Reduction | Oxidation | Reduction | Oxidation | ||
| Fraction A | |||||
| A850-300 | 0.2054 | 850 | 300 | −23.15 | 1.35 |
| A850-350 | 0.1911 | 850 | 350 | −21.98 | 3.48 |
| A850-400 | 0.2039 | 850 | 400 | −22.10 | 8.17 |
| A950-300 | 0.1912 | 950 | 300 | −24.90 | 0.90 |
| A950-350 | 0.2067 | 950 | 350 | −25.44 | 2.22 |
| A950-400 | 0.2247 | 950 | 400 | −24.48 | 6.22 |
| A1050-300 | 0.2024 | 1050 | 300 | −26.43 | 0.55 |
| A1050-350 | 0.1932 | 1050 | 350 | −25.89 | 1.77 |
| A1050-400 | 0.2207 | 1050 | 400 | −26.90 | 4.92 |
| Fraction B | |||||
| B850-300 | 0.1957 | 850 | 300 | −21.77 | 1.45 |
| B850-350 | 0.1940 | 850 | 350 | −22.00 | 4.55 |
| B850-400 | 0.2140 | 850 | 400 | −24.28 | 11.44 |
| B950-300 | 0.1950 | 950 | 300 | −24.93 | 1.09 |
| B950-350 | 0.2136 | 950 | 350 | −24.91 | 2.80 |
| B950-400 | 0.1927 | 950 | 400 | −25.48 | 8.10 |
| B1050-300 | 0.1945 | 1050 | 300 | −25.89 | 0.75 |
| B1050-350 | 0.2076 | 1050 | 350 | −25.94 | 2.10 |
| B1050-400 | 0.2200 | 1050 | 400 | −26.11 | 5.23 |
Publisher’s Note: MDPI stays neutral with regard to jurisdictional claims in published maps and institutional affiliations. |
© 2021 by the authors. Licensee MDPI, Basel, Switzerland. This article is an open access article distributed under the terms and conditions of the Creative Commons Attribution (CC BY) license (https://creativecommons.org/licenses/by/4.0/).
Share and Cite
MDPI and ACS Style
Nowacki, K.; Maciąg, T.; Lis, T. Recovery of Iron from Mill Scale by Reduction with Carbon Monoxide. Minerals 2021, 11, 529. https://0-doi-org.brum.beds.ac.uk/10.3390/min11050529
AMA Style
Nowacki K, Maciąg T, Lis T. Recovery of Iron from Mill Scale by Reduction with Carbon Monoxide. Minerals. 2021; 11(5):529. https://0-doi-org.brum.beds.ac.uk/10.3390/min11050529
Chicago/Turabian StyleNowacki, Krzysztof, Tomasz Maciąg, and Teresa Lis. 2021. "Recovery of Iron from Mill Scale by Reduction with Carbon Monoxide" Minerals 11, no. 5: 529. https://0-doi-org.brum.beds.ac.uk/10.3390/min11050529
Note that from the first issue of 2016, this journal uses article numbers instead of page numbers. See further details here.