Article

Uranium Deposits of Erlian Basin (China): Role of Carbonaceous Debris Organic Matter and Hydrocarbon Fluids on Uranium Mineralization

1
State Key Laboratory of Nuclear Resource and Environment, East China University of Technology, Nanchang 330013, China
2
CNNC Key Laboratory of Uranium Resource Exploration and Evaluation Technology, Beijing Research Institute of Uranium Geology, Beijing 100029, China
3
Geologic Party No.208, China National Nuclear Corporation, Baotou 014010, China
*
Authors to whom correspondence should be addressed.
Submission received: 2 April 2021 / Revised: 8 May 2021 / Accepted: 14 May 2021 / Published: 18 May 2021
(This article belongs to the Special Issue Geology of Uranium Deposits)

Abstract

:
The relationship of sedimentary organic matter, oil-gas and sandstone-type uranium (U) deposits is the key problem of U-mineralization. Whether migrate hydrocarbons participate in U-mineralization is still a controversy. Typical U deposits of the Erlian Basin in northeast China have been investigated through detailed petrography, mineralogical, micro spectroscopic, organic geochemical and C-isotope studies. Petrographic observations, Microscopic Laser Raman Spectroscopic, Infrared Spectroscopic and Scanning Electron Microscope analyses indicated there are three types of organic matter (including carbonaceous debris and migrated hydrocarbons). A significant amount of uranium was associated with pyrites, clay minerals and carbonaceous debris organic matter, either coexisted with hydrocarbon fluids. There are at least two stages mineralization events, stage I is related to sedimentary organic matter (syngenetic pre-enrichment stage), and stage II is related to mobile hydrocarbon fluids (main mineralization stage). Therefore, our results support that migrated hydrocarbons were involved as a reducing agent for the main uranium mineralization after synsedimentary mineralization.

1. Introduction

Sandstone-type uranium deposits account for about 40% of the currently discovered deposits [1]. Since the 1980s, China has gradually focused on a search for economically recoverable in-situ leachable sandstone-type uranium deposits in Mesozoic sedimentary basins. The Erlian Basin is one of the large Mesozoic continental sedimentary basins in North China; it is located at the southeastern edge of the Central-Asia Uraniferous Province (CAUP). The CAUP is one of the largest metallogenic provinces in the world with uranium ore deposits located from the Transbaikal region in Russia, in southern Kazakhstan, in Uzbekistan, in Mongolia and North China [2]. Several large in-situ leachable sandstone-hosted uranium deposits (e.g., Bayanwula, Saihangaobi, Hadatu) and mudstone-hosted uranium deposits (e.g., Nuheting) with poor economic value at present were found in the Erlian Basin.
In Erlian Basin, researchers have carried out work in sedimentology [3,4], mineralogy [5,6], geochemistry [7,8] etc., including some research on the genesis of the deposit [9,10]. Several metallogenic models have been proposed for the origin of deposits. There is a consensus by all metallogenic models for roll front deposits, that U is transported by oxidizing groundwater; different origins of the reductant for precipitation of U and associated elements result in three broad subfamilies of genetic models [10]. The first model declared that sedimentary organic matter (OM) was inherited from carbonaceous debris (ancient plants, e.g., ZoovchOvoo basin, Mongolia) [11,12]. The second model emphasized that migration hydrocarbon bearing basinal fluids (e.g., oil, CH4, H2S etc.) are introduced into sandstone without inherited sedimentary OM (e.g., Franceville basin, Gabon) [13,14]. It is unclear whether the migrated hydrocarbon fluids are involved in U-mineralization in Erlian Basin. Taking the Nuheting deposit as an example, Li and Kuang (2010), Bonnetti (2015) regarded as hydrocarbon fluids did not participate in uranium mineralization [12,15], whereas Niu et al. (1995) and Zhang et al. (1996) hold the opposite opinion, they argued for a genetic relationship between oil-gas fields and uranium mineralization, hence favoring an epigenetic mineralizing process [16,17]. In addition, Wang (2016) discovered the symbiosis of bitumen and uranium minerals in the Saihangaobi deposit, providing evidence that hydrocarbon fluids participate in U-mineralization [18]. In fact, many petroleum reservoirs have been discovered under the layers of uranium deposits in Erlian Basin [19,20,21]. The petroleum reservoirs are closely related to uranium deposits in terms of spatial distribution, but it is unclear whether they are genetically related.
In this paper, we carried out the studies of petrography, mineralogy, C isotope and biomarker compounds by methods of optical microscopy, fluorescence microscopy, scanning electron microscope with X-ray energy dispersive spectrometer (SEM-EDX), microlaser Raman and Infrared spectroscopy, gas chromatography with mass spectroscopy (GC-MS) and Elemental Analysis with Gas Isotope Mass Spectrometer (EA-GIMS). The purpose of this paper is to focus on genetic relationships between carbonaceous debris OM, migration hydrocarbon fluids and U-mineralization.

2. Geological Setting

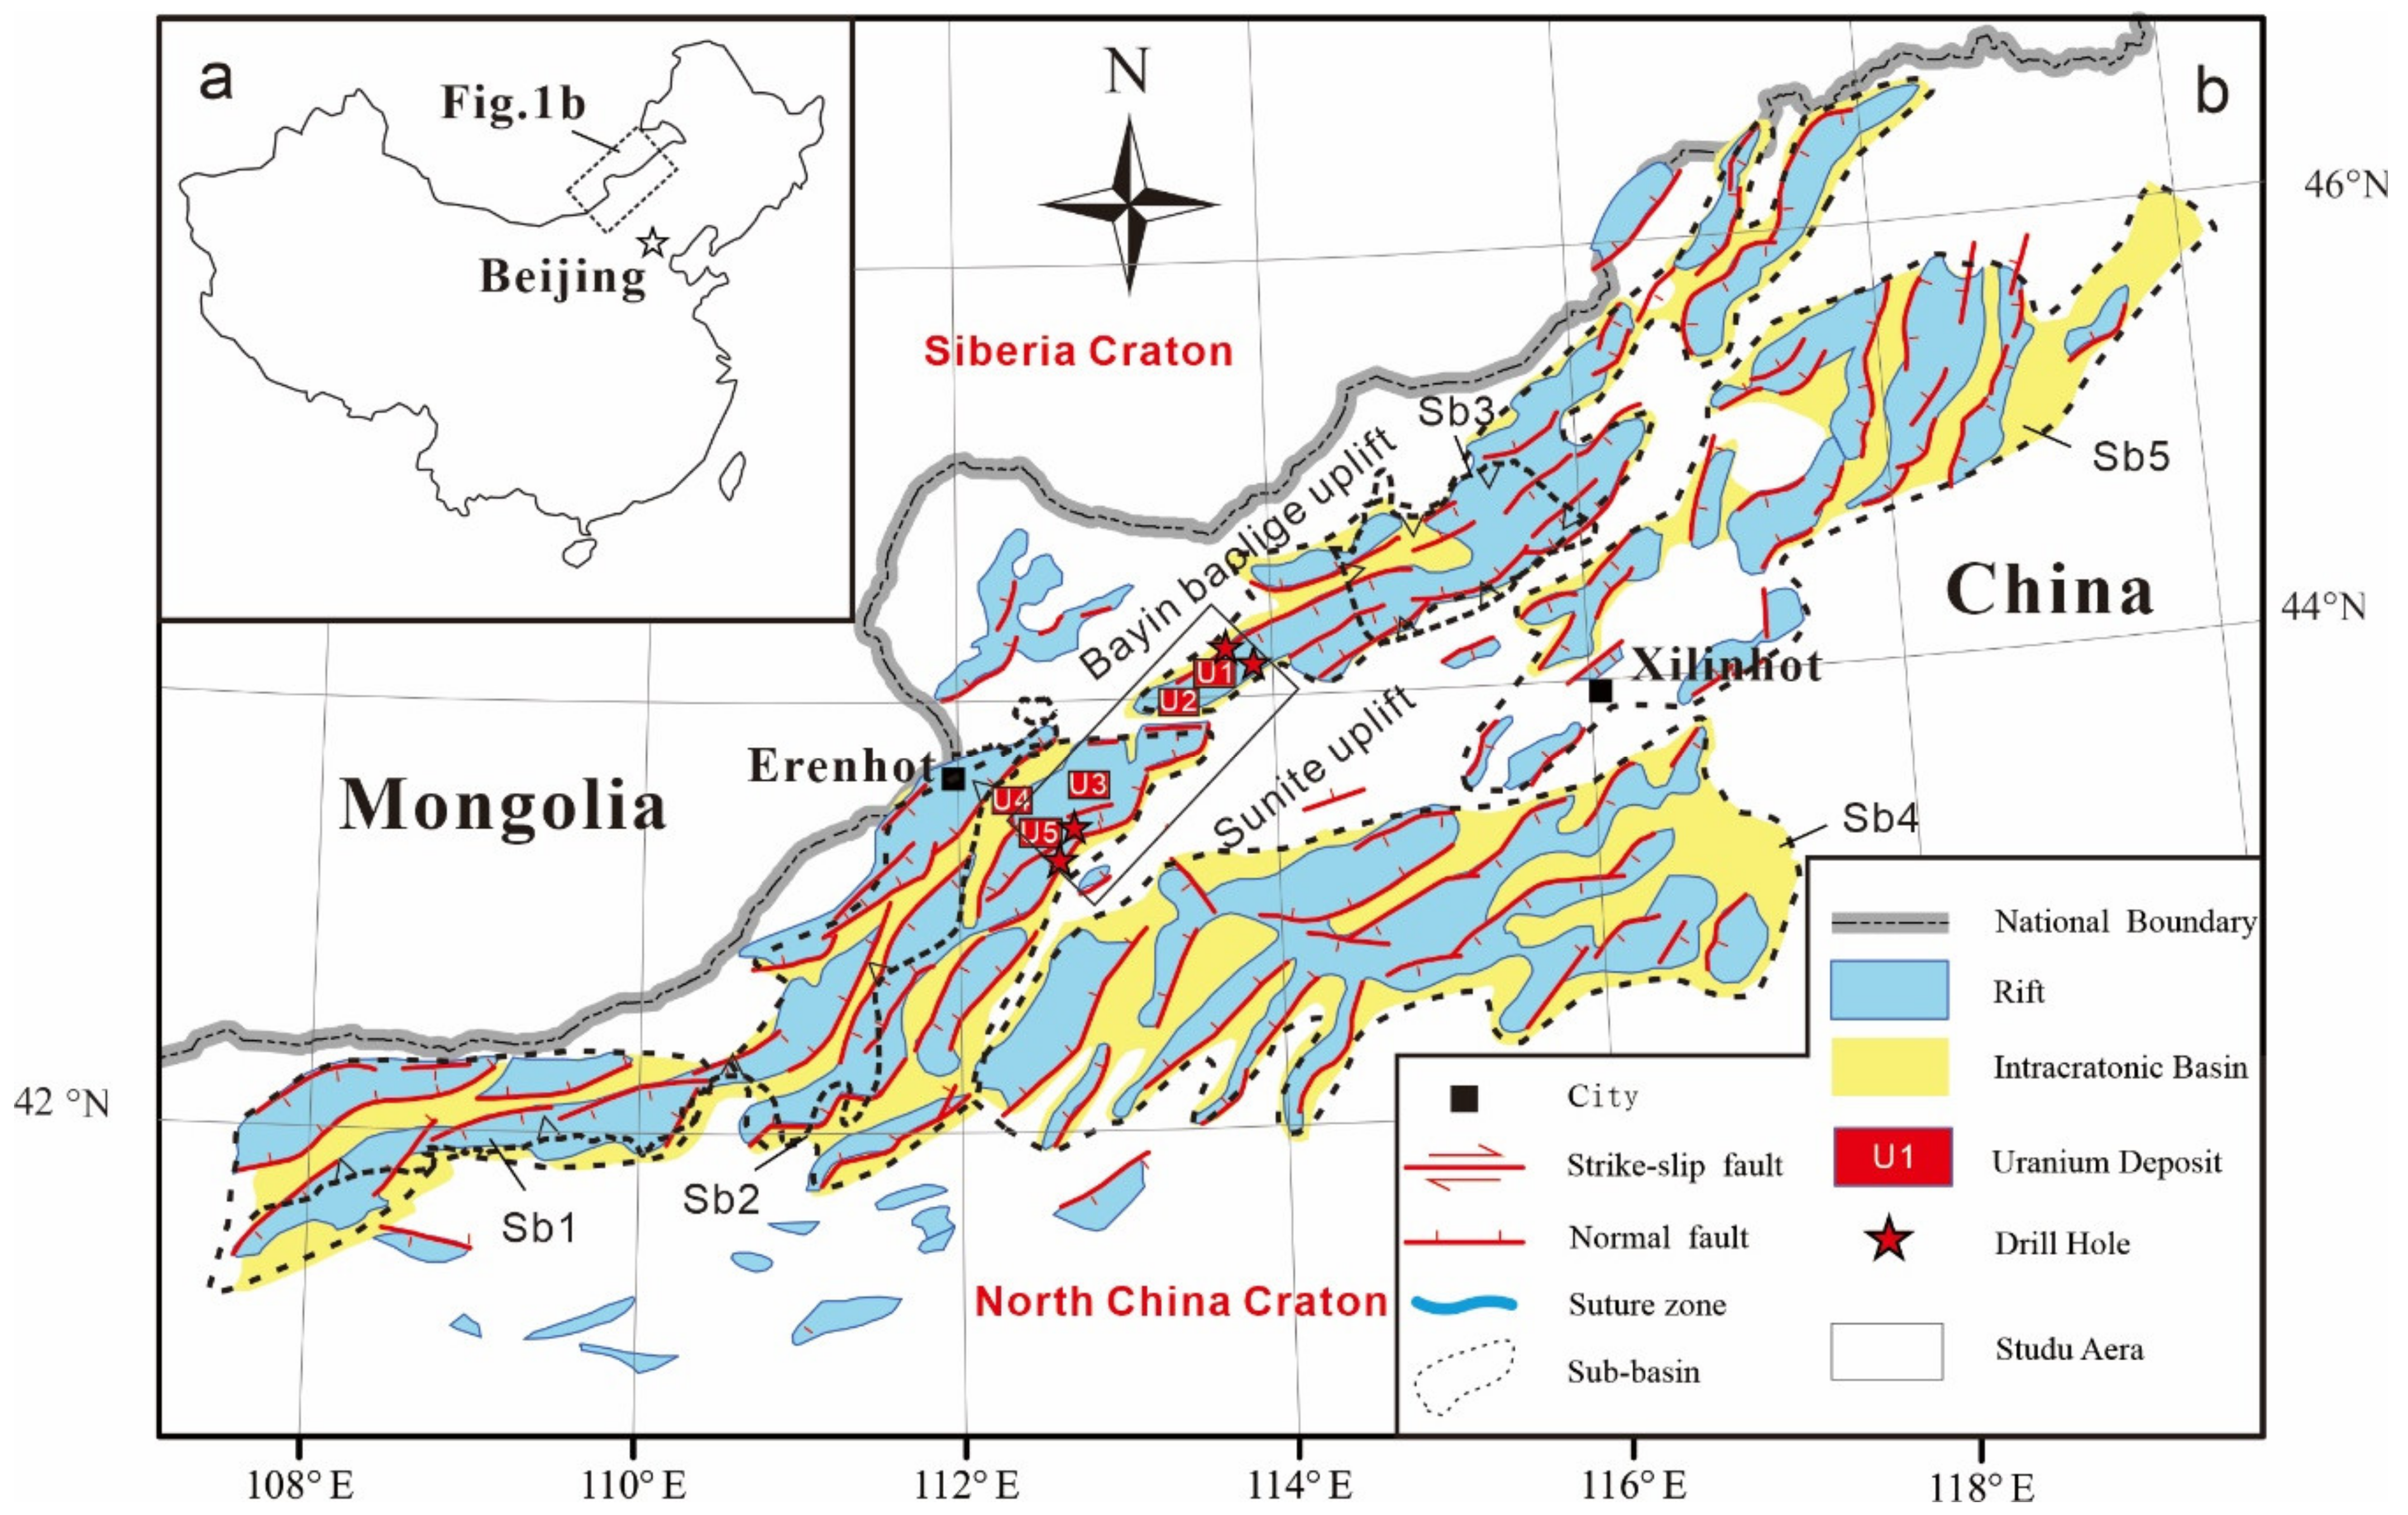
2.1. The Erlian Basin

The Erlian Basin is located in northeast China, Inner Mongolia, close to the border between China and Mongolia. It is located at the junction of the Siberian plate and the North China plate (Figure 1a), covering an area of approximately 110,000 km2 [22,23]. The Erlian basin is divided into six secondary tectonic units of “five Sub-basins and one uplift” [23]. From southwest to northeast, it includes the Chuanjing sub-basin, Wulanchabu sub-basin, Manite sub-basin, Tengge’er sub-basin and Wunite sub-basin, and the Sunite uplift spreads along the north-east direction in the central part [24,25] (Figure 1b).
The Erlian basin lies on a folded metamorphic basement corresponding to the southern margin of the Xing’an or Xingmeng Mongolian orogenic belt, and developed as a rift-type basin in the late Mesozoic [26]. The basement of the basin is composed of Ordovician-Permian strata, which are composed of metasandstone, slate, carbonate and volcanic tuff [25]. High uranium contents (3–13 ppm) of basement volcanic rocks and granites are argued to provide uranium sources [26,27]. The basin is filled with Jurassic and Cretaceoussediments, which comprised lacustrine and fluvial deposits.

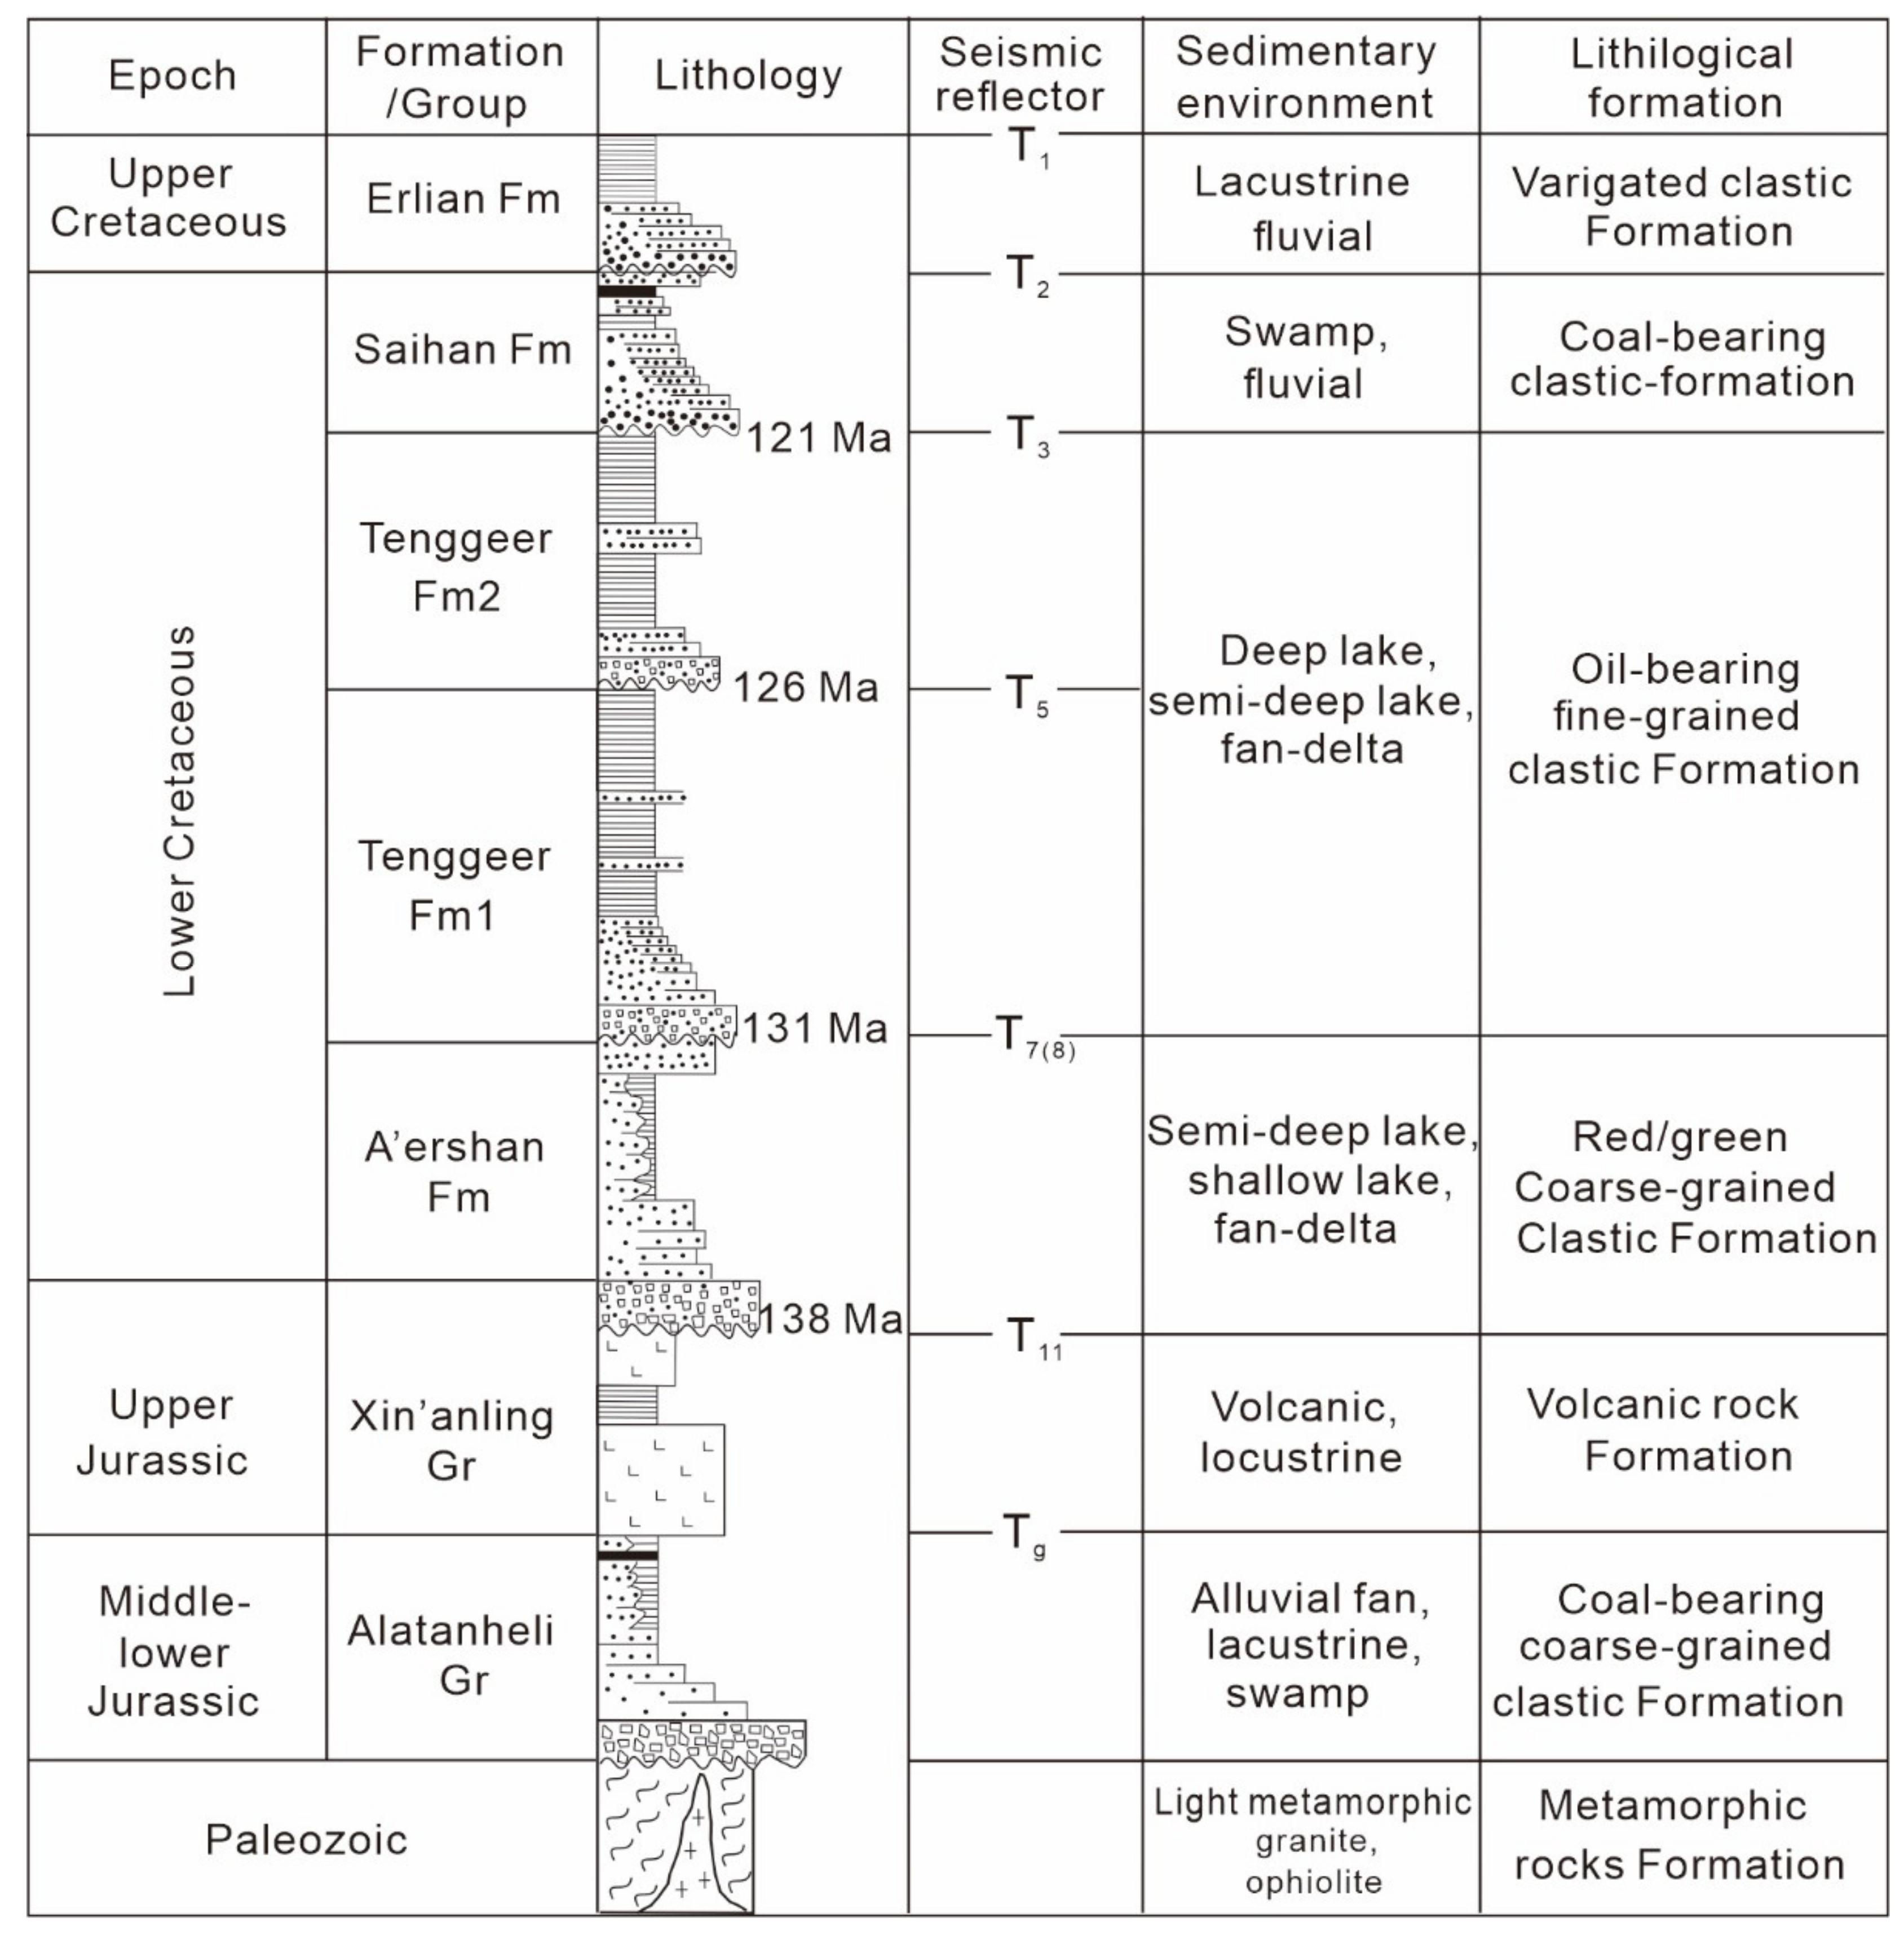
2.2. Tectonic Evolution and Basin Filling

Erlian basin have been tectonically inverted during the late stage of the Early Cretaceous, the tectonic stages of the basin can be divided into two stages [29]. In the early to middle Jurassic (stage 1), tectonism is characterized by volcanic eruptions along the NE- and NNE-trending large-scale faults, which produced volcanic assemblages of basalt, andesite, trachytic andesite, quartz trachytic andesite, and rhyolite [25,29]. During this stage a series of volcanic rocks, coarse-grained clastic rocks and coal-bearing clastic rocks deposited in the Erlian Basin. During the Early Cretaceous (stage 2), tectonism is characterized by fault-controlled sub-basins filled with large amounts of coal-bearing clastic rocks [25,29].
Jurassic and Cretaceous continental sediments of fluvial and alluvial-deluvial provenance fill the basin.The cover formation is mainly composed of Alatan-Heli Group of the Middle-Lower Jurassic (J1-2al), Lower Cretaceous Arshan Fm (K1a) and, Tenge’ger Fm (K1t), Saihan Fm (K1s), Erlian Fm (K2e) of upper Cretaceous and Yierding-Manha Fm of Eocene Series (E2y) [25], the stratigraphic column is listed as Figure 2. The Aershan, Tenggeer, and Saihan formations (Fms) were developed throughout the Erlian Basin. Arshan Fm and Tenge’ger Fm are formed in deep or semi deep lake sedimentary environment with the thickness above 1000 m, and comprised of fine-grained clastic rocks contained oil [30]. The Saihan Fm are comprised of ash-color coarse clastic rocks which is the main uranium mineralization section of paleochannel sandstone-type deposits, it is formed in swamp and fluvial sedimentary environment with the thickness of 200–1200 m [30].

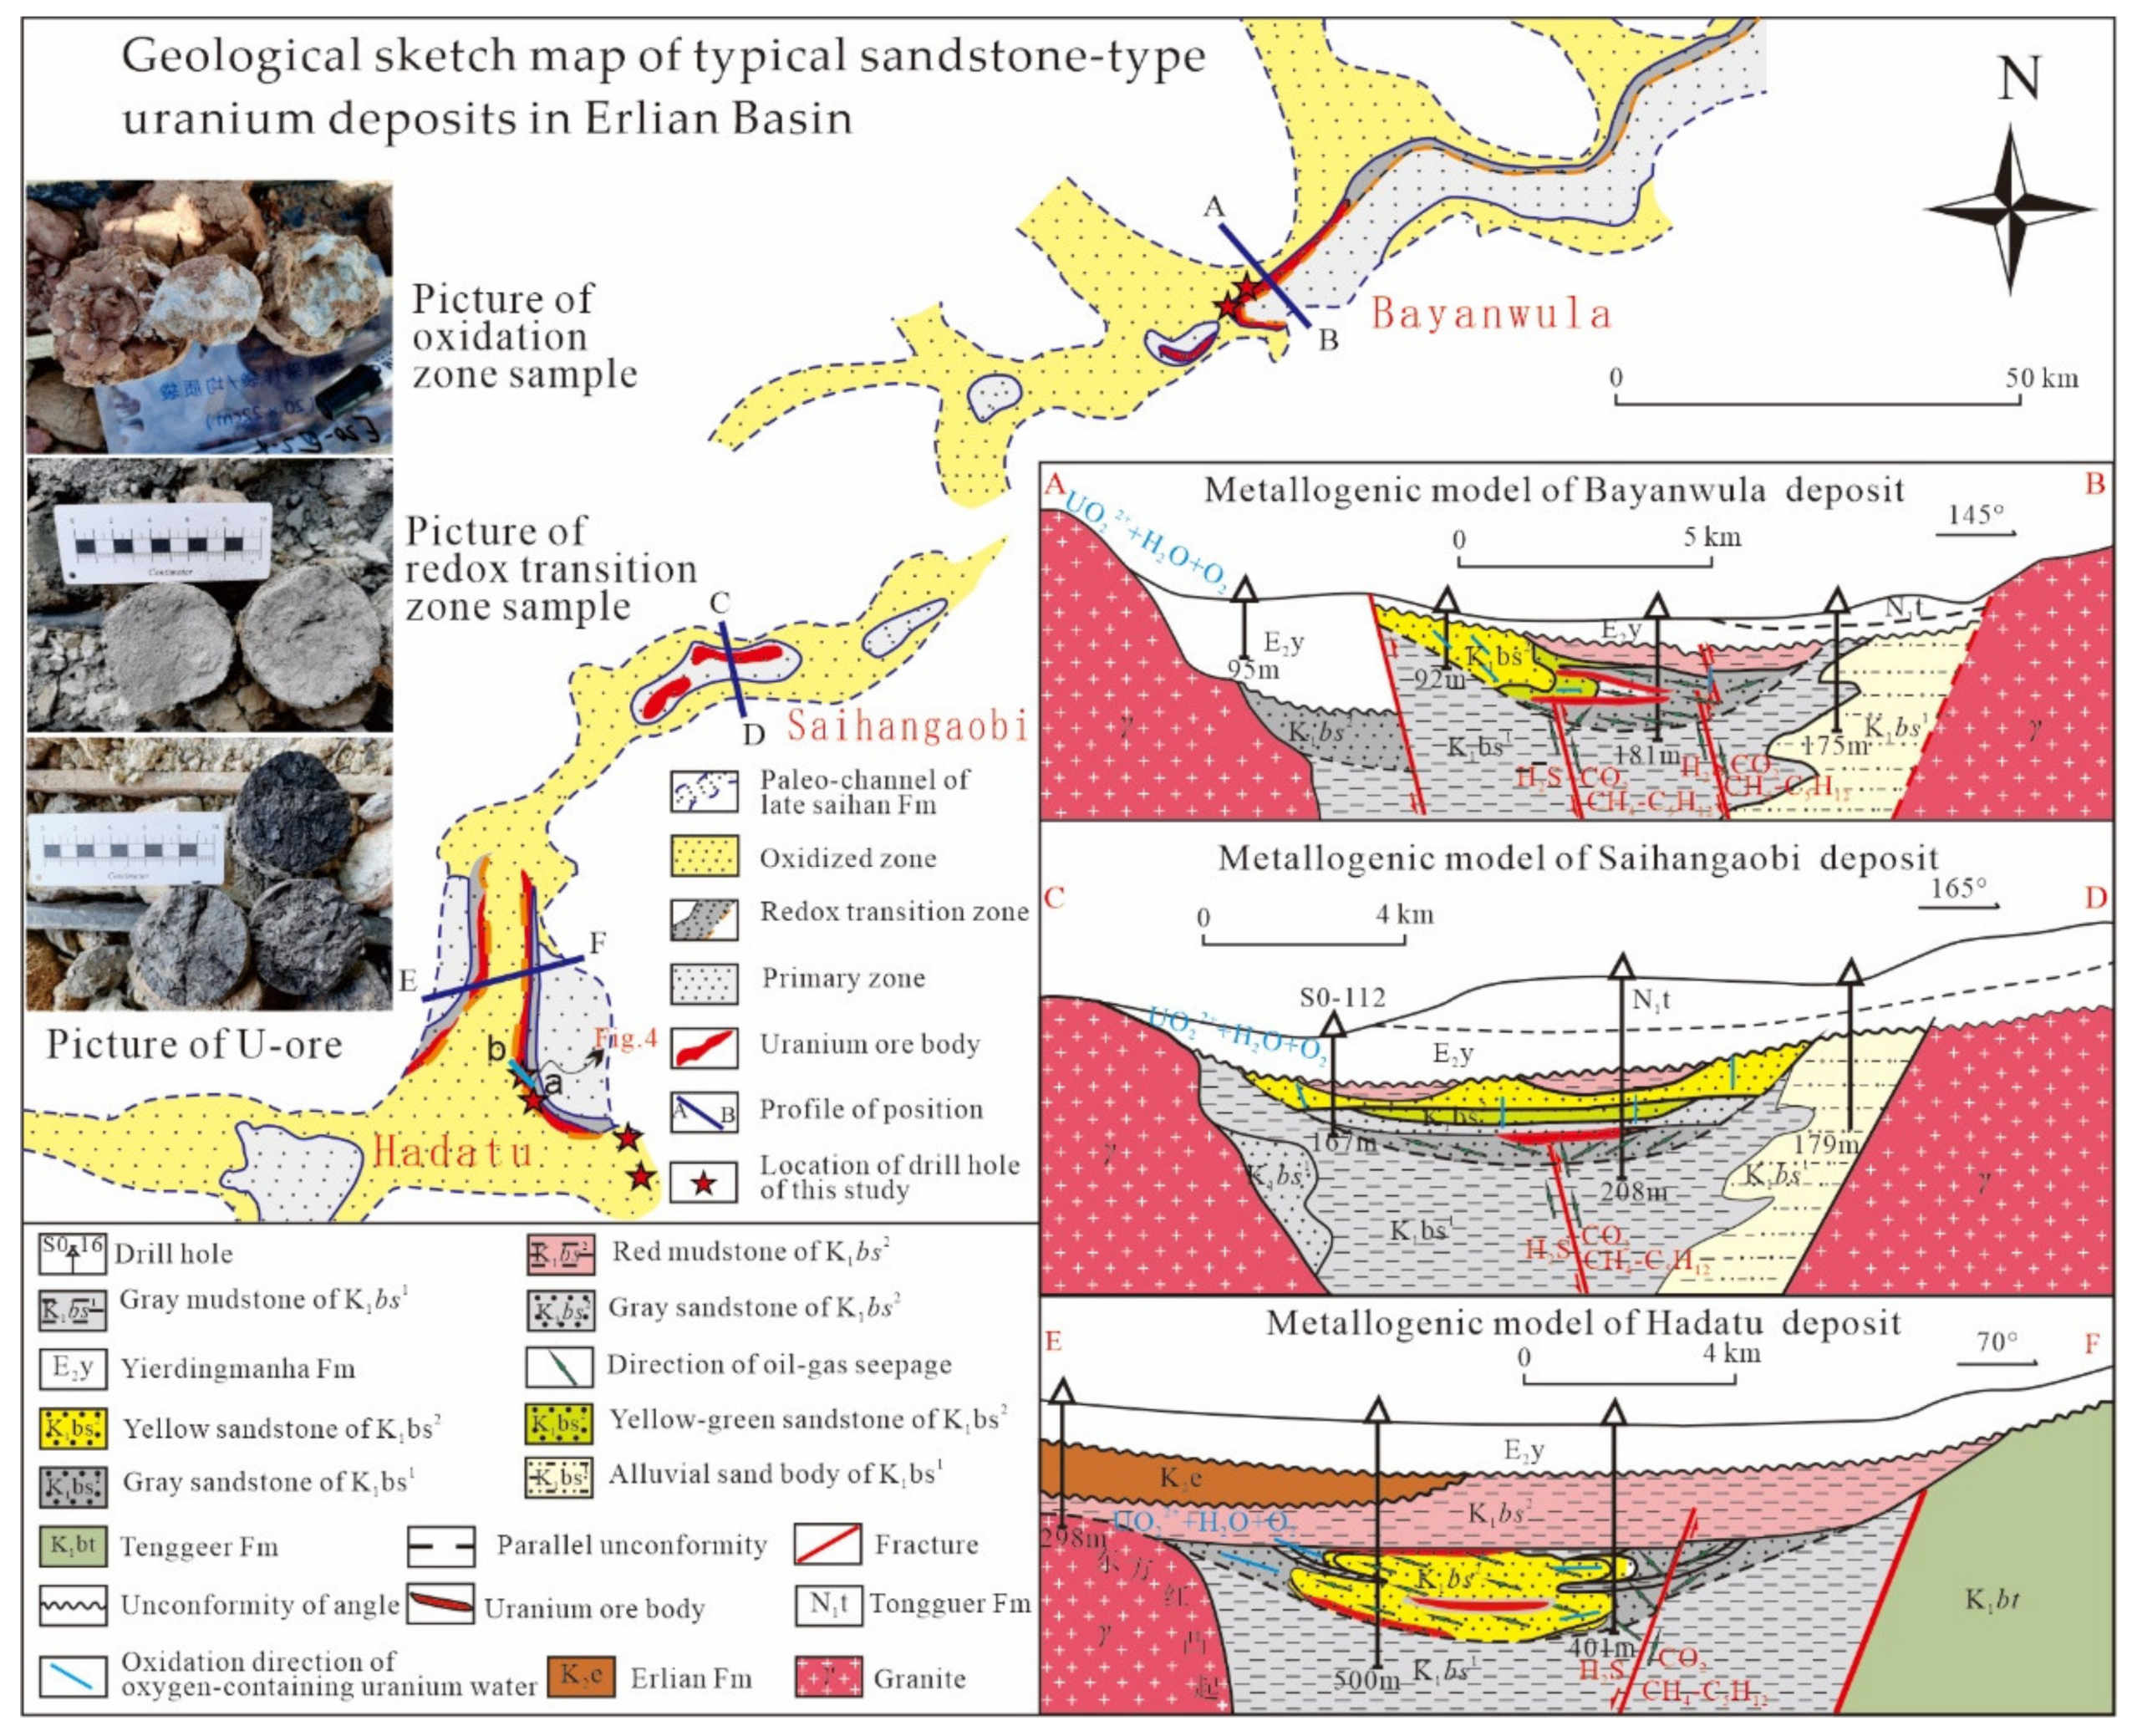
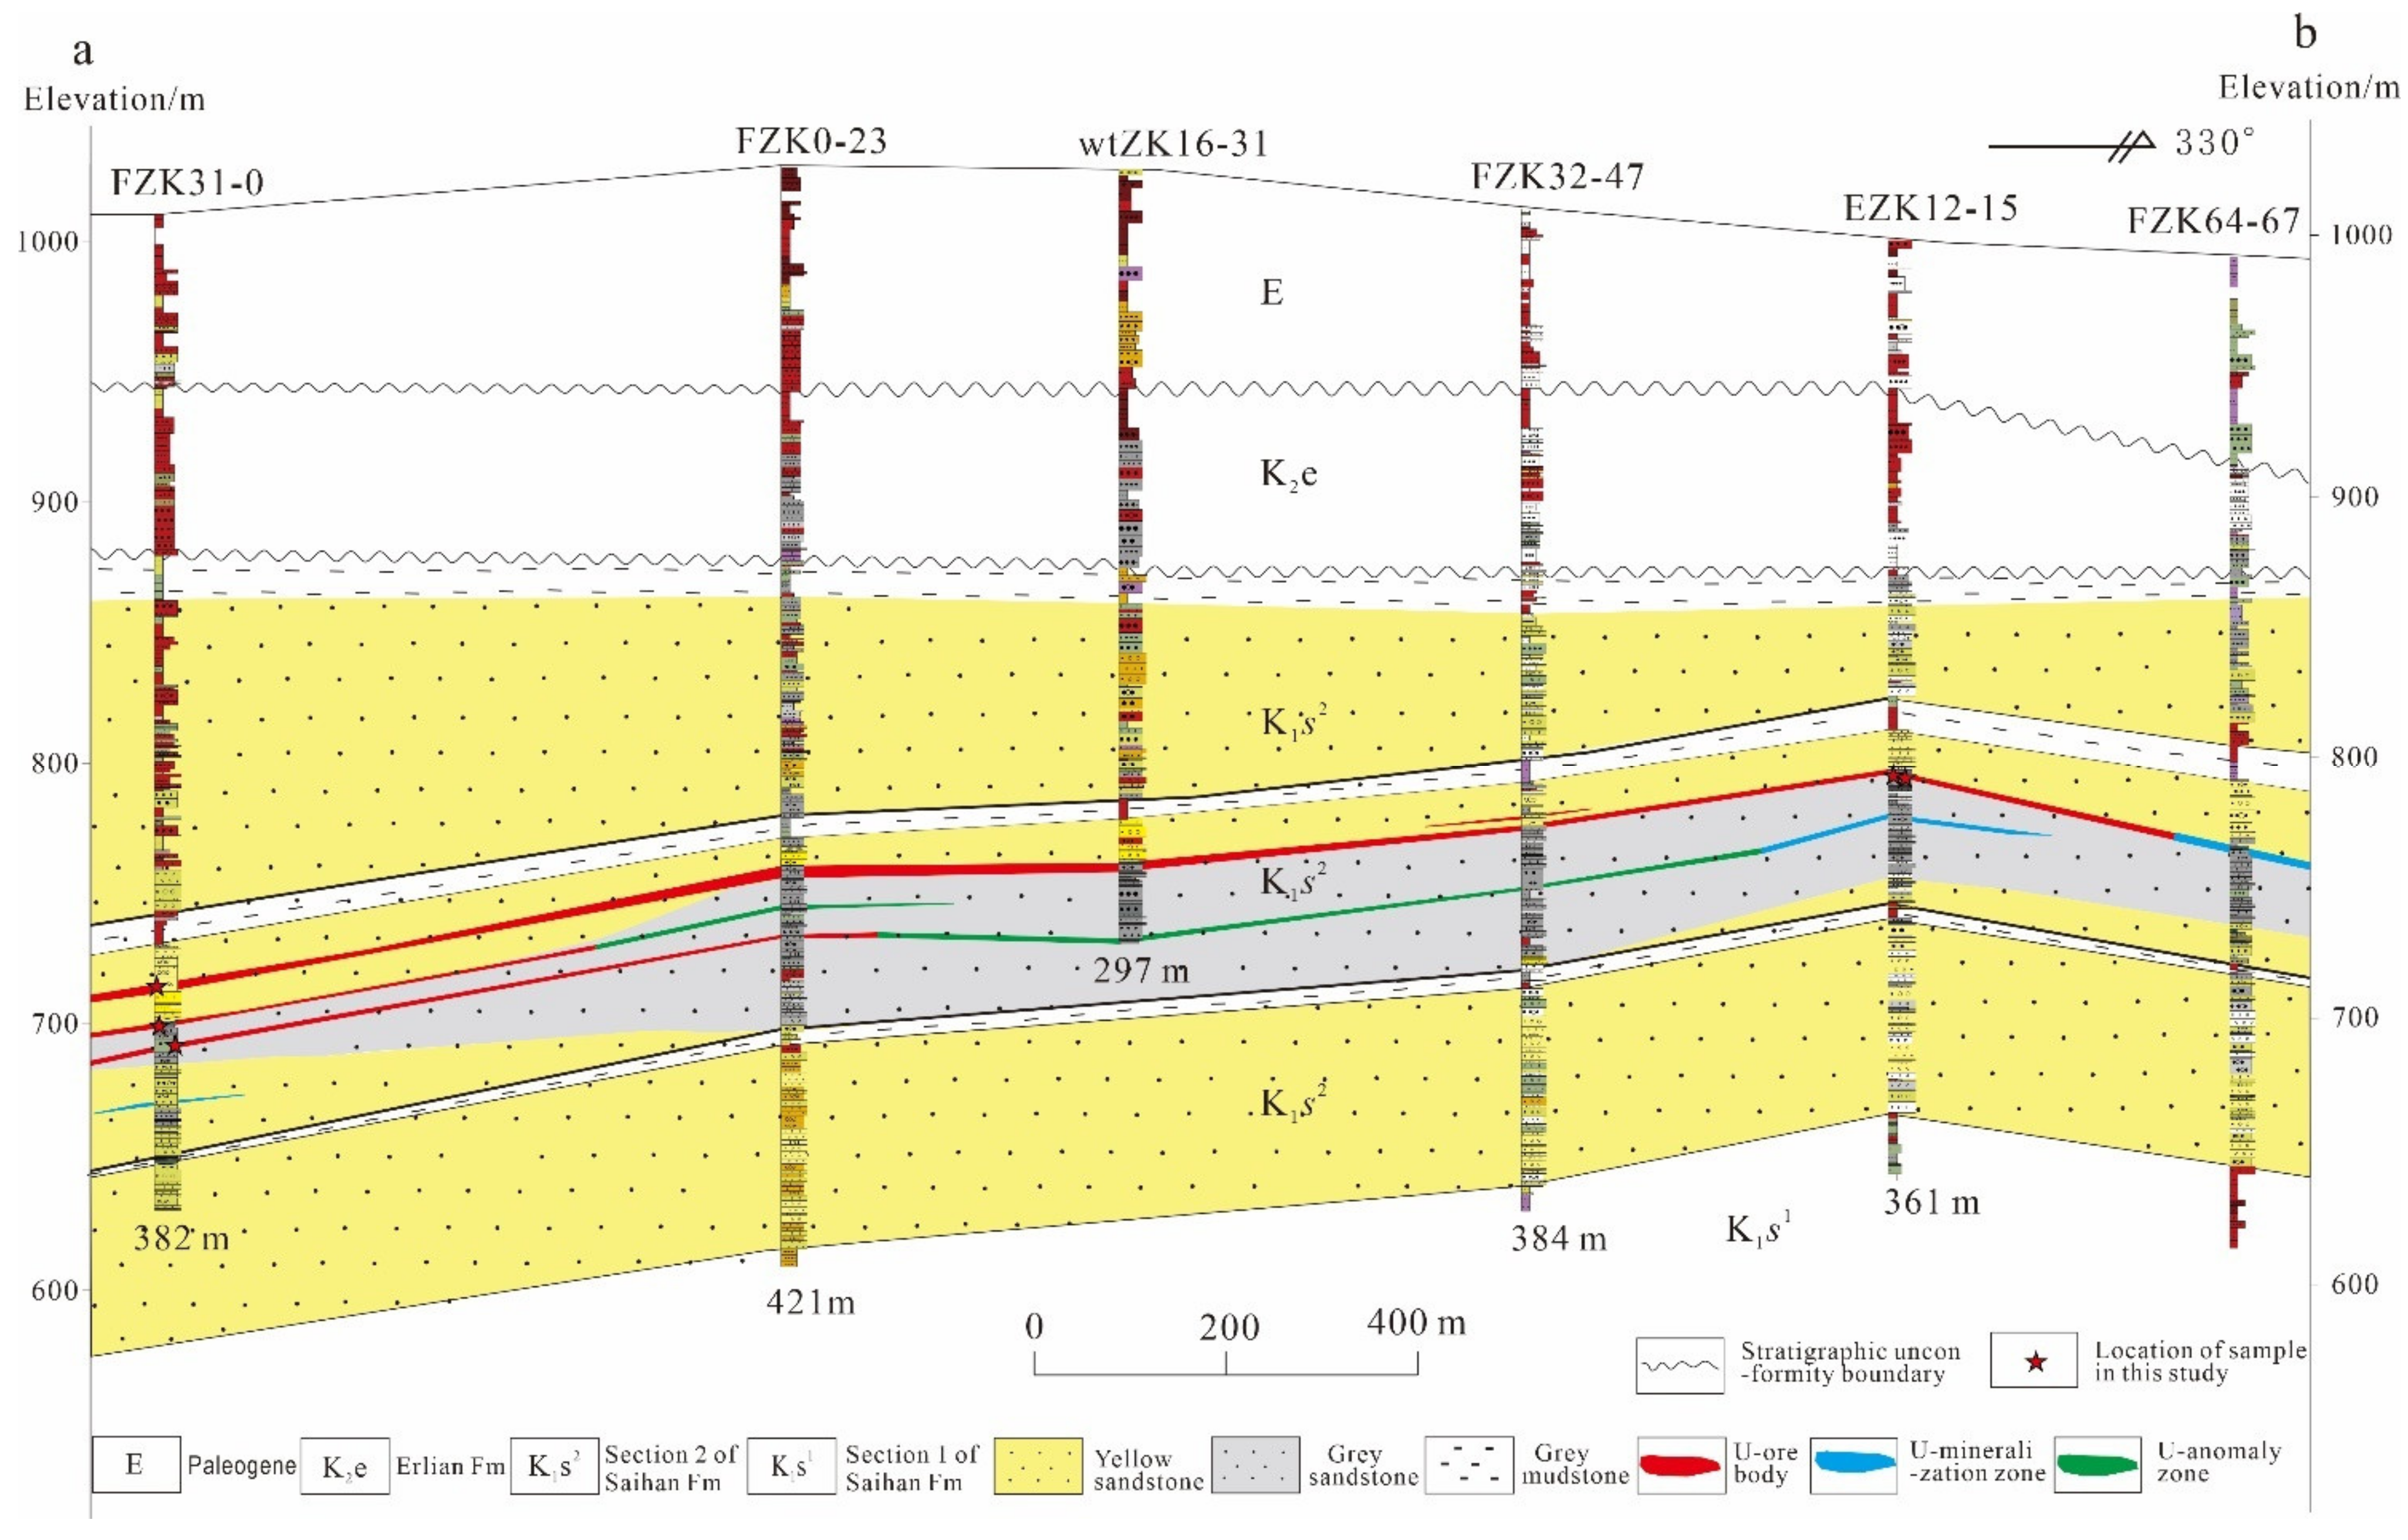
2.3. Sandstone-Type Uranium Deposits

Since 1990s, four medium-large sandstone-type uranium deposits (e.g., Bayanwula, Hadatu, Manglai, Saihangaobi) and one mudstone-type uranium deposit (e.g., Nuheting) have been discovered in the Erlian Basin, and many uranium mineralization drill holes have been discovered around the periphery of the deposits, estimated exceed ~20,000 tons of U in total at an average grade of 0.01–0.05% U [31]. All of the sandstone-type uranium deposits are located in the paleo-channels in the Manite and Wulanchabu sub-basins (Figure 1b), the location of uranium deposits is spatially consistent with oil–gas reservoirs. The paleo-channels are sandwiched between the Sunite and Bayinbaolige uplifts.
The positioning of paleochannel sandstone-type uranium deposits is controlled by scale, sedimentary microfacies, oxidation zone, and reduction capacity of paleochannel (Figure 3) [32]. In the Erlian Basin, the typical sandstone-type U deposits that have been discovered so far include the Hadatu deposit, the Bayanwula deposit and the Saihangaobi deposit, all of which have reached the scale of medium—large deposits. The ore-bearing stratum is mainly Saihan Fm, followed by Yierdingmanha Fm. The lithology of ore-bearing stratum is mainly yellow and gray gravel-bearing medium coarse sandstone, coarse sandstone and mudstone interbeds, the upper part of the ore body is mainly red mudstone and argillaceous siltstone, the lower part of the ore body is grey carbonaceous mudstone or grey-green argillaceous siltstone [32,33]. Alterations include hematitization, limonite, chloritization and kaolinization [25,30,32,33]. Ore bodies have various forms in different deposits, most of ore bodies are tabular -shaped, and part of ore bodies are lenticular-shaped (Figure 4). The main ore body distributed in a NE direction and continuous in the strike, which is basically same as the distribution of the paleo-river valley. The length of the ore body is 300 to 5500 m, and the thickness of the ore body is 0.50 to 22 m [33]. The surrounding rocks of the ore body are generally yellow, red or yellowish green, the mineralized rocks are gray and dark gray, and the extra-rich uranium ore is black (Figure 3). The grade of uranium ore is generally 0.01% to 0.2%, and the grade of extra-rich uranium ore can reach more than 1% [31,32]. Most of the uranium mineralization mainly occurs in the clastic sediments of fluvial facies containing abundant organic matter [30], U-mineralization is described as possibly related to paleo-phreatic oxidation fluids, sedimentary organic matter, and reducing hydrocarbon fluids [32]. Mineralized sandstones have elevated background values of Re, Se, Mo, Sc and V, which correlate positively with U [34].

3. Sampling, Analytical Procedures and Methods

3.1. Samples

The more than fifty samples of this study were collected from the several drill holes distributed along a profile oriented perpendicular to the main geochemical and mineralogical zoning of Hadatu deposit, Bayanwula deposit and exploration area outside the deposits. Before the indoor studies, the samples were carefully observed, photographed and described. Mineralogical, Micro molecular spectroscopy, organic geochemical studies were carried out on the samples.

3.2. Mineralogical Study

Fifteen samples were selected for Mineralogical study, which includes 8 ore-bearing sandstone samples, 5 reduction zone sandstone samples and 2 mudstone samples, and microprobe section and fluid inclusion section were made. Detailed mineralogical studies (i. e., microscopic observation, SEM-EDX and electron microprobe (EPMA) analysis were conducted at the Laboratory of division of geology and mineral resources, Beijing Research Institute of Uranium Geology.

3.2.1. SEM and EDX Analysis

Back scattered electron (BSE) images and elements Mapping images were obtained on microprobe section from VEGA3 scanning electronic microscope (TESCAN, Brno, Czech Republic). The analytical conditions include a 20 kV voltage accelerating, a 15 μA beam intensity. EDX Analysis was conducted by EDAX TEAM energy dispersive spectrometer (AMETEK, CA, USA) with the following parameters: single point acquisition time of 200 μs, the input CPS was more than 20,000, and the dead time was less than 30%.

3.2.2. EPMA Analysis

The EPMA analysis were obtained on microprobe section from a JXA-8100 electron microprobe (JEOL, Tokyo, Japan). The analytical conditions include a 15.0 kV accelerating voltage, a 2 μm beam diameter, a counting time of 15 s and a current of 2.00 × 10⁻⁸ A. The calibration was made against natural and synthetic oxides or alloys (orthoclase, albite, MnTiO3, wollastonite, hematite and olivine), the detection limits is between 0.01% and 0.05% (with slight changes at different test conditions, different elements). Micro spectroscopy analysis was conducted at the analytical Laboratory of Beijing Research Institute of Uranium Geology.

3.3. Micro Spectroscopy Analysis of Organic Matter

Micro spectroscopy analysis of OM was analyzed by microlaser Raman spectroscopy and Mid-IR spectroscopy. Micro spectroscopy analysis was also conducted at the Laboratory of division of geology and mineral resources, Beijing Research Institute of Uranium Geology.

3.3.1. Raman Microprobe Spectroscopy

The thin section samples were placed on the stage of an BX-41 microscope (Olympus, Tokyo, Japan) that is equipped with10× to 100× objectives which are a part of the Evolution type laser Raman microscope system (HORIBA, Tokyo, Japan), as well as an electronic cooled CCD detector, an illuminant system, and a filter system. The Raman spectra were excited by 532 nm YAG laser at a resolution of 1 cm−1 with the following parameters: 100× objectives, scanning range between 100 and 4000 cm−1, a grating of 1800 gr/mm, gaining a single point in 8 s, and accumulating for 4 times. The spectrum was calibrated using the 520.7 cm−1 lines of a silicon wafer. Data processing and spectral manipulation such as smoothing, peak analyzing, and baseline correcting were performed using the software Labspec 6 of Horiba.

3.3.2. IR Spectroscopy

Mid-infrared spectra were obtained using a LUMOS micro Fourier transform infrared (FTIR, Bruker, Karlsruhe, Germany) within an ATR model. The spectra were obtained after 64 scans with a scanning range between 4000 and 640 cm−1 and a resolution of 4 cm−1. Data processing and spectral manipulation such as smoothing, baseline adjustment, normalization and band component analysis were performed using the special software OPTU 7.5 as an accessory instrument.

3.4. Organic Geochemical Studies

The ore samples were crushed to 80 mesh (Φ = 0.18 mm) and extracted with trichloromethane for 72 h to collect the chloroform bitumen A (Bitm-A), refers to Soxhlet extract procedure. The extracts were separated into saturated, aromatic and polar (NSO) fractions. The saturated and aromatic hydrocarbon fractions were prepared for the next analysis.

3.4.1. GC-MS Analysis

GC-MS analysis was performed using an 5977A gas chromatograph-mass spectrometer (Agilent, Santa Clara, CA, USA). The column used a HP-5 fused silica capillary column (60 m × 0.25 mm × 0.25 μm i.d.). The GC oven was held isothermally at 120 °C for 2 min, programmed to 300 °C at 4 °C/min and then remained at this temperature for 12 min. The solvent is n-hexane, helium is used as the carrier gas, and the pressure is 15.475 psi, Take the standard substance perfluorotributylamine as a reference.

3.4.2. C Isotope Analysis

C isotope analysis of extracts was performed using a system composed of Flash 2000 element analyzer (Thermo Fisher, Waltham, MA, USA) and Delta v Plus gas isotope mass spectrometer (Thermo Fisher, Waltham, MA, USA). Prepare the extract samples drying in oven for 24 h at 70 °C, were wrapped in a tin cup to be converted into CO2 in Flash 2000 Element analyzer. Then, the CO2 is brought into the gas isotope mass spectrometer to test the carbon isotope composition by helium through the online pipeline. The column used was a SS fused silica capillary column (3 m × 6 mm × 5 mm i.d.). The oxygen-passing reaction time is 3 s, and the temperature of the reaction furnace is 960 °C. Helium was the carrier gas and CO2 were used as a reference gas (GBW04407, GBW04408 and IAEA-600). The standard deviation of the EA-GIMS for each measurement was less than 0.2 %.
Among the above-mentioned laboratories, the extraction experiment (Bitm-A) and GC-MS analysis were carried out in the State Key Laboratory of Oil and Gas Reservoir Geology and Exploitation, Chengdu University of Technology, and other experiments were carried out in Beijing Research Institute of Uranium Geology.

4. Results

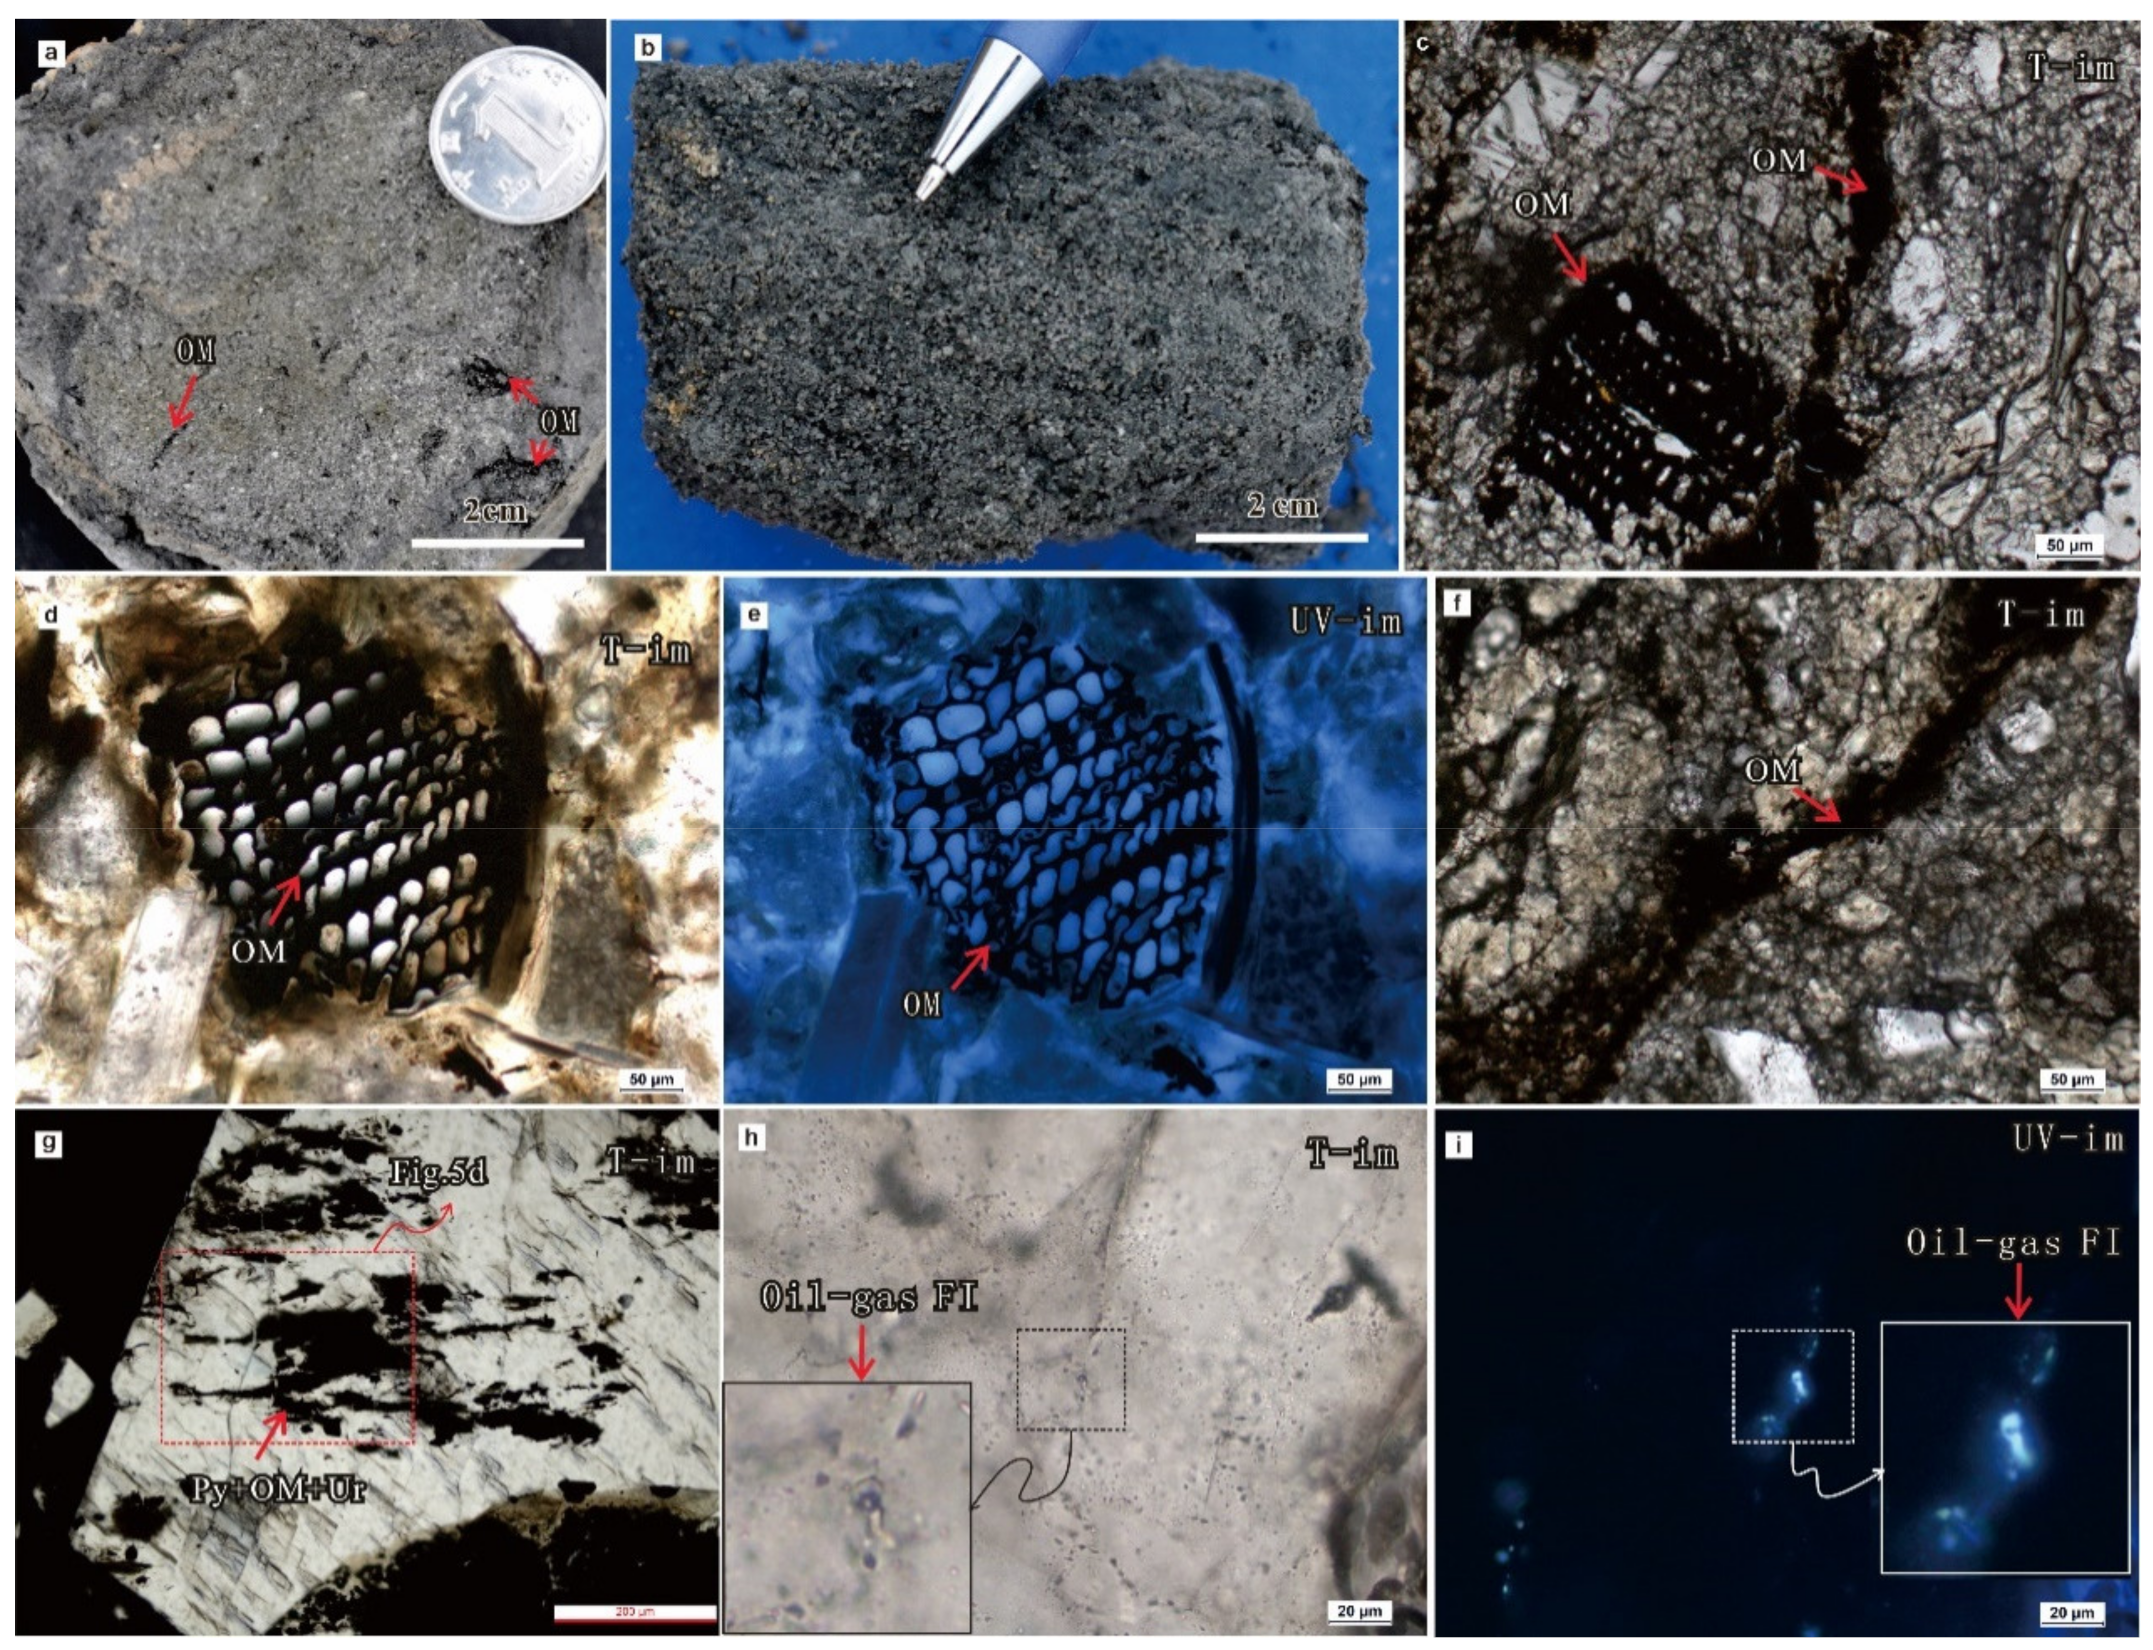
4.1. Petrography and Mineralogy

Drilling cores show that U-rich sandstone is generally black and dark grey, and some are rich in carbonaceous debris (fragments of ancient plants), and the other not (Figure 5a,b). Ore-bearing sandstone ore is mainly composed of quartz, feldspar and carbonate minerals, rich in pyrite and OM (Figure 5). Three forms of OM were observed in U-bearing sandstone and reduction zone sandstone, the first type OM (type-I) has the characteristics of plant cell structure, which should come from inherited OM (fragments of ancient plants) sedimented and scattered into the sandstone (Figure 5c,d). The second type OM (type-II) presents the evidence of mobility and migration (Figure 5c,e), being distributed along micro fracture of U-bearing sandstone. The third type OM (type-III) also presents the characteristics of mobility and migration, as it is distributed in dissolution voids of detrital minerals (calcite, barite, feldspar, etc.) of high-grade ore (Figure 5g). Under the UV fluorescence, most of the OM in the samples does not fluoresce, part of U-bearing sandstone samples shows light blue fluorescence (Figure 5e), and some oil-gas (hydrocarbon) fluid inclusions showing strong light blue fluorescence were observed in the micro-fractures of quartz (Figure 5h,i).
In the core of the drilled hole (exploration area outside the Hadatu deposit), a layer of U-anomalous mudstone (≈80 ppm) with a thickness of about 5 m was found under the U-mineralization sandstone of the Saihan Fm, in which numerous vertical micro-cracks developed and filled with grey-black material (Figure 6a). Petrography and SEM-EDX studies shows that the grey-black material distributed along the vertical cracks is composed of light distillates (fluorescence), bitumen and pyrite (Figure 6b–f).
SEM analysis shows that U-minerals are distributed in various forms. Some U-minerals are distributed as vein along micro cracks of U-bearing sandstone (Figure 7a), some U-minerals distributed in the pores between grains of clastic minerals or in the hole of carbonaceous debris (Figure 7c), and some along the micro fractures (Figure 7b) or dissolution voids of clastic minerals (Figure 7d–i). Pyrites mainly occurred in grey and dark-grey sandstone of the reducing zone and high-grade U-ores, shows columnar, granular or scattered as tiny crystals. U-minerals are mainly uraninite, and a small amount of coffinite (Ti-bearing) which is closely associated with pyrite and OM (Figure 7b–d,g). EPMA analysis verifies that U-minerals of high-grade ore are mainly uraninite, the content of UO2 is between 76% and 84%, and rich in S, P, As, Fe, Ca etc.

4.2. Micro Spectroscopy Analysis

Micro spectroscopy studies on the OM and uraninite after microscopic observation and SEM analysis, including microlaser Raman and micro Fourier transform infrared spectroscopy (FTIR) analysis.

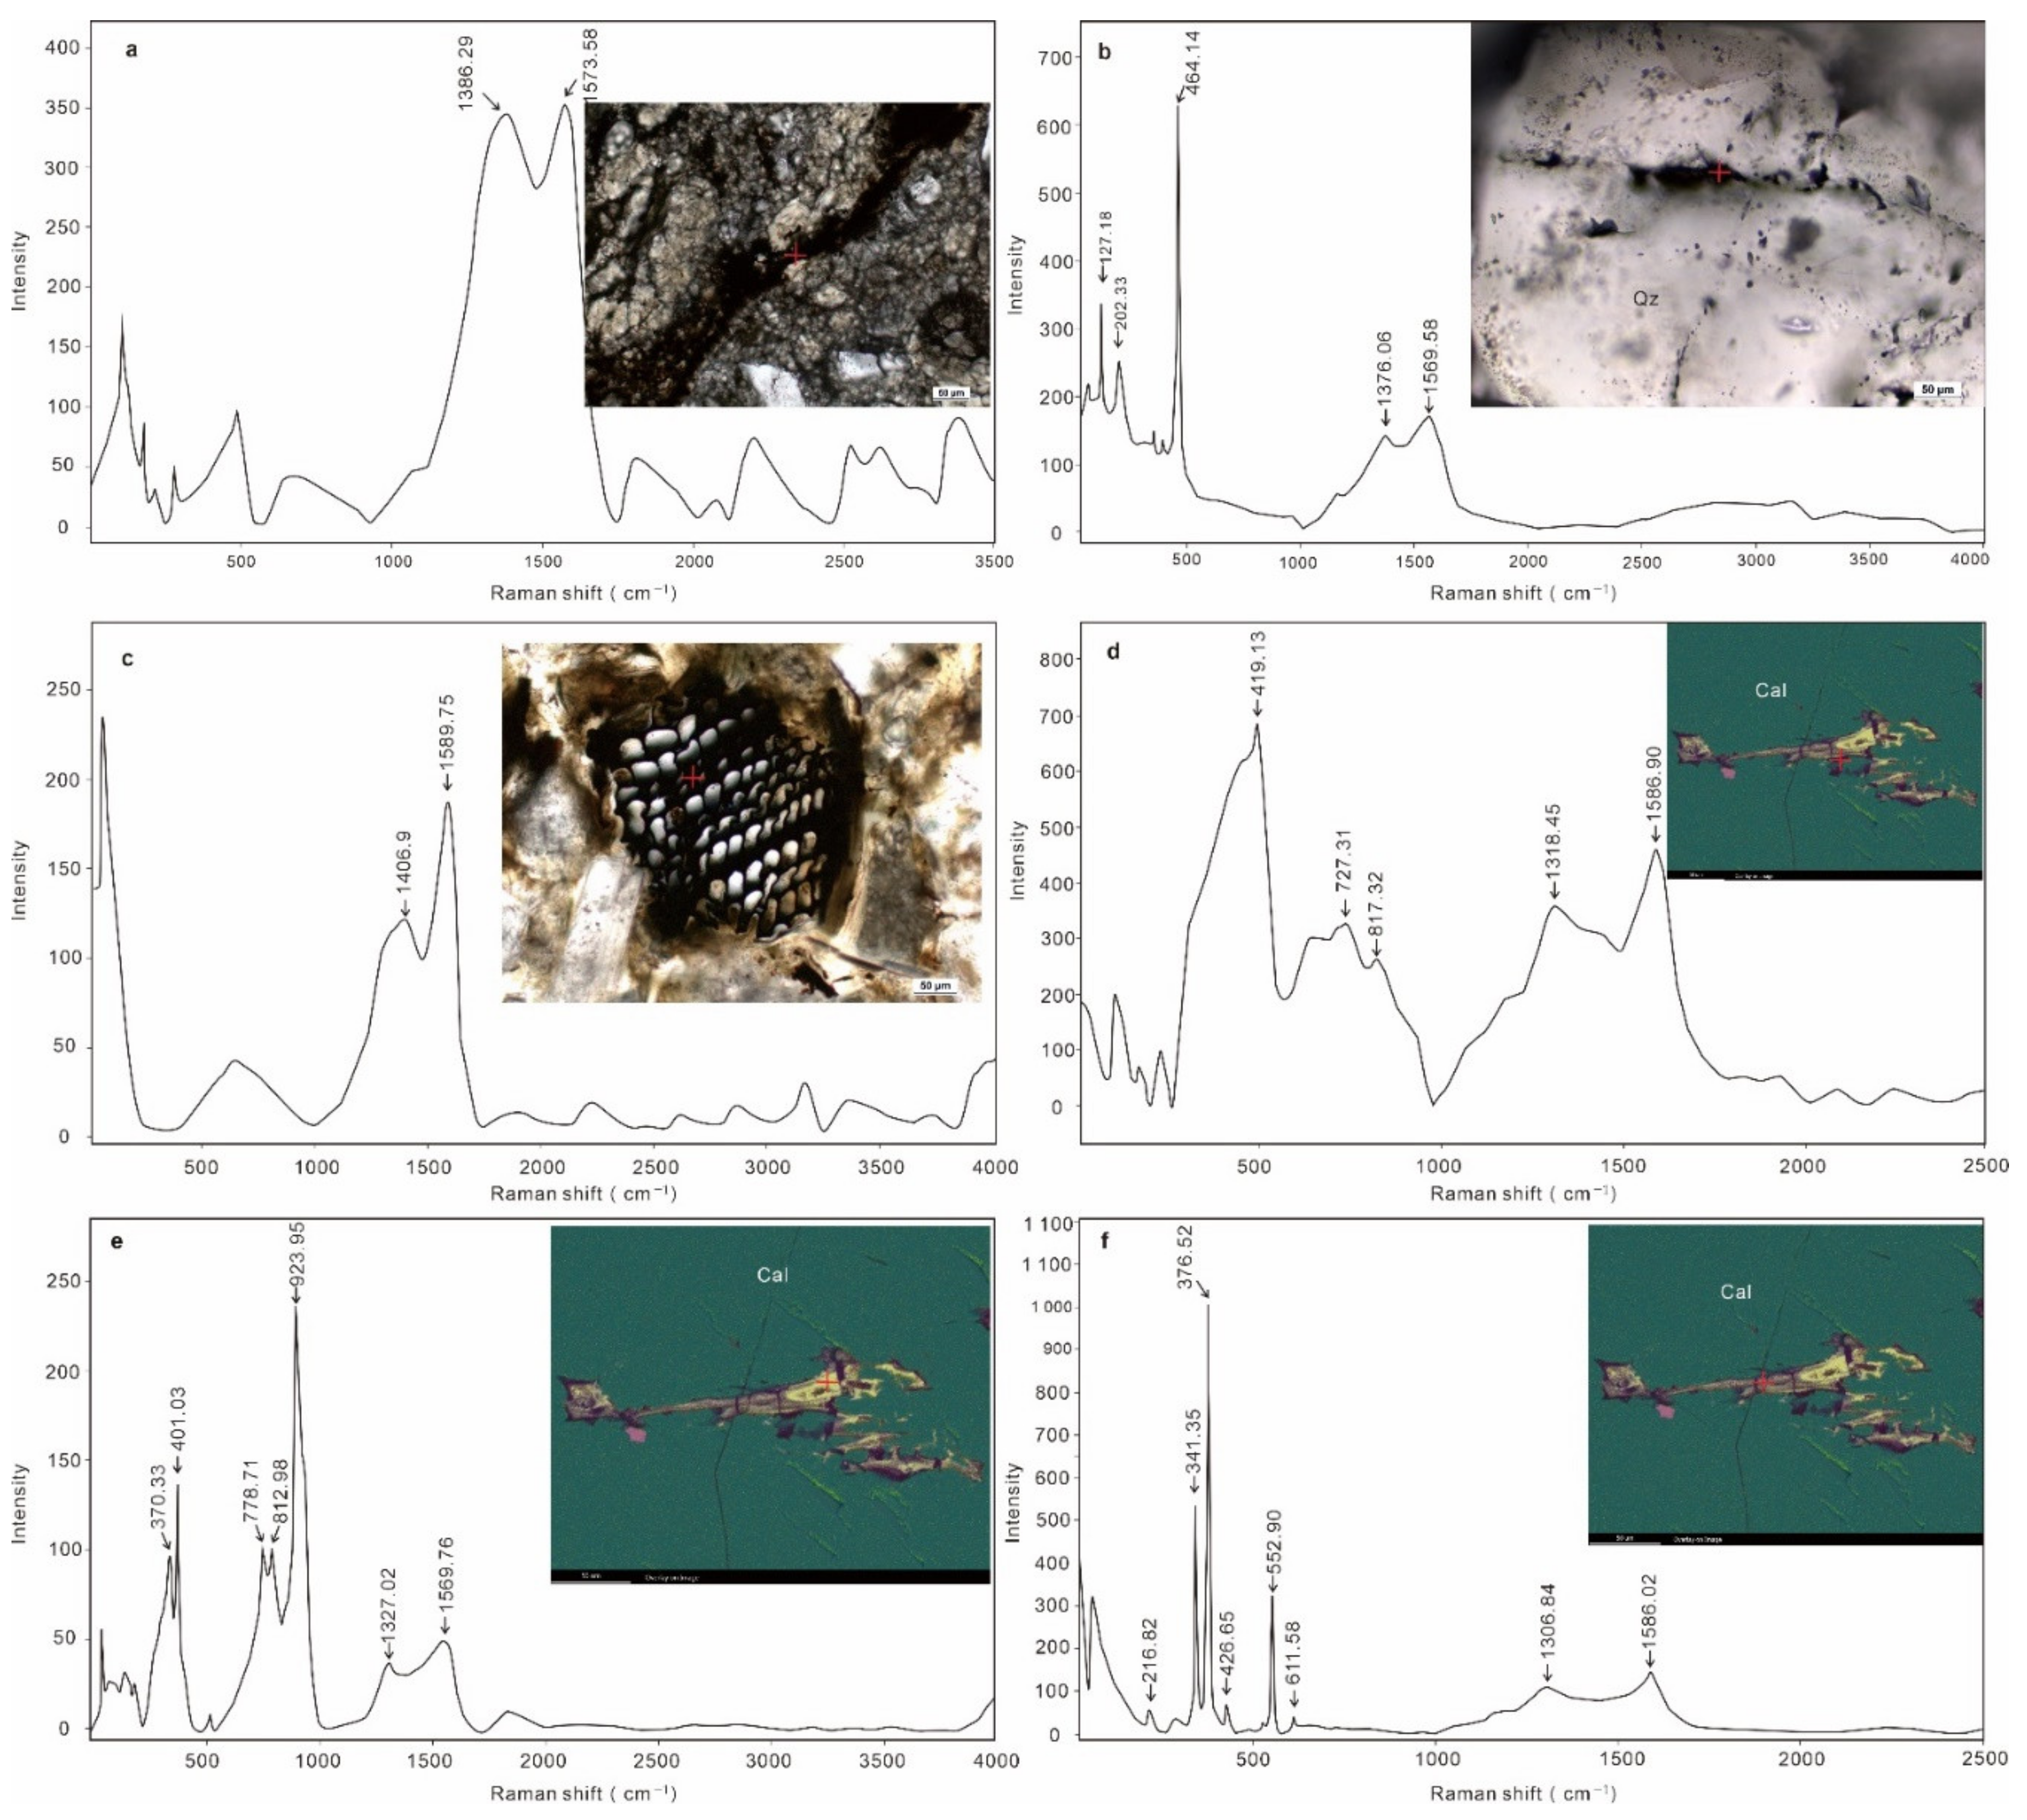
4.2.1. Microlaser Raman Analysis

Three types of OMs, which were founded in the U-bearing sandstone, was analyzed by a micro-laser Raman spectroscopy, uraninite and pyrite associated with type-III OM in the dissolution voids of calcite were analyzed by a microlaser Raman too. Type-I OM (fragments of ancient plant) have two first-order characteristic peaks in the laser Raman spectrum, the D band is between 1380~1407 cm−1 and the G band is between 1590~1620 cm−1. The G band is narrow, and the intensity of G band is significantly higher than D band (Figure 8c). The type-II OM (migration OM) also have two Raman characteristic peaks, the D band is between 1300~1390 cm−1 and the G band is between 1570~1590 cm−1, The G band and D band are wide, and the intensity of G band is slightly higher than D band (Figure 8a,b). The type-III OM also have Raman band at ~1320 cm−1 (D band) and 1587 cm−1 (G band) (Figure 8d). D band is related to the degree of disorder of carbon material, the width of D band will decease as the exaltation of OM, the G band is related to the stretching vibration of the C=C bond in the molecular structure of carbon material, the intensity of G band will increase as the degree of evolution of OM [35]. Therefore, type-II and type-III OMs are lower degree of evolution and highly disordered, type-I OM is higher degree of evolution and more orderly than type-II and type-III OMs.
Raman analysis shows the uraninite in the dissolution voids of calcite has the multiplex Raman characteristic peaks, such as 370 cm−1, 401 cm−1, 778 cm−1, 813 cm−1, 924 cm−1, 1327 cm−1 and 1570 cm−1 (Figure 8e), indicated that uraninite in the dissolution voids is not a single material component. Raman bands at 401 cm−1, 778 cm−1, 813 cm−1, 924 cm−1 are attributed to the characteristic peak of vibrational modes of U-O group (Figure 8e). The same situation, type-III OM were detected the Raman characteristic peaks at 419 cm−1, 727 cm−1 and 817 cm−1 beside the ~1320 cm−1(D band) and 1587 cm−1 (G band) (Figure 8d), which are attributed to the characteristic peak of vibrational modes of U-O group, it is showing that type-III OM in the dissolution voids is not a single material component too, which contains some invisible U-minerals. Pyrite in the dissolution voids of calcite also has the multiplex Raman characteristic peaks at 341 cm−1, 377 cm−1, 426 cm−1, 552 cm−1, 611 cm−1, 1306 cm−1 and 1587 cm−1 (Figure 8f). Raman band at 341 cm−1 and 377 cm−1 are attributed to the characteristic peak of pyrite, 426 cm−1 is attributed to the vibrational modes of U-O group, 1306 cm−1 and 1587 cm−1 are attributed to the D band and G band of OM, 552 cm−1 is unknown substance. In short, in the dissolution voids of calcite, Raman bands at ~1320 cm−1 and 1580 cm−1, which were detected in uraninite and pyrite, are attributed to the G and D bands of OM, this indicate the presence of OM in Uraninite and pyrite, Raman band at 370 cm−1, which is detected in uraninite, indicate the presence of invisible pyrite in Uraninite, Raman band at 426 cm−1, which is detected in pyrite, indicate the presence of invisible U-minerals in pyrite. Uraninite, pyrite and OM are closely symbiotic, they may precipitate in the same fluids.

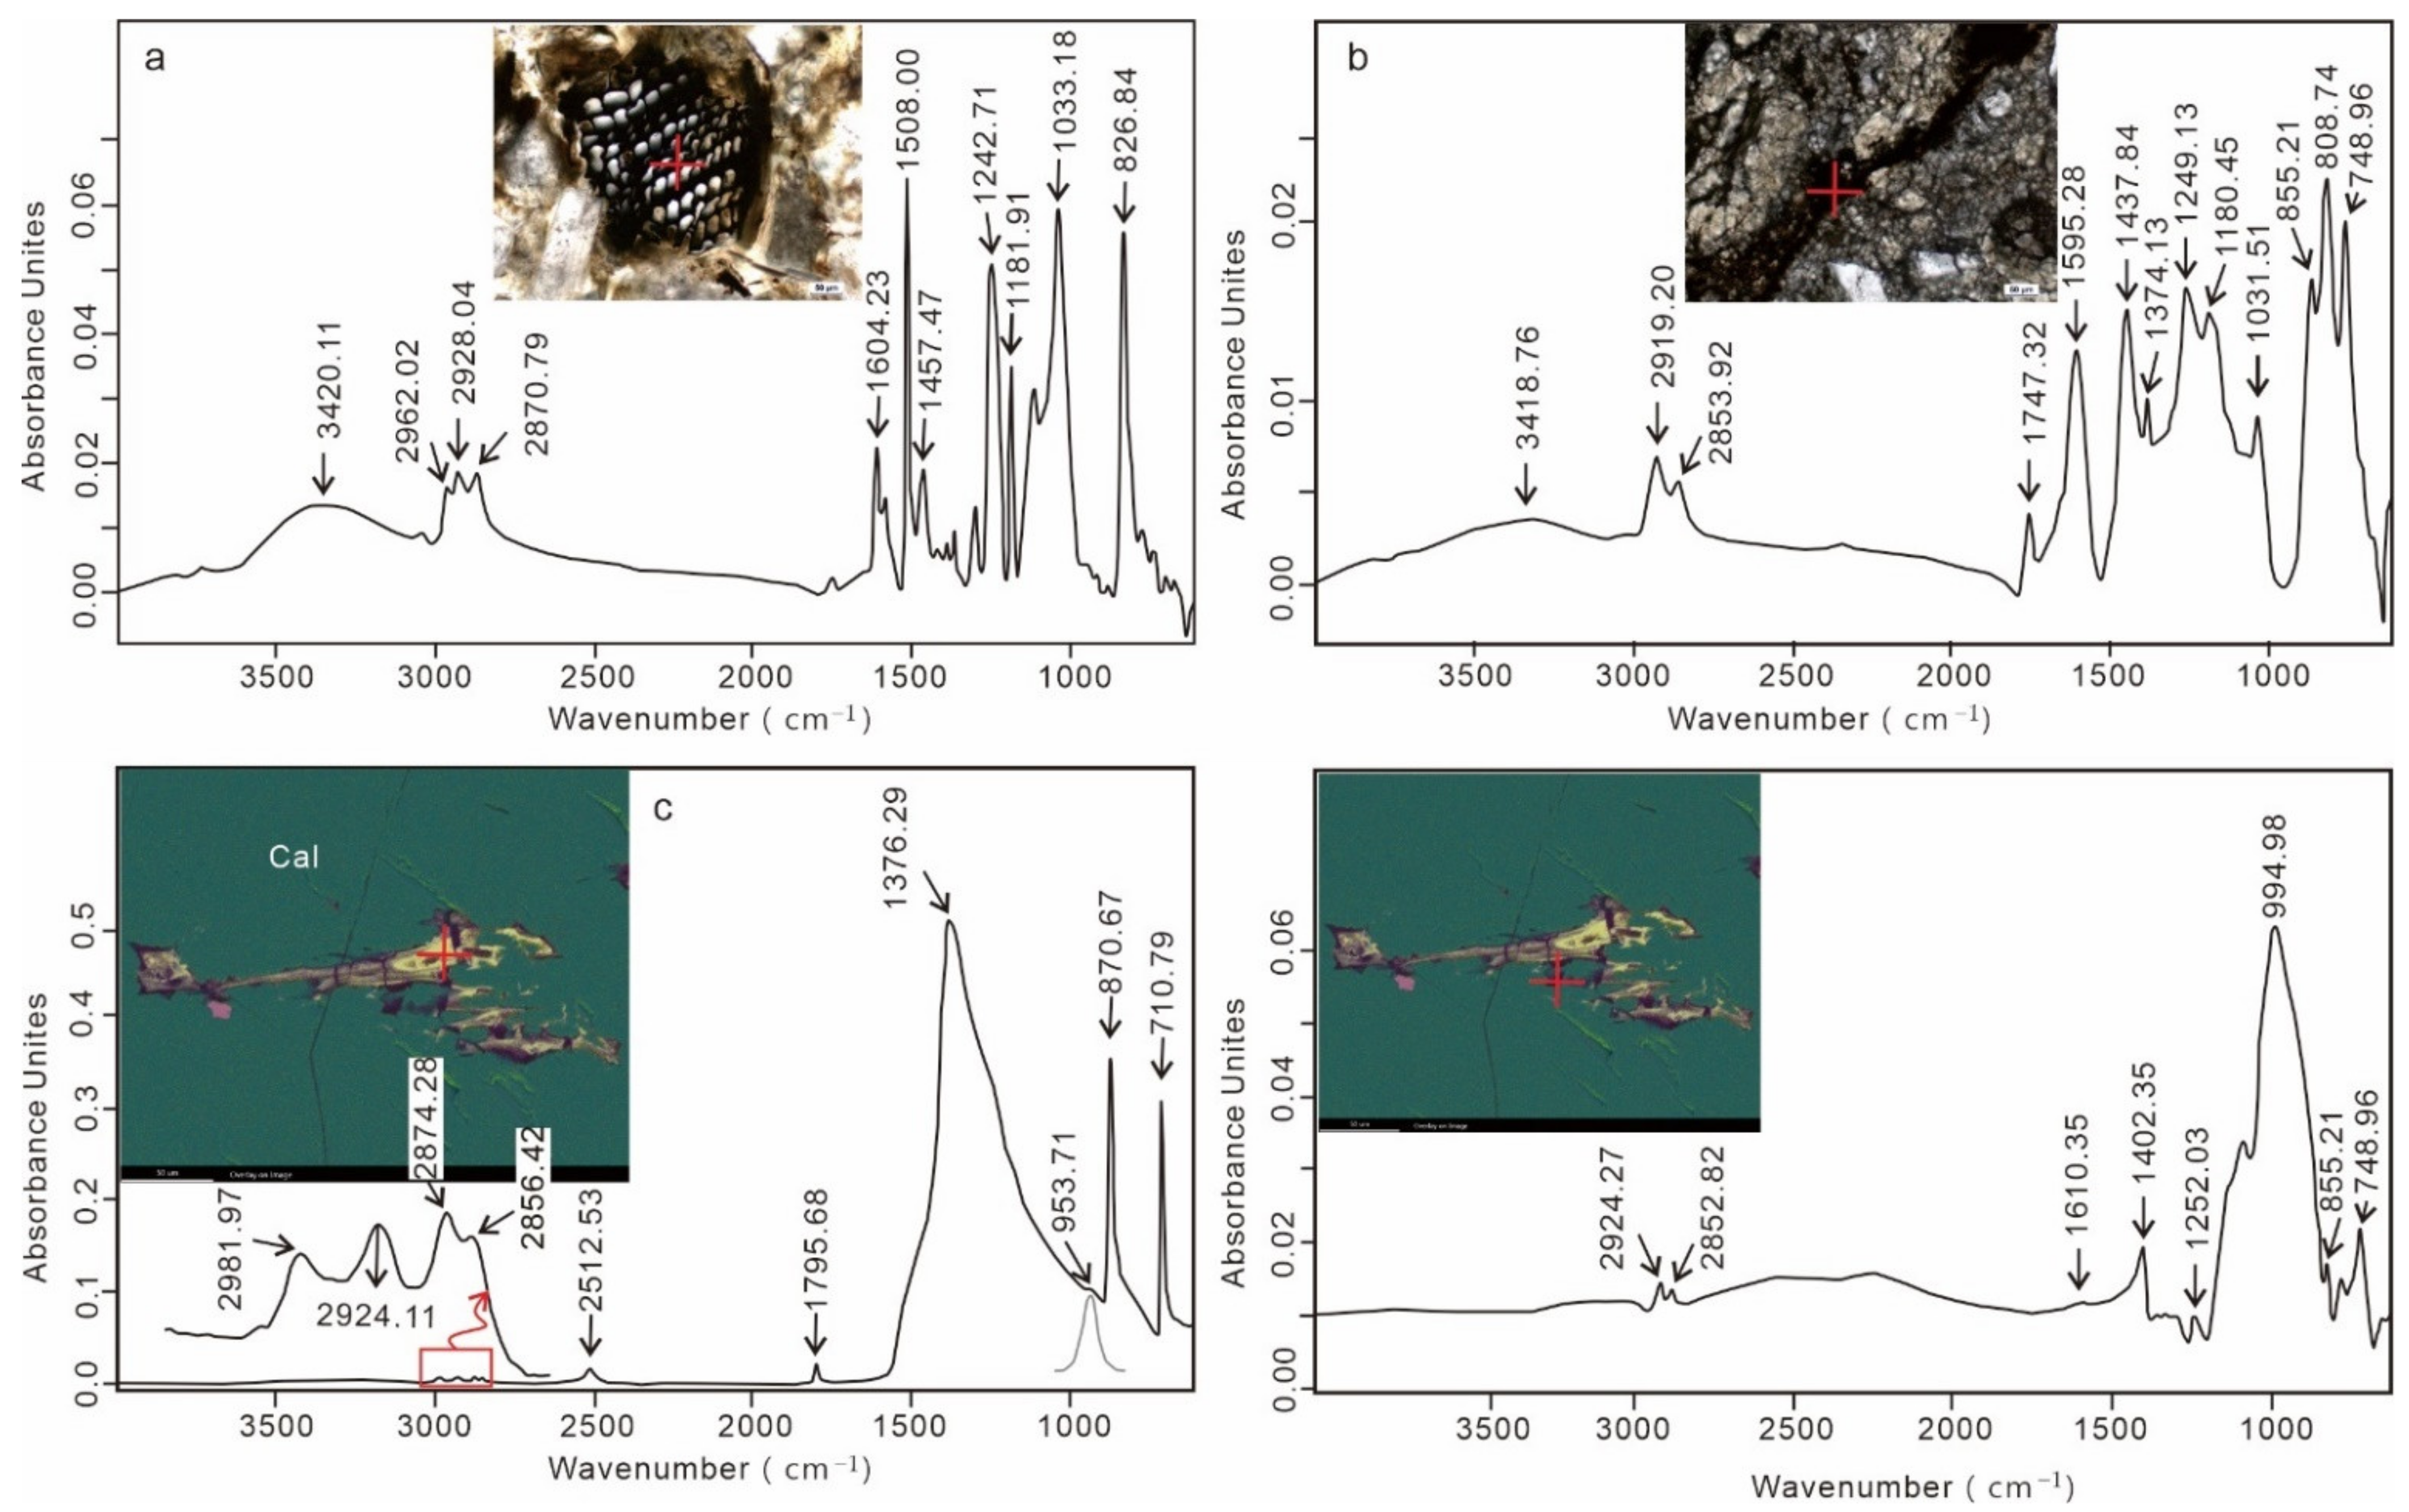
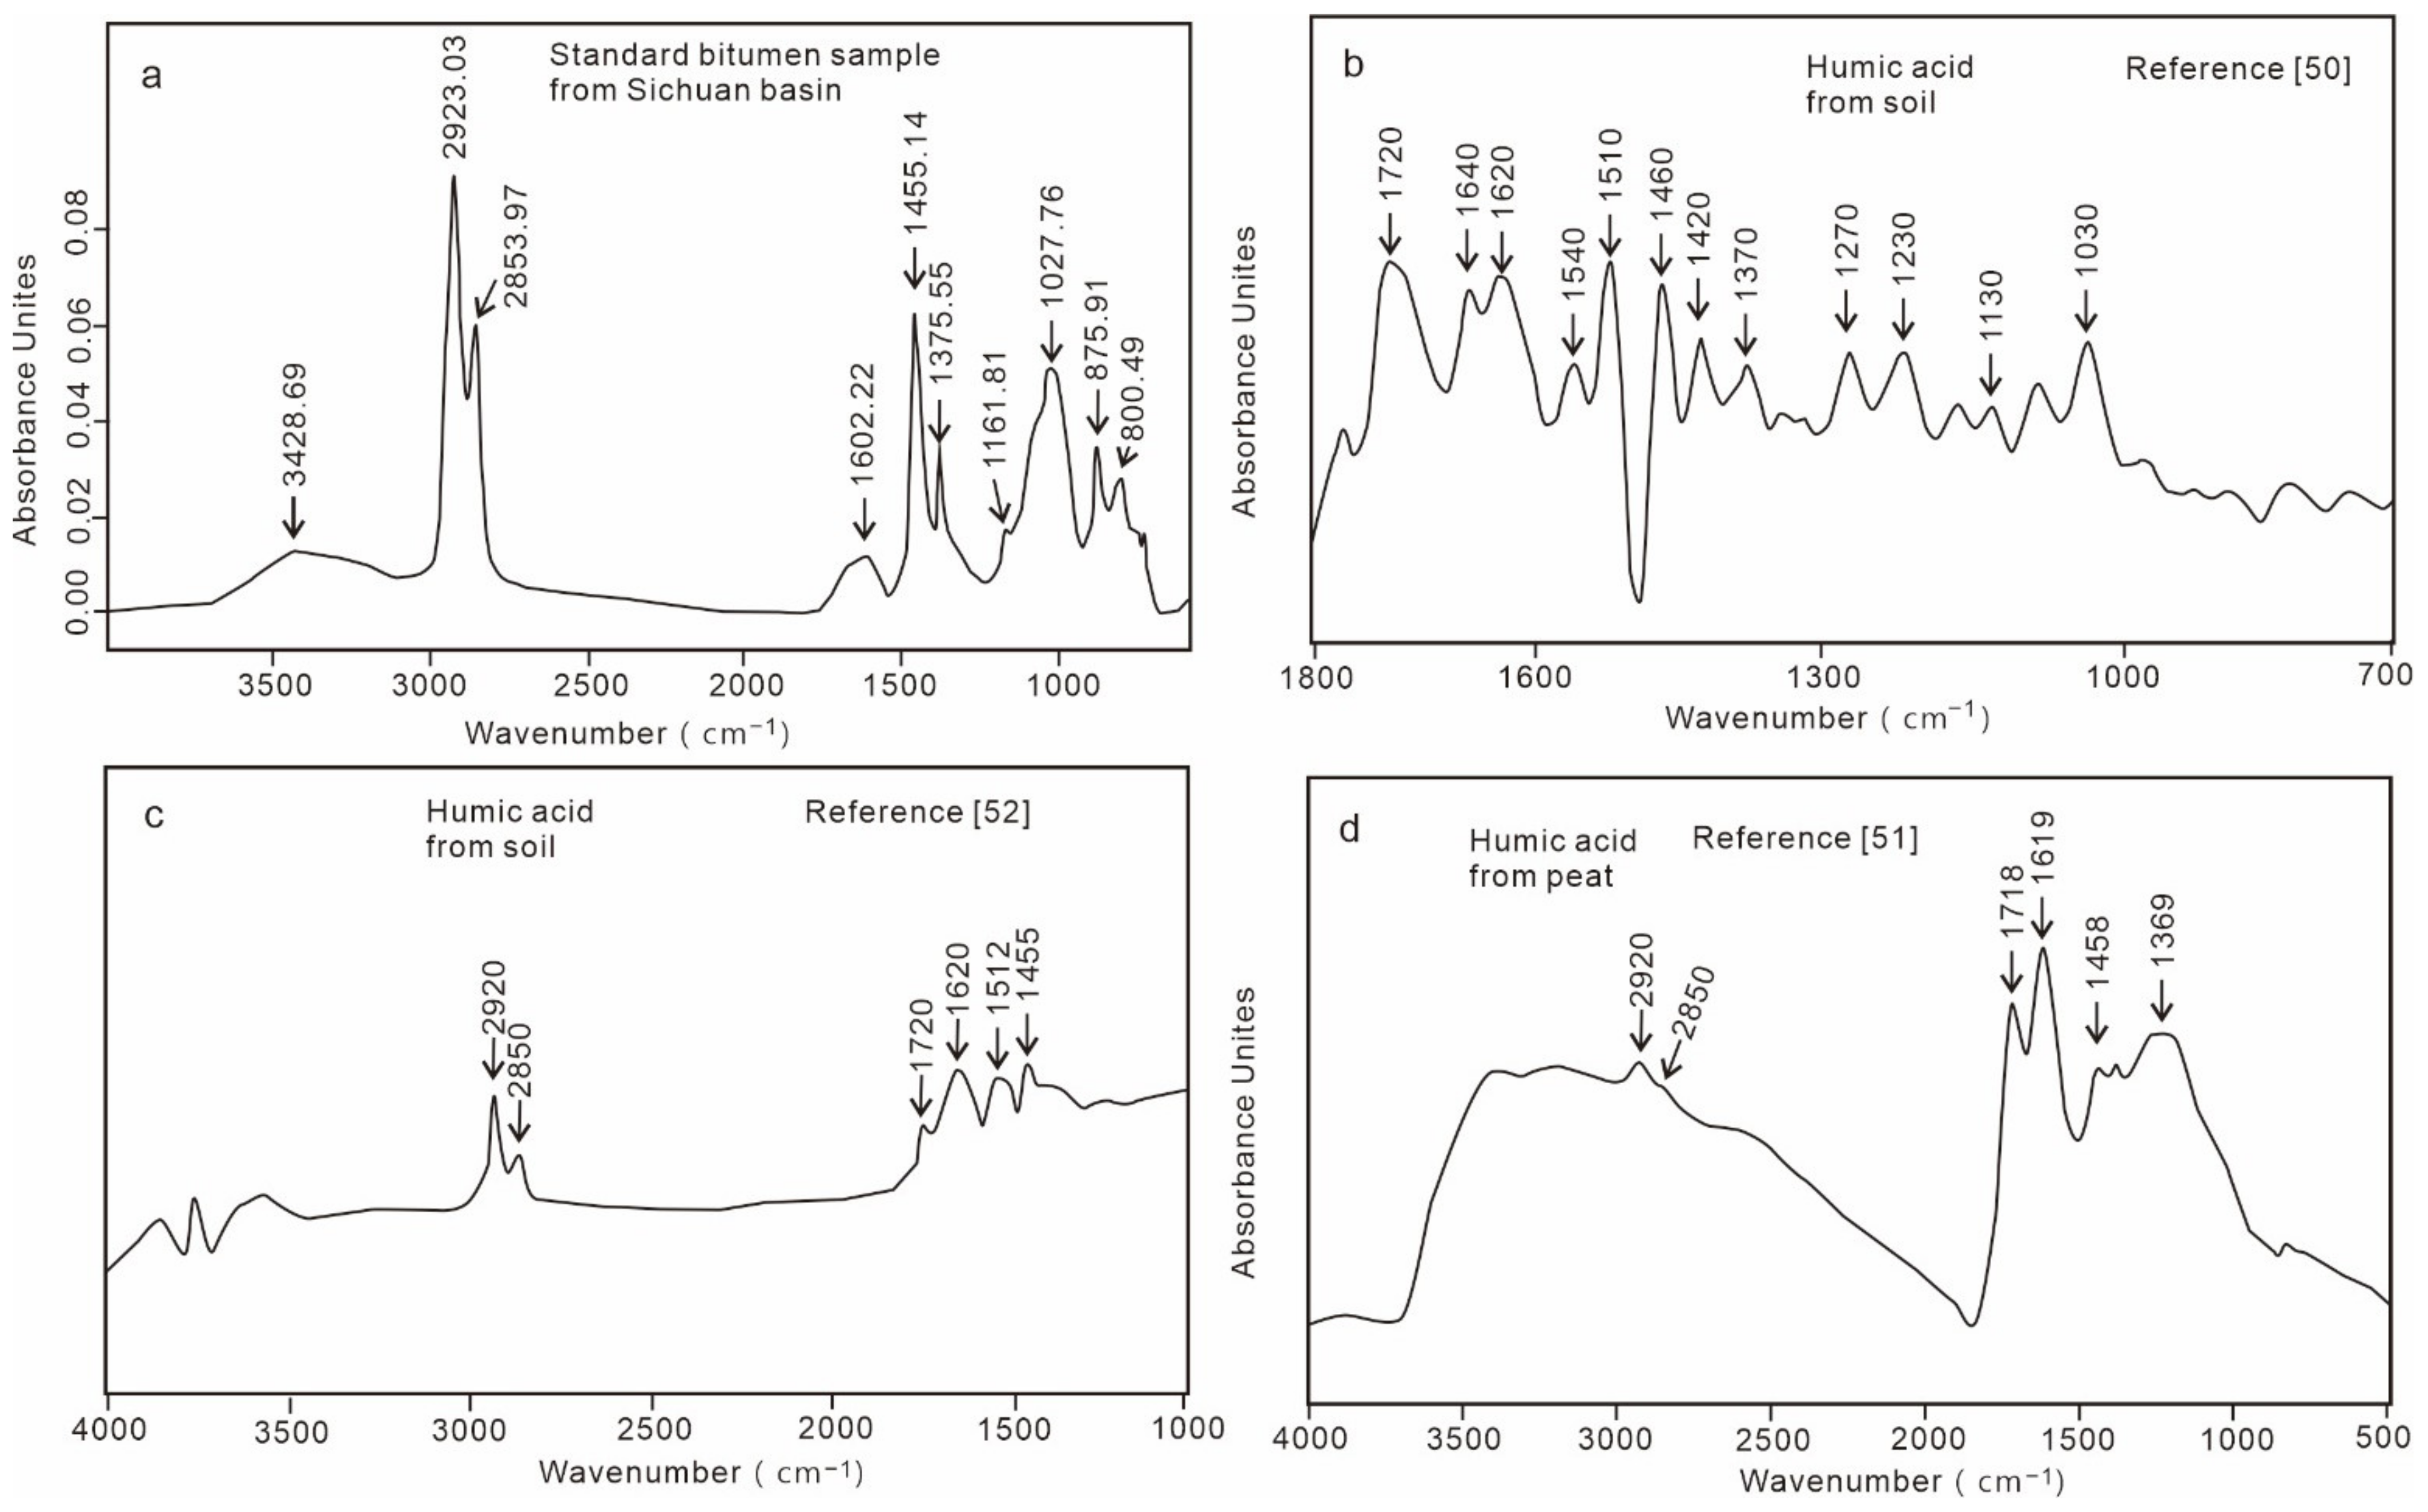
4.2.2. Micro FTIR Spectroscopy Analysis

Three types of OMs and OM-bearing uraninite, which were founded in the U-bearing sandstone, was analyzed by a micro FTIR spectroscopy. The infrared absorption peaks of different OM are shown in Table 1 and Figure 9.
Type-I and type-II OMs are exhibit a very complex infrared spectrum, mainly covers 700~900 cm−1, 1000~1300 cm−1, 1400~1600 cm−1 and 2800~3000 cm−1 (Figure 9a,b), they have the same peaks of ~810 cm−1, ~1030 cm−1, ~1180 cm−1, ~1245 cm−1, ~1600 cm−1(Table 1, Figure 9a,b). Type-III OM have lower peaks of 700~900 cm−1 and 1200~400 cm−1, higher and broad peaks of ~995 cm−1 (Figure 9d). Compare with published literature, all of three type of OMs have major bands at 2800~3000 cm−1, which are identified as typical stretching vibration of CH2 group of aliphatic (Figure 9a,b,d). Bands at ~2960 cm−1 corresponds to the asymmetric stretch of C-H bond’s, and 1460 cm−1, 1350 cm−1 corresponds to the deformation vibration and symmetric stretch vibrations of C-H bond’s,1600 cm−1 corresponds to C=C bond in benzene ring or C-H bond’s stretching vibration [36,37]. Band at ~1030 is assigned to the C-O bending vibration of alcohol and ether, Band at ~1380 cm−1 is assigned to bending vibration of CH2 and CH3 groups or asymmetric stretching vibration of COO- group of aromatics [38], Bands at ~1250 cm−1 are assigned to stretching vibration and bending mode of phenolic [39]. Bands at ~750 cm−1 and ~850 cm−1 assigned to vibration bonds of aromatics. Band at ~3400 cm−1 is assigned to vibration of hydroxyl of H2O. In general, all the OMs have the similar groups of methyl, methylene, benzene ring, carboxyl, but the type-III OM is obviously different at the broad peaks of ~995 cm−1, this is attributed to the type-III OM not a single substance, which contains other material components. The infrared spectrum characteristic peaks are superimposed in the area of 1000~1100 cm−1, resulting in the broad and strong peak of 995 cm−1.
The IR spectrum of uraninite have the peaks of 711 cm−1, 871 cm−1, 953 cm−1, 1376 cm−1, 1796 cm−1 and 2800~3000 cm−1 (Figure 9c). Bands at ~711 cm−1, ~871 cm−1 and 953 cm−1 are assigned to vibration of U-O bond [39,40],1376 cm−1 is assigned to bending vibration of CH2 and CH3 groups or asymmetric stretching vibration of COO- group of aromatics, 1796 cm−1 is assigned to vibration of C=O bond [38], 2800~3000 cm−1 are identified as typical stretching vibration of CH2 group of aliphatic [37]. Overall, in addition to the bands of U-O bond, uraninite also contains broad bands of 1376 cm−1, 2856 cm−1, 2874 cm−1, 2924 cm−1, 2980 cm−1, it is instructed that existence tiny OM in Uraninite, which is hosted in the dissolution voids of calcite of U-bearing sandstone.

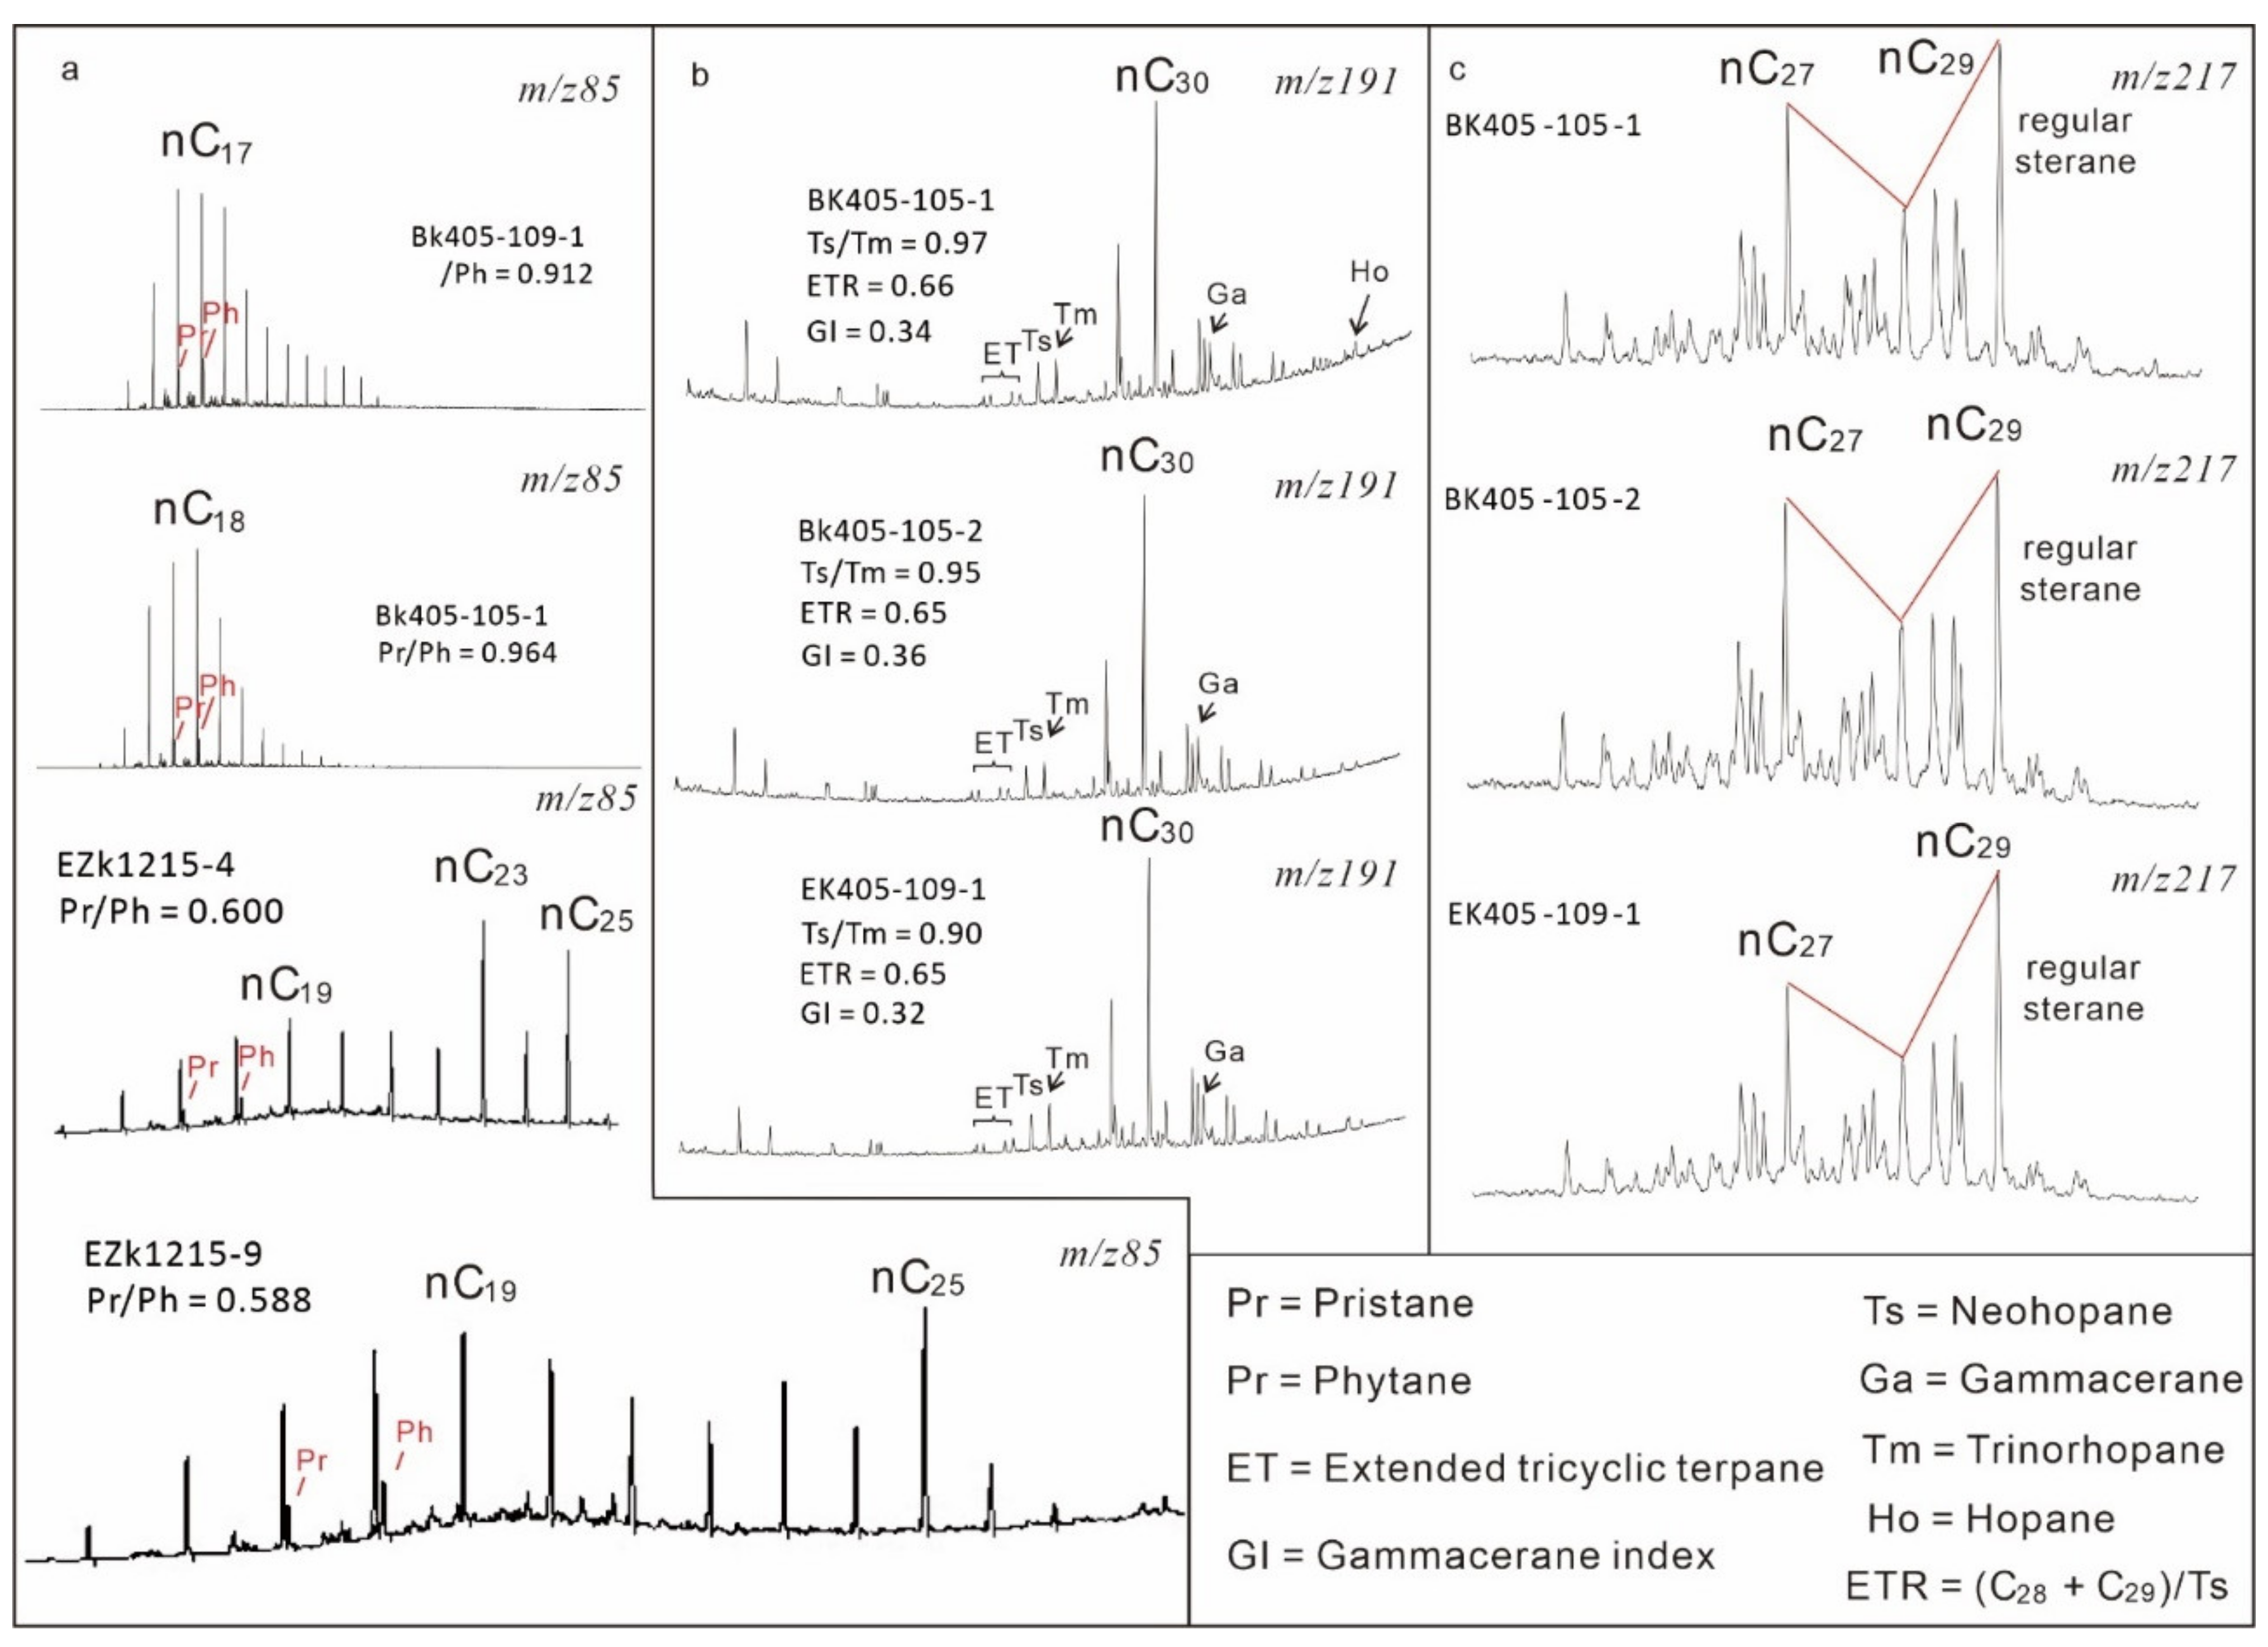
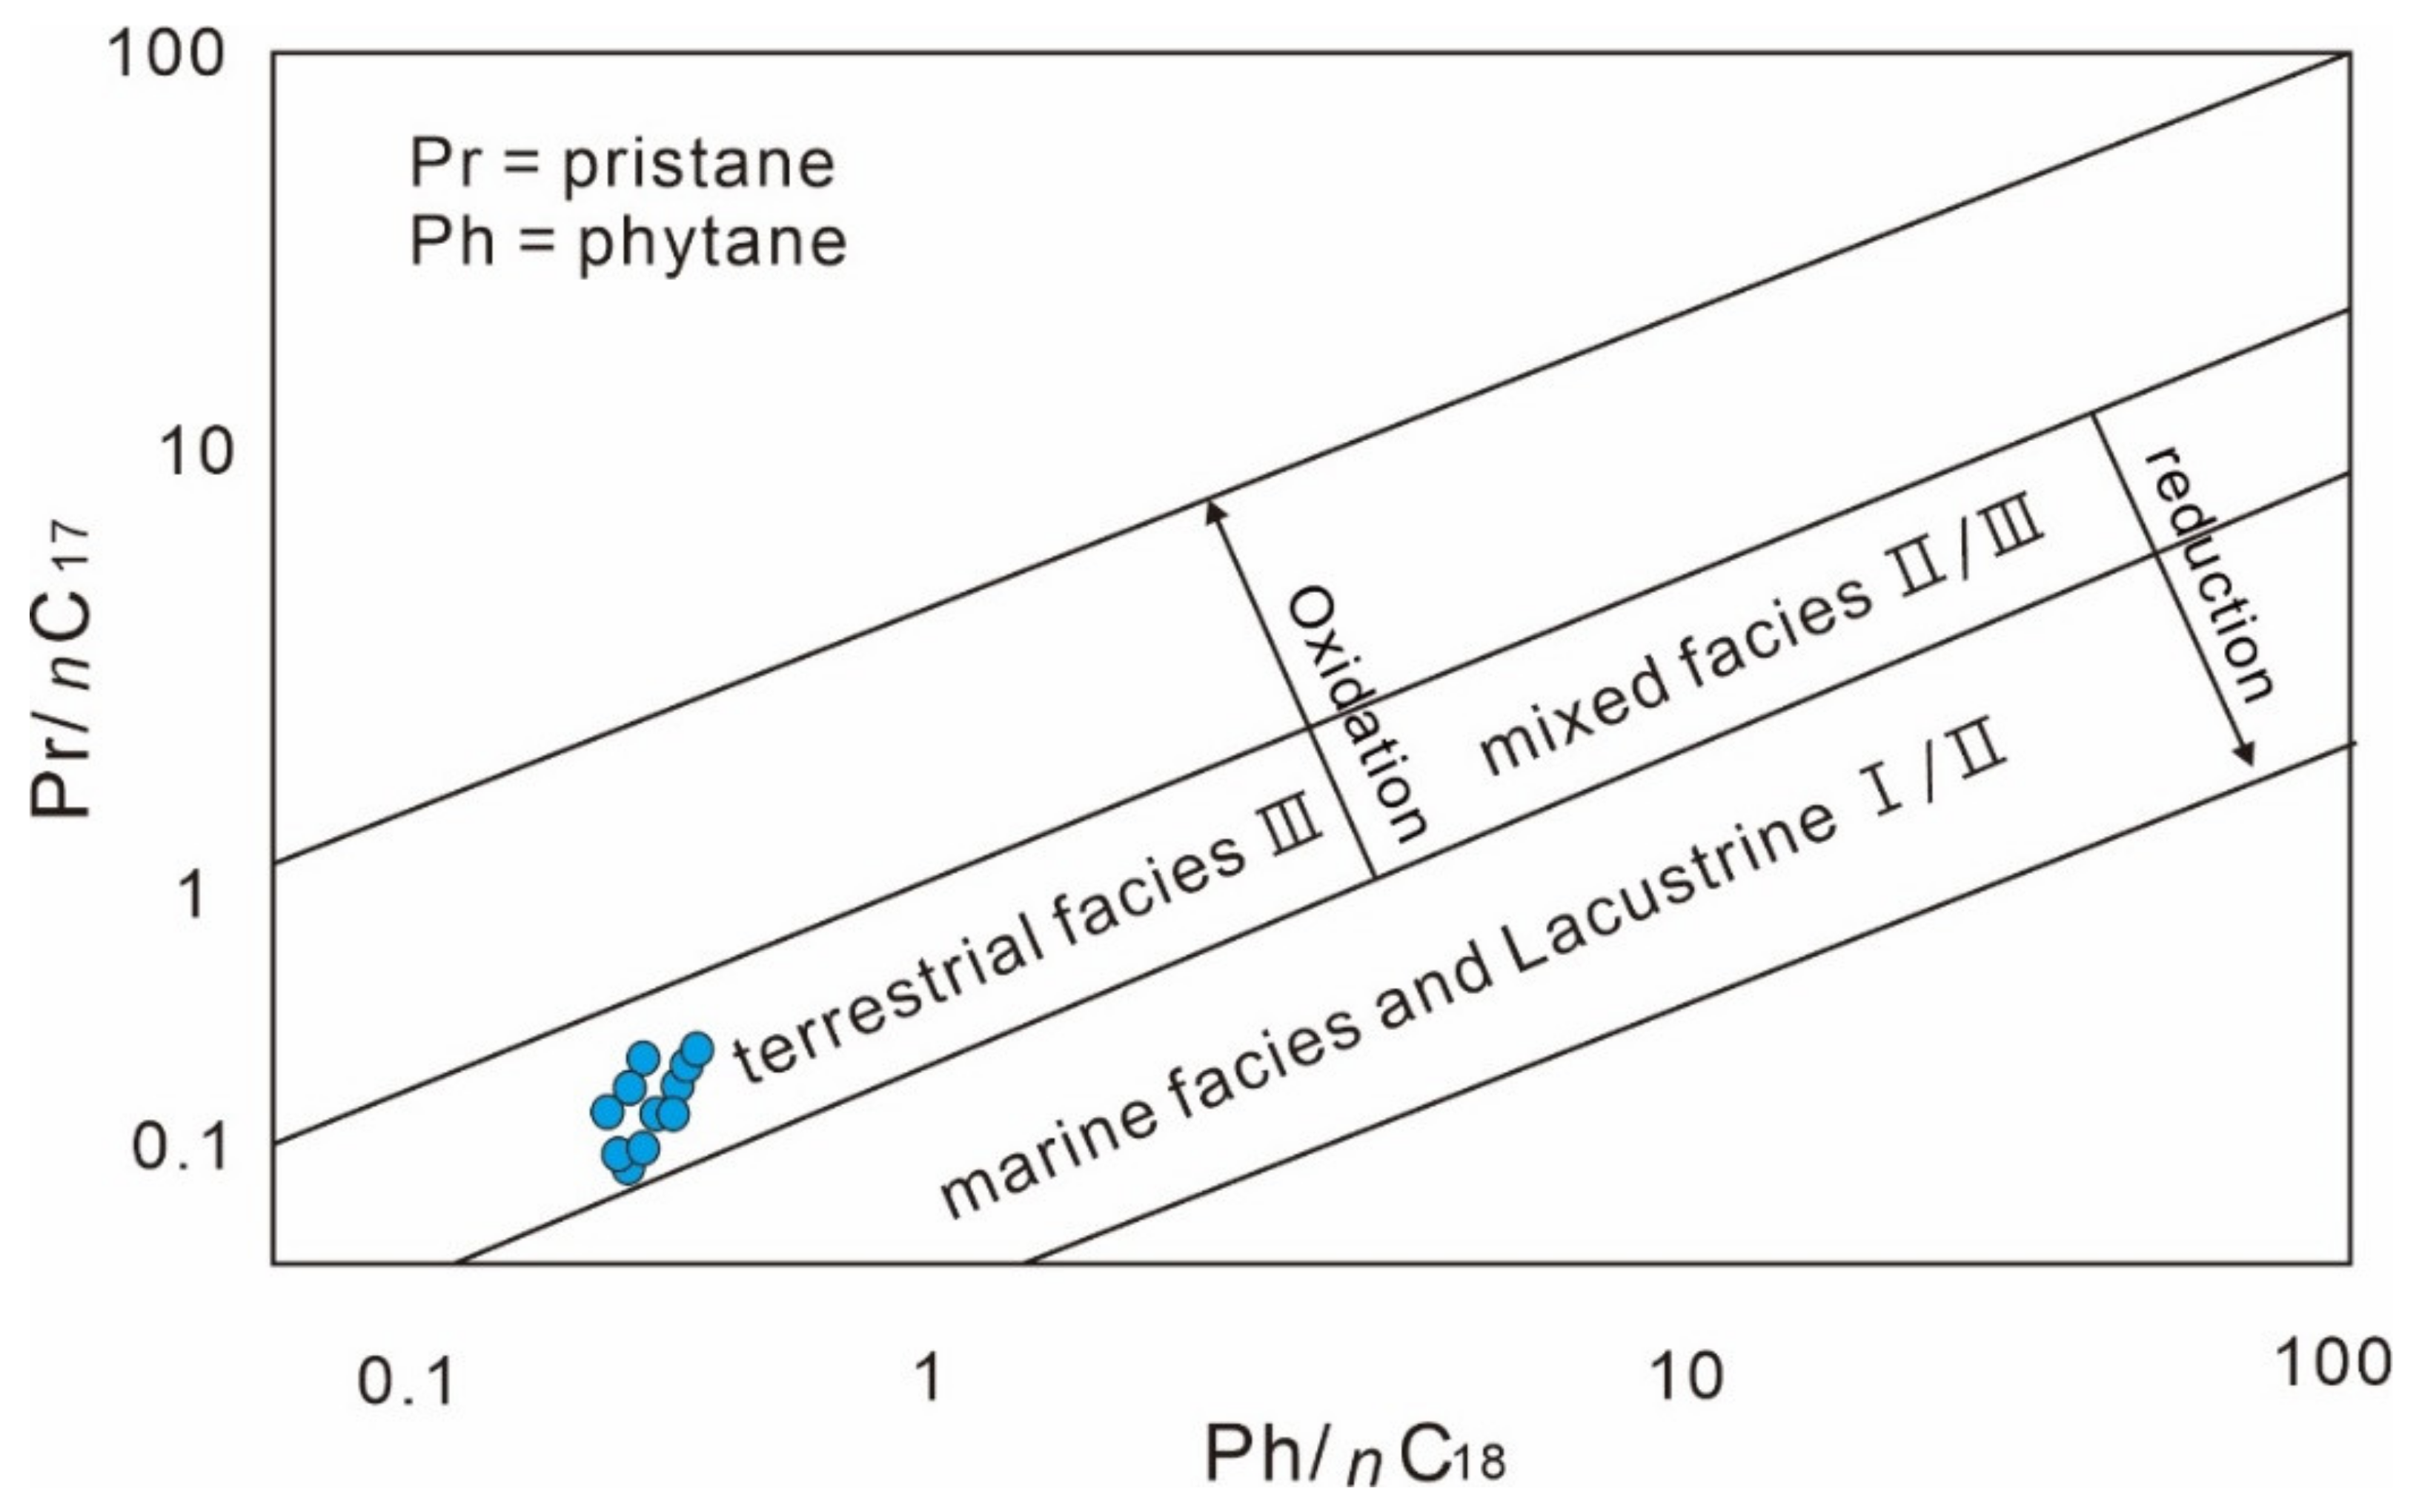
4.2.3. GC-MS Analysis of Soxhlet Extracts

The GC-MS analysis results and geochemical parameters of the Soxhlet extracts of U-bearing sandstone are shown in Table 2. Most U-bearing sandstone samples contain a certain amount of soluble OM, ranging from 0.0012% to 0.0289%. The saturated hydrocarbon content is 13.13% ~ 51.35%, the aromatic hydrocarbon content is 2.70%~15.79%, the colloid (nonhydrocarbon) content is 32.69%~66.67%, the bitumen content is 1.27%~28.85% (Table 2). Sa-HC/ Ar-HC is 1.3~19.0, the Saturated hydrocarbon occupies a dominant position, it reflects a high maturity of hydrocarbons in the U-bearing sandstone, and good oil-generating parent materials.
The carbon number of n-alkanes are distribution ranges from nC17 to nC32. There are two types of peak shape in general. The first type is the former single peak shape with main peak carbon No. of nC17~nC19, and the second type is of bimodal morphology, with the main peak carbon characteristics of nC17~nC19 and nC23~nC25 (Figure 10a), the low molecular n-alkanes occupies a dominant position, but there are also some high molecular n-alkanes. The Pr/Ph value is 0.588~1.128 (Table 2), and the average value is 0.808. The CPI (Carbon preference index) value is 1.30~3.92, OEP (odd-even predominace) is 0.92~3.94, and the odd-even advantage is not obvious, indicating that the hydrocarbon components of the ore-bearing sandstone are in the mature stage. The Pr /nC17 value is 0.116~0.364, the Ph /nC18 value is 0.085~0.464, and the Pr /nC17 with Ph /nC18 correlation graph has a narrow distribution range (Figure 11), indicating the formation of source rocks in reduction-weak oxidizing environment. The chromatogram of m/z 217 was dominated by pregnane and homopregnane. The distribution of C27–C28–C29 regular steranes had an order of C29 > C27 > C28 (Figure 10c), The pentacyclic terpanes were characterized by a high abundance of C30 hopane, while the C23 tricyclic terpane was predominate in the tricyclic terpanes (Figure 10b), this shows that sedimentary environment was salty and autotrophic algae have more advantages than bacteria. The Ts/Tm (Neohopane/Trinorhopane) value is 0.90~1.06, ETR ((C28+C29)/Neohopane)) value is 0.64~0.66, GI (Gammacerane index) value is 0.32~0.38, it also indicates that the hydrocarbon source rock was formed in the reductive sedimentary environment of Saline water.

4.2.4. C Isotope of Chloroform Bitumen A

The C isotope composition of the Soxhlet extracts of U-bearing sandstone are shown in Table 3. The δ13C isotope value of extracts ranges from −33.4‰ to −27.0‰, with an average value of −29.9‰. It falls within the δ13C value range of organic matter (δ13C = −10‰~−35‰) [41].

5. Discussion

5.1. The Nature and Source of OM

According to sedimentological core analysis, coal layers are absent or less abundant inside the reservoir zone. Three forms of organic matter are documented from the sedimentary rocks of U-bearing sandstone and reduction zone sandstone. The type-I OM originated from the sedimentation of fragments of ancient plants, it is supported by the evidence of plant cell structure, but type-II and type-III OMs are different.
Micro laser Raman analysis indicated that the type-I OM has a narrow G band characteristic, which is comparable to the low-mature (Ro = 0.5%–1%) coal chip characteristics reported by Morga et al. (2014) [42] and Su et al. (2016) [43], It is obviously different from the Raman spectrum characteristics of bitumen reported by Zhang et al. (2013) [44] and Wang et al. (2015) [45]. The type-II and the type-III OMs have the characteristics of broad D band and G band. The D band (~1350 cm−1) (disordered induced) could be explained by phonon dispersion of graphite, G band (~1600 cm−1) is related to the stretching vibration of C=C bond in the molecular structure [35,46], The intensity ration of G band and D band (IG/ID) is increasing as the maturation of OM [47,48]. Type-I OM has the Raman characteristics of higher G band, type-II and type-III OMs have the Raman characteristics of lower G band (Figure 8), it shows that the type-I OM has a higher degree of evolution than type-II and type-III OM, which are higher disordered.
All three types of OM have complex molecular structure was instructed by FTIR studies. The type-I OM has the similar infrared characteristics of the coal reported by Sun et al. (2001) [49], but it still has a more complex composition and molecular structure, this may be caused by a certain degree of thermal evolution. Infrared characteristics of type-II OM is different from the type-I OM, and is similar to the infrared spectrum of the standard bitumen from the Sichuan Basin, South China (Figure 12a), but is quite different from the infrared spectrum of humic acid reported by Jiménez-González et al. (2019) [50], Wei et al. (2018) [51] and Zhang (2015) [52]. (Figure 12b–d). Type-III OM has very broad peaks from 1000 cm−1 to 1500 cm−1, it is due to the superimpose of the peaks of OM and ore-forming elements, this view is also supported by the SEM-EDX, EPMA and laser Raman analysis results of U-minerals. Infrared and Raman analysis shows that the OM related to U-mineralization is a macromolecular substance with a complex structure, containing methyl, methylene, carboxyl, benzene ring etc., it is similar to bitumen, which contains molecular groups such as methyl, carboxyl and benzene ring groups of alcohol, ether, aliphatic, aromatic and phenolic etc.
GC-MS analysis results show that the extracts of U-bearing sandstone have a high abundance saturated hydrocarbon, aromatic hydrocarbon. Low-carbon n-alkanes are mainly derived from plankton and algae fatty acids and high-carbon n-alkanes derived from the epidermal wax layer of terrestrial plants [53,54]. Low-carbon and high-carbon n-alkanes coexist in U-bearing sandstone, indicated that the parent material is mainly lower aquatic organisms, while higher plants also have a certain contribution. Pr/Ph < 1.0 indicating reduction environment [55,56]. The Pr/Ph value (average value is 0.808) of n-alkanes indicating that the parent material comes from a strong reducing environment. The CPI, OEP recommend the hydrocarbon components of the ore-bearing sandstone was passive the mature stage. The Pr/nC17 with Ph/nC18 correlation graph indicate the source rocks in reduction-weak oxidizing environment. The biomarker of Pregnane, hopane, homopregnane and tricyclic terpane, Ts/Tm, ETR, GI values also show the source rock was formed in reduction and salty environment. The main geochemical parameters obtained from the above studies are comparable with the crude oil of pioneering studies in the Wulanhua and Saihantala sag in Erlian basin [57,58].
The δ13C isotope value of extracts ranges from −33.4‰ to −27.0‰, with an average value of −29.9‰, indicates that carbon should be derived from sapropelic kerogen rather than humic-type kerogen [59]. It is basically consistent with the δ13C isotope values (−32‰~−29.0‰) measured by Feng et al. (2020) and Wang et al. (2020) of the crude oils in the Wulanhua sag and Saihantala sag [57,58], implies that the extracts are related to the deep hydrocarbon fluids in the Erlian Basin. The presence of hydrocarbon inclusions (light blue fluorescence, Figure 5h,i) in quartz of U-bearing sandstone, and the bitumen veins and light distillates in the vertical cracks of the mudstone of Saihan Fm (Figure 6), these are supported the hydrocarbon fluids invaded the ore-forming zone of Saihan Fm.

5.2. The Relationship Between OM and Uranium Mineralization

OM has long been known to be associated with many types of mineral deposits, especially certain types of uranium deposits [60]. The precipitation of uranium in sedimentary basin is described as the process of reducing uranyl ions from U6+ to U4+ [61], OM provides the reductant for uranium precipitation, the reaction process of U precipitation has also been confirmed by simulation experiments [62,63]. Initially, scholars believed that this kind of OM was mainly charcoal formed by burial of ancient plants [64,65], Later, some U deposits were also discovered in the formations which are lacking carbonaceous debris OM (e.g., Grants in the United States, Oklo in Gabon, Athabasca in Canada, WitWatersrand in south Africa, Bigrlyi in Australian), hydrocarbon fluids were noticed and speculated for the importance role of U-mineralization in this type deposit [13,14,66,67,68,69].
The mechanism of the combination of OM and uranium is very complex, including reduction, absorption, complexation, etc. [70,71,72,73]. Beside the absorption, OM may contribute to U-mineralization mainly in two ways: (1) The first way is to reduction the U(VI) of the formation as a reducing agent [70], then the U as tiny particles(solid) or dissolved status enter the ore-forming fluids, the chemical reaction formula of reduction described as: CH3COO- + 4U(VI) + 4(H2O) → 4U(IV)+2HCO3− + 9H+ [71]; (2) The second way is to complexation with uranium and migration together in the form of the macromolecular structure of the U-organic complex [72]. Under oxidizing conditions, the U-organic complex decomposes and precipitates, the chemical reaction formula of U-organic complexation and oxidation decomposition described as: 2R-COOH + UO22+ → RCOO-(UO2)-OOCR + 2H+, 2(RH) + UO22+ → 2R0 + 2H+ + UO2 [73].
In Erlian basin, previous studies have generally agreed that the role of OM in U-mineralization. However, whether this OM is carbonaceous debris or mobile hydrocarbon fluids is still very controversial [12,15,18]. Our study shows that most U-minerals occur in the intergranular pores, micro-cracks and detrital mineral dissolution voids of sandstone (Figure 7a,b,d,g), and only a small amount of U-minerals are found in the cavities of ancient plant fossils (Figure 7c), indicates that there is no large-scale U-mineralization occurred during the stage of sedimentary diagenesis. The OM related to large scale mineralization has the characteristics of mobility, the mobile OM has the significantly different characteristics of Raman and infrared spectroscopy as carbonaceous debris, but has the characteristics of macromolecular OM similar to the high disordered and amorphous bitumen. These evidences are in contrast with the contribution of inherited carbonaceous debris to large-scale U-mineralization. Furthermore, hydrocarbon fluid inclusions (intensity blue fluorescence) in Quartz of U-bearing sandstone and hydrocarbon fluids in vertical fractures of mudstone were found, confirmed that deep oil-gas fluids intruded into ore-bearing layer. C-isotope and biomarker compounds of extracts are similar to crude oil in the Wulanhua sag and Saihantala sag of Erlian basin, indicates that the hydrocarbon fluids originate from lacustrine source rocks in the lower layer of the Saihan Fm.
Tenge’ger Fm (131 Ma~121 Ma) is a large section of dark gray–black mudstone-based sediments (>500 m), formed in a warm–humid climate and floodplain circumstance [30,74]. Saihan Fm (Aptian-Albian stage,120~100 Ma) is a river and lacustrine facies coal-bearing coarse clastic sediments (>200 m), formed in a Semiarid climate [75]. The age of large-scale hydrocarbon generation of the source rocks of Tenge’er Fm and oil–gas invading event is around 100–95 Ma [74], indicating that the hydrocarbon invading event was after the Saihan Fm sedimentary. The main U- mineralization age in the Erlian Basin varies widely, ranging from 85 Ma to 35 Ma [15,76,77], U-mineralization age is significantly later than the age of oil-gas fluids invading event. U deposits and oil–gas reservoirs are consistent on the spatial scale (i.e., produced in the same basin), and U-mineralization is later than the oil–gas invading event. U mineralization is affected and restricted by oil–gas fluids system, supporting the idea that hydrocarbons are involved in U mineralization in the Erlian Basin.
An important issue needs to consider is what the role of hydrocarbons in the U-mineralization in the Erlian Basin. Our research found the co-existence of bitumen vein, light distillates and pyrite vein in the cracks of mudstone under the U-bearing layer (Saihan Fm), as well as the light oil-gas fluid inclusions (intensity blue fluorescence) in microfractures of quartz of U-bearing sandstone, this proved that the hydrocarbons from the lower layer actually intrude into the U-mineralization layer, and the occurrence of hydrocarbons cracking–differentiation. Besides, we found the tiny U-minerals, pyrite, and migration OM (related to the differentiation-cracking of hydrocarbons) closely co-existing in the dissolution voids of detrital minerals, this proved that U-minerals, pyrite and mobile OM originate from the same ore-forming fluid system. Two models could utilize for the role of hydrocarbons in the U-mineralization. The first model is that the uranyl ions are reduced to sub-micron minerals by the reduction agents from cracking hydrocarbons, the sub-micron U-minerals entered the ore-forming fluid and transported with fluids together, U was precipitated during the changes of physical–chemical conditions of ore-forming fluid. The second model is that the uranyl ions are complexed with OM (evolution from hydrocarbons) and migrated together, U was precipitated during the stage of decomposition of coordination compound.

6. Conclusions

Our research has identified three types of OM and provided direct evidence that mobile OM (mainly hydrocarbon fluids) participates in U-mineralization. We believe that there are at least two stages mineralization events, stage I is related to sedimentary organic matter (syngenetic pre-enrichment stage), and stage II is related to mobile hydrocarbon fluids (main mineralization stage). Therefore, our results support that migrated hydrocarbons were involved as a reducing agent for the main uranium mineralization after synsedimentary mineralization. The migration OMs should originate from deeply oil–gas system under Saihan Fm, involved in main U mineralization stage. In addition to the OMs participating in the oxidation-reduction event of U-mineralization, we proposed a model of uranium and OM complex migration, decomposition and precipitation. Of course, this is just a hypothetical model, which may need to be verified by more experiments and researches. We believe that our study, albeit preliminary, has shown that migration hydrocarbons have all the characteristics required to mobilize U and act as ore fluids, therefore, it is reasonable to consider the possibility that for these deposits at least, hydrocarbon fluids may have contributed significantly to ore formation as an agent of uranium transportation.

Author Contributions

Conceptualization, L.-F.Q., W.-S.L. and B.-Q.H.; data curation, L.-F.Q.; formal analysis, L.-F.Q.; investigation, L.-F.Q.; methodology, L.-F.Q., W.-S.L. and Z.-B.H.; project administration, X.-D.L. and W.-S.L.; resources, X.-D.L. and L.G.; supervision, B.-Q.H.; writing—original draft, Z.-B.H.; writing—review and editing, X.-D.L. and L.G. All authors have read and agreed to the published version of the manuscript.

Funding

This research was funded by Centralized Research and Innovation Project of CNNC, grant number Geo-LCEQ-1 and Geo-LCEQ-3.

Data Availability Statement

No new data were created in this study. Data sharing is not applicable to this article.

Acknowledgments

We are highly thankful to Geologic Party No. 208, China National Nuclear Corporation for the permission to examine cores and field work investigation in the study areas. Our thanks are also given to the editors and reviewers for constructive comments that helped improved the paper.

Conflicts of Interest

The authors declare no conflict of interest.

References

  1. International Atomic Energy Agency (IAEA). World Uranium Geology, Exploration, Resources and Production; IAEA Library: Vienna, Austria, 2020. [Google Scholar]
  2. International Atomic Energy Agency (IAEA), OECD-NEA/IAEA. Uranium 2009: Resources, Production and Demand (Red book); IAEA Library: Vienna, Austria, 2010. [Google Scholar]
  3. Liu, W.S.; Liu, J.H.; Wang, Z.B. Subsequent Transformation and Evolution of ore bearing structure in Erlian. J. East China Inst. Technol. 2005, 28, 52–58, (In Chinese with English Abstract). [Google Scholar]
  4. Fan, X.J.; Nie, F.J.; Chen, Y.P.; Wang, W. Discussion on age and paleo geographical environment of ore bearing strata for sandstone-type uranium deposits in Bayanwula area, Erlian basin. Uranium Geol. 2008, 24, 150–154, (In Chinese with English Abstract). [Google Scholar]
  5. Fan, G.; Qin, M.K.; Shen, K.F.; Kang, S.F. Electronic probe study on uranium minerals in 2082 sandstone-type uranium deposit. J. Chin. Electr. Microsc. Soc. 2006, 301–302, (In Chinese with English Abstract). [Google Scholar]
  6. Li, W.T.; Li, Z.Y.; Li, X.D.; Liu, W.S.; Kang, S.H.; Lv, Y.H. Study on uranium occurring state in Hadatu sandstone-type uranium deposit in Erlian basin. Uranium Geol. 2020, 24, 150–154, (In Chinese with English Abstract). [Google Scholar]
  7. Hao, J.T. Application of geochemical model in the prediction of sandstone-type uranium deposits in eastern Erlian basin. Uranium Geol. 2013, 29, 24–33, (In Chinese with English Abstract). [Google Scholar]
  8. Zhang, B.M.; Wang, X.Q.; Zhou, J.; Han, Z.X.; Liu, W.S.; Liu, Q.Q.; Wang, W.; Li, R.H.; Zhang, B.Y.; Dou, B. Regional geochemical survey of concealed sandstone-type uranium deposits using fine-grained soil and groundwater in the Erlian basin, north-east China. J. Geochem. Explor. 2020. [Google Scholar] [CrossRef]
  9. Liu, B.; Yang, J.X.; Qiao, B.C.; Zhang, F. Characteristics of ore-controlling genetic facies and prospect prediction of sandstone-type uranium deposits in the Tengge’ er depression, Inner Mongolia. Geol. Explor. 2015, 51, 870–878. [Google Scholar]
  10. Bonnettia, C.; Zhou, L.L.; Rieglerc, T.; Bruggerd, J.; Fairclough, M. Large S isotope and trace element fractionations in pyrite of uranium roll front systems result from internally-driven biogeochemical cycle. Geochim. Cosmochim. Acta 2020, 282, 113–132. [Google Scholar] [CrossRef]
  11. Rallakis, D.; Michels, R.; Brouand, M.; Cathelineau, M. The Role of Organic Matter on Uranium precipitation in Zoovch Ovoo, Mongolia. Minerals 2019, 9, 310. [Google Scholar] [CrossRef] [Green Version]
  12. Bonnetti, C.; Cuney, M.; Malartre, F.; Michels, R.; Liu, X.; Peng, Y. The Nuheting deposit, Erlian Basin, NE China: Synsedimentary to diagenetic uranium mineralization. Ore Geology. Rev. 2015, 69, 118–139. [Google Scholar] [CrossRef]
  13. David, J.; Mossman, D.J. Hydrocarbon habitat of the paleoproterozoic Franceville Series, Republic of Gabon. Energy Sources 2001, 23, 45–53. [Google Scholar] [CrossRef]
  14. Andrei, L.; Raymond, M.; Michel, C.; Christophe, M.; Marc, B.; Nicolas, F. Uranium deposits of Franceville basin (Gabon): Role of organic matter and oil cracking on uranium mineralization. Ore Geol. Rev. 2020. [Google Scholar] [CrossRef]
  15. Li, H.; Kuang, W. Metallogenesis and metallogenic model of the Nuheting uranium deposit in Erlian Basin. World Nucl. Geosci. 2010, 27, 125–129, (In Chinese with English Abstract). [Google Scholar]
  16. Niu, L.; Huang, S.; Yang, G. The Characteristics of Uranium Mineralization and Genesis of Nuheting Uranium Deposit in Erlian Basin, Inner Mongolia; China Nuclear Science and Technology Report; CNIC: Beijing, China, 1995; pp. 1005–1017. [Google Scholar]
  17. Zhang, R.; Ding, W. Discussion on geological characteristics of Nuheting type uranium deposit and the relation between oil and gas-bearing water and uranium metallogenesis. In Galaxy of Research Achievements of Uranium Geology of China; Bureau of Geology, China National Nuclear Corporation: Beijing, China, 1996; Volume 10, pp. 205–214. [Google Scholar]
  18. Wang, W. Features and the origin of mineral in sandstone type uranium deposit related to petroleum asphalt in Erlian basin of Inner Mogolia. Uranium Geol. 2016, 32, 270–278, (In Chinese with English Abstract). [Google Scholar]
  19. Yi, S.W. Exploration Theory and Practice of Lithologic and Stratigraphic Reservoirs in Erlian Basin. Ph.D. Thesis, Chengdu University of Technology, Chengdu, China, 2006. [Google Scholar]
  20. Xing, Y.W.; Zhang, Y.M.; Jiang, S.Q.; Dong, X.Y.; Wang, Y.J.; Wang, H.X.; Xu, Y.Z. Characteristics and distribution of petroleum reservoirs in Wulanhua Sag, Erlian Basin. China Pet. Explor. 2020, 25, 68–78. [Google Scholar]
  21. Zhao, X.Z.; Wang, Q.; Dan, W.N.; Wang, W.Y.; Qiao, X.X.; Ren, C.L. Exploration Discovery and Prospects of Cretaceous Stratigraphic Reservoirs in Erlian Basin. Lithol. Reserv. 2017, 29, 1–9. [Google Scholar]
  22. Liu, W.S.; Kang, S.H.; Zhao, X.Q.; Shi, Q.P.; Zhang, Z.N. Mineralization Mechanism and exploration of paleo channel type Uranium deposition Central Erlian Basin. Uranium Geol. 2015, 31, 163–175. [Google Scholar]
  23. Zhang, W.D.; Liu, W.S.; Zhang, Z.N.; Shi, Q.P.; Liu, C.H. Study on geochemical characteristics of hadatu paleo channel type sandstone type uranium deposit in Erlian basin. J. East China Univ. Technol. Nat. Sci. Ed. 2020, 43, 323–334. [Google Scholar]
  24. Liu, W.S.; Liu, J.H.; Wang, Z.B.; Xie, Y.X. The process and evolution of post-generation transformation of ore-bearing-formation in Erlian Basin. J. East China Univ. Technol. Nat. Sci. Ed. 2020, 28, 52–58. [Google Scholar]
  25. Nie, F.; Yan, Z.; Feng, Z.B.; Li, M.G.; Xia, F.; Zhang, C.Y.; Wang, Y.G.; Yang, J.X.; Kang, S.H.; Shen, K.F. Genetic models and exploration implication of the paleochannel sandstone-type uranium deposits in the Erlian Basin, North China—A review and comparative study. Ore Geol. Rev. 2020, 127, 103821. [Google Scholar] [CrossRef]
  26. Zhang, C.Y.; Nie, F.J.; Quan, J.P.; Deng, W. Sources of Sandstone-type Uranium Ore of Intermountain Basin—Taking Tu-Ha Basin and Er’lian Basin as Examples. J. East China Univ. Technol. Nat. Sci. Ed. 2012, 35, 230–237. [Google Scholar]
  27. Qin, M.K.; Zhao, F.M.; He, Z.B.; Sheng, K.F.; Fan, G.; Li, Y.X.; Cao, J.Y. Comparison of metallogenic conditions for sandstone-type uranium deposit between Erlian basin of China and sedimentary basins of Mongolia. Uranium Geol. 2009, 25, 78–84. [Google Scholar]
  28. Yan, Z.B.; Nie, F.J.; Hu, J.J.; Kang, S.H. Study on uranium occurrences of sandstone-type uranium deposit in Bayanwula area, Erlian basin, Inner Mongolia. Appl. Mech. Mater. 2013, 295–298, 2803–2806. [Google Scholar] [CrossRef]
  29. Li, J.Y.; Gao, L.M.; Sun, G.H.; Li, Y.P.; Wang, Y.B. Shuangjingzi middle Triassic syn-collisional crust-derived granite in the east Inner Mongolia and its constraint on the timing of collision between Siberian and Sino-Korean paleo-plates. Acta Pet. 2007, 23, 565–582. [Google Scholar]
  30. Li, H.J.; Shen, K.F.; Nie, F.J.; Kuang, Z.W.; He, D.T. Sedimentary Evolution in Meso-Cenozoic and Uranium Mineralization of Erlian Basin. J. East China Univ. Technol. Nat. Sci. Ed. 2012, 35, 301–308. [Google Scholar]
  31. International Atomic Energy Agency (IAEA). World Distribution of Uranium Deposit /UDEPO, 2016 ed.; IAEA TECDOC-1843; IAEA Library: Vienna, Austria, 2016; pp. 112–114. [Google Scholar]
  32. Liu, W.S.; Kang, S.H.; Jia, L.C.; Shi, Q.P.; Peng, C. Characteristics of paleochannel sandstone-type uranium deposits in the central part of Erlian Basin. Uranium Geol. 2013, 29, 328–335. [Google Scholar]
  33. Liu, B.; Yang, J.X.; Peng, Y.B.; Kang, S.H.; Qiao, P.; Lu, C.; Zhang, F. Study of structure and formation in uranium-bearing paleo-valley and typical metallogenic models in eastern part of Erlian Basin. Mineral Deposits 2017, 36, 126–142. [Google Scholar]
  34. Feng, Z.B.; Nie, F.J.; Deng, J.Z.; Zhang, H.J.; Liu, B.H. Spatial-temporal collocation and genetic relationship among uranium, coal, and hydrocarbons and its significance for uranium prospecting: A case from the Mesozoic-Cenozoic uraniferous basins, North China. Russ. Geol. Geophys 2017, 58, 611–623. [Google Scholar] [CrossRef]
  35. Potgieter-Vermaak, S.; Maledi, N.; Wagner, N.; van Heerden, J.H.P.; van Griekenb, R.; Potgietere, J.H. Raman spectroscopy for the analysis of coal: A review. J. Raman Spectrosc 2011, 42, 123–129. [Google Scholar] [CrossRef]
  36. Masson, J.F.; Pelletier, L.; Collins, P. Rapid FTIR method for quantification of styrene-butadiene type copolymers in bitumen. Appl. Polym. Sci. 2001, 79, 1034–1041. [Google Scholar] [CrossRef]
  37. Robert, K.; Isacsson, U. Application of FTIR-ATR to Characterization of Bitumen Rejuvenator Diffusion. J. Mat. Civ. Eng. 2003, 15, 157–165. [Google Scholar]
  38. Wu, M.; Song, M.Y.; Liu, M.; Jiang, C.; Li, Z. Fungicidal activities of soil humic/fulvic acids as related to their chemical structures in greenhouse vegetable fields with cultivation chronosequence. Sci. Rep. 2016, 6, 32858. [Google Scholar] [CrossRef] [PubMed]
  39. Guan, X.H.; Chen, G.H.; Shang, C. ATR-FTIR and XPS study on the structure of complexes formed upon adsorption of simple organic acids on aluminum hydroxide. J. Environ. Sci. 2007, 19, 438–443. [Google Scholar] [CrossRef]
  40. Qiu, L.F.; Ou, G.X.; Zhang, M.; Li, Q.; Wu, D.; Shang, C.J. Micro-area Analysis of Uranium Minerals by Micro FT-IR Spectrometry. Acta Mineral. Sin. 2016, 36, 43–47. [Google Scholar]
  41. Ohmoto, H.; Rye, R.O. Isotopes of sulfur and carbon. In Geochemistry of Hydrothemeal Ore Deposits, 2nd ed.; Barnes, H.L., Ed.; Wiley: New York, NY, USA, 1979; pp. 509–567. [Google Scholar]
  42. Morga, R.; Jelonek, I.; Kruszewsk, K. Relationship between coking coal quality and its micro-Raman spectral characteristics. Int. J. Coal Geol. 2014, 134–135, 17–23. [Google Scholar] [CrossRef]
  43. Su, X.B.; Si, Q.; Song, J.X. Characteristics of coal Raman spectrum. J. China Coal. Soc. 2016, 41, 1197–1202. [Google Scholar]
  44. Zhang, N.; Wang, Z.M.; Ju, F.P.; Xiao, Z.Y.; Fang, Q.F.; Zhang, B.S.; Lu, Y.H.; Yu, X.Q. Diagenetic bitumen in Ordovician carbonate reservoirs of the northern Tarim basin. Acta Perrolei. Sin. 2013, 34, 225–232. [Google Scholar]
  45. Wang, M.L.; Xiao, X.M.; Wei, Q.; Zhou, Q. Thermal maturation of solid bitumen in shale as revealed by Raman spectroscopy. Nat. Gas Geosci. 2014, 26, 1712–1718. [Google Scholar]
  46. Li, X.; Zeng, F.G.; Wang, W.; Dong, K. Raman characterization of structural evolution in the low-middle rank coals. J. Coal Society. 2016, 41, 2298–2304. [Google Scholar]
  47. Cuesta, A.; Dhamelincourt, P.; Laureyns, J.; Martinez-Alonso, A.; Tascón, J.D. Raman microprobe studies on carbon materials. Carbon 1994, 32, 1523–1532. [Google Scholar] [CrossRef]
  48. Duan, J.C.; Zhuang, X.G.; He, M.C. Characteristics in laser Raman spectrum of different ranks of coal. Geo Log. Sci. Technol. Inf. 2002, 21, 64–67. [Google Scholar]
  49. Sun, X.G.; Chen, J.P.; Hao, D.F. Micro-FTIR Spectroscopy of Macerals in Coals from Tarim Basin. Acta Sci. Nat. Univ. Pekin. 2001, 37, 832–838. [Google Scholar]
  50. Jiménez-González, M.A.; Álvarez, A.M.; Carral, P.; Almendros, G. Chemometric assessment of soil organic matter storage and quality from humic acid infrared spectra. Sci. Total Environ. 2019, 685, 1160–1168. [Google Scholar] [CrossRef]
  51. Wei, S.P.; Wu, M.; Li, Z.P. Comparative Study on Infrared Spectroscopy of Humic Acid from Different Sources. Humic Acid 2018. [Google Scholar] [CrossRef]
  52. Zhang, M.Y. Study on Chemical Composition and Structure of Extracts from Plants at Different Evolutionary Stages and Humic Substances of Different Sources. Master’s Thesis, Jilin Agricultural University, Changchun, China, 2015. [Google Scholar]
  53. Cranwell, P.; Eglinton, G.; Robinson, N. Lipids of aquatic organisms as potential contributors to lacustrine sediments-II. Org. Geochem. 1987, 11, 513–527. [Google Scholar] [CrossRef]
  54. Meyers, P.A. Organic geochemical proxies of paleoceanographic, paleolimnologic, and paleolimatic processes. Org. Geochem. 1997, 27, 213–250. [Google Scholar] [CrossRef]
  55. Philp, R.P. Biolgical markers in fossil fuel production. Mass Spectrom. Rev. 1985, 4, 1–54. [Google Scholar] [CrossRef]
  56. Amane, W.; Hideki, N. Geochemical characteristics of terrigenous and marine sourced oils in Hokkaido, Japan. Org. Geochem. 1997, 28, 27–41. [Google Scholar]
  57. Feng, W.P.; Wang, F.Y.; Wang, Z.X.; Shi, Y.L.; Jiang, T.; Wang, Y.F.; Zhou, H.F. Characteristics and origin of crude oils in the Wulanhua sag. J. Geomech. 2020, 26, 932–940. [Google Scholar]
  58. Wang, H.; Wang, F.Y.; Jiang, S.Q.; Wu, Z.; Xin, Y.W.; Lan, B.F. The oil families and their geochemical characteristics in Sanhantala Sag, Erlian Basin. Lithol. Reserv. 2017, 29, 36–43. [Google Scholar]
  59. Huang, D.F.; Li, J.C. Types of kerogen and the validity, limitations and relevance of its classification parameters. Acta Sedimentol. Sin. 1984, 2, 18–33. [Google Scholar]
  60. Spirakis, C.S. The roles of organic matter in the formation of uranium deposits in sedimentary rocks. Ore Geol. Rev. 1996, 11, 53–69. [Google Scholar] [CrossRef]
  61. Langmuir, D. Uranium solution-mineral equilibria at low temperature with applications to sedimentary ore deposits. Geochim. Cosmochim. Acta 1978, 42, 547–569. [Google Scholar] [CrossRef]
  62. Szalay, A. The significance of humus in the geochemical enrichment of uranium. In Proceedings of the 2nd International Conference on the Peaceful Uses of Atomic Energy, Geneva, Switzerland, 1–13 September 1958; pp. 182–186. [Google Scholar]
  63. Hostetler, P.B.; Garrels, R.M. Transportation and precipitation of uranium and vanadium at low temperatures, with special reference to sandstone type uranium deposits. Econ. Geol. 1962, 57, 137–167. [Google Scholar] [CrossRef]
  64. Kochennov, A.V.; Zinevyev, V.; Lovaleva, S. Some features of the accumulation of uranium in peat bogs. Geochem. Int. 1965, 2, 65–70. [Google Scholar]
  65. Tayeva, N. Association of radium and uranium with peat. Geochem. Int. 1967, 4, 1168–1174. [Google Scholar]
  66. McKay, A.D.; Miezitis, Y. Australia’s uranium resources, geology and development of deposits. AGSO Geosci. Aust. Min. Resour. Rep. 2001, 1, 195. [Google Scholar]
  67. Alexandre, P.; Kyser, T.K. Geochemistry of uraniferous bitumen in the southwest Athabasca Basin, Saskatchewan, Canada. Econ. Geol. 2006, 101, 1605–1612. [Google Scholar] [CrossRef]
  68. Fuchs, S.H.J.; Schumann, D.; Williams-Jones, A.E.; Murray, A.J.; Couillard, M.; Lagarec, K.; Phaneuf, M.W.; Vali, H. Gold and uranium concentration by interaction of immiscible fluids (hydrothermal and hydrocarbon) in the Carbon Leader Reef, Witwatersrand Supergroup, South Africa. Precambrian Res. 2017, 293, 39–55. [Google Scholar] [CrossRef] [Green Version]
  69. Jaireth, S.; McKay, A.; Lambert, I. Association of large sandstone uranium deposits with hydrocarbons. Aust. Gov. Geosci. 2008, 89, 1–6. [Google Scholar]
  70. Sharon, E.; Bone, J.C.; Weaver, K.; Takacs, C.J.; Roycroft, S.; Fendorf, S.; Bargar, J.R. Complexation by organic matter controls uranium mobility in Anoxic Sediments. Environ. Sci. Technol 2020, 54, 1493–1502. [Google Scholar]
  71. Lovley, D.R.; Phillips, E.J.; Gorby, Y.A.; Landa, E.R. Microbial reduction of uranium. Nature 1991, 350, 413–416. [Google Scholar] [CrossRef]
  72. Mikutta, C.; Langner, P.; Bargar, J.R.; Kretzschmar, R. Tetra-and hexavalent uranium forms bidentate-mononuclear complexes with particulate organic matter in a naturally uranium-enriched peatland. Environ. Sci. Technol 2016, 50, 10465–10475. [Google Scholar] [CrossRef] [PubMed]
  73. Landais, P. Organic geochemistry of sedimentary uranium ore deposits. Ore Geol. Rev. 1996, 11, 33–51. [Google Scholar] [CrossRef]
  74. Xue, Z.W. Three History Analysis and Hydrocarbon Accumulation of Early Cretaceous Basin in Wunite Depression, Erlian Basin. Master’s Thesis, China University of Mining, Xuzhou, China, 2019. [Google Scholar]
  75. Nie, F.J.; Chen, A.P.; Hu, Q.H.; Shen, K.F. Discussion of the early Cretaceous sandstone type Uranium deposits, Erlian basin, Inner Mongolia. J. Stratigr. 2007, 31, 272–279. [Google Scholar]
  76. Liu, W.S.; Li, X.D.; Xue, Z.A.; Lv, Y.H.; Liu, C.H. Geochemical characteristics and geological significance of Hadatu uranium deposit in Erlian Basin, Inner Mongolia. Uranium Geol. 2020, 36, 325–335. [Google Scholar]
  77. Lu, C. Tectonic Ore-Controlling Mechanism and Uranium Metallogenic Model of Bayanwula Uranium Ore Field in Erlian Basin. Ph.D. Thesis, China University of Geosciences, Wuhan, China, 2019. [Google Scholar]
Figure 1. (a) The location of the study area shown in Figure 1b; (b) Tectonic units and Structural map of Erlian Basin showing the distribution of uranium deposits and the study area (including drill hole); U1: Bayanwula deposit; U2: Manglai deposit; U3: Saihangaobi deposit; U4: Nuheting deposit; U5: Hadatu deposit; Modified after Yan et al. (2013) [28], Nie et al. (2020) [25], Liu et al. (2020) [24].
Minerals 11 00532 g001
Figure 2. Stratigraphic column of the Erlian Basin. Modified after Nie et al. 2020 [25].
Minerals 11 00532 g002
Figure 3. Geological sketch map of typical sandstone-type uranium deposits in Erlian Basin and its metallogenic model map. Modified after Liu et al. 2013 [32].
Minerals 11 00532 g003
Figure 4. Cross section of a-b Hadatu U-deposit.
Minerals 11 00532 g004
Figure 5. Photos of U-bearing sandstone and Microscopic characteristics of organic matter in Erlian Basin. (a,b)Pictures of the representative U-bearing sandstone of Saihan Fm and different form organic matter in Uranium ore; (c) Inherited carbonaceous debris (ancient plants) OM with cell structure and mobile OM distributed along fracture of high-grade ore; (d,e) Inherited carbonaceous debris (ancient plants, fluorescence) OM with cell structure of U-bearing sandstone; (f) mobile OM (no fluorescence) distributed along fracture of reduction zone sandstone; (g) pyrite, mobile organic matter (no fluorescence) and uraninite distributed in dissolution hole of calcite in high-grade ore; (h,i) oil-gas (hydrocarbon) fluid inclusion (intensive fluorescence) distributed along fracture of quartz in U-bearing sandstone. OM: organic matter; Ur: Uraninite; Py: Pyrite; Oil-gas FI: Oil-gas fluid inclusion; T-im: transmission light image; UV-im: UV fluorescence image.
Minerals 11 00532 g005
Figure 6. Mudstone sample under the orebody of Saihan Fm (a) and Microscopic characteristics of the vertical cracks of the mudstone sample (bf); (a) Gray U-anomalous mudstone (≈80 ppm) with numerous vertical micro cracks was found under the U-mineralization sandstone of the Saihan Fm, and filled with some gray–black OMs; (b,c) Light distillates (intensive blue fluorescence), pyrite and OM distributed along the vertical cracks of mudstone; (d) BSE image shows pyrite and OM distributed along the vertical cracks of mudstone; (e,f) EDX spectrum of pyrite and OM distributed along the vertical cracks of mudstone.
Minerals 11 00532 g006
Figure 7. Microscopic characteristics of U-minerals and organic matter in the Erlian Basin. (a) Uraninite, pyrite and OM distributed along the fracture of high-grade ore; (b) Uraninite, pyrite and OM distributed along the fracture of calcite in high-grade ore; (c) Uraninite, pyrite and OM coexist in U-bearing sandstone, the OM has the characteristics of cell structure; (d) Electron backscatter image shows Uraninite (grayish white), pyrite (gray) and mobile organic matter(black) coexist in dissolution void of calcite in high-grade ore; (e,f) Mapping image shows Uraninite (yellow), pyrite (pink) and mobile organic matter (black) coexist in dissolution void of calcite in high-grade ore, (e) Multi-element composite image, (f) Single element of U image; (g) BSE image shows Uraninite (grayish white), pyrite (dark gray), molybdenite(gray) and mobile organic matter(black) coexist in dissolution voids of barite in high-grade ore; (h,i) Mapping image shows Uraninite (yellow), pyrite (light purple), molybdenite (purple) and mobile organic matter(black) coexist in dissolution voids of barite in high-grade ore, h is multi-element composite image, (i) Single element of U image; OM: organic matter; Ur: Uraninite; Py: Pyrite; Mo: molybdenite; Cal: calcite; Brt: barite; BSE: Electron backscatter image; Mapping: element Mapping image transmission light image; UV-im: UV fluorescence image. EPMA M-P: EPMA measurement point.
Minerals 11 00532 g007
Figure 8. Raman Spectrums of OM and Uraninite (OM-bearing). (a) Raman Spectrum of OM which is distributed along fracture of ore-bearing sandstone; (b) Raman Spectrum of OM which is distributed along micro-fracture of Qz in high-grade sandstone; (c) Raman Spectrum of the inherited carbonaceous debris (ancient plants, fluorescence) OM of U-bearing sandstone which has cell structure; (df) Raman Spectrum of mobile OM, OM-bearing uraninite, OM-bearing pyrite which are distribution in dissolution voids of calcite of high-grade ore. Qz: quartz; Cal: calcite.
Minerals 11 00532 g008
Figure 9. FTIR Spectrums of OM and Uraninite (OM-bearing) in Erlian Basin. (a) FTIR Spectrum of the inherited carbonaceous debris (ancient plants, fluorescence) OM of U-bearing sandstone which has cell structure; (b) FTIR Spectrum of OM which is distributed along fracture of ore-bearing sandstone; (c,d) FTIR Spectrums of mobile OM-bearing uraninite and OM which is distribution in dissolution voids of calcite of high-grade ore; Cal: calcite.
Minerals 11 00532 g009
Figure 10. Gas chromatograms and ion mass chromatograms of Soxhlet extracts of U-bearing sandstone in Erlian Basin. (a) Gas chromatograms of n-alkanes; (b) Characteristics of terpanes of Soxhlet extracts; (c) Characteristics of steranes of Soxhlet extracts.
Minerals 11 00532 g010
Figure 11. Pr/nC17-Pr/nC18 plot of the Soxhlet extracts of U-bearing sandstone in Erlian Basin.
Minerals 11 00532 g011
Figure 12. FTIR spectra of standard bitumen sample from Sichuan Basin (a) and FTIR spectra of humic acid of related references(bd). (a) FTIR spectra of standard bitumen sample from Sichuan Basin; (b) FTIR spectra of humic acid from soil reported by Jiménez-González et al. (2019); (c) FTIR spectra of humic acid from soil reported by Zhang (2020); FTIR spectra of humic acid from peat reported by Wei et al (2018).
Minerals 11 00532 g012
Table 1. Micro FTIR spectroscopy analysis result of OM.
Testing No.Sample PropertiesDistribution PatternAbsorption Peaks
FTIR-1type-I OMScatter in porosity of U-bearing sandstone826, 1033, 1182, 1242, 1457, 1508, 1604;
2871, 2928, 2962
FTIR-2type-II OMDistribution along cracks of U-bearing sandstone749, 809, 855, 1031, 1180, 1249, 1374, 1438, 1595, 1747; 2853, 2924
FTIR-3type-III OMDistribution in the dissolution voids of U-bearing sandstone749, 855, 995, 1352, 1402, 1610;
2852, 2924
FTIR-4OM-bearing UraniniteDistribution in the dissolution voids of U-bearing sandstone711, 871, 953, 1376, 1795, 2512;
2856, 2874, 2924, 2981;
Table 2. Group composition and geochemical parameters of Soxhlet extracts of ore-bearing sandstones.
Sample No.Cont Bitm-A*/%Sa-HC /%Ar-HC /%Non-HC/%As/%Main C-PeakSa/ ArPr/PhCPIOEPPr/nC17Ph/nC18
EK405-109-10.005231.5815.7944.747.89nC172.00.9121.3011.0770.3350.386
BK405-105-10.007451.352.7037.848.11nC1719.00.9642.1431.0410.3510.382
BK405-105-20.028931.512.7457.538.22nC1711.50.9791.8491.0490.3560.430
E19-02-40.000313.1310.1066.6710.10nC181.30.7921.6170.9600.3040.274
E19-02-50.002130.779.4049.5710.26nC233.31.0093.9213.9380.2880.256
E19-02-60.001620.008.3361.6710.00nC182.40.7541.4070.9200.2830.266
EZK1215-30.001330.407.6751.4210.51nC254.01.1282.1271.9070.1160.085
EZK1215-40.00008 #25.006.2553.1215.63nC234.00.6009.3962.2650.2770.344
EZK1215-80.00009 #31.116.6744.4417.78nC184.70.6221.7520.9700.3070.430
EZK1215-90.002920.0013.3351.6715.00nC251.50.5882.6492.0390.3030.394
E20-D3-30.001230.777.6932.6928.85nC194.00.7302.1381.0600.3230.347
* Calculation formula of Content of Bitm-A: X = G 2 G 1 m × 100 % . X: Content of Bitm-A, %; G1: Mass of empty weighing bottle (minimum value of two times), g; G2: Mass of weighing bottle plus Bitm-A (minimum value of two times), g; m: Mass of sample, g. Sa: Saturated; Ar: Aromatic; As: Asphaltene HC: hydrocarbon; Pr: pristane; Ph: phytane; CPI: Carbon preference index; OEP: odd-even predominace; the value with “#” is relatively low and only used as a reference value.
Table 3. δ13C composition of Soxhlet extracts of ore-bearing sandstones.
Sample No.DepositSample Propertiesδ13C V-PDB (‰)
EK405-109-1BayanwulaDark, high-grade U-ore−31.1
BK405-105-1BayanwulaDark, high-grade U-ore−33.4
BK405-105-2BayanwulaDark, high-grade U-ore−32.0
E19-02-4New area drillGrey, U-bearing sandstone−28.6
E19-02-5New area drillGrey, U-bearing sandstone−28.1
E19-02-6New area drillGrey, U-bearing sandstone−27.0
EZK1215-3HadatuDark, medium-grade U-ore−29.6
EZK1215-4HadatuDark, high-grade U-ore−30.9
EZK1215-8HadatuDark, medium-grade U-ore−28.6
Publisher’s Note: MDPI stays neutral with regard to jurisdictional claims in published maps and institutional affiliations.

