Article

Simulation-Based Analysis of Hydrometallurgical Processes. Case Study: Small-Scale Gold Mining in Ecuador

1
Escuela Superior Politécnica del Litoral, ESPOL, Facultad de Ciencias Naturales y Matemáticas, Campus Gustavo Galindo, Km. 30.5 Vía Perimetral, Guayaquil P.O. Box 09-01-5863, Ecuador
2
Independent Consultant, Stapenhorststrasse 65, 33615 Bielefeld, Germany
3
Escuela Superior Politécnica del Litoral, ESPOL, Facultad de Ingeniería en Ciencias de la Tierra, Campus Gustavo Galindo, Km. 30.5 Vía Perimetral, Guayaquil P.O. Box 09-01-5863, Ecuador
*
Author to whom correspondence should be addressed.
Submission received: 12 April 2021 / Revised: 13 May 2021 / Accepted: 14 May 2021 / Published: 19 May 2021
(This article belongs to the Special Issue Hydrometallurgy in Gold Extraction)

Abstract

:
In this work, two hydrometallurgical processes for gold recovery are explored for a small-scale gold mining case study located at Ponce Enriquez, Azuay, Ecuador. The hydrometallurgical systems consider the use of sodium cyanide and sodium thiosulfate as leaching agents, with and without the incorporation of a subsystem for residual mercury removal. The proposed processes are modelled using the commercial simulator PRO/II interconnected with a Python scientific computing environment for performing stochastic simulations. Monte Carlo simulations, in which the conversion of the main units and the prices of gold vary following a random uniform distribution, permit observing the effects of these uncertainties on key recovery and economic indicators. The results facilitate the correlation between the inputs and outputs of interest as well as the visualization of the outputs variability for an adequate assessment of the systems under study by following a technical and social responsibility approach.

1. Introduction

The COVID-19 outbreak during 2020–2021 has placed Latin America as one of the most affected regions, because of not only the casualties, but also the economic impact [1]. In this context, Ecuador has faced a GDP contraction along with the drop of oil prices worldwide, requiring foreseeing medium- and long-term economic recovery alternatives. Gold mining appears to be a reasonable path to follow with the intention of improving the economy of the country. On 15 October 2020, Ecuador was accepted as a member of the Extractive Industries Transparency Initiative (EITI), which paves the path in the direction of improving transparency and accountability in the extractive sector [2]. In the case of gold mining, it is imperative to promote its technification, particularly for the artisanal and small-scale gold mining (ASGM) sector of the country. From exploration to commercialization, the ASGM operations influence the perspective of the public opinion towards the mining industry [3]. Ecuador has been promoting its modernization to increase tax collection and to reduce the associated environmental impact [4]. Even though there are some unresolved issues, this sector has exposed benefits for rural citizens and the government along with activating local networks and economic activities [5]. Therefore, the development of technically oriented frameworks for decision-making in small-scale gold mining operations has relevant importance.
ASGM processors are important actors in the extraction and processing of gold ores. Indeed, they contribute with 85% of the total gold produced in Ecuador. Small operations distinguish for being rudimentary, which characterizes the ASGM. On the other hand, small-scale mining plants are not always artisanal. The terms “artisanal” and “small-scale” are commonly used reciprocally, but they refer to rudimentary practices and the size of operation, respectively [6]. Indeed, both actors (artisanal and small-scale processors) work typically together. For instance, in the Zaruma–Portovelo mining district (Ecuador), 87 gold processing facilities were reported in 2017 as small-scale mining plants. These facilities offer crushing, grinding, amalgamating, and leaching with cyanide as services for local artisanal miners. In 2015, it was reported that 95% of these plants used cyanidation and 65% of them used amalgamation in their operations. Treating tailings that contain residual mercury/amalgams with cyanide is a practice that has been increasing over the years. Even though this methodology increases gold recovery, it provokes a serious environmental impact [6]. Moreover, because of concerns generated by cyanide contaminated effluents, the literature reports processes that study alternative hydrometallurgical recovery methods, among which the use of sodium thiosulfate as a leaching agent seems to be a feasible approach [7].
Computer-aided tools are of remarkable importance in minerals processing [8]. Different studies involving the modelling of gold recovery applying conventional and novel hydrometallurgical paths have been proposed [9,10,11,12,13]. Nevertheless, these approaches analyze the main unit operations and involved processes separately. There are few studies reporting the use of commercial simulators handling solids and minerals. Nikkhah and Anderson [14] studied the use of simulation software in mineral processing. The package JKSimMet evaluated the sizing of mineral processing units while METSIM and IDEAS computed energy and mass balances. Lv et al. [15] addressed the use of the package METSIM for the resolution of mass and energy balances in different units, studying the extraction of vanadium, chromium, and silicon. Okudan et al. [16] utilized the process simulator SuperPro Designer for vanadium recovery along with experimental studies. More recently, Saidi and Kadkhodayan [17] employed the simulator Aspen Plus for a joint experimental and computational study of copper recovery by implementing optimization and sensitivity analyses of the leaching processes. Elomaa et al. [18] implemented a life cycle assessment using a cyanide-free cupric chloride leaching process for gold recovery, using the HSC-Sim process simulation module. To the best of our knowledge, the process simulator PRO/II has not been reported in the literature for hydrometallurgical processes of gold recovery.
In this work, four different steady-state simulations of hydrometallurgical processes for gold recovery are studied. The models are developed using the commercial simulator PRO/II. The proposed framework incorporates the abovementioned simulator and a Python environment. Both platforms are interconnected with the Python COM interface. Uncertainties are included in the conversions of the main processing units and the prices of gold. The considered hydrometallurgical processes include the use of sodium cyanide and sodium thiosulfate as leaching agents. Because of common practices evinced in small-scale gold mining operations, in which the raw mineral is previously exposed to mercury, this work incorporates a unit for residual mercury removal. The main aim of such a design proposal is to minimize the further environmental impact mercury has demonstrated to have in water bodies [19]. Monte Carlo simulations are carried out for visualizing the impact of the uncertainties in three key indicators. Finally, by combining a technical and social responsibility assessment, some perspectives are drawn, emphasizing the potential impact the proposed framework has for the small-scale gold mining case study.

2. Process Description

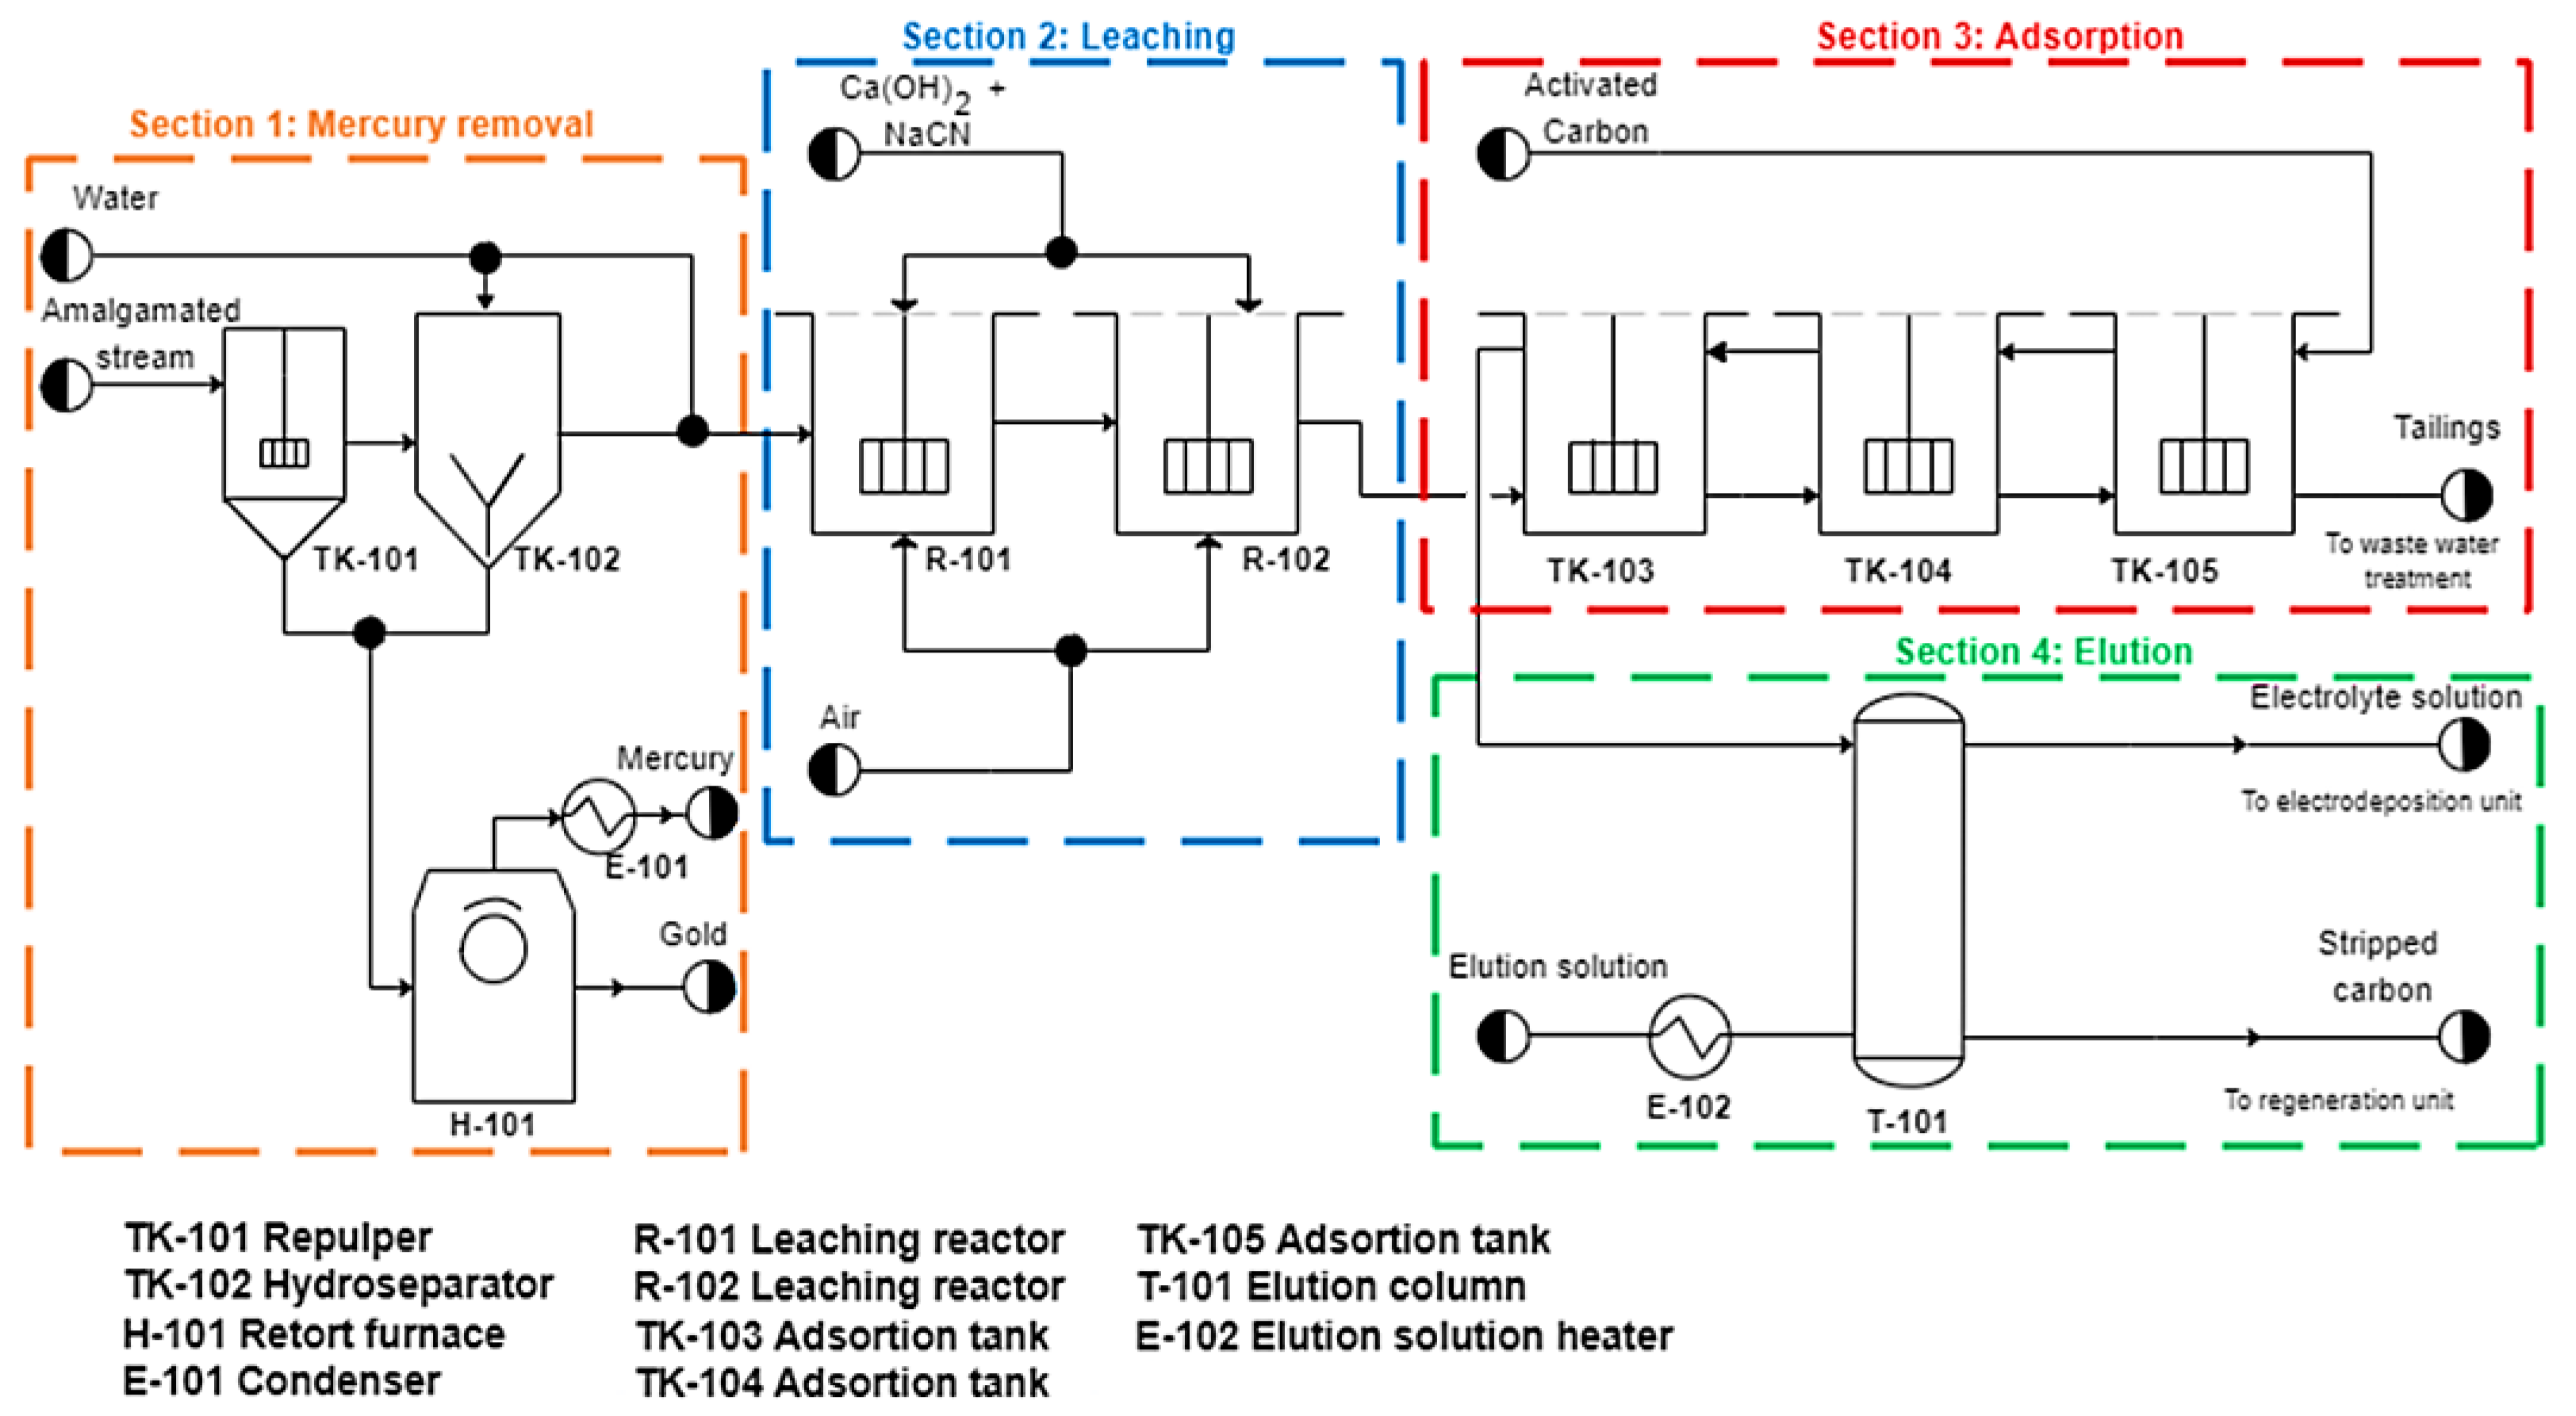
2.1. Leaching, Adsorption, and Elution Processes

2.1.1. Via Sodium Cyanide

The hydrometallurgical process can be divided into four sections: mercury removal, leaching, absorption, and elution, as illustrated in Figure 1. A stream composed by a mixture of a pulverized mineral (composed mainly of quartz and pyrite), including residual amalgam/mercury, and 40% (w/w) water enters the mercury removal section, which consists of the conical bottom repulper TK-101 and the hydro-separator TK-102. The system recovers 96% of the existing mercury and amalgams through gravimetric separation, for later sending them to the retort furnace H-101 where the stream is heated up to 700 K. At this temperature, mercury evaporates and separates from gold, facilitating the recovery of both. The vaporized mercury passes through the condenser E-101, and it is recovered in the liquid phase for its further use. This approach permits recovering up to 77% of the remnant mercury.
The stream coming from the hydro-separator TK-102 has a set point of 50% (w/w) water. This stream is referred to as a pulp and passes through two stirred tanks in series R-101 and R-102, where the leaching process included in Section 2 takes place. Here, the pulp is conditioned by adding calcium hydroxide to increase its pH to 11. Sodium cyanide is then added as a complexing agent, until it reaches a concentration of 0.15 M. Together with gold, it forms a soluble and recoverable compound. Air is injected into the reactors keeping the oxygen concentration at 8.2 mg/L to ensure slightly oxidizing conditions required for leaching. The leaching reaction that takes place inside the tanks is denoted as Equation (1) [20]:
4   Au + 8   CN +   O 2 + 2   H 2 O   4   Au ( CN ) 2 + 4   OH .
Section 3 corresponds to an adsorption system that uses activated carbon with a ratio of 20 kg per ton of mineral [20]. The system works in a counter current arrangement and includes three stages represented by TK-103, TK-104, and TK-105. Here, the gold complex is retained. It is assumed that the carbon adsorbs the complex until it reaches TK-103 and that in TK-105 the solution no longer contains gold. Thus, it is sent to a treatment system.
The carbon loaded with gold is retained due to its particle size in TK-103 with filters. Thereafter, it is sent to the elution column T-101 in Section 4. In this column, a solution composed of sodium cyanide, ethanol, and sodium hydroxide is fed at a rate of 2 the bed’s volume. The mixture, known as the elution solution, is heated up to 353 K in E-101. When the loaded carbon is put in contact with the solution, it causes the release of the gold complex by diluting it. The resultant electrolytic solution is sent to the electroplating unit to obtain the final gold product, while the utilized carbon is regenerated.

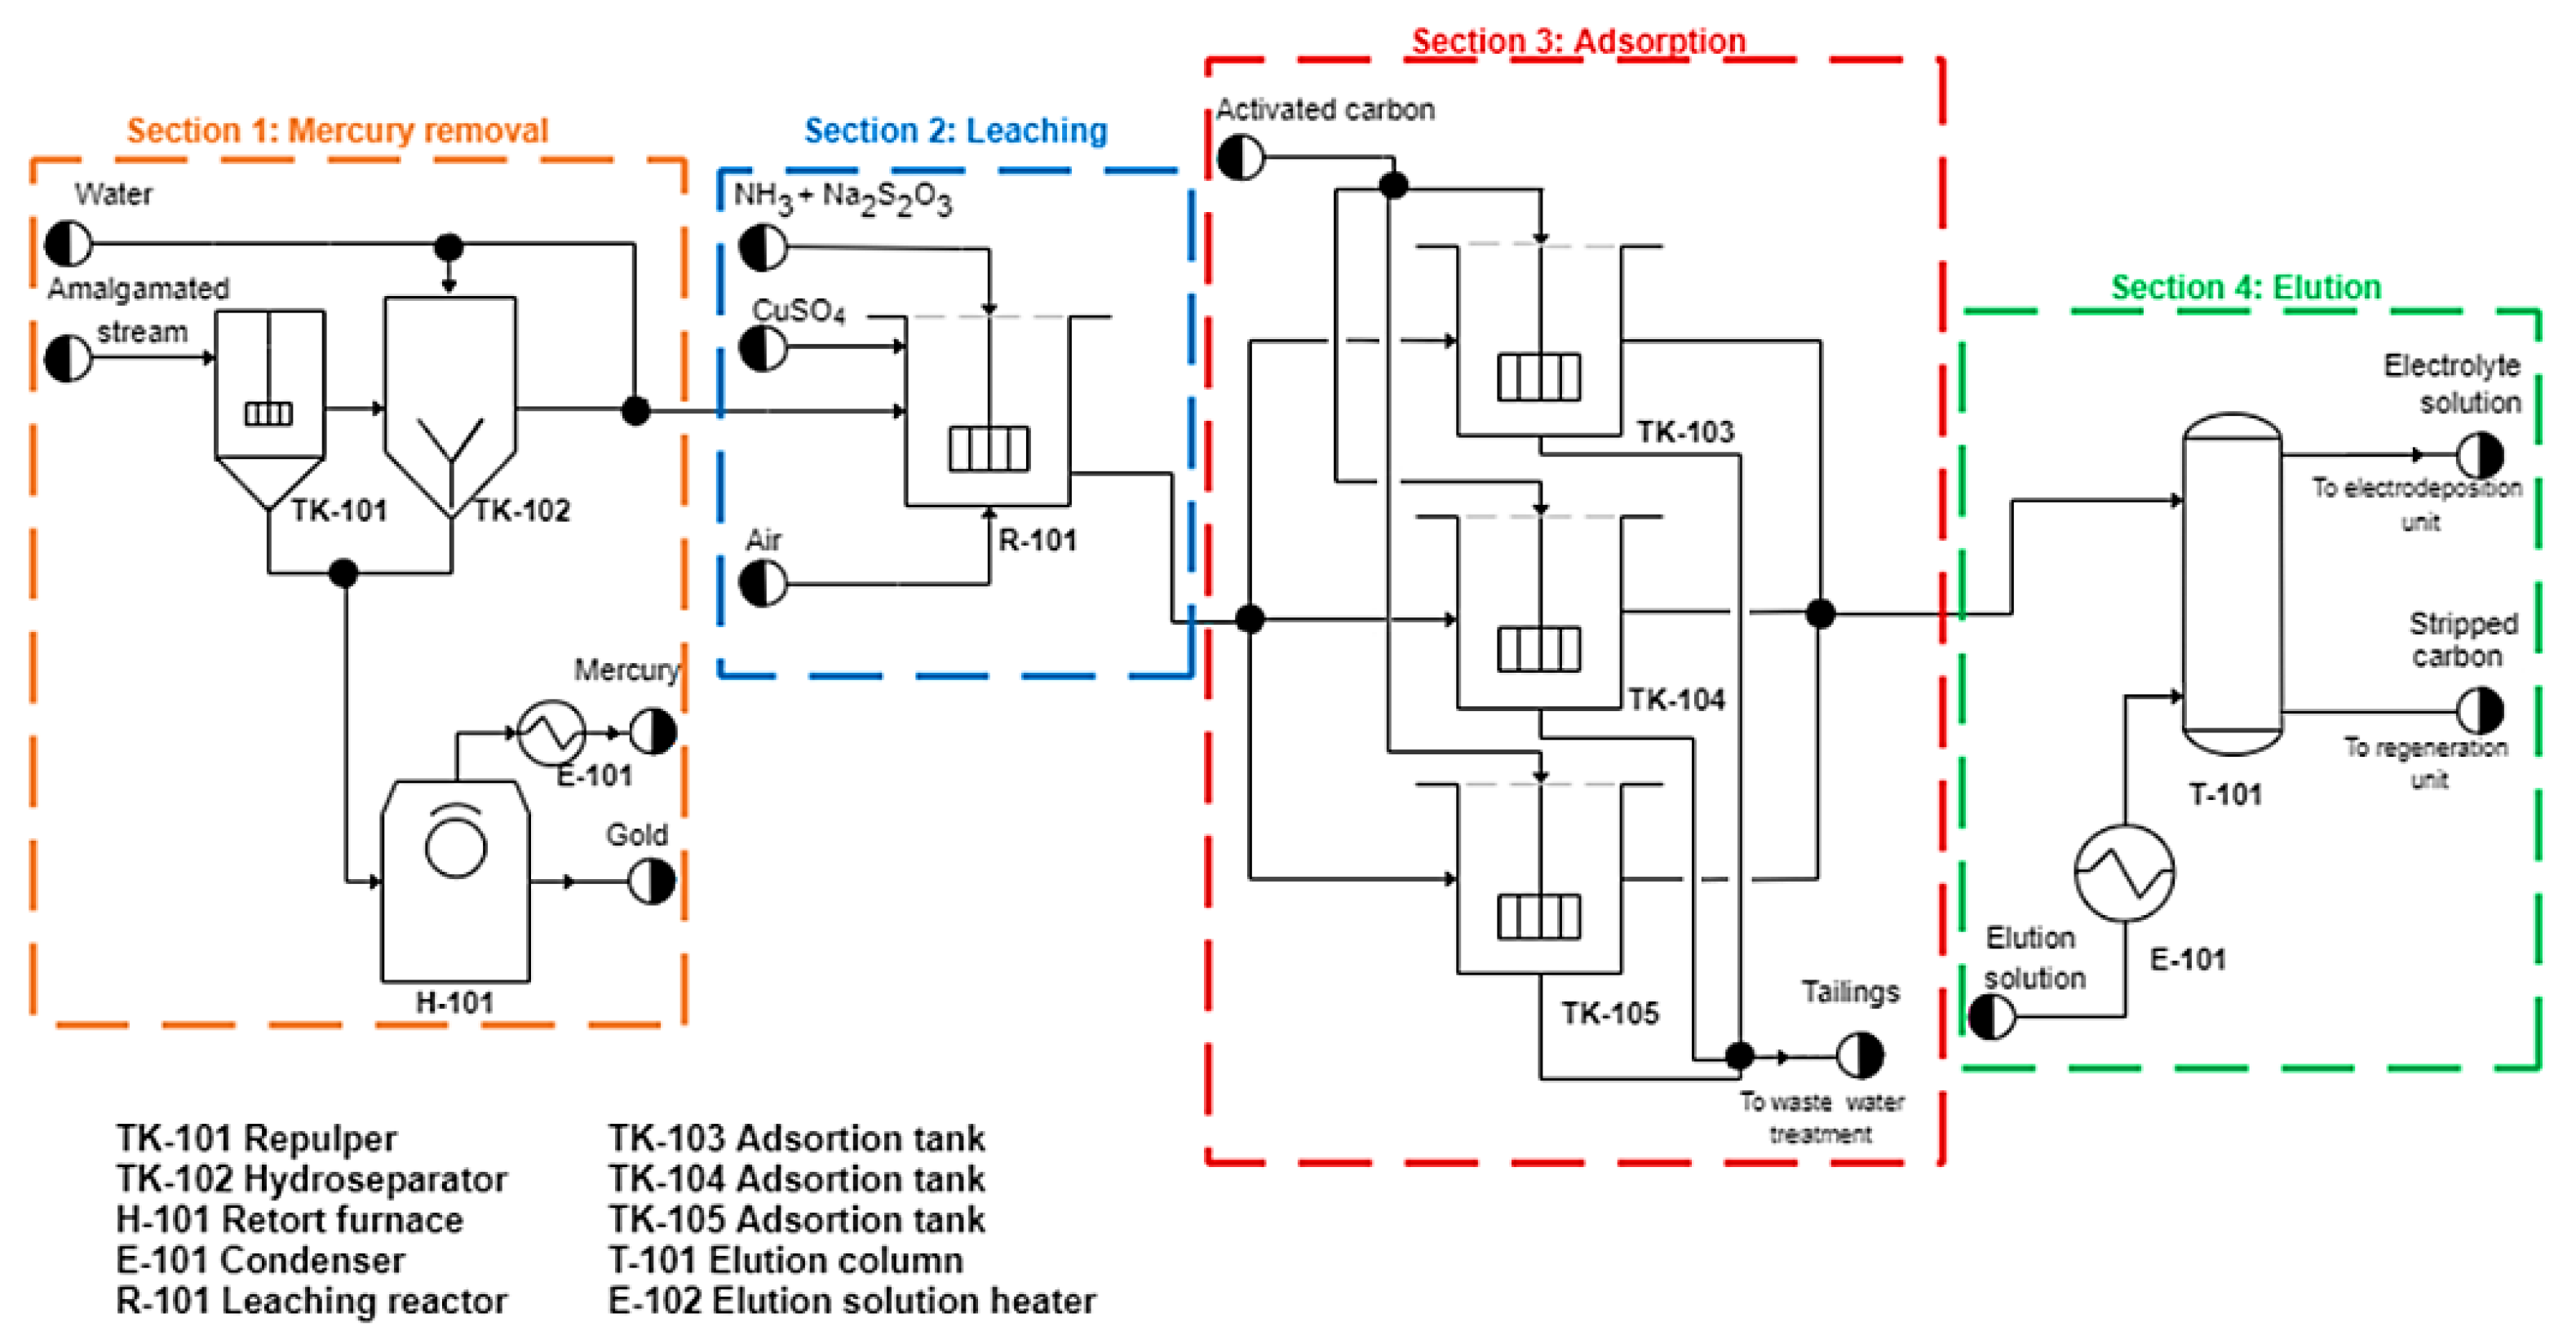
2.1.2. Via Sodium Thiosulfate

In the case of using sodium thiosulfate as the leaching agent, some modifications are included as observed in Figure 2. This system is analogous the one presented in Figure 1. However, in R-101, sodium thiosulfate is added as the leaching agent, and the ammonia dose is adjusted for reaching a 10.5 pH value. The reactor uses copper sulfate as catalyst at a concentration of 1.5 g/L. Later, it is regenerated by reducing the dissolved oxygen.
The leaching reaction for the dissolution of gold [7,21] is represented as Equation (2):
2   Au + 10   S 2 O 3 2 + 2   Cu ( NH 3 ) 4 2 + 2   Au ( S 2 O 3 ) 2 3 + 8   NH 3 + 2   Cu ( S 2 O 3 ) 3 5 .
Section 3 represents the carbon absorption system. It consists of three parallel tanks TK-103, TK-104, and TK-105. This arrangement provides a prolonged contact between the gold ion and the contact surface. Finally, in Section 4, a mixture of ammonia and sodium thiosulfate is used as an elution solution for T-101.

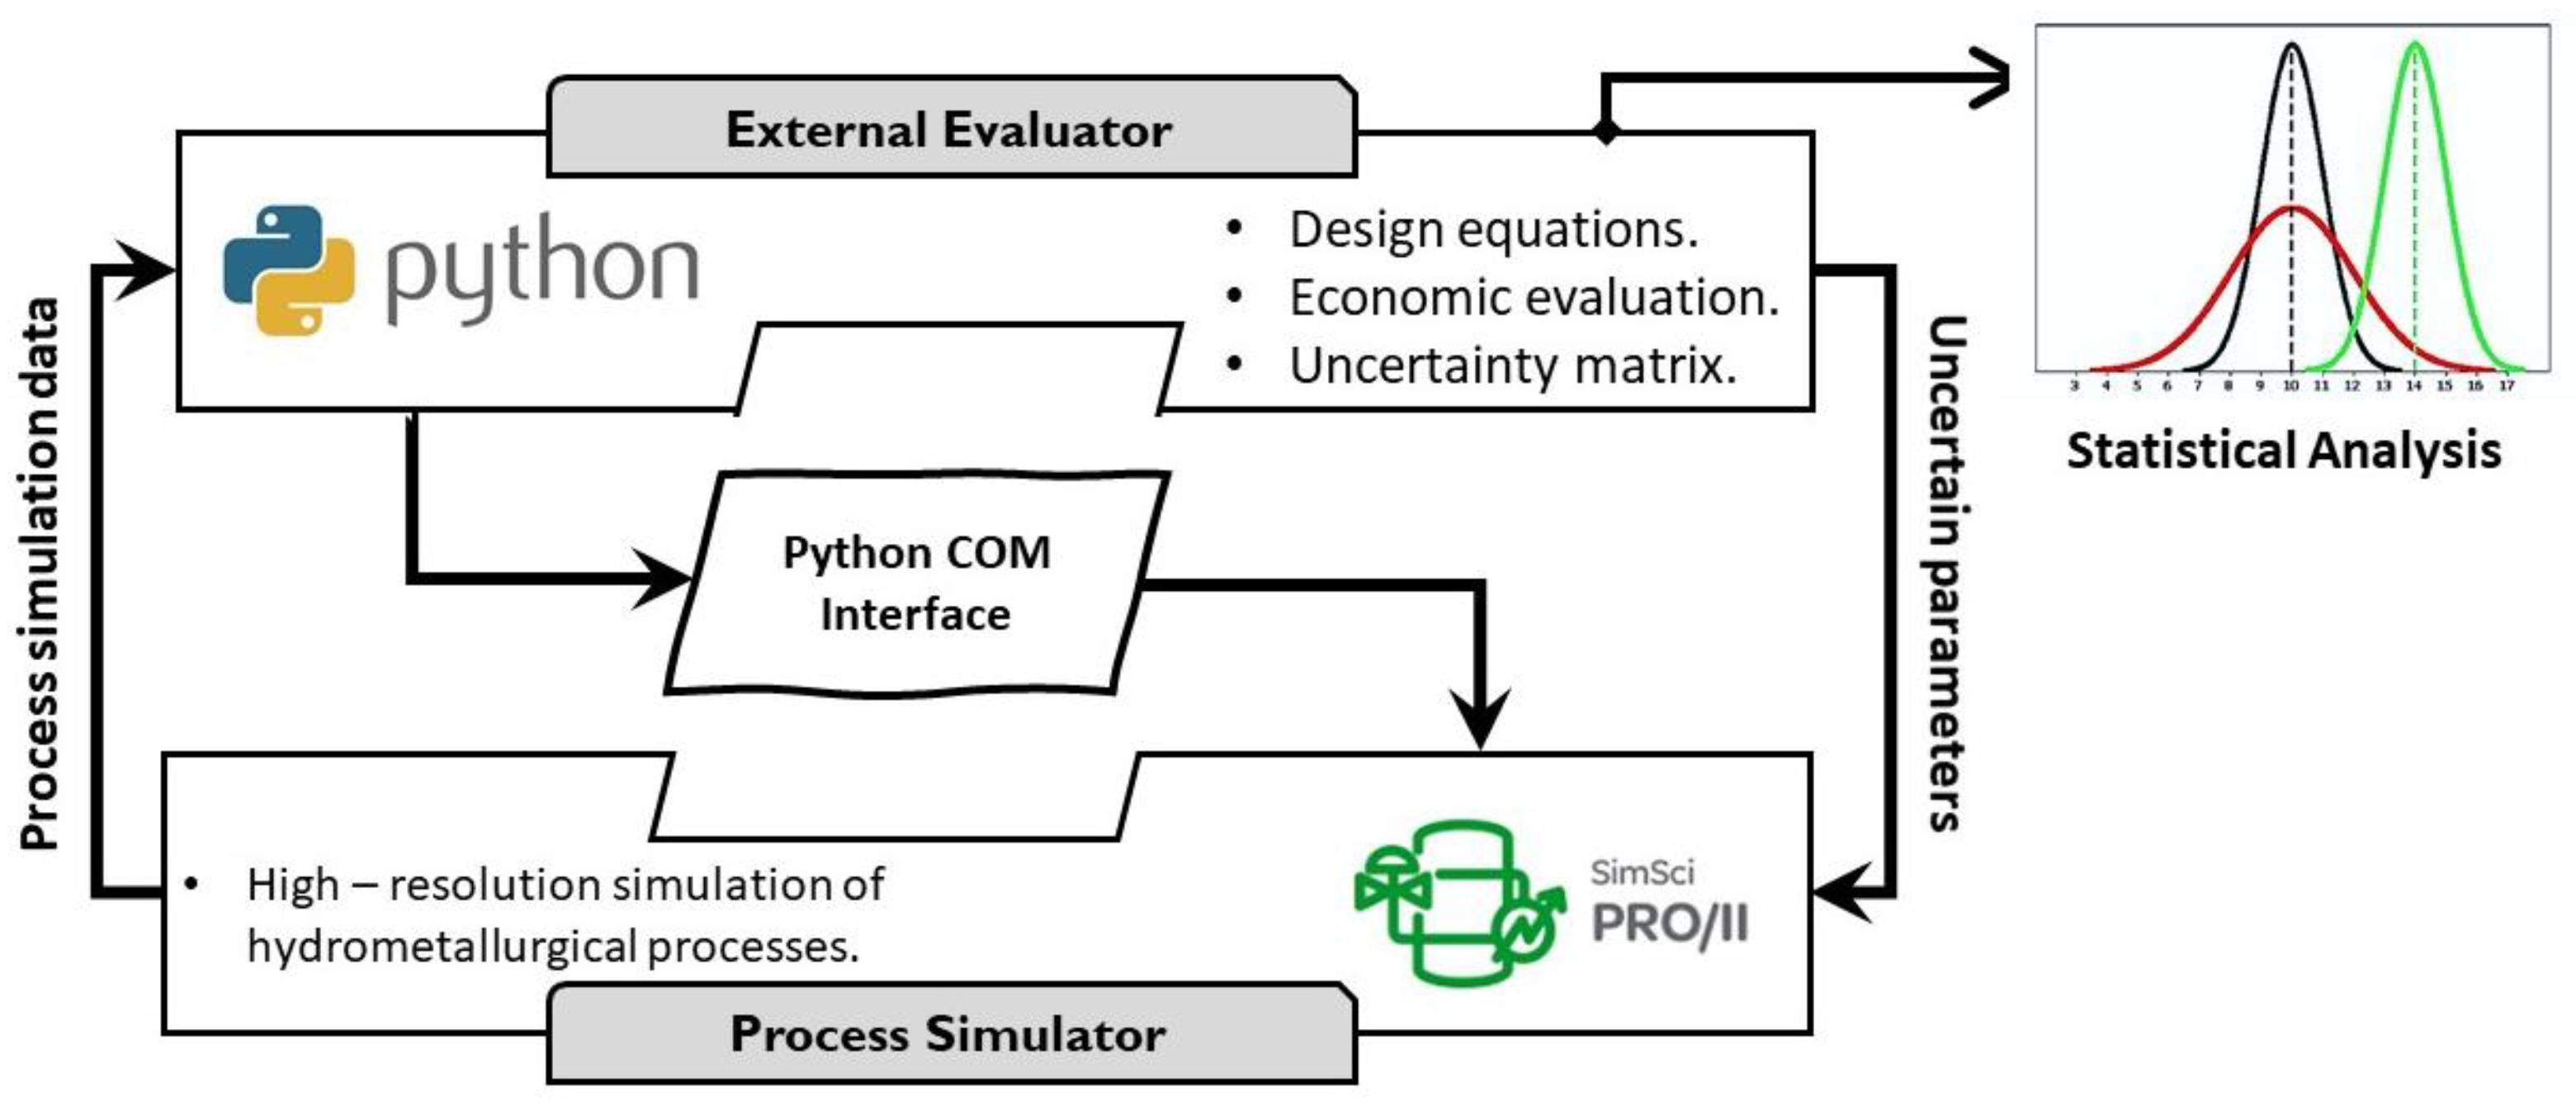
2.2. Hydrometallurgical Process Simulation

All the simulations follow a similar methodology. The components are added using the PRO/II OLILIB library, which allows working with pure electrolytes and minerals, as those found in the studied systems. For simulating the raw mineral, samples processed in a small-scale mining plant located at Ponce Enriquez, Azuay, Ecuador were considered.
Different physical and chemical analyses were performed to determine the mineral properties and its composition. Such analyses are important to understand the ore’s behavior during its processing. Physical techniques such as natural humidity and apparent and real density were carried out. In addition, the samples were analyzed using a Flame Atomic Absorption Spectrophotometer (210VGP, Buck Scientific Inc., East Norwalk, CT, USA). The mineralogical composition of the raw material was evaluated by an X-ray diffractometer instrument (X’Pert Pro, PANalytical, Almelo, The Netherlands). Finally, the granulometric analyses of the material to be leached took place using a laser scattering particle size distribution analyzer (LA-300, HORIBA Scientific, Austin, TX, USA). The information regarding the mineral composition of the studied material can be found in Table 1.
The chemicals that are not available in the databank were formulated and incorporated into the simulation through the functional groups of each compound. Solid ionic compounds were defined as UNIFAC structures including their molecular weight, density, entropy, and enthalpy. The simulations were built using two equations of state (EOS). The Soave–Redlich–Kwong (SRK) thermodynamic package was implemented for the mercury removal (System 1) because of its applicability in these processes [22]. The EOS for the leaching system and subsequent stages was the non-random two-liquid (NRTL) model, because it allows working with polar and electrolytic streams. The solution under study was assumed to be polar because it was composed of complexes soluble in water and of electrolytic nature due to the presence and formation of ions [20]. The modeling of the equipment required the use of different units available in PRO/II. The main assumptions and thinking process for selecting the unit operations are described in Table 2.
For modelling Section 1, TK-101 and TK-102 were simulated together. For the amalgam formation, a conversion reactor with a fixed value of the reaction yield was utilized. Afterwards, a counter-current decanter was incorporated. No pressure drop and a liquid recovery fraction of 0.9 were assumed. The upper outlet stream of the decanter was connected to a flash separator. This unit operated at atmospheric temperature and pressure, and it represented the separation of mercury from water. The lower stream of the decanter was connected to a stream calculator that represented the separation of the amalgam from the rest of the minerals for later mixing it with the mercury stream downstream the flash separator. This stream was connected to a retort system using a conversion reactor where the thermal decomposition of the amalgam on H-101 was simulated followed by a flash that separated gold and mercury in the vapor phase. E-101 was a heat exchanger in which the outlet temperature was specified at 298 K, ensuring a total condensation of the mercury.
The process parameters and variables of the system using sodium cyanide as a leaching agent are enlisted in Table 3. The parameters and the variables that corresponded to the system using sodium thiosulfate as a leaching agent are enlisted in Table 4. In both cases, the process variables were obtained from the literature.
To simulate the leaching reactors R-101 and R-102 (Section 2), the perfect mixing of the components was assumed by implementing mixers to add the required reagent streams. The controllers implemented in the simulation regulated the flow of the required reagents, guaranteeing that the needed conditions were accomplished inside the reactor. The calculators were implemented to estimate the pH inside the reactors by using the concentration of the bases. The calculator was connected to a controller which regulated the amount of base added to attain certain desired pH.
The counter-current adsorption tank system in Section 3 was simulated using a conversion reactor and a molar equivalency of the ion attached to the carbon. In this case, the adsorption yield was utilized as a conversion value. A stream calculator was responsible for separating the activated carbon from the rest of the components, once the adsorption finished. The three adsorption stages, established in TK-103, TK-104, and TK-105, were simulated as one, considering the overall performance of the process. Equation (3) represents the absorption equivalence reaction for the sodium cyanide system:
M n + + n   Au ( CN ) 2   M n + [ Au ( CN ) 2 ] n .
For the T-101 elution tower, a heat exchanger adjusted the elution solution to a desired temperature, followed by a conversion reactor that used the same base in adsorption but this time with the elution yield. Likewise, a stream calculator was implemented for the deactivated carbon separated from the electrolytic current. Equation (4) represents the molar equivalency for the elution of the sodium cyanide system [20]:
M n + + [ Au ( CN ) 2 ] n   M n + + n · Au ( CN ) 2 .

3. Simulation-Based Framework for Uncertainty Analysis

3.1. Problem Formulation

The literature reports that the conversions in all the stages of gold recovery could vary within a range. Due to the margin of variability of the yields in the leaching, adsorption, and elution stages, their direct impact on the process is notorious, influencing the amount of gold recovered and the economy of the business. These conversions are associated with the consumption of different amounts of reagents and utilities. In addition, the market, mainly driven by the prices of gold and its associated volatility, influences the business economy.
The reliability of a process could be evaluated by studying its uncertainties [23,24]. In this context, a stochastic analysis for evaluating the uncertain nature of the process was studied along with the influence of varying the prices of gold. The incidence of the conversion and income variations were evaluated in terms of the cash flow and profitability of the evaluated hydrometallurgical alternatives, particularized for a small-scale gold mining case study located in Ecuador.
A generic mathematical expression for analyzing the variability of outputs y k when including uncertainty is reported as Equation (5):
y k ( θ ) = c T + E [ f ( θ i j ) ] ,
subject to:
h ( θ ) = 0 ,
g ( θ ) 0 ,
θ i L B θ i θ i U B ,
where θ represents an uncertainty matrix of i generated samples and j parameters. This matrix is considered as the source of uncertainty for the high-resolution model; the outputs are composed of a deterministic term denoted by cT, which corresponds to a constant vector of unchanged parameters; the term E [ f ( θ i j ) ] represents the expected value of the outputs of interest. It considers the uncertainties, and it is a function of the uncertain parameters, θ i j ; the equality constraints, denoted by h ( θ ) , resemble the mass and energy balances of the process simulation as well as the cost estimation equations; the inequality constraints, represented by g ( θ ) , correspond to the equipment and other process design constraints. Each generated sample θ i is restricted between an upper and lower bound, represented by θ i L B and θ i U B , respectively.
In this work, both process and economic indicators were considered. The main equations studied are displayed as following:
A u r e c o v e r e d ( θ ) = A G R ( θ ) A G 100 ,
C F ( θ ) = A G R ( θ ) · c A u O P E X ( θ ) ,
P r o f i t a ( θ ) = A G R ( θ ) · c A u T A C ( θ ) ,
where
T A C ( θ ) = O P E X ( θ ) + C A P E X ( θ ) · A F ,
O P E X ( θ ) = 0.18   C A P E X ( θ ) + 1.23 ( R M C + C U t ( θ ) ) ,
C A P E X ( θ ) = 1.18   e = 1 E C B M , e ( θ ) C E P C I 2009 C E P C I b a s e ,
R M C = j = 1 R ( F j ) ( c j ) ,  
A F = i ( 1 + i ) t ( ( 1 + i ) t 1 ) ,
where A u r e c o v e r e d represents the percentage of gold recovered from the procces and it is the ratio between the amount of gold recovered in the process (AGR) and the amount of gold with the mineral (AG) multiplied by 100; C F is the cash flow, and it is the difference between the sales revenues and obtained by multiplying the AGR, the price of gold c A u , and the annualized operational expenditures ( O P E X ); P r o f i t a represents the annualized profit, and it is the difference between the sales revenues and the total annualized cost (TAC), which is the sum between the capital expenditures ( C A P E X ) and the O P E X ; the C A P E X is annualized when multiplied by the annualization factor ( A F ); the O P E X includes the raw material costs (RMC) and the utility costs (CUt). In this work, the CUt included the electricity, water, carbon reactivation, and tailings treatment. The RMC considered a total of R raw materials with an individual mass flow of F j . The C A P E X was expressed as the sum of the cost bare modules ( C B M ) of a total of E equipment required by each process. It was multiplied by the relationship between the chemical plant cost index (CEPCI) of 2019 and the base year (2001 in this work). The factor A F considered an annual interest rate (i) and the life span of the mineral processing plant (t). In this work, the values of 0.1 and 10 years were applied for both parameters, respectively [25].
Table 5 enlists the lower and upper bounds of the uncertain parameters. The operational uncertainties bounds were obtained from [17,26,27], and the range for the gold prices was defined based on the prices of this commodity between August and October 2020. Notice that the system considering sodium cyanide as the leaching agent has four process parameters and the system that uses sodium thiosulfate as the leaching agent has three process parameters. The costs of the raw materials and utilities are listed in Table 6 [25], and the prices of the reagents are detailed in Table 7. These prices were obtained from local vendors (in Ecuador).

3.2. Framework for Economic Evaluation under Uncertainty

Uncertainty can influence decision-making in every process, and typically, it is not accounted when modelling or designing a system. However, it can impact on the efficiency and the profitability of a project. To visualize and quantify the influence of uncertainties in metal recovery facilities, it is essential to consider the variability of certain exogenous parameters. In our practice, the process simulator PRO/II was connected to a Python environment through the Python COM interface [28] for evaluating the variability of three outputs from different hydrometallurgical alternatives.
The framework utilized the packages PRO/II Process Engineering 10.2 (64 bit) and Spyder (Python 3.7). The experiments in this work were performed in a laptop PC Intel Core™ i7-8565U CPU @ 1.80 GHz with 16.00 GB of installed RAM. To test the framework, 1200 simulations of each hydrometallurgical configurations were evaluated.
A schematic of the framework is included in Figure 3. The proposed approach adopts a simulation-based paradigm that exploits the accuracy of the high-resolution model, and it is based on the methodology proposed in [29]. The benefits of the process simulator include the reliability of internal mass and energy balances as well as internally built-in computations. The interface with Python was set as an external evaluator tool.
The connection between Python and PRO/II was established through the Component Object Model (COM) command which allows a bi-directional communication between Python and PRO/II. PyWin32, an extension package for Windows available in Python, allows accessing the COM to manipulate other applications while using the Python programming interpreter. Once the communication between both platforms is established, the PRO/II COM server allows access to the process simulation model to read and write values on the simulation’s objects and streams. This promotes a continuous and iterative interaction between the process simulation and Python.

4. Results

In terms of computational time, the simulations that used sodium cyanide as the leaching agent required 5.62 and 7.32 h for the cases that excluded and included Hg treatment, respectively. The simulations that used sodium thiosulfate as the leaching agent required 5.60 and 9.98 h for the cases that excluded and included Hg treatment, respectively.
Figure 4 and Figure 5 illustrate the resultant probability density functions for A u r e c o v e r e d ( θ ) and P r o f i t a ( θ ) , respectively. The blue distributions correspond to sodium thiosulfate, and the black distributions correspond to sodium cyanide. The Y-axis is the probability of the density function. This function describes the relative probability at which the output variable will take certain value within a probable region limited by the area under the curve. The dashed lines correspond to the cases that do not include the mercury removal section, while the continuous lines are the systems that include the mercury removal section. It is important to mention that the cases that do not include these removal units include an additional cost for treating the generated contaminated tailings. On the other hand, the systems that include the mercury removal section have the advantage of recovering additional gold, which otherwise would be discarded into the disposal tailings.
When analyzing the probability density function in Figure 4 and Figure 5, it was observed that the greatest existing risk fell in the processes that used sodium thiosulfate. This observation showed a greater degree of variability/dispersion through the widening of its distributions when compared to the processes using sodium cyanide, in which the potential risk was lower.
Table 8 displays a summary statistic of the three studied outputs A u r e c o v e r e d ( θ ) , C F ( θ ) , and P r o f i t a ( θ ) . The included statistics in this work are the mean or expected value, standard deviation of the outputs ( σ y ), and minimum and maximum values achieved in the evaluated simulations. Case 1 and case 2 corresponded to the cases that used sodium cyanide as the leaching agent excluding and including the mercury removal section, respectively. Case 3 and case 4 were the cases that used sodium thiosulfate as the leaching agent excluding and including the mercury removal section, respectively. Notice that the cases that used sodium cyanide had the highest annualized profitability which was a consequence of a higher gold recovery. In addition, these cases showed a higher cash flow, which represents a good indicator for the business. A particular compelling factor was observed in terms of the process reliability. The systems using sodium cyanide showed a smaller σ y in all results, implying that this leaching agent leads to a configuration less sensitive to the process and market uncertainties. On the other hand, we can observe the benefit of including the mercury removal system, because gold was recovered from tailings generating a positive impact on the gold recovery facility. These results could be used as a guidance for decision-making in small-scale mining facilities.

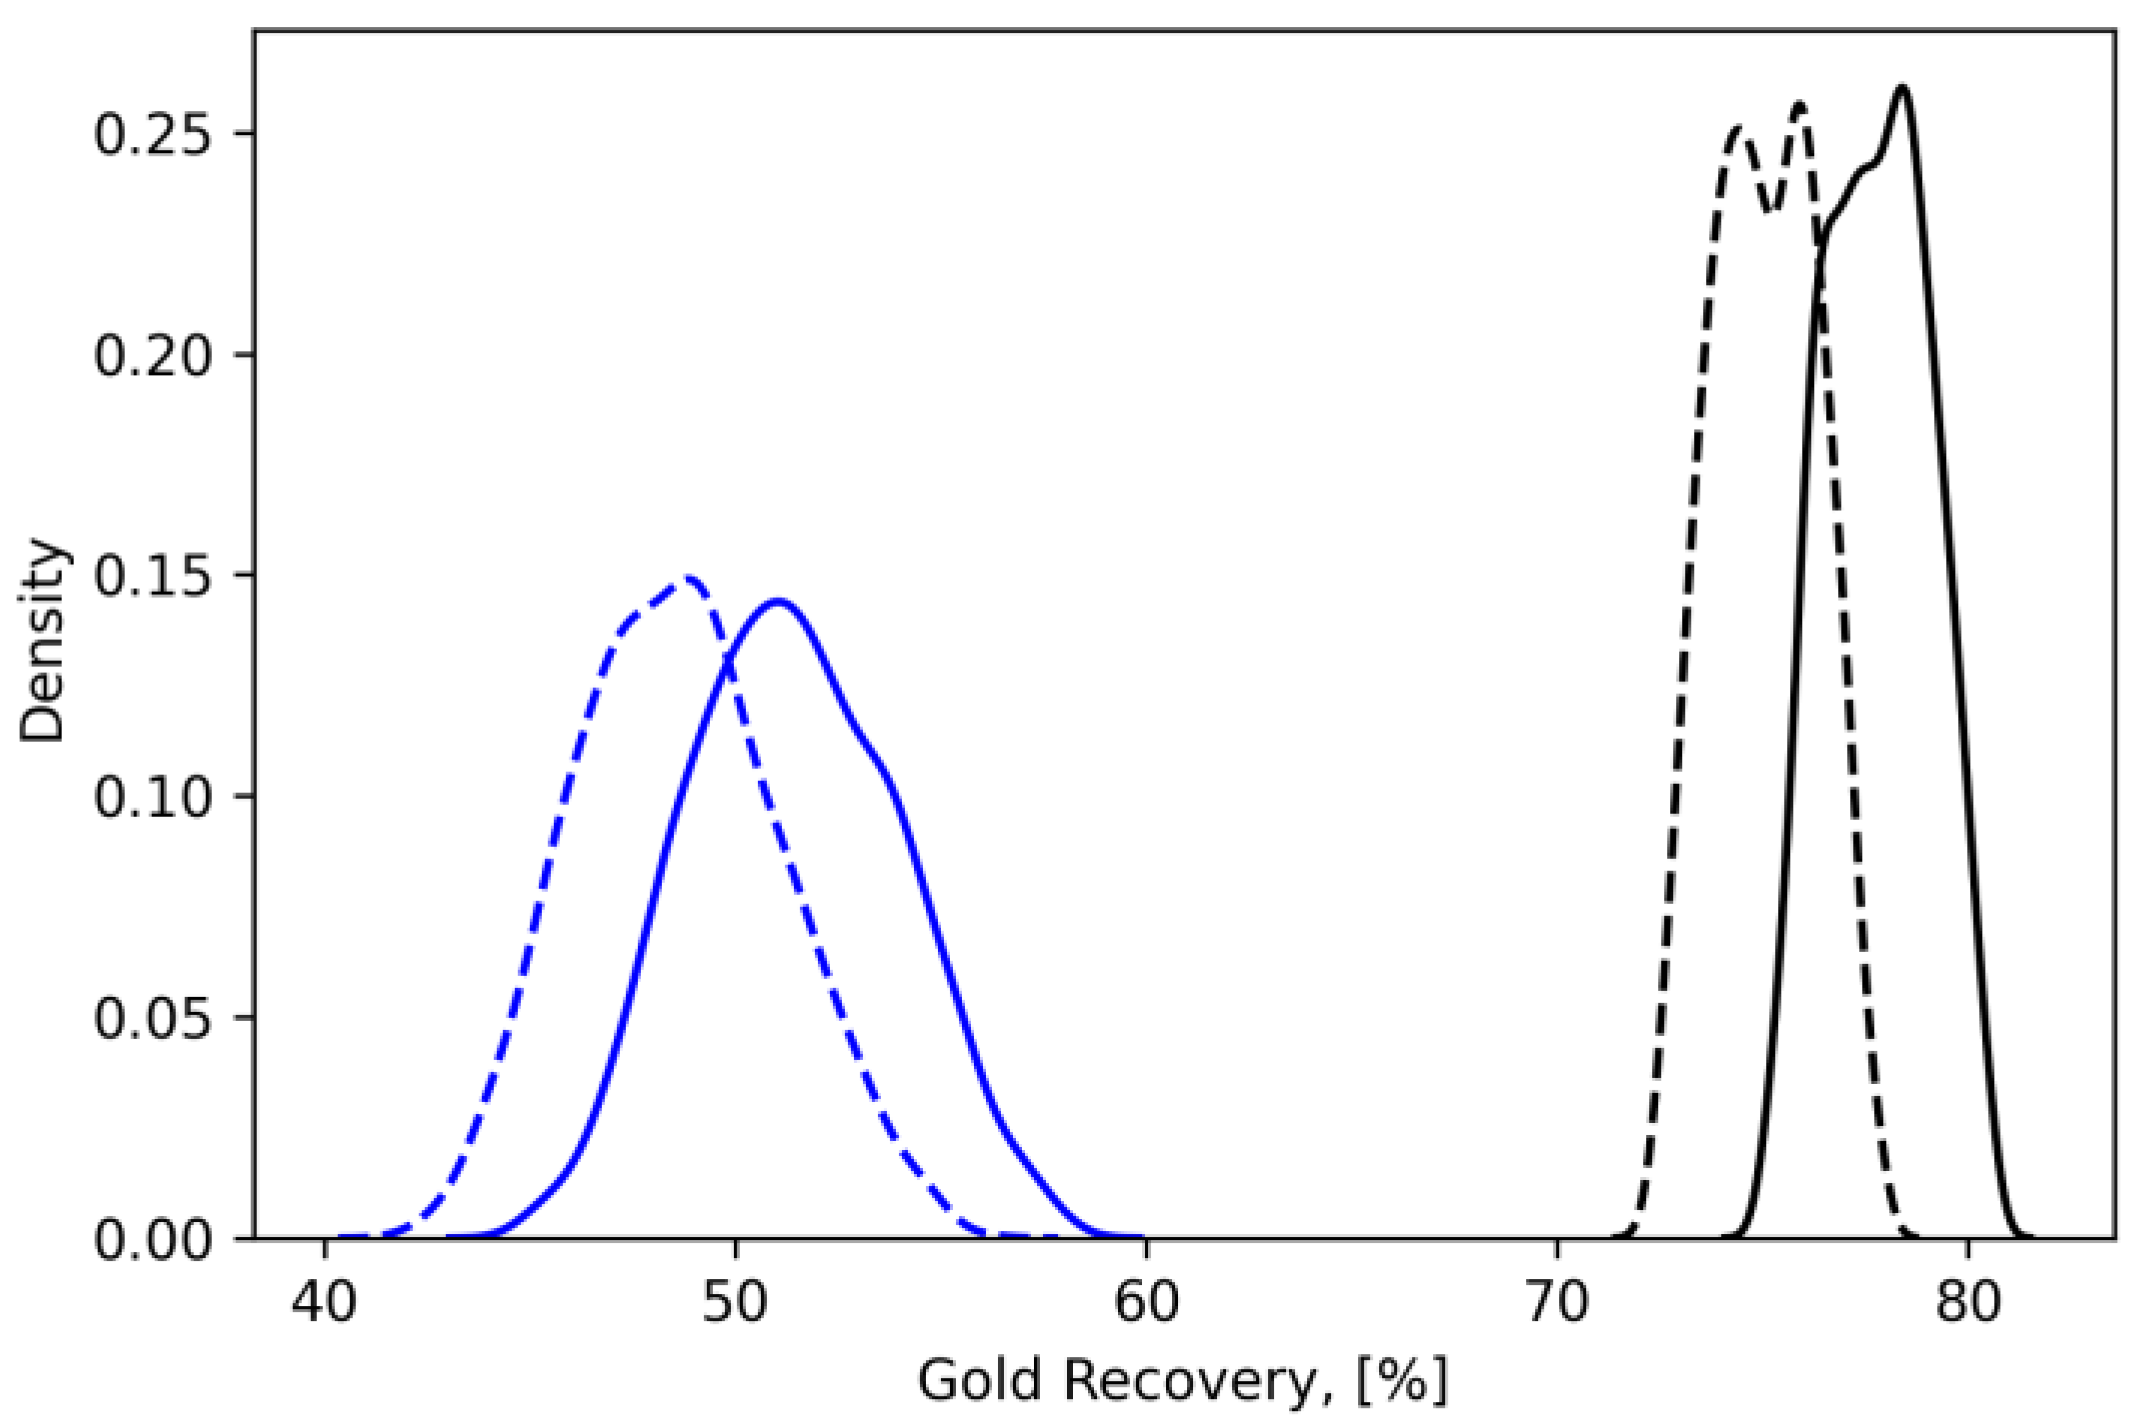
4.1. Hydrometallurgy Process Using Sodium Cyanide

In Figure 6, the outputs of the processes using sodium cyanide as the leaching agent are contrasted. The three studied outputs were evaluated for the system excluding (case 1) and the system including (case 2) the mercury removal section. The diagonal illustrates the type of distribution of the output variables. Notice that all cases resembled a normal-like distribution. Furthermore, the dispersion points show each possible combination of the outputs for two random variables according to their probabilities of occurrence. The outputs showed a positive relationship among them, meaning that a greater value of one will cause a greater value of the other.
A Pearson’s coefficient matrix permits constructing a visualization, in the form of a heat map and the relationship between the uncertain inputs and the outputs of interest. Such representation permits quickly identifying the incidence patterns and discovering the relationships among inputs and outputs. Depending on the value of the Pearson’s coefficient, certain relationship could be deducted. A value of 0 indicates that there is no relationship, while −1 or +1 implies a perfect negative or a perfect positive relationship, respectively.
Figure 7 shows the Pearson’s coefficients heat map correlations for the systems that used sodium cyanide as the leaching agent. Figure 7a corresponds to case 1, which did not include the mercury removal section, and Figure 7b corresponds to case 2, which included the mercury removal section. The variables denoted as θ 1 5 are the uncertain inputs, in which the last one corresponds to the price of gold as previously introduced in Table 5. The remainder three variables ( y 1 3 ) are the outputs of interest in the following order A u r e c o v e r e d ( θ ) , C F ( θ ) , and P r o f i t a ( θ ) , respectively. Both cases are essentially similar with some minor differences. Overall, the results showed a strong correlation of the elution process conversion on A u r e c o v e r e d ( θ ) followed by the adsorption conversion with respect to the same output. In addition, the elution process conversion and the adsorption conversion showed relevant influence on C F ( θ ) and P r o f i t a ( θ ) . Finally, the price variability mainly affected the C F ( θ ) and the P r o f i t a ( θ ) . Based on these results, a key operational variable and unit to pay attention is the elution process, as it influences the overall gold recovery and the economy of the process.

4.2. Hydrometallurgy Process Using Sodium Thiosulfate

In Figure 8, the outputs of the systems using sodium thiosulfate as the leaching agent were evaluated. The three outputs were studied for the proposed alternatives, which exclude the mercury removal section (case 3) and include the mercury removal section (case 4). The diagonal represents the type of distribution for the output variables. Similarly, all cases exhibit a normal-like distribution. The outputs showed a positive relationship among them, meaning that a greater value of one will cause a greater value of the other.
Figure 9 shows the Pearson’s coefficients heat map correlations for the systems that use sodium thiosulfate as the leaching agent. Figure 9a corresponds to case 3 which did not include the Hg recovery unit, and Figure 9b corresponds to case 4 which included the Hg recovery unit. The variables denoted as θ 1 4 are the uncertain inputs, in which the last one corresponds to the price of gold as previously introduced in Table 5. The remainder three variables ( y 1 3 ) are the outputs of interest as already explained in the previous section. For both cases, they were essentially similar with some minor differences. For the sodium thiosulfate systems, the influence of gold prices lost relevance. In fact, the sections that appear to be important and more influential in the economy are the leaching and adsorption processes. A u r e c o v e r e d ( θ ) showed a strong correlation with the leaching conversion, which implies that the operation and control of this process stage is a key factor in achieving the good economy of the system. Finally, the elution process lost importance in these cases.

5. Social Responsibility

International experiences show that the nature of the ASGM is a major challenge for the implementation of cleaner technologies. The social and cultural context of small-scale gold mining and its informality is a barrier for mercury recovery and elimination, as well as for gold recovery following more sustainable and environmentally friendly pathways. These topics have been addressed by different governmental and corporate programs, with some of them driven by international large-scale mining (LSM) companies for more than two decades in Africa, Latin America, and Asia.
None of the international agreements is better for this concern than the Minamata Convention on mercury elimination, addressed by several governmental and regional programs, such as the UNDP Planet Gold in the Andean countries. Any progress in this direction requires a step-by-step approach to the ASGM actors and an appropriated change management.
In some cases, gradual mercury reduction and mercury-free gold recuperation could be achieved at a greater scale. Important initiatives correspond to technical assistance and learning programs regarding mineral pre-selection (vs. whole ore amalgamation), community-based retorts, and gold recovery with gravimetric methods. Another change approach is local buying platforms for artisanal miners and women minerals selectors to avoid domestic amalgamation or through local trading platforms. For instance, it is the aim of the Ecuadorian Central Bank to buy gold from artisanal- and small-scale miners for a market price in cooperation with area rehabilitation programs of the Ecuadorian National Mining Company (ENAMI) [30,31].
In several parts of the world, small retort equipment has been provided to ASGM groups, but in locations where its operation is not accompanied over time; after finishing the programs, miners tend to re-use amalgamation after project closing. The lesson learnt is that programs should be developed by miners themselves for achieving mercury elimination at a higher scale.
After international and national legislations have been changed to commit to phasing mercury out, the ASGM development programs are focusing more on formalization and organizational development. This offers access to credits, better technologies, and markets and incentives for organizational development. On the other hand, this establishes a clear crossroad, going from formalization (mercury elimination) or falling out of the scope of programs, which might foil the current achievements.
Unfortunately, the pandemic situation increases the risks of a new wave of strong poverty, driving migration into mining areas which might mean that illegal gold mining and mercury use is a bigger challenge than ever before for the eco-systems. The key lesson learnt from all programs is that the lever for change management are economic incentives through commercial platforms for buying gold at a commercial price, and offering further incentives for development as proposed by CSR-systems like Fairtrade [32] and Fairmined [33] certification.
More effective step-by-step programs towards development could be small-scale gold miners located at concessions of LSM companies. In this regard, LSM companies assume the responsibilities for small-scale and artisanal miners in their concessions and surrounding areas. In this context, computer-aided tools, as the proposed framework, could become more accessible for ASGM decision-makers if promoted by LSM companies. These tools could illustrate the bigger picture of different processing techniques as well as the advantages of recovering remanent mercury. Such an approach could encourage more beneficial and sustainable operations in the ASGM sector once applied as a common practice.

6. Discussion and Conclusions

A simulation-based strategy for evaluating hydrometallurgical alternatives was developed using tailor-made computer-aided tools combined with commercial process simulation software. The framework developed in this work aims to serve as a decision support tool for the mining sector even though the case study focused on small-scale gold mining in Ecuador. Indeed, this sector (ASGM) requires to include more technical, sustainable, and profitable operations.
The high-resolution simulation of different processes for gold recovery was evaluated including uncertainties in the conversion stages and the gold prices. These simulations were interconnected with a Python environment for its stochastic analysis and further statistical assessment. Four different scenarios were simulated using PRO/II. The considered hydrometallurgical processes included the use of sodium cyanide and sodium thiosulfate as the leaching agents and with and without the removal of residual mercury. For the evaluated scenarios, the systems that used sodium cyanide as the leaching agent were the most profitable hydrometallurgical processes, especially the one that included the removal of mercury. In addition, these systems exhibited a higher reliability, because their standard deviations were lower. Such a finding should not undermine the use of more cleaner leaching pathways (e.g., sodium thiosulphate). Indeed, it should encourage the study of applying incentives that promote the use of more sustainable processes.
In terms of the environmental perception, the use of sodium thiosulfate is more competitive when compared with cyanide solutions. In this study, environmental indicators were not included, but the literature highlights that safe and clean reagents are of remarkable importance for public perception [7]. However, small-scale mining operations have the priority of incorporating mercury removal systems. This work concludes that such practices could bring additional economic benefits due to the amalgam recovery and consequent increase of gold recovery and annualized profitability as observed in Figure 4 and Figure 5. These benefits do not exclude the already existing incentives regarding the Fairtrade and the Fairmined certification for gold commercialization. Overall, the combination of better and more sustainable practices, guided by technologically oriented frameworks as the proposed one, have the potential of improving the ASGM sector in Ecuador and to bring benefits for all the actors.

Author Contributions

Conceptualization: S.D.S.; methodology, S.D.S. and Y.G.; software, P.C. and J.C.G.; validation, S.D.S. and E.P.-C.; formal analysis, S.D.S. and Y.G.; writing of the original draft preparation, P.C. and J.C.G.; writing of review and editing, S.D.S., Y.G., E.P.-C., and R.K.; visualization, S.D.S. and J.C.G. All authors have read and agreed to the published version of the manuscript.

Funding

This research received no external funding.

Institutional Review Board Statement

Not applicable.

Informed Consent Statement

Not applicable.

Data Availability Statement

Data regarding the results of the simulations of the studied hydrometallurgical processes are available in the following repository: https://github.com/RockyRambo/Simulation-Based-Analysis-of-Hydrometallurgical-Processes.git (accessed on 13 May 2021).

Acknowledgments

The authors would like to acknowledge AVEVA for facilitating the process simulator PRO/II 10.2 under the academic program license for its use at the Polytechnic University of the Coast (ESPOL), Guayaquil, Ecuador. In addition, thanks are given to Juan M. Menéndez-Aguado from the Polytechnic University of Mieres, University of Oviedo, for providing important suggestions and comments on this manuscript.

Conflicts of Interest

The authors declare no conflict of interest.

References

  1. Hevia, C.; Neumeyer, A. A Conceptual Framework for Analyzing the Economic Impact of COVID-19 and its Policy Implications. UNDP LAC441 COVID-19 Policy Doc. Ser. 1 2020, 1, 29. [Google Scholar]
  2. EITI. Extractive Industries Transparency Initiative—Ecuador. Available online: https://eiti.org/es/implementing_country/98 (accessed on 11 May 2021).
  3. Velásquez-López, P.C.; Páez-Varas, C.; Benavides-Zúñiga, X.; Gallegos, F.; Fallon, G. Women mine-rock waste collectors in artisanal and small-scale mining in Ecuador: Challenges and opportunities. Extr. Ind. Soc. 2020, 7, 1579–1586. [Google Scholar] [CrossRef]
  4. Thomas, M.J. Ecuador Gold Supply Chain: Analysis of Government Intervention in the Artisanal Mining Sector. Ph.D. Thesis, The University of British Columbia, Vancouver, BC, Canada, 2019. [Google Scholar]
  5. Gaudry, K.H.; Charro, D.M.; Villacreses, G.; Castillo, W.; Shaban, A. Estimating scales of gold ore production and processing in Zaruma and La Merced de Buenos Aires, Ecuador: Electrical power consumption as an indirect metric. Extr. Ind. Soc. 2020, 7, 847–854. [Google Scholar] [CrossRef]
  6. Gonçalves, A.O.; Marshall, B.G.; Kaplan, R.J.; Moreno-Chavez, J.; Veiga, M.M. Evidence of reduced mercury loss and increased use of cyanidation at gold processing centers in southern Ecuador. J. Clean. Prod. 2017, 165, 836–845. [Google Scholar] [CrossRef]
  7. Aylmore, M.G. Thiosulfate as an Alternative Lixiviant to Cyanide for Gold Ores; Elsevier B.V.: Amsterdam, The Netherlands, 2016; ISBN 9780444636584. [Google Scholar]
  8. Cisternas, L.A.; Lucay, F.A.; Botero, Y.L. Trends in modeling, design, and optimization of multiphase systems in minerals processing. Minerals 2020, 10, 22. [Google Scholar] [CrossRef] [Green Version]
  9. Ahmed, F.E.; Young, B.D.; Bryson, A.W. Comparison and modelling of the adsorption kinetics of gold cyanide onto activated carbon and resin in a silica slurry. Hydrometallurgy 1992, 30, 257–275. [Google Scholar] [CrossRef]
  10. Yin, X.; Opara, A.; Du, H.; Miller, J.D. Molecular dynamics simulations of metal-cyanide complexes: Fundamental considerations in gold hydrometallurgy. Hydrometallurgy 2011, 106, 64–70. [Google Scholar] [CrossRef]
  11. Khalesi, M.R.; Zarei, M.J.; Sayadi, A.R.; Khoshnam, F.; Hemmati Chegeni, M. Development of a techno-economic simulation tool for an improved mineral processing plant design. Miner. Eng. 2015, 81, 103–108. [Google Scholar] [CrossRef]
  12. Karrech, A.; Attar, M.; Oraby, E.A.; Eksteen, J.J.; Elchalakani, M.; Seibi, A.C. Modelling of multicomponent reactive transport in finite columns—Application to gold recovery using iodide ligands. Hydrometallurgy 2018, 178, 43–53. [Google Scholar] [CrossRef]
  13. Jun, Z.; Hua, Y.; Hongxia, Y.; Zhongda, T.; Runda, J. Gold recovery modeling based on interval prediction for a gold cyanidation leaching plant. IEEE Access 2019, 7, 71511–71528. [Google Scholar] [CrossRef]
  14. Nikkhah, K. Role of Simulation Software in Design and Operation of Metallurgical Plants: A Case Study. Available online: https://www.andritz.com/resource/blob/14794/3d282780924827727a1efc8a5953f0dc/aa-automation-simulation-metallurgical-plants-data.pdf (accessed on 15 May 2021).
  15. Lv, Y.; Zheng, S.; Du, H.; Wang, S.; Zhang, Y. The application of metsim in hydrometallurgy process: A case study. Adv. Mater. Res. 2012, 581–582, 988–995. [Google Scholar] [CrossRef]
  16. Okudan, M.D.; Akcil, A.; Tuncuk, A.; Deveci, H. Effect of parameters on vanadium recovery from by-products of the Bayer process. Hydrometallurgy 2015, 152, 76–83. [Google Scholar] [CrossRef]
  17. Saidi, M.; Kadkhodayan, H. Experimental and simulation study of copper recovery process from copper oxide ore using aspen plus software: Optimization and sensitivity analysis of effective parameters. J. Environ. Chem. Eng. 2020, 8, 103772. [Google Scholar] [CrossRef]
  18. Elomaa, H.; Rintala, L.; Aromaa, J.; Lundström, M. Process simulation based life cycle assessment of cyanide-free refractory gold concentrate processing—Case study: Cupric chloride leaching. Miner. Eng. 2020, 157, 106559. [Google Scholar] [CrossRef]
  19. Pesantes, A.A.; Carpio, E.P.; Vitvar, T.; López, M.M.M.; Menéndez-Aguado, J.M. A multi-index analysis approach to heavy metal pollution assessment in river sediments in the Ponce Enríquez Area, Ecuador. Water 2019, 11, 590. [Google Scholar] [CrossRef] [Green Version]
  20. Marsden, J.O.; House, C.I. The Chemistry of Gold Extraction, 2nd ed.; Society for Mining, Metallurgy, and Exploration (SME): Englewood, Colorado, 2005; ISBN 9780873352741. [Google Scholar]
  21. Zhang, S.; Nicol, M.J. An electrochemical study of the dissolution of gold in thiosulfate solutions. Part II. Effect of Copper. J. Appl. Electrochem. 2005, 35, 339–345. [Google Scholar] [CrossRef]
  22. Khalifa, M.; Lue, L. A group contribution method for predicting the solubility of mercury. Fluid Phase Equilib. 2017, 432, 76–84. [Google Scholar] [CrossRef] [Green Version]
  23. Geraili, A.; Salas, S.; Romagnoli, J.A. A Decision Support Tool for Optimal Design of Integrated Biorefineries under Strategic and Operational Level Uncertainties. Ind. Eng. Chem. Res. 2016, 55, 1667–1676. [Google Scholar] [CrossRef]
  24. Salas, S.D.; Geraili, A.; Romagnoli, J.A. Optimization of Renewable Energy Businesses under Operational Level Uncertainties through Extensive Sensitivity Analysis and Stochastic Global Optimization. Ind. Eng. Chem. Res. 2017, 56, 3360–3372. [Google Scholar] [CrossRef]
  25. Turton, R.; Bailie, R.C.; Whiying, W.B.; Shaeiwitz, J.A. Analysis, Synthesis, and Design of Chemical Processes, 3rd ed.; Pearson Education, Inc.: London, UK, 2008; ISBN 9780132618120. [Google Scholar]
  26. Khosravi, R.; Azizi, A.; Ghaedrahmati, R.; Gupta, V.K.; Agarwal, S. Adsorption of gold from cyanide leaching solution onto activated carbon originating from coconut shell—Optimization, kinetics and equilibrium studies. J. Ind. Eng. Chem. 2017, 54, 464–471. [Google Scholar] [CrossRef]
  27. Cango Siguencia, P.L.; Gómez Ordoñez, J.C. Techno-Economic Analysis of Sustainable Hydrometallurgical Alternatives for Gold Recovery Focused on Small-Scale Mining Processes; Escuela Superior Politécnica del Litoral: Guayaquil, Ecuador, 2020. [Google Scholar]
  28. Jones, M.N.; Frutiger, J.; Ince, N.G.; Sin, G. The Monte Carlo driven and machine learning enhanced process simulator. Comput. Chem. Eng. 2019, 125, 324–338. [Google Scholar] [CrossRef]
  29. Salas, S.D.; Contreras-Salas, L.; Rubio-Dueñas, P.; Chebeir, J.; Romagnoli, J.A. A Multi-Objective Evolutionary Optimization Framework for a Natural Gas Liquids Recovery Unit. Comput. Chem. Eng. 2021, 107363. [Google Scholar] [CrossRef]
  30. Banco Central del Ecuador. Comercialización de Oro. Available online: https://www.bce.fin.ec/index.php/comercializacion-de-oro (accessed on 11 April 2021).
  31. ENAMI, EP. Empresa Nacional Minera de Ecuador. Available online: https://www.enamiep.gob.ec (accessed on 11 April 2021).
  32. Fairtrade International. Criterio Fairtrade para el Oro y los Metales Preciosos Asociados para la Minería Artesanal y en Pequeña Escala. Available online: https://files.fairtrade.net/standards/Gold-and-Precious-Metals_SP.pdf (accessed on 15 May 2021).
  33. Alianza por la Minería Responsable & Fairmined. Estándar Fairmined para Oro de Minería Artesanal y de Pequeña Escala, Incluyendo Metales Preciosos Asociados. Available online: http://www.responsiblemines.org/wp-content/uploads/2017/05/Est%C3%A1ndar-Fairmined-2.0_2014_-1.pdf (accessed on 15 May 2021).
Figure 1. Process flow diagram for hydrometallurgical gold recovery using sodium cyanide as a leaching agent.
Minerals 11 00534 g001
Figure 2. Process flow diagram for hydrometallurgical gold recovery using sodium thiosulfate as a leaching agent.
Minerals 11 00534 g002
Figure 3. Framework for the stochastic analysis of gold recovery processes including the process simulator PRO/II and a Python environment connected through the Python–Component Object Model (COM) interface.
Minerals 11 00534 g003
Figure 4. Distributions of the gold recovery of the studied systems. Blue distributions correspond to sodium thiosulfate, and black distributions correspond to sodium cyanide. The dashed lines are the systems that do not include Hg treatment. The continuous lines are the systems that include Hg treatment.
Minerals 11 00534 g004
Figure 5. Distributions of the annualized profitability. Blue distributions correspond to sodium thiosulfate, and black distributions correspond to sodium cyanide. The dashed lines are the systems that did not include Hg treatment. The continuous lines are the systems that included Hg treatment.
Minerals 11 00534 g005
Figure 6. Pairwise bivariate distribution of the outputs for the systems using sodium cyanide as the leaching agent. The blue results correspond to the samples that did not include Hg removal, and the orange results correspond to the samples that included Hg removal.
Minerals 11 00534 g006
Figure 7. Pearson’s coefficients heat map correlations for the systems that use sodium cyanide as the leaching agent without Hg removal (a) and with Hg removal (b).
Minerals 11 00534 g007
Figure 8. Pairwise bivariate distribution of the outputs for the systems using sodium thiosulfate as leaching agent. The blue results correspond to the samples that do not include Hg removal, and the orange results correspond to the samples that include Hg removal.
Minerals 11 00534 g008
Figure 9. Pearson’s coefficients heat map correlations for the systems that use sodium thiosulfate as leaching agent without Hg removal (a) and with Hg removal (b).
Minerals 11 00534 g009
Table 1. Composition of the feedstock mineral for the process simulation.
FormulaMineralComposition
SiO2Quartz54.5228%
FeS2Pyrite44.2750%
CuFe(II)S2Chalcopyrite-A0.5970%
CuFeS2Chalcopyrite-B0.5970%
AuNative gold0.0082%
Total100.00%
Table 2. Unit operations incorporated into the process simulations in PRO/II.
Unit OperationsDescription
Conversion reactorThis reactor is a preliminary approximation of the equipment during conceptual design stages.
Counter-current decanterIt models the recovery of components in the liquid phase of a stream with a defined solvent.
FlashIt resembles the separation of the components in a stream due to volatility differences.
Stream calculatorIt allows the separation of streams based on mass balances determined by the user.
Simple heat exchangerIt is used to heat up or cool down a stream by specifying certain conditions or by exchanging heat between two fluids.
ControllerIt allows regulating a parameter/variable of interest of a process stream or equipment by varying a certain input. It also permits modifying the specification of another unit.
CalculatorIt performs any calculation through mathematical equations. This information can be used by other units within the simulation environment.
Table 3. Hydrometallurgical process simulation conditions when the leaching agent is sodium cyanide.
SectionOperating ConditionsUnitValue
Pulp streamGold flow ratekg/day4.1
TemperatureK298
Pressureatm1
Particle sizemm0.045–0.150
Retort processDistillation temperatureK700
Condensate temperatureK298
Conversion reactorsTemperatureK298
Pressureatm1
Pulp densitywt %50
Leaching pH-11
Sodium cyanideM0.15
Adsorption tanksTemperatureK298
Pressureatm1
Act. carbon ratiog per ton20
Act. carbon part. sizemm1.00–3.00
Elution towerTemperatureK298
Pressureatm1
Elution solution ratioBV2
Table 4. Hydrometallurgical process simulation conditions when the leaching agent is sodium thiosulfate.
SectionOperating ConditionsUnitValue
Pulp streamGold flow ratekg/day4.1
TemperatureK298
Pressureatm1
Particle sizemm0.045–0.150
Retort processDistillation temperatureK700
Condensate temperatureK298
Conv. reactorsTemperatureK298
Pressureatm1
Pulp densitywt %40
Leaching pH-10.50
Sodium thiosulfateM1.50
Adsorption tanksTemperatureK298
Pressureatm1
Act. carbon ratiog per ton20
Act. carbon part. Sizemm1.00–3.00
Elution towerTemperatureK298
Pressureatm1
Elution solution ratioBV2
Table 5. Lower and upper bounds of parameters including uncertainty.
Parameters θ i L B θ i U B Units
Sodium cyanide as the leaching agent
Leaching conversion (Reactor 1 and 2)0.880.90-
Adsorption conversion0.870.89-
Elution process conversion0.900.95-
Sodium thiosulfate as the leaching agent
Leaching conversion0.750.85-
Adsorption conversion0.850.95-
Elution process conversion0.700.75-
Market uncertainty
Price of gold6065USD/g
Table 6. Prices of utilities and raw materials.
DescriptionValueUnits
Pulverized mineral (royalties, transport, and grinding)105USD/ton
Waste treatment (solid and liquid effluents)200USD/ton
Activated carbon1896USD/ton
Water for use in the processes0.067USD/1000 kg
Electric consumption0.06USD/kWh
Table 7. Prices of reagents and other required chemicals.
DescriptionCostUnits
Sodium cyanide3.10USD/kg
Calcium hydroxide0.32USD/kg
Activated carbon5500USD/ton
Sodium hydroxide4.62USD/kg
Ethyl alcohol6.33USD/kg
Industrial ammonia1.50USD/kg
Sodium thiosulfate4.08USD/kg
Copper sulphate3.50USD/kg
Table 8. Summary statistic (mean or expected value, standard deviation, and minimum and maximum values) of the four hydrometallurgy alternatives studied.
OutputStatsCase 1Case 2Case 3Case 4Units
A u r e c o v e r e d ( θ ) m e a n 75.177.848.651.4%
σ y 1.31.32.52.5%
m i n 72.275.042.144.9%
m a x 77.980.656.058.0%
C F ( θ ) m e a n 51.0854.13−0.202.35MM USD/year
σ y 1.941.982.462.51MM USD/year
m i n 46.4149.34−6.89−4.27MM USD/year
m a x 55.8659.177.269.67MM USD/year
P r o f i t a ( θ ) m e a n 50.5053.52−0.402.12MM USD/year
σ y 1.941.982.462.51MM USD/year
m i n 45.8348.74−7.09−4.50MM USD/year
m a x 55.2958.567.069.44MM USD/year
Publisher’s Note: MDPI stays neutral with regard to jurisdictional claims in published maps and institutional affiliations.

