1. Introduction
Yushenfu mining area is located in the north of Shaanxi Province, China, which belongs to Yuyang District and Shenmu County of Yulin City and is a national key mining area. The area includes 3 state-owned key coal mines, 15 state-owned local coal mines and 14 township coal mines [
1]. The surface of this area is covered by Quaternary aeolian sand, and the ecological environment is poor. Water is scarce and green vegetation is scarce. In order to prevent surface subsidence and soil erosion caused by coal-seam mining, the mines in the area have been using roof–pillar and strip mining for a long time [
2]. This method has achieved a certain water retention effect; however, with the passage of time, creep and instability accidents of coal pillar have occurred more frequently [
3], which have caused the overburden to be damaged and the water-conducting fracture zone to move upward, seriously affecting the surface environment. As a result, filling mining technology has been adopted in some mines [
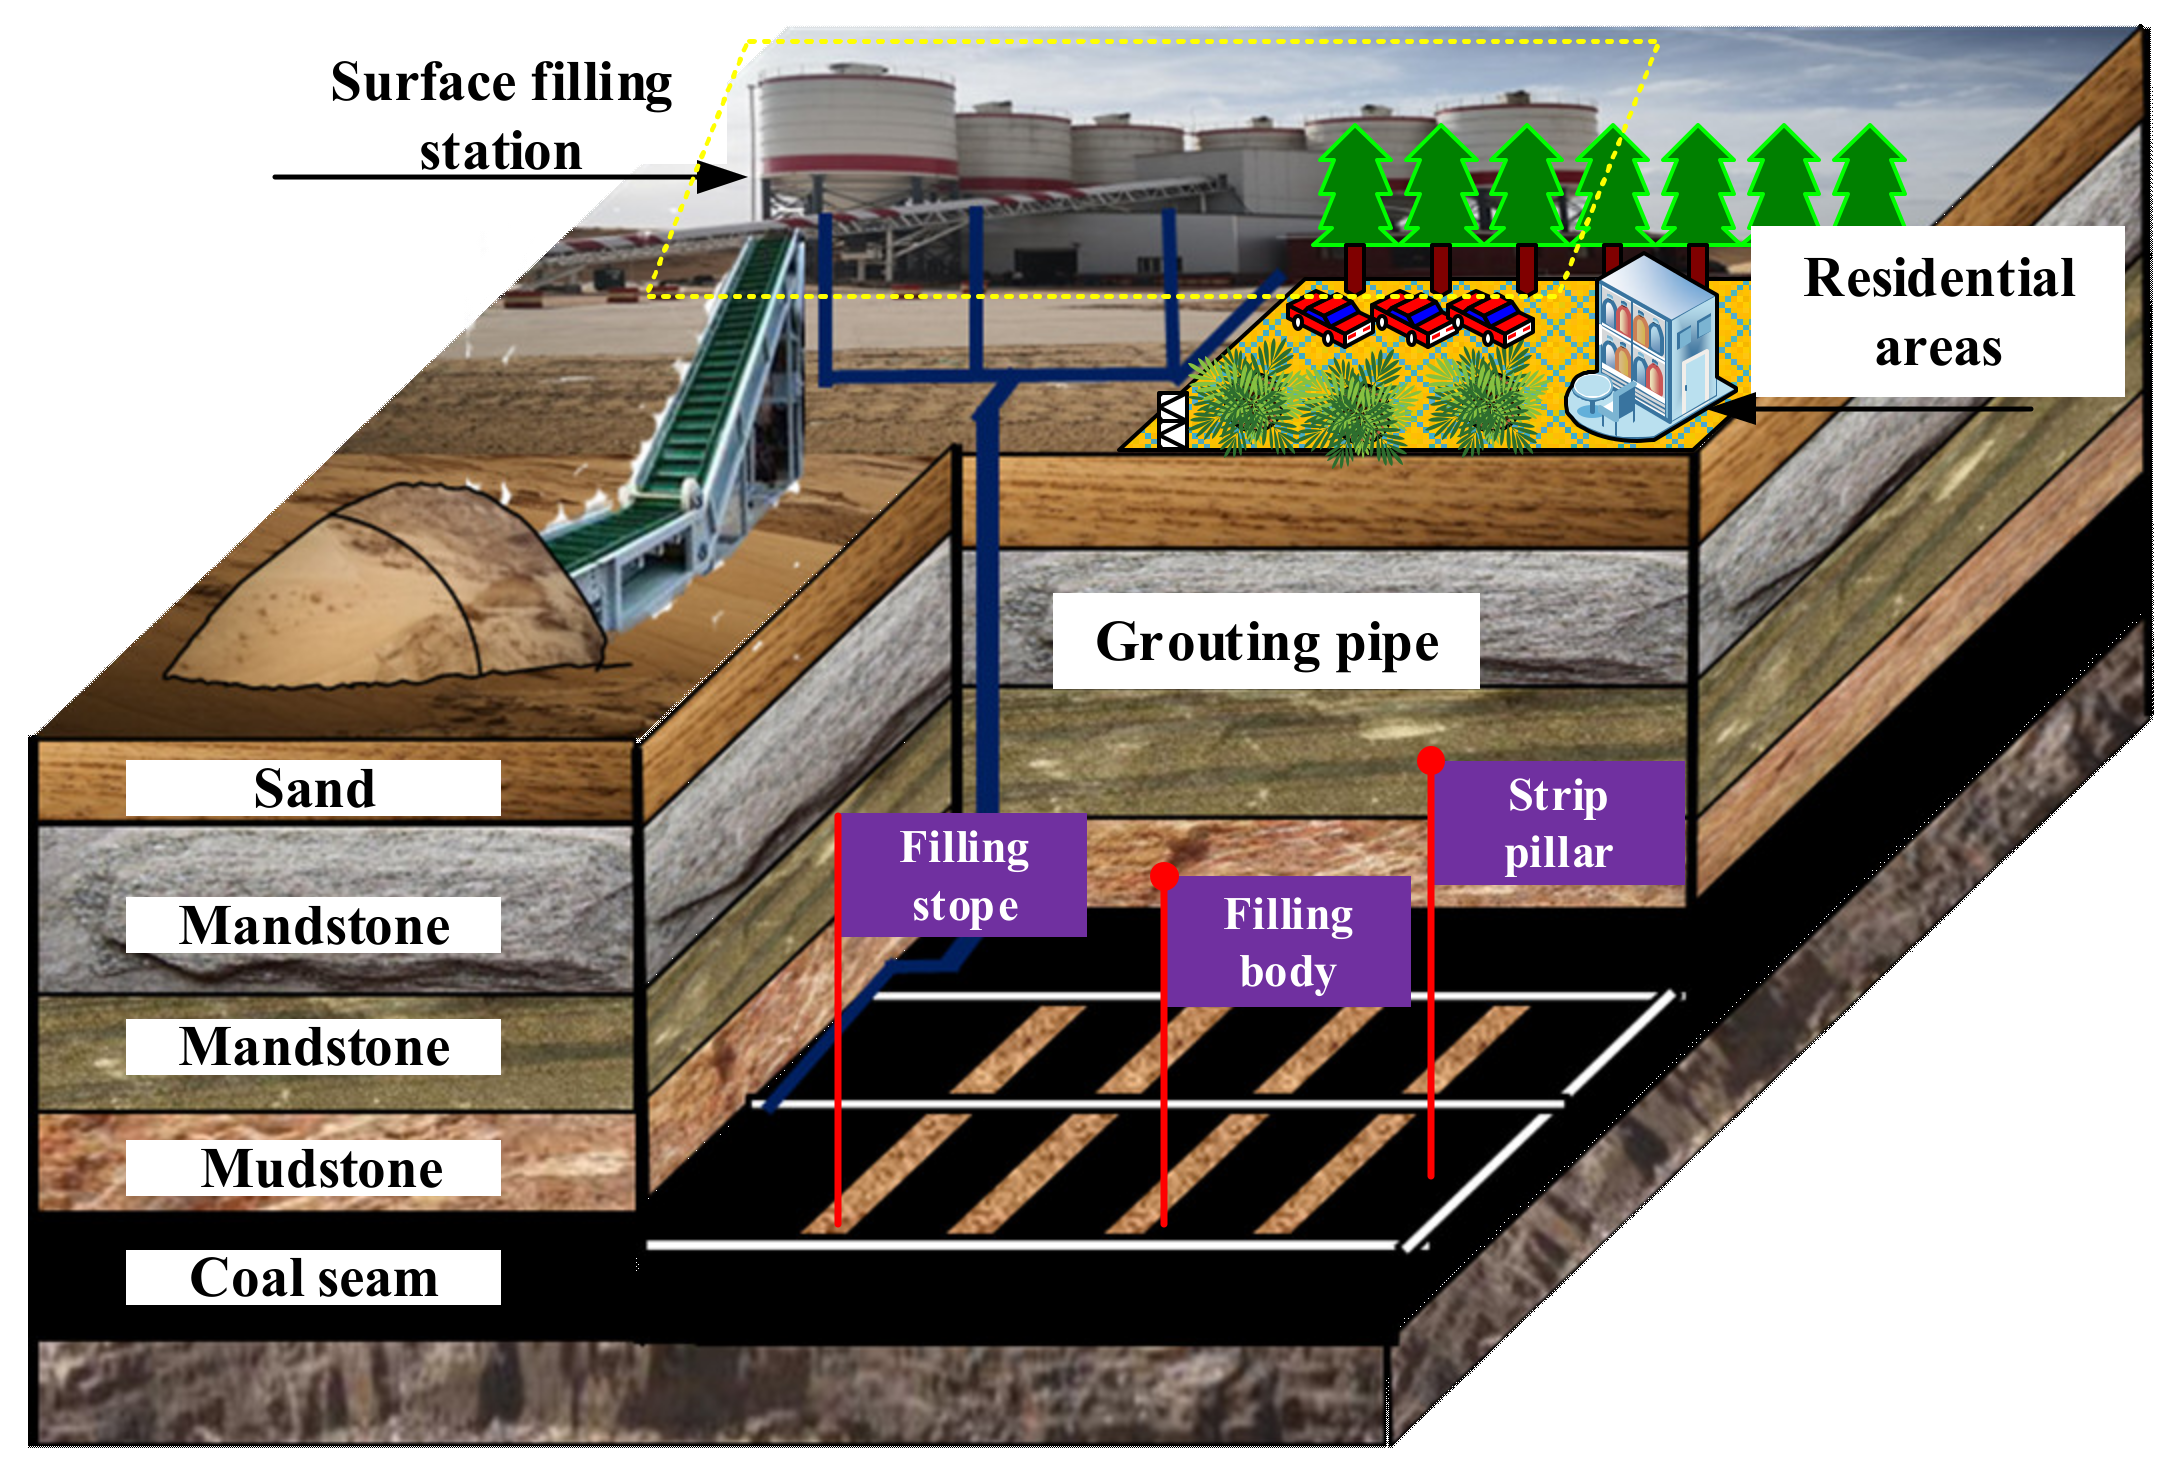
4]. As shown in
Figure 1, the filling material is first mixed on the ground and then transported to the gob of the underground working face through pipelines. After solidification, the filling material can support the overlying strata well. Selecting suitable materials to fill the gob can effectively control surface subsidence and improve the mining rate of coal resources, and, at the same time, avoid destroying the surface buildings, prevent water and soil erosion and realize the secondary utilization of waste resources. In Shanghe Coal Mine, the fly ash from the power plant around Yushenfu Mine and the excess aeolian sand on the surface are mixed with cement in proportion for filling. This not only achieves the function of replacing coal and supporting overlying rock to preserve water for coal mining but also greatly reduces the pollution of fly ash and promotes the regeneration of vegetation on the surface.
In view of paste backfill mining, paste backfill technology was first applied in a German lead–zinc mine in 1979, and an optimization scheme for the bleeding problem of water–sand backfill was proposed [
5,
6]. Around the year 2000, most of the mines with hydraulic cemented filling in Canada switched to paste filling for production [
7]. China began to use full tailing paste filling technology in metal mines around 1980 [
8].
In recent years, scholars have carried out a lot of research on paste materials, from material size distribution [
9,
10,
11], selection of binder [
6,
12], effect of conservation environment [
13,
14], rheological properties [
15,
16,
17,
18], permeability [
19,
20,
21], pumping characteristics of paste [
15,
22] and stress variation and stability in filling field [
23].
In fly-ash-related research, Jiang et al. studied the mechanical properties of cemented rockfill (CRF) and pointed out that partial replacement of ordinary Portland cement with fly ash could improve the strength of CRF samples [
24,
25]. Fládr et al. found that the incorporation of fly ash into structural concrete can improve the performance of concrete, enhance the late strength of concrete and improve the compactness of concrete and the shrinkage resistance of concrete [
26,
27,
28]. Zhou et al. studied the influence of fly ash, cement and lime-slag content and concentration on the transport performance and mechanical properties of aeolian-sand-based cemented backfill materials via laboratory tests [
29].
For ASPLB, Shao et al. investigated its unstratified fluidity [
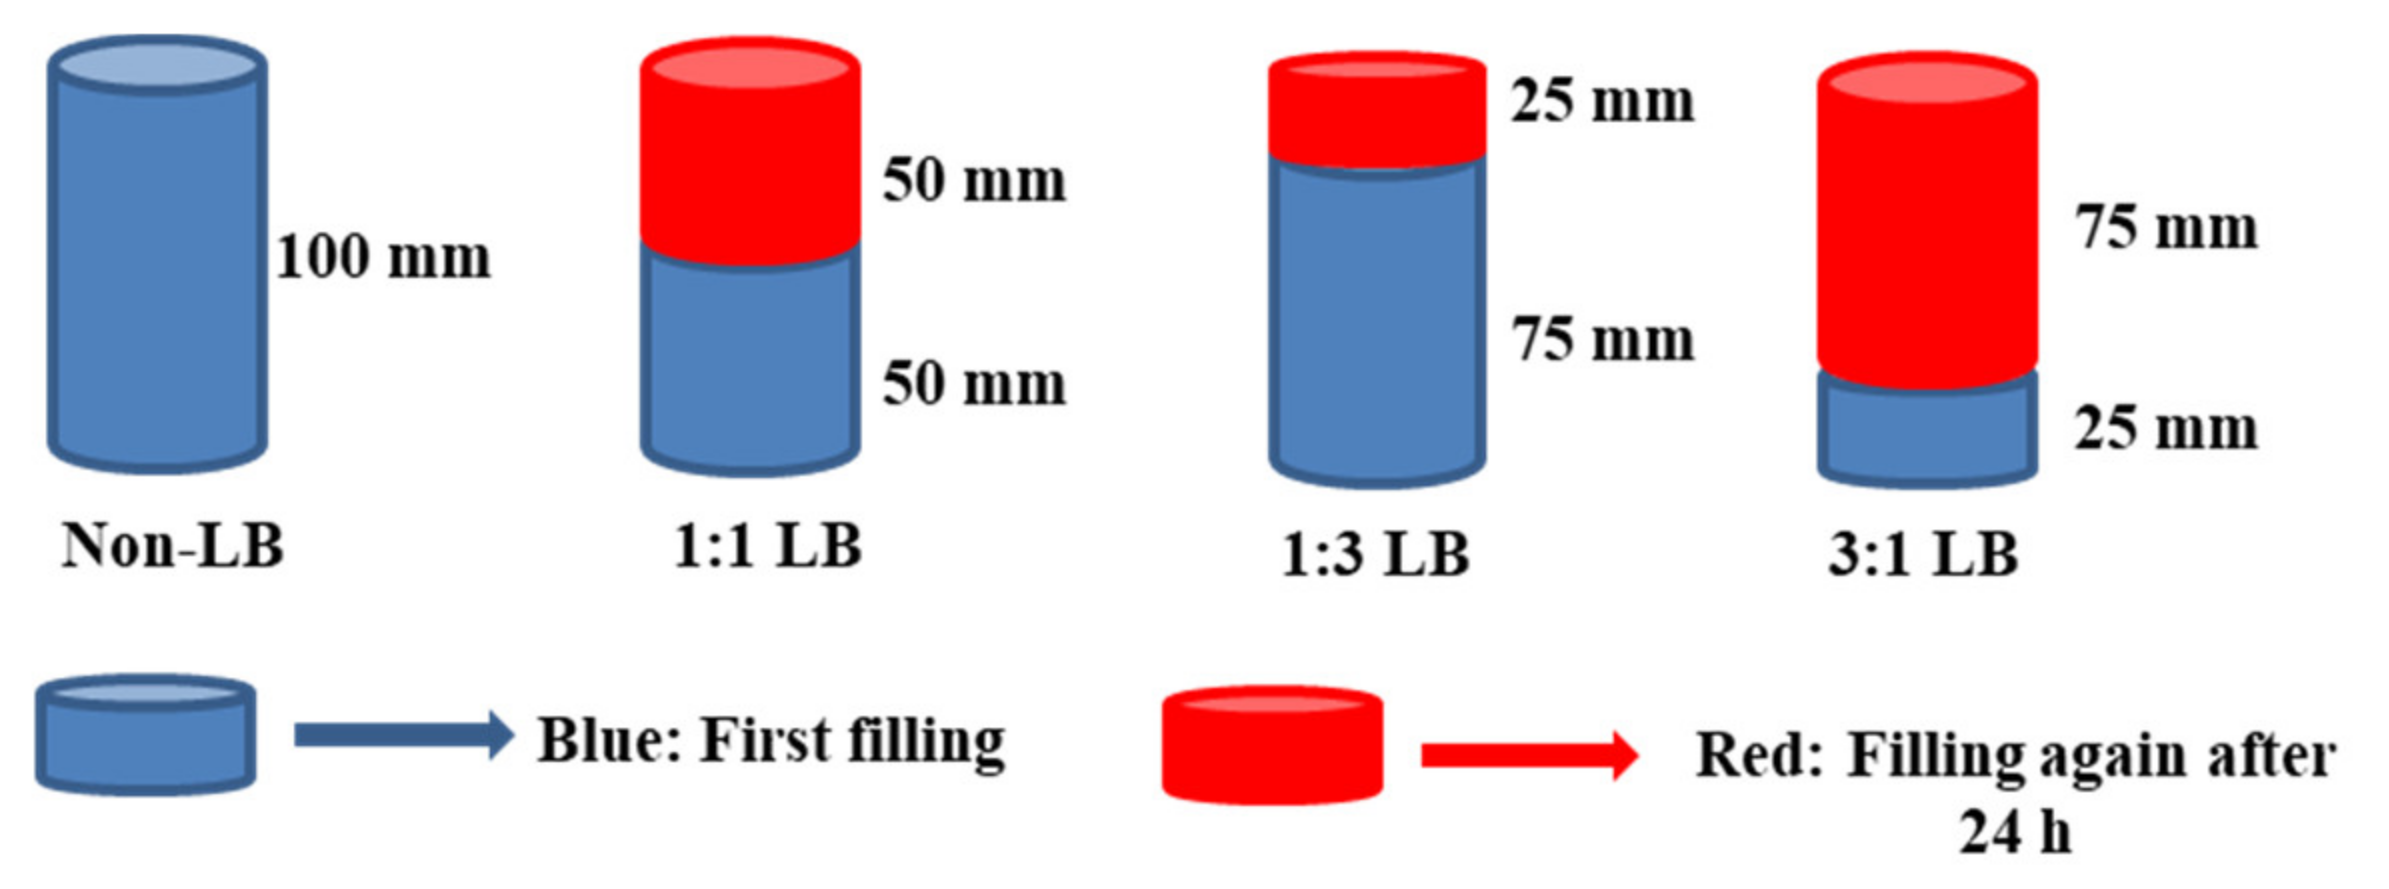
30]; however, in the process of backfill mining, the gob cannot be filled all at once due to problems with backfill bleeding pressure and construction technology. The strip gob needs to be layered and filled to achieve the maximum filling rate.
In order to further explore the strength of backfill under a layering operation, Cao et al. focused on factors such as the number of structural planes and the angle of the structural planes and they believed that the mechanical characteristics of backfill were closely related to the state of the structural planes [
31,
32]. Xu et al. established a quantitative function relationship between the number of structural planes and uniaxial compressive strength [
33]. Based on different test parameters, Wang et al. built a damage constitutive model under the coupling action of the structural plane and load and, at the same time, made an in-depth analysis of the evolution law of the energy capacity of slicing and filling [
34]. The strength and failure characteristics of ASPLB and the field measurement application are worth further study.
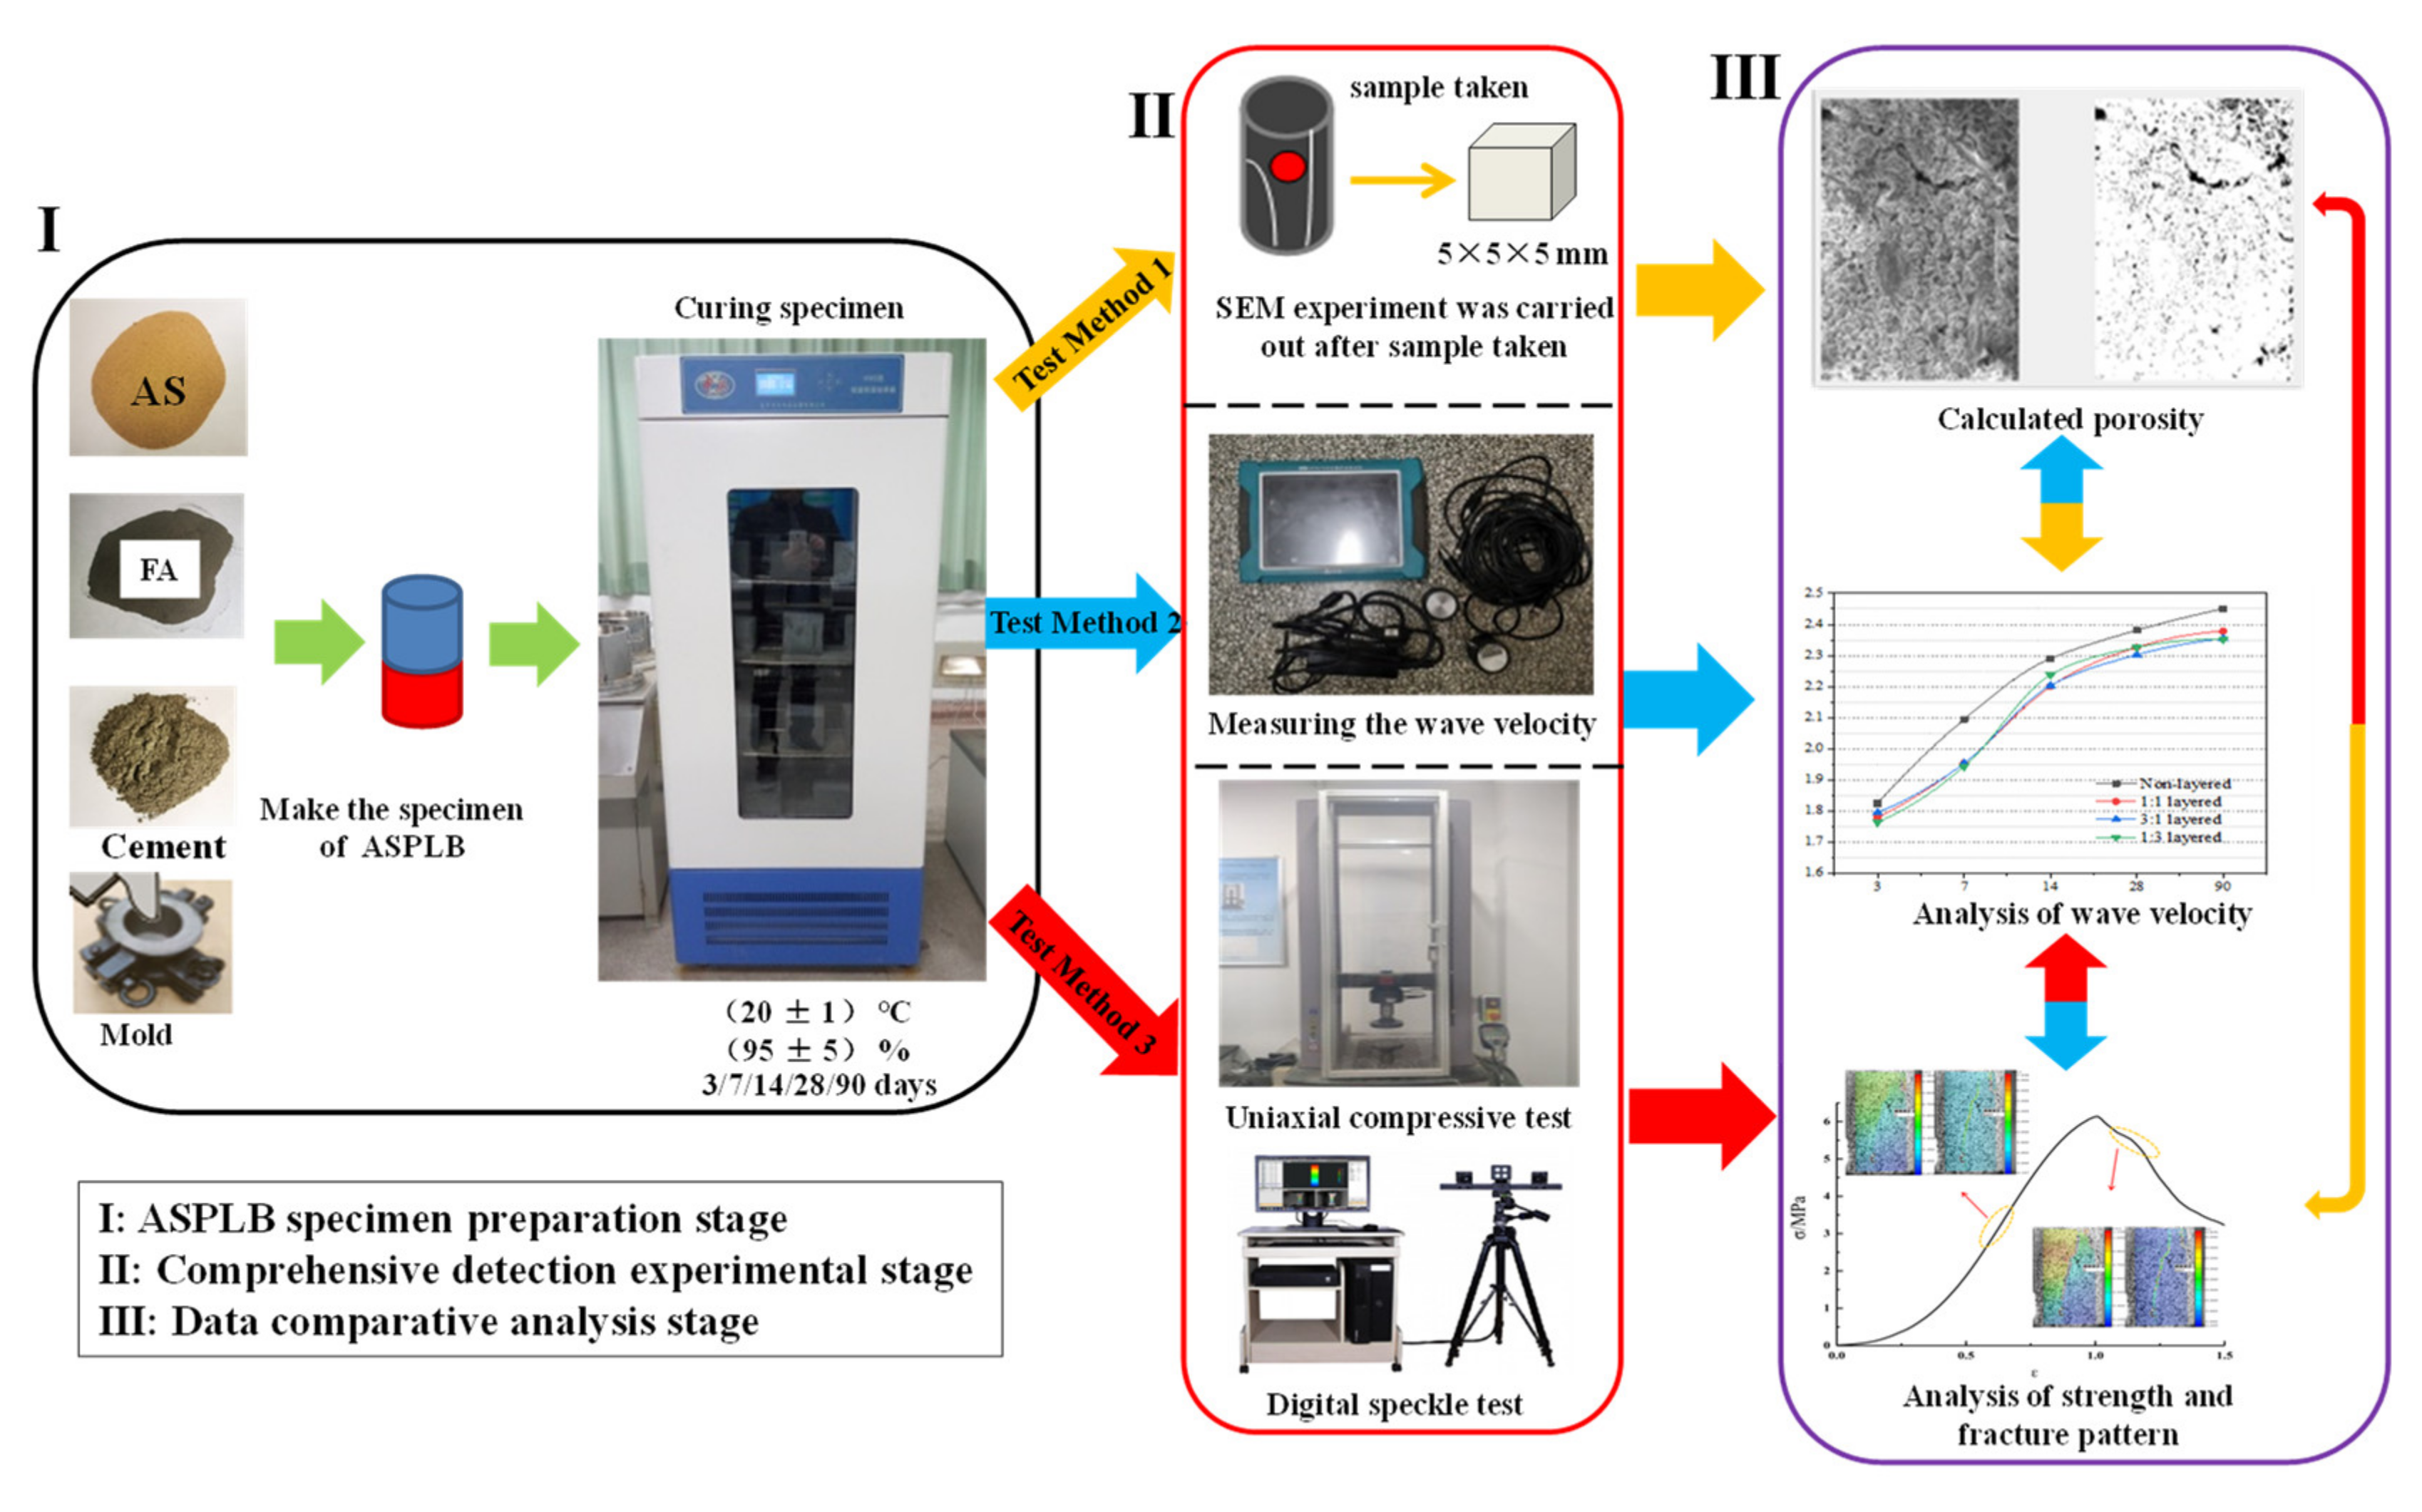
In this study, we used aeolian sand, fly ash and cement as the main BMs. The actual backfill process was simulated by a one-time backfill and different layering proportions of backfill. We carried out experimental research on three kinds of ASPLB with different proportions from micro and macro perspectives. The aim was to determine the material ratio and the optimal slicing and filling ratio that meet the filling strength of the mining area. This scheme can provide a scientific basis for the slicing and filling mining of the Yushenfu mining area and can realize green mining in similar mining areas.
3. Results and Discussion
3.1. Hydration Process and Microscopic Characteristics of ASPLB
3.1.1. Main Chemical Reactions in the Curing of ASPLB
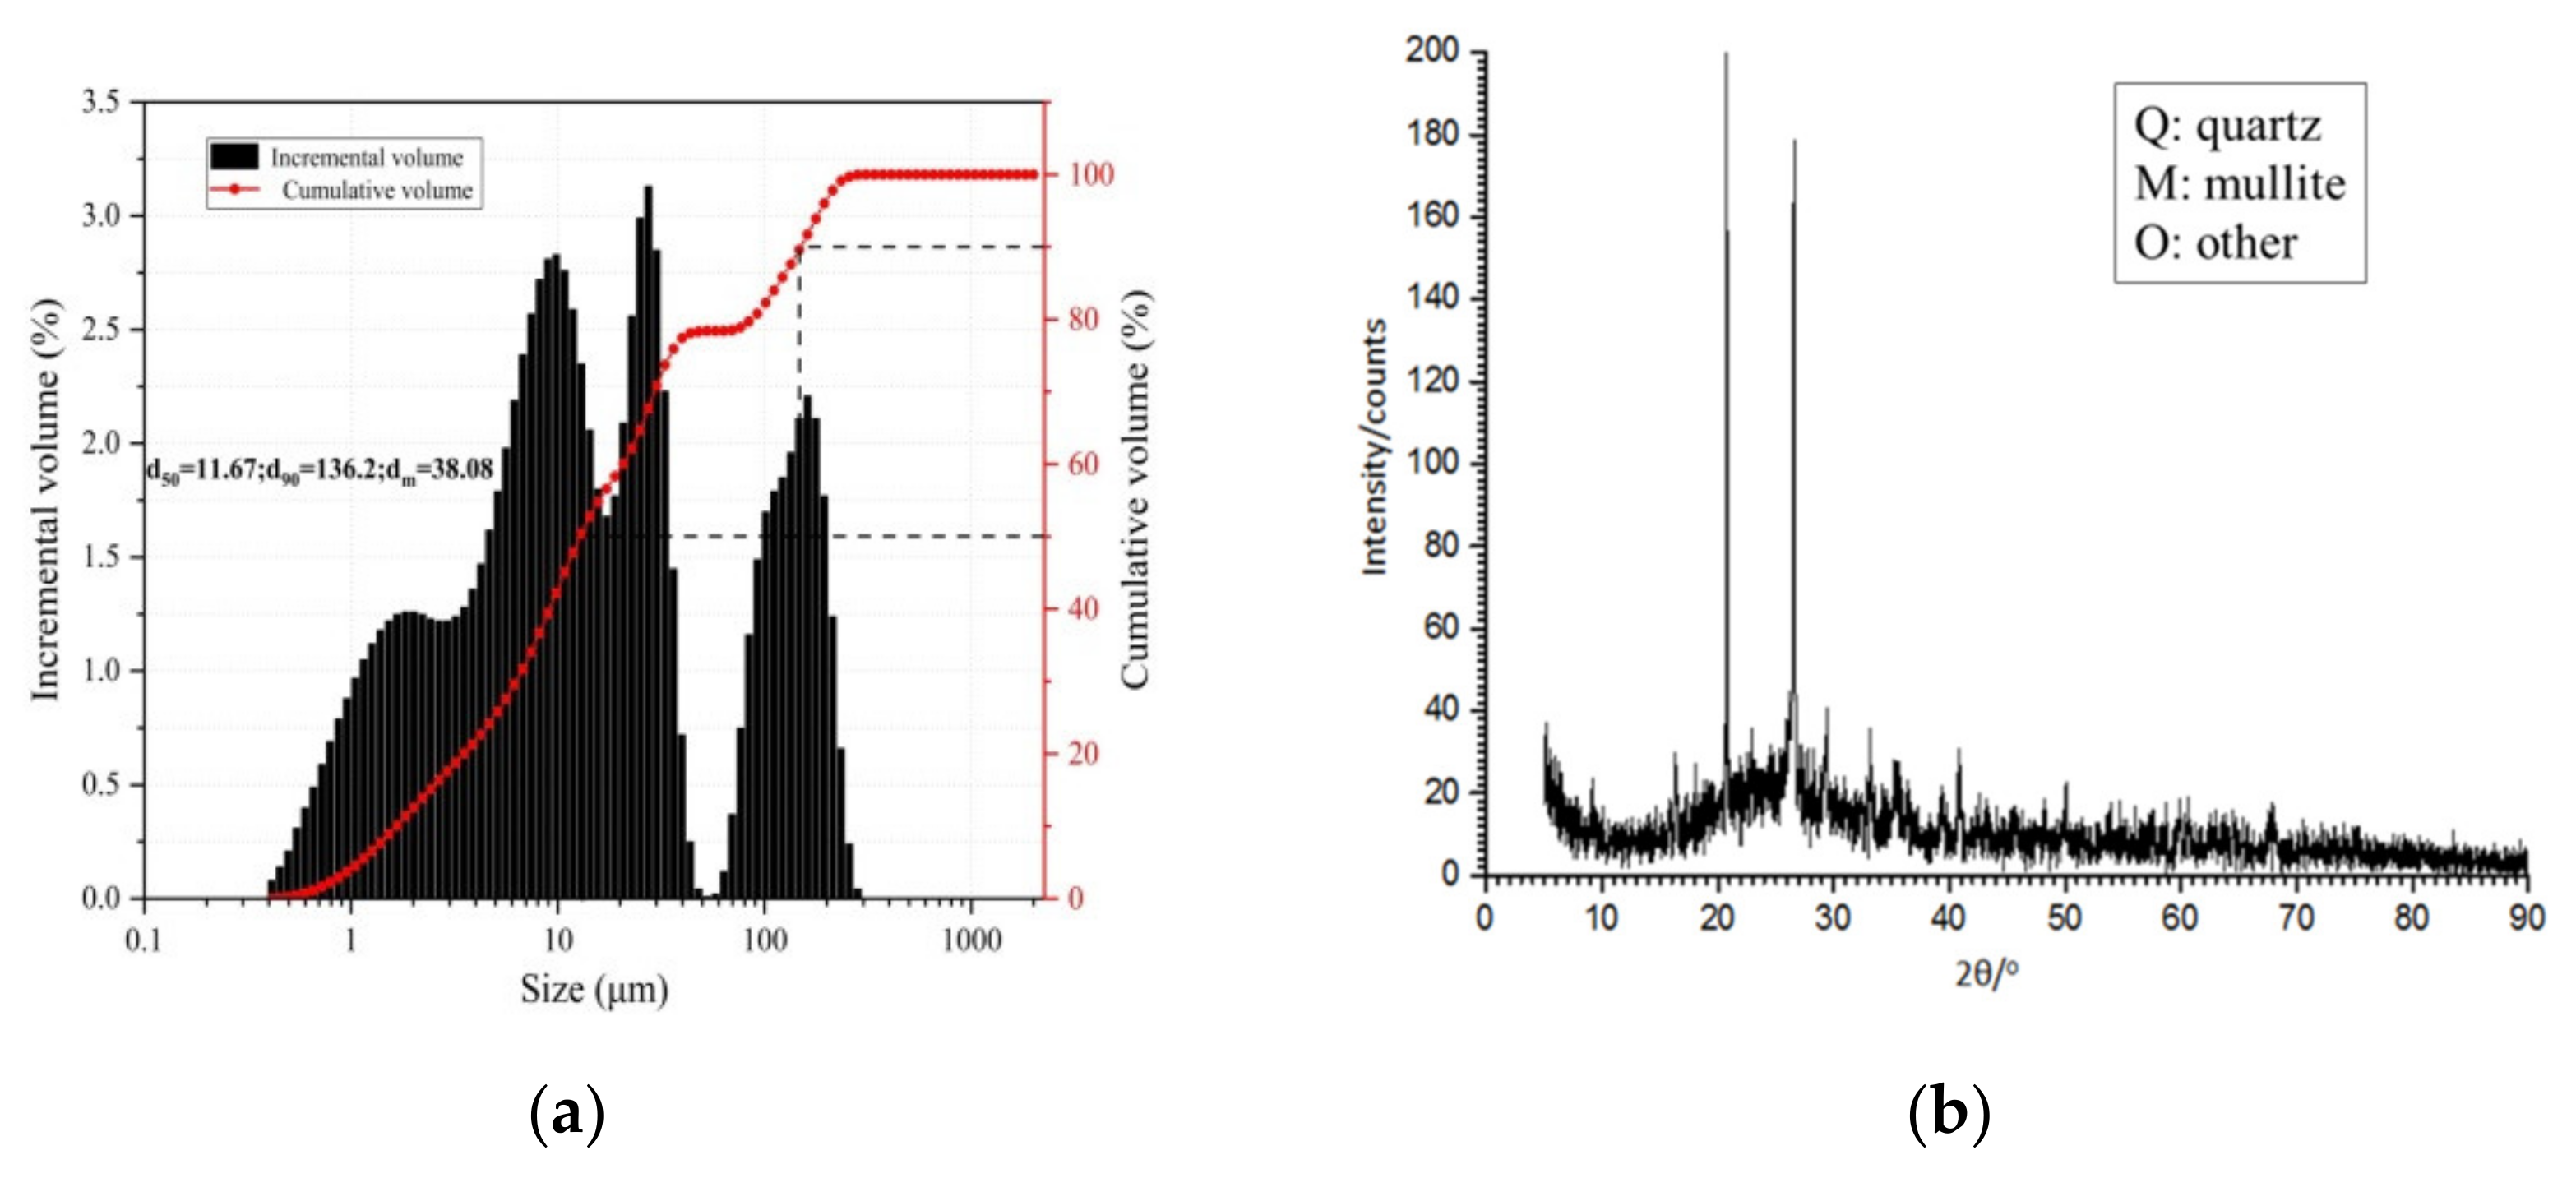
By using the JSM-6460LV SEM instrument, the microstructure of ASPLB with various curing times and proportions was analyzed. It was found that the main chemical components of the FA were
,
and
. It contained a great deal of active
and
. The main components of the cement are CaO, SiO
2 and Al
2O
3. The early hydration reaction of
and
produced a large amount of
. Due to the existence of the
basic activator and
acidic activator, the hydration reaction of the FA was accelerated. Due to the variety of FA minerals, its chemical reaction is relatively complex. It is mainly the reaction of active
and
with
,
with
and
with
. The hydration reaction is as follows:
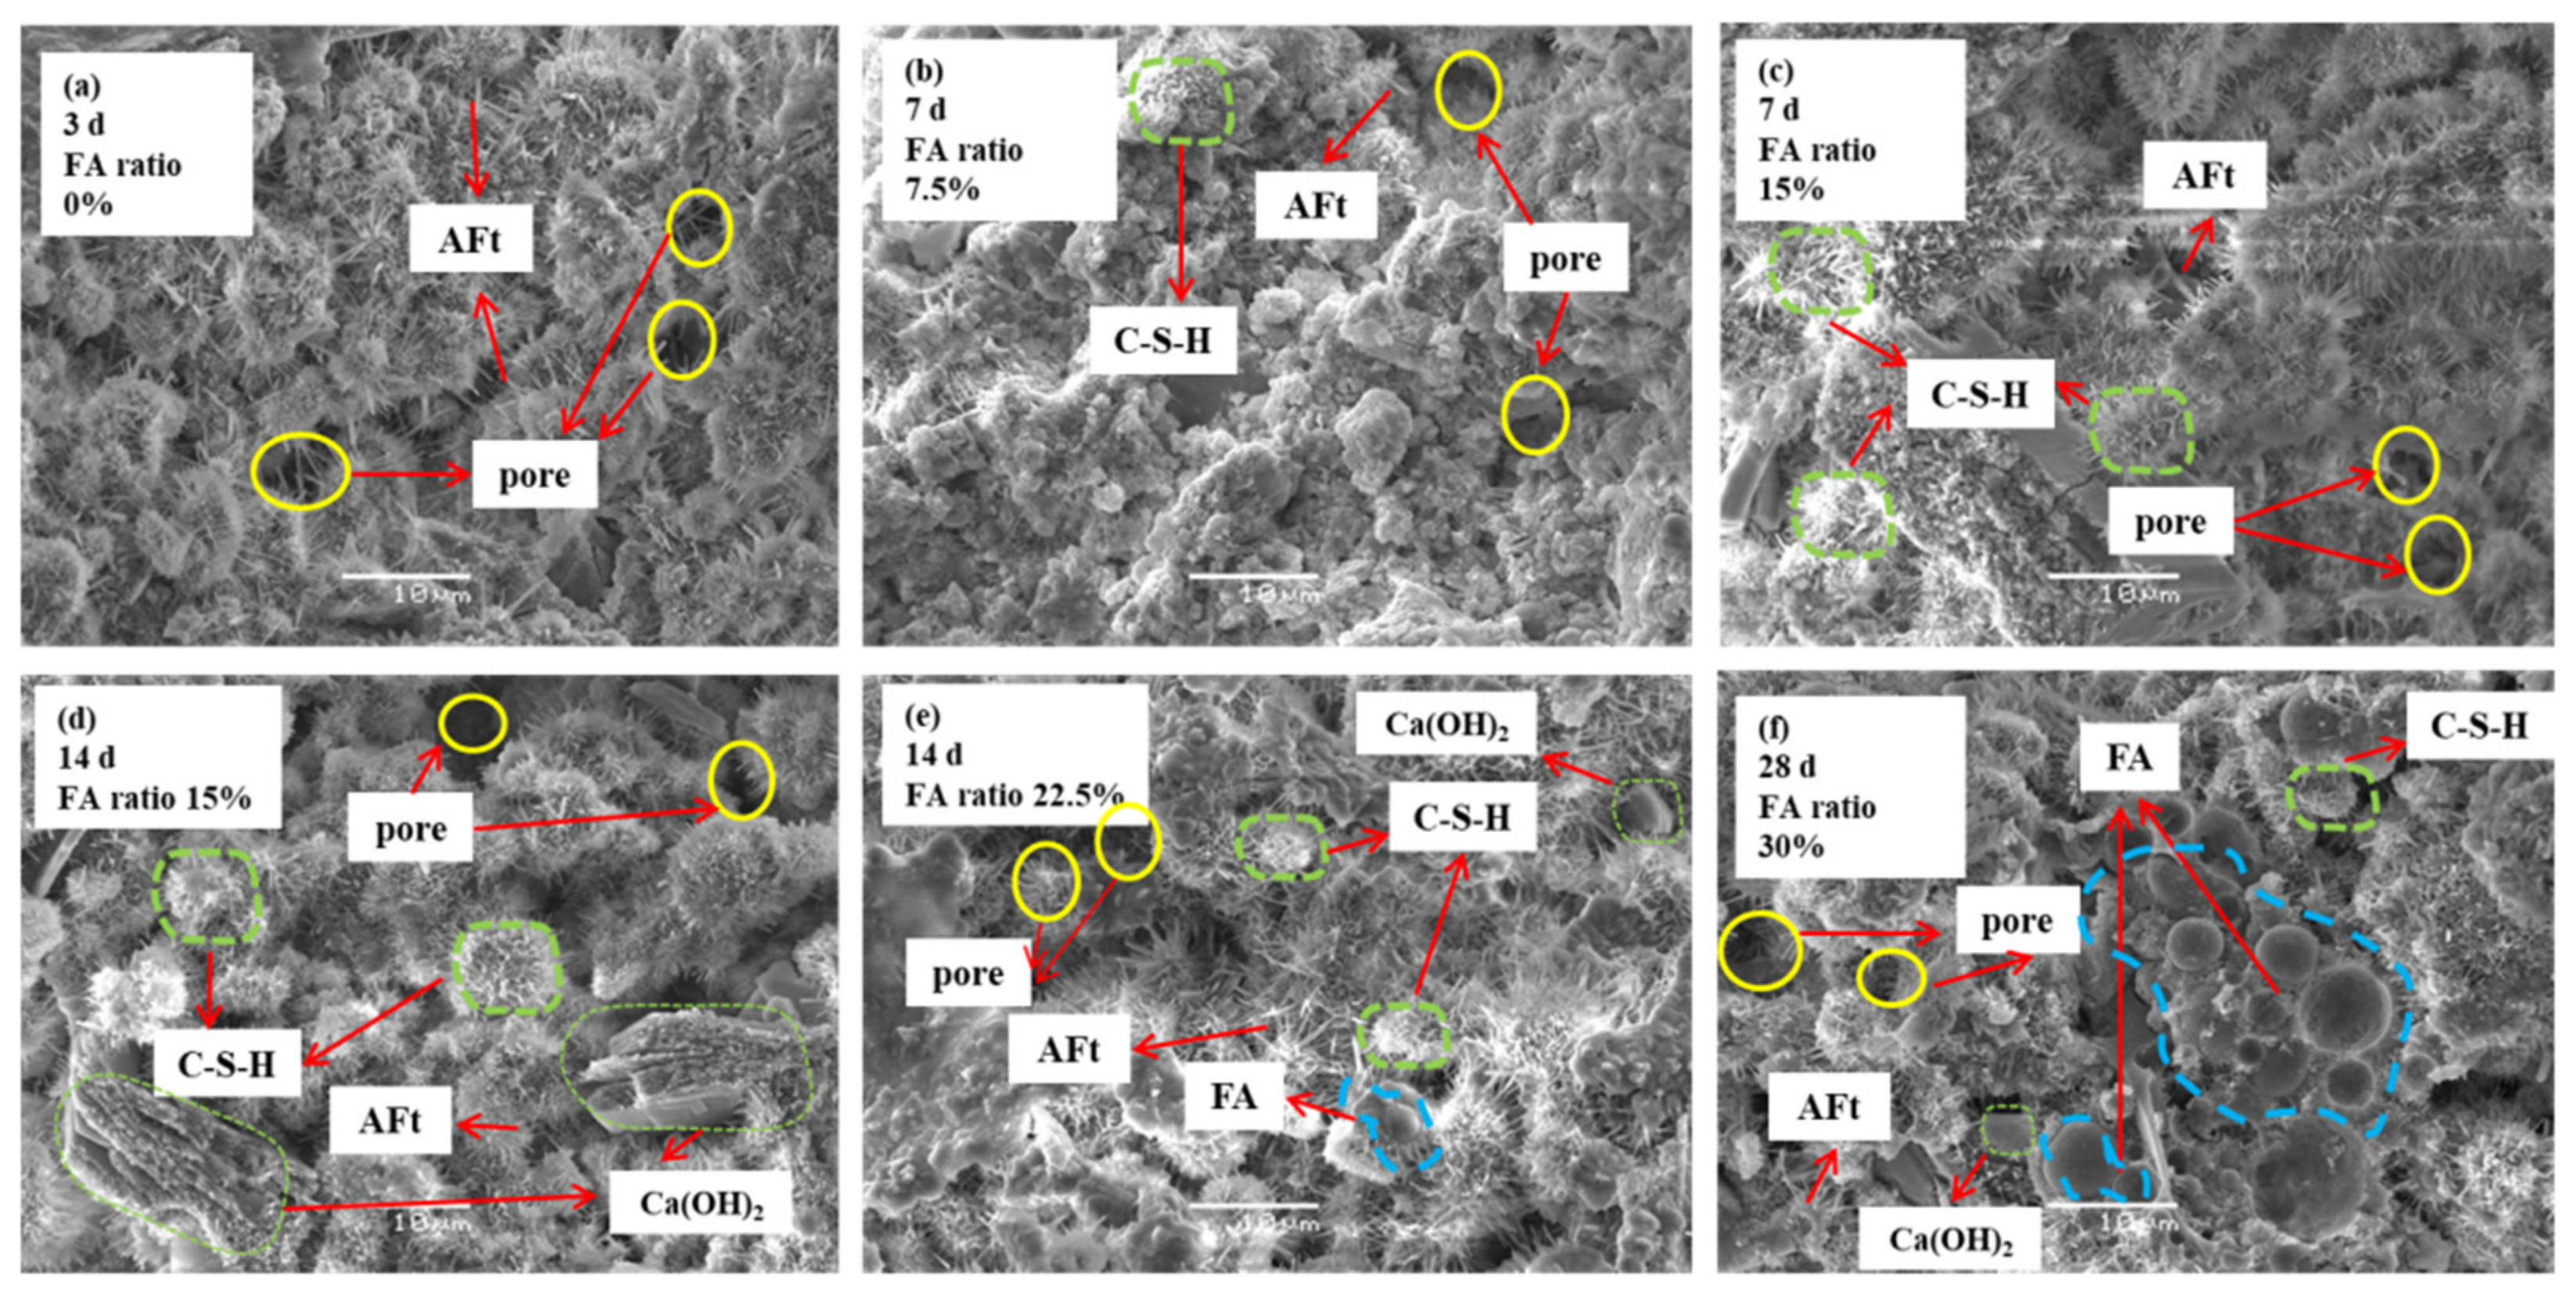
The microstructure of the ASPLB hydration product was composed of cementitious material particles and pores. They are mainly flocculent (C-S-H), gelatinized fine acicular ettringite crystal (Aft), hexagonal flake calcium hydroxide () and round FA. The formation of hydration products such as (C-S-H) gelling calcium hydroxide provides the basis for the strength of ASPLB. And (C-S-H) gel and large acicular ettringite were interlaced with each other to fill the pores of the ASPLB sample so that the solid particles were closely bonded with the hydration products and the internal structure was compact and firm.
3.1.2. The Microscopic Characteristics of ASPLB
Some of the detection results are shown in
Figure 6. It can be seen from the figure that the hydration reaction of the backfill is the most obvious within 3–14 days after curing. When the backfill with 15% FA content is cured for 7–14 days, the hydration reaction of the backfill is the most violent. The hydration products (Aft) of the backfill are uniform and dense and attached to the surface of the reactants in the shape of fine needles. The pores between the local reactants are filled with hydration products (C-S-H and Ca(OH)
2), which can be clearly seen in
Figure 6c,d. With the increase in the FA proportion in the backfill specimen, the pore amount and size of the backfill are reduced and the binding between the materials of the backfill is more compact, indicating that FA optimizes the material binding of the backfill and inevitably affects the strength of the backfill [
29]. As shown in
Figure 6f, when the FA content reaches 30%, needle-like and flocculent hydration products can be clearly seen around the spherical fly ash particles. The correlation between the porosity presented by the backfill microstructure with different FA content and the backfill strength will be discussed later in
Section 3.4.
We used MATLAB software (R2016a) to further calculate the porosity values in the backfill microstructure [
39]. We first converted the three-channel SEM image to a single-channel grayscale image. Then, we mapped and segmented the pixel value of the grayscale image by using the imbinarize function as well as setting a reasonable threshold T in order to convert it into a binary image with the pixel value of 0 or 255. Finally, the number of black pixels
was calculated by the find function in MATLAB, and
was the calculated value of a single image. Based on the method in the cited literature, the final porosity was obtained.
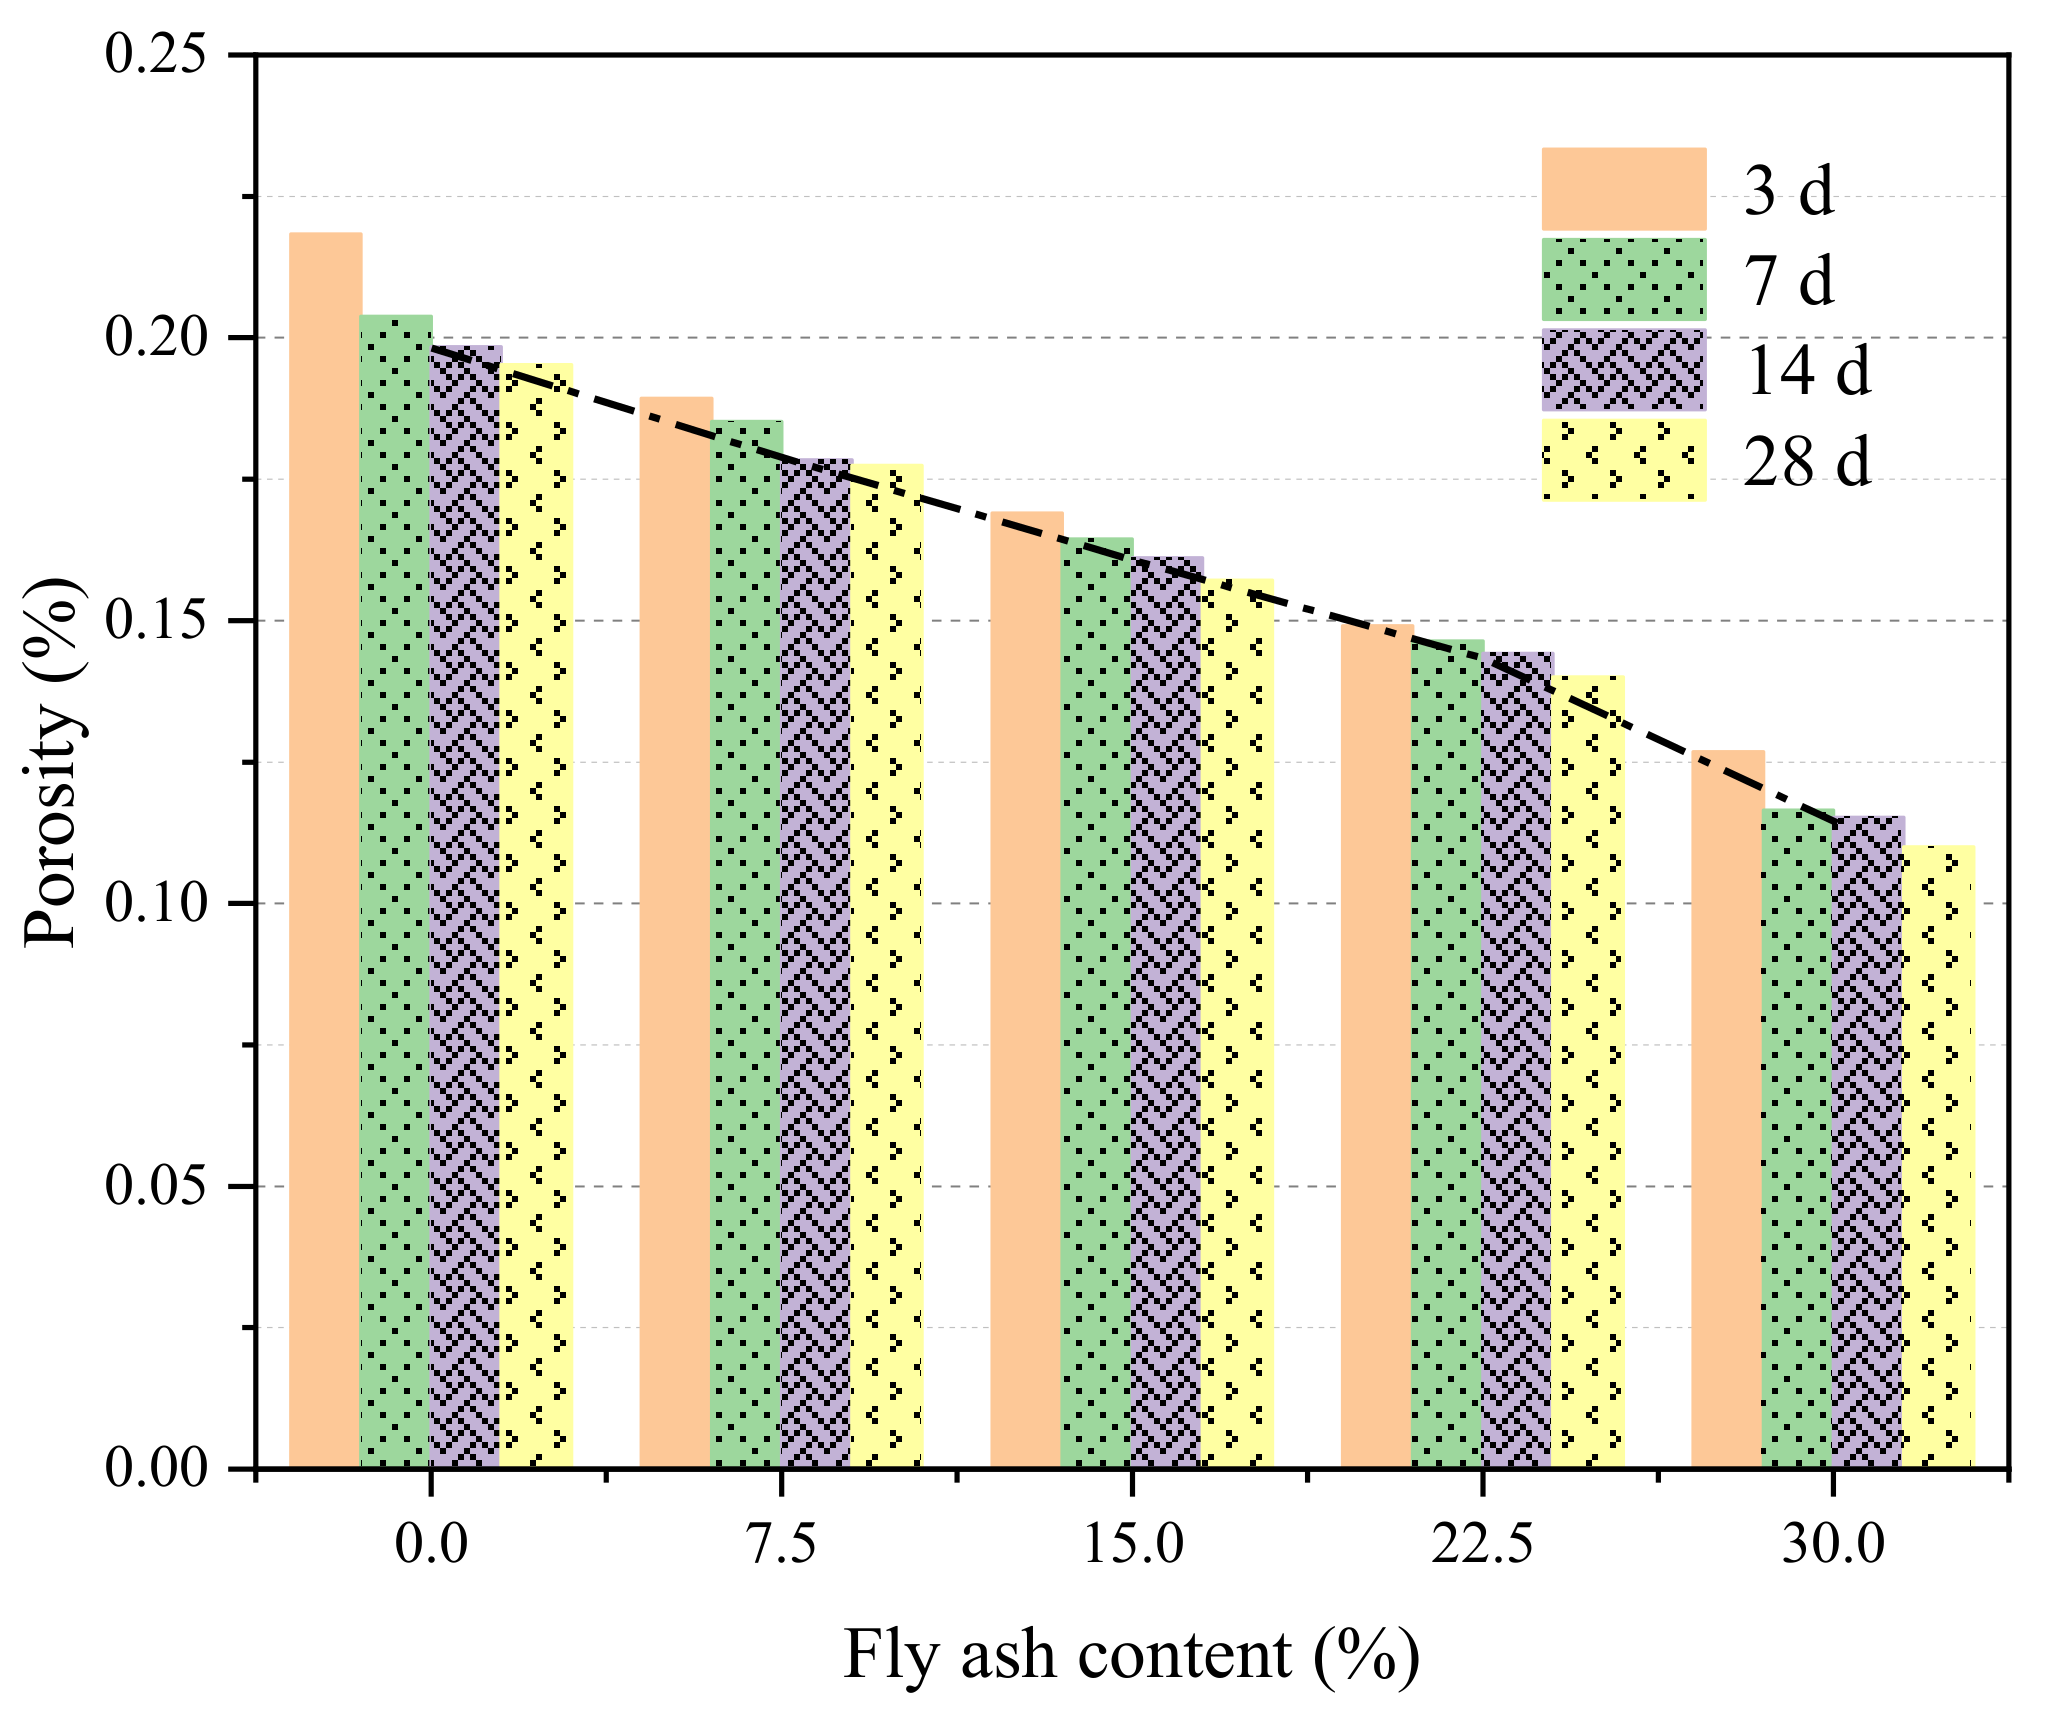
It can be seen from
Figure 7 that the porosity values of the backfill with the same FA content show a downward trend under different curing times, which is due to the hydration reaction between the materials of the backfill with an increase in curing time [
40]. The hydration products fill the pores to a certain extent, thus reducing the porosity of the backfill. Among the backfill specimens with different FA content, when the FA content of the ASPLB was 0, its porosity value was the highest. With the increase in FA content to 30%, the porosity value showed a downward trend. This is mainly due to the small size of FA particles (the average particle size (d
m) was 38.08 μm), which causes the backfill slurry to become viscous and plays a good physical backfill role for the backfill specimen that was made. In addition, the active substances in FA cause a pozzolanic reaction between the backfill materials and play a role of secondary hydration, thus reducing the porosity of the backfill. To sum up, the porosity of the backfill with the same ratio decreases with the increase in curing time. Within the ratio range of this experiment, the porosity of the backfill with different ratios decreases with the increase in FA content in the ratio, but the degree of porosity reduction caused by the curing time is obviously weaker than that caused by the increase in FA content. The addition of FA promotes the hydration reaction of ASPLB. In addition, due to the small size of FA particles, FA can play a physical backfill role and produce a certain cementing effect on the combination between materials, thus greatly reducing the porosity of the backfill. This is consistent with experimental results in the literature [
41]. The influence of porosity should be taken into account when studying backfill strength and fracture development.
3.2. Analysis of the Influence of Layered Structure on Wave Velocity
Accurate measurement of the size and change of acoustic parameters can infer the performance of concrete’s internal structure and its composition. If the specimen has an internal defect (hole section), the sound velocity at the defect will be lower than that of the normal part [
42].
According to the analysis of microscopic characteristics in
Section 3.1.2, it can be found that, with the increase in curing time, the BMs are subject to a sufficient hydration reaction and a secondary hydration reaction (volcanic ash reaction), which reduces the porosity of the backfill and makes the bond between the BMs closer, resulting in good sound transmission. Therefore, the measured wave velocity value increases with the increase in curing time. If the specimen is damaged, the acoustic transmission will be affected.
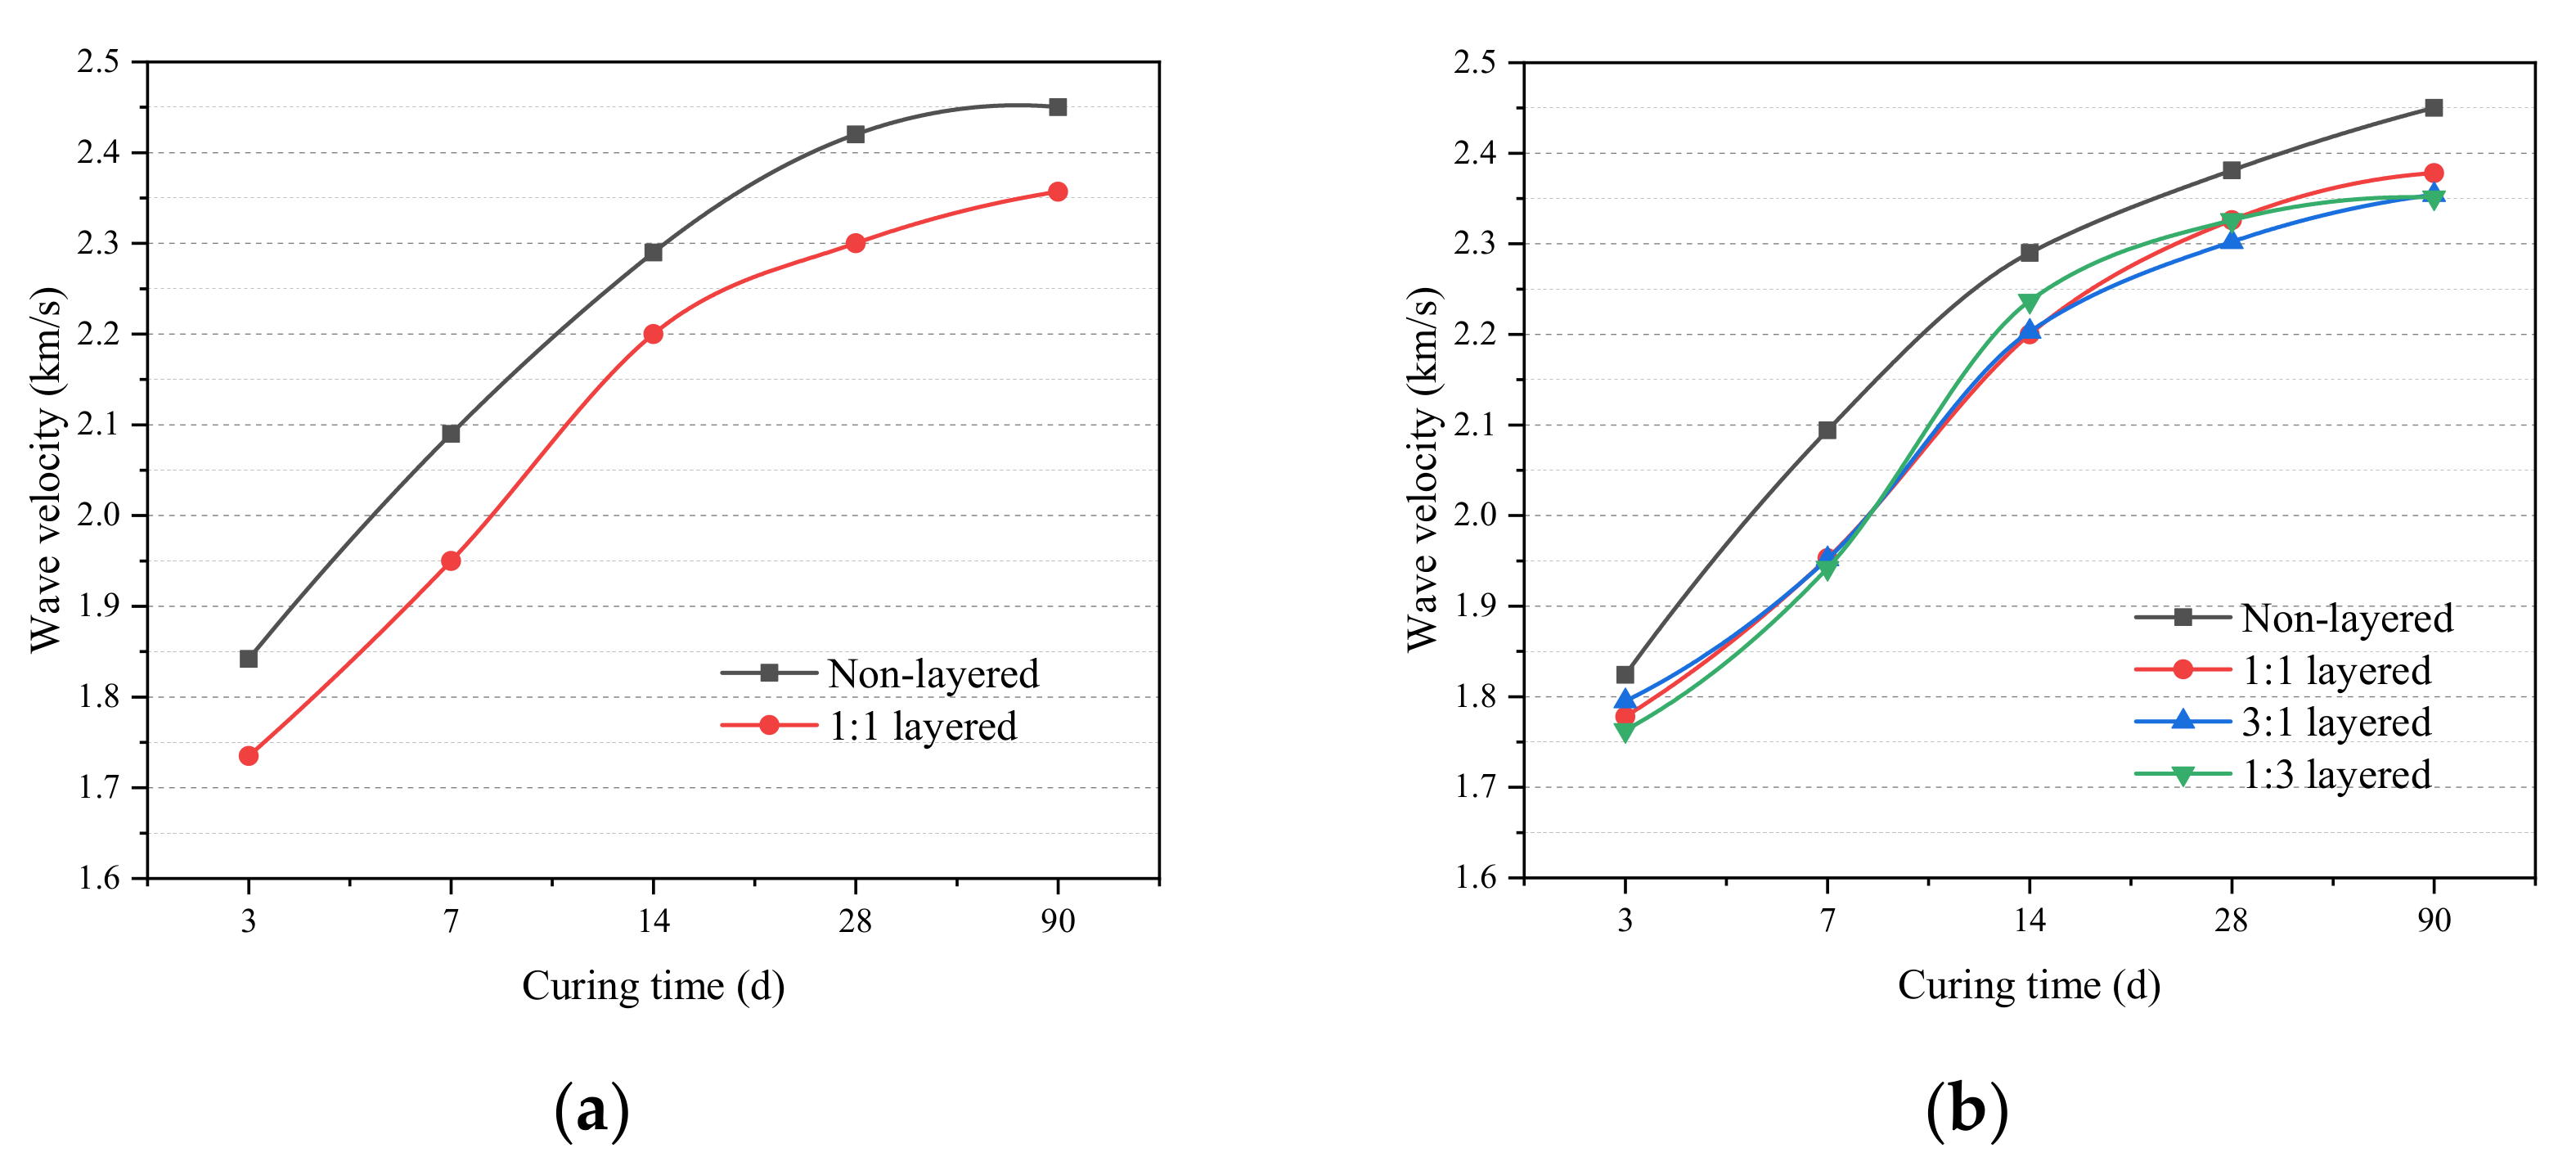
It can also be observed from
Figure 8 that the wave velocity of the layered backfill (LB) is lower than that of the non-layered backfill (Non-LB) by observing ASPLB with 15% fly ash content. The measured wave velocities of the three kinds of ASPLB with different laying ratios have a certain degree of similarity, but all of them are smaller than the measured values of the Non-LB, indicating that the layered structure formed by the LB has a certain hindrance to wave velocity conduction. The layered structure of the backfill destroys the integrity of the backfill and there is air between the layered structures. Since the propagation velocity of sound waves in a solid is greater than that in a gas, the wave velocity value of the LB is smaller than that of the Non-LB under the same conditions. The layering ratio of the backfill (the position of the layered structure plane (LSP)) has no obvious influence on the wave velocity. Through further observation of
Figure 8, it can be found that the measured wave velocities of the backfill specimens with different proportions at the same curing time are similar. For example, during the 28-day curing time, the wave velocities of Non-LB with different proportions were 2.36 km/s and the wave velocities of LB were 2.20–2.34 km/s.
To sum up, measured values of wave velocities of ASPLB with different ratios have little change under the same curing time. With the increase in curing time, the porosity of the backfill decreases, the degree of material bonding becomes closer and the wave velocity presents an increasing trend. The wave velocities of the LB are all lower than those of the Non-LB.
3.3. Law and Variation Characteristics of Compressive Strength of ASPLB
3.3.1. Influence of FA Content on ASPLB Strength
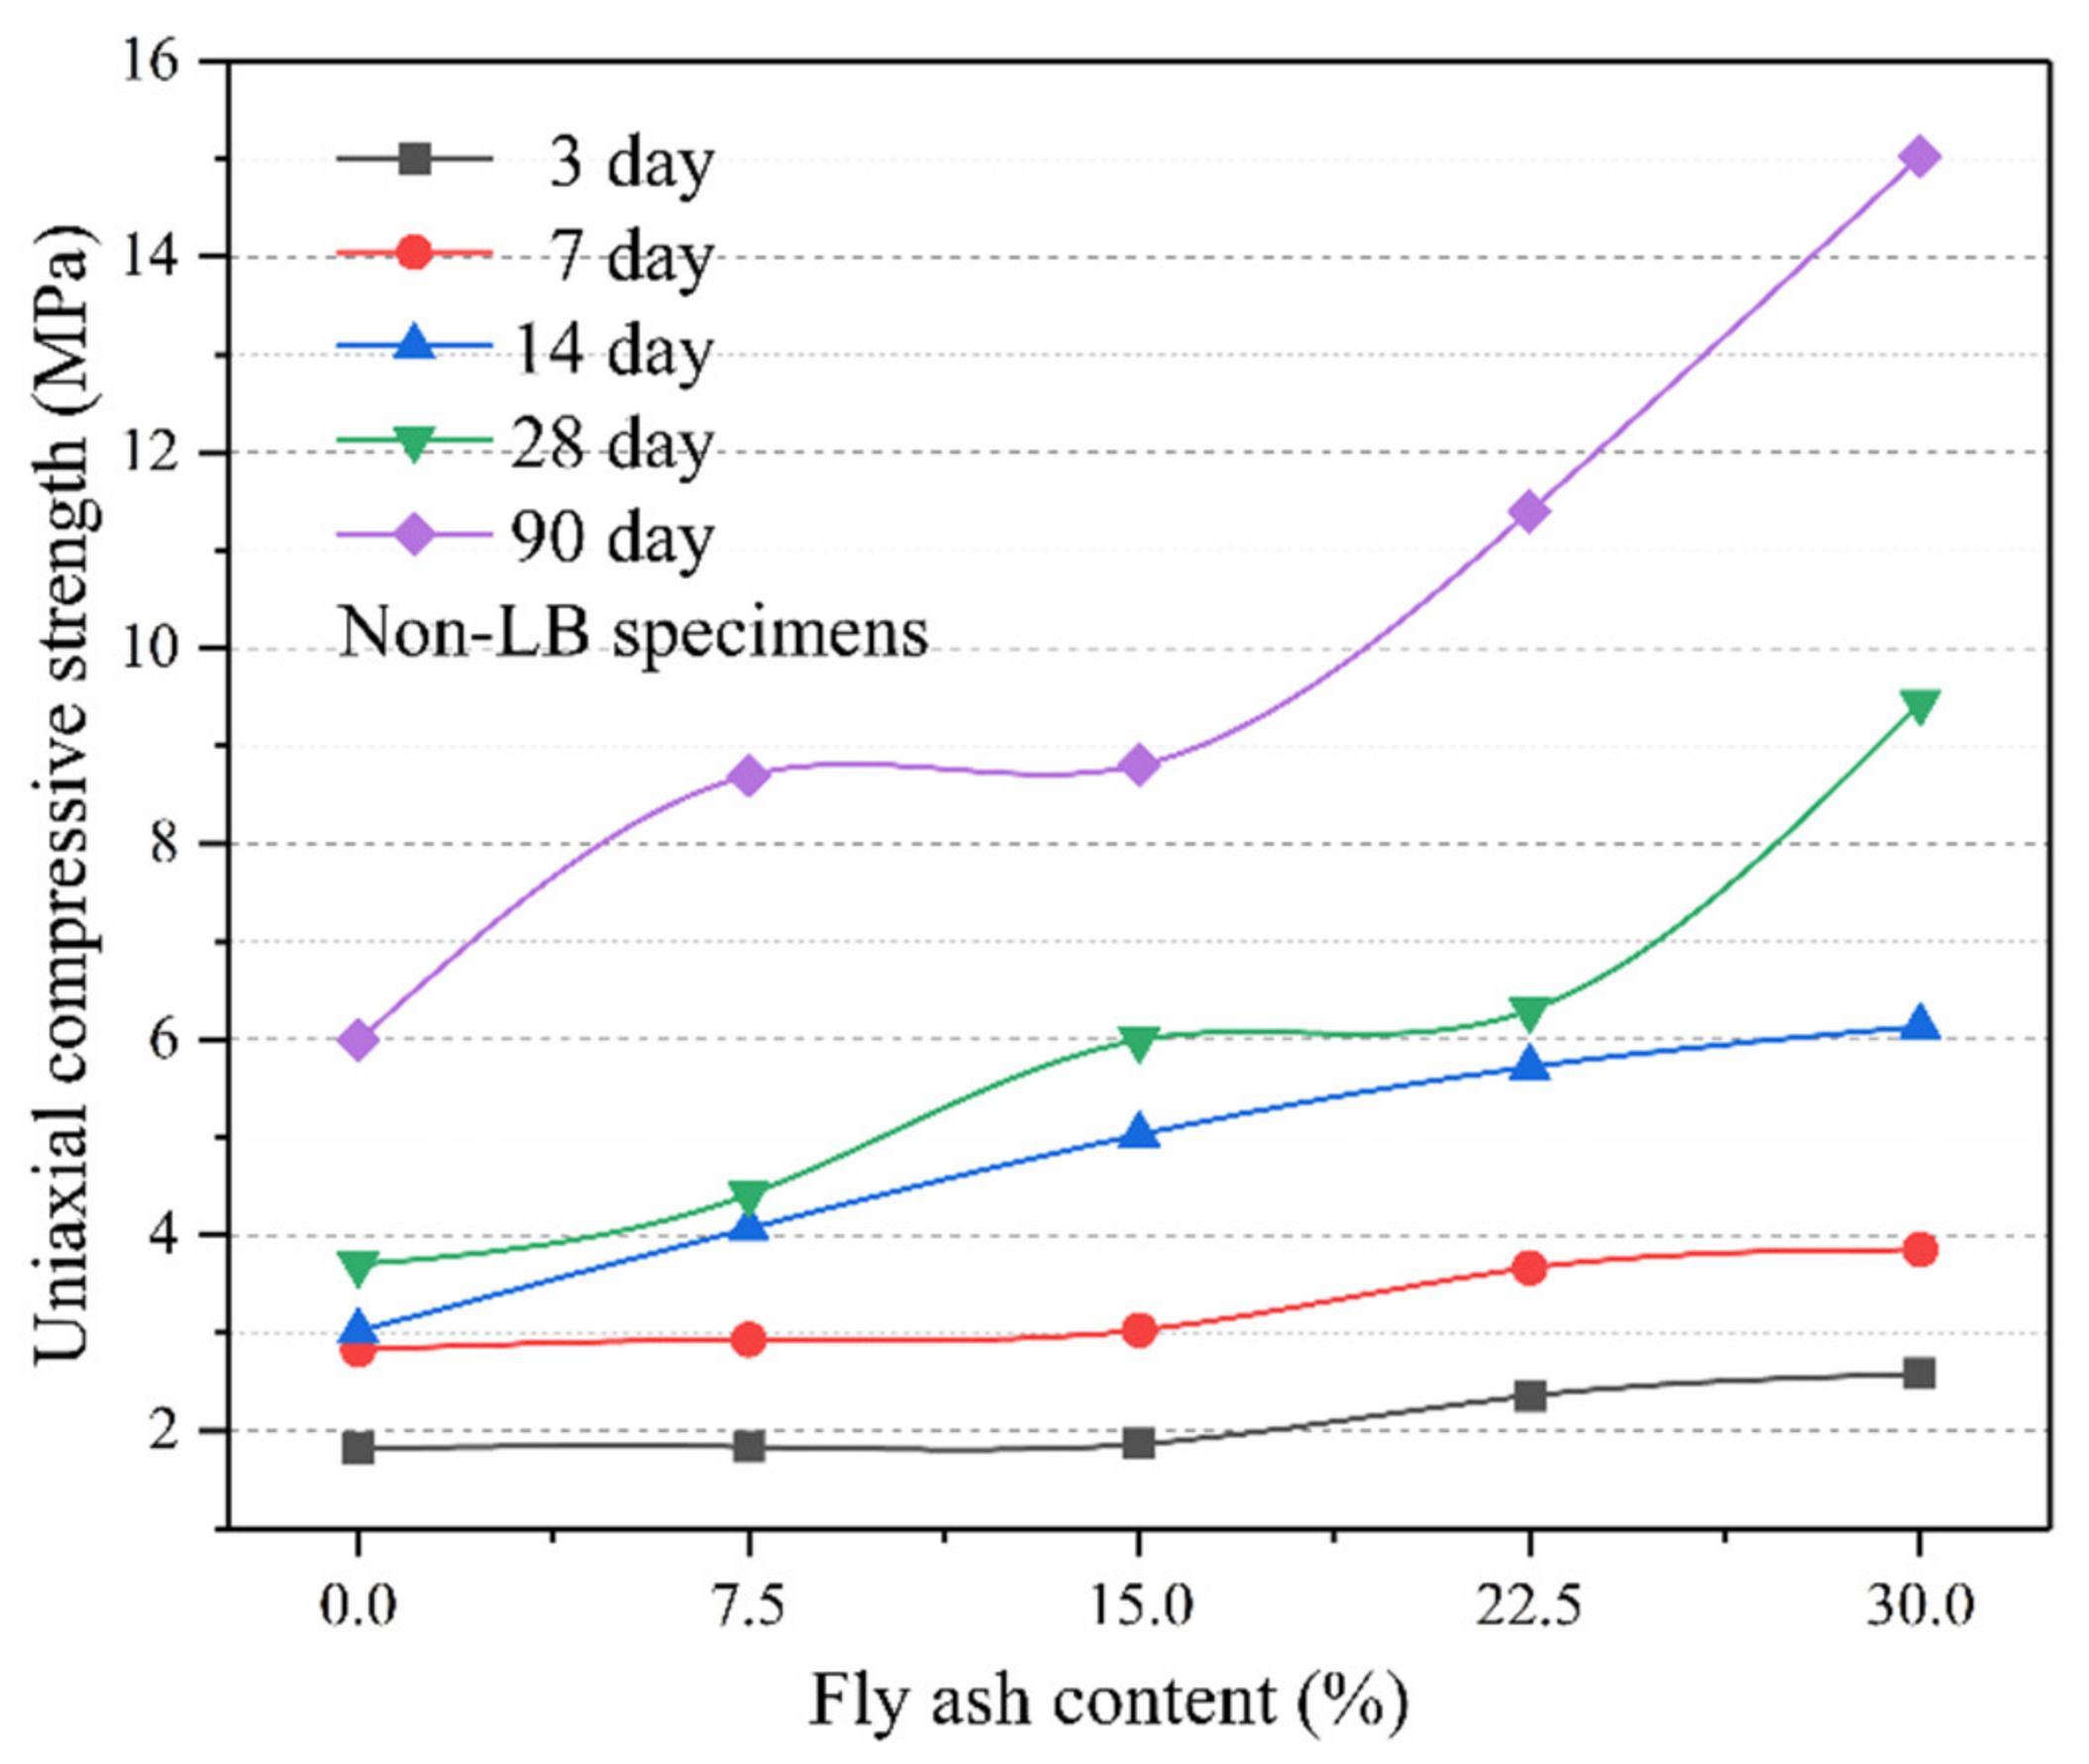
We used the uniaxial compression test to obtain the peak value of the uniaxial compressive strength of ASPLB with each ratio. As can be seen from
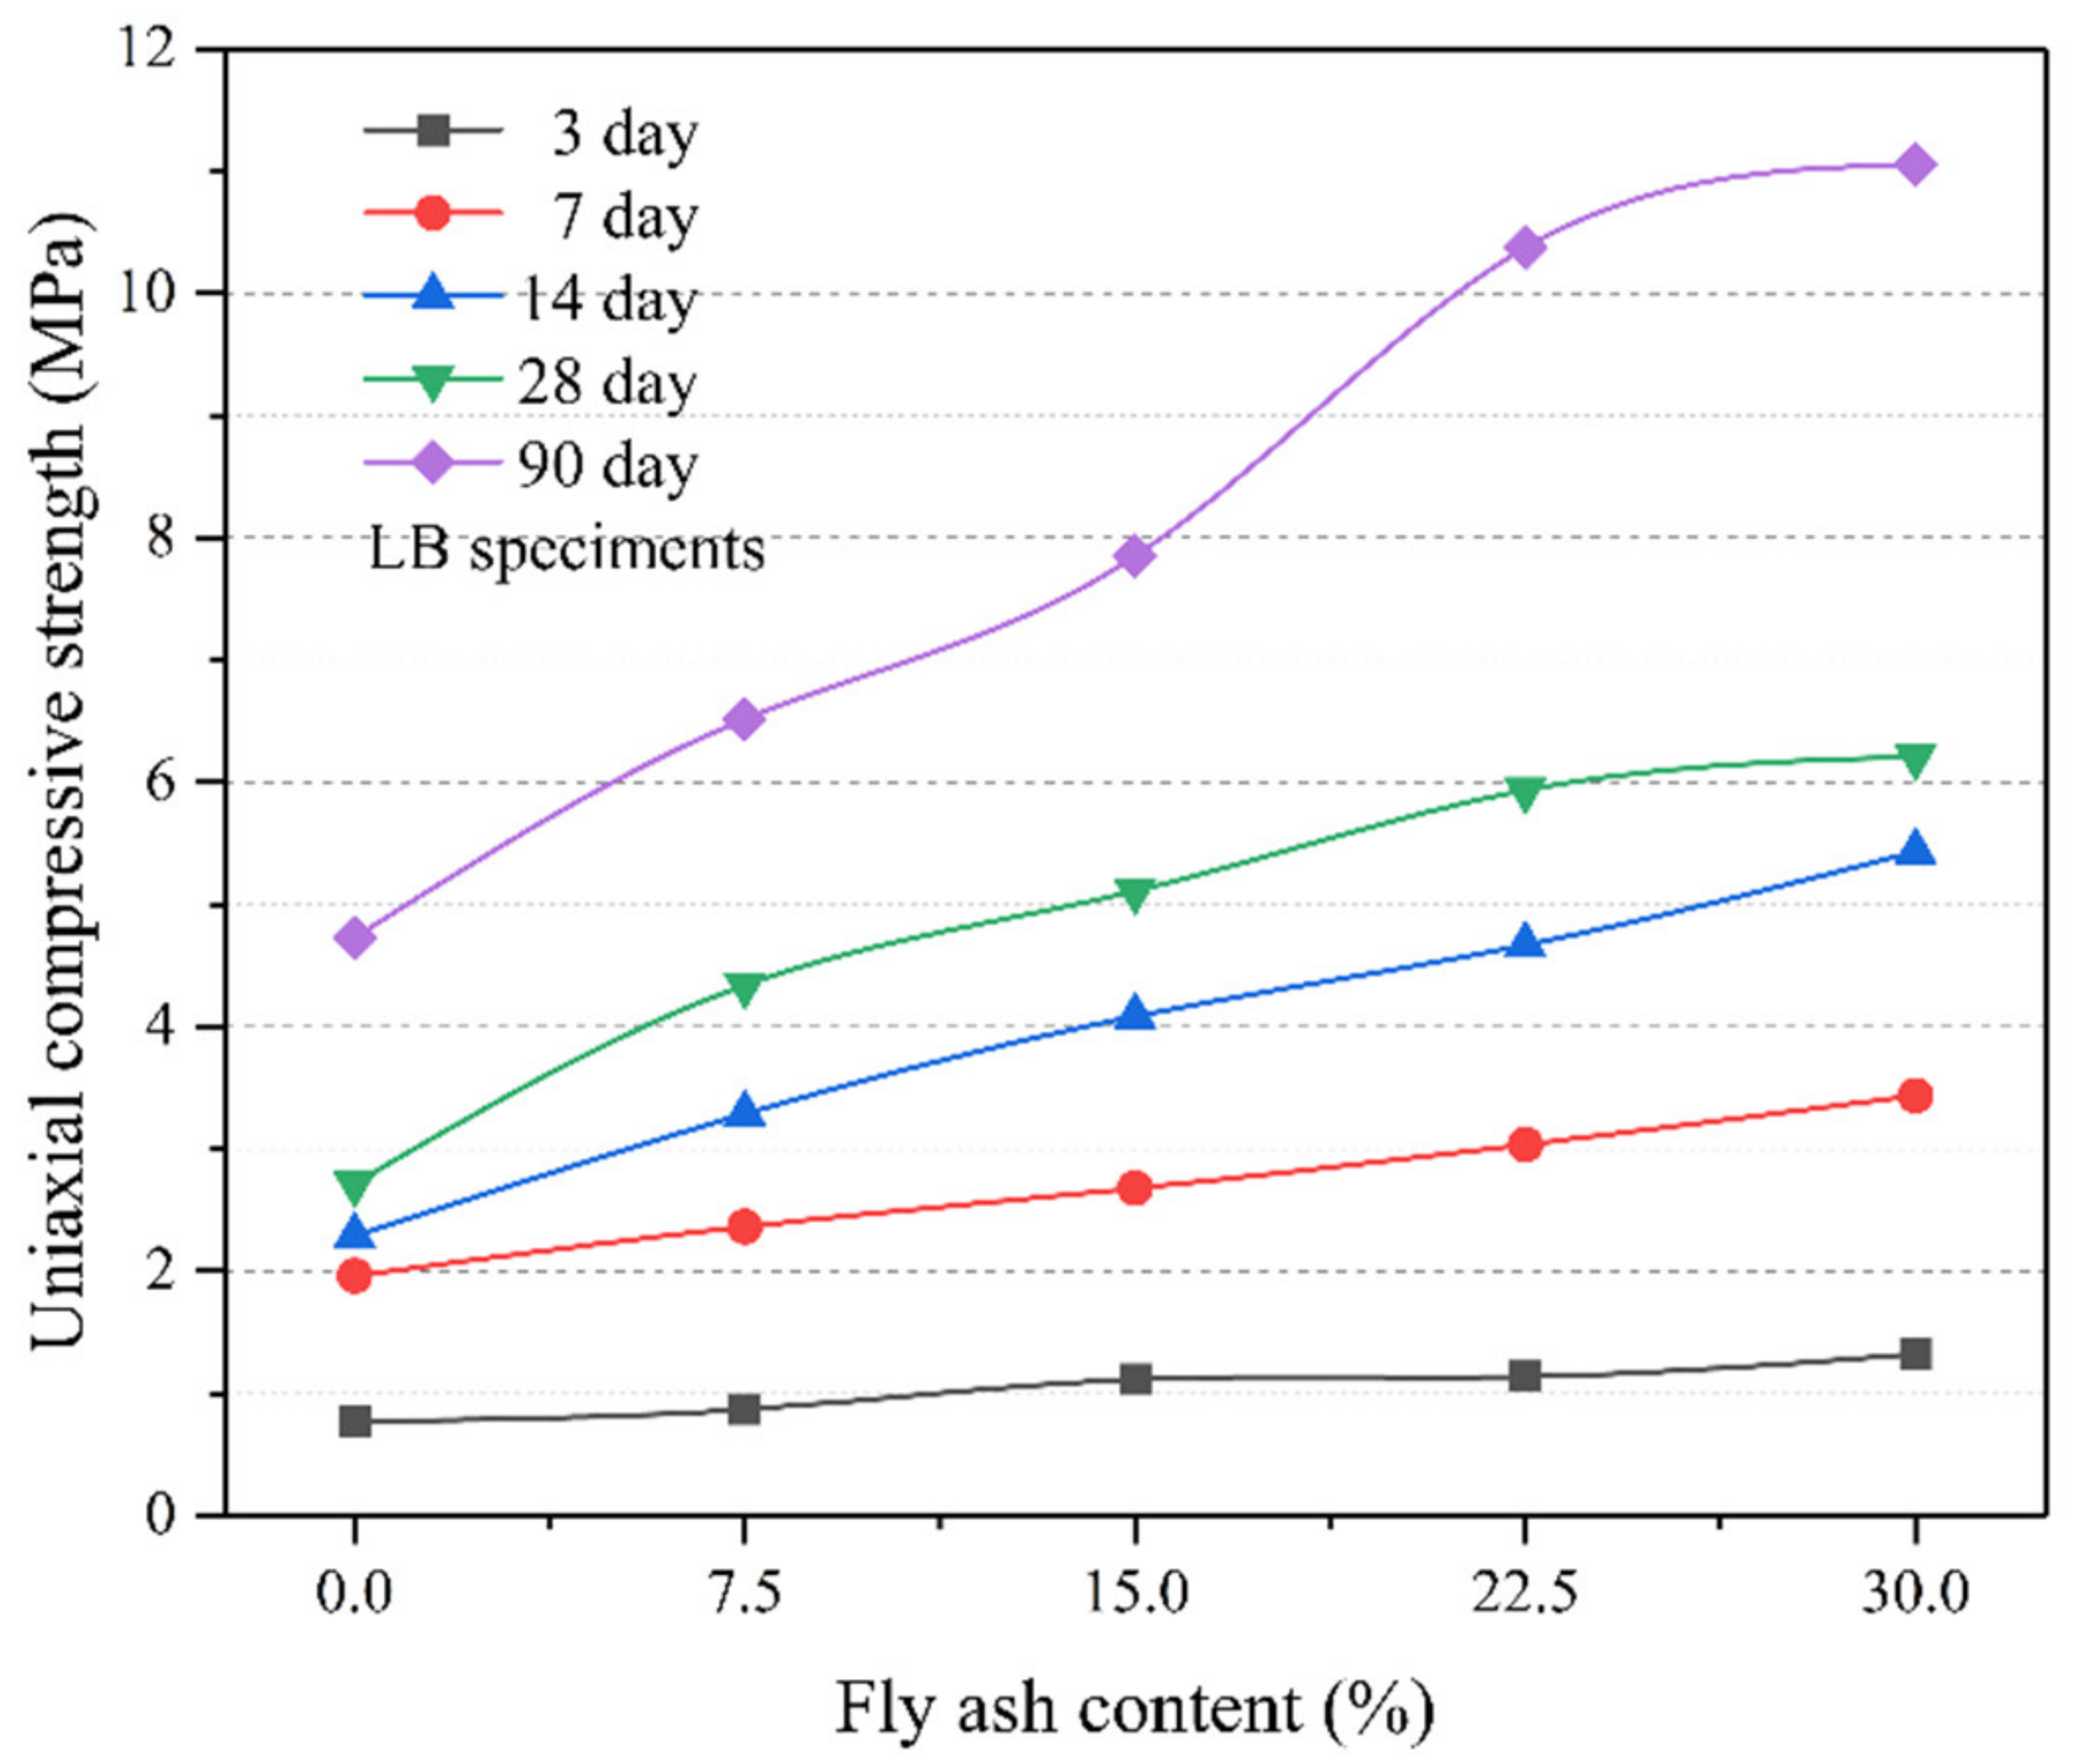
Figure 9, the uniaxial compressive strength of Non-LB with different proportions is significantly different. The higher the FA content in the Non-LB specimen, the greater the strength of the Non-LB under the same curing time, and the increase in FA content presents a certain positive correlation with the increase in Non-LB strength. We used the uniaxial compression test to obtain the peak value of the uniaxial compressive strength of ASPLB with a 1:1 layering ratio: the results are shown in
Figure 9. It can be seen from the analysis that the variation trend of strength of the LB is similar to that of the Non-LB. By comparing
Figure 9 and
Figure 10, the overall strength of the LB is less than that of the Non-LB. When the FA content is 30% and the curing time is 90 days, the strength of the Non-LB is 15.03 MPa, the strength of the LB is 11.05 MPa and the reduction rate is 26%. This is mainly because the layered structure destroys the integrity of the backfill specimen, making the backfill above and below the LSP relatively independent specimens. After the backfill at the top of the LSP is damaged, the backfill at the bottom will not be further damaged. As a result, the strength of the LB specimen is significantly lower than that of the Non-LB.
By analyzing the stress–strain curve of the backfill under the curing time of 28 d, we found that, as shown in
Figure 11, for Non-LB, when the FA content is 0, the peak stress has a certain degree of ductility. This indicates that in the Non-LB without FA, the porosity between substances is relatively large. In the uniaxial compression test, the materials of the Non-LB will be compacted under external pressure. When the Non-LB specimen is compacted to a certain extent, the specimen will be damaged. With the increase of FA content, the compressive peak value of the other four Non-LBs increases. After reaching the peak value, the stress curve of the Non-LB decreases rapidly and presents the phenomenon of irreversible plastic deformation. This indicates that the addition of FA promotes a close bond between the backfill materials and has an obvious promoting effect on the compressive strength of Non-LB. After reaching the peak of failure, the plastic deformation of Non-LB becomes more obvious.
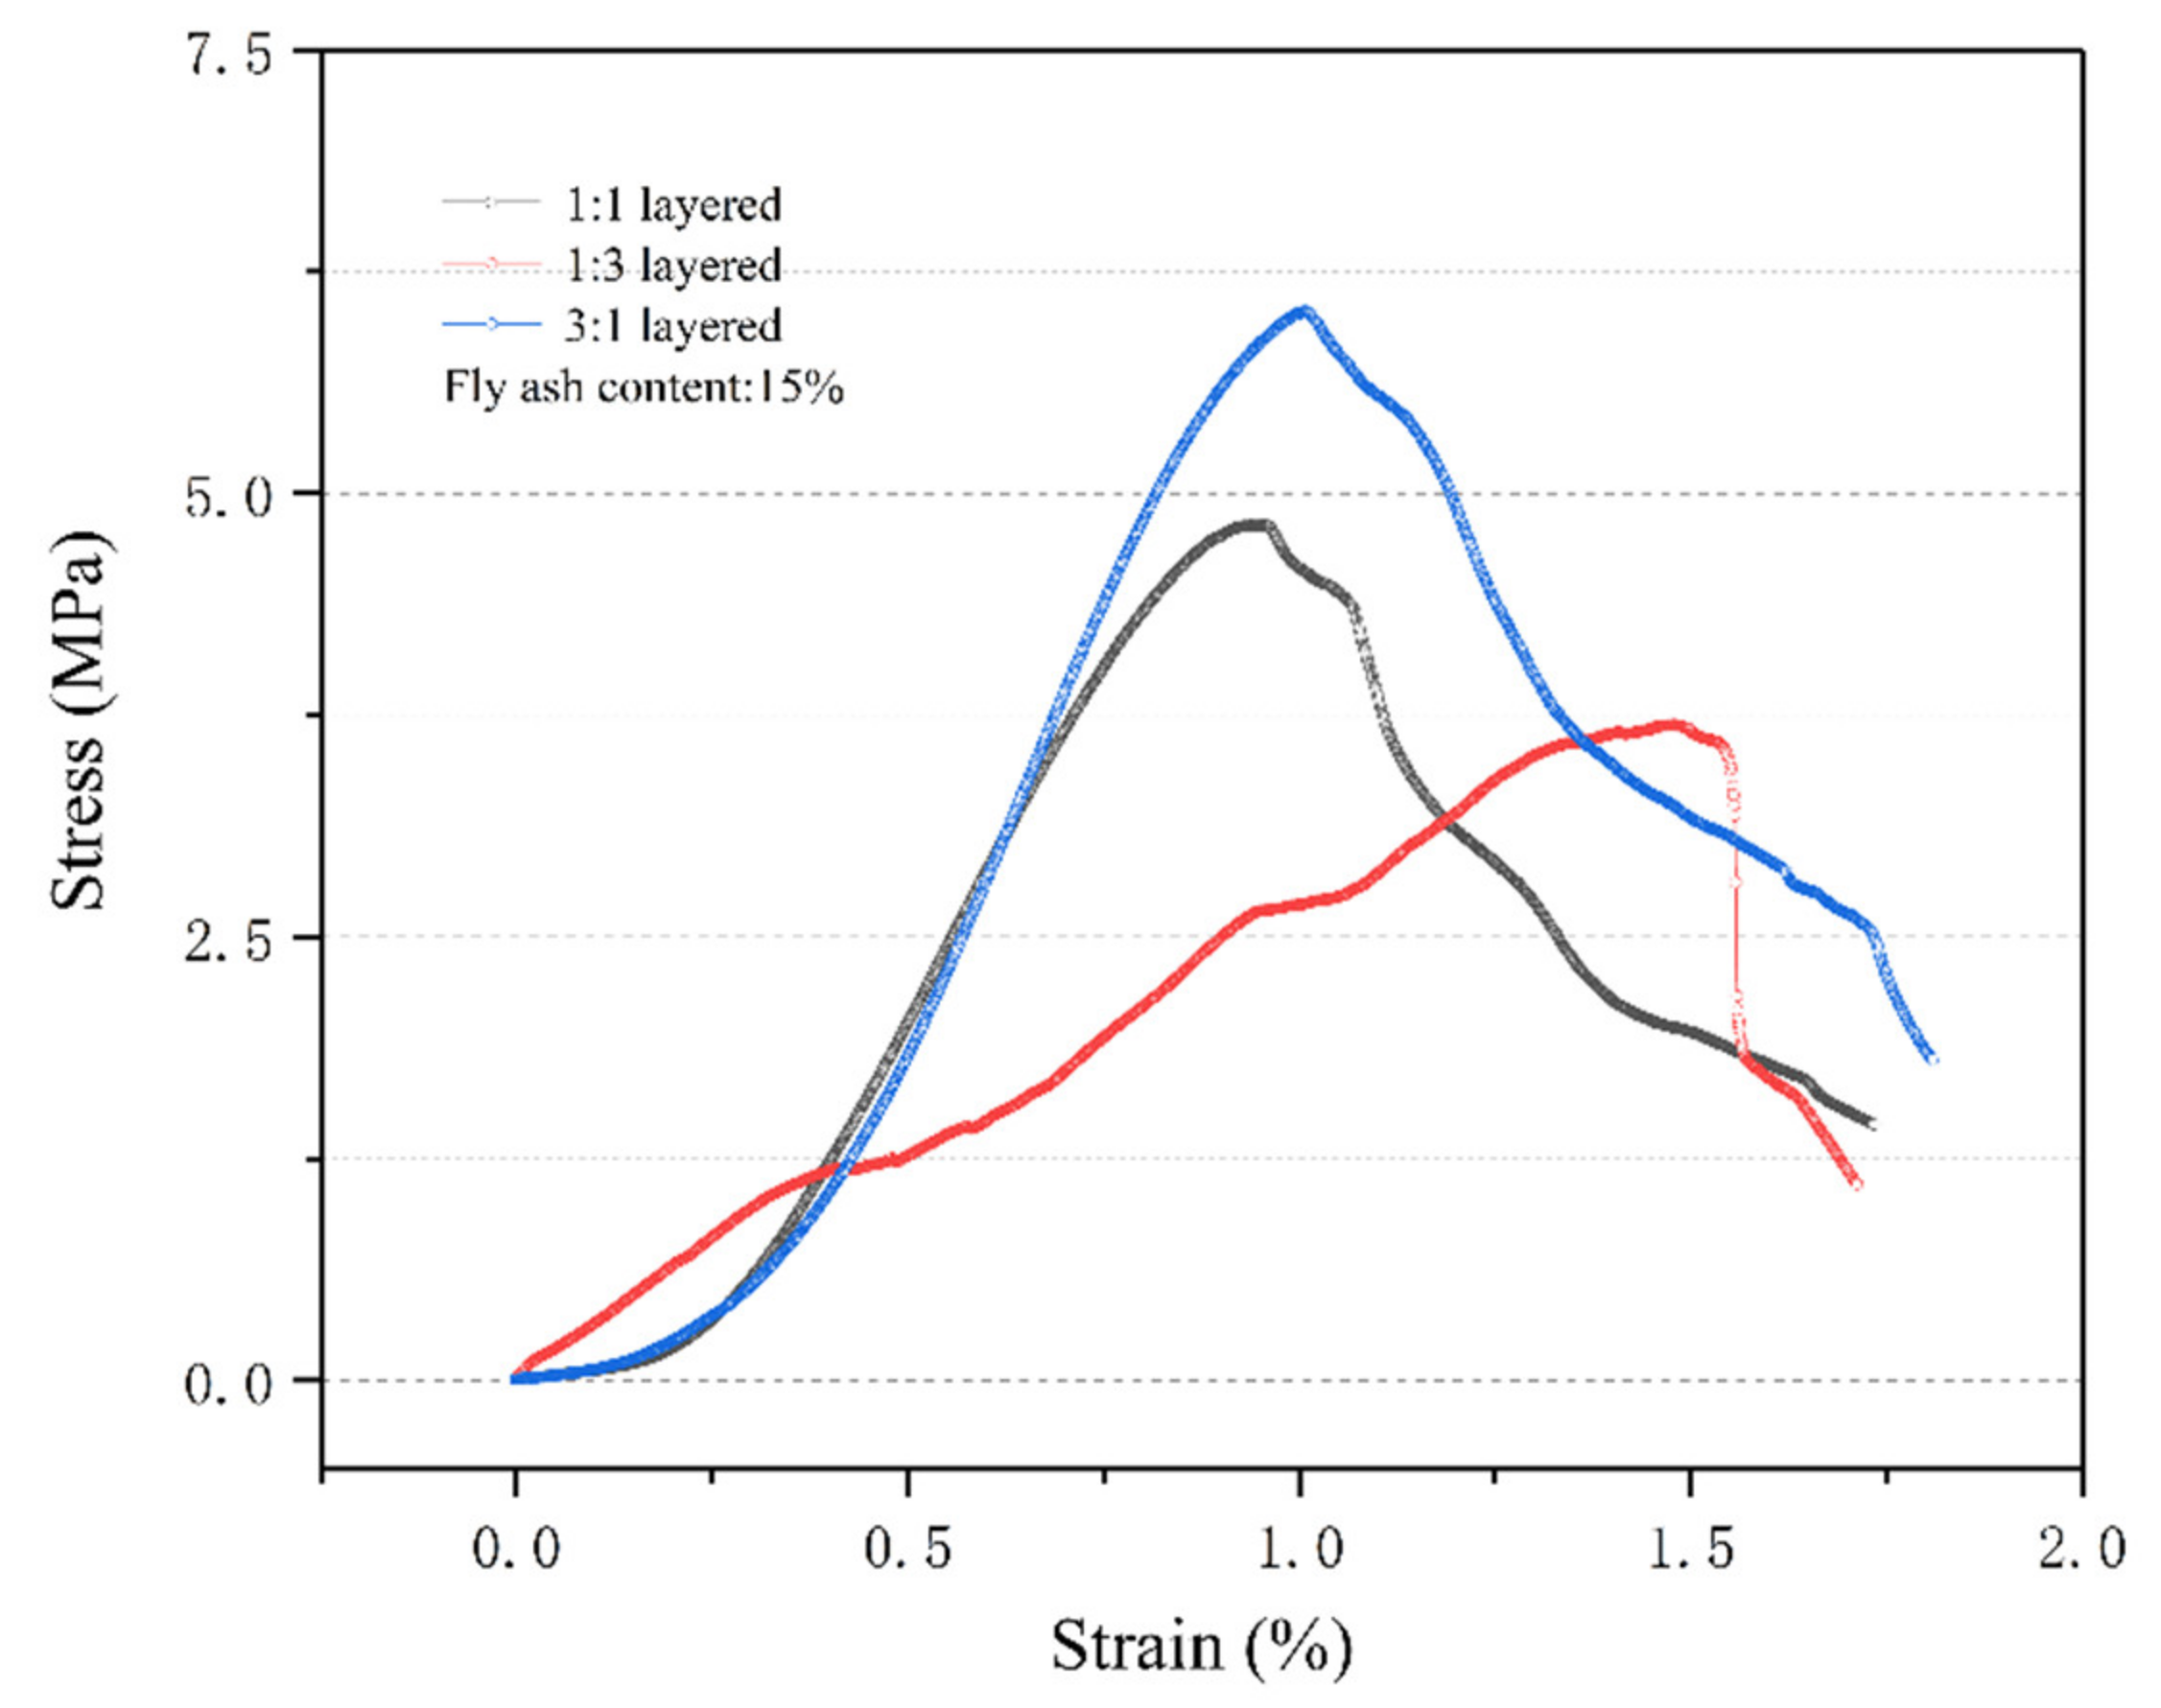
Figure 12 shows the stress–strain curves of the backfill curing for 28 days with different layering ratios. By comparing the stress–strain curves of different LB with 15% FA content in
Figure 12 with Non-LB with 15% FA content in
Figure 11, it can be seen that the plastic deformation phenomenon of the LB is similar to that of the Non-LB. Both reach the peak value and then decline rapidly after failure; however, the stress peak value of the LB is significantly lower than that of the Non-LB. This is related to the position of the LSP. The closer the LSP is to the upper end of the LB, the smaller the stress peak value of the LB. The LB is damaged above the LSP first, and then the cracks conduct themselves further downward. This indicates that the layered backfill operation divides the backfill into two different modules, making the concentrated stress module of the LSP smaller. When the module above the LSP is smaller, the stress peak measured by the LB is also smaller.
3.3.2. Effect of Curing Time on ASPLB
Another factor affecting the strength of the backfill is the curing time. It can be seen from
Figure 9 and
Figure 10 that with the increase in curing time the compressive strength of the backfill also increases, indicating that the curing time of the backfill is positively correlated with its strength. This is because with the increase in curing time, the wool stoma, i.e., the space left over by the constant consumption of pore water and evaporation of the backfill material in the hydration reaction and volcanic ash reaction process decreases, giving rise to more gel pores, i.e., the spaces in the structure of the reaction products C-S-H gel and ettringite, with a small pore size [
43]. As a result, the BMs are more tightly bound to each other, the total porosity of the backfill decreases and the strength of the backfill increases significantly. During the curing period between 28 and 90 days, the strength of the backfill increases by about a factor of 1. This indicates that a long curing time can make the hydration reaction of the backfill more complete and thorough, thus greatly increasing the strength of the backfill. When the backfill specimen is cured for 28 days, the strength of the backfill containing FA is between 4 and 8 MPa. At this time, the strength of the backfill is able to meet the backfill strength required by most backfill mining mines.
Figure 11 and
Figure 12 show that the slope of the stress–strain curve of the backfill with a curing time of 28 days increases along with the increase in FA content in the backfill. This indicates that an increase in curing time of the backfill and an increase in FA content in the backfill materials can effectively improve backfill strength.
3.3.3. Influence of Layered Structure on Backfill Strength
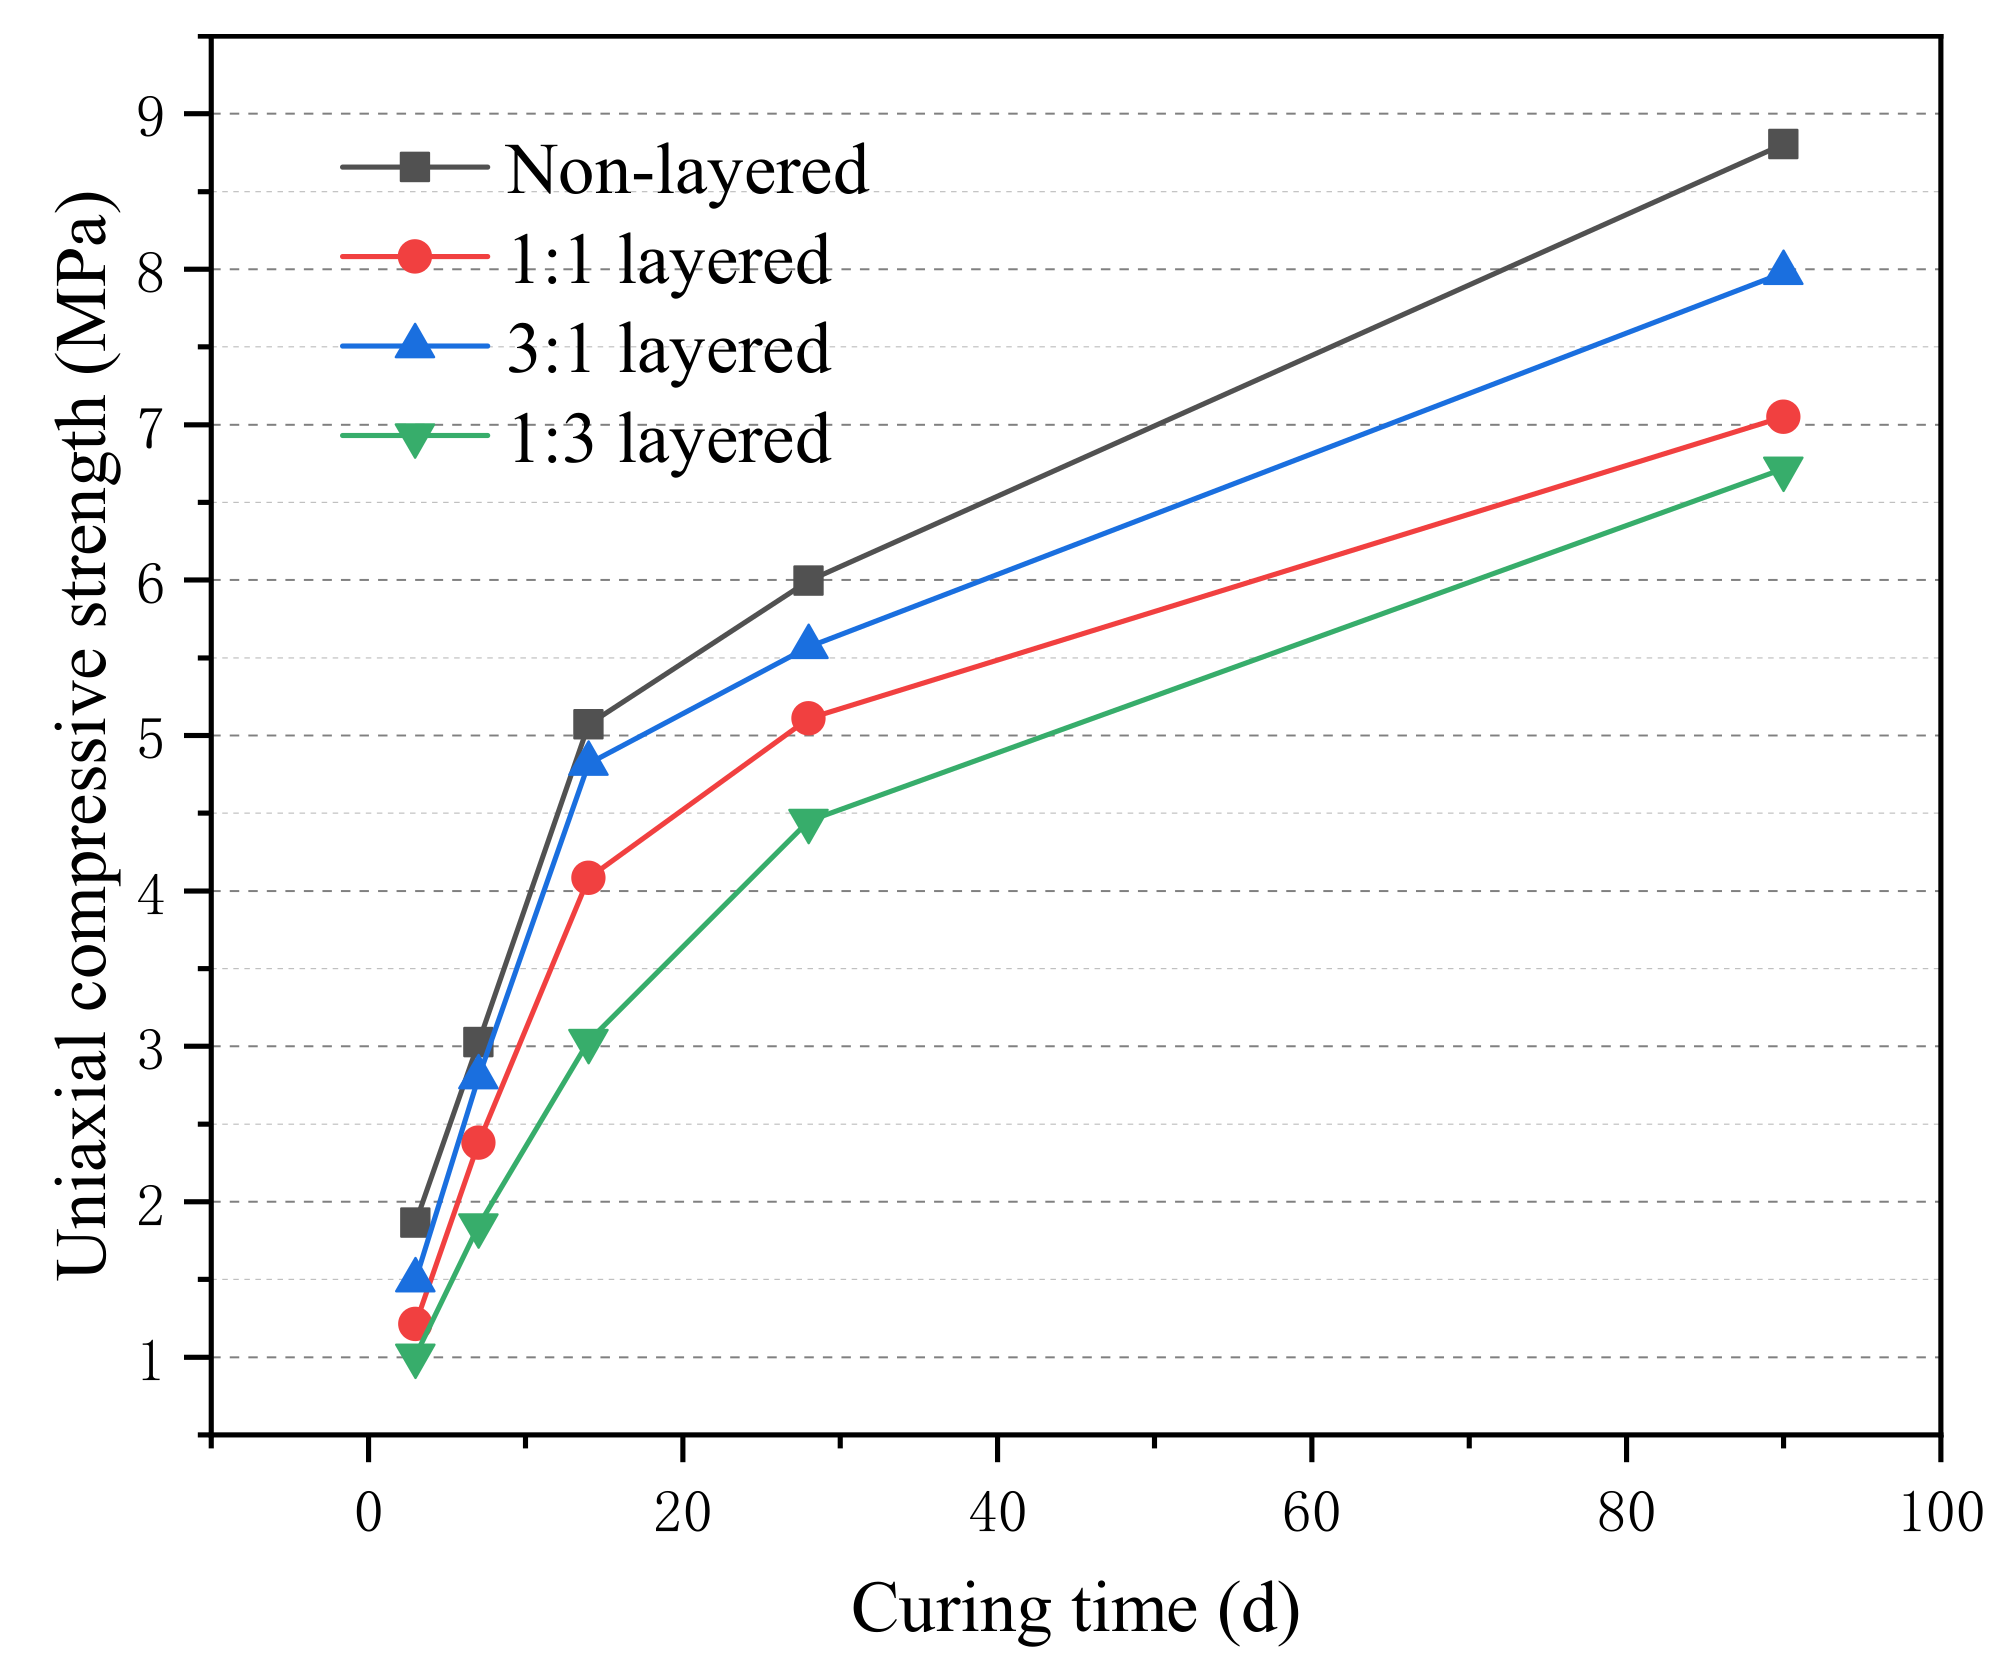
Uniaxial compression tests were carried out on the different layering ratios with an FA content of 15%. According to
Figure 13, the strength of LB at curing times for 3 d, 7 d and 14 d is less than that of Non-LB. When the curing time reached 28 d and 90 d, the strength of the LB was significantly lower than that of the Non-LB. The LSP formed by layered backfill has an obvious reduction effect on the strength of LB. In addition, when the proportion of backfill above the LSP is larger, the strength of LB is higher, but it is also lower than that of Non-LB. This indicates that ensuring the integrity of the backfill has a positive effect on the strength of the backfill, but it is difficult to backfill a complete gob once in the actual backfill operation, so the number of backfill times should be reduced as much as possible.
3.3.4. Summary of Different Factors Affecting the Compressive Strength of ASPLB
It can be seen from the analysis in this section that the strength of ASPLB is affected by a variety of factors, such as FA content, curing time and type of layered structure. The strength of the ASPLB increases with increases in FA content and the curing time of the specimen. The reason for this intensity change is influenced by micro and macroscales. From the micro point of view, with increases in the FA content and curing time, the internal structure of ASPLB has different chemical changes, which leads to the change of porosity and wave velocity. The specific numerical relationship between porosity and wave velocity with strength will be further analyzed in
Section 3.4. From the macro point of view, due to the existence of the delamination plane, the specimen is divided into two different parts (upper and lower), which also causes a change in the failure mode. The failure mode and law of ASPLB will be analyzed in detail in
Section 3.5.
3.4. Relationship between Porosity and Wave Velocity with Uniaxial Compression Strength of ASPLB
3.4.1. Relationship between Porosity and Uniaxial Compression Strength of ASPLB
Figure 14 shows the relationship between the porosity and uniaxial compression strength of the Non-LB and the 1:1 LB. The blue line (squares) is the fitting line of the strength of Non-LB. The red line (circles) is the fitting line of the strength of the 1:1 LB specimen. Their fitting equations are shown in the figure. The fitting coefficient (R
2) between the porosity of Non-LB and the uniaxial compression strength is 0.93, and the fitting coefficient (R
2) between the porosity of the 1:1 LB and the uniaxial compression strength is 0.96, showing a good fit. It can be seen that uniaxial compression strength is an approximately linear inverse correlation with porosity, which indicates that the smaller the porosity of the backfill, the greater the uniaxial compression strength, which is in good agreement with the literature [
38]. The larger the porosity of the backfill, the smaller the tightness between the backfill materials and the lower the backfill strength. The addition of FA reduces the porosity of the backfill, and the greater the proportion of FA, the greater the strength of the backfill. By comparing the slopes of the two fitting curves, the slope of the red line in
Figure 14 is significantly lower than the blue line, indicating that porosity has a more significant impact on the strength of Non-LB.
3.4.2. Relation between Wave Velocity and Uniaxial Compression Strength of ASPLB
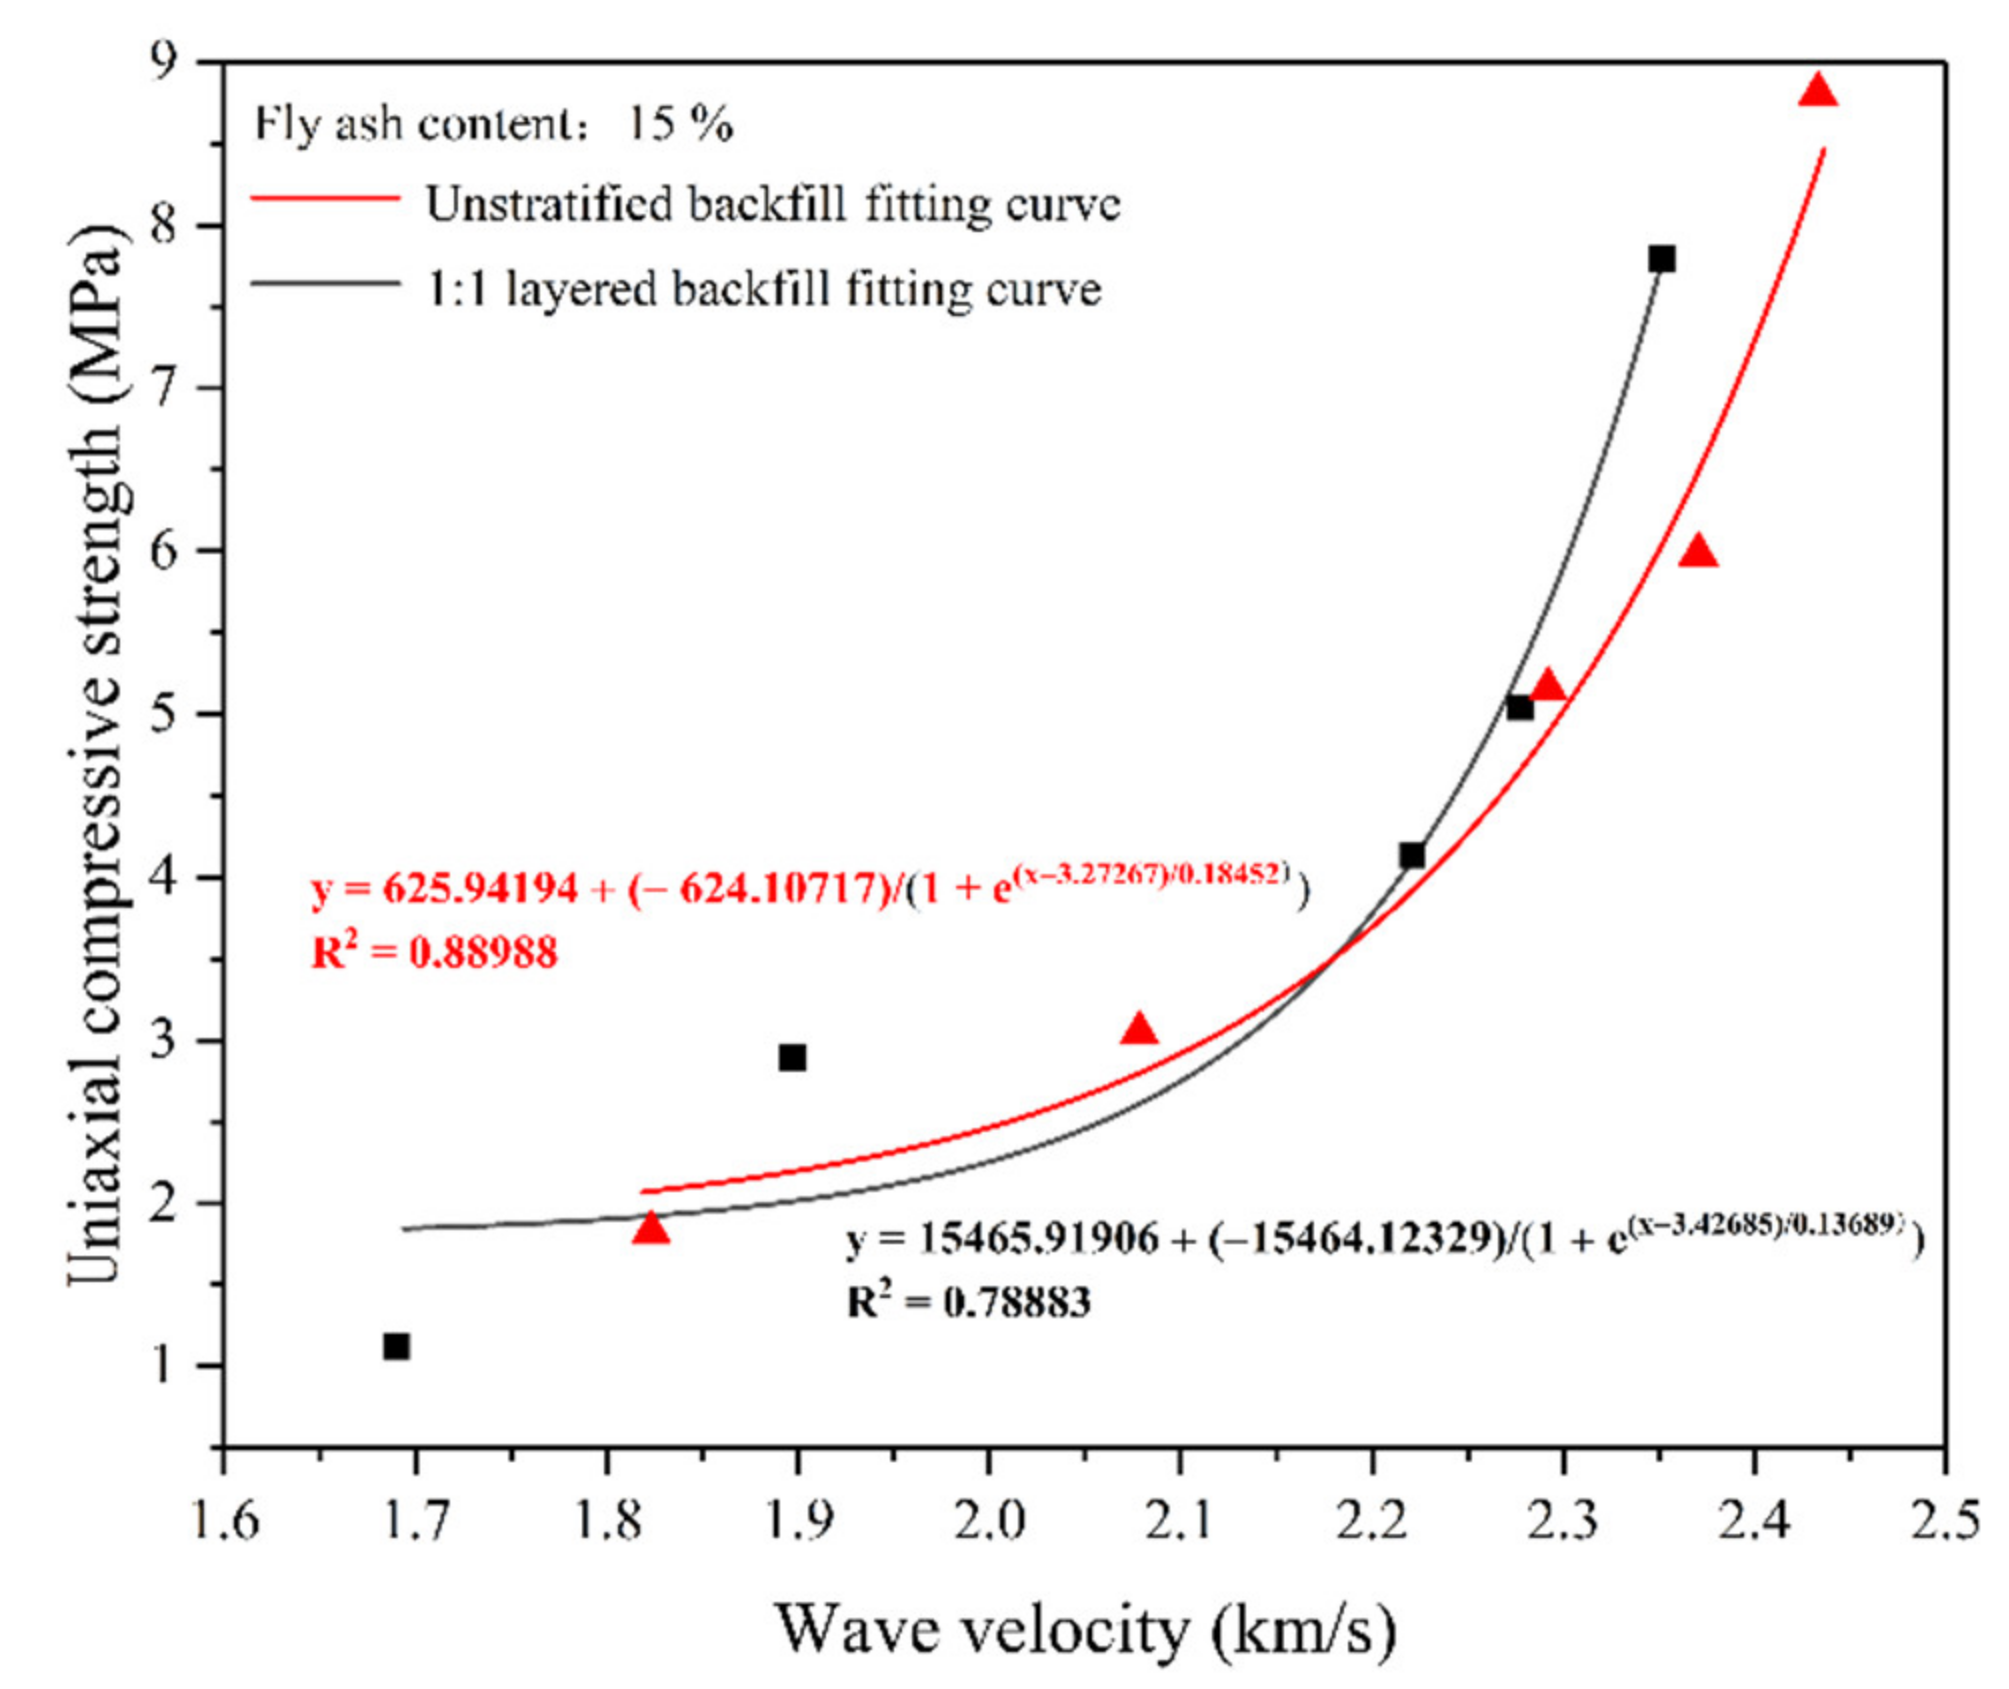
Figure 15 shows the relationship between the wave velocity and the uniaxial compression strength of the Non-LB and the 1:1 LB. The red line (squares) is the fitting line of the strength of Non-LB. The black line (squares) is the fitting line of the strength of the 1:1 LB specimen. Their fitting equations are shown in the figure. The fitting coefficient (R
2) between the wave velocity of Non-LB and the uniaxial compression strength is 0.89, and the fitting coefficient (R
2) between the wave velocity of 1:1 LB and the uniaxial compression strength is 0.79. It can be seen from the figure that the larger the wave velocity of the backfill, the greater the corresponding backfill strength, and the wave velocity of the backfill is approximately nonlinear and positively correlated with the uniaxial compression strength. In
Figure 15, the experimental data of 1:1 LB under the 1.7–1.9 wave velocity have a large deviation from the fitting curve, which is caused by the incomplete shaping of the LSP at the early curing time. For the wave velocity and uniaxial compression strength of the LB under the medium and long curing times, the experimental data are in good agreement with the fitting curve. The experimental results are consistent with the literature [
44].
3.4.3. Summary of the Relationship between Porosity, Wave Velocity and Compressive Strength
Based on the above fitting analysis, we can make strength predictions for similar materials. Some key data can also provide an important basis for predicting intensity changes. The measured wave velocity has a positive nonlinear correlation with uniaxial compressive strength, while the porosity has a linear inverse correlation with compressive strength.
When the wave velocity is between 1.6 and 2.1 m/s, the strength increases relatively slowly. The Non-LB growth slope is 3.33, and the LB growth slope is 1.67. When the wave velocity of the Non-LB specimen exceeds 2.1 m/s or the LB specimen exceeds 1.95 m/s, the strength of the two groups of specimens increases rapidly. This wave velocity value corresponds to the 7th day of the curing cycle in
Section 3.2. The main reason for the increase of wave velocity is that the hydration reaction occurs at a rapid stage from 7 to 14 days; ultrasonic waves travel slowly as they pass through liquids and gases. With the increase in curing age, the volume fraction of liquid and gas in the backfill decreases gradually, forming a homogeneous single structure system. Therefore, the propagation velocity of ultrasonic waves in the filling body increases rapidly. These two wave velocity parameters can be used as important parameters to judge the reaction degree of backfill.
The variation law of porosity is similar between Non-LB and LB; however, under the same porosity, the strength of Non-LB is greater than that of LB. The main reason is the effect of the layered structure. This effect will be further analyzed in the next section on failure modes.
3.5. Failure Mode
3.5.1. Fracture Development Mode of Non-LB
In order to study the displacement characteristics of cracks on the surface of Non-LB, digital speckle field treatment was carried out on the surface of Non-LB, and three points were marked on the top, middle and tail of the fracture development: see
Figure 16. The positions of the marked points were obtained by tracing the center of the mark points. The different colors in
Figure 16 show the fracture displacement and geometric deformation images after 28 d curing of the Non-LB with 15% FA content.
The fracture extends from the upper end of the Non-LB to the end of the Non-LB. The width of the fracture is between 0.8 and 1.6 mm, and the geometric deformation is about 5%.
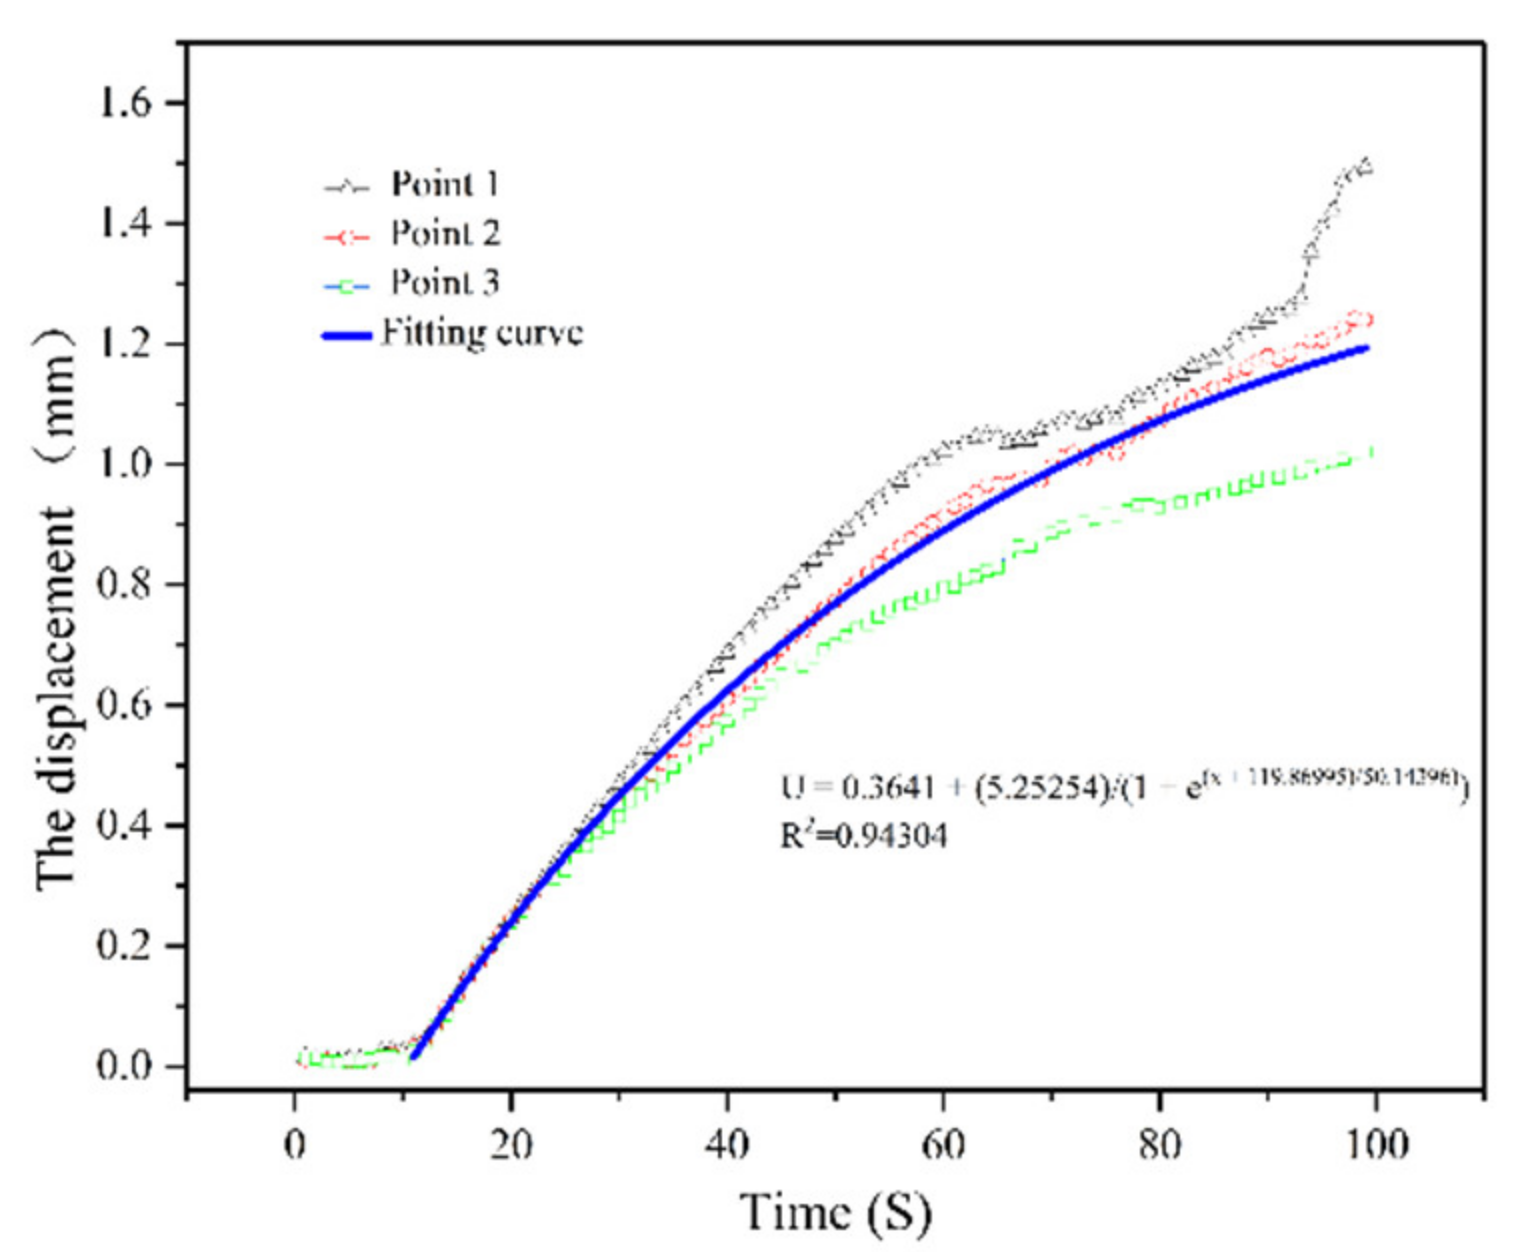
Figure 17 shows the displacement images of the three marked points of the Non-LB. It can be seen from the figure that the crack of the Non-LB starts to appear at a nearly consistent time, indicating that the fracture extension of the Non-LB is not hindered, and the mark points at the upper end of the Non-LB have the maximum displacement at the final failure. The displacement of the upper end fluctuated after 60 s, which was related to the position deviation caused by the continuous pressure of the backfill material near the mark point at the upper end, which had little influence on the displacement change trend of the mark point and was an experimental error. Through observation, the displacement change trend of the three marks is similar, and the displacement images of the marks are fitted with the fitting function as follows:
where
U is the displacement value of the marker point and
x is the compression time and the fitting coefficient is 0.94. The fitting is in good agreement with the development degree of the middle fracture, and the final development degree of the upper and lower fracture is within the range of (
U ± 0.4) mm of the fitting curve. Therefore, the middle development degree of fracture can be expressed by the equation.
3.5.2. Failure Mode of LB
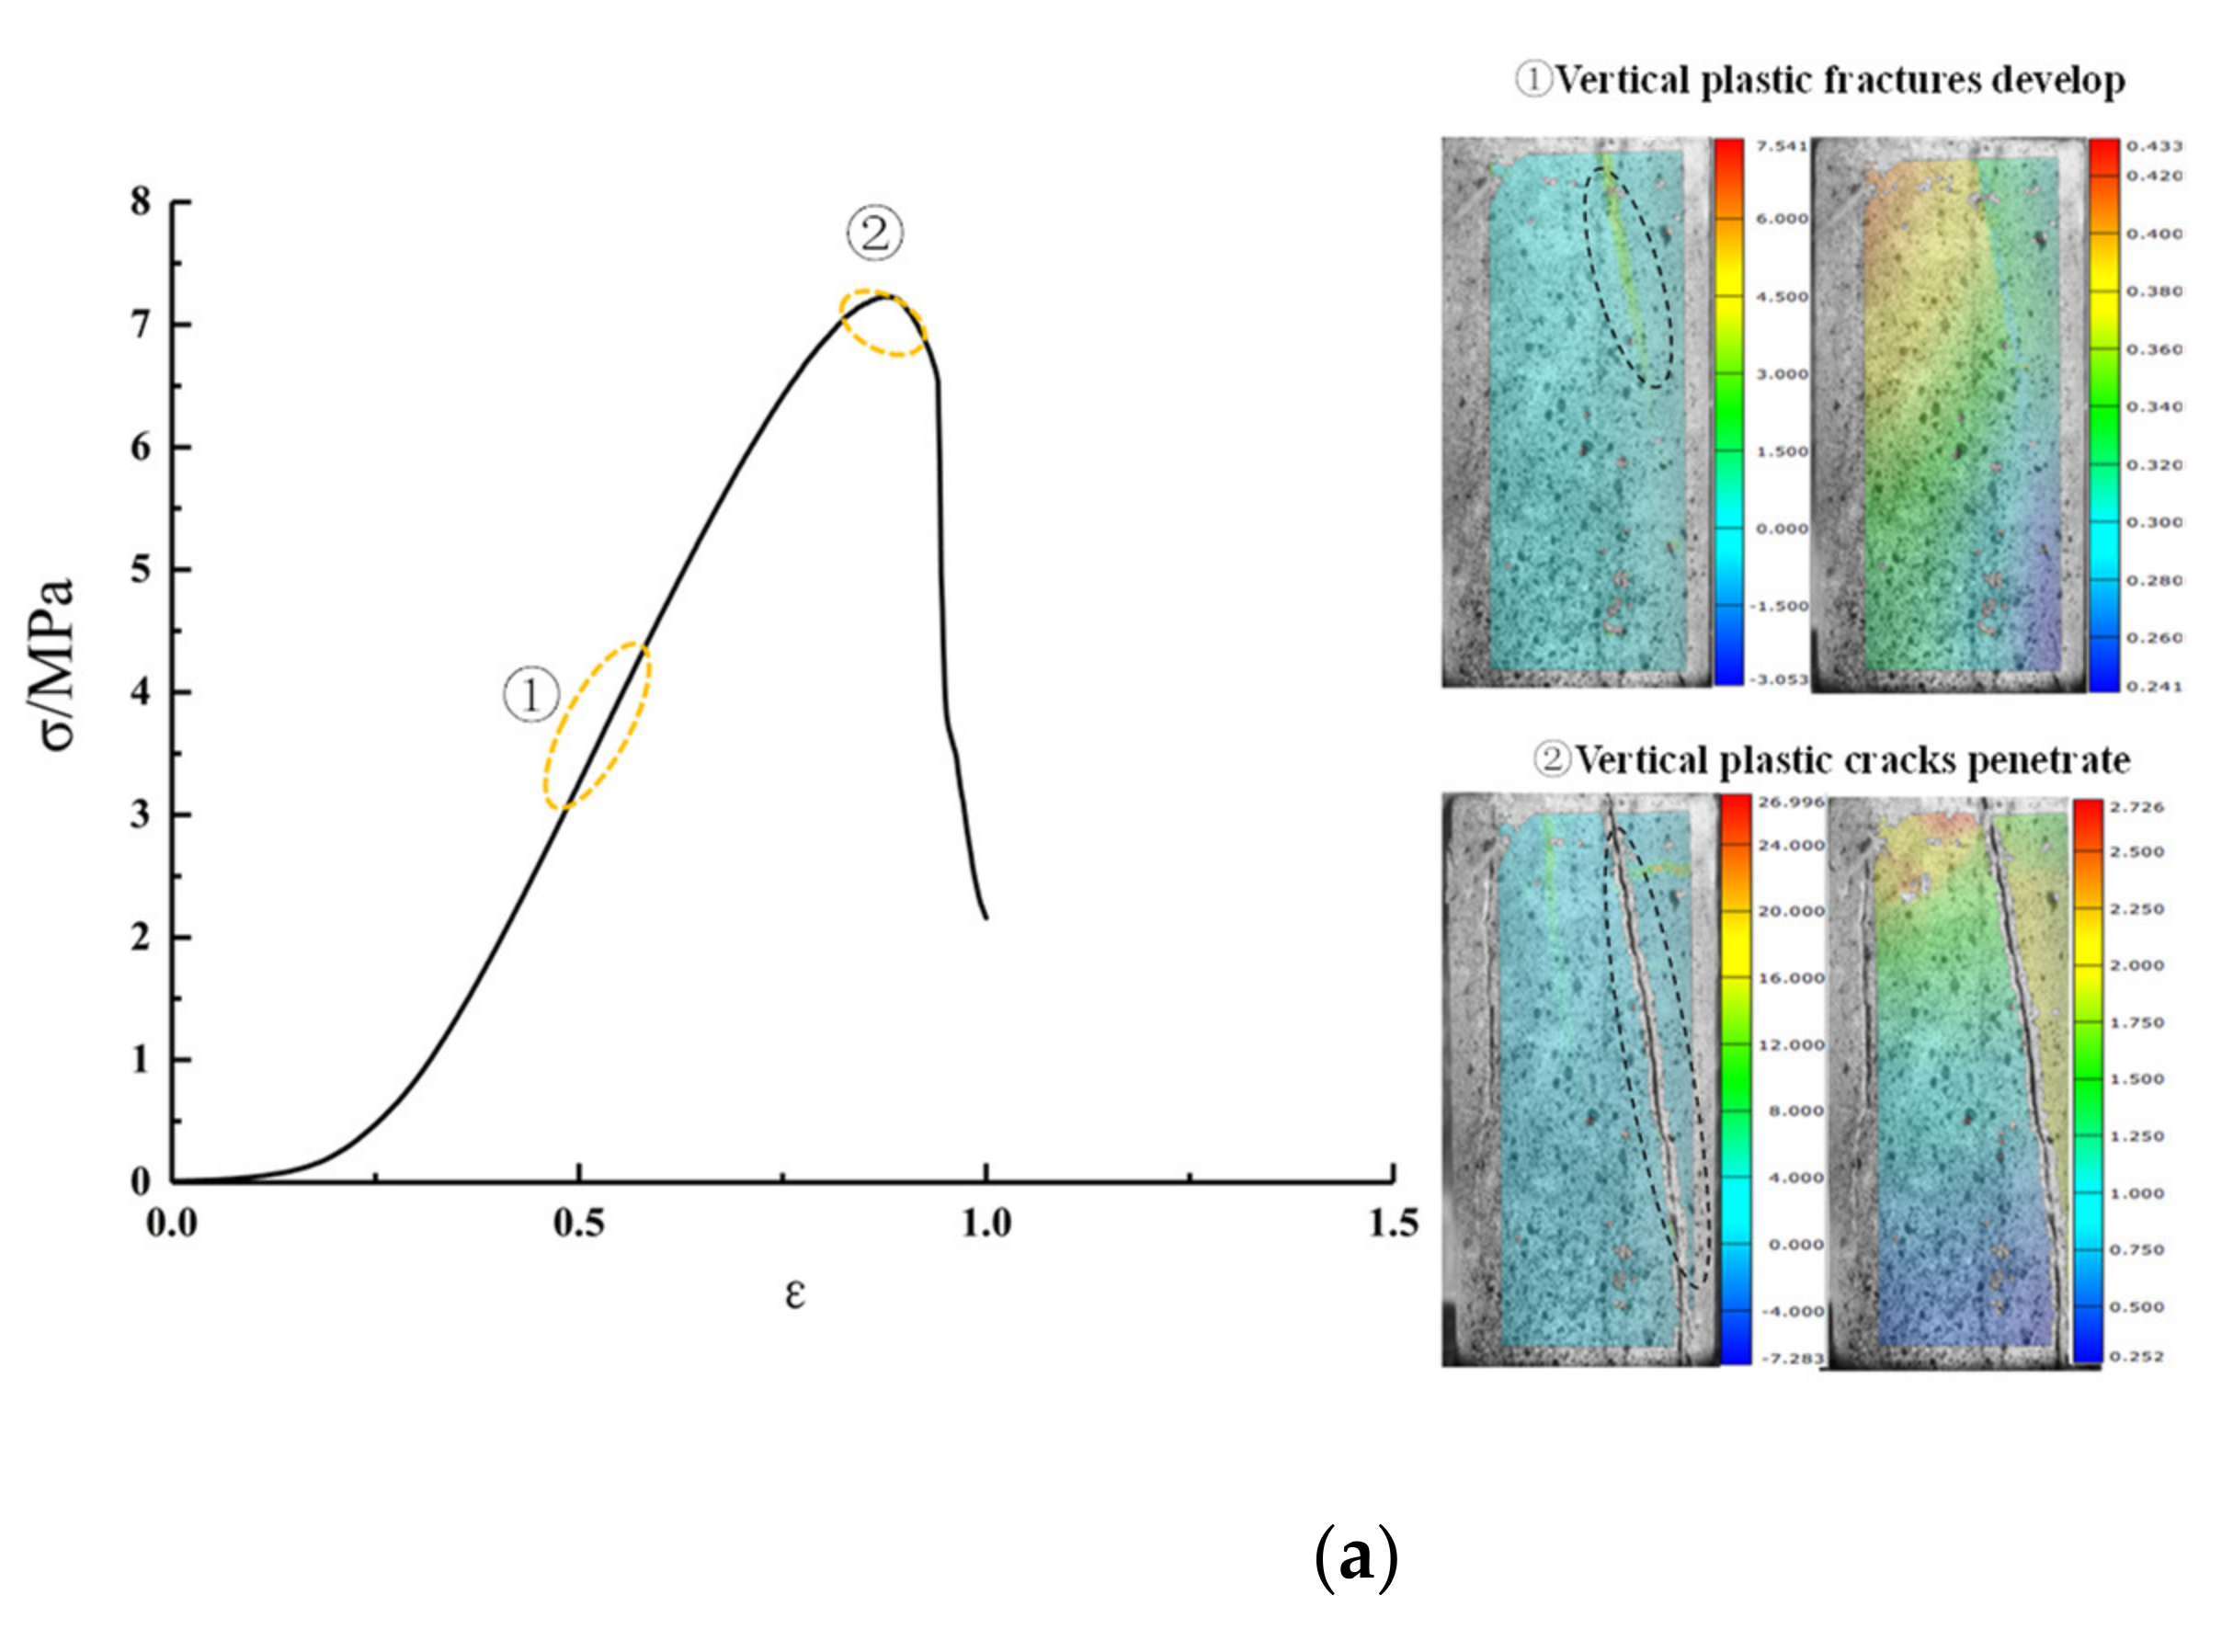
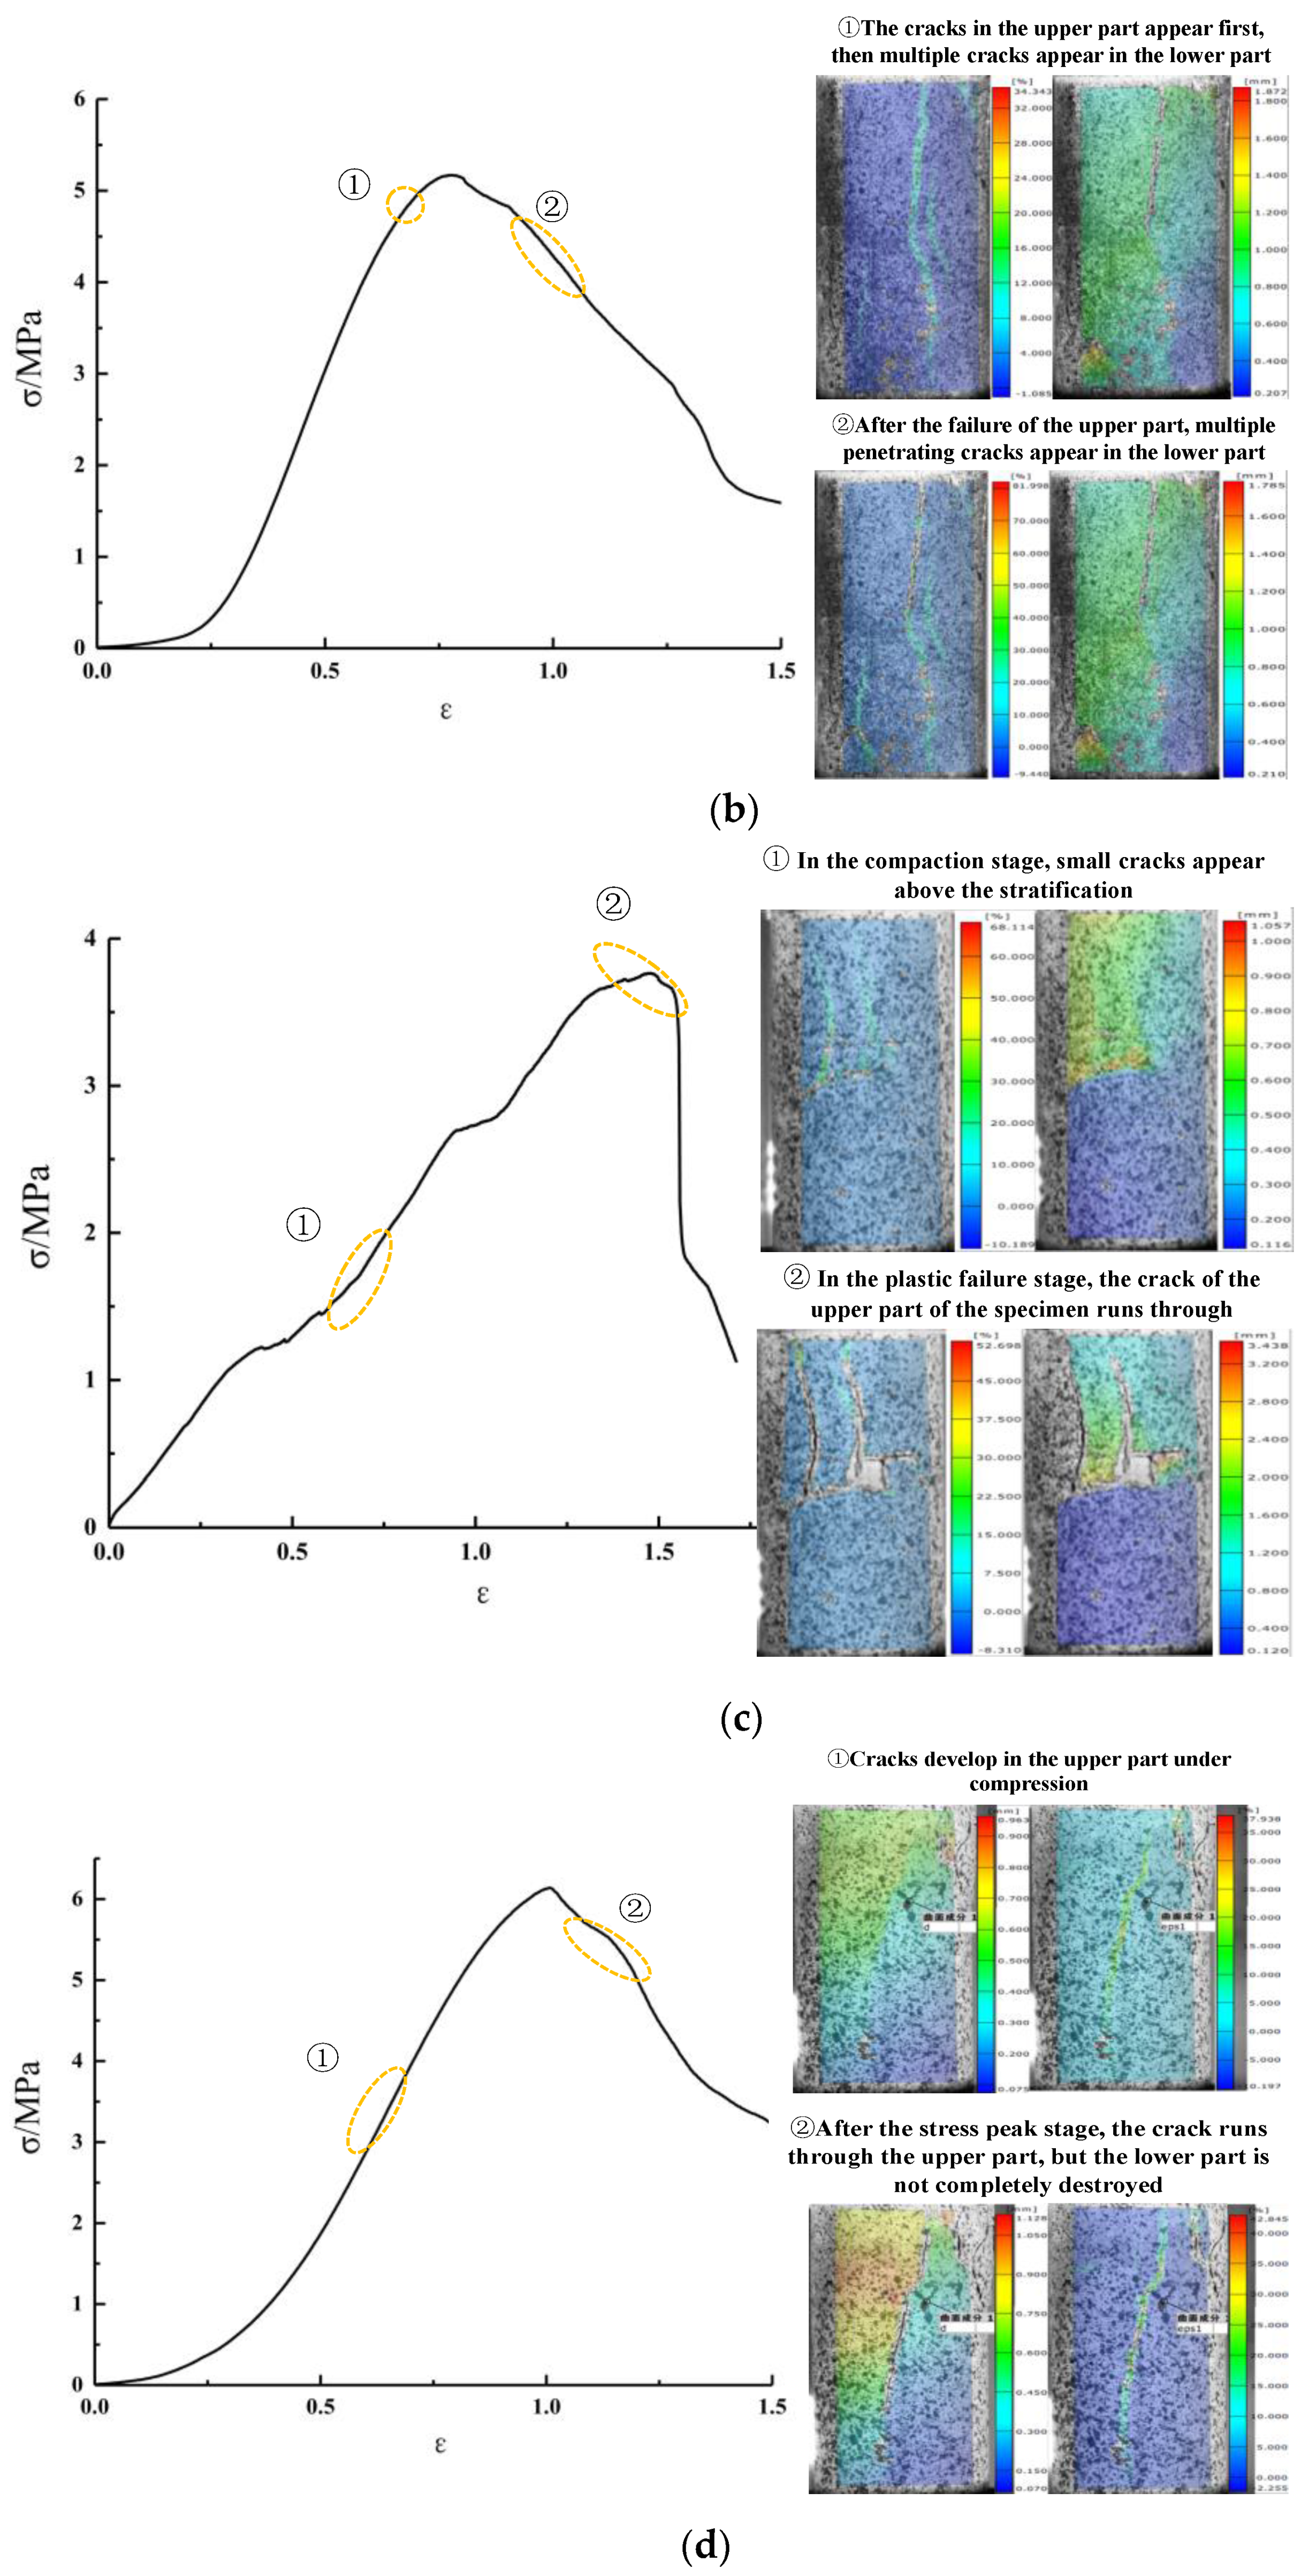
Figure 18 shows the fracture development diagram of the backfill with different layered proportion structures after curing for 28 days.
Figure 18a shows the specimen without delamination, and
Figure 18b,c show 1:1, 1:3 and 3:1, respectively, for the layered filling body.
It can be seen from the figure that the crack width of the 1:3 and 3:1 layered filling body is between 0.8 and 1.2 mm. The geometric deformation is about 4%, and it is also a ductile failure. The fracture width and geometric deformation ratio of the layered backfill (LB) are smaller than those of the non-layered backfill (Non-LB). By comparing the four groups of images, it can be seen that the corresponding fracture development degree of the backfill with different slice proportions is different.
Figure 18a shows that in the elastic stage of uniaxial compression of the Non-LB, small cracks first appear at the upper end of the specimen. With further development of the crack, the crack developed into a penetrating crack at the peak stage due to the lack of the influence of layered structural planes, and the compressive strength of the specimen was 7.1 MPa.
Figure 18b shows 1:1 LB. In the elastic compression stage, the digital speckle detected significant strain changes at the stratification, and the strain was observed to be about 0.3, shown as a green horizontal line area. This is because at the initial stage of compression, two intact specimens below the laminated surface were compacted. Before the peak stage, a small continuous crack was detected in the middle of the specimen, but no large crack was found. In the late period of peak destruction, vertical cracks appeared in the upper part of the specimen, but, after the destruction to the layers, they did not penetrate but were hindered by the layers and dispersed into a number of small vertical cracks. The lower sublayer was not completely destroyed, but, because the upper sublayer was destroyed, the specimen as a whole reached the peak compressive strength of 5.2 MPa.
Figure 18c shows 1:3 LB. By comparing the images of each failure stage, it can be seen that the cracks are all distributed in the upper third part, and the final failure form is the complete plastic failure in the upper part. The lower part is still intact due to its proportion of 3/4, and the compressive strength of the specimen with this proportion is only 3.6 MPa.
Figure 18d shows 3:1 LB. Since the upper part accounts for three-quarters of the specimen, the failure mode of this form is approximate to that of the Non-LB failure mode. It can be seen that a small vertical crack has developed in the elastic stage. After the peak failure, the crack runs through the whole upper part but does not penetrate the lower part. The specimen had a compressive strength of 5.8 MPa, which was the greatest among the stratified specimens.
3.5.3. Influence of Layered Structure on the Failure Mode of ASPLB
The failure mode of the LB is the same as that of the Non-LB, both of which are in the form of vertical splitting. The fracture development of the LB is obviously blocked at the stratified backfill, and, when the fracture develops near the stratified backfill, the fracture development of the stratified backfill is obviously blocked. The maximum compressive strength of the whole specimen has been achieved when cracks develop near the subplanes. As can be seen from the destruction picture of the 1:3 LB, the backfill above the sublevel layer has been crushed, but the backfill below the sublevel layer remains in a relatively complete state. This indicates that the layered filling body is a relatively independent loading module above the sublayer, and the failure cracks of the specimen caused by the loading are mainly concentrated above the sublayer.
3.6. Optimal Case
Based on comprehensive analysis of the microscopic pores, wave velocity, compressive strength and failure modes of the ASPLB, the optimal specimen occurs when the FA content is 15%, curing is 28 d and the LB is a 3:1 layered ratio. The compressive strength of the specimen is 5.8 MPa, which is the greatest among the stratified specimens. The compressive strength of the LB specimens is reduced by 14% compared with that of the Non-LB specimens under the same conditions. Compared with the 1:1 and 1:3 LB specimens, the compressive strength of the 3:1 LB specimen increased by 16.7% and 40%, respectively.
According to the design of the aeolian sand paste-like backfill mining scheme of Shanghe Coal Mine in Yulin City, the uniaxial compressive strength of the backfill in 28 days should reach 5 MPa or above after strip mining of the solid coal working face.
According to this study and material fluidity [
31], Ratios III or IV should be determined when the FA content is between 15% and 22.5%, and the 3:1 LB mode should be adopted.
3.7. Field Survey in Mining Area
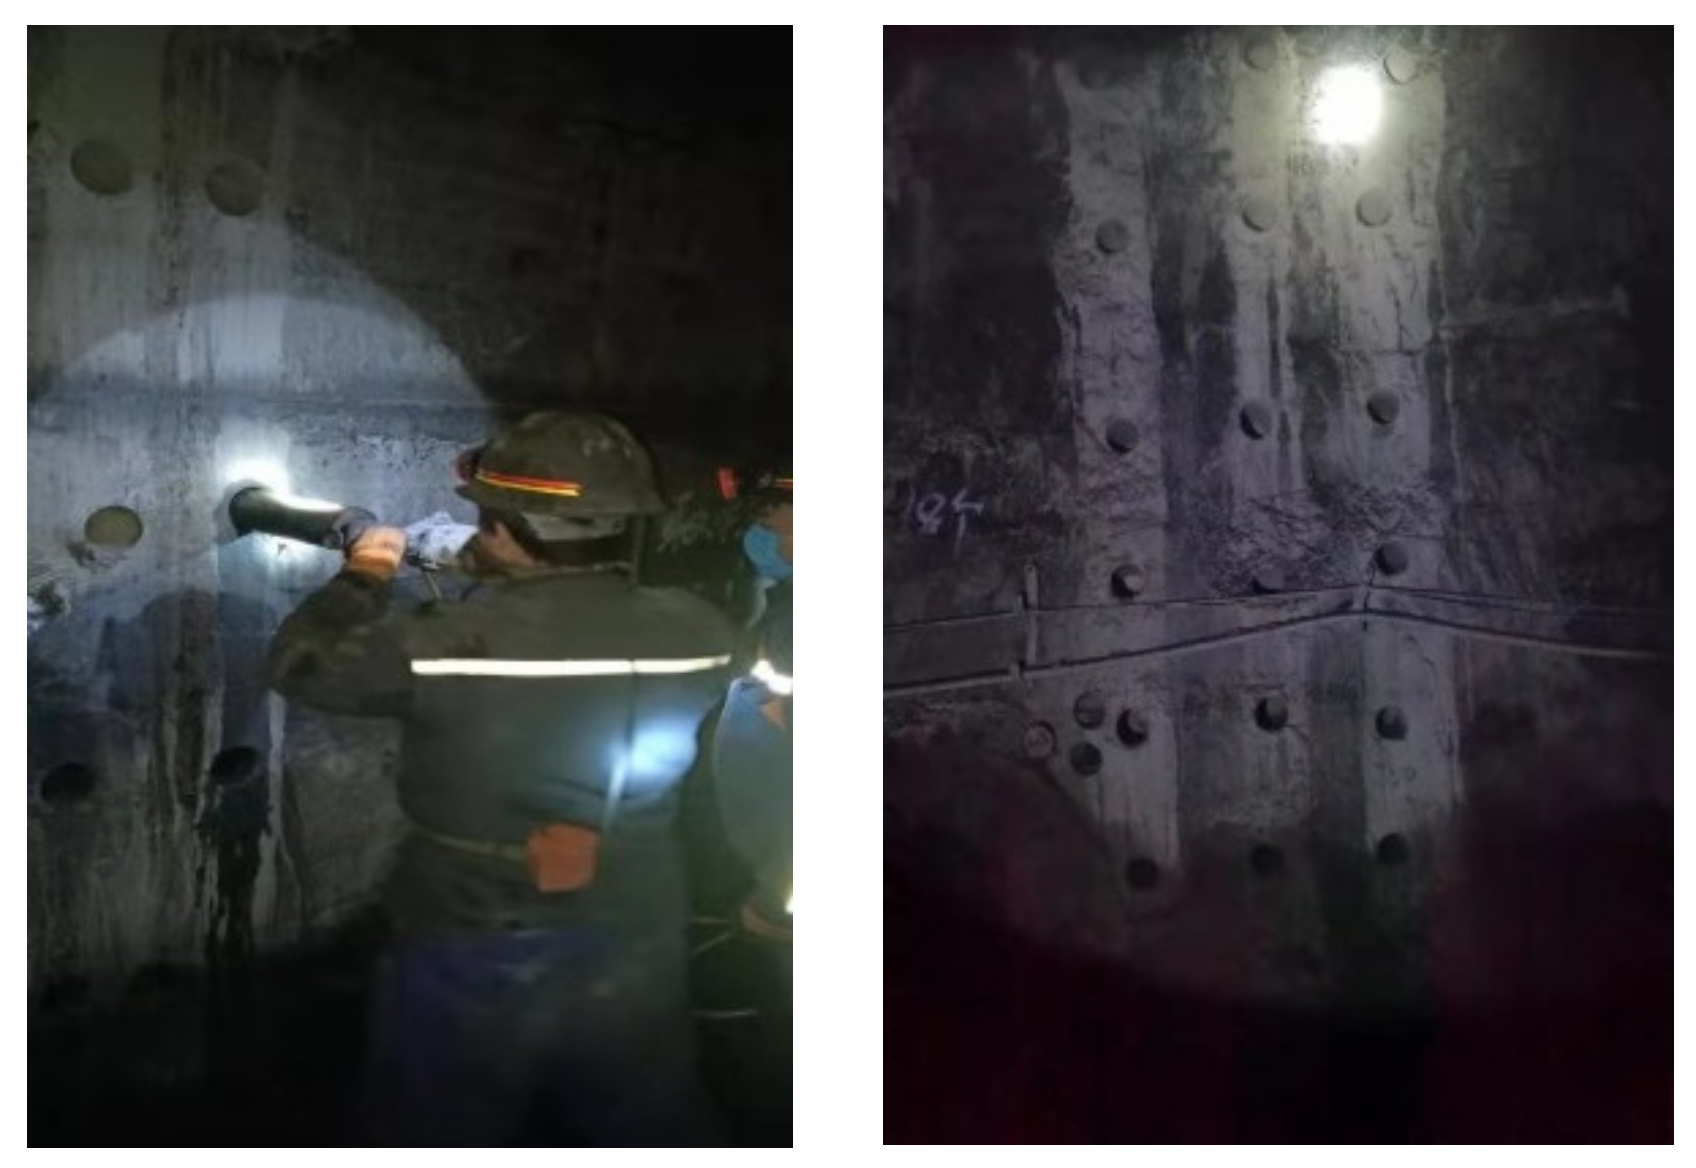
The above filling scheme was adopted to carry out backfill mining in Shanghe Coal Mine experimental face. After the solidification time of the underground backfill body reached 28 d, as shown in
Figure 19 and
Figure 20, the layered sections of the filling body were well connected, no penetrating cracks were found and the surface was smooth. Different parts of the backfill were drilled and made into samples for strength testing. A total of 21 backfill samples were obtained.
After the final measured slicing filling, we used the correction coefficient of the nonstandard rock sample for conversion. The maximum uniaxial compressive strength of the backfill was 8.56 MPa, the minimum uniaxial compressive strength was 6.76 MPa and the average uniaxial compressive strength was 7.56 MPa. The scheme can meet the design requirements.
4. Conclusions
The main conclusions of the study are as follows:
- (1)
The UCS of ASPLB is obviously reduced by the layered structure. The higher the proportion of the ASPLB above the LSP, the higher the strength of the LB. The strength value of the 3:1 LB is 5.8 MPa (Ratio III, 28 d), which is reduced by 14% compared with that of Non-LB specimen. In addition, the strength of 3:1 LB was increased by 16.7% and 40% compared with 1:1 LB and 1:3 LB, respectively.
- (2)
The denser the ASPLB, the greater the wave velocity and the smaller the porosity. Both wave velocity and porosity can be used to predict strength. The porosity and strength of the ASPLB (Non-LB) are an approximately linear inverse correlation. The wave velocity and strength of the ASPLB (1:1 LB) are an approximately nonlinear forward correlation.
- (3)
Compared to Non-LB specimens, the failure of the LB is mainly concentrated above the LSP. After the failure of the ASPLB above the LSP, the fracture was blocked when extending downward. The lower sublayer of 1:1 LB was dispersed into many small vertical fractures, while the cracks in the lower sublayers of the 3:1 and 1:3 LB all stopped developing.
- (4)
The optimal scheme suitable for Shanghe Coal Mine is: cement content is 15.6%; FA content is between 15% and 22.5%; 3:1 LB mode. The average strength of backfill in the field for 28 d was 7.56 MPa. This scheme can meet the requirements for the strength and stability of backfill in the actual situation.
The experimental scheme designed in this paper analyzes the mechanical properties of the ASPLB under three types of stratification (1:1, 1:3, 3:1 LB). However, when we made a specimen, we did not use two different ratios for the upper and lower layers. Although the same ratio has been used for filling in Shanghe Coal Mine for a long time, different ratios can be used in a specimen in future research to better study the strength change rule under the influence of the mixing ratio. At the same time, on the basis of the mixing ratio, for the practice of backfilling operations, it would be useful to establish the layering coefficient of the backfilling mass and predict its overall strength.


