Review

Cobalt and Associated Impurities in Blue (and Green) Glass, Glaze and Enamel: Relationships between Raw Materials, Processing, Composition, Phases and International Trade

by
Philippe Colomban
1,*,
Burcu Kırmızı
2 and
Gulsu Simsek Franci
1,3
1
MONARIS UMR8233, Sorbonne Université, CNRS, 4 Place Jussieu, 75005 Paris, France
2
Department of Conservation and Restoration of Cultural Property, Faculty of Architecture, Yıldız Technical University, Yıldız Yerleşkesi B Blok, Beşiktaş, Istanbul 34349, Turkey
3
Surface Science and Technology Center (KUYTAM), Rumelifeneri Campus, College of Sciences, Koç University, Rumelifeneri Yolu, Sariyer, Istanbul 34450, Turkey
*
Author to whom correspondence should be addressed.
Submission received: 8 March 2021 / Revised: 9 May 2021 / Accepted: 11 June 2021 / Published: 15 June 2021
(This article belongs to the Special Issue Characterization of Archaeological and Historic Vitreous Materials)

Abstract

:
Minerals able to colour in blue (and green in combination with yellow pigments) are limited in number and geologically. After presenting a short history of the use of cobalt as a colouring agent of glass, glaze and enamel in the Western/Mediterranean, Islamic and Asian worlds since Antiquity, we will present the different forms (dissolved ions, natural and synthetic crystalline phases/pigments) of cobalt and associated elements regarding primary (transition metals) and secondary geological deposits (transition metals and/or arsenic, bismuth, silver). Attempts to identify the origin of cobalt have been made by many authors considering the associated elements but without considering the important modifications due to different processing of the raw materials (extraction/purification/formulation). We review the information available in the ancient reports and present literature on the use of cobalt, its extraction and production from the ores, the different geological sources and their relationship with associated elements (transition metals, bismuth, arsenic, and silver) and with technological/aesthetic requirements. (Partial) substitution of cobalt with lapis lazuli is also addressed. The relative application of non-invasive mobile Raman and pXRF analytical instruments, to detect mineral phases and elements associated with/replacing cobalt is addressed, with emphasis on Mamluk, Ottoman, Chinese, Vietnamese and Japanese productions. The efficiency of Ni-Zn-As diagram proposed by Gratuze et al. as a classification tool is confirmed but additionally, CoO-Fe2O3−MnO and CoO-NiO-Cr2O3 diagrams are also found as very efficient tools in this research. The relationship between the compositional data obtained from the artefacts and historical questions on the origin and date of their production are discussed in order to obtain a global historical view. The need of a better knowledge of (ancient) deposits of cobalt ores and the evolution of cobalt ore processing with time and place is obvious.

Graphical Abstract

1. Introduction

Ancient glassy materials, either as glass objects or glassy coatings in the form of glaze and enamel, are basically made up of (alumino-)silicates. Colouring agents able to colour glassy silicates in blue are limited. They are also used to obtain green colours by mixing with a suitable yellow colouring agent. The limited methods available to produce blue colour are based on the following mechanisms: (i) Co2+ ions dissolved in the glassy silicate network, (ii) Co2+ ions located in specific sites of a crystalline phase, a pigment, prepared before and dispersed (and unreacted) in the glassy phase or formed by precipitation on cooling [1,2,3], (iii) Sn ions located in specific sites of a feldspathoid (lazurite, the main phase of lapis lazuli) or of a zeolite (synthetic ultramarine) [4,5], and (iv) V4+ ions distributed in certain sites of zircon (ZrSiO4) and Mn6+ ions in barium manganate (BaMnO4) [1,2,3,6]. The latter compounds have only been used for a few decades, although the other colouring agents have been used since Antiquity [4,5,6,7,8]. To the best of our knowledge, blue chromophores such as copper carbonate minerals (azurite) [9], widely used for paintings, do not display sufficient thermal and chemical stability to be used as colouring agents for glass, glaze and enamel. Egyptian blue (CaCuSi4O10), a more or less crystalline copper-lime silicate, can be considered as the first synthetic pigment in history but it was not being used to colour glass and glaze and its use as a painting pigment ended during the Roman Empire [6]. Many centuries after, Chinese Han potters developed a barium homologue to Egyptian blue [6], as observed in the (cold painted) decoration of the famous terra cotta sculpture army of the Qin Shi Huang mausoleum at Xi’an in the late 3rd-Century BCE [10]. Some other blue minerals (gems) are very rare, such as blue tourmaline coloured by Cu2+ ion ([Ca,Na,K…][Mg,Li,Al,Mn,Fe2+,3+,V,Cr,Ti,Cu…]3 [Al,Mg,Cr…]6 (BO3)3 [Si, Al…]6 O18 (OH,O)3 (OH,F,O)), sapphire (Al2O3) coloured by Fe3+ and Ti4+ ions, grandidierite ((Mg,Fe2+)Al3(BO3)(SiO4)O2) coloured with Fe2+ ion, and topaz (Al2SiO4(F,OH)2) coloured by point defects. Some recently developed blue materials have not been used as industrial colorants until the present (e.g., Ce4+ or Eu3+-Li+ substituted monazite and Nasicon [11,12]). In this review, we will focus on the colouration of glassy silicates with cobalt by addressing the different sources of cobalt, their processing methods and procedures to colour the glass, glaze and enamels, as well as methods to recover information about ancient ‘chaîne opératoire’. We will try to cite the literature from different origins and various languages, in particular ancient studies available in different languages only as printed issues, ignored by some of the recent publications. To the best of our knowledge, previous review papers were focused on specific countries and do not cover all the Ancient World. For a long time, art history has been considered from a European perspective. Efforts are now focused on a more holistic view covering a global approach. We will try this in this review, the initial works having mainly focused on the use of cobalt in the colouration of glasses at the archaeological sites in the Mediterranean area. Our remarks will largely concern the Asian area (namely Turkey, Iran, China, Vietnam and Japan) and its interactions with other places, including with Europe by taking into consideration that only Persian cobalt sources were studied significantly [13,14,15,16,17,18,19]. Likewise, it is important that the data extracted from ancient texts are integrated with those extracted from the analyses of originally diversified objects studied by us since 2014 [20,21,22,23,24,25].
It is not possible to cite all the pertinent literature, but we expect that the present overview will provide the state of the art of present knowledge and trigger questions on the use of cobalt to colour glassy silicates from Europe to Asia.

2. Historical Background and Famous Use of Cobalt as Colouring Agent

The use of cobalt and alternative thermostable pigments has been already reviewed from the mineralogical [4] and historical [6] points of view. Information can also be found in the books devoted to the analysis of archaeological and historical glasses [7,8]. Figure 1 shows examples of a wide range of ceramic, metal and glass artefacts decorated with blue (and green) colouring agents throughout history. Previous reviews are mainly focused on archaeological glass and generally ignore enamelled artefacts produced after the Renaissance. Indeed, the colouration can be either in the glass bulk material or in the glassy coating on a metal, glass or ceramic substrate, namely enamel and glaze. The coloured décor is obtained by the homogeneous or heterogeneous distribution of the colouring agent, taking into account that the resolution of the human eye is equal to a few micrometres.
The use of cobalt in bulk glass material goes back to the oldest Egyptian Dynasties and is well established with the early work of the French chemist Alexandre Brongniart, the former director of the Sèvres Factory (from 1800 to 1847) and the founder of the first museum dedicated to pottery and glass—Musée national de céramique—at the very beginning of the 19th-Century [26,27]. Then, cobalt was identified in various blue coloured artefacts such as glazed pottery, glass objects, stained and lustre glass by many scholars [14,19,28,29,30,31,32,33,34,35,36,37,38]. The evidence of cobalt use in blue Mycenaean (Greece) [39,40] and Mesopotamian Late Bronze Age glasses was also asserted [41,42] and the long-distance trade activity during this period was evidenced [43]. More recently, we can also cite the bricks of the famous Ishtar gate (Mesopotamia, Babylon, ca. 575 BCE) glazed in blue colour and similar blue glazed bricks at Susa in Iran during the 1st millennium BCE [44]. Indeed, it seems that the oldest glass coloured in blue by cobalt dates to the Late Bronze Age Egypt (~16th- to 11th-Century BCE) [30,45] but the number of analysed artefacts remains limited, especially regarding the masterpieces coloured in blue.
In the beginning of the Islamic period, cobalt oxide started to be used as a blue colourant in lustre glass during the Umayyad Caliphate (661–750 CE) and the early times of the Abbasid Caliphate (750–1258 CE) [19]. It is also observed in the blue painted pottery which mainly flourished during the 9th-Century by the Abbasid potters of Bassorah (Figure 1l) in Iraq [46,47,48,49,50,51]. The cobalt-based pigment painted with a brush onto the glaze mixture was then fired to obtain the blue décor incorporated with the white glaze opacified with tin oxide, a process which marks the beginning of the faience.
In the light of the present knowledge, the use of cobalt in China (re-)started with the Tang potters (7th-Century). Chinese wares were traded in the Islamic world, Southeast Asia, and along the east-coast of Africa [48,49,50,51]. The processing of the cobalt pigment painted on the ceramic body (Figure 1j) and then fired under a clear transparent glaze would later lead to the production of famous Chinese blue and blue-and-white porcelains during the Yuan (1271–1368 CE) and Ming periods (1368–1644 CE) and Vietnamese porcelains after the 15th-Century (Figure 1c). Then, Ottomans, Safavids and European potters produced imitations of Asian blue-and-white porcelain (Figure 1d). Underglaze painting in cobalt blue was also performed on the Islamic ceramics produced in Iran and Syria, especially from the 12th-Century onwards. The Ottoman potters then transferred this tradition to a well-established industry of famous under/overglaze polychrome ceramics and tiles in Iznik with original technological features (Figure 1e,k), that were later followed and optimized by European potters (Figure 1f).
Enamelling has been performed to create refined and durable glassy decorations on throughout history not only on ceramics but also on glass and metal. Indeed, the earliest enamel applications were mainly made to assemble pieces of stone and gems. The art of enamelling distinctively combined the processing of materials with different natures, namely metal working (Figure 1a,b and Figure 2f,g), glass making (Figure 1g,h,m and Figure 2e) and ceramic production (Figure 1c–f,l and Figure 2a–d) [52,53,54]. The first objects produced were mainly small items such as jewellery made of gold and silver onto which the enamels were fused for ornamentation [55,56], with the earliest examples coming from Cyprus and Crete as early as the 15th-Century BCE [56,57]. In time, the enamelling applications were further developed to involve the association of many layers of enamel with different composition and numerous firing cycles as well as the production of larger objects. Copper and copper alloys such as bronze and brass also started to be used due to their easier accessibility and good working properties [57,58,59,60]. Several cultures including the Celts and Romans took enamelling on metal to the next level with the development of various enamelling techniques for the creation of sophisticated decorations, such as champlevé and cloisonné. In the former technique, the enamels are fused onto the carved regions of the metal substrate to create valleys in which the molten glass is retained. In the cloisonné technique, the enamels are set inside the cloisons which are pieces of metal foil fixed to the metal substrate to form walls that retain the molten glass according to the desired décor [56,57,58,59,60,61,62,63,64]. The variety of substrates imposes a variety of compositions for the coloured décor. Starting from the 8th-Century, Byzantine craftsmen perfected the cloisonné technique to produce religious objects mainly on gold [56,57,58,59,60]. Enamelling on metal then flourished in Western countries (Spain, France) during the Middle Ages on one side, and reached China (Figure 1a) on the other, most probably in relation to the large-scale trade network via the Silk Roads [57,61,62,63,64]. The Chinese craftsmen adopted the cloisonné technique to widely produce highly prized objects for the adornment of significant buildings by the time of the Ming Dynasty (1368–1644) [61,62,63,64]. Then, the painted enamelling technique culminated during the Qing Dynasty (1644–1912 CE) to produce more sophisticated decorations with the technological transfer initiated by the European missionaries hosted at the Chinese court during the 17th–18th-Centuries (see further) [62,63,64].
It is worth mentioning that various researchers failed to find cobalt in some blue glasses and glazes using elemental analytical methods in Egyptian and then Islamic artefacts [45,65,66,67,68]. As we will discuss afterwards, the very high colouration power of cobalt ions means that the content of cobalt can be very small (<0.1 wt.%). These authors were not able to identify the colouring agent with conventional techniques (XRF, EPMA, SEM-EDS, etc.) until Raman spectroscopists demonstrated the wide use of lapis lazuli as a colouring agent, at least since the Ptolemaic Dynasty (Lagids: ~300 to 30 BCE), either in pottery [4,5,69,70] or glass [4,71,72,73,74]. Furthermore, both cobalt ions and lapis lazuli grains could be used simultaneously as colouring agents [5,73,74,75], suggesting some conclusions should be reconsidered since the dispersion of lapis lazuli grains is difficult to detect by elemental analysis—especially when the mineral is not specifically searched for by scholars. At that time, experts were convinced that elemental analysis was able to identify all colouring agents and thus ignored spectroscopic studies. Indeed, ‘good’ chromophores such as the polysulfides (Sn) ions in lapis lazuli, capable of strong colouring in small quantities give a very intense resonant Raman signature that makes traces easily detected. We can anticipate that the use of lapis lazuli instead of cobalt, or especially with cobalt, was much broader than has been effectively recognized. For instance, it was found as a colourant in most of the enamelled Mamluk glass masterpieces [72,73] and as a whitening agent for the glaze in the first hard-paste porcelains made by J.F. Böttger in Meissen (Saxony, very early 18th-Century) [76].

3. Brief Overview of Cobalt Chemistry and Geology

Elemental cobalt belongs to the transition metals group. This group, located in the centre of the Periodic Table, is characterised by the fact that the d-electron sub-shell is not complete, allowing the absorption of light in the visible range to occur by electronic transitions. Consequently, these elements are the main colouring agents used since Antiquity, namely Fe, Mn, Co, and Cu. Colour formation depends on the speciation (redox equilibrium imposed by the firing atmosphere, directly or through complex redox reactions drive by fast ion diffusion [77] and the effect of the crystal field imposed by the structure hosting the ions.
The similarity of the chemical properties of transition metals leads to their precipitation together, particularly in the deep sea to form polymetallic nodules [78,79,80,81]. Nodules vary in size from microscopic particles to large pellets more than 20 centimetres across. The main phases are Fe-vernadite (Mn4+,Fe3+,Ca,Na)(O,OH)2·nH2O), Mn-feroxyhyte (δ-Fe/ Mn3+O(OH)), asbolane ((O,OH)2·(Co,Ni,Mg,Ca)x(OH)2x·nH₂O), buserite (Na4Mn14O27·21H2O), birnessite ((Na0.3Ca0.1K0.1)(Mn4+,Mn3+)2O4·1.5H2O) and todorokite ((Na,Ca,K,Ba,Sr)1−x(Mn,Mg,Al)6O12·3-4H2O), which are in a simpler way a mixture of oxy-hydroxides of transition metals. Roughly speaking, in terms of tectonic movements of the continental plates, deposits on the ancient deep seabed have then been upset, compressed and heated (metamorphosed) to form new geological layers which can be exploited as quarries or mines. Such features are observed around recent mountains like the Himalayas. The asbolanes (asbolite) are well representative of the phases formed by this process and these ores are found in many places [4,13,14]. These deposits are regarded as primary sources of cobalt. An example of such a mining place is located in Yunnan, close to the Blue River in China (Toung-Tchouan, Mo Pou Tchang) [14,82,83] where asbolane nodules are accumulated.
More complex transformations can occur geologically. In depth, the circulation of hot water under pressure dissolves certain elements, transports them along faults and in the case of decreasing pressure and/or temperature, precipitation-differentiation according to the elements leads to the formation of new phases in veins or geodes. These deposits formed by the hydrothermal process are said to be of a secondary type and generally found in ancient mountain ranges (i.e., Hercynian massifs in Europe). Primary deposits can be transformed incompletely and both types can be observed in the same area. When the hydrothermal process eliminates certain elements, it incorporates new ones. Thus, cobalt is associated with sulphur and arsenic but also with bismuth and silver, and as reported by Kissin, the ores of these elements are called the five-element (Ni-Co-As-Ag-Bi) ore type [84]. Well-established examples are found in North America, Europe but also in Africa and Asia. In Europe, the main sites exploited since the end of the Middle Ages or from the Renaissance primarily not for cobalt but for silver, are located (from the north to the south) in Norway, Russia (Ural mountains), England (Cornwall), Slovakia (Dobsina), Germany (Schwarzwald; Erzgebirge: Johanngeorgenstadt, Annaberg, Schneeberg, Marienberg, Freiberg, Joachimsthal (actually in the Czech Republic, the Erzgebirge forming the border between the two countries), Thuringia and Harz), France (Ste-Marie-aux-Mines, close to the Schwarzwald; Belledonne Massif), Switzerland, Austria, Italy (Sardinia), Spain (Gifthain in the Pyrenees), and Portugal. German mines mainly consist of cobalt minerals such as chloanthite (Ni,Co,Fe)As3, skutterudite (Co,Ni)As3−x but also some Co-Mn asbolanes.
In Morocco, Co-Ni arsenide ores are also present. Cobalt ores in Iran also seem to belong to the secondary type deposits at Talmessi and Meskani sites, close to the Anârak district, 200 km east of Kâshân, a famous city of potters during the medieval period. These mines incorporate Co-Bi-Ni arsenides and arsenates [13] such as red erythrite (also known as cobalt bloom) (Co3(AsO4)2.8H2O). The cobalt mine of Qamsar (~35 km southwest of Kâshân) is the most cited source of ore processed for the production of cobalt blue pigment used from the ancient times until the early 20th-Century, e.g., in Abü’l-Qâsim’s famous book on ceramic making [13,14,15] and consists of asbolane (primary deposit) and erythrite, a hydrated cobalt arsenate (secondary deposit?) [13,14,15,16,17,85] Persian cobalt ores were processed either physically (by gravity separation process) or by visual phase separation [16]. In Azerbaijan, 150 km south of Tabriz, which is another famous place for pottery production, Bi-Ni-Zn-Co ores are present mainly in the form of smaltite-skutterudite ((Co,Ni)As3−x), cobaltite (CoAsS) and linnaeite (Co3S4). Cobalt ores in the form of siegenite ((Co,Ni)3S4) have also been identified in Caucasia, such as in Telavi, located about 50 km north of Tbilisi [14].
Cobalt sources in Asia are less well documented (at least in western language sources). It was reported that blue glass beads had been made in Central Asia using cobaltite from Rajasthan in India [86]. Other sources are in Indonesia, China, and Japan which will be considered further.
Alteration of secondary deposits are also expected to modify the distribution of elements and add K, Sr, Pb and rare earth elements (REEs) as well as more rarely Hg and Au to the composition [84]. An example of such tertiary deposits refers to cobaltiferous alums (evaporites) which can be extracted from salt lakes such as in Egypt, in the form of wupatkiite (Co,Mg,Ni)Al2(SO4)4.22H2O)) etc. [30,34]. Obviously, a more accurate knowledge of the location of ancient mining places (especially in Asia) and the duration of their activities, as well as of their mineralogical characteristics are needed to document the circulation of these ores in the past.

4. Historical Information on the Use and Trade of Cobalt

Many authors have searched for ancient mentions of the use and sources of cobalt to trace its origins as Asian, European, or Persian [13,14,15,16,17,18,19]. An extensive summary was given by Porter in 2000 [14]. Regarding the oldest use in Egypt, the first topic that receive academic attention, Kaczmarczyk [30] identified two different sources of cobalt from the elemental composition (elements associated with cobalt) of blue glasses. One of them had been used from ca. 15th-Century BCE to 4th-Century BCE, coming from the cobalt-alums in Dakhla oasis while the other source from the 5th-Century BCE to the end of the Ptolemaic period (1st-Century BCE) was expected to come from Iran [30]. The later source of cobalt was also used in Mesopotamia. It is important to note that as early as the Ptolemaic and Roman periods, lapis lazuli was also used as a colouring agent of the glaze and enamels on glass [69,70,71,72,73,74,75,87,88], a fact still today ignored by most scholars. Taking into account that cobalt appears to have been used to colour glass continuously since the late Egyptian/Mesopotamian Antiquity [89,90,91,92,93,94,95,96,97], we should ask why the coloration of glazes with cobalt almost disappeared after the Ptolemaic period up to the Tang Dynasty (8th-Century) in China (at the kilns of Baihe and Huangye, close to Gongyi, in Gongxian, Henan province [98,99,100,101,102,103,104]) and the Umayyad Caliphate (661–750 CE) in Mesopotamia [19]. One reason can be found in the continuous recycling of blue glass proved by many shipwrecks in the Roman [105,106] and to some extent during the medieval period [14,106]. The much lower amount of cobalt required to colour bulk glass (Figure 1h,m) than to colour thin glaze/enamel (see further) makes that blue glass can be prepared by adding recycled blue glass fragments. The much higher concentration of cobalt required to colour thin glaze/enamels meaningfully explains the absence of their production. However, the other potential reason may be that the Egyptian blue (CaCuSi4O10) was invented in ancient Greece and Roman Empire and therefore cobalt was only occasionally used as a pigment in a glass-bound form. Moreover, at this period, Han blue (BaCuSi4O10) was also used as a blue colouring agent in China before the reintroduction of the use of cobalt in glass, ceramics and enamels. In earlier times, Greek and Roman authors such as Theophrastus [107] and Pliny [108] mentioned synthetic kyanos as a colouring agent which is interpreted as a cobalt pigment [4,6,14]. Many centuries later, the methodology of colouring and enamelling of glass and ceramics was written again in the treatises of al-Biruni, al-Hassan, and Teflisi [18]. They used the word lâjvard-e kashi as the matter used to colour enamel (mina/minai) in blue, but only the word lâjvard (Persian) or lâzaward (Arabic) was used for lapis lazuli [13,14,18,19]. However, Abü’l-Qâsim refers to lapis lazuli as sang-i lâjvard in his Persian written treatise [17]. Thus, Arabic and Persian historical records provide more information on the subject [109,110,111,112,113,114,115]. In the Jowhar-nâme-ye Nezâmi (Book on Mineralogy), dated to 1196, the manufacture of porcelain and of glaze/enamel are described [13,14], i.e., six centuries before the technical report of Father d’Entrecolles on Chinese porcelain [116]. The book describes that the blue colour was made by using sang-e soleymâni or âbgine-ye soleymâni (after the Jewish king Solomon, 10th-Century BCE; but note that in Islamic tradition the Solomon kingdom was extended to present day Iran), translated as the ‘stone of Solomon’ and the ‘glass of Solomon’, respectively [14], consistent with the old recipes. Similar mentions are in the famous treatise on ceramics by Abü’l-Qâsim written in two manuscripts, dated 1301 and 1583, respectively. In the latter book translated by Allan [17] and Porter [14], the source of lâjvard is found in the village of Qamsar, in the mountains, 19 miles to the south of Kâshân and the people there claim that it was discovered by the prophet Sulaimân (king Solomon). Another book, Javâher-name, from the Timurid period (14th–15th-Centuries) confirms the use of Kashân ores: ‘When you grind this black stone and decorate cups, dishes and cups with them, when you put them in the oven, the fusion of this mineral gives a beautiful blue’ [14]. Information can be found in some other ancient texts [18,19]. The situation already seems to be complex at that time since Abü’l-Qâsim wrote that Iranian potters had used both Iranian and European lâjvard while Jâbir ibn Hayyân mentioned in his Arabic treatise, Kitâb Al-Durra Al-Maknuna (The Book of the Hidden Pearl) dated to the 8th-Century that the Persian cobalt ore was exported to China and Europe [19,117,118,119,120] and contrarily from Europe to Persia [17]. The evidence for the import of a European cobalt source was revealed from the treatise of Abü’l-Qâsim in which he mentioned that It is like white silver shining in a sheath of black stone. From it comes lâjvard colour. Another type comes from Farangistân (i.e., Europe) and is ash-coloured and soft. And there is a red kind found in the mine which is a deposit on the outside of the stones and is like the red shells of pistachios. This kind is very strong but is a fatal deadly poison’ [17]. Correspondence with a mineral made of arsenic is obvious and the red variety can be linked to erythrite. Despite the historical importance of ‘Iranian’ cobalt sources, knowledge of the deposits, at least in widely accessible documents, remains limited and a synthesis of documents, identified by certain authors who are expert in the studies of cobalt-containing glassy silicates in the Near East, remains to be done to update the review of Porter [14]. Indeed, during the 13th–14th Centuries, the Pax Mongolica under the Mongol Rule from the Black Sea to the China Sea secured the long-distance trade along the Silk Road network and the trade of Iranian cobalt ores. The attraction for the colour blue—the colour of the steppe sky—was important for the Mongols [75]. The question regarding the interest of Persian potters in the import of European cobalt will be further discussed later. A blue pigment imported from the Levant to Europe during the Middle Ages, i.e., before the production of smalt also known as zaffre was called ‘Damascus blue’ imported from Syria through Venice [119], could be the stone of Solomon mentioned above.
Chinese historical records also mention the importation of different cobalt ores, from Persia and other places in the Islamic world. The different words used speak of the use of different sources, such as su-ni-po (蘇尼坡) [14,120] or su-ma-li (蘇麻里) [121] that seem to come from soleymâni (the king Solomon), the name used in Persian reports, being consistent with an import from Iran [14]. This word is also related to ‘Samarra blue’ by some authors. Samarra is a Mesopotamian city where Abbasid lustre pottery was produced onwards from the 9th-Century. Some other scholars said that su-ni-po and su-po-ni ch’ing (or suponi qing according to the convention used for writing in Latin characters) come from the Chinese transliteration of the Arabic word, samawi which means “sky-colored” or “azur” [122]. During the Zhengde era (1506–1521), a new pigment imported, called hui (回) blue, started to be used [123]. It is a type of cobalt ore probably rich in arsenic [124,125]. An ancient source (1520) cites the blue “hui-hui” (回回) among the tributes paid from Sumatra [125,126], which seems to indicate that this pigment had been imported from or via Indonesia, with a reference to the Muslim sultanates. It could coincide with the “hui-ch’ing” term (回青translated as Mohammedan blue) and “hui-hui-ch’ing” (回回青, Islamic blue) according to Medley [127] and Yu and Miao [128]. This new pigment seems to have been used pure or mixed with the local pigment, in particular shi (石) blue, according to the needs of the variability of hues in the décor. Indeed, Chinese texts from the 16th-Century inform us that the mixture of the two types of cobalt, likely in the form of asbolite and arsenate (rich in arsenic), allowed a better definition of the décor. Yunnan cobalt which mainly included asbolite was called “shih-ch’ing” (石青, blue stone) [14].
Several hypotheses have been proposed for the precise date of the transition between imported and ‘local’ cobalt use in China. Underwater excavations and studies of many Chinese and Vietnamese shipwrecks dating from the 9th- to the 18th-Centuries [122,129,130,131,132,133,134,135,136,137] have provided more evidence for the dating of the blue-and-white porcelain exported and its variation according to time. The Cu Lào Cham shipwreck cargo, excavated close to Hoi An harbour (Vietnam) offers a nice scope of the 15th-Century production of Hong River blue-and-white ceramics, as confirmed by elemental and spectroscopic analyses [134,137].
The sea trade of Islamic blue (the so-called Mohammedan blue) seems to have started at Longquan in south China during the Northern Song Dynasty (960–1127 CE) [138] when blue-and-white porcelain developed outside China as a consequence of the impact of the migration of Chinese potters to other Asian countries during the civil war. At this period, the Muslim merchants were trading cobalt pigments from the Islamic heartland to Jingdezhen [122]. The pottery decorated with this cobalt during the last generation of Yuan productions were being sold both in the domestic and international markets. At the beginning of the Ming period, between the Hongwu (1368–1398) and Yongle eras (1402–1424), imported cobalt still seems to have been used, as specified in particular by sources from the middle of the Ming dynasty citing sumali blue [121]. According to some studies, this transition would have taken place during the Xuande era (1425–1435), i.e., not immediately after the first ban of exchanges with abroad imposed by the Ming Emperor [137,139]. This date corresponds also to the decline of the Mongol Kingdoms and certainly to the long-distance exchanges along the terrestrial Silk Roads. Indeed, some Xuande porcelains appear to contain imported ores or a mixture of imported and local ores [125]. Furthermore, some differences are present between imperial (‘official’) and private factories. Private kilns seem to have started using local cobalt earlier, likely because it was less expensive than the imported ingredients, as early as the Hongwu era, while the imperial kilns were able to exercise a monopoly on imported cobalt at least until the Xuande era [125]. As mentioned before, Chinese texts from the 16th-Century tell us that when the mixture of the two types of cobalt is used, the décor would be better achieved [125]. During the Zhengde era (1506–1521), a new imported pigment, hui blue, was widely used [123], a cobalt ore probably richer in arsenic [124]. This second change again reflects a transition from the strong Ming Dynasty (1368–~1500) to the weak Ming Dynasty (~1500–1644) [125] with different degrees of control over the trade.
A new change in the use of imported cobalt is recognized at the end of the Kangxi reign (1661–1722) during the Qing Dynasty (1644–1912) in the beginning of the 18th-Century. Both Chinese and European ancient documents and recent analytical studies of painted enamels on porcelain and on metal manufactured at the Forbidden City workshop during the end of Kangxi and the Yongzheng reigns under the guidance of Jesuit missionaries demonstrated the use of imported ingredients and recipes from Europe, in particular blue and green enamel powders and ingredients to be able to obtain enamelled decors depicting complex ‘painting’, similar to those made on wood or canvas using the oil painting technique [140,141,142,143] (see Figure 2c,g).
Similar evidence has recently been put forward for the production of Japanese Imari porcelain under the guidance of Portuguese and Italian Jesuits many decades before, with the analytical study of a rare mukozuke dish bearing the Japanese mark ‘Kan’ei Nen Sei’ (made in the Kan’ei period, 1624–1644) [144,145,146]. The use of European ingredients for the production of enamelled porcelain continued in Japan after the expulsion of the European missionaries, most likely occurring through the trade with Dutch merchants (see further) who retained the authorization to trade in some harbours.
During the 19th–20th-Centuries, Chinese sources mentioned the use of different Chinese cobalt pigments from the Zhejiang province (prefectures of Shaoxing and Jinhua), Yunnan, Jiangxi (prefectures of Yunzhou and Fengcheng), Guangdong and Guangxi [147]. The types from Zhejiang and Yunnan were considered to have a better quality, while that of Jiangxi is considered superior to those of Guangdong and Guangxi [148]. From the start of the last century, it seems that the best blue was obtained by chu-ming blue or chu-ming-liao which came from Yunnan.

5. Processing of the Cobalt Ores

Traditionally, the miners selected the vein to quarry the rock fragments richest in the desired mineral(s). Common physical and chemical methods of ore processing include washing, crushing/grinding, grilling/roasting and/or treatment with acids as reported by the 18th-Century book of Valmont de Bomare [149]. The goal is to obtain a product which can be profitably sold and has the greatest demand, a factor that can vary with time, but determines the processing methods. Thus, it is established that in the Middle Ages, the European mines of the Erzgebirge (word-for-word: Ore Mountains) were exploited [84] for silver production by smelting and the material rich in cobalt was then a by-product as described by Georg Bauer, alias Agricola, in his famous book published in 1556 [150]. Indeed, cobalt remains in the slag melt (silicates) during the metallurgical process [150,151,152]. This has been related to the elimination of (most of the) arsenic in European cobalt used before ~1600–1650, as the evidence comes from glass objects coloured in blue which are free of residual arsenic [153,154,155,156]. The roasting process has been recently replicated on cobalt arsenide ore by Molera et al. [157]. In particular, the effect of the flux (fluorite or calcite) added to (re-)melt the slag on the formation of crystalline phases in glass coloured by cobalt (e.g., F-apatite equivalent to hedyphane, when CaF2 flux is used) has been demonstrated.
Bismuth was identified in Erzgebirge mines during the 15th-Century, probably before 1450 [150,157]. It was being mined, refined and then used for several purposes including incorporation into the lead alloys used to cast printing types in great development with the Gutenberg printing innovation (middle of the 15th-Century). It naturally occurs in association with cobalt [84]. Bismuth was extracted by roasting the ores [157] (it melts at 270 °C [158]). The cobalt metal was separated as part of the silicate slag due to a much higher point of fusion (Co: 1495 °C; CoO: 1933 °C), and not easily reduced. Therefore, it was first discarded as waste without significant value. As a proof, the word “kobold”(from which the word cobalt originates), known to be the name of a mountain and mine devil, was possibly associated with this ore because of the very toxic fumes rich in arsenic caused by the roasting process. The presence of cobalt in silicate residues could be at the origin of the mixing with potassium-rich flux to liquefy and purify the slag; this forms a blue glass, called “smalt” (also known as starch blue/zaffre or in French, saffre). The term “smalt” derives from the proto-German word smaltian which means to smelt. The cobalt-rich matter is mixed with variable quantities of quartz, sand or flint and potash and then melted again to obtain different grades of smalt (see further) which is a potash glass coloured in blue. As reported by Father d’Entrecolles in 1722 [116], the roasting was carried out at Jingdezhen by Chinese craftsmen in the oven for twenty-four hours, followed by grinding in an unglazed porcelain mortar using an unglazed porcelain pestle which was performed over a period of several weeks until it was reduced to a dust-like powder [116,122]. The resulting powdered smalt undergoes processes of sifting, washing and is then classified in different grades [149].
The technology changed during the middle of the 16th–17th-Centuries with the increasing demand of cobalt for large scale production of decorated pottery to copy Chinese porcelains (mainly Delft pottery) and for the whitening of linen fabrics and paper [159,160]. It was also widely used as an oil painting pigment by artists to replace lapis lazuli and azurite. This directly had an impact on the ore processing and modified the number of residual elements associated with the cobalt. When heated in a reducing atmosphere, the more fusible components such as bismuth melt and are almost wholly extracted. In addition, the arsenic will be partially fumed out. Stable transition metals (Ni, Cr etc.) had remained difficult to separate until the development of metallic chemistry in the second part of the 19th-Century, although iron, copper and manganese could be eliminated by acid treatment [149]. Considering the literature and in comparison with other arsenides which decompose above 500–600 °C, arsenates decompose at a higher temperature and complete elimination is achieved above ~900–1000 °C [157,161]. Arsenic is very volatile and condenses in cool areas of the kiln and chimney [161] making the production very hazardous. However, arsenic oxides and sulphides are in a high demand as by-products (pigments, poisons, drugs). It is suggested that oxophilic elements such as iron and manganese enter the silicate glaze network, while sulphophilic elements such as copper and nickel preferentially enter the matte phase and hence are more eliminated.
The higher demand of cobalt eventually led to the mining of specific cobalt ores different from those of silver and bismuth. White, grey, blue, red or black pieces of cobalt ores (that correspond to different minerals) are visually selected, ground to powder, sifted, washed, grilled and then classified [52,149]. Therefore, distinguishing the effects due to the use of ores with different associated elements (variable with deposit type) or with different processing methods which modify the amounts of these elements as well as due to the mixing of different ores is difficult, if not impossible, except if incompletely reacted (microscopic) residues are preserved in the studied material. The latter is a common feature in pottery processing (but leads to discarding the product, forming accumulations near the kiln) which can be analyzed at the (sub)microscopic scale. Only the distinction between primary, secondary and tertiary deposits (geological sites) appears to be reliable with the present state of knowledge.

6. Physical and Chemical Requirements for the Colouration of Glass and Glazes/Enamels

A comprehension of the entire process (chaîne opératoire) is required to extract valuable information from analytical and spectroscopic studies. Apart from the enamelling on metal, the colouration may be executed on a glass which is an amorphous phase (silicate type in the cases mentioned in this review) shaped in the viscous state at high temperatures typically between 900 and 1000 °C, or on a glaze, a glassy coating covering a ceramic body. A glaze precursor is first deposited on a porous substrate (fired or not fired) and the glaze is obtained after it has been heated up to reach the molten state. The thickness of the glaze varies from a few tens to a few hundreds of microns. The glaze should perfectly cover the object in the desired place and to the required thickness, whatever its shape, and should have a nice gloss after cooling. The glaze can be fired at the same time—and temperature—with the body or after the body has been previously fired up to a solid but porous state (biscuit-firing). The firing process modifies the degree of reaction between the coating and the substrate and the type of crystalline phases that form in the glassy phase. An overglaze or enamel is deposited on a non-porous substrate and its thickness is usually less than 50 µm, in contrast with the thickness of an object made of glass being a few mm or more. In the cloisonné and champlevé enamelling techniques, thin metal foils and ridges, respectively, as barriers isolate the coloured areas of enamel from each other (Figure 1a and Figure 2f). Alternatively, a black line made with a very refractory phase that does not diffuse in the molten enamel (Figure 2c), or simply an incision, is used to isolate the blue colour which tends to mix easily with the other colours due to the high diffusivity of cobalt. The last deposited (and fired) blue enamel often appears in relief (Figure 2d,e). This requires the use of different cobalt compounds for the different enamels/overglaze decorations. For instance, at least three different types of enamels with different flux levels have been used for Mamluk enamelled glass masterpieces [72]. Blue was obtained using lapis lazuli and a glassy matrix not very different from the artefact body, but green was obtained with the dispersion of Naples yellow pyrochlore pigment in a lead-containing glass coloured by cobalt ions. Red was obtained with the use of hematite (Fe2O3) and white with cassiterite (SnO2) [72]. The composition of the enamel should be adapted to each colour (the colour depends on the site occupied by the colouring element) and the thermal expansion of the substrate [1,53,54]. The thermal expansion of the upper coating should be (a little) higher than that of the substrate so that it is compressed after cooling to prevent cracking [1,53]: this determines the composition to be used. Furthermore, enamelled objects, especially those decorated with a complex enamelled décor are rare artefacts, making the data on their composition also rare and their reliability not perfect, depending on the techniques used for the measurement.
There are important differences in the colouring process used for glass and glaze/enamels. Drawing a décor in blue on a colourless glass substrate or a ceramic body, requires an ink (water-or oil-based) concentrated in cobalt. The viscosity of the ink should be controlled to depict complex décors as shown in Figure 1 and Figure 2. Most of the Chinese blue-and-white porcelains are decorated with a blue drawing made on the body before deposition of the glaze powder (underglaze décor, Figure 1j) although Vietnamese porcelains are generally decorated on the artefact already coated by the glaze precursor (overglaze drawing). The stability and quality of the décor needs to be preserved during the firing (and softening) of the glaze. Overglaze decoration of porcelain as well as on glass objects requires a different decoration method due to the lack of porosity of the substrate. This time, the ink composed of oil and glues should have a high viscosity and thixotropy to maintain the décor safe before and during firing. The ink should be concentrated in the colouring elements already mixed with the materials forming the glassy silicate enamels. Different degrees of colour can be achieved by repeating the drawing and using different mixtures, etc. This is one reason for the use of different cobalt ores, simultaneously.
Moreover, the firing temperature and atmosphere should be compatible for the preservation of the substrate and the décor and should be controlled differently along the firing cycle(s). There are physical parameters such as thickness, the pathway of the light and the presence of a more or less opaque substrate (ceramic, metal or even glass). The colour of an object made of glass is observed by global illumination, particularly by the light passing through it. On the contrary, the light illuminating a coating on an opaque substrate should penetrate the coating and the colour that is then perceived by our eyes arises from the light component which is not absorbed by the upper layer(s). For these reasons, the amount of colouring agent to be incorporated in a coating must be much larger than that dispersed in a glass object to overcome the colour of the substrate and to look ‘nice’. But, if the concentration of colouring agent(s) is too high, the colour darkens and loses its gloss and a white opacifier is then usually added.
Cobalt ions constitute an incredibly good colouring agent and 0.05 wt.% of cobalt is indeed sufficient to colour bulk glass in blue. In comparison, for obtaining a nice turquoise colour, 0.25 wt.% of copper is required to colour a bulk glass while 1 to 5 wt.% is added to colour a glaze [1,53,77]. Only 0.5 to 1 wt.% of cobalt is needed for a darker blue hue. The coloration power of manganese ions is rather like that of copper. Manganese does not contribute to the colour if the firing atmosphere is strictly reducing. If the firing is oxidative, the colour becomes purple to black and after mixing with cobalt blue, a dark blue-green colour is obtained. Iron ions are less efficient; a ceramic body and glaze remain white with ~1 wt.% of iron oxide if the firing is under reducing atmosphere. However, 3 wt.% of Fe2O3 can colour a glaze brown and ~5–8 wt.% is required to colour a glaze black [1]. The nickel content also contributes to darken the blue in a quite undesirable way. Arsenic precipitation as a white phase lightens and improves the blue colour. Thus, the ‘impure’ cobalt can be an advantage or a drawback as a function of the potter’s knowhow and objective.
The firing atmosphere, resulting in redox equilibria at the surface and diffusion of reduced/oxidized fast moving ions (Fe, Mn, Sn etc.) in the molten ‘bulk’ glass/glaze/ enamel, determines the speciation of multivalent colouring ions [77]. Only H2 produced by burning wet wood/coal can diffuse in bulk glass and thereby directly impose a sufficient degree of reduction. The presence and amount of flux such as alkalis and lead are also important for achieving the resulting colour.
The main methods used for the measurement of elemental composition in glass, glaze and enamel are, in historical order of their use, chemical analysis after dissolving the material in hot strong acids (HF-H2SO4/HCl/HNO3 mixture) and measuring the weight of specific precipitates in combination with instrumental analysis techniques such as atomic absorption spectroscopy (AAS) or inductively coupled plasma – optical emission spectrometry (ICP-OES). These methods require very large samples [6]. Neutron activation analysis (NAA) does not require sampling [7]. X-ray fluorescence (XRF) [7,25], scanning electron microscopy coupled with energy dispersive spectroscopy (SEM-EDS) [7], ion beam excited spectroscopy (IBS: PIXE, PIGE, etc.) [7], laser ablation – inductively coupled plasma-mass spectrometry (LA-ICP-MS) [7,160] and laser-induced breakdown spectroscopy (LIBS) require small to microscale sampling [7,156]. Each analytical technique has its advantages and drawbacks, such as the analysis can be non-invasive or (micro/macro) destructive requiring some sample preparation. Other drawbacks include the delay in recovery of the sample due to the radioactivity created in NAA, the induction of some thermal shock that can generate cracks in LA-ICP-MS and LIBS, an inability to analyse the same volume for each element measured and to measure light elements such as sodium etc. in portable XRF [25].
Figure 3 shows representative CoO amounts measured by Zhang [162] for blue coloured lead-based Tang glaze, blue and blue-and-white Song to Ming Dynasty porcelain glazes and blue Qing overglaze. The measured content varies between 0.1 wt.% and 1 wt.% CoO due to the different techniques of underglaze (sky blue, sacrificial blue) and overglaze décors, all with various thicknesses and various dispersion degrees of cobalt, and the glaze type (lead- or (earth)alkali-based). Figure 3 shows clearly that the amount of cobalt always remains less than ~1 wt.%, due to its high colouration power. Higher content of cobalt darkens the shade too much to make it look black and the glaze loses its gloss and precipitation of cobalt silicate or aluminate takes place. Small amounts of reduced Mn, Fe and Cu ions do not really contribute to the colour (this requires a firing under reducing atmosphere) and hence do not alter the blue hue obtained by cobalt ions. It is worth mentioning that the rather constant value measured for lead-based glazes is due to the fact that this type of glaze was used to obtain homogeneous blue areas and has a low viscosity which facilitates the homogenization.
Therefore, the amount of minor and trace elements associated with cobalt will also be low and difficult to detect, especially if the volume probed is also mixed with some part of the body or of the colourless glaze. For instance, as a function of the element considered, the depth probed by XRF varies from a few micrometres (light elements) to many millimetres (heavy elements) [25] and depends on the heterogeneity of the décor as well. Micro analysis at the (sub)micron scale with either X-ray (synchrotron or rotating anode sources), ion (accelerators) or light (Raman spectrometers) microbeams is thus needed, but only the latter technique can be performed on-site with mobile set-ups [61,62,72,73,140,141,142,143]. The elemental mean composition of bulk (homogeneous) glass fragments is obtained by using (micro)destructive techniques such as in the case of archaeological samples. However, it is much more complicated to obtain data for glaze/enamels, especially for those made of layers superimposed (e.g., Figure 1k and Figure 2d) or using the microdot technique on outstanding representative artefacts (Figure 2g). For rare masterpieces, only non-invasive (mobile) techniques such as pXRF and Raman microspectroscopy can be performed on-site [25,52,140,141,142,143].

7. Elements Associated with Cobalt, Their Ratios and Categorisation of the Composition: Tentative Classifications as a Function of Time and Place of Use

In this section, we will consider preferentially Ottoman and Asian productions and compare these with European/Mediterranean productions previously considered by Gratuze et al. [89,90,97]. As a summary of his work on European cobalt ores, the cobalt which contains As, Ni, Bi, W, Mo, U and Fe has been sourced from Erzgebirge (Germany) at least from the early Middle Ages. Knowledge about the composition of cobalt ores in the other centres is less documented. In China (and the north of present Vietnam), the earliest large evidence of cobalt use dates to the Warring States period (475–221 BCE), as a blue pigment on glass eye beads [163]. Southeast Asia (linked also with China and to some extent Japan) was an integral part of the world trading system linking societies from the Mediterranean basin to Han China [164,165]. Local production has been dated up to ~400 BCE, as for China. Glass production in the Indus area dates to the middle of the 5th- millennium BCE and production of blue glass at Bara (close to Peshawar, Pakistan) is well documented since ~200 BCE [166]. In the Tang Dynasty (618–907 CE), Co-blue was used in lead-based glazes (sancai in Chinese and tam tai in Vietnamese) as an underglaze, draw-on-glaze or overglaze decoration (blue-and-white/qinghua) [137,162,163,167]. The large use of cobalt in the making of high-fired glazes (sacrificial blue) began during the 14th-Century. Then cobalt was used in voluntary combination with manganese to obtain a purple colour [162]. Analyses of many Chinese and Vietnamese porcelains with blue-and-white décor (qinghua, sancai/tam tai, wucai) show that various cobalt pigment types were used with very different amounts of manganese, from low values up to a Mn/Co ratio of more than 4 or even 8 as a function of the period considered [21,99,128,137,147,162,167,168,169,170,171,172,173,174,175,176,177,178,179,180,181,182,183,184].
In several studies, nickel and zinc have been detected as impurities along with cobalt [147], as well as significant amounts of arsenic [52,89,90,140,141,142,153,155,156,157,184,185,186,187]. Analyses of Ottoman Iznik and parent productions show that cobalt was also associated with significant amounts of manganese, iron, copper, zinc, nickel, but also bismuth, silver and chromium in trace amounts (ppm) [22,23,186,187].
Gratuze et al. were the first to collect systematically a large amount of compositional data from blue glass fragments [89] coming from the Mediterranean world and then to compare these data with blue glazes [90], mainly produced before ~1600 (Table 1). This work is still in progress [97,160,166,188]. The first series of compositional analysis of glass fragments was performed by NAA (as in ref [147]) and the second series was carried out on glazes by LA-ICP-MS [189]. The latter technique has now become the most used for archaeological glass fragments and makes it possible to perform the measurement of all elements with high precision on a small volume of material (spot diameter ~0.1 mm) and even the measurement of different isotopes with the latest generation instrument [190]. Unfortunately, only one isotope of cobalt is stable. However, some companion elements have stable isotopes (Ni, Cr, Fe) or isotopes with sufficient lifetime to be observed (Mn, Bi). This could in the future offer tools to link the colouring agent of cobalt with ancient mines as it was made for lead ores to some extent. The NAA method in fact has the advantage to perform analysis for the whole volume of the object without any sampling but is not much used due to the closure of nuclear facilities intended for sample irradiation. The LA-ICP-MS technique, although microdestructive, allows progressive measurement with the elimination of matter from the surface to the bulk, such as the upper corroded layer. Representativeness can be limited when large pigment grains are present. LA-ICP-MS is risky for enamelled artefacts due to their great sensitivity to thermal shock induced by the laser flash.
Confirmation of Gratuze’s categorization has been supported by Porter [14] and Henderson [65] also regarding Mediterranean/Islamic productions. Figure 4 visualizes the different cobalt types. The Ni, Zn and As diagram classifies satisfactorily the three groups numbered 2, 3 and 4 in Table 1 identified by Gratuze et al. [89,90].
Regarding blue glass artefacts from Egypt, Abe et al. [191] also identified different groups as did Gratuze et al. [89] and Kaczmarczyk [28], but by considering specifically the manganese content (Figure 5a,b). Abe et al. concluded that the compositional characteristics of the cobalt-blue colorant in the Ramesside period (13th–11th-Centuries BCE) glasses and ‘faiences’ (actually so-called Egyptian ‘faience’ is a type of fritware consisting of silica-rich stonepaste, not a clay-based paste as possessed by standard faience) were different from the colorant derived from cobaltiferous alum, labelled as Type A used in the 18th Dynasty (15th-Century BCE). The analyses suggest that a new cobalt source other than cobaltiferous alum from the Western Oases was also utilized in Egypt during the Ramesside period. This colourant is distinguished as Type R with a much lower level of zinc than Type A and relatively higher level of nickel. However, the composition of the colorant used in the Late/Ptolemaic/Roman periods (7th-Century BCE to 1st-Century CE), labelled as Type N particularly lacks nickel and shows depletion in zinc as impurities of the cobalt ore which have a direct effect on the hue of the blue colour obtained.
The purer the cobalt source, the higher the quality of the colour achieved. Indeed, colorant Type N is often characterized by a significant amount of manganese and is therefore subdivided into two groups based on the manganese oxide content. This ore belongs to the Co-Mn (1c) group recognized by Gratuze et al. (Table 1). Thus, at least five groups of cobalt sources can now be identified.
Demirsar Arli et al. [25] have recently compared the variability of the chemical data measured by pXRF on a selection of Ottoman Iznik tiles. They demonstrated that the variability of the CoO/NiO/MnO ratios measured for a single artefact, on a surface area equal to ~1 cm2 is significant, being larger than the measurement error. It is important to note that areas that are homogeneously coloured on Iznik tiles are generally larger than 1 cm2 (Figure 2a,b,d). A similar conclusion can be made for the CoO/Bi2O3 ratios. Furthermore, the distribution of the data is strongly anisotropic (Figure 6) along the lines joining defined CoO/NiO (~3 to 1) and MnO/CoO ratios (~>3). Indeed, the distribution along a line indicates a constant ratio, a feature observed when e.g., two phases containing the considered elements are mixed in variable proportions or when a solid solution is formed. A quasi-continuous distribution of compositions between MnO and 0.5/0.6–0.8 CoO-0.3–0.5 NiO is observed for the sherds excavated from Iznik tile kilns and Edirne tiles (15th–16th-Centuries). These results indicate the mixing of ores with different composition, voluntarily (using ores from different sources) or involuntarily (pieces of rock extracted from a single mine have different compositions; the grinding and processing therefore failed to homogenize the content).
Further information can be extracted by considering more ternary diagrams. Figure 7 compares the same series of measurements made on sherds excavated from ancient Iznik tile kilns [22] and on tiles covering the walls of Edirne mosques (see examples in Figure 2a,b,d) built during the 15th-Century (Şah Melek Paşa, Muradiye, and Üç Şerefeli mosques) and 16th-Century (Selimiye Mosque) [23]. The different ternary diagrams consider the different transition metals associated with cobalt (Ni, Zn, Fe and Mn) as well as elements belonging to the ‘Five elements vein’ (Bi, As) according to Kissin [84]. The CoO-NiO-ZnO diagram does not allow the distinction of different groups, except for rare outliers. These rare outliers comprise a Rhodes ware and two blue-and-white wares of Iznik productions (one having no cobalt and other without nickel content).
Moreover, the tiles of Selimiye mosque, either restored or of unknown origin, are outside of the main group, as well as two hexagonal glazed bricks. The diagrams including MnO, Bi2O3 and Fe2O3 demonstrate the distribution of Mn, Bi and Fe contents, respectively. These distributions are assigned to the intrinsic variability of the ores, probably from the same mine. However, for very specific tiles (two hexagonal glazed bricks unearthed at Iznik tile kilns excavation site, coloured glazed tiles of Şah Melek Paşa and Muradiye’s mihrab, and two untypical tiles of Selimiye mosque, possibly restorated or unauthentic) the position on particular lines in the CoO-Fe2O3-MnO diagram indicates the use of different sub-types of cobalt ore (Figure 7).
Some data are very differentiated, through the variability of the CoO+NiO/MnO ratio. They demonstrate that the cobalt comes from another origin. In this diagram, two restored or unauthentic Iznik tiles which were used in the wall revetments of the Selimiye Mosque (1569–1575) in Edirne exist in the same group as the tile panel of the Muradiye Mosque (1435–1436) and polychrome panel of the Şah Melek Paşa Mosque (1429) [23]. Additionally, the data obtained from two glazed hexagonal bricks which were unearthed during the Iznik tile kilns excavation in 2019 were distributed outside of the main group. The Zn content has been measured at a small level and seems not to be effective for potential use in the categorization except for the Muradiye tiles (the origin of these tiles with particular décor of Chinese style, i.e., Figure 2a, has been highly debated for decades) that are quasi zinc-free. The distribution of copper content is larger and the data from the Muradiye tiles form also a specific group as copper-rich. The distribution of manganese is rather limited, but a specific series is formed by the blue colour of the Şah Melek Paşa and Muradiye mihrab tiles and some excavated sherds. Analytical data support the very specific origin of these tiles deduced from their particular décor.
The Ni-Zn-As diagram as made by Gratuze et al. [90] (Figure 4) satisfactorily classifies the Group 3 and Group 4. Figure 8 compares similar diagrams obtained on a series of Chinese and Vietnamese sherds excavated at Qalhat [20], an important harbour located in the Sultanate of Oman, Hormuz Strait. Qalhat was a sister town of Hormuz during the late medieval times and became active in the maritime trade with India, Indonesia and the east African coast, before to be sacked by the Portuguese in 1508 [20,192]. Additional data from the sherds excavated from the ancient Vietnamese kilns (14th–16th-Centuries, Chu Dau, along Hong River, Hoa Luu, Tonkin, and Khai quat, Centre-Vietnam [137]), coming from a shipwreck (Surcouf, 18th-Century, France) [193], Marquis of Abrantes Palace (16th–17th-Centuries, Lisbon, Portugal) [193] and from the private collection of ASET Stiftung in Berlin (‘Blue Print’, 14th–15th-Centuries) [24].
The diagrams seem to be quite different from those drawn with data obtained from the Ottoman tiles (Figure 7), but the three groups identified for Asian porcelains, namely the Mn-rich correspond to Groups B and C already identified for other periods and continent (N2 group in Figure 5 and B-C group in Figure 8 closer to N2 group in Figure 5) [22,23] and Co-rich (Group A, cf. N1 in Figure 5). This demonstrates that the ores coming from deposits of the same geological types led to similar classification, whatever the mining places. However, Asian blues are all free of bismuth, and of copper, both of which are very variable in Ottoman glazes. Rare Asian and Iznik artefacts show significant levels of arsenic, most of the data corresponding to Group 3 and more rarely to Group 2. The most significant feature is the comparison of the CoO-Fe2O3-MnO diagram that is in contrast with that drawn from the Iznik data. Two series of data, ’Blue Print’ and the Vietnamese artefacts, are identified plus some outliers that are similar to the Iznik data (Figure 7). The origins of the blue-and-white porcelains of the ‘Blue Print’ program are not formally documented because they were not unearthed from an excavation site or kept in the collection of a museum. Indeed, these sherds belong to the private collection of the Art & Science Endowment Trust Charter (ASET) holdings located in Berlin (Germany). They were assumed to be the fragments of genuine objects produced from the Yuan to Ming dynasties. Identification of outliers is however an important information. For instance, regarding the composition of some of the blues of the Muradiye and Şah Melek Paşa mosque tiles [23], a clear distribution of composition is observed along the line drawn between CoO and 3ZnO-NiO. Bismuth and copper are not observed. The Mn content classifies the data into three groups called A, B and C and the Ni-As-Zn ones (Groups 2, 3 and 4) appears to be pertinent for artefacts made at very different periods and places. This confirms that the compositional classification is related to the geological classification (primary type rich in transition metals like Ni, secondary types enriched in arsenic, etc.) and different sites may have very similar chemical signatures, at least regarding the ratios for some of the components. Thus, consideration of many elements is mandatory. Comprehensive studies comparing the ores from different mines, in particular isotopic characteristics, are further needed.
Figure 9 compares the chromium content in the CoO-NiO-Cr2O3 diagram. Compositional features are very different for Iznik and Asian artefacts. We observed two groups in the Ottoman tiles but only one group for Asian cobalt types, along with some outliers. The same outliers (Rhodes ware, blue-and-white ware, hexagonal glazed brick, and untypical Iznik tiles of Selimiye mosque) of Iznik productions are evidenced in both ternary diagrams, Figure 7 and Figure 9. Most of the data are distributed along a Cr2O3-2[CoO-NiO] line. The tiles from the Muradiye mosque form a specific group free of chromium. It is worth noting that pure cobalt was measured for a modern restoration in the Selimiye mosque. Pure cobalt, characteristic of a modern chemical production (>1960) can be used to detect modern restoration/fakes. This ternary diagram completes very well those identified by Gratuze et al. [89,90] and Kaczmarczyk [28].

8. Compositional Shift: Mine Origin or Processing Effect?

We will try to go deeper in the discussion to understand if the ore processing also determines the different compositional groups. The fact that the compositional distribution measured for a single artefact is not isotropic but distributed along specific lines [25], the same with those formed by considering a series of artefacts (but larger) [21,177], is consistent with an intrinsic variability in certain elements for cobalt ores coming from the same mine. Anisotropic distribution of composition is clearly observed in Figure 7, Figure 8 and Figure 9. This hypothesis is also supported by the studies of Matin and Pollard [15,16] who analyzed rock pieces extracted from the area of the Kâshân mine (Iran) mentioned in ancient texts [13,14]. The elemental analysis showed that the ore contained high Fe and As concentrations along with a negligible content of Zn and Ni. The textual evidence also confirmed that the ore (secondary type) included cobaltite (CoAsS) and erythrite (Co3(AsO4)2.8H2O) as the main cobalt-bearing minerals. The authors also conducted experimental washing processes of the rocks according to a historical text and found that the ore then became more enriched with erythrite. A significant distribution of elemental ratios was also measured for the pieces of rock collected simultaneously. It is obvious that the variability of the ore composition prevents the establishment of a direct relationship between the specific ratio of companion elements versus cobalt. Furthermore, the statistical view of the compositional distribution of ore samples from other geological sites should be considered. Nevertheless, the comparison of diagrams in Figure 7, Figure 8 and Figure 9 suggests that most of the cobalt ores used for Ottoman and Chinese/Vietnamese artefacts are very different and only rarely are data seen to be similar for the two series (see the data on the right side of the top diagram for CoO-NiO-ZnO and CoO-NiO-MnO). For instance, the two tiles from the Selimiye Mosque, which were probably restored during the later periods of Iznik productions (shown with the pink lozenges in Figure 7), two glazed hexagonal bricks (blue plus sign, probably Seljuk production), two blue-and-white Iznik tiles and a Rhodes stonepaste (claret red plus sign) unearthed at the Iznik tile kilns excavation are outside the main Iznik cluster but lie closer to the Chinese/Vietnamese artefacts.
The Ni-Zn-As diagram (Figure 7, bottom-right) shows evidence for two groups for Ottoman blues (one consistent with Group 3 of Gratuze et al. [90], Figure 4), those with the presence of nickel or arsenic. The absence of nickel supports two different geological origins since the elimination of nickel requires complex processing which was not available before the second half of the 19th-Century, at least. The distribution of arsenic is much larger than that of Group 4 in the Gratuze et al. classification [89,90]. A much larger set of analytical data are required to extract more information from the compositional distribution.
The three groups recognized for Asian blues (Figure 8) fit with the classification of Gratuze et al. [89,90]. The CoO-Fe2O3-MnO diagram is highly informative. Three groups of blues can be recognized, such as manganese-free, rather similar with Ottoman blues and two types of cobalts with specific CoO/MnO ratios 5 and 1, respectively. They correspond to different types of sherds from different sites. Those excavated at Qalhat from the kilns along the Hong River and the others from the Chu Dau kilns in Tonkin (Vietnam) or from Yunnan [21,137,175] have a MnO/CoO ratio equal to 5 and those from the Blue Print project of ASET Stiftung in Berlin have this same ratio equal to 1 [24].
Comparison of Figure 5 (Egyptian cobalt types, ~1500–1300 BCE), Figure 7 (Ottoman, 15th–16th-Centuries CE) and Figure 8 (Asian, 14th–18th-Centuries CE) shows that types N (N1 and N2) and R can be distinguished. Obviously, this demonstrates again that the classification from elemental compositions categorizes types of geological deposits and not mining procedures, and conclusions based on the elemental signatures should hence be used with caution.
Asian historical records and studies indicate that the mixing of different raw materials of cobalt occurred. Manganese-rich areas coloured in blue with cobalt have been identified in Japanese [144,145,146,194], Chinese [21,147,167,168,169,170,171,172,173,174,195] and Vietnamese [21,137,175] porcelains. Considering Japanese porcelain, poor-quality cobalt ore had been used but some artefacts show a high arsenic content along with nickel, that is only consistent with the use (and/or mix) with European cobalt imported by the help of Portuguese Jesuit missionaries [144,145,146]. From the second half of the 19th-Century and well into the 20th-Century, Japanese potters had gradually replaced most of the low-grade natural cobalt ores (which were rich in manganese and iron) imported from China and the smalt-based enamel imported from the Old Continent with Co-based synthetic pigments of European origin which were characterized by a higher colouring power and less sensitivity to the firing atmosphere. In the same way, the guidance of French Jesuits hosted at the Chinese court by Emperor Kangxi (17th-Century) led to the importation of European ingredients, in particular arsenic-rich cobalt, and recipes to develop expertise on painted overglaze enamelling on porcelain [140,141,142] and on metal [61,143]. Then, Asian ingredients continued to be used again but with the recipes adapted.
The importation of cobalt from Persia and/or Europe and/or Indonesia during the Yuan (Mongol) Dynasty (1271–1368) has been accepted by many authors [14,99,100,124,128,138,140,167,168,169,170,171,172,173,174]. The high Fe/Mn value of the blue pigment is considered an effective empirical criterion to recognize the use of Asian cobalt sources [124,138,167,168,169,170,171,172,173,174,180,195,196,197,198,199,200,201]. A very recent study by Jiang et al. [180] addressed this subject with the analysis of selected pigment particles with different morphology, chemical composition and distribution behaviour in the blue Chinese porcelain glazes, using the sophisticated technique of focused ion beam-transmission electron microscopy (FIB-TEM). They confirmed the absence of significant amounts of Mn and Fe in Co-rich areas of Yuan porcelain and some As, Ni and Cu, consistent with importation from Iran or Europe. They identified two classes of pigments and concluded that a mixture of imported and local cobalt pigments had been used for providing the aesthetic effect of different hues. The results indicated that the Chinese overseas trade with western Asia had actually been active after the death of Admiral Zheng He with the consistent supply chain of imported cobalt pigment, despite the end of official trade and tributary activities at that time. The admiral was a significant figure during the 15th-Century with his several missions to Asian and African countries, marking the comprehensive Chinese overseas trade network with the west. Transmission electron microscopy and µ-X-ray Diffraction were also performed together with Raman microspectroscopy and SEM-EDS by Pinto et al. [202,203,204] in order to measure precisely the composition of blue coloured grains in Chinese porcelain (see further).
More detailed phase diagrams, i.e., the extended Co-Fe-Mn-Ni-Zn-Bi-As-Ag diagram, need to be considered to classify the different cobalt types. Detection of As by XRF is subtle due to the superimposition of the main As peak with that of Pb (see e.g., in [52]) but Raman microspectroscopy is very efficient for the detection of very minor amounts of arsenic due to the high intensity of the As-O vibrational modes [52,140,141,142,143,156,184,185] (see further). Nevertheless, the following conclusion can be made that high Mn and Fe contents can be associated with primary Asian geological deposits. Zn, Ni and In contents appear to be specific to some ores, mainly European ones. It is difficult to conclude if the presence of Bi (melting temperature 270 °C), Ag (melting temperature 962 °C) and As (volatile over 500–700 °C) arises from specific types of ores or from specific processing methods of the ores, or both.

9. European ‘Chaîne Opératoire’: Zaffre, Smalt and Blue Glass

We will consider the effect of processing for smalt, the main ‘raw material’ used in Europe for most applications (and exported to Asia) up to the production of ‘pure chemicals’ during the 19th-Century. Indeed, reliable data are now available with different ancient reports and the study of unreacted pigment grains found in paintings [205,206,207], and of smalt and slag fragments coming from Soví huť and Horní Blatná (northwest Bohemia) dating to the 16th- and 17th-Centuries [208]. According to the very interesting paper of Mimoso [209] who cites unpublished documents or difficult to find (Horschik [210]; Hammer [211]; De Gruijl [212]), “cobalt ores and cobalt occurring under different forms and compounds were known to the miners of the Erzgebirge Mountains at least since the 15th century. Before the invention of the blue colour, the simple mountain men called all arsenic and sulphur containing rocks and ores “kobold”. When they did not contain bismuth, they were cast away as unusable rubble. Usable bismuth ores often contained cobalt, nickel, sulphur and arsenic. Therefore, the miners also spoke of “bismuth-kobold”. The bismuth low melting point facilitated its extraction. It was “roasted” outdoors over an open wood fire. This resulted in the bismuth giving away toxic smoke. The slag-like residues were named “bismuth barley”(in the mine mills, the coarsest pieces of pounded ore are called grains or barley) and only at a higher temperature did cobalt melt from them.
Several authors suggest that miners active in the Ore Mountains (possibly Italians) had discovered that the blue pigment could be prepared from the slag and but, obviously, they did not reveal their purpose. It is known that the blue pigment was available throughout France, Germany, Low-Countries, Italy and in Spain before 1500 and some Italian sources have connected it with a German origin [209,213]. The large production of blue glass for stained glass church windows from the 12th-Century onward in France, England and Germany should also be recalled [8,119,214,215]. The paper of Mimoso [209] translating the text of Horschik gives important details: “Christopher Schürer came from a family of Saxony glassmakers [from] the upper Erzgebirge and [with] a branch located in Bohemia. established himself in Eulenhütte, between Platten and Neudeck in Bohemia where in 1530 he succeeded in fusing the glass and cobalt to obtain smalt. ln 1540 he built in the Rohlau near Neudeck a water-driven colour mill in which the smalt was crushed to a powder. In the same year he sent a report with a cost estimate “of how much 50 kg of blue glass melted in Schneeberg should cost” to the Elector in Dresden [Saxony]. The letter stated that with 5000 kg of zaffre by the addition of white quartz 10,000 kg of blue glass could be obtained at a cost of 3 and ¼ florins per 50 kg.” According to Kunckel [216], who was a German chemist and director of glassworks, also cited by Mimoso [209], “cobolt is taken one portion and mixed well with two or more parts of the finest and smallest crushed gravel pieces (which the miners call quartz) mixed and fired together, put in barrels until it is hard and strong like stone. After a long period finally it is again crushed with iron mallets. Such gravel will be sent away to the Dutch and other nations and used to paint their fine tableware and other things with it. And this is precisely what many mountain people and particularly [Italian] miners call “zaffera”. The Germans and English called it “zaffre” while the French call it “saffre”. “The sand is from Meissen and no other material is mixed so that the strength of the blue needed in other countries that the women want (and the painters also call “blue smalt”) cannot be imitated or reprocessed at a profit. For it is also known that if this fumed cobolt with a certain part of sand and potash is again mixed and molten the glass then carefully crushed and ground in a good mill between two particularly hard stones, a powder is obtained and then separated in different kinds, there is always one more beautiful than the others and sold in portions by an important trader from which a not small revenue is obtained by His Highness of Saxony. The Dutch text [212] continues as “This product was called “zaffre” and was one of the raw materials used by the Westzaan Company for the manufacture of blue smalt. Zaffre consisted of approximately 70% cobalt oxide and also the remains of arsenic and other metals”…. Depending on the desired colour intensity more or less zaffre was added up to about 5%. After some 8–10 h, the glass mass was molten. The top layer was the cobalt glass, and the sediment consisted of the unwanted metallic compounds. This was called “speiss”. The glass was gently scooped out with iron implements, taking care that it was not contaminated by the speiss. Again the technique of pouring the glass in water was used, resulting in pulverized blue glass. The technique of production is that of frits, common for the preparation of the coloured matter that is mixed with the glassy matrix powder to obtain enamels (anima and corpo mixture [95,217]).
Taking also into account the historical documents, the process of cobalt production can be summarized as follows. After visual examination of the ore pieces, the pieces selected were roasted to extract the bismuth and silver. The remaining slag pellets were used for the extraction and preparation of a cobalt product. This slag was crushed and then underwent a calcination process. Sulphur and arsenic (partly) escaped and were collected by condensation and the cobalt was oxidized. The resulting molten mass, a sort of slag with a significant content of silica already present was mixed with sand and various fluxes (potash, fluorite, etc.), heated to melt and was then thrown into water so that the thermal shock would break it into pieces. The broken mass was then crushed easily with heavy iron mallets and ground mechanically as finely as possible to obtain the smalt powder. Complementary elimination of iron can be made by acidic treatment. Blue grains of smalt identified in paint have the following oxide composition (wt.%): 66–72 SiO2, 10–21 K2O, 2–18 CoO and 0–8 As2O3 [205]. These results are consistent with the 18th-Century book of Valmont de Bomare [149] which indicates that different grades existed for the cobalt precursor (zaffre) and the grade used for paintings is called ‘smalt’.
The Dutch text [212] cited by Mimoso [209] confirms that the mining places listed by Kissin [84] were active at that time. The importance of Dutch merchants for the continuation of the use of European ingredients in Japan after the expulsion of Christian missionaries confirms their quasi monopoly in the trading of smalt: “cobalt oxide, the raw material, was obtained from Germany, mostly from Saxony (Erzgebirge) but also from Thuringia and from the Black Forest. The purchase was done through trading houses in Amsterdam which were specialized in this material”. Mimoso concluded [209]: “after a first largely unsuccessful effort in Saxony around 1540, where the basic technology had been discovered, the first industrial colour mills were set in Holland, probably before or around 1550 and the technology perfected there to an extent that was never duplicated in the Erzgebirge. In Saxony the first permanent colour mill was built in 1568 and a number of other mills were established both in Saxony and in Bohemia, particularly from the early 17th century. The ore on the Saxon side of the border returned a better blue (at least with the technology locally available) but the local ruler established a monopoly over the production, limiting private enterprise. On the Bohemian [now Czech] side there were no such limitations but to obtain a good colour, the ore had to be acquired from Saxony”.The Bohemian cobalt did not have the quality of that from Schneeberg and Annaberg deposits in Saxony”’. Hammer [211] has lately stated about the extraction of arsenic from the cobalt pigment: “arsenic may remain at a low content because it then has a favourable effect to the colour” (note the formation of a white phase(s) by the reaction of arsenic with lead, potassium and calcium promotes the colour and the gloss). An 18th-Century book written by Lehmann [213] in 1761 mentions the four shades of cobalt blue (smalt) available at that time such as Flemish blue, Dutch blue, Prussian blue and Saxony blue with different grades, as also stated in Valmont’s book [149]. The French chemist J.B. Guimet invented ultramarine blue in 1828 after his predecessor L.N. Vauquelin had discovered its presence in the blue deposits of soda and lime kilns. This artificial pigment (a zeolite hosting Sn ions), much cheaper to produce, replaced smalt in almost all applications except those that called for stability at temperatures over its own ~400 °C limit. Lapis lazuli had been the only concurrent mineral in use with cobalt for the coloration of glassy silicates until the preparation of specific types of spinels, (Co-,Ni-, Zn-,Cr-)-based at the end of the 19th- and the beginning of the 20th-Centuries [218] and the synthesis of the V-ZrSiO4 pigment [1,2,3].

10. Optical Spectroscopic Non-Invasive Characterization of Colouring Phases and Glassy Silicate Matrix

Elemental analysis identifies the elements present in a coloured area/volume but cannot identify the phases, and whether these are crystalline or amorphous. X-ray diffraction patterns, especially performed with a micro beam, include a series of Bragg peaks, the unit-cell structure, and by comparison with a database identifies the (amount of the different) phase(s) and even the complete structure (crystal symmetry, atom positions, etc.) after the application of a refinement procedure (Rietveld analysis). Raman microspectroscopy identifies both the crystalline and amorphous phases by comparison with a database or by chemical-based deduction [4,6,53,54,219,220,221,222,223,224,225]. UV-visible spectroscopy identifies the colouring ions, and in some cases, the symmetry of the ion site. Similar information is obtained by the technique of X-ray absorption near edge structure spectroscopy (XANES) under a synchrotron beam. A combination of methods is thus needed to identify the colouring agents, their amounts and their phases/elements present in different forms. This objective is much more difficult if only non-invasive (mobile) techniques are authorized in order to preserve outstanding (rare and high valued) artefacts which cannot be moved out of their storage rooms.
Although there have been many studies made on bulk coloured glass, mainly regarding elemental composition, analyses of enamelled artefacts are limited and deals mainly with the body, not the enamel layers. Due to their very high power of coloration, Co2+ ions dispersed in a glassy silicate matrix give a rather strong blue without any precipitation of the crystalline phases that can be formed, the solubility limit being not reached. Potentially, cobalt silicate with an olivine structure (Co2-xMxSiO4) [226] and cobalt aluminate with a spinel structure (Co1-xMxAl2O4) are the only phases expected to be formed over the saturation limit [220]. However, both structures accommodate several ionic substitutions and a large series of solid solutions exist with the replacement of Co and Al, mainly with Fe, Zn, Ni, Cr, Mn, In, and Mg ions. Furthermore, for the spinel structure, cations can occupy the different sites, such as tetrahedral and octahedral [203,204,205,217,226,227,228,229]. These phases can be identified by XRD or Raman microspectroscopy [203,204,205,228]. However, only Raman spectroscopy can identify the structure of the glassy silicates [223,224,225]. Figure 10 shows the representative Raman spectra of a glaze with two broad ‘bands’, at about 500 and 1000 cm−1, arising from the bending and stretching modes of the SiO4 tetrahedron which is the basic unit of silicates, either crystalline or amorphous. However, due to the large deformation of the Si-O bond in a symmetrical stretching mode, this mode dominates the Raman spectrum, and a direct link was established between the spectral components and the different more or less connected SiO4 tetrahedra. For similar reasons, the main peaks of olivine and spinel phases are the Si-O and M-O stretching modes, located at ~820–850 and ~650–700 cm−1 respectively [133,134,135,136,153]. Actually, the different components are very closely located in spinels and shoulders should be identified (see e.g., Figure 11) although a well-defined doublet is recognised for olivines [226]. The positions of these bands present in between the strong SiO4 bending and stretching modes should be detectable. Their absence will be consistent with a glassy phase, free of any crystalline second phase(s) (e.g., in Figure 10, right) in which the colour is obtained by dissolving ions in the glassy network. Raman spectroscopy is not sensitive to the presence of Co2+ in a glassy silicate network since the Co-O bond is too ionic to give a specific stretching Raman signature. In this case, the spectrum of the glassy silicate with its two broad ‘bands’ at ~500 and ~1000 cm−1 is only detected [221,222,223,224,225], indirectly leading to the conclusion about the presence of cobalt.
UV-vis spectroscopy (by transmission, absorption, diffuse reflectance modes, etc.) is a good method to identify the colouring ions in glass. Diffuse reflectance spectroscopy is a non-invasive technique that can be performed on-site with a mobile set-up (fibre optics reflectance spectroscopy: FORS [230,231,232,233,234,235]) and now with a hyperspectral camera [236]. From the reflectance curves, and using the Kubelka-Munk function, F(R) = (1 − R)2/2R, the UV–Vis–NIR absorption spectra of the glass samples could be obtained and compared with the literature.
Blue glass has absorption bands at about 524, 596 and 650 nm, which are characteristic of Co2+ in a tetrahedral environment, easily enabling the identification of cobalt as the blue pigment. These absorption bands derive from the allowed electronic 3d7 transitions of Co2+ cations (from the 4A2(F) ground state to the 4T1(P) and 2T(G) excited states) characteristic of cobalt in tetrahedral sites [237,238,239]. In a weak octahedral crystal field Co2+ (d7) gives rise to quartet states 4T1g(F), 4T2g(F), 4A2g(F) and 4T1g(P) and a number of doublet states like 2A1g(G), 2T1g(G), 2T2g(G) and 2Eg(G) of which 4T1g(F) is the ground state. The spectrum of Co2+ in an octahedral site, which displays a rose hue, exhibits bands at 506, 544, 600, 636, 644 and 1196 nm (see the nice spectra in [217,237,238]). The bands at 1196 and 506 nm are attributed to two spin allowed transitions from the ground state 4T1g(F) to the excited states 4T2g(F), and 4T1g(F), respectively. The other three bands are attributed to transitions 4T1g(F) → 2A1g(G), 2T1g(G) and 2T2g(G), respectively.
Under blue to red laser excitation the chromophore of lapis lazuli (S2− and S3− ions in the lazurite mineral) gives a very specific and intense spectrum (Figure 10-left, resonance Raman signal at ~545 cm−1 with a series of overtones/combination bands) [5,69,70,71,72,73,74,75,76,87,88]. The resonance Raman signal of Sn ions which is very strong under red to green laser illumination decreases (if the resonance Raman signal is not observed, we can conclude that lapis lazuli was not added) and disappears under blue to UV illumination and the host framework (feldspar for natural lapis lazuli or zeolite for synthetic ultramarine) can be identified. Another indication of the presence of cobalt ions is in the shape of the spectral background. Absorption of light in the red range that gives the blue colour flattens the Raman background on the Stokes side and very nice spectra of the glassy silicate (Figure 10) can be recorded although the spectrum of the colourless glaze exhibits generally a rather strong background [52] which increases with the wavenumber. We will consider the different types of coloured glassy coatings as follows.

10.1. Enamels on Glass

The main reason for the comparative rarity of studies on enamelled glass is the small number of the objects that have been produced and preserved even in the form of small fragments (Figure 1g). Enamelled glass artefacts were objects produced for the elite in society. Photographic documentation on Islamic [65,66,67,71,72,73,240,241,242] and European [96,243,244,245,246,247,248,249] enamelled glass is available but the number of specific scientific analyses of the enamels on glass is much smaller than those on pottery. Lead-rich compositions were generally used for this type of enamelling to facilitate the melting at relatively low temperatures [242,250,251,252], which are lower than that of the body. The most comprehensive studies have been performed on Egyptian [30], Ptolemaic [73] and Roman [71] artefacts and on Norman/Frederician vessels and Islamic mosque lamps (13th–14th-Centuries [72,73,74]). Mamluk enamelled artefacts are less rare and significant numbers of large-scale artefacts have been preserved [72,73,240,241,242,243]. Figure 2e shows an example of a Mamluks enamelled and gilded glass bottle in which the power of the enamel colour obtained by using lapis lazuli is very strong (Figure 10). The use of lapis lazuli in the place of cobalt (or with) appears to be quite common during the 13th- and 14th-Centuries [73,74]. The high skill of the Mamluk craftsmen led to the use of enamel compositions that are not very different from those of the bulk glass, avoiding the use of (easily corroded) lead-rich compositions. Sophisticated enamelled glass artefacts were also produced during the Quattrocento/Renaissance and afterwards with the development of glass production, mainly in Italy first at Altare and Venice, then in France at particularly Orléans as well as in the Low-Countries and Bohemia [243,244,245,246,247,248,249,250,251,252]. Elemental composition studies of these enamels on glass are documented [250,253,254], the measurements being focused on the composition of the glass body. In such cases, Raman spectroscopy offers the great advantage to be performed non-invasively on rare masterpieces with on-site measurements [69,70,71,72,73,74,75,76,140,141,142,143,155,156,230,243].
The use of arsenic-rich cobalt ores leads to the precipitation of lead arsenate phases that are characterised with a strong ~820 to 830 cm−1 band, as observed for the same period objects [62,140,141,142,143,155,156,184,185,252]. The reaction between the lead-based glass and the As-rich cobalt ore generates phases with varying compositions in the form of Na1−x−2yKxCayPb4(AsO4)3 apatite [255,256], F-apatite [157] or feldspar [52,257,258] according to the variable glass composition and firing temperature. The presence of Pb, Na, K, Ca and/or F is related to the fluxes that dissolve the arsenic present in the cobalt-rich ore, the saturation of arsenic leading to precipitation. The different phases formed explain the shift of the ca. 820 cm−1 band and the variable bandwidths. Although elemental As is hardly identified especially using pXRF, due to the superimposition of As peaks with those of major elements such as Pb, the presence of As is easily detected from the Raman peak of the As-O bond.

10.2. Glazed Pottery

FORS is efficient for the identification of the speciation of cobalt ions in the glaze as in any coloured phase, crystalline or amorphous [230,231]. The technique works well when a flat and glossy surface is available. In many cases, a focused beam is required. The need for a higher concentration of cobalt in thin glaze and enamels is expected to lead to saturation with cobalt, resulting in the precipitation of Co-based crystalline phases. Alternatively, Co-based pigments can be prepared separately and incorporated into the glaze precursor [1,220].
Pinto et al. [202,203,204] analysed Yuan and Ming blue-and-white porcelains in detail by a combination of μXRD, SEM-EDS, TEM and Raman spectroscopy. As demonstrated by the absence of additional Raman peaks in the signature of glassy silicate, Yuan porcelains were found to be coloured by dissolved Co2+ ions in the glaze network. Crystalline phase(s) were not or very rarely detected. In the latter case, the characteristic peaks are those of CoFe2O4 and more rarely of CoAl2O4. Whatever the establishment of empirical relationships between the composition and peak wavenumber [227], the determination of the composition of spinels from their Raman spectra is difficult, because the stretching modes in which only oxygen atoms move significantly dominate the Raman spectrum. The wavenumber shifts related to atomic substitution remain small and signatures of most of the spinels consist of a strong peak at ca. 680–700 cm−1 with smaller peaks at ~200–300, 450 and 550 cm−1 (Figure 11) [202,203,204,220,227,228,229,259,260,261,262].
Shoulders can be observed on the low- and high-wavenumber side of the stronger peak when sites are occupied by different atoms [227,228,229]. The site occupancy has more effect than the elemental composition. For pure CoAl2O4, due to the poor covalent character of the Al-O bond, the band at ca. 700 cm−1 is weak and the bands at ca. 200 and 520 cm−1 are stronger than those observed for ferrites [21,204,259,260,261]. However, the latter peak is close to the main peak of the feldspar group of minerals (~510 cm−1) [256,257], a common residue in porcelain bodies and glazes [21] which may lead to confusion. Furthermore, feldspars, in particular plagioclases, form complex solid solutions (concentration changes with incommensurable phases) that shift peak wavenumbers and increase the risk of misinterpretation of the signatures of spinels and feldspars.
Non-stoichiometric spinels have also been identified by Pinto et al. [202,203,204] with complex compositions in Ming blue-and-white porcelains by the combination of µXRD and Raman microspectroscopy: (Cox,Fey,Mnz,Niu,Mgv,Crw)AlnO4 with 0.2 < x < 0.55, 0.3 < y < 0.9, 0.15 < z < 0.35 and 1.8 < n < 2.5; where the u, v and w content values are close to or less than 0.1.

10.3. Defects Provoked by Elements Associated with Cobalt: Dark Spots

Darker spots, some with dendritic crystals formed on the surface of the glaze are observed for Vietnamese [175] (Figure 12) and Chinese [203] blue-decorated porcelains. Dendrites are formed in the liquid phase and observation of dendrites in some spots indicates localized heterogeneities have been formed during the solidification on cooling. This is very consistent with the heterogeneity of cobalt ores evidenced from the dispersion of elemental data. Well-defined dendrites have also been identified in iron-rich glazes such as those on the Jian (Tenmoku) wares [263,264], Hare’s Fur and rather similar bowls [265,266,267,268], where the distribution of the dendrites over the complete surface is typical of the related décor types. It is well known that addition of iron decreases the melting temperature of silicates under a reducing atmosphere [158]. The phases identified are magnetite (Fe3O4 with a spinel cubic structure), ferrite spinels (CoFe2O4, MnFe2O4, MnMn2O4 and more complex solid solutions) and ε-Fe2O3 (natural mineral: luogufengite; in which iron is in fact partially substituted by different elements), a rare polymorph of iron oxide [204,264,269,270,271]. The epsilon structure is defined by the pseudo hexagonal unit-cell but some ordering in the structure decreases the crystal symmetry that makes the Raman spectrum more complex. The easy twinning habit of the single crystals most likely facilitates the formation of dendrites in the glazes.
In comparison with the Raman signatures of other iron oxide polymorphs [262], ε-Fe2O3 shows more peaks [203,269]: the stronger peaks are at ~115, 148,171, 232, 350–390, 570, 600, 650, 680, 720, and 1400–1425 cm−1. In particular, the second order band at ~1400 cm−1 is broader but has a lower intensity. The illumination laser power at the sample should be very low (<0.1 mW) to avoid incurring a phase transformation through heating and changes in the oxidation state of the iron oxides [228,229,262,271].

10.4. Overglaze and Painted Enamels

Artefacts decorated with overglaze and enamel painted techniques on porcelain (Figure 1e,f and Figure 2c) and metal (Figure 1b and Figure 2g) are the most sophisticated and highly appreciated. Figure 13, Figure 14, Figure 15 and Figure 16 show representative examples of Raman and XRF spectra recorded on enamelled porcelain and metal artefacts, such as a painted porcelain bowl prepared at the Forbidden City Imperial workshop under the guidance of Jesuits during the Kangxi reign (Qing Dynasty) [140], an exceptional ewer (from a pair) with a Qianlong mark associating both painted and cloisonné enamels and a cloisonné box (Qing Dynasty) [143], a Limoges enamel portrait of St. Ignatius, the founder of the Jesuits Company [62] and painted enamel watches [52]. The analysis of such masterpieces requires non-invasive mobile techniques, namely portable XRF and Raman microspectroscopy.
As mentioned before, detection of the As-O stretching mode is easy due to the high polarizability of the bond and the high number of electrons involved that provide strong bands. For instance, a band at ~820–830 cm−1 is observed in the blue décor of soft-paste porcelains (Figure 13a,a’), a painted Chinese bowl (Figure 14a), a cloisonné box (Figure 14c), a Limoges portrait (Figure 14d) and the enamelled watches (Figure 16).
On-site analysis of complete enamelled artefacts imposes the requirement for the measurement to be made at the surface or in the upper layer(s). As shown in Figure 1k, a décor is made of many layers and the thickness ranges between typically 50 and 1000 µm for the enamels. Regarding XRF, penetration of the X-ray beam also varies in this range and as a function of the electronic transition levels of the analysed element (K, L or M), so the probed depth will be different. Penetration of the laser beam in Raman is also very variable as a function of the colouration and heterogeneity of the enamels, the laser wavelength and the laser power. The information obtained will be thus partial if the cross section of the object is not available. Indeed, qualitative information is obtained such as the elements present (major, minor and traces by pXRF), crystalline phases and the glassy silicate matrix (Raman microspectroscopy).
The use of a very high magnification such as a long working distance microscope objective (×200) allows focusing to be made on individual crystalline grains and hence benefits from the rather pure contribution of the crystalline phase in the glassy matrix (see e.g., the spectrum of the 26296 tea pot in Figure 13a’). In other cases, both contributions from the crystalline phase and the glassy matrix are mixed. The identification of the components of the SiO4 stretching band and the band area ratio of the bending and stretching modes identify the type of glassy matrix (potash-based, soda or soda-lime based, lead-poor or lead-rich) [221,222,223,224]. For instance, the glazes of the 18432 pot and 13371 salt cellar peaking at 985–1000 cm−1 are lead-rich although those of the 6638 cup and a blue-and-white ceramic sherd unearthed at the Iznik tile kilns excavation site are of the lead-alkali type (Figure 13b). Regarding the MG5250 Imperial bowl (Figure 14a), the spectrum of the blue glaze is characteristic of a porcelain potash glaze fired at high temperature (5250 blue depth and 5250-light blue, 1040 to 1075 cm−1 peak) on which lead-based overglazes are coated (5250-blue 21, 990–1040 cm−1 doublet). Up to now the evidence of a Raman signature of CoSiO4, olivine, was only detected in a specimen of blue speckled glazed pottery excavated from Qalhat (Figure 13c) [192], and not on glazed porcelain. Identification of major, minor and trace elements by pXRF confirms the Raman assignments [192].
Figure 15 compares the XRF data obtained from Chinese (a,b,c) and Vietnamese (c) artefacts on the basis of the energy range in which the characteristic peaks of transition metals are observed. Mn, Fe, Ni, Cu and Zn are unambiguously detected but detection of Co can be sometimes doubtful since the cobalt Kα peak overlaps the minor Kβ peak of iron. When the enamel layer is sufficiently thick to avoid contamination by the substrate, the instrument software can determine the composition except for the light elements. XRF detection can also be hard due to the superimposition of the stronger Kα peak of As with the main peak of Pb (Lα), which is shown as an example in Figure 16.

10.5. Enamels on Metals

Figure 16 shows representative pXRF and Raman spectra recorded on watches with painted enamelled décor depicting famous paintings of the 17th- and 18th-Centuries that led to an accurate dating of the artefacts. These rare and costly artefacts were made by experts and were the first to use innovative enamelling technology in terms of mimicking the technique of oil painting on small metal objects [52]. Comparison of the XRF and Raman spectra shows very well how the detection of arsenic is easier with Raman microspectroscopy. The variability of the signals of elements associated with cobalt (Ni, Cu, Zn and Mn) for similar objects of about the same date and origin points out that contemporary craftsmen had used different ores or grades. The same conclusion was drawn in the study of Limoges enamels dating from the end of the 17th-Century to the beginning of the 18th-Century, where the artefacts were made either using As-containing or As-free cobalt [185]. Thus, establishing a relationship between the set of elements in association with cobalt and a production place and/or period of time appears to be an oversimplification.

11. Conclusions

Obviously, before the development of chemical purification routes of transition metals during the 20th-Century, minor and trace elements associated with cobalt preserved the signature of the geological context of cobalt ores. Three types of geological contexts can be recognized, the primary ones where Co, Fe, Ni and Mn are mixed, the secondary (hydrothermal) ones which are rich in As and S and the tertiary deposits. Ancient processing routes eliminated some of the associated elements, such as Ag and Bi to some extent. The elemental fingerprint of the cobalt pigment thus depends on many parameters and classification based on this loses its efficiency with the acceleration of the technological innovation (i.e., after the Renaissance). However, correlations as well as outliers identified in the phase diagrams derived from the compositional data support evidence of changes being made in the technology due to the use of different ingredients.
Anisotropic distribution of the compositions observed whatever the place and period of production in the phase diagrams is due to the heterogeneous composition of cobalt ores. Thus, compositional characteristics must be considered from the statistical point of view on a higher number of objects from the same production place and period.
Regarding the cases studied and considered in this review, except for the outliers related to ingredients imported by long-distance trade, large differences between Ottoman and Asian data support the use of local sources in priority. Historical records and scientific analyses point out that different types of cobalt were used simultaneously to produce the desired shades in different types of decoration for achieving aesthetical requirements, most likely by the selection of different grades from the same geological origins. The efficiency of Ni-Zn-As diagram proposed by Gratuze et al. as a classification tool is confirmed but diagrams CoO-Fe2O3-MnO and CoO-NiO-Cr2O3 are mandatory to identify the outliers that could prove the trade of cobalt ores. However, a much larger scale of data obtained from the analyses of different artefacts and of the raw materials excavated in ancient production centers such as Bohemia are required to establish the relevance of these phase diagrams further and to facilitate the drawing of more reliable conclusions. It should be noted that economic constraints in terms of time and cost are also present in order to perform a series of microanalytical measurements for each artefact studied to be able to discuss more effectively the origin of the cobalt pigments and the technology used. Combination of optical spectroscopic techniques and pXRF is very efficient to discriminate between the technology of colouration and their non-invasiveness and mobility allow the study of masterpieces, providing unique information.

Author Contributions

Conceptualization, P.C.; investigation, P.C. and G.S.F.; resources, P.C. and G.S.F.; data curation, P.C. and G.S.F.; image production, P.C. and G.S.F.; writing—original draft preparation, P.C.; writing—review and editing, P.C., B.K. and G.S.F. All authors have read and agreed to the published version of the manuscript.

Funding

The research in France was funded by the French Agence Nationale de la Recherche ANR EnamelFC project—19-CE27–0019-02. Part of the study made in Turkey was supported by the Scientific and Technological Research Council of Turkey (TÜBİTAK) through 1001-Scientific and Technological Research Projects Funding Program (Grant No: MAG 217M625).

Data Availability Statement

Data sharing not applicable.

Acknowledgments

The authors acknowledge Curators, Keepers and all the staff of the French museums giving the opportunity to studies artefacts from their collection: Cité de la Céramique Sèvres & Limoges; musée du Louvre (Département Islam et Département des objets d’art), Paris; musée des arts décoratifs, Paris; musée des arts asiatiques-Guimet, Paris; musée du Chateau de Fontainebleau, Fontainebleau. Authors are deeply grateful to Belgin Demirsar Arli and Sennur Kaya for giving the permission of doing on-site measurements at Iznik Tile Kilns Excavation. The authors also acknowledge the authorities of Edirne City and Selimiye Foundation as well as colleagues involved in the previous studies (Ozan Unsalan, Kutalmis Bayraktar, Altay Bayatli).

Conflicts of Interest

The authors declare no conflict of interest.

References

  1. Epler, R.A.; Epler, D.R. Glazes and Glass Coatings; The American Ceramic Society: Westerville, OH, USA, 2000. [Google Scholar]
  2. Demiray, T.; Nath, D.K.; Hummel, F.A. Zircon-Vanadium blue pigment. J. Am. Ceram. Soc. 1970, 53, 1–4. [Google Scholar] [CrossRef]
  3. De Waal, D.; Heyns, A.M.; Pretorius, G.; Clark, R.J.H. Raman spectroscopic investigations of ZrSiO4:V4+, the blue zircon vanadium pigment. J. Raman Spectrosc. 1996, 27, 657–662. [Google Scholar] [CrossRef]
  4. Colomban, P. Rocks as blue, green and black pigments/dyes of glazed pottery and enamelled glass artefacts—A review. Eur. J. Mineral. 2014, 25, 863–879. [Google Scholar] [CrossRef]
  5. Colomban, P. Lapis lazuli as unexpected blue pigment in Iranian Lâjvardina ceramics. J. Raman Spectrosc. 2003, 34, 420–423. [Google Scholar] [CrossRef]
  6. Colomban, P. The destructive/non-destructive identification of enamelled pottery and glass artifacts and associated pigments—A brief overview. Arts 2013, 2, 77–110. [Google Scholar] [CrossRef] [Green Version]
  7. Janssens, K. Modern Methods for Analysing Archaeological and Historical Glass. 2 Volumes; John Wiley and Sons Ltd.: Chichester, UK, 2013. [Google Scholar]
  8. Richet, P. Encyclopedia of Glass Science, Technology, History, and Culture. 2 Volumes; Richet, P., Ed.; The American Ceramic Society: Columbus, OH, USA; John Wiley and Sons, Inc.: Hoboken, NJ, USA, 2021. [Google Scholar]
  9. Guineau, B. Analyse non destructive des pigments par microsonde Raman laser: Exemples de l’azurite et de la malachite. Stud. Conserv. 1984, 29, 35–41. [Google Scholar]
  10. Wei, S.; Ma, Q.; Schreiner, M. Scientific investigation of the paint and adhesive materials used in the Western Han dynasty polychromy terracotta army, Qingzhou, China. J. Archaeol. Sci. 2012, 39, 1628–1633. [Google Scholar] [CrossRef]
  11. Orlova, A.I.; Kitaev, D.B.; Lukinich, A.N.; Tomilin, S.B.; Lizin, A.A.; Kulikov, I.A.; Samsanov, V.E. Phosphate monazite- and NaZr2(PO4)3 (NZP)-like ceramics containing uranium and plutonium. Czech. J. Phys. 2003, 53, A665–A670. [Google Scholar] [CrossRef]
  12. Parchur, A.K.; Prasad, A.I.; Rai, S.B.; Tewari, R.; Sahu, R.K.; Okram, G.S.; Singh, R.A.; Ningthoujam, R.S. Observation of intermediate bands in Eu3+ doped YPO4 host:Li+ ion effect and blue to pink light emitter. AIP Adv. 2012, 2, 032119. [Google Scholar] [CrossRef]
  13. Porter, Y. Textes persans sur la céramique. In La Science dans le Monde Iranien; Vesel, Z., Ed.; Institut Français de Recherche en Iran: Teheran, Iran, 1998; pp. 165–189. [Google Scholar]
  14. Porter, Y. Le cobalt dans le monde Iranien (IXe-XVIe siècles). Taoci 2000, 1, 5–14. [Google Scholar]
  15. Matin, M.; Pollard, A.M. From ore to pigment: A description of the minerals and experimental study of cobalt ore processing from the Kâshân mine, Iran. Archaeometry 2017, 59, 731–746. [Google Scholar] [CrossRef]
  16. Matin, M.; Pollard, A.M. Historical accounts of cobalt ore processing from the Kāshān mine, Iran. Iran 2015, 53, 171–183. [Google Scholar] [CrossRef]
  17. Allan, J.W. Abū’l-Qāsim’s treatise on ceramics. Iran 1973, 11, 111–120. [Google Scholar] [CrossRef]
  18. Holakooei, P. A medieval Persian treatise on coloured and enamelled glass: Bayan Al-Sana’at. Iran 2016, 54, 95–106. [Google Scholar] [CrossRef]
  19. Al-Hassan, A.Y. An eighth century Arabic treatise on the colouring of glass: Kitāb Al-Durra Al-Maknūna (the Book of the Hidden Pearl) of Jābir Ibn Ḥayyān (C. 721–C. 815). Arab. Sci. Philos. 2009, 19, 121–156. [Google Scholar] [CrossRef]
  20. Rougeulle, A.; Renel, H.; Simsek, G.; Colomban, P. Medieval ceramic production at Qalhât, Oman, a multidisciplinary approach. Proc. Int. Seminar Arabian Stud. 2014, 44, 299–336. [Google Scholar]
  21. Simsek, G.; Colomban, P.; Wong, S.; Bing, Z.; Rougeulle, A.; Liem, N.Q. Toward a fast non-destructive identification of pottery: The sourcing of 14th-16th century Vietnamese and Chinese ceramic shards. J. Cult. Herit. 2015, 16, 159–172. [Google Scholar] [CrossRef]
  22. Simsek, G.; Arli, B.D.; Kaya, S.; Colomban, P. On-site pXRF analysis of body, glaze and colouring agents of the tiles at the excavation site of Iznik kilns. J. Eur. Ceram. Soc. 2019, 39, 2199–2209. [Google Scholar] [CrossRef]
  23. Simsek, G.; Unsalan, O.; Bayraktar, K.; Colomban, P. On-site pXRF analysis of glaze composition and colouring agents of “Iznik” tiles at Edirne mosques (15th and 16th-centuries). Ceram. Int. 2019, 45, 595–605. [Google Scholar] [CrossRef]
  24. Simsek Franci, G. Handheld X-ray fluorescence (XRF) versus wavelength dispersive XRF: Characterization of Chinese blue-and-white porcelain sherds using handheld and laboratory-type XRF instruments. Appl. Spectrosc. 2020, 74, 314–322. [Google Scholar] [CrossRef]
  25. Demirsar Arli, B.; Simsek Franci, G.; Kaya, S.; Arli, H.; Colomban, P. Portable X-ray Fluorescence (p-XRF) uncertainty estimation for glazed ceramic analysis: Case of Iznik Tiles. Heritage 2020, 3, 1302–1329. [Google Scholar] [CrossRef]
  26. Brongniart, A. Mémoire sur la Peinture sur Verre; Imprimerie Sellingue: Paris, France, 1829. [Google Scholar]
  27. Brongniart, A. Traité des Arts Céramiques ou des Poteries Considérées Dans Leur Histoire, leur Pratique et leur Théorie, 3rd ed.; Libraire Faculté de Médecine: Paris, France, 1977; Volume 2. [Google Scholar]
  28. Weber, F.W. Artist’s Pigments, Their Chemical and Physical Properties; Van Nostrand: New York, NY, USA, 1923. [Google Scholar]
  29. Feller, R.L. Artist’s Pigments: A Handbook of Their History and Characterization, Volume 1; Oxford University Press: New York, NY, USA, 1986. [Google Scholar]
  30. Kaczmarczyk, A. The source of cobalt in ancient Egyptian pigments. In Proceedings of the 24th International Archaeometry Symposium; Olin, J.S., Blackman, M.J., Eds.; Smithsonian Institution Press: Washington, DC, USA, 1986; pp. 369–376. [Google Scholar]
  31. Naef-Galuba, I. Les bleus d’Egypte. Rev. Céramique Verre 1993, 69, 41–45. [Google Scholar]
  32. Nicholson, P.T. Glassmaking and glassworking at Amarna: Some new work. J. Glass Stud. 1995, 37, 11–19. [Google Scholar]
  33. Shortland, A.J.; Tite, M.S. The interdependence of glass and vitreous faience production at Amarna. In Prehistory and History of Glassmaking Technology; McCray, P., Ed.; The American Ceramic Society: Westerville, OH, USA, 1998; pp. 251–265. [Google Scholar]
  34. Shortland, A.J.; Tite, M.S.; Ewart, I. Ancient exploitation and use of cobalt alums from the western oases of Egypt. Archaeometry 2006, 48, 153–168. [Google Scholar] [CrossRef]
  35. Rehren, T. Aspects of the production of cobalt-blue glass in Egypt. Archaeometry 2001, 43, 483–489. [Google Scholar] [CrossRef]
  36. Tite, M.S.; Shortland, A.J. Production technology for copper- and cobalt-blue vitreous materials from the New Kingdom site of Amarna—A reappraisal. Archaeometry 2003, 45, 285–312. [Google Scholar] [CrossRef]
  37. Tite, M.S. The technology of glazed Islamic ceramics using data collected by the late Alexander Kaczmarczyk. Archaeometry 2011, 53, 329–339. [Google Scholar] [CrossRef]
  38. Hodgkinson, A.K.; Rohrs, S.; Muller, K.; Reiche, I. The use of Cobalt in 18th Dynasty Blue Glass from Amarna: The results from an on-site analysis using portable XRF technology. Sci. Tech. Archaeol. Res. 2019, 5, 1–17. [Google Scholar] [CrossRef] [Green Version]
  39. Dayton, J.E. Geological evidence for the discovery of cobalt blue glass in Mycenaean times as a by-product of silver smelting in the Schneeberg area of the bohemian Erzgebirge. In Proceedings of the Actes du XXe Symposium International d’Archéométrie, Paris, France, 26–29 March 1980; 1981; Volume III. [Google Scholar]
  40. Zacharias, N.; Kaparou, M.; Oikonomou, A.; Kasztovszky, Z. Mycenaean glass from the Argolid, Peloponnese, Greece: A technological and provenance study. Microchem. J. 2018, 141, 404–417. [Google Scholar] [CrossRef]
  41. Walton, M.S.; Shortland, A.; Kirk, S.; Degryse, P. Evidence for the trade of Mesopotamian and Egyptian glass to Mycenaean Greece. J. Archaeol. Sci. 2009, 36, 1496–1503. [Google Scholar] [CrossRef]
  42. Walton, M.; Eremin, K.; Shortland, A.; Degryse, P.; Kirk, S. Analysis of Late Bronze Age glass axes from Nippur—A new cobalt colourant. Archaeometry 2012, 54, 835–852. [Google Scholar] [CrossRef]
  43. Purowski, T.; Kepa, L.; Wagner, B. Glass on the Amber Road: The chemical composition of glass beads from the Bronze Age in Poland. Archaeol. Anthropol. Sci. 2018, 10, 1283–1302. [Google Scholar] [CrossRef]
  44. Holakooei, P. A multi-spectroscopic approach to the characterization of early glaze opacifiers: Studies on an Achaemenid glazed brick found at Susa, south-western Iran (mid-first millennium BC). Spectrochim. Acta Part A Mol. Biomol. Spectrosc. 2013, 116, 49–56. [Google Scholar] [CrossRef] [PubMed]
  45. Broschat, K.; Rehren, T. The glass headrests of Tutankhamen. J. Glass Stud. 2017, 59, 377–380. [Google Scholar]
  46. Mason, R.B. Shine Like the Sun: Lustre-painted and Associated Pottery from the Medieval Middle East; Mazda Press: Costa Mesa, CA, USA; Royal Ontario Museum: Toronto, ON, Canada, 2004. [Google Scholar]
  47. Colomban, P.; Truong, C. Non-destructive Raman study of the glazing technique in lustre potteries and faience (9th–14th centuries): Silver ions, nanoclusters, microstructure and processing. J. Raman Spectrosc. 2004, 35, 194–207. [Google Scholar] [CrossRef]
  48. Hallett, J. Iraq and China: Trade and innovation in the Early Abbasid period. Taoci 2005, 4, 21–29. [Google Scholar]
  49. Hallett, J. Pearl cups like the moon: The Abbasid reception of Chinese ceramics. In Shipwrecked: Tang Treasures and Monsoon Winds; Krahl, R., Guy, J., Keith Wilson, J., Raby, J., Eds.; Smithsonian Institution: Washington, DC, USA, 2010; pp. 75–81. [Google Scholar]
  50. Kessler, A.T. Song Blue and White Porcelain on the Silk Road. Studies in Asian Art and Archaeology; Brill: Leiden, The Netherlands, 2012. [Google Scholar]
  51. Watson, O. Ceramics and circulation. In A Companion to Islamic Art and Architecture; Flood, F.B., Necipoğlu, G., Eds.; John Wiley & Sons, Inc.: Hoboken, NJ, USA, 2017; pp. 478–500. [Google Scholar]
  52. Colomban, P.; Kirmizi, B.; Gougeon, C.; Gironda, M.; Cardinal, C. Pigments and glassy matrix of the 17th–18th century enamelled French watches: A non-invasive on-site Raman and pXRF study. J. Cult. Herit. 2020, 44, 1–14. [Google Scholar] [CrossRef]
  53. Colomban, P. Glaze and enamels. In Encyclopedia of Glass Science, Technology, History and Culture, 1st ed.; Richet, P., Ed.; John Wiley and Sons, Inc.: Hoboken, NJ, USA, 2020; pp. 1309–1326. [Google Scholar]
  54. Colomban, P. Glass, pottery and enamelled objects: Identification of their technology and origin. In Conservation Science: Heritage Materials, 2nd ed.; Garside, P., Richardson, E., Eds.; Royal Society of Chemistry: London, UK, 2021. [Google Scholar]
  55. Ward, G.W.R. Enamel. In The Grove Encyclopedia of Materials and Techniques in Art; Oxford University Press: Oxford, UK, 2008; pp. 187–190. [Google Scholar]
  56. Speel, E. Dictionary of Enamelling: History and Techniques; Routledge: New York, NY, USA, 1998. [Google Scholar]
  57. Gauthier, M.-M. Émaux. In Encyclopédie Universalis; Encyclopædia Universalis: Paris, France, 1985; pp. 939–960. [Google Scholar]
  58. Campbell, M. An Introduction to Medieval Enamels; HMSO: London, UK, 1983. [Google Scholar]
  59. Kruta, V. The first Celtic expansion: Prehistory to history. In The Celts; Moscati, S., Frey, O.H., Kruta, V., Raftery, B., Szabo, M., Arslan, E., Vitaly, D., Eds.; Bompiani: Milano, Italy, 1991; pp. 195–210. [Google Scholar]
  60. Buckton, D. Byzantine Enamel. In Byzantium: Treasures of Byzantine Art and Culture; Buckton, D., Ed.; The British Museum Press: London, UK, 1994; p. 18. [Google Scholar]
  61. Kırmızı, B.; Colomban, P.; Quette, B. On-site analysis of Chinese Cloisonné enamels from fifteenth to nineteenth centuries. J. Raman Spectrosc. 2010, 41, 780–790. [Google Scholar]
  62. Colomban, P.; Arberet, L.; Kırmızı, B. On-site Raman analysis of 17th and 18th century Limoges enamels: Implications on the European cobalt sources and the technological relationship between Limoges and Chinese enamels. Ceram. Int. 2017, 43, 10158–10165. [Google Scholar] [CrossRef] [Green Version]
  63. Quette, B. Cloisonné: Chinese Enamels from the Yuan, Ming and Qing Dynasties; Yale University Press: Yale, CT, USA, 2011. [Google Scholar]
  64. Garner, S.H.M. Chinese and Japanese Cloisonné Enamels; Faber & Faber: London, UK, 1962. [Google Scholar]
  65. Henderson, J. Blue and other coloured translucent glass decorated with enamels: Possible evidence for trade in cobalt-blue colourants. In Gilded and Enamelled Glass from the Middle East; Ward, R., Ed.; BMP: London, UK, 1998; pp. 116–121. [Google Scholar]
  66. Freestone, I.C.; Stapleton, C.P. Composition and technology of Islamic enamelled glass of the thirteenth and fourteenth centuries. In Gilded and Enamelled Glass from the Middle East; Ward, R., Ed.; BMP: London, UK, 1998; pp. 122–128. [Google Scholar]
  67. Newby, M.S. The Cavour Vase and gilt and enamelled Mamluk coloured glass. In Gilded and Enamelled Glass from the Middle East; Ward, R., Ed.; BMP: London, UK, 1998; pp. 35–40. [Google Scholar]
  68. Freestone, I.C. The relationship between enamelling on ceramics and on glass in the Islamic world. Archaeometry 2002, 44, 251–255. [Google Scholar] [CrossRef]
  69. Clark, R.J.H.; Curri, M.L.; Laganara, C. Raman microscopy: The identification of lapis lazuli on medieval pottery fragments from the south of Italy. Spectrochim. Acta Part A Mol. Biomol. 1997, 53, 597–603. [Google Scholar] [CrossRef]
  70. Clark, R.J.H.; Curri, L.; Henshaw, G.S.; Laganara, C. Characterization of brown–black and blue pigments in glazed pottery fragments from Castel Fiorentino (Foggia, Italy) by Raman microscopy, X-Ray powder diffractometry and X-Ray photoelectron spectroscopy. J. Raman Spectrosc. 1997, 28, 105–109. [Google Scholar] [CrossRef]
  71. Greiff, S.; Schuster, J. Technological study of enamelling on Roman glass: The nature of opacifying, decolourizing and fining agents used with the glass beakers from Lübsow (Lubieszewo, Poland). J. Cult. Herit. 2008, 9, e27–e32. [Google Scholar] [CrossRef]
  72. Colomban, P.; Tournié, A.; Caggiani, M.C.; Paris, C. Pigments and enamelling/gilding technology of Mamluk mosque lamps and bottle. J. Raman Spectrosc. 2012, 43, 1975–1984. [Google Scholar] [CrossRef]
  73. Caggiani, M.C.; Colomban, P.; Valotteau, C.; Mangone, A.; Cambon, P. Mobile Raman spectroscopy analysis of ancient enamelled glass masterpieces. Anal. Meth. 2013, 54, 345–354. [Google Scholar] [CrossRef]
  74. Caggiani, M.C.; Ditaranto, N.; Guascito, M.R.; Acquafredda, P.; Laviano, R.; Giannossa, L.C.; Mutino, S.; Mangone, A. Combined analysis of enamelled and gilded glassware from Frederick II Castle at Melfi (Italy) to identify technology and raw materials. X-Ray Spectrom. 2015, 44, 191–200. [Google Scholar] [CrossRef]
  75. Colomban, P. Routes du Lapis Lazuli, Lâjvardina et échanges entre arts du verre, de la céramique et du livre. Taoci 2005, 4, 145–152. [Google Scholar]
  76. Colomban, P.; Milande, V. On-site Raman analysis of the earliest known Meissen porcelain and stoneware. J. Raman Spectrosc. 2006, 37, 606–613. [Google Scholar] [CrossRef] [Green Version]
  77. Colomban, P.; Schreiber, H.D. Raman signature modification induced by copper nanoparticles in silicate glass. J. Raman Spectrosc. 2005, 36, 884–890. [Google Scholar] [CrossRef] [Green Version]
  78. Jana, R.K.; Premchand, B.D.P. Ammoniacal leaching of roast reduced deep-sea manganese nodules. Hydrometallurgy 1999, 53, 45–56. [Google Scholar] [CrossRef]
  79. Jana, R.K.; Srikanth, S.; Pandey, B.D.; Kumar, V.; Premchand, B.D.P. Processing of Deep-Sea Manganese Nodules at NML for Recovery of Copper, Nickel & Cobalt. Metals Mater. Process. 1999, 11, 133–144. [Google Scholar]
  80. Gupta, B.; Deep, A.; Singh, V.; Tandon, S.N. Recovery of cobalt, nickel, and copper from sea nodules by their extraction with alkylphosphines. Hydrometallurgy 2003, 70, 121–129. [Google Scholar] [CrossRef]
  81. Manceau, A.; Lanson, M.; Takahashi, Y. Mineralogy and crystal chemistry of Mn, Fe, Co, Ni, and Cu in deep-sea Pacific polymetallic nodule. Am. Mineral. 2014, 99, 2068–2083. [Google Scholar] [CrossRef]
  82. Marres, P. L’organisation économique de la Chine du Sud-Ouest et la route de Birmanie. Ann. Géographie 1941, 283, 229–232. [Google Scholar]
  83. Le Yunnan. In Etudes et Conjoncture—Economie Mondiale; Presse Universitaires de France: Paris, France, 1946; pp. 97–123. [CrossRef]
  84. Kissin, S.A. Five-element (Ni-Co-As-Ag-Bi) veins. Geosci. Can. 1992, 19, 113–124. Available online: https://journals.lib.unb.ca/index.php/gc/article/view/3768/4282/ (accessed on 15 December 2019).
  85. Ladame, G. Les ressources métallifères de l’Iran. Schweiz. Mineral. Petrogr. Mitt. 1945, 25, 165–298. [Google Scholar]
  86. Siu, I.; Henderson, J.; Qin, D.; Cui, J.; Ma, H. New light on plant ash glass found in Africa: Evidence for Indian Ocean Silk Road trade using major, minor, trace element and lead isotope analysis of glass from the 15th–16th century AD from Malindi and Mambui, Kenya. PLoS ONE 2020, 15, e0237612. [Google Scholar]
  87. Catalano, I.M.; Genga, A.; Laganara, C.; Laviano, R.; Mangone, A.; Marano, D.; Traini, A. Lapis lazuli usage for blue decoration of polychrome painted glazed pottery: A recurrent technology during the Middle Ages in Apulia (Southern Italy). J. Archaeol. Sci. 2007, 34, 503–511. [Google Scholar] [CrossRef]
  88. Mangone, A.; de Benedetto, G.E.; Fico, D.; Giannossa, L.C.; Laviano, R.; Sabbatini, L.; van der Werf, I.D.; Traini, A. A multianalytical study of archaeological faience from the Vesuvian area as a valid tool to investigate provenance and technological features. New J. Chem. 2011, 35, 2860–2868. [Google Scholar] [CrossRef]
  89. Gratuze, B.; Soulier, I.; Barrandon, J.N.; Foy, D. De l’origine du cobalt dans les verres. Revue d’Archéométrie 1992, 16, 97–108. [Google Scholar] [CrossRef]
  90. Gratuze, B.; Soulier, I.; Blet, M.; Vallauri, L. De l’origine du cobalt: Du verre à la céramique‘. Revue d’Archéométrie 1996, 20, 77–94. [Google Scholar] [CrossRef]
  91. Uboldi, M.; Verita, M. Scientific analyses of glasses from Late Antique and Early Medieval archeological sites in Northern Italy. J. Glass Stud. 2003, 45, 115–137. [Google Scholar]
  92. Colomban, P.; March, G.; Mazerolles, L.; Karmous, T.; Ayed, N.; Ennabli, A.; Slim, H. Raman identification of materials used for jewellery and mosaics in Ifriqiya. J. Raman Spectrosc. 2003, 34, 205–213. [Google Scholar] [CrossRef]
  93. Gallo, F.; Silvestri, A. Medieval glass from Rocca di Asolo (Northern Italy): An archaeometric study. Archaeometry 2012, 54, 1023–1039. [Google Scholar] [CrossRef]
  94. Basso, E.; Invernizzi, C.; Malagodi, M.; La Russa, M.F.; Bersani, D.; Lottici, P.P. Characterization of colorants and opacifiers in roman glass mosaic tesserae through spectroscopic and spectrometric techniques. J. Raman Spectrosc. 2014, 45, 238–245. [Google Scholar] [CrossRef]
  95. Neri, E.; Morvan, C.; Colomban, P.; Guerra, M.F.; Prigent, V. Late Roman and Byzantine mosaic opaque “glass-ceramics” tesserae (5th–9th century). Ceram. Int. 2016, 42, 18859–18869. [Google Scholar] [CrossRef] [Green Version]
  96. Caggiani, M.C.; Barone, G.; de Ferri, L.; Laviano, R.; Mangone, A.; Mazzoleni, P. Raman and SEM-EDS insights into technological aspects of Medieval and Renaissance ceramics from Southern Italy. J. Raman Spectrosc. 2021, 52, 186–198. [Google Scholar] [CrossRef]
  97. Gratuze, B.; Pactat, I.; Schibille, N. Changes in the signature of cobalt colorants in Late Antique and Early Islamic glass production. Minerals 2018, 8, 225. [Google Scholar] [CrossRef] [Green Version]
  98. Li, Z.; Zhang, F. On the technical aspects of Tang sancai. In Scientific and Technological Insights on Ancient Chinese Pottery and Porcelain; Science Press: Beijing, China, 1986; pp. 69–76. [Google Scholar]
  99. Chen, Y.; Zhang, F.; Zhang, X.; Jiang, J.; Li, D. A study on Tang blue and white wares and sources of cobalt pigments used. In Science and Technology of Ancient Ceramics 3 Proceedings of the International Symposium; Guo, J., Ed.; Shanghai Research Society of Science and Technology of Ancient Ceramics: Shanghai, China, 1995; pp. 204–210. (In Chinese) [Google Scholar]
  100. Feng, X.M. Céramiques Chinoises, 1st ed.; Shanghai Chinese Classic Publishing House: Shanghai, China, 2006. (In Chinese) [Google Scholar]
  101. Sun, X.; Liu, Y.; Zhao, Z.; Guo, M.; Bao, M.; Zhao, J.; Tian, J.; Zhang, J.; Shen, L.; Zhou, Y.; et al. Les fouilles du four de Huangye dans le comté de Gong (Henan Province). Huaxia Archaeol. 2007, 4, 106–192. (In Chinese) [Google Scholar]
  102. Wood, N.; Tite, M.S.; Doherty, C.; Gilmore, B. A technological examination of ninth-tenth century AD Abbasid blue-and-white ware from Iraq, and its comparison with eighth century AD Chinese blue-and-white sancai ware. Archaeometry 2007, 40, 665–684. [Google Scholar] [CrossRef]
  103. Tite, M.; Watson, O.; Pradell, T.; Matin, M.; Molina, G.; Domoney, K.; Bouquillon, A. Revisiting the beginnings of tin-opacified Islamic glazes. J. Archaeol. Sci. 2015, 57, 80–91. [Google Scholar] [CrossRef] [Green Version]
  104. Spataro, M.; Wood, N.; Meeks, N.; Meek, A.; Priestman, S. Pottery technology in the Tang dynasty (ninth century AD): Archaeometric analyses of a Gongyi sherd found at Siraf, Iran. Archaeometry 2019, 61, 574–587. [Google Scholar] [CrossRef]
  105. Fontaine, S.D.; Foy, D. L’épave Ouest-Embiez 1, Var: Le commerce maritime du verre brut et manufacture en Méditerranée occidentale dans l’Antiquité. Rev. Archéol. Narbonnaise 2007, 40, 235–265. [Google Scholar] [CrossRef]
  106. Gratuze, B. Provenance analysis of glass artefacts. Ch. 5.1. In Modern Methods for Analysing Archaeological and Historical Glass. 2 Volumes; Janssens, K., Ed.; John Wiley and Sons Ltd.: Chichester, UK, 2013; pp. 311–343. [Google Scholar]
  107. Theophrastus (originally 310 BCE). In Recherches sur les Plantes. Le Livre des Pierres, Athènes V; Les Belles Lettres: Paris, France, 2006.
  108. Plinius (originally 77 CE). In Naturalis Historia, XII-XXXVII; Veuve Desaint: Paris, France, 1771.
  109. Olmer, L.-J. Rapport sur une Mission Scientifique en Perse; Imprimerie Nationale: Paris, France, 1908; pp. 49–61. [Google Scholar]
  110. Schindler, A.H. Eastern Persian Irak; John Murray: London, UK, 1897. [Google Scholar]
  111. De Rochechouart, J. Souvenirs d’un Voyage en Perse; Challamel Ainé: Paris, France, 1867. [Google Scholar]
  112. Afshār, Ī. Javāhir-nāme-ye Nizāmī, the source of Tansūkh-nāma and Arāyis al-Javāhir. Yaghmā Mag. 1971, 271, 35–42. [Google Scholar]
  113. Binesh, M.T. 1447: Javāhir-nāma. Farhang-i Īrānzamīn 1965, 12, 273–297. [Google Scholar]
  114. Kalāntar Zarrābi, A.R. History of Kāshān, Afshār, Ī; Amir Kabir Publications: Tehran, Iran, 1999. [Google Scholar]
  115. Manşur, M. 1454–1478: Gawhar-nāma, Sutūda, M. Farhang-i Īrānzamīn 1956, 4, 185–287. [Google Scholar]
  116. Father d’Entrecolles. Lettre du Père d’Entrecolles, Missionnaire de la Compagnie de Jésus sur la Porcelaine, au Père Orry de la même Compagnie, 1er Sept. 1712 and 25 Janvier 1722. In Lettres Édifiantes et Curieuses de Chine par des Missionnaires Jésuites (1702–1776); Le Clerc, N., Ed.; Saint-Jacques: Paris, France, 1712; Volume X, pp. 365–376. Available online: https://gallica.bnf.fr/ark:/12148/bpt6k106074r.image (accessed on 15 February 2021).
  117. Fitzhugh, E.W.; Floor, W.M. Cobalt, Encyclopaedia Iranica; Encyclopædia Iranica Foundation, Inc.: New York, NY, USA, 1992; Volume V, pp. 873–875. [Google Scholar]
  118. Fitzhugh, E.W. Artists Pigments Handbook. Their History and Characterization; National Gallery of Art: Washington, DC, USA, 1997. [Google Scholar]
  119. Parker, J.M.; Martlew, D. Stained glass windows, ch. 10.8. In Encyclopedia of Glass Science, Technology, History, and Culture; Richet, P., Ed.; John Wiley and Sons, Inc.: Hoboken, NJ, USA, 2021. [Google Scholar]
  120. Pope, J.A. Chinese Porcelain from Ardabil; Smithsonian Institute: Washington, DC, USA, 1956; Volume II, p. 84. [Google Scholar]
  121. Wang, S.M. Kui Tian Wai Cheng; 1589. (In Chinese) [Google Scholar]
  122. Finlay, R. The Pilgrim Art. Culture of Porcelain in World History; California Press: Berkley, NC, USA, 2010. [Google Scholar]
  123. Tian, Y.H. Liu Qing Ri Zha (Miscellanei on Precious Works of Art); Shanghai Classics Publishing House: Shanghai, China, 1600; republished 1995. [Google Scholar]
  124. Watt, J.C.Y. Notes on the use of cobalt in later Chinese ceramics. Ars Orient. 1979, 11, 63–85. [Google Scholar]
  125. Wen, R.; Wang, C.S.; Mao, Z.W.; Huang, Y.Y.; Pollard, A.M. The chemical composition of blue pigment on Chinese blue-and-white porcelain of the Yuan and Ming Dynasties (AD 1271–1644). Archaeometry 2007, 49, 101–115. [Google Scholar] [CrossRef]
  126. Huang, S.-Z. Xi Yang Chao Gong Dian Lu (Registration of Taxes from Foreign Countries); Zhong wai jiao tong shi ji cong kan Series; 1520. (In Chinese) [Google Scholar]
  127. Medley, M. The Chinese Potter. A Practical History of Chinese Ceramics, 3rd ed.; Phaidon: London, UK, 1999. [Google Scholar]
  128. Yu, K.N.; Miao, J.M. Non-destructive analysis of Jingdezhen Blue and White porcelains of the Ming dynasty using EDXRF. X-ray Spectrom. 1996, 25, 281–285. [Google Scholar] [CrossRef]
  129. Guy, J. Early ninth-century Chinese export ceramics and the Persian Gulf connection: The Belitung shipwreck evidence. Taoci 2005, 4, 9–20. [Google Scholar]
  130. Wei, Z. L’archéologie sous-marine en Chine. Taoci 2001, 2, 21–26. [Google Scholar]
  131. Carswell, J. Two unexplored wrecks of the 14th Century in the Red Sea and off Sri Lanka. Taoci 2001, 2, 51–61. [Google Scholar]
  132. Crick, M. Les céramiques chinoises, vietnamiennes et thailandaises de la jonque de Lena, fin XVe siècle. Taoci 2001, 2, 71–85. [Google Scholar]
  133. Lam, P.Y.K. Dating criteria for Chinese Blue and Whites of the mid to late 15th century from shipwrecks. Taoci 2001, 2, 35–46. [Google Scholar]
  134. Bound, M. Aspects of the Hoi An wreck: Dishes, bottles, statuettes and chronology. Taoci 2001, 2, 95–103. [Google Scholar]
  135. Estehuizen, L.V. History written in porcelain sherds. Taoci 2001, 2, 111–116. [Google Scholar]
  136. Jörg, C. The porcelain of the Vung Tau Junk. Taoci 2001, 2, 117–122. [Google Scholar]
  137. Colomban, P.; Liem, N.Q.; Sagon, G.; Tinh, H.X.; Hoành, T.B. Microstructure, composition and processing of 15th century Vietnamese porcelains and celadons. J. Cult. Herit. 2003, 4, 187–197. [Google Scholar] [CrossRef]
  138. Wood, N. Chinese Glazes: Their Chemistry, Origins, and Recreation; University of Pennsylvania Press: Philadelphia, PA, USA, 1999; Volume 2. [Google Scholar]
  139. Tai, Y.S.; Daly, P.; Mckinnon, E.E.; Parnell, A.; Feener, R.M.; Majewski, J.; Ismail, N.; Sieh, K. The impact of Ming and Qing dynasty maritime bans on trade ceramics recovered from coastal settlements in northern Sumatra, Indonesia. Archaeol. Res. Asia 2020, 21, 100174. [Google Scholar] [CrossRef]
  140. Colomban, P.; Zhang, Y.Z.; Zhao, B. Non-invasive Raman analyses of Chinese huafalang and related porcelain wares. Searching for evidence for innovative pigment technologies. Ceram. Int. 2017, 43, 12079–12088. [Google Scholar] [CrossRef] [Green Version]
  141. Colomban, P.; Ambrosi, F.; Ngo, A.T.; Lu, T.A.; Feng, X.L.; Chen, S.; Choi, C.L. Comparative analysis of wucai Chinese porcelains using mobile and fixed Raman microspectrometers. Ceram. Int. 2017, 43, 14244–14256. [Google Scholar] [CrossRef] [Green Version]
  142. Colomban, P.; Kirmizi, B.; Zhao, B.; Clais, J.B.; Yang, Y.; Droguet, V. Investigation of the Pigments and Glassy Matrix of Painted Enamelled Qing Dynasty Chinese Porcelains by Non-invasive On-site Raman Microspectrometry. Heritage 2020, 3, 915–940. [Google Scholar] [CrossRef]
  143. Colomban, P.; Kirmizi, B.; Zhao, B.; Clais, J.B.; Yang, Y.; Droguet, V. Non-invasive On-site Raman Study of Pigments and Glassy Matrix of 17th–18th-Century Painted Enamelled Chinese Metal Wares: Comparison with French Enamelling Technology. Coatings 2020, 10, 471. [Google Scholar] [CrossRef]
  144. Montanari, R.; Alberghina, M.F.; Casanova Municchia, A.; Massa, E.; Pelagotti, A.; Pelosi, C.; Schiavone, S.; Sodo, A. A polychrome Mukozuke (1624–1644) porcelain offers a new hypothesis on the introduction of European enameling technology in Japan. J. Cult. Herit. 2018, 32, 232–237. [Google Scholar] [CrossRef]
  145. Montanari, R.; Murakami, N.; Alberghina, M.F.; Pelosi, C.; Schiavone, S. The Origin of overglaze-blue enameling in Japan: New discoveries and a reassessment. J. Cult. Herit. 2019, 37, 94–102. [Google Scholar] [CrossRef]
  146. Montanari, R.; Murakami, N.; Colomban, P.; Alberghina, M.F.; Pelosi, C.; Schiavone, S. European ceramic technology in the Far East: Enamels and pigments in Japanese art from the 16th to the 20th century and their reverse influence on China. Herit. Sci. 2020, 8, 48. [Google Scholar] [CrossRef]
  147. Giannini, R.; Freestone, I.C.; Shortland, A.J. European cobalt sources identified in the production of Chinese famille rose porcelain. J. Archaeol. Sci. 2017, 80, 27–36. [Google Scholar] [CrossRef] [Green Version]
  148. Wang, Q.; Chin, L.; Wang, C. Underglaze Blue and Red: Elegant Decoration on Porcelain of Yuan, Ming and Qing; Multi-Art: Hong Kong, China, 1993. [Google Scholar]
  149. Valmont de Bomare, M. Minéralogie, ou Nouvelle Exposition du Règne Minéral, 2nd ed.; Vincent Imprimeur-Libraire: Paris, France, 1774; pp. 76–96. [Google Scholar]
  150. Agricola, G. De Re Metallica; Froben: Basel, Switzerland, 1556. [Google Scholar]
  151. Andrews, R.W. Cobalt. In Overseas Geological Surveys. Minerals Resources Division; Her Majesty’s Stationery Office: London, UK, 1962. [Google Scholar]
  152. Dehaine, Q.; Tijsseling, L.T.; Glass, H.J.; Törmanen, T.; Butcher, A.R. Geometallurgy of cobalt ores: A review. Miner. Eng. 2021, 160, 1–28. [Google Scholar] [CrossRef]
  153. Hancock, R.G.V.; McKechnie, J.; Aufreiter, S.; Karklins, K.; Kapches, M.; Sempowski, M.; Moreau, J.-F.; Kenyon, I. Non-destructive analysis of European cobalt blue glass trade beads. J. Radioanal. Nucl. Chem. 2000, 244, 567–573. [Google Scholar] [CrossRef]
  154. Hancock, R.G.V. European glass trade beads in Northeastern North America, ch. 5.9. In Modern Methods for Analysing Archaeological and Historical Glass; Janssens, K., Ed.; John Wiley and Sons Ltd.: Hoboken, NJ, USA, 2013; Volume 2, pp. 459–471. [Google Scholar]
  155. Koleini, F.; Prinsloo, L.C.; Biemond, W.M.; Colomban, P.; Ngo, A.T.; Boeyens, J.; van der Ryst, M.; van Brakel, K. Unravelling the glass trade bead sequence from Magoro Hill, South Africa: Separating pre-17th-century Asian imports from later European counterparts. Herit. Sci. 2016, 4, 43. [Google Scholar] [CrossRef] [Green Version]
  156. Koleini, F.; Colomban, P.; Pikirayi, I.; Prinsloo, L.C. Glass beads, markers of ancient trade in Sub-Saharan Africa: Methodology, state of the art and perspectives. Heritage 2019, 22, 343–369. [Google Scholar] [CrossRef] [Green Version]
  157. Molera, J.; Climent-Font, A.; Garcia, G.; Pradell, T.; Vallcorba, O.; Zucchiatti, A. A study of historical processing of cobalt arsenides in XV-XVI century Europe. J. Archaeol. Sci. Rep. 2021, 36. [Google Scholar] [CrossRef]
  158. Levin, E.M.; Robbins, C.R.; McMurdie, H.F.; Reser, M.K. Phase Diagrams for Ceramists; The American Ceramic Society: Colombus, OH, USA, 1964. [Google Scholar]
  159. Barandon, J.-N.; Irigoin, J. Papiers de Hollande et papiers d’Angoumois de 1650 à 1810. Leur differentiation au moyen de l’analyse par activation neutronique. Archaeometry 1979, 21, 101–106. [Google Scholar] [CrossRef]
  160. Gratuze, B. Glass characterisation using Laser Ablation Inductively coupled Plasma Mass Spectrometry methods, Ch. 3.1. In Modern Methods for Analysing Archaeological and Historical Glass; Janssens, K., Ed.; John Wiley and Sons Ltd.: Hoboken, NJ, USA, 2013; Volume 2, pp. 201–234. [Google Scholar]
  161. Vermeulen, M.; Saverwyns, S.; Coudray, A.; Janssens, K.; Sanyova, J. Identification by Raman spectroscopy of pararealgar as a starting material in the synthesis of amorphous arsenic sulfide pigments. Dyes Pigment. 2018, 149, 290–297. [Google Scholar] [CrossRef]
  162. Zhang, F. The origin and development of traditional Chinese glazes and decorative ceramics color. In Ancient Technology to Modern Science; Kingery, W.D., Ed.; The American Ceramic Society: Colombus, OH, USA, 1985; Volume 1, pp. 163–180. [Google Scholar]
  163. Gan, F.; Li, Q.; Henderson, J. Recent Advances in the Scientific Research on Ancient Glass and Glaze; World Scientific: Singapore, 2016; Volume 2. [Google Scholar]
  164. Lankton, J.W.; Dussubieux, L. Early glass in Southeast Asia. Ch. 5.7. In Modern Methods for Analysing Archaeological and Historical Glass; Janssens, K., Ed.; John Wiley and Sons Ltd.: Hoboken, NJ, USA, 2013; Volume 2, pp. 415–443. [Google Scholar]
  165. Nakai, I.; Shindo, Y. Glass trade between the Middle East and Asia. Ch. 5.8. In Modern Methods for Analysing Archaeological and Historical Glass; Janssens, K., Ed.; John Wiley and Sons Ltd.: Hoboken, NJ, USA, 2013; Volume 2, pp. 445–457. [Google Scholar]
  166. Dussubieux, L.; Gratuze, B. Glass in South Asia. Ch. 5.6. In Modern Methods for Analysing Archaeological and Historical Glass; Janssens, K., Ed.; John Wiley and Sons Ltd.: Hoboken, NJ, USA, 2013; Volume 2, pp. 399–413. [Google Scholar]
  167. Vandiver, P.; Kingery, W.D. Variation in the microstructure and microcomposition of pre-Song, Song, and Yuan Dynasty ceramics. In Ancient Technology to Modern Science; Kingery, W.D., Ed.; The American Ceramic Society: Colombus, OH, USA, 1985; Volume 1, pp. 181–233. [Google Scholar]
  168. Yap, C.T.; Tang, S.M. X-ray fluorescence analysis of modern and recent Chinese porcelains. Archaeometry 1984, 26, 78–81. [Google Scholar] [CrossRef]
  169. Yap, C.T. A quantitative spectrometric analysis of trace concentrations of manganese and cobalt in ceramics and the significance of As/Co and Mn/Co ratios. J. Archaeol. Sci. 1988, 15, 173–177. [Google Scholar] [CrossRef]
  170. Yu, K.N.; Miao, J.M. Locating the origins of blue and white porcelains using EDXRF. Appl. Radiat. Isot. 1997, 48, 953–959. [Google Scholar] [CrossRef]
  171. Yu, K.N.; Miao, J.M. Multivariate analysis of the energy dispersive X-ray fluorescence results from blue and white Chinese porcelains. Archaeometry 1998, 40, 331–339. [Google Scholar] [CrossRef]
  172. Yu, K.N.; Miao, J.M. Characterization of blue and white porcelains using Mn/Fe ratio from EDXRF, with particular reference to porcelains of the Xuande period (1426 to 1435 A.D.). Appl. Radiat. Isot. 1999, 51, 279–283. [Google Scholar] [CrossRef]
  173. Morimoto, A.; Yamasaki, K. Technical Studies on Ancient Ceramics Found in North and Central Vietnam; Fukuoka Museum: Fukuoka, Japan, 2001. [Google Scholar]
  174. Cheng, H.S.; Zhang, B.; Xia, H.N.; Jiang, J.C.; Yang, F.J. Non-destructive analysis and appraisal of ancient Chinese porcelain by PIXE. Nucl. Instr. Meth. Phys. Res. Sect. B 2002, 190, 488–491. [Google Scholar] [CrossRef]
  175. Colomban, P.; Sagon, G.; Huy, L.Q.; Liem, N.Q.; Mazerolles, L. Vietnamese (15th Century) Blue-and-White, Tam Thai and Lustre Porcelains/Stonewares: Glaze Composition and Decoration Techniques. Archaeometry 2004, 46, 125–136. [Google Scholar] [CrossRef]
  176. Du, F.; Su, B. Further study of sources of the imported cobalt-blue pigment used on Jingdezhen porcelain from late 13 to early 15 centuries. Sci. China Ser. E Technol. Sci. 2008, 51, 249–259. [Google Scholar] [CrossRef]
  177. Figueiredo, M.; Silva, T.P.; Veiga, J.P. A XANES study of cobalt speciation state in blue-and-white glazes from 16th to 17th century Chinese porcelains. J. Electron Spectrosc. 2012, 185, 97–102. [Google Scholar] [CrossRef]
  178. Wen, R.; Pollard, A.M. The Pigment Applied to Islamic Minai Wares and the Correlation with Chinese Blue-and-White Porcelain. Archaeometry 2016, 58, 1–16. [Google Scholar] [CrossRef]
  179. Zhu, T.Q.; Zhang, Y.C.; Xiong, H.; Feng, Z.Y.; Li, Q.; Cao, B.L. Comparison of the different types of Qinghua porcelain from Jingdezhen in the Yuan Dynasty of China (AD 1271–1368) by micro X-ray fluorescence spectroscopy (µ-XRF) and microscopy. Archaeometry 2016, 58, 966–978. [Google Scholar] [CrossRef]
  180. Jiang, X.C.; Weng, Y.J.; Wu, X.H.; Cui, J.F.; Lyu, H.S.; Jiang, J.X.; Song, G.D.; Jin, H.; Qin, D.S.; Wang, C.S. Early globalized industrial chain revealed by residual submicron pigment particles in Chinese imperial blue-and-white porcelains. Proc. Natl. Acad. Sci. USA 2020, 117, 6446–6452. [Google Scholar] [CrossRef]
  181. Wen, J.; Chen, Z.; Zeng, Q.; Hu, L.; Wang, B.; Shi, J.; Zhang, G. Multi-microanalytical studies of blue-and-white porcelain (Ming dynasty) excavated from Shuangchuan island. Ceram. Int. 2019, 45, 13362–13368. [Google Scholar] [CrossRef]
  182. Xu, W.; Niziolek, L.C.; Feinman, G.M. Sourcing qingbai porcelains from the Java Sea Shipwreck: Compositional analysis using portable XRF. J. Archaeol. Sci. 2019, 103, 57–71. [Google Scholar] [CrossRef]
  183. Van Pevenage, J.; Lauwers, D.; Herremans, D.; Verhaeven, E.; Vekemans, B.; de Clercq, W.; Vincze, L.; Moens, L.; Vandenabeele, P. A combined spectroscopic study on Chinese porcelain containing ruan-cai colours. Anal. Meth. 2014, 6387–6394. [Google Scholar]
  184. Arberet, L. On-Site Raman Analysis of 17th and 18th Century Limoges Enamels: Comparison with Chinese Enamels, 2016, unpublished MSc report.
  185. Dias, M.I.; Rodrigues, A.L.; Kovacs, I.; Szokefalvi-Nagy, Z.; Prudencio, M.I.; Kasztovszky, Z.; Maroti, B.; Marques, R.; Flor, P.; Cardoso, G. Chronological assessment of della Robbia sculptures by using PIXE, neutrons and luminescence techniques. Nucl. Instr. Meth. Phys. Res. Section B Beam Inter. Mater. Atoms 2020, 477, 77–79. [Google Scholar] [CrossRef]
  186. Gill, M.S.; Rehren, T. Material characterization of ceramic tile mosaic from two 17th-century Islamic monuments in Northern India. Archaeometry 2011, 53, 22–36. [Google Scholar] [CrossRef]
  187. Constantinescu, B.; Cristea-Stan, D.; Kovacs, I.; Szokefalvi-Nagy, Z. External milli-beam PIXE analysis of the mineral pigments of glazed Iznik (Turkey) ceramics. Period. Mineral. 2014, 83, 159–169. [Google Scholar]
  188. Neri, E.; Gratuze, B.; Schibille, N. The trade of glass beads in early medieval Illyricum: Towards an Islamic monopoly. Archaeol. Anthropol. Sci. 2019, 11, 1107–1122. [Google Scholar] [CrossRef] [Green Version]
  189. Koch, J.; Günther, D. Review of the state-of-the-art of laser ablation inductively coupled plasma mass spectrometry. Appl. Spectrosc. 2011, 65, 155A–162A. [Google Scholar] [CrossRef]
  190. Degryse, P.; Henderson, J.; Hodgins, G. Isotopes in Vitreous Materials; Leuven University Press: Leuven, Belgium, 2009. [Google Scholar]
  191. Abe, Y.; Harimoto, R.; Kikugawa, T.; Yazawa, K.; Nishisaka, A.; Kawai, N.; Yoshimura, S.; Nakai, I. Transition in the use of cobalt-blue colorant in the New Kingdom of Egypt. J. Archaeol. Sci. 2012, 39, 1793–1808. [Google Scholar] [CrossRef]
  192. Gianni, L.; Renel, H.; Kremenovic, A.; Colomban, P. ‘Blue-’ and ‘Brown-speckled’ pottery from Qalhât, the Sultanate of Oman (13th–16th centuries): Comparison with traditional Omani 19–20 century productions. Bull. Soc. Esp. Ceramica Vidrio 2020. [Google Scholar] [CrossRef]
  193. Colomban, P.; Treppoz, F. LADIR CNRS Report, 2004, Thiais, France (unpublished).
  194. Kitada, M.; Chang, D.S. Microstructures of cobalt blue enamel of first Imari porcelain made in the early 17th century (the first Edo Era). J. Japan Inst. Metals 2008, 72, 483–490. [Google Scholar] [CrossRef]
  195. Coutinho, M.L.; Muralha, V.S.F.; Mirao, J.; Veiga, J.P. Non-destructive characterization of oriental porcelain glazes and blue underglaze pigments using mu-EDXRF, mu-Raman and VP-SEM. Appl. Phys. A Mater. Sci. Process. 2014, 114, 695–703. [Google Scholar] [CrossRef]
  196. Geng, B.C. Identification of Porcelain of Ming and Qing Dynasties; Zi Jin Cheng Publishing House: Beijing, China, 1993. [Google Scholar]
  197. Wang, Q.Z. The producing area of blue pigment. Chin. Cult. Relics 1982, 8, 59–64. [Google Scholar]
  198. Chen, Y.C. An investigation on Chinese blue-and-white ware and its blue pigment. J. Chin. Ceram. Soc. 1978, 6, 225–241. [Google Scholar]
  199. Wu, J.; Li, J.Z.; Deng, Z.Q.; Wang, C.S. Dating research on blue-and-white porcelain of Jingdezhen official kiln. Sci. China Ser. E Eng. Mater. Sci. 2004, 34, 516–524. [Google Scholar]
  200. Bao, Z.A.; Yuan, H.L.; Wen, R.; Chen, K.Y. The fast and direct characterization of blue-and-white porcelain glaze from Jingdezhen by laser ablation-inductively coupled plasma mass spectrometry. Anal. Methods 2015, 7, 5034–5040. [Google Scholar] [CrossRef]
  201. Mazogray, V.; Alvarez, M. X-ray-Fluorescence characterization of Ming-Dynasty porcelain recued from a Spanish shipwreck. Archaeometry 1992, 34, 37–42. [Google Scholar] [CrossRef]
  202. Pinto, A.; Groenen, J.; Zhao, B.; Zhu, T.; Sciau, P. Chromogenic mechanisms in blue-and-white porcelain. J. Eur. Ceram. Soc. 2020, 40, 6181–6187. [Google Scholar] [CrossRef]
  203. Pinto, A.; Sciau, P.; Zhu, T.; Zhao, B.; Groenen, J. Raman study of Ming porcelain dark spots: Probing Mn-rich spinels. J. Raman Spectrosc. 2019, 50, 711–719. [Google Scholar] [CrossRef]
  204. Pinto, A. Microstructure et procédés techniques des porcelains qinghua: Une approche de type Science des Matériaux. Ph.D. Thesis, Université de Toulouse, Toulouse, France, 10 October 2019. Available online: http://www.theses.fr/2019TOU30183 (accessed on 5 January 2021).
  205. Panighello, S.; Kavcic, A.; Vogel-Mikus, K.; Tennent, N.H.; Wallert, A.; Hocevar, S.B.; van Elteren, J.T. Investigation of smalt in cross-section of 17th century paintings using elemental mapping by laser ablation ICP-MS. Microchem. J. 2016, 125, 105–115. [Google Scholar] [CrossRef]
  206. Santopadre, P.; Verità, M. A study of smalt and its conservation problems in two sixteenth-century wall paintings in Rome. Stud. Conserv. 2006, 51, 29–40. [Google Scholar] [CrossRef]
  207. Robinet, L.; Spring, M.; Pages-Camagna, S. Investigation of the discoloration of smalt pigment in historic paintings by micro-X-ray Absorption Spectroscopy at the Co K-edge. Anal. Chem. 2011, 83, 5145–5152. [Google Scholar] [CrossRef] [PubMed]
  208. Zlamalova Cilova, Z.; Gelnar, M.; Randakova, S. Smalt production in the ore mountains: Characterization of samples related to the production of blue pigment in Bohemia. Archaeometry 2020, 62, 1202–1215. [Google Scholar] [CrossRef]
  209. Mimoso, J.M. Origin, early history and technology of the blue pigment in azulejos. In Proceedings of the GlazeArch2015, Lisbon, Portugal, 2–3 July 2015; pp. 357–376. Available online: http://azulejos.lnec.pt/AzuRe/links/07%20Origin_of_blue_pigment.pdf (accessed on 20 January 2021).
  210. Horschik, J. Beiträge zur Geschichte der Kobaltfarbe und ihre Verwendung in der Keramik (Contributions to the history of the cobalt colour and its use in ceramics). Keramos 1979, 85, 119–142. [Google Scholar]
  211. Hammer, P. Das Sächsische Blaufarbenwesen und der Handel mit Kobaltfarben –nach Unterlagen der Bücherei der Bergakademie Freiberg (The Saxony blue pigment and the trade in the cobalt colour—According to documents in the library of the Bergakademie of Freiberg). In Proceedings of the VII International Symposium Cultural Heritage in Geosciences, Leiden, The Netherlands, 19–23 May 2003; Winkler Prins & Donovan: Veendam, The Netherlands, 2004. [Google Scholar]
  212. De Gruijl, M. Zaans Blauw-Van Zaffer Tot Smalt Naar Ultramarijn (Zaan Blue—From Zaffre to Smalt to Ultramarine; unpublished.
  213. Lehmann, D.J. Cadmiologia oder Geschichte des Farben-Kobolds; Woltersdorfs G.L. Wwe: Königsberg, Russia, 1761. [Google Scholar]
  214. Colomban, P.; Etcheverry, J.-P.; Asquier, M.; Bounichou, M.; Tournié, A. Raman identification of ancient stained glass and their degree of deterioration. J. Raman Spectrosc. 2006, 37614–37626. [Google Scholar]
  215. Colomban, P.; Tournié, A. On-site Raman identification and dating of ancient/modern stained glasses at the Sainte-Chapelle, Paris. J. Cult. Herit. 2007, 8, 242–256. [Google Scholar] [CrossRef]
  216. Kunckel, J. Ars Vitriaria Experimentalis; (self-published), Frankfurt am Main and Leipzig, Germany; 1689. [Google Scholar]
  217. Biron, I.; Chopinet, M.-H. Colouring, decolouring and opacifying of glass. Ch. 1.3. In Modern Methods for Analysing Archaeological and Historical Glass; John Wiley and Sons Ltd.: Chichester, UK, 2013; Volume 2. [Google Scholar]
  218. Bertran, H.; Reboulleau; Magnier; Romain, A. Nouveau Manuel Complet de la Peinture sur Verre, sur Porcelaine et sur Émail; Encyclopédie-Roret, L. Mulo: Paris, France, 1913. [Google Scholar]
  219. Colomban, P.; Lu, T.-A.; Milande, V. Non-invasive on-site Raman study of blue-decorated early soft-paste porcelain: The use of arsenic-rich (European) cobalt ores—Comparison with huafalang Chinese porcelains. Ceram. Int. 2018, 44, 9018–9026. [Google Scholar] [CrossRef]
  220. Colomban, P.; Sagon, G.; Faurel, X. Differentiation of antique ceramics from the Raman spectra of their coloured glazes and paintings. J. Raman Spectrosc. 2001, 32, 351–360. [Google Scholar] [CrossRef]
  221. Colomban, P. Polymerization degree and Raman identification of ancient glasses used for jewellery, ceramic enamels and mosaics. J. Non-Crystall. Solids 2003, 323, 180–187. [Google Scholar] [CrossRef]
  222. Colomban, P.; Paulsen, O. Non-destructive Raman Determination of the Structure and Composition of Glazes by Raman Spectroscopy. J. Amer. Ceram. Soc. 2005, 88, 390–395. [Google Scholar] [CrossRef]
  223. Colomban, P.; Tournié, A.; Bellot-Gurlet, L. Raman identification of glassy silicates used in ceramic, glass and jewellery: A tentative differentiation guide. J. Raman Spectrosc. 2006, 37, 841–852. [Google Scholar] [CrossRef] [Green Version]
  224. Colomban, P. Non-destructive raman analysis of ancient glasses and glazes. In Modern Methods for Analysing Archaeological and Historical Glass, 1st ed.; Janssens, K., Ed.; John Wiley and Sons Ltd.: London, UK, 2012; pp. 275–300. [Google Scholar]
  225. Labet, V.; Colomban, P. Vibrational properties of silicates: A cluster model able to reproduce the effect of “SiO4” polymerization on Raman intensities. J. Non-Crystall. Solids 2013, 370, 10–17. [Google Scholar] [CrossRef] [Green Version]
  226. Foster, N.F.; Wozniakiewicz, P.J.; Price, M.C.; Kearsley, A.T.; Burchell, M.J. Identification by Raman spectroscopy of Mg–Fe content of olivine samples after impact at 6 km s−1 onto aluminium foil and aerogel: In the laboratory and in Wild-2 cometary samples. Geochim. Cosmochim. Acta 2013, 121, 1–14. [Google Scholar] [CrossRef] [Green Version]
  227. D’Ippolito, V.; Andreozzi, G.B.; Bersani, D. Raman fingerprint of chromate, aluminate and ferrite spinels. J. Raman Spectrosc. 2015, 46, 1255–1264. [Google Scholar] [CrossRef]
  228. Cvejic, Z.; Rakic, S.; Kremenovic, A.; Antic, B.; Jovalekic, C.; Colomban, P. Nanosize ferrites obtained by ball milling: Crystal structure, cation distribution, size-strain analysis and Raman investigations. Solid State Sci. 2006, 8, 908–915. [Google Scholar] [CrossRef]
  229. Vucinic-Vasic, M.; Antic, B.; Kremenovic, A.; Nikolic, A.S.; Stoiljkovic, M.; Bibic, N.; Spasojevic, V.; Colomban, P. Zn,Ni ferrite/NiO nanocomposite powder obtained from acetylacetonato complexes. Nanotechnology 2006, 17, 4877–4884. [Google Scholar] [CrossRef]
  230. Fornacelli, C.; Colomban, P.; Turbanti Memmi, I. Toward a Raman/FORS discrimination between Art Nouveau and contemporary stained glasses from CdSxSe1-x nanoparticles signatures. J. Raman Spectrosc. 2015, 46, 1129–1139. [Google Scholar] [CrossRef]
  231. Machado, A.; Vilarigues, M. Cobalt blue-reproduction and characterisation of blue enamel recipes from The Handmaid to the Arts by Robert Dossie. Glass Technol. Eur. J. Glass Sci. Technol. Part. A 2016, 57, 131–140. [Google Scholar] [CrossRef]
  232. Fermo, P.; Andreoli, M.; Bonizzoni, L.; Fantauzzi, M.; Giubertoni, G.; Ludwig, N.; Rossi, A. Characterisation of Roman and Byzantine glasses from the surroundings of Thugga (Tunisia): Raw materials and colours. Microchem. J. 2016, 129, 5–15. [Google Scholar] [CrossRef] [Green Version]
  233. Fischer, C.; Hsieh, E. Export Chinese blue-and-white porcelain: Compositional analysis and sourcing using non-invasive portable XRF and reflectance spectroscopy. J. Archaeol. Sci. 2017, 80, 14–26. [Google Scholar] [CrossRef]
  234. Maltoni, S.; Silvestri, A. A Mosaic of Colors: Investigating Production Technologies of Roman Glass Tesserae from Northeastern Italy. Minerals 2018, 8, 255. [Google Scholar] [CrossRef] [Green Version]
  235. Fornacelli, C.; Ceglia, A.; Bracci, S.; Vilarigues, M. The role of different network modifying cations on the speciation of the Co2+ complex in silicates and implication in the investigation of historical glasses. Spectrochim. Acta Part. A Mol. Biomol. Spectrosc. 2018, 188, 507–515. [Google Scholar] [CrossRef]
  236. Janssens, K.; van der Snickt, G.; Alfeld, M.; Noble, P.; van Loon, A.; Delaney, J.; Conover, D.; Zeibel, J.; Dik, J. Rembrandt’s ‘Saul and David’ (c. 1652): Use of multiple types of smalt evidenced by means of non-destructive imaging. Microchem. J. 2016, 126, 515–523. [Google Scholar] [CrossRef] [Green Version]
  237. Vieira Ferreira, L.F.; Ferreira Machado, I.; Ferraria, A.M.; Casimiro, T.M.; Colomban, P. Portuguese tin-glazed earthenware from the 16th century: A spectroscopic characterization of pigments, glazes and pastes. Appl. Surf. Sci. 2013, 285, 144–152. [Google Scholar] [CrossRef]
  238. Visinescu, D.; Paraschiv, C.; Ianculescu, A.; Jurca, B.; Vasile, B.; Carp, O. The environmentally benign synthesis of nanosized CoxZn1−xAl2O4 blue pigments. Dyes Pigment. 2010, 87, 125–131. [Google Scholar] [CrossRef]
  239. Shim, J.; Venkata Reddy, C.; Sarma, G.V.S.S.; Narayana Murthy, P.; Ravikumar, R.V.S.S.N. Effect of Co2+ and Ni2+-doped zinc borate nano crystalline powders by co-precipitation method. Spectrochim. Acta Part. A Mol. Biomol. Spectrosc. 2015, 142, 279–285. [Google Scholar] [CrossRef] [PubMed]
  240. Ward, R. Gilded and Enamelled Glass from the Middle East; BMP: London, UK, 1998. [Google Scholar]
  241. Carboni, S. Glass from Islamic Lands, The Al-Sabah Collection at the Kuwait National Museum; Thames & Hudson: London, UK, 2001. [Google Scholar]
  242. Hess, C. The Arts of Fire—Islamic Influences on Glass and Ceramics of the Italian Renaissance; J. Paul Getty Museum: Los Angeles, CA, USA, 2004. [Google Scholar]
  243. Ricciardi, P.; Colomban, P.; Tournié, A.; Milande, V. Nondestructive on-site identification of ancient glasses: Genuine artefacts, embellished pieces or forgeries? J. Raman Spectrosc. 2009, 40, 604–617. [Google Scholar] [CrossRef]
  244. Barrelet, J. Porcelaines de verre en France: Des secrets de Bernard Perrot aux recherches scientifiques de Réaumur. Cahiers de la Céramique, du Verre et des Arts du feu: Sèvres. 1964, 36, 254–265. [Google Scholar]
  245. Bellanger, J. Verre d’Usage et de Prestige—France, 1500–1800; Editions De l’amateur: Paris, France, 1988. [Google Scholar]
  246. Bénard, J.; Dragesco, B. Bernard Perrot et les Verreries Royales du Duché d’Orléans, 1662–1754; Editions des Amis du Musée d’Orléans: Orléans, France, 1989; pp. 55–66. [Google Scholar]
  247. Maitte, C. Artisans, Industrie, Nouvelles Révolutions du Moyen Âge à nos Jours, Cahiers d’Histoire et de Philosophie des Sciences n. 52; Coquery, N., Hilaire-Perez, L., Sallmann, L., Verna, C., Eds.; SFHST-ENS Editions: Paris, France, 2004; pp. 341–353. [Google Scholar]
  248. Page, J.-A. Beyond Venice-Glass in Venetian Style 1500–1750; The Corning Museum of Glass: New York, NY, USA, 2004. [Google Scholar]
  249. Geyssant, J. (Ed.) Bernard Perrot (1640–1709), Secrets et Chefs D’œuvre des Verreries Royales D’Orléans; Catalogue, Musée des Beaux-Arts d’Orléans—SOMOGY Editions d’Arts: Paris, France, 2013. [Google Scholar]
  250. Biron, I.; Gratuze, B.; Pistre, S.; Lehuede, P. Etude en laboratoire d’objets en verre attribués à Bernard Perrot. In Proceedings of the 25ème rencontres de l’AFAV, Orléans (FRANCE), bulletin de l’AFAV 2011, Orleans, France, 28–29 May 2011; pp. 19–26. [Google Scholar]
  251. Geyssant, J. Secret du Verre Rouge Transparent de Bernard Perrot et Comparaison Avec Celui de Johann Kunckel, in Bernard Perrot (1640–1709), Secrets et Chefs d’œuvre des Verreries Royales D’Orléans; Catalogue, Musée des Beaux-Arts d’Orléans—SOMOGY Editions d’Arts: Paris, France, 2013; pp. 51–66. [Google Scholar]
  252. Colomban, P.; Kirmizi, B. Non-invasive on-site Raman study of polychrome and white enamelled glass artefacts in imitation of porcelain assigned to Bernard Perrot and his followers. J. Raman Spectrosc. 2020, 51, 133–146. [Google Scholar] [CrossRef]
  253. Verità, M. Venetian soda glass.Ch. 6.2. In Modern Methods for Analysing Archaeological and Historical Glass, 1st ed.; Janssens, K., Ed.; John Wiley & Sons Ltd.: London, UK, 2012; pp. 515–536. [Google Scholar]
  254. Janssens, K.; Cagno, S.; de Raedt, I.; Degryse, P. Transfer of glass manufacturing technology in the Sixteenth and Seventeenth Centuries from Southern to Northern Europe. Ch 6.3. In Modern Methods for Analysing Archaeological and Historical Glass, 1st ed.; Janssens, K., Ed.; John Wiley & Sons Ltd.: London, UK, 2012; pp. 535–562. [Google Scholar]
  255. Manoun, B.; Azdouz, M.; Azrour, M.; Essehli, R.; Benmokhtar, S.; El Ammari, L.; Ezzahi, A.; Ider, A.; Lazor, P. Synthesis, Rietveld refinements and Raman spectroscopic studies of tricationic lacunar apatites Na1-xKxPb4(AsO4)3 (0 < x < 1). J. Mol. Struct. 2011, 986, 1–9. [Google Scholar]
  256. Colomban, P.; Maggetti, M.; d’Albis, A. Non-invasive Raman identification of crystalline and glassy phases in a 1781 Sèvres Royal Factory soft paste porcelain. J. Eur. Ceram. Soc. 2018, 38, 5228–5233. [Google Scholar] [CrossRef]
  257. Kremenovic, A.; Colomban, P.; Piriou, B.; Massiot, D.; Florian, P. Structural and spectroscopic characterization of the quenched hexacelsian. J. Phys. Chem. Solid. 2003, 64, 2253–2268. [Google Scholar] [CrossRef]
  258. Freeman, J.J.; Wang, A.; Kuebler, K.E.; Jolliff, B.L.; Haskin, L.A. Characterization of natural feldspars by Raman spectroscopy for future planetary exploration. Canadian Mineral. 2008, 46, 1477–1500. [Google Scholar] [CrossRef]
  259. Shirai, H.; Morioka, Y.; Nakagawa, I. Infrared and Raman spectra and lattice vibrations of some oxide spinels. J. Phys. Soc. Jpn. 1982, 51, 592–597. [Google Scholar] [CrossRef]
  260. Nakane, T.; Naka, T.; Sato, K.; Taguchi, M.; Nakayama, M.; Mitsui, T.; Matsushita, A.; Chikyow, T. Spectroscopic and crystallographic anomalies of (Co1−xZnx)Al2O4 spinel oxide. Dalton Trans. 2015, 44, 997–1008. [Google Scholar] [CrossRef]
  261. Wang, X.; Liu, Y.; Zhang, T.; Luo, Y.; Lan, Z.; Zhang, K.; Zuo, J.; Jiang, L.; Wang, R. Geometrical-Site-Dependent Catalytic Activity of Ordered Mesoporous Co-Based Spinel for Benzene Oxidation: In Situ DRIFTS Study Coupled with Raman and XAFS Spectroscopy. ACS Catal. 2017, 7, 1626–1636. [Google Scholar] [CrossRef]
  262. Froment, F.; Tournié, A.; Colomban, P. Raman identification of natural red to yellow pigments: Ochre and iron-containing ores. J. Raman Spectrosc. 2008, 39, 560–568. [Google Scholar] [CrossRef]
  263. Dejoie, C.; Sciau, P.; Li, W.; Noé, L.; Mehta, A.; Chen, K.; Luo, H.; Kunz, M.; Tamura, N.; Liu, Z. Learning from the past: Rare ε-Fe2O3 in the ancient black-glazed Jian (Tenmoku) wares. Sci. Rep. 2014, 4, 4941. [Google Scholar] [CrossRef] [Green Version]
  264. Simsek Franci, G.; Akkas, T.; Yildirim, S.; Yilmaz, S.; Birdevrim, A.-N. Characterization of a Jian-like sherd with the optical microscope, confocal Raman, wavelength-dispersive X-ray fluorescence, and portable XRF spectrometers. J. Raman Spectrosc. 2020, 51, 1343–1352. [Google Scholar] [CrossRef]
  265. Hoo, Q.; Liang, Y.; Yan, X.; Wang, X.; Cao, T.; Cao, X. Millimeter-sized flower-like clusters composed of mullite and ε-Fe2O3 on the Hare’s Fur Jian Ware. J. Eur. Ceram. Soc. 2020, 40, 4340–4347. [Google Scholar] [CrossRef]
  266. Liu, Z.; Jia, C.; Li, L.; Li, X.; Ji, L.; Wang, L.; Lei, Y.; Wei, X. The morphology and structure of crystals in Qing Dynasty purple-gold glaze excavated from the Forbidden City. J. Am. Ceram. Soc. 2018, 101, 5229–5240. [Google Scholar] [CrossRef]
  267. Guan, M.; Kang, B.; Wei, X.; Li, L.; Li, H.; Ding, Y.; Lei, Y. The microstructure of multicolor Hare’s fur glaze: The correlation between morphological and compositional characteristics and glaze color. Heritage Sci. 2021, 9, 21. [Google Scholar] [CrossRef]
  268. Zhong, D.; Guo, M.; Liu, Y.; Liu, S.; Dong, J.; Li, Q. Nondestructive analysis of iron rich porcelains excavated from Qingliangsi Site in Baofeng Country, Henan Province. Spectrosc. Spectral Anal. 2019, 1, 172–179. (In Chinese) [Google Scholar]
  269. López-Sánchez, J.; Serrano, A.; Del Campo, A.; Abuín, M.; Rodríguez de La Fuente, O.; Carmona, N. Sol-gel synthesis and micro-Raman characterization of ϵ-Fe2O3 micro- and nanoparticles. Chem. Mater. 2016, 28, 511–518. [Google Scholar] [CrossRef]
  270. Lee, S.; Xu, H. Size-Dependent Phase Map and Phase Transformation Kinetics for Nanometric Iron(III) Oxides (γ → ϵ → α Pathway). J. Phys. Chem. C. 2016, 120, 13316–13322. [Google Scholar] [CrossRef]
  271. Kusano, Y.; Fujii, T.; Takada, J.; Fukuhara, M.; Doi, A.; Ikeda, Y.; Takano, M. Epitaxial growth of ε-Fe2O3 on mullite found through studies on a traditional Japanese stoneware. Chem. Mater. 2008, 20, 151–156. [Google Scholar] [CrossRef]
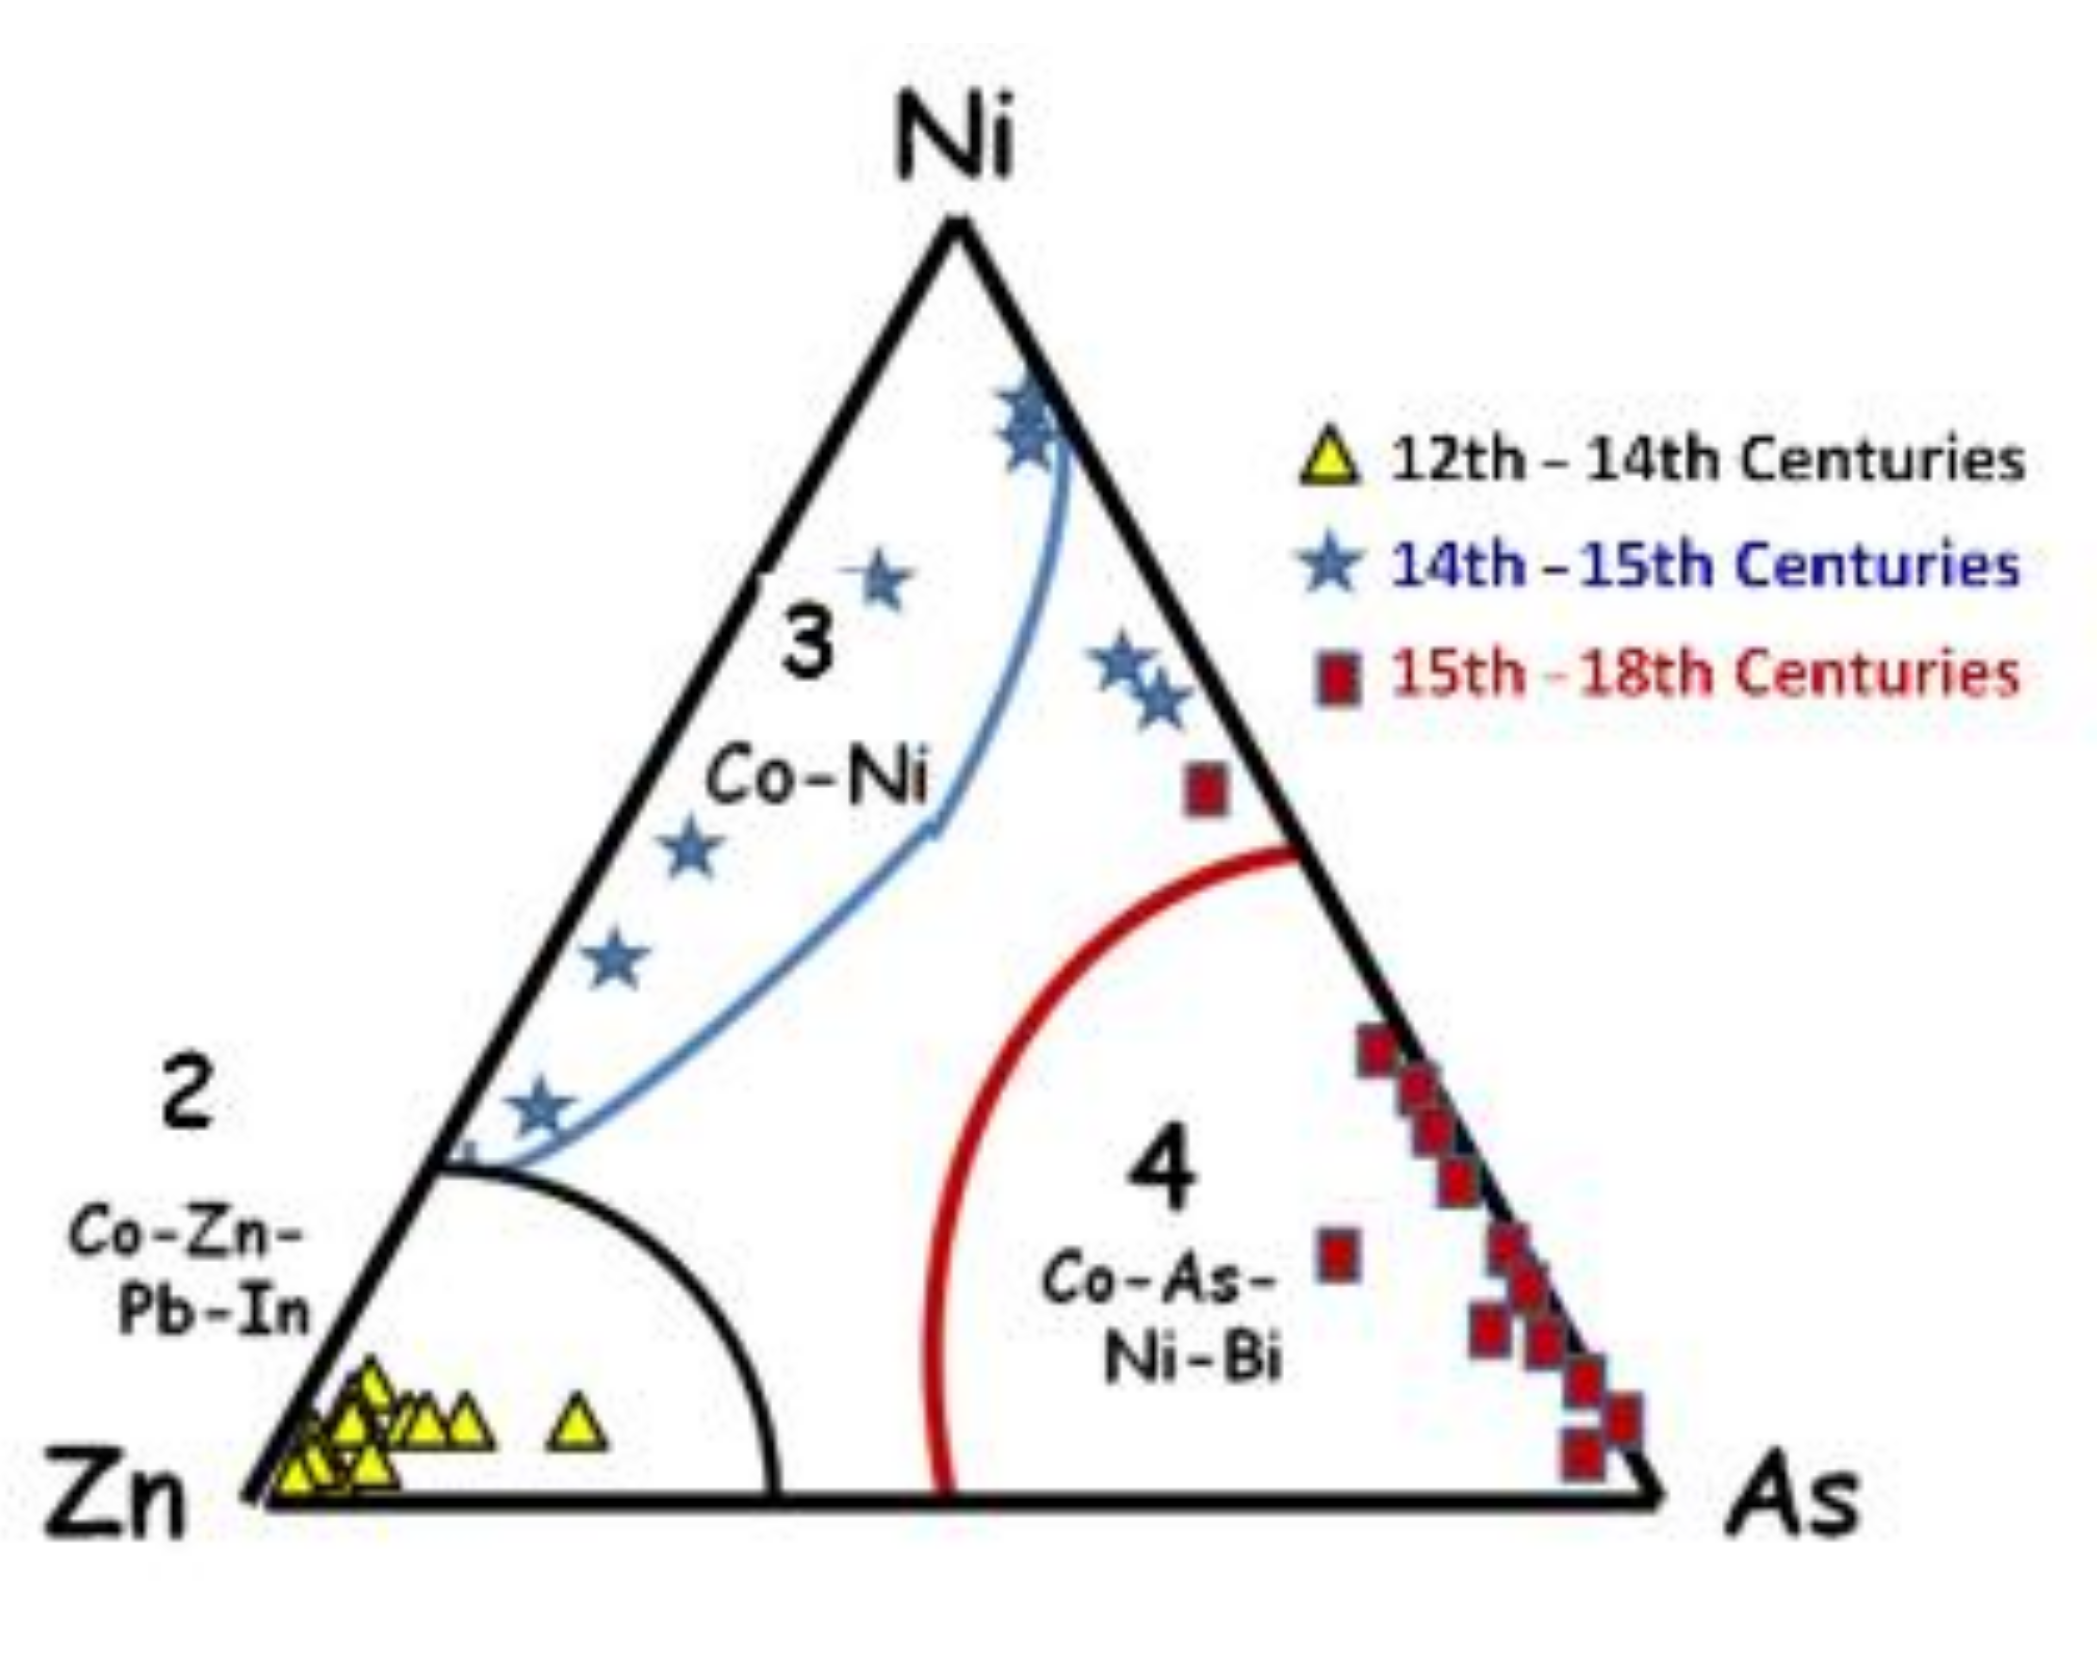
Figure 1. Variety of glassy artefacts coloured in blue and with blue décor: (a) Chinese Ming Dynasty cloisonné enamel on copper alloy (detail of a box lid); (b) Limoges enamel on copper plate; (c) 15th-Century Vietnamese blue-and-white porcelain bowl; (d) Medici porcelain bottle (16th-Century); (e) Iznik tile (16th-Century); (f) test palette on soft-paste porcelain plate (early 19th-Century); (g) Ptolemaic/Roman enamelled glass (Begram Hoard, 1st-Century BCE to 1st-Century CE); (h) ‘Façon de Venise’ glass cup (16th–17th-Centuries); (i) ‘Bernard Perrot’ glass bottle imitating porcelain (17th–18th-Centuries, Orléans, France); (j) section of a qinghua Chinese porcelain showing blue décor drawn under the glaze; (k) section of an Iznik tile showing red and blue overglazes coated on the quartz-rich slip (white), the latter being coated on the (grey) stonepaste; (l) Abbasid (9th-Century) pottery imitating Tang sancai excavated at Bassorah; (m) Khami-Indo-Pacific trade beads (15th–17th-Centuries). Collections from: Musée des arts décoratifs, Paris (a,b); Cité de la Céramique-Sèvres & Limoges (d,f,h,i); Musée des arts asiatiques-Guimet (g); Topkapi Palace Museum (k); (m) University of Pretoria; others (c,e,j,l) private collections (scale bar: 1 cm).
Minerals 11 00633 g001
Figure 2. Examples of the variety and complexity of enamelled decorations: (a) blue-and-white wall tile (Muradiye Mosque, 1435–1436, Edirne, Turkey); (b) polychrome Iznik wall tile (Selimiye Mosque, 1569–1575, Edirne); (c) detail of a painted porcelain (Jingdezhen, Qianlong reign, China, Fontainebleau Castle Collection, France); (d) detail of an Iznik tile (16th-Century); (e) enamelled and gilded décor of a Mamluk bottle (middle of 14th-Century, Egypt or Syria, OA3365, Louvre Museum Coll., France). The blazon is that of Tuquztimur, the cup-bearer of al-Malik al-Nasir al-Din Muhammad ibn Qala’un Sultan, vice-regent of Syria from 1342 to 1345; (f) details of a cloisonné vase and (g) of a painted ewer (Qianlong reign, China, Fontainebleau Castle Collection). Scale bar: 1 cm.
Minerals 11 00633 g002
Figure 3. Typical CoO content (wt.%) in Chinese glazes (after data from [162]). Tang glaze is lead-based and hence a very homogeneous glaze; Song, Yuan and Ming glazes show various hues of blue and hence varying cobalt content; Qing blue overglaze is also lead-based.
Minerals 11 00633 g003
Figure 4. Ternary diagrams of the compositional Ni, Zn and As ratios showing the Groups 2, 3 and 4 identified by Gratuze et al. [90]; glaze data are indicated with triangle, star, and square labels; glass data are used to draw the delimited areas.
Minerals 11 00633 g004
Figure 5. Ternary diagrams of the oxide compositional ratios of the transition metals in the cobalt-blue artifacts from Dahshur North (Egypt, 18th Dynasty, ca. 1450 BCE) and Northwest Saqqara (19th Dynasty, ca. 13th-Century BCE): (a) ratios of CoO, NiO, and ZnO, (b) ratios of CoO, NiO, and MnO3. Diagrams for bulk glass and faience glaze are redrawn after Abe et al. [191]. Type A is observed for faience. Types N (N1 & N2 subgroups) are from the Late/Ptolemaic/Roman periods.
Minerals 11 00633 g005
Figure 6. Comparison of the intrinsic variability measured on selected tiles with a set of measurements made on the blue areas of sherds previously excavated from Iznik tile kilns (see [22] for details) in comparison with measurements made on-site for tiles from Edirne mosques (Şah Melek Paşa (1429), Üç Şerefeli (1410–1447), Muradiye (1435–1436), Selimiye (1569–1575)) (redrawn from Demirsar Arli et al. data [25]).
Minerals 11 00633 g006
Figure 7. Comparison of the intrinsic variability measured on the 15th–16th-centuries Iznik sherds unearthed at the Iznik tile kilns excavation (green, blue, and claret red plus) and tiles from the mosques in Edirne (Şah Melek Paşa (yellow triangle), Muradiye (blue triangle), Selimiye (pink lozenge), and Üç Şerefeli (cyclamen asterisk) mosques). Data are obtained from measurements used in references [22] and [23]. Visual guidelines are drawn; numbers 3 and 4 refer to the Gratuze et al.’ groups (see Figure 4 and Table 1). Dividing by SiO2 allows for the elimination of the errors occurring due to the variable setting of the handheld pXRF instrument.
Minerals 11 00633 g007
Figure 8. Comparison of the intrinsic variability measured on Chinese and Vietnamese sherds excavated from the Qalhat site ([20,177], Sultanate of Oman, 14th–16th-Centuries), the period corresponding the Yuan-Ming transition. Visual guidelines are drawn; numbers 2, 3, and 4 refer to the Gratuze et al.’ groups (see Figure 4). The subgroups A, B, and C by referring these to Group N (N1 and N2) of Figure 5 are also identified.
Minerals 11 00633 g008
Figure 9. Comparison of the variability of Cr2O3 content measured on Chinese/Vietnamese sherds and Iznik sherds/tiles (please refer to Figure 7 and Figure 8).
Minerals 11 00633 g009
Figure 10. Examples of Raman spectra recorded with different laser excitations on lapis lazuli mineral (left, a), and lapis-lazuli-containing enamel (left, b and c) and on the glazes with a mobile 532 nm set-up, the blue areas of a European soft-paste porcelain (centre, b) and a Vietnamese hard-paste porcelain (right, c); the glaze of the oldest prepared (soft-paste) porcelain in Europe (Poterat Factory, Rouen circa 1680, Sèvres Cité de la Céramique collection) is lead-based with a characteristically strong 980 cm−1 SiO4 stretching peak. Note the flat background due to the light absorption by the blue glaze and high scattering at low wavenumber (the Boson peak is strong for a lead-based glass). The small 820 cm−1 component is assigned to an As-based phase (see further). The signal intensity of the glaze of hard-paste Asian porcelain is much lower (potash-lime alumina-rich glaze) and the background should be subtracted to see the spectrum clearly; the SiO4 stretching modes (900–1150 cm−1 band) are shifted to higher wavenumbers due to the composition being richer in silica and alumina.
Minerals 11 00633 g010
Figure 11. Examples of the Raman spectra of spinels with different compositions (left and right). Note the shift of the main M-O stretching mode between ~655 and 720 cm−1 (redrawn after [204] data). Right, the top spectra represent the blue (Co-Fe-Mn) spinel signature measured on blue-and-white underglaze decorated sherds (excavated from Qalhat, the Sultanate of Oman, 14th–16th-Centuries [21]), with traces of zircon, hematite; the contribution of the glaze (plus quartz) is shown below.
Minerals 11 00633 g011
Figure 12. Examples of dendrites observed on black spots similar with those observed on the Vietnamese sherd (Chu Dau kiln, 15th-Century). Dendrites are iron rich and are depleted in Si, Al, and Ca elements. See more details in [175].
Minerals 11 00633 g012
Figure 13. Similarity of the Raman signatures measured on blue glazes: French soft-paste porcelains, (a) 18432: ointment pot from Rouen Factory, end of the 17th-Century, 6638: pallet cup from the Vincennes Royal Factory made by Pierre-Antoine-Henry Taunay in 1748; (a’) 13371 (different spots-4,8): salt container assigned to Dominique or Pierre Chicaneau or Marie Moreau, from the Saint-Cloud or Paris Factory, beginning of the 18th-Century and 26296: tea pot from the Vincennes Royal Factory, middle of the 18th-Century; note that different signatures of As-based phases can be observed on the same object, see [219]); (b) Raman spectrum of an arsenic-containing blue pigment recorded on a sherd unearthed at the ancient Iznik tile kilns (Co: 0.42; As: 0.31; Ni: 0.13; Cu: 0.98 wt.%), (c) similar Raman spectrum recorded on a blue speckled glazed sherd excavated at Qalhat site (The Sultanate of Oman) exhibiting spectra of Co-olivine and of margarosanite (Ca2PbSi3O9).
Minerals 11 00633 g013
Figure 14. Representative Raman signatures recorded on the blue areas of enamelled porcelain and metal objects (Qing Dynasty Chinese artefacts): (a) a painted huafalang Imperial porcelain bowl (Kangxi reign mark) [140,222]; (b) a painted and cloisonné metal ewer (Qianlong reign mark); (c) cloisonné metal box (Qianlong reign,19th-Century) (Collections of Musée des arts asiatiques-Guimet, Paris and Musée Chinois, Fontainebleau Castle); (d) a Limoges enamelled artefact depicting St. Ignatius, founder of the Jesuits Missionary Company, assigned to Léonard II Limosin (ca. 1630; Collection of Musée des arts décoratifs, Paris) [62].
Minerals 11 00633 g014
Figure 15. Examples of XRF spectra of various Chinese (ac) [196] and Blue Print Collection [24] and Vietnamese (c), Chu Dau, Hua Luu, etc.) glazed sherds which represent different compositions of Co-containing blue pigments [21]. The sherd in (a) represents a fragment of a charger with a qilin and (b) represents a fragmentary stem bowl, both attributed to the productions of the Yuan Dynasty, 14th-Century [24].
Minerals 11 00633 g015
Figure 16. (a) Examples of enamelled watches and details of XRF spectra energy windows showing the signal of cobalt and associated elements (Mn, Fe, Ni, Cu, Zn, and As) recorded on the 17th–18th-Century enamelled watches (on gold alloy substrate, see [52]); (b) Raman spectra of enamelled watches recorded on the blue areas; cassiterite: 635–775 cm−1 doublet; As-O bond at ~815 cm−1.
Minerals 11 00633 g016
Table 1. Categorization of cobalt sources according to the accompanying elements by Gratuze et al. [89,90].
TypeAssociated
Elements
PeriodExpected Mines
1Co, Co-Sb (a)<12th-CenturyThe Eastern Mediterranean
Co-Cu? (b)
Co-Mn (c)
2Co-Zn-Pb-In13th–15th-CenturiesErzgebirge (Freiberg?)
3Co-NiAround 1500Erzgebirge?
4Co-As-Ni-Bi15th–18th-CenturiesErzgebirge (Schneeberg)
Publisher’s Note: MDPI stays neutral with regard to jurisdictional claims in published maps and institutional affiliations.

