
The Effect of pH, Ionic Strength and the Presence of PbII on the Formation of Calcium Carbonate from Homogenous Alkaline Solutions at Room Temperature


Abstract
:1. Introduction
2. Materials and Methods
2.1. Materials
2.2. Titration Equipment
2.3. Titration Experiments
2.4. Calibrations
3. Results
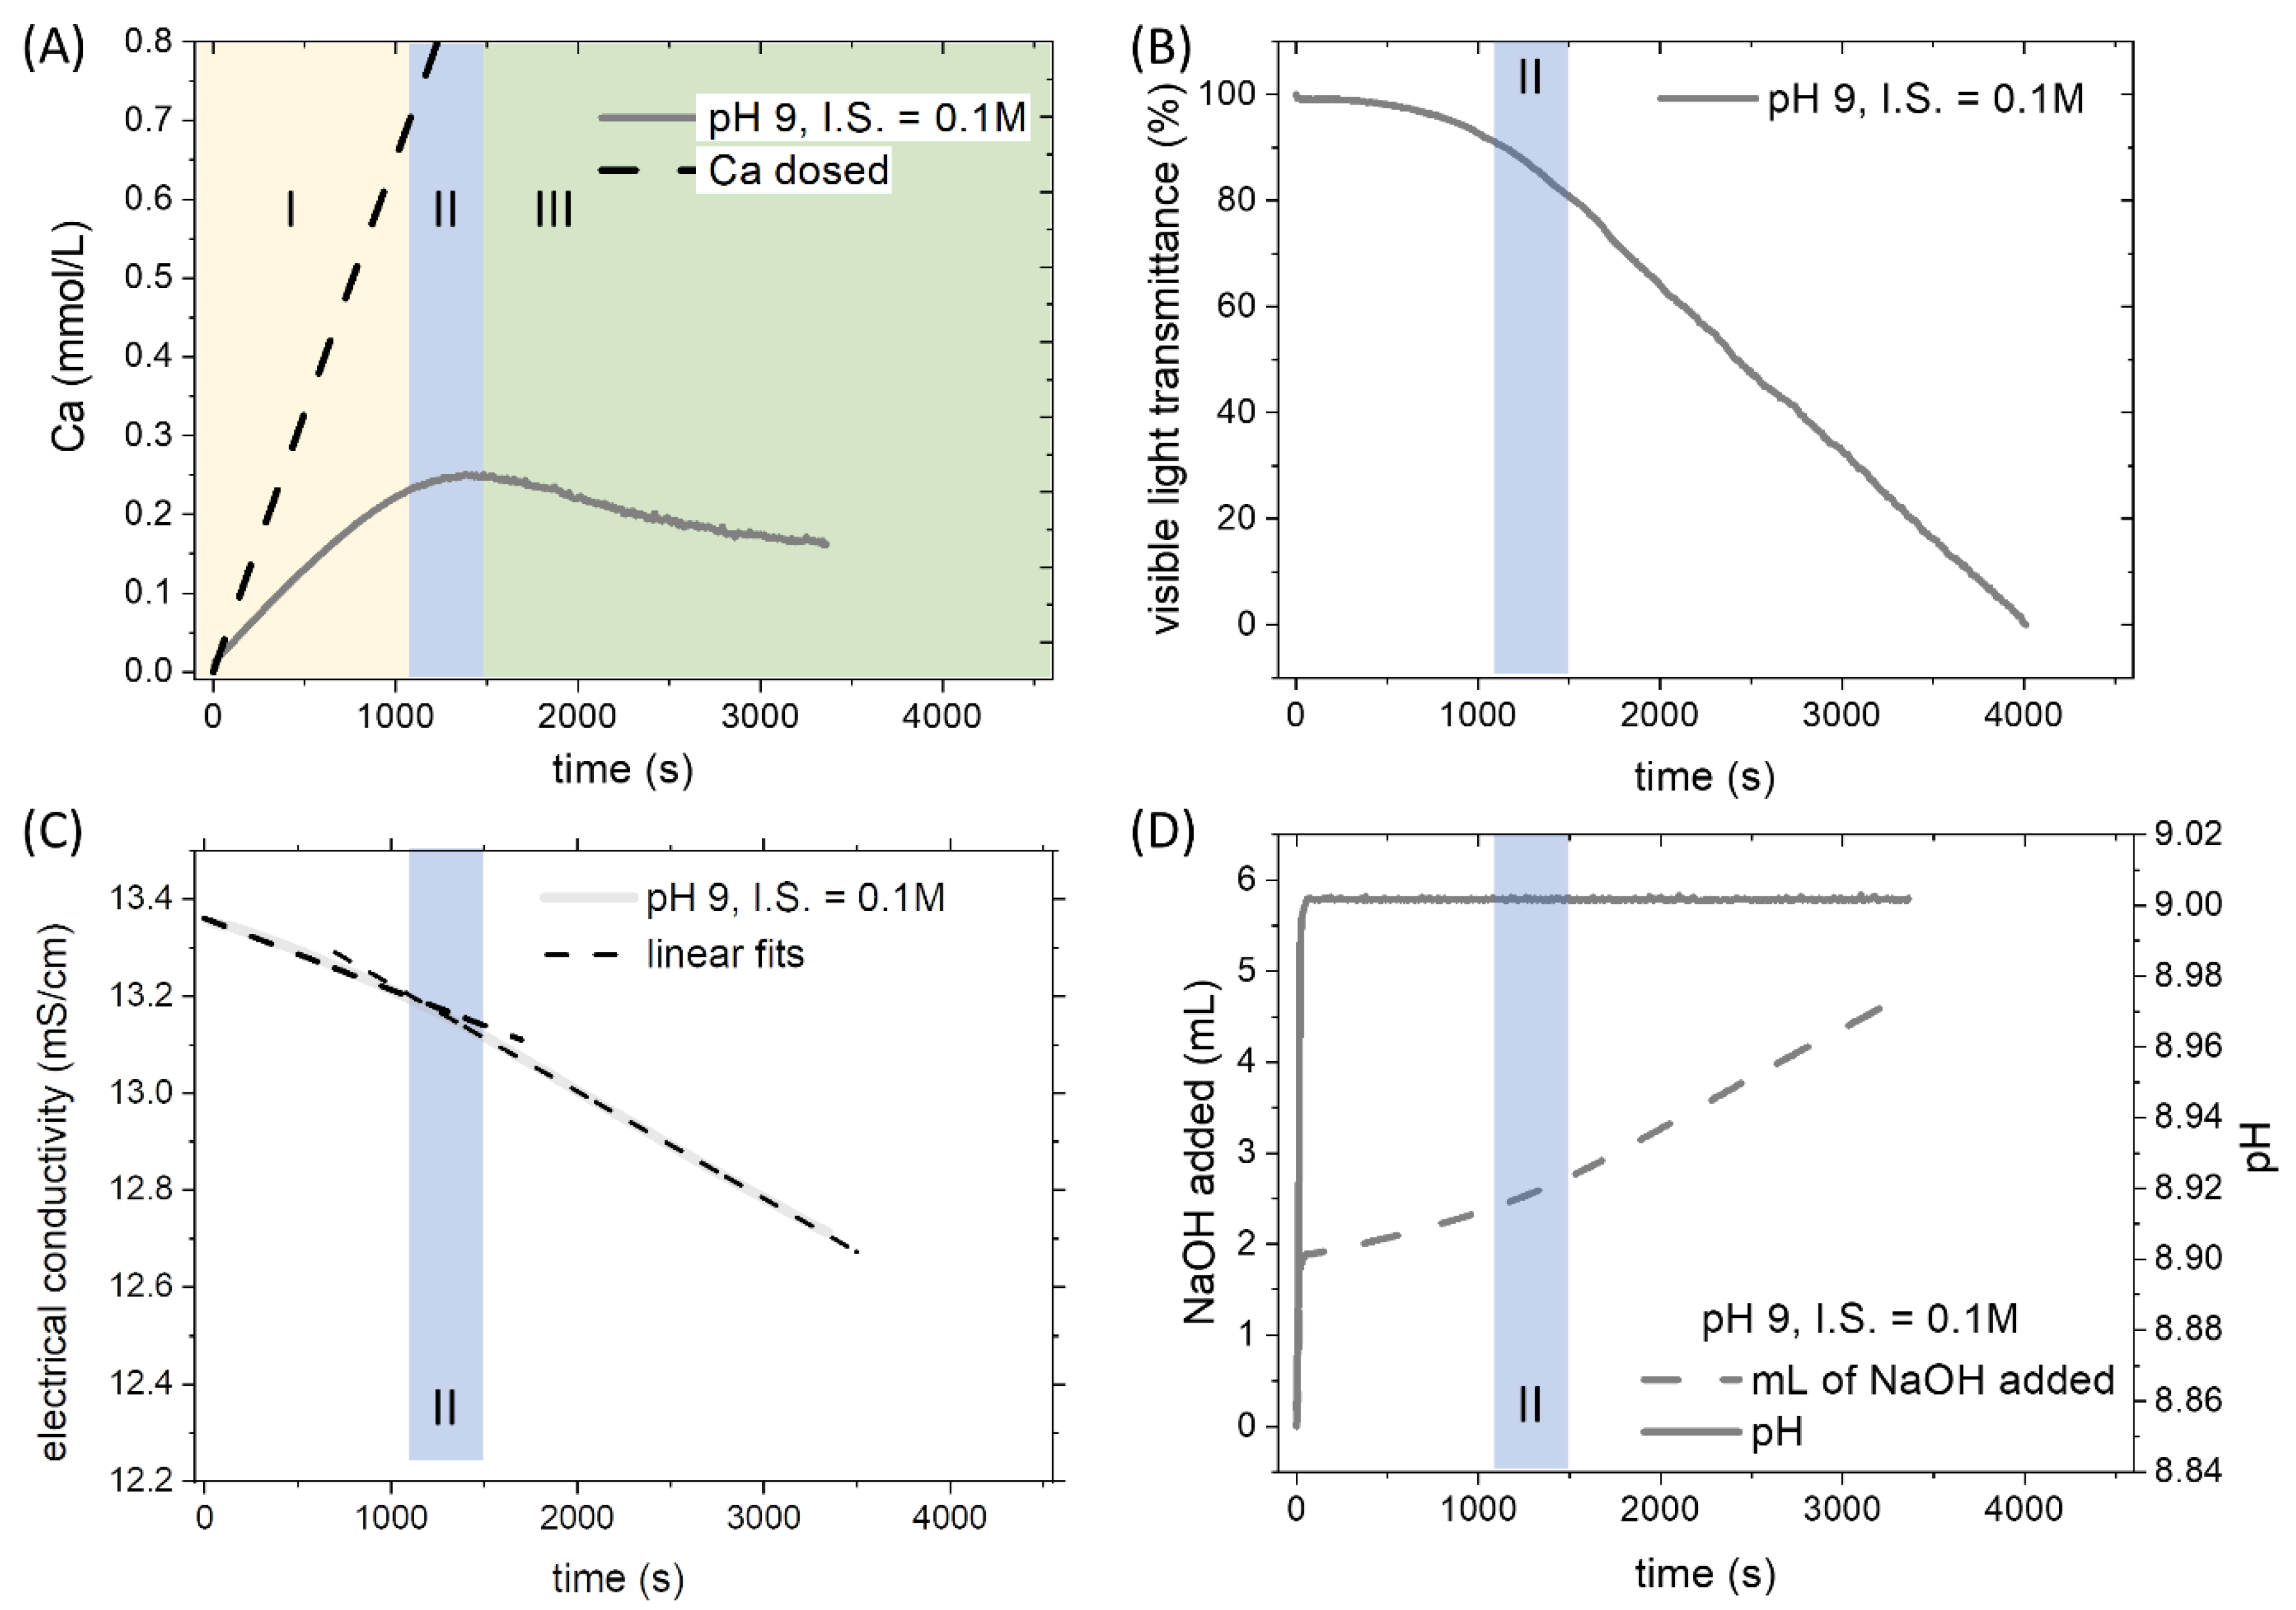
3.1. Physical-Chemistry Basis for Titration Experiments
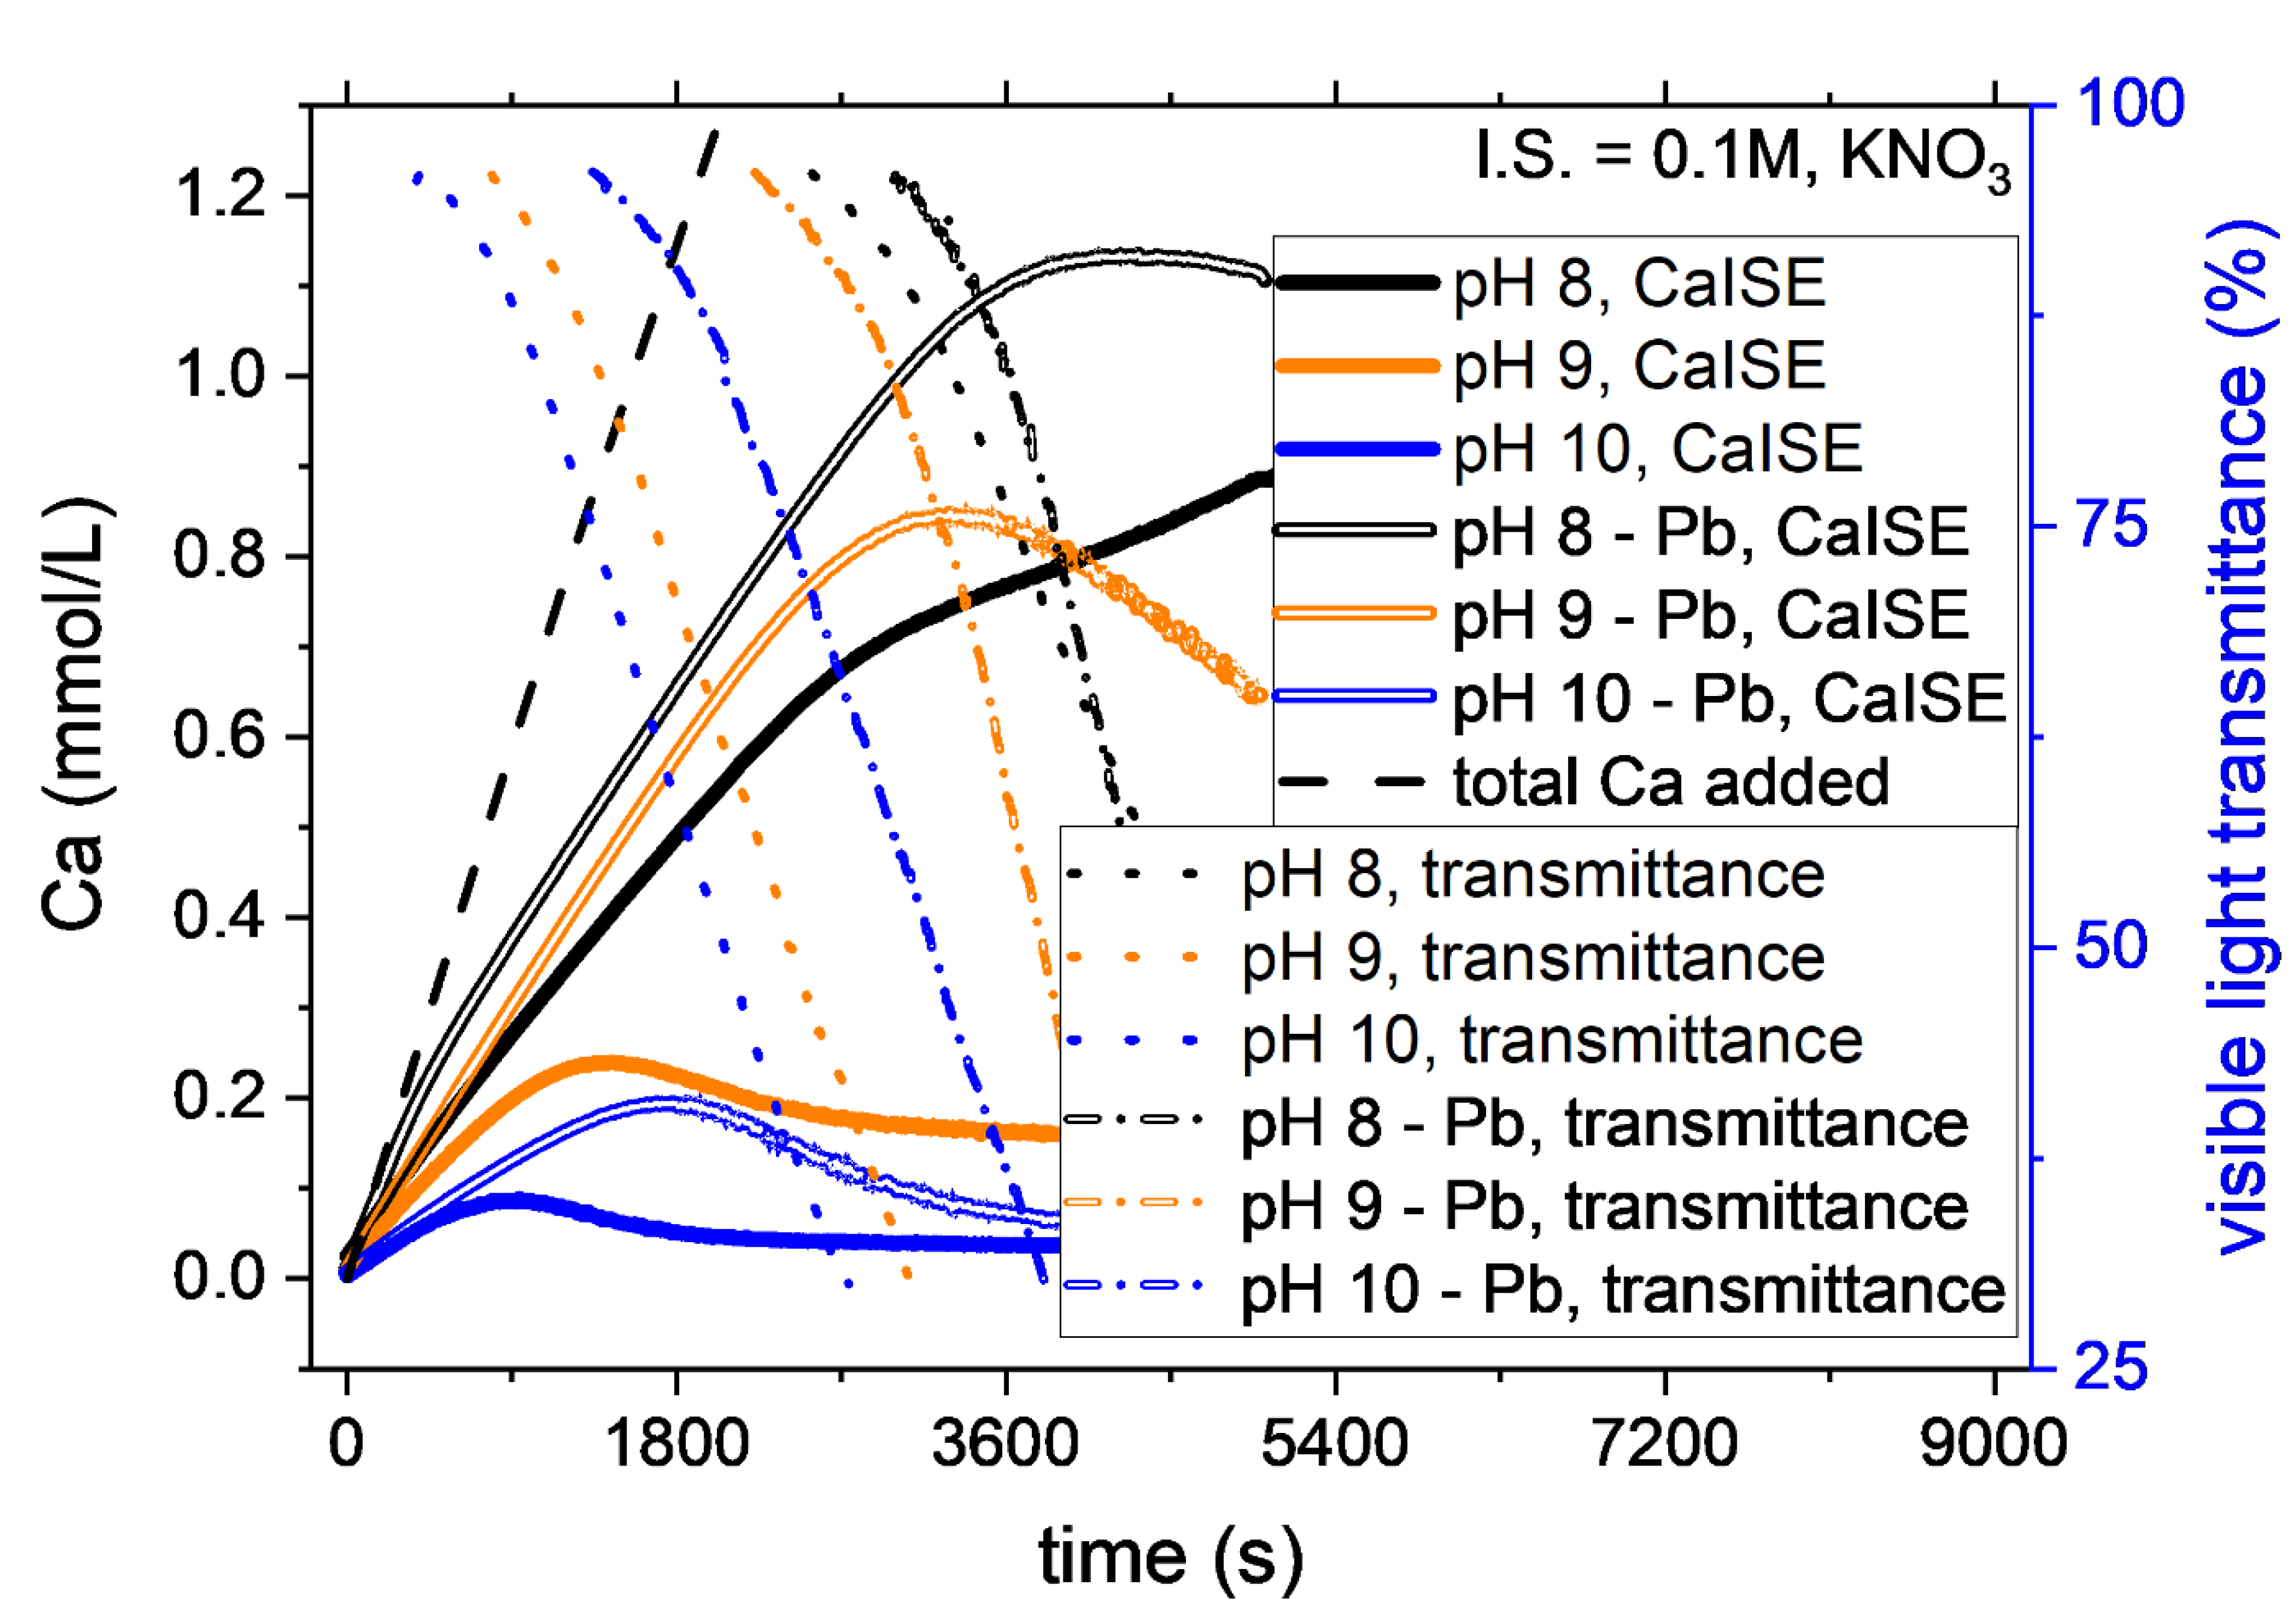
3.2. The Effect of pH and Ionic Strength on CaCO3 Formation
3.3. The Effect of Pb2+ on CaCO3 Formation
4. Discussion
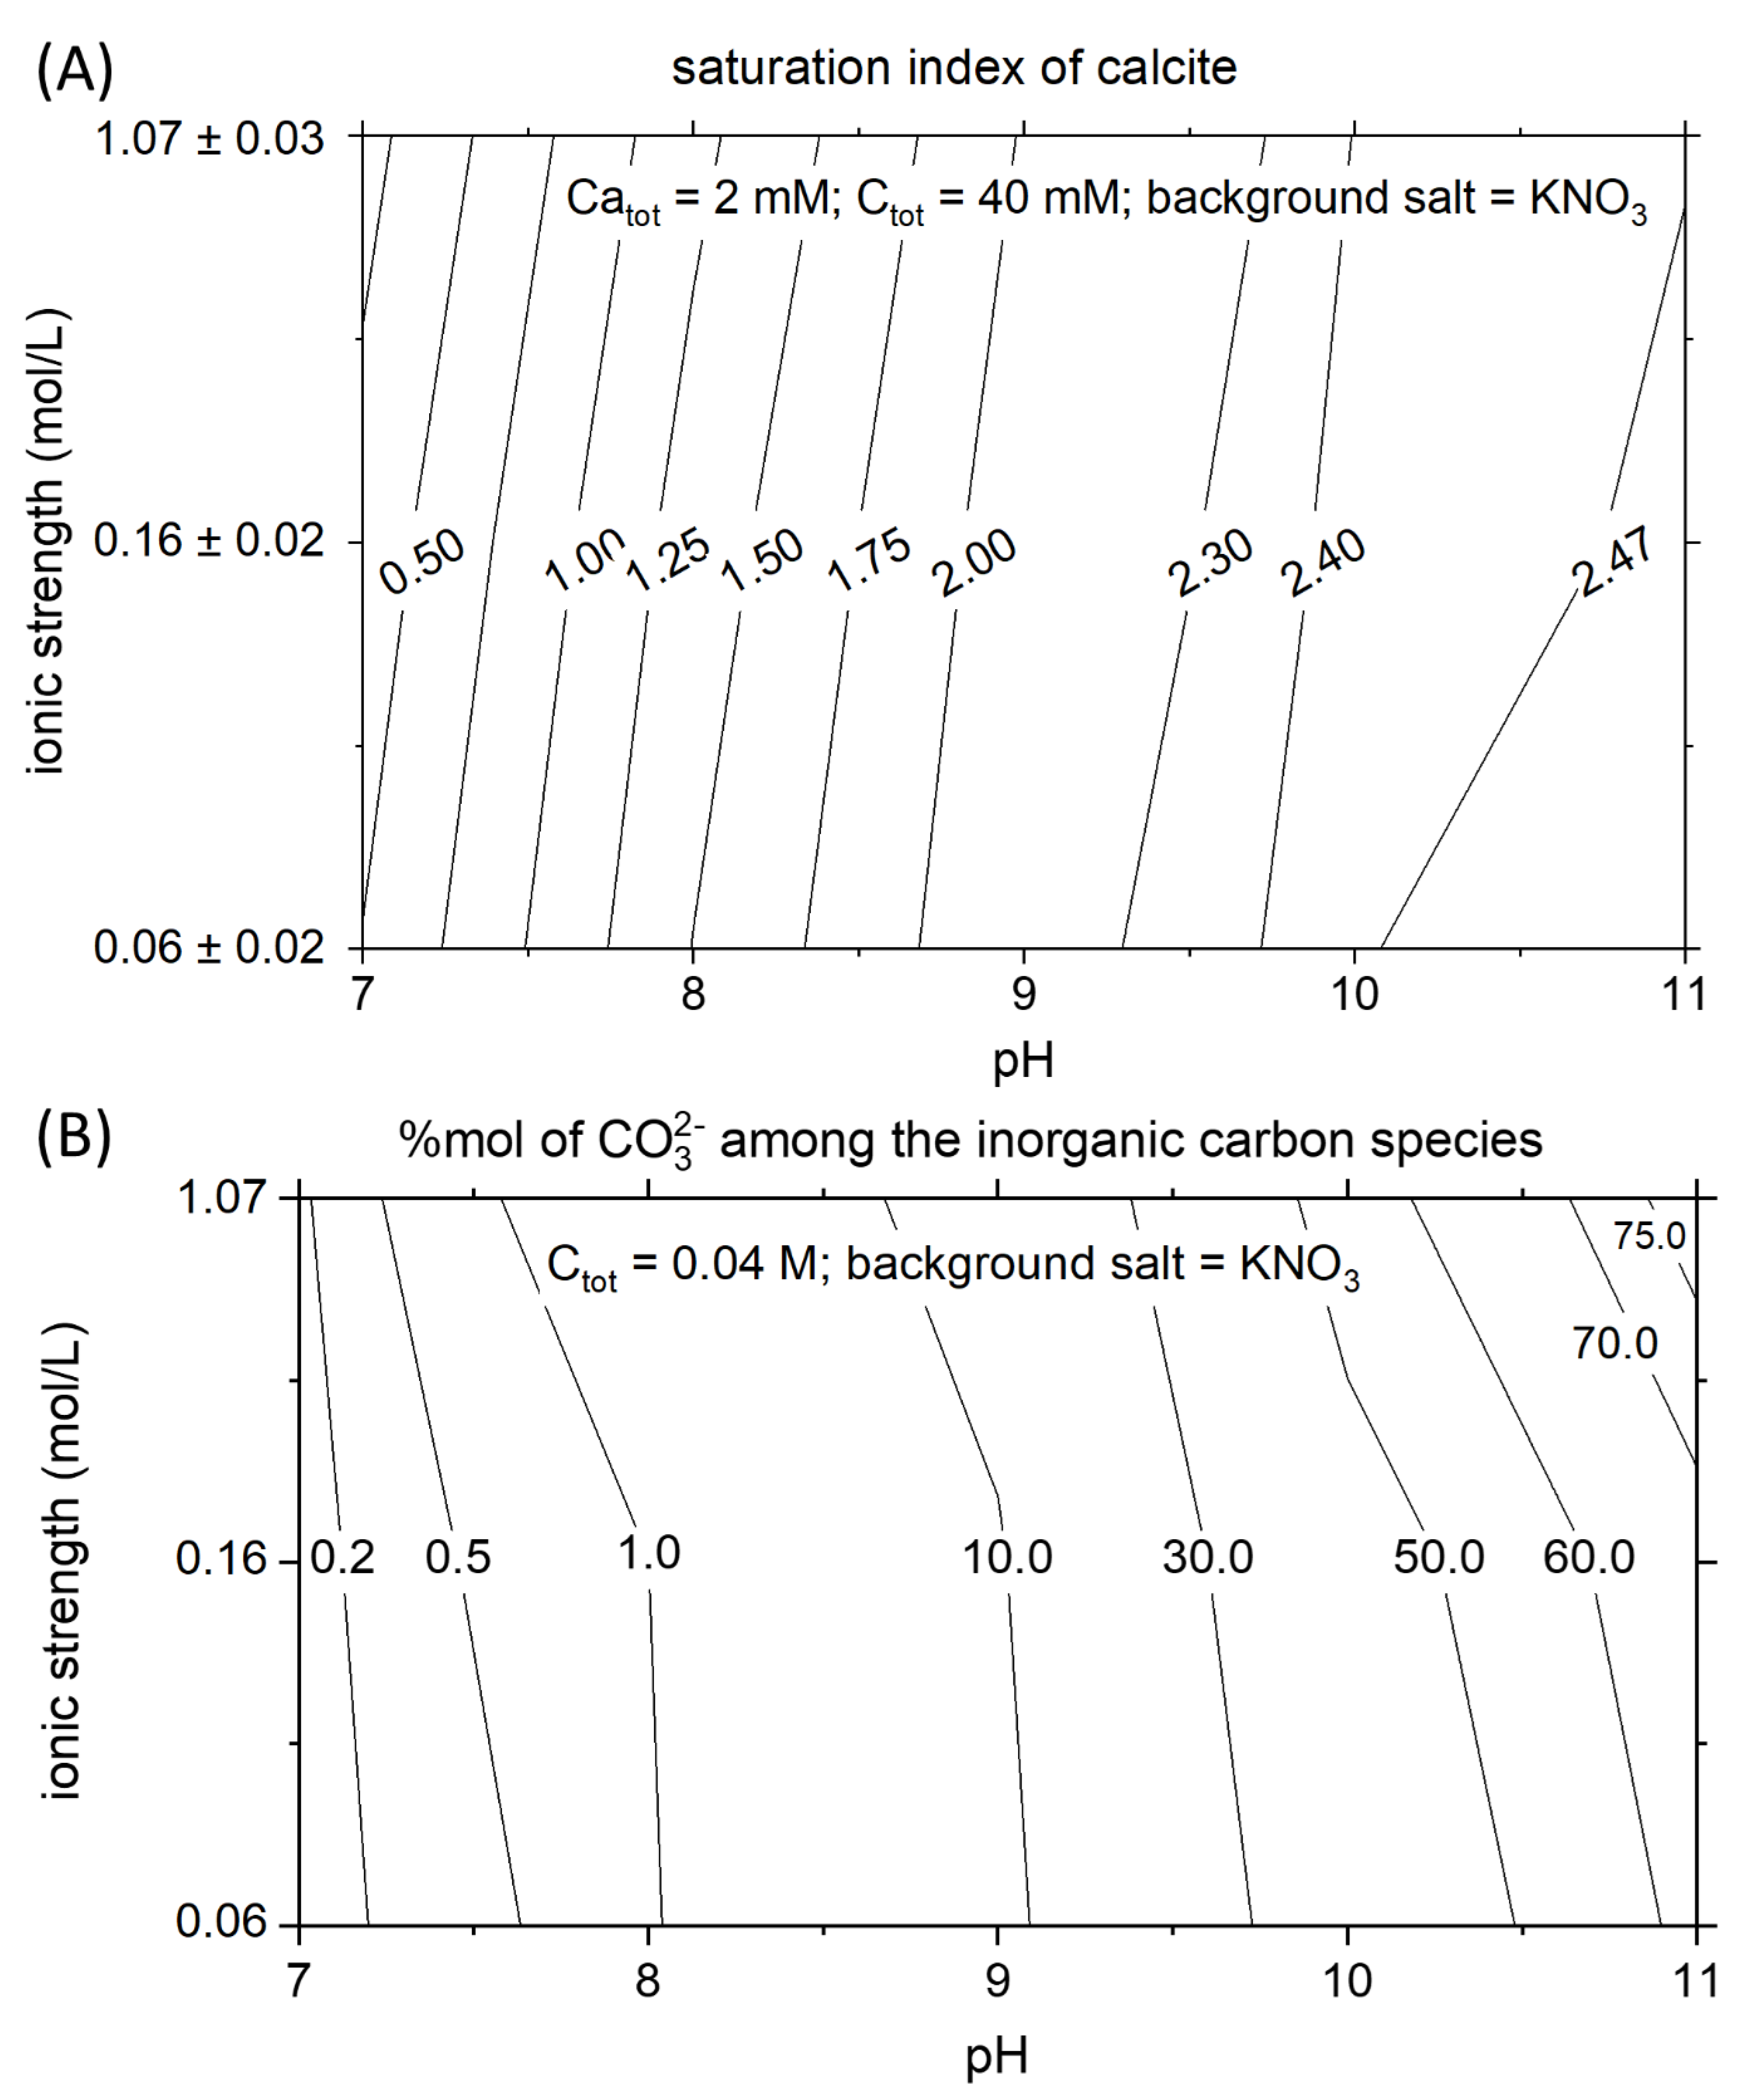
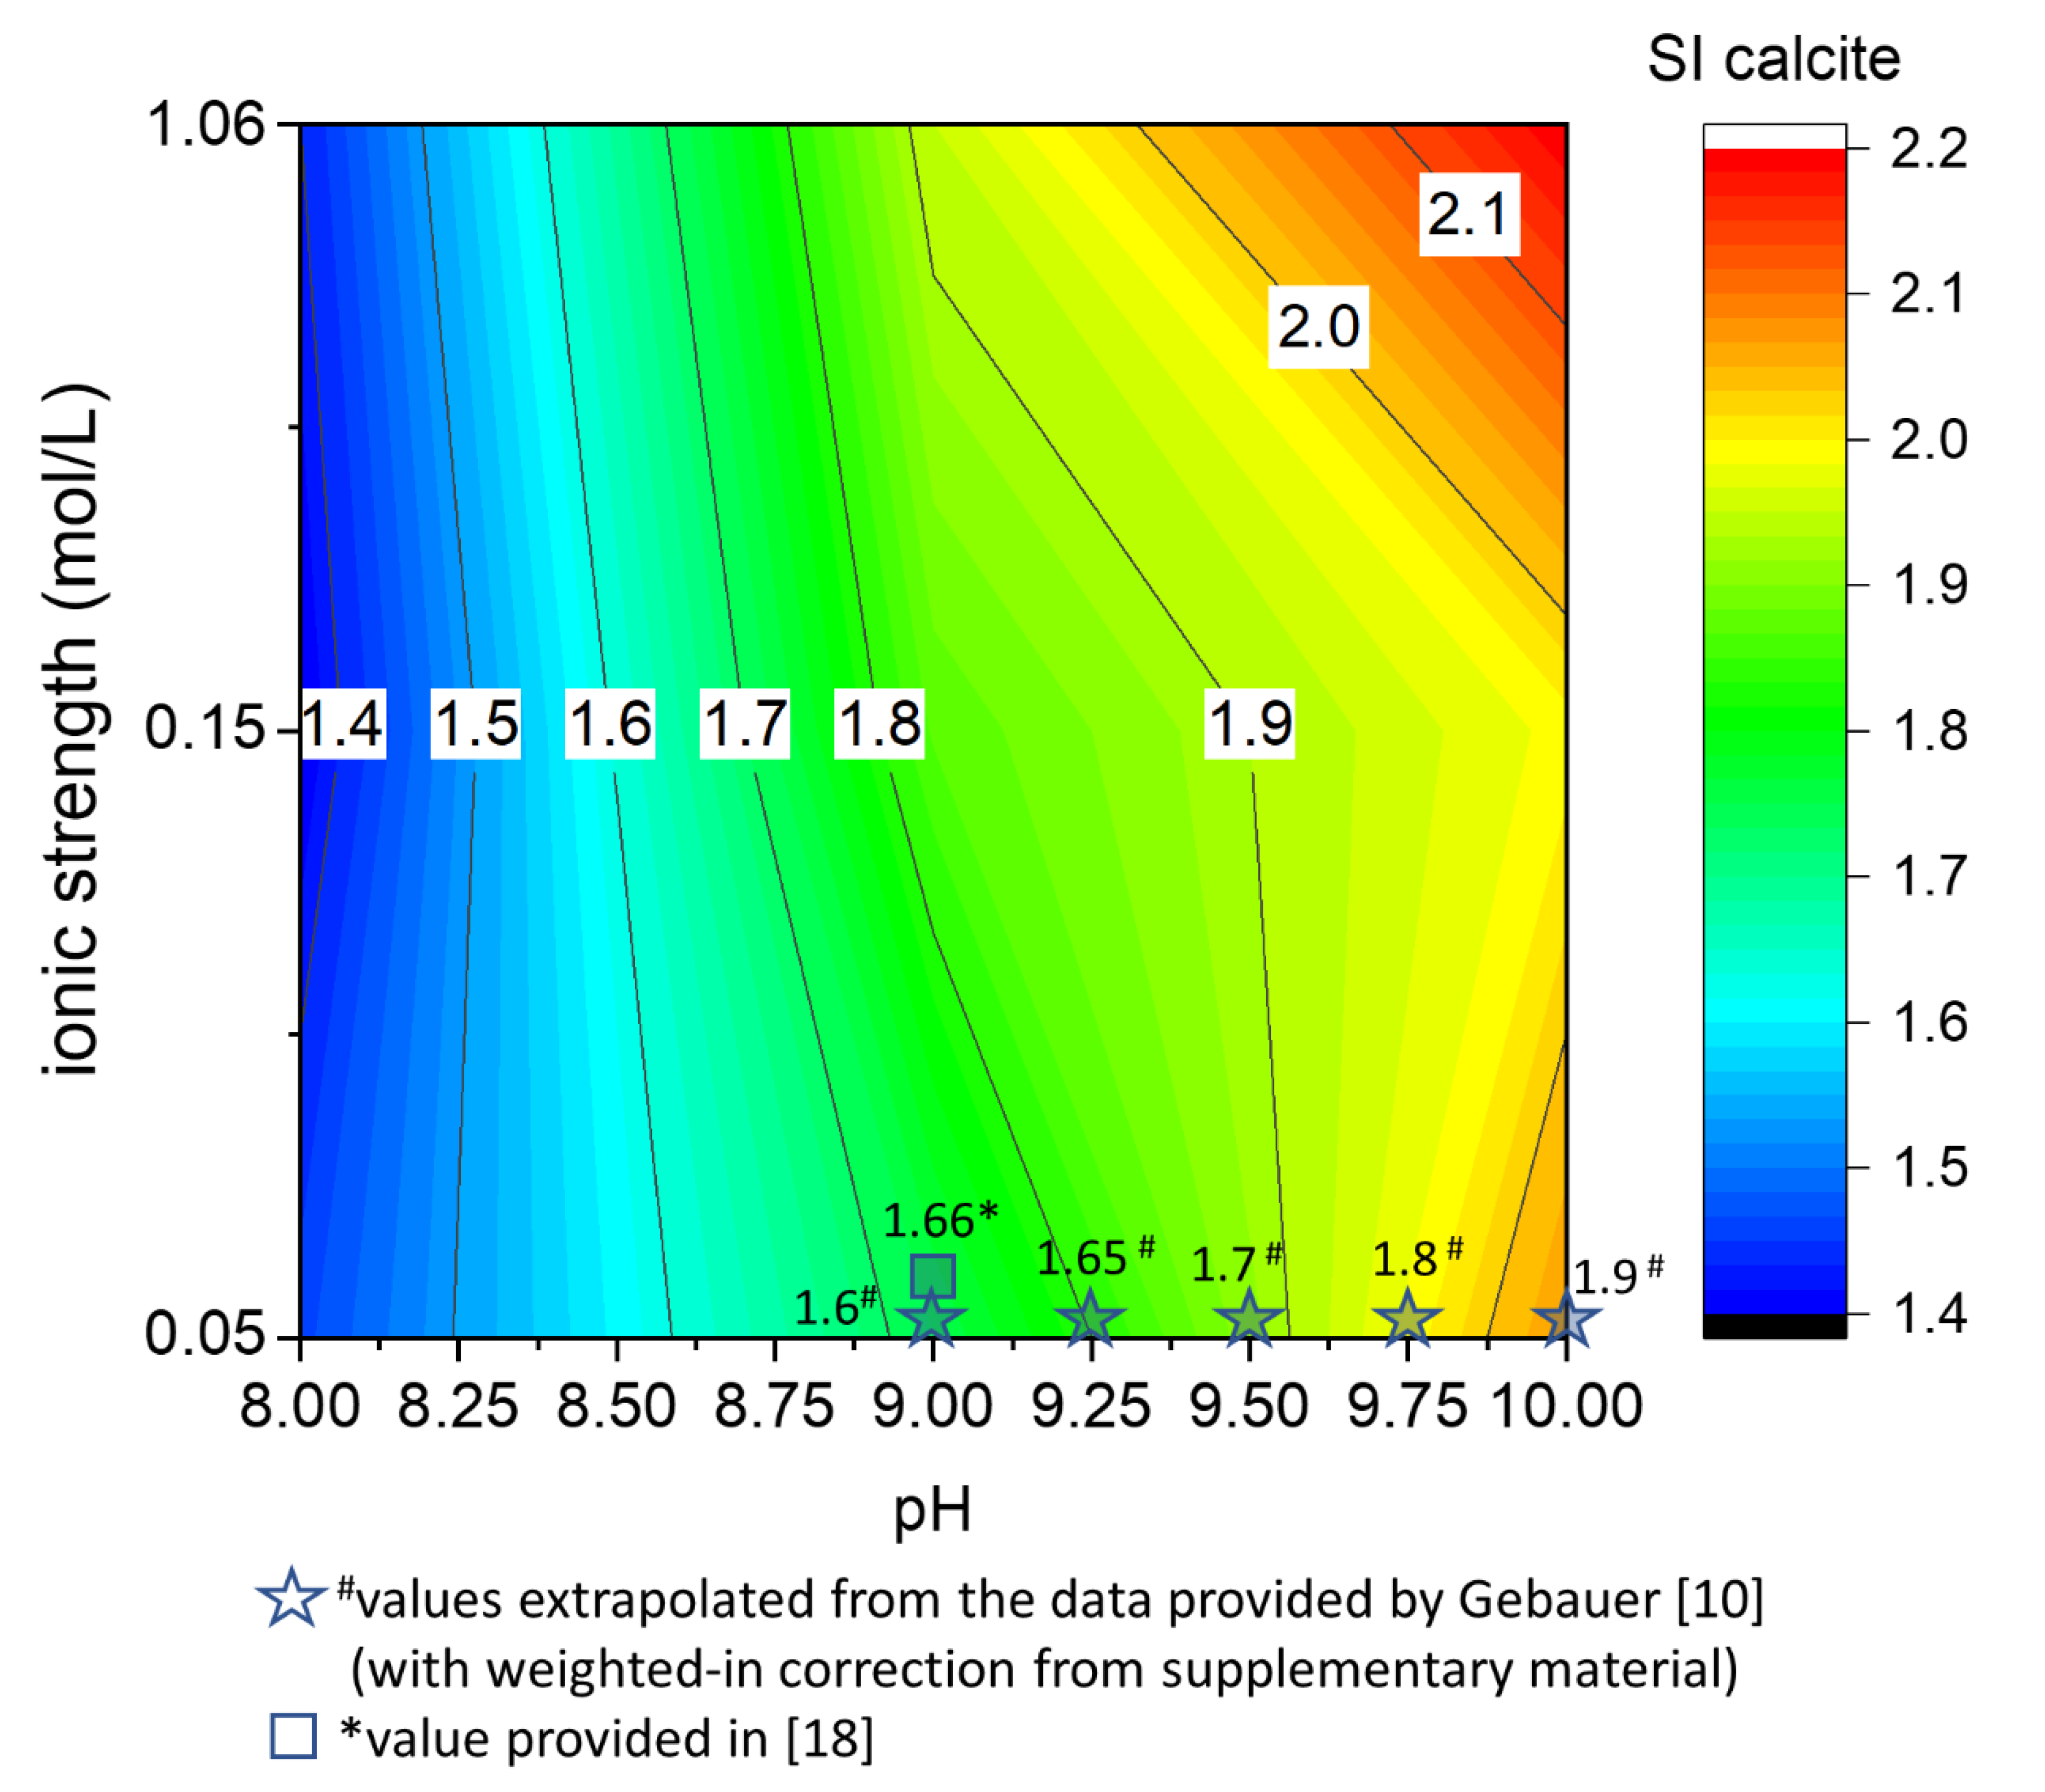
4.1. The Effect of pH and Ionic Strength on the Saturation State of Calcite
4.2. Inhibitory Effect of Pb2+ on Calcium Carbonate Nucleation
5. Conclusions
Author Contributions
Funding
Institutional Review Board Statement
Informed Consent Statement
Data Availability Statement
Conflicts of Interest
References
- Stumm, W.; Morgan, J.J. Aquatic Chemistry: Chemical Equilibria and Rates in Natural Waters; Wiley: Hoboken, NJ, USA, 1996; p. 1040. [Google Scholar]
- Morse, J.W.; Arvidson, R.S.; Lüttge, A. Calcium carbonate formation and dissolution. Chem. Rev. 2007, 107, 342–381. [Google Scholar] [CrossRef]
- Dong, S.; Berelson, W.M.; Rollins, N.E.; Subhas, A.V.; Naviaux, J.D.; Celestian, A.J.; Liu, X.; Turaga, N.; Kemnitz, N.J.; Byrne, R.H.; et al. Aragonite dissolution kinetics and calcite/aragonite ratios in sinking and suspended particles in the North Pacific. Earth Planet. Sci. Lett. 2019, 515, 1–12. [Google Scholar] [CrossRef] [Green Version]
- Addadi, B.L.; Raz, S.; Weiner, S. Taking Advantage of Disorder: Amorphous Calcium Carbonate and Its Roles in Biomineralization. Adv. Mater. 2003, 12, 959–970. [Google Scholar] [CrossRef]
- Salas, D.A.; Ramirez, A.D.; Rodríguez, C.R.; Petroche, D.M.; Boero, A.J.; Duque-Rivera, J. Environmental impacts, life cycle assessment and potential improvement measures for cement production: A literature review. J. Clean. Prod. 2016, 113, 114–122. [Google Scholar] [CrossRef]
- Matter, J.M.; Broecker, W.S.; Gislason, S.R.; Gunnlaugsson, E.; Oelkers, E.H.; Stute, M.; Sigurdardottir, H.; Stefansson, A.; Alfredsson, H.A.; Aradottir, E.S.; et al. The CarbFix Pilot Project—Storing Carbon Dioxide in Basalt. Energy Procedia 2011, 4, 5579–5585. [Google Scholar] [CrossRef] [Green Version]
- Gislason, S.R.; Oelkers, E.H. Carbon storage in basalt. Science 2014, 344, 373–374. [Google Scholar] [CrossRef] [PubMed]
- Khormali, A.; Petrakov, D.G.; Nazari Moghaddam, R. Study of adsorption/desorption properties of a new scale inhibitor package to prevent calcium carbonate formation during water injection in oil reservoirs. J. Pet. Sci. Eng. 2017, 153, 257–267. [Google Scholar] [CrossRef]
- Warsinger, D.M.; Swaminathan, J.; Guillen-Burrieza, E.; Arafat, H.A.; Lienhard, V.J.H. Scaling and fouling in membrane distillation for desalination applications: A review. Desalination 2015, 356, 294–313. [Google Scholar] [CrossRef]
- Gebauer, D.; Völkel, A.; Cölfen, H. Stable Prenucleation Calcium Carbonate Clusters. Science 2008, 322, 1819–1822. [Google Scholar] [CrossRef] [PubMed] [Green Version]
- Henzler, K.; Fetisov, E.O.; Galib, M.; Baer, M.D.; Legg, B.A.; Borca, C.; Xto, J.M.; Pin, S.; Fulton, J.L.; Schenter, G.K.; et al. Supersaturated calcium carbonate solutions are classical. Sci. Adv. 2018, 4, 1–12. [Google Scholar] [CrossRef] [Green Version]
- Avaro, J.T.; Wolf, S.L.P.; Hauser, K.; Gebauer, D. Stable Prenucleation Calcium Carbonate Clusters Define Liquid. Liq. Phase Sep. 2020, 6155–6159. [Google Scholar] [CrossRef]
- Hong, M.; Xu, J.; Teng, H.H. Evolution of calcite growth morphology in the presence of magnesium: Implications for the dolomite problem. Geochim. Cosmochim. Acta 2016, 172, 55–64. [Google Scholar] [CrossRef] [Green Version]
- Di Lorenzo, F.; Cametti, G.; Vanhecke, D.; Churakov, S.V. The role of interfaces in controlling Pb2+ removal by calcium carbonate minerals. Cryst. Growth Des. 2020, 20, 6157–6169. [Google Scholar] [CrossRef]
- Godelitsas, A.; Astilleros, J.M.; Hallam, K.R.; Löns, J.; Putnis, A. Microscopic and spectroscopic investigation of the calcite surface interacted with Hg(II) in aqueous solutions. Mineral. Mag. 2003, 67, 1193–1204. [Google Scholar] [CrossRef] [Green Version]
- Oelkers, E.H.; Golubev, S.V.; Pokrovsky, O.S.; Bénézeth, P. Do organic ligands affect calcite dissolution rates? Geochim. Cosmochim. Acta 2011, 75, 1799–1813. [Google Scholar] [CrossRef]
- Ruiz-Agudo, E.; Putnis, C.V.; Hövelmann, J.; Álvarez-Lloret, P.; Ibáñez-Velasco, A.; Putnis, A. Experimental study of the replacement of calcite by calcium sulphates. Geochim. Cosmochim. Acta 2015, 156, 75–93. [Google Scholar] [CrossRef]
- Di Lorenzo, F.; Burgos-Cara, A.; Ruiz-Agudo, E.; Putnis, C.V.; Prieto, M. Effect of ferrous iron on the nucleation and growth of CaCO3 in slightly basic aqueous solutions. CrystEngComm 2017, 19, 447–460. [Google Scholar] [CrossRef]
- Nriagu, J.O.; Pacyna, J.M. Quantitative assessment of worldwide contamination of air, water and soils by trace metals. Nature 1988, 333, 134–139. [Google Scholar] [CrossRef]
- Prieto, M.; Heberling, F.; Rodríguez-Galán, R.M.; Brandt, F. Crystallization behavior of solid solutions from aqueous solutions: An environmental perspective. Prog. Cryst. Growth Charact. Mater. 2016, 62, 29–68. [Google Scholar] [CrossRef]
- González-Núñez, R.; Rigol, A.; Vidal, M. Assessing the efficacy over time of the addition of industrial by-products to remediate contaminated soils at a pilot-plant scale. Environ. Monit. Assess. 2017, 189. [Google Scholar] [CrossRef] [PubMed]
- Rodriguez-Navarro, C.; Ruiz-Agudo, E.; Burgos-Cara, A.; Elert, K.; Hansen, E.F. Crystallization and Colloidal Stabilization of Ca(OH)2 in the Presence of Nopal Juice (Opuntia ficus indica): Implications in Architectural Heritage Conservation. Langmuir 2017, 33, 10936–10950. [Google Scholar] [CrossRef]
- Bersani, D.; Campani, E.; Casoli, A.; Lottici, P.P.; Marino, I.G. Spectroscopic study of the degradation products in the holy water fonts in Santa Maria della Steccata Church in Parma (Italy). Anal. Chim. Acta 2008, 610, 74–79. [Google Scholar] [CrossRef]
- Parkhurst, D.L.; Appelo, C.A.J. Description of Input and Examples for PHREEQC Version 3-A Computer Program for Speciation, Batch-Reaction, One-Dimensional Transport, and Inverse Geochemical Calculations; Book 6, Section A; US Geological Survey: Reston, VA, USA, 2013; Chapter 43.
- De Yoreo, J.J.; Vekilov, P.G. Principles of Crystal Nucleation and Growth. Rev. Mineral. Geochem. 2003, 54, 57–93. [Google Scholar] [CrossRef] [Green Version]
- Gebauer, D.; Cölfen, H. Prenucleation clusters and non-classical nucleation. Nano Today 2011, 6, 564–584. [Google Scholar] [CrossRef] [Green Version]
- Wolthers, M.; Nehrke, G.; Gustafsson, J.P.; Van Cappellen, P. Calcite growth kinetics: Modeling the effect of solution stoichiometry. Geochim. Cosmochim. Acta 2012, 77, 121–134. [Google Scholar] [CrossRef] [Green Version]
- Seepma, S.Y.M.H.; Ruiz-Hernandez, S.E.; Nehrke, G.; Soetaert, K.; Philipse, A.P.; Kuipers, B.W.M.; Wolthers, M. Controlling CaCOParticle Size with {Ca2+}:{CO32−} Ratios in Aqueous Environments. Cryst. Growth Des. 2021, 21, 1576–1590. [Google Scholar] [CrossRef]
- Mills, J.V.; DePaolo, D.J.; Lammers, L.N. The influence of Ca:CO3 stoichiometry on Ca isotope fractionation: Implications for process-based models of calcite growth. Geochim. Cosmochim. Acta 2021, 298, 87–111. [Google Scholar] [CrossRef]
- Kutchko, B.G.; Strazisar, B.R.; Dzombak, D.A.; Lowry, G.V.; Thauiow, N. Degradation of well cement by CO2 under geologic sequestration conditions. Environ. Sci. Technol. 2007, 41, 4787–4792. [Google Scholar] [CrossRef] [PubMed]
- Duguid, A.; Scherer, G.W. Degradation of oilwell cement due to exposure to carbonated brine. Int. J. Greenh. Gas Control 2010, 4, 546–560. [Google Scholar] [CrossRef]
- Arvidson, R.S.; Mackenzie, F.T. The Dolomite Problem: Control of Precipitation Kinetics by Temperature and Saturation State. Am. J. Sci. 1999, 2, 257–288. [Google Scholar] [CrossRef] [Green Version]
- Lin, Y.-P.; Singer, P.C. Effect of Mg2+ on the kinetics of calcite crystal growth. J. Cryst. Growth 2009, 312, 136–140. [Google Scholar] [CrossRef]
- Astilleros, J.M.; Fernández-Díaz, L.; Putnis, A. The role of magnesium in the growth of calcite: An AFM study. Chem. Geol. 2010, 271, 52–58. [Google Scholar] [CrossRef] [Green Version]
- Katz, J.L.; Reick, M.R.; Herzog, R.E.; Parsiegla, K.I. Calcite Growth Inhibition by Iron. Langmuir 1993, 9, 1423–1430. [Google Scholar] [CrossRef]


| Experimental Conditions | Beaker (Initial Composition) | Burette 1 | Burette 2 | ||||
|---|---|---|---|---|---|---|---|
| # | Ionic Strength(KNO3) | pH | Reagent mol% | Total Inorganic Carbon | Ca(NO3)2 | Pb(NO3)2 | NaOH |
| 1 | 0.05 M | 8 | NaHCO3 100% | 0.04 M | 0.03 M | 0 (no Pb) | 0.1 N |
| 2 | 0.15 M | ||||||
| 3 | 1.06 M | ||||||
| 4 | 0.05 M | 9 | NaHCO3 92% + Na2CO3 8% | 0.04 M | 0.03 M | 0 (no Pb) | 0.1 N |
| 5 | 0.15 M | ||||||
| 6 | 1.06 M | ||||||
| 7 | 0.05 M | 10 | NaHCO3 49% + Na2CO3 51% | 0.04 M | 0.03 M | 0 (no Pb) | 0.1 N |
| 8 | 0.15 M | ||||||
| 9 | 1.06 M | ||||||
| 10 | 0.05 M | 8 | NaHCO3 100% | 0.04 M | 0.03 M | 0.0003 M (Ca/Pb = 100) | 0.1 N |
| 11 | 0.15 M | ||||||
| 12 | 1.06 M | ||||||
| 13 | 0.05 M | 9 | NaHCO3 92% + Na2CO3 8% | 0.04 M | 0.03 M | 0.0003 M (Ca/Pb = 100) | 0.1 N |
| 14 | 0.15 M | ||||||
| 15 | 1.06 M | ||||||
| 16 | 0.05 M | 10 | NaHCO3 49% + Na2CO3 51% | 0.04 M | 0.03 M | 0.0003 M (Ca/Pb = 100) | 0.1 N |
| 17 | 0.15 M | ||||||
| 18 | 1.06 M | ||||||
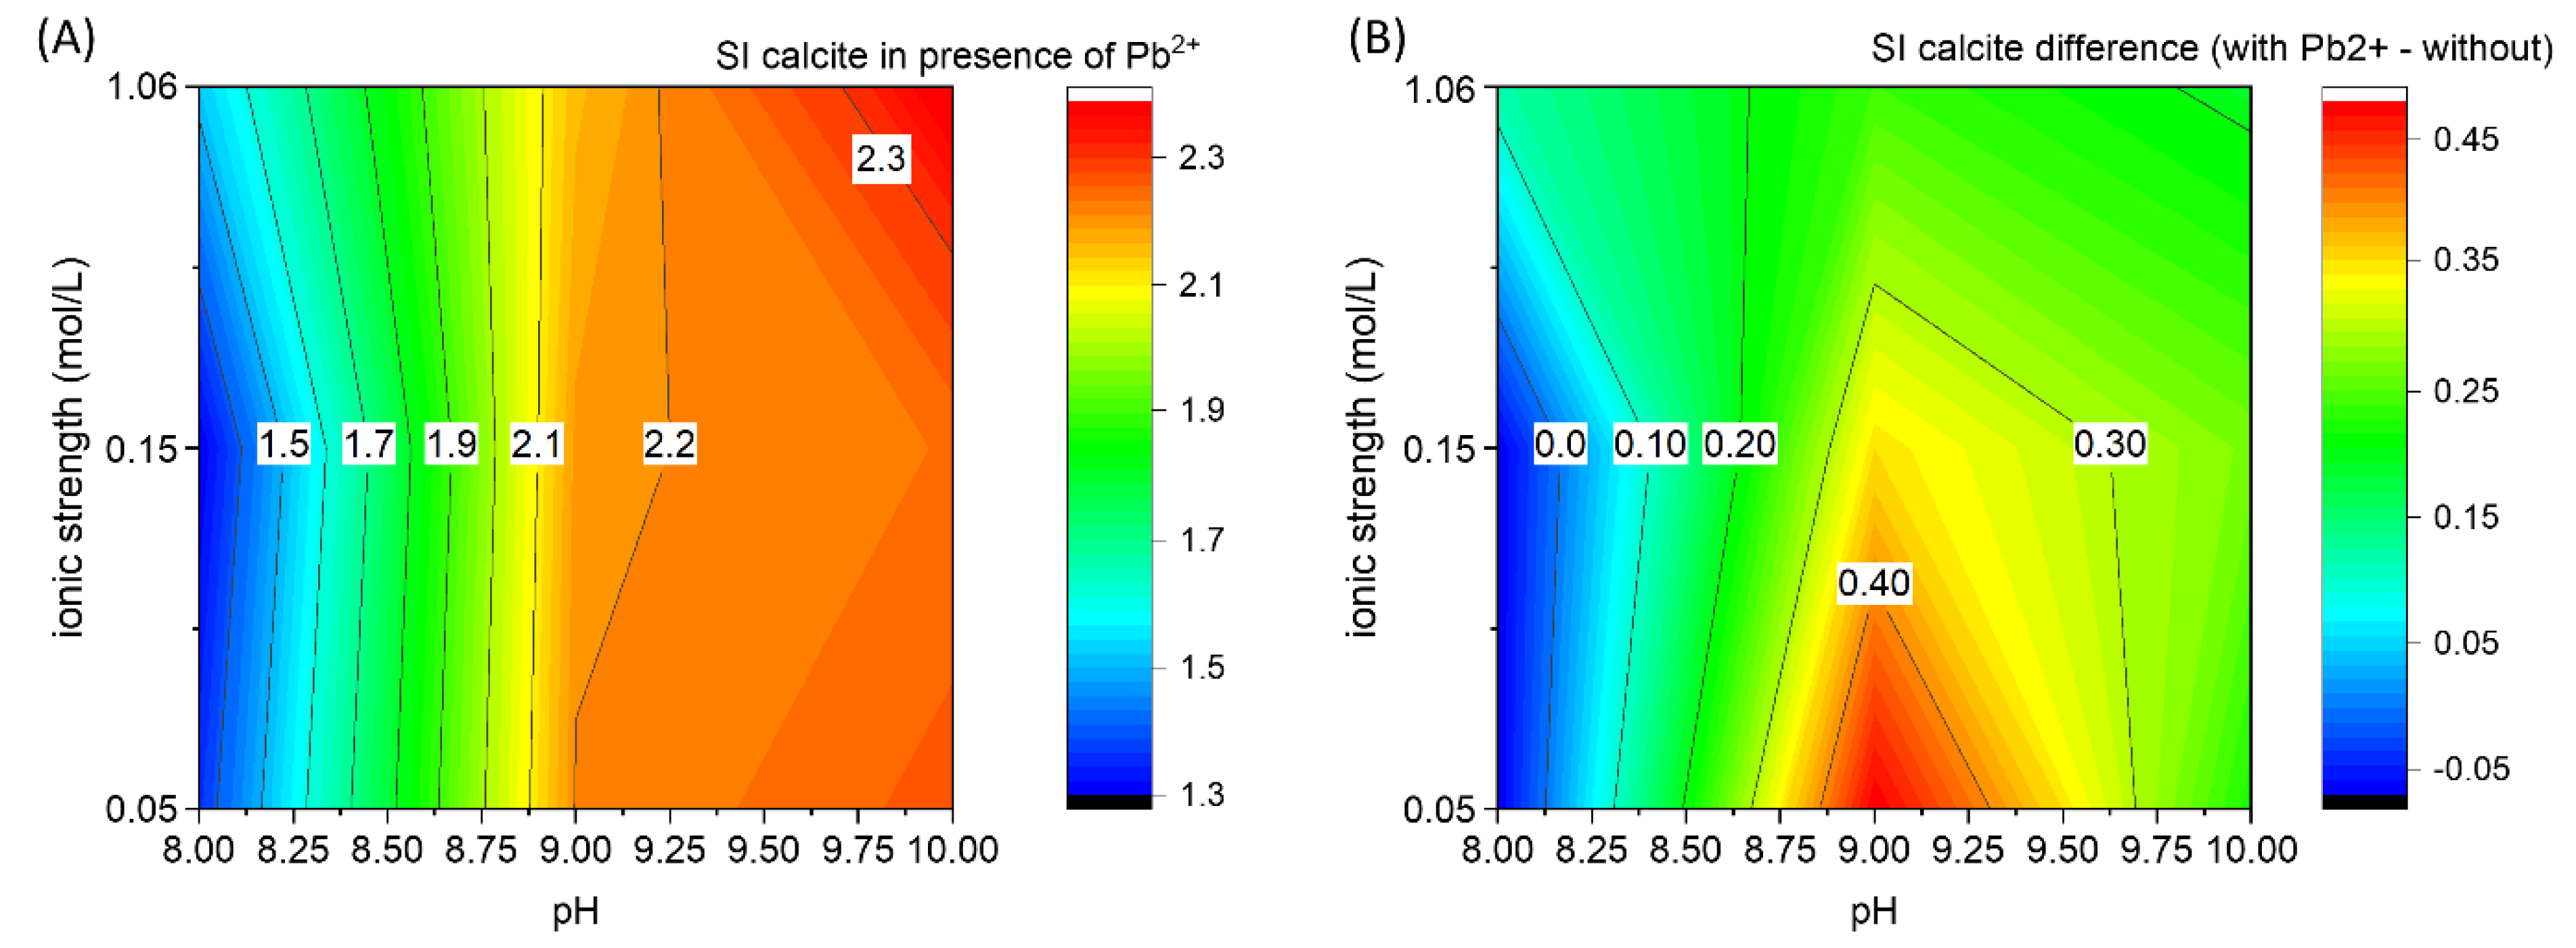
| Ca-CO2-H2O saturation index of calcite | pH | |||
| 8 | 9 | 10 | ||
| ionic strength (mol/L) | 0.05 | 1.43 | 1.72 | 2.04 |
| 0.15 | 1.37 | 1.84 | 1.96 | |
| 1.06 | 1.4 | 1.92 | 2.17 | |
| Ca-Pb-CO2-H2O (Ca/Pb = 100 mole ratio) Difference in saturation index of calcite | pH | |||
| 8 | 9 | 10 | ||
| ionic strength (mol/L) | 0.05 | −0.07 | 0.48 | 0.22 |
| 0.15 | −0.07 | 0.35 | 0.27 | |
| 1.06 | 0.12 | 0.24 | 0.19 | |
Publisher’s Note: MDPI stays neutral with regard to jurisdictional claims in published maps and institutional affiliations. |
© 2021 by the authors. Licensee MDPI, Basel, Switzerland. This article is an open access article distributed under the terms and conditions of the Creative Commons Attribution (CC BY) license (https://creativecommons.org/licenses/by/4.0/).
Share and Cite
Di Lorenzo, F.; Steiner, K.; Churakov, S.V. The Effect of pH, Ionic Strength and the Presence of PbII on the Formation of Calcium Carbonate from Homogenous Alkaline Solutions at Room Temperature. Minerals 2021, 11, 783. https://0-doi-org.brum.beds.ac.uk/10.3390/min11070783
Di Lorenzo F, Steiner K, Churakov SV. The Effect of pH, Ionic Strength and the Presence of PbII on the Formation of Calcium Carbonate from Homogenous Alkaline Solutions at Room Temperature. Minerals. 2021; 11(7):783. https://0-doi-org.brum.beds.ac.uk/10.3390/min11070783
Chicago/Turabian StyleDi Lorenzo, Fulvio, Kay Steiner, and Sergey V. Churakov. 2021. "The Effect of pH, Ionic Strength and the Presence of PbII on the Formation of Calcium Carbonate from Homogenous Alkaline Solutions at Room Temperature" Minerals 11, no. 7: 783. https://0-doi-org.brum.beds.ac.uk/10.3390/min11070783