Article

Worth from Waste: Utilizing a Graphite-Rich Fraction from Spent Lithium-Ion Batteries as Alternative Reductant in Nickel Slag Cleaning

1
Department of Chemical and Metallurgical Engineering, School of Chemical Engineering, Aalto University, Kemistintie 1, P.O. Box 16100, 00076 Aalto, Finland
2
Geological Survey of Finland, Vuorimiehentie 2, 02150 Espoo, Finland
*
Author to whom correspondence should be addressed.
Submission received: 30 April 2021 / Revised: 5 July 2021 / Accepted: 15 July 2021 / Published: 19 July 2021
(This article belongs to the Special Issue Battery Minerals)

Abstract

:
One possible way of recovering metals from spent lithium-ion batteries is to integrate the recycling with already existing metallurgical processes. This study continues our effort on integrating froth flotation and nickel-slag cleaning process for metal recovery from spent batteries (SBs), using anodic graphite as the main reductant. The SBs used in this study was a froth fraction from flotation of industrially prepared black mass. The effect of different ratios of Ni-slag to SBs on the time-dependent phase formation and metal behavior was investigated. The possible influence of graphite and sulfur contents in the system on the metal alloy/matte formation was described. The trace element (Co, Cu, Ni, and Mn) concentrations in the slag were analyzed using the laser ablation-inductively coupled plasma-mass spectrometry (LA-ICP-MS) technique. The distribution coefficients of cobalt and nickel between the metallic or sulfidic phase (metal alloy/matte) and the coexisting slag increased with the increasing amount of SBs in the starting mixture. However, with the increasing concentrations of graphite in the starting mixture (from 0.99 wt.% to 3.97 wt.%), the Fe concentration in both metal alloy and matte also increased (from 29 wt.% to 68 wt.% and from 7 wt.% to 49 wt.%, respectively), which may be challenging if further hydrometallurgical treatment is expected. Therefore, the composition of metal alloy/matte must be adjusted depending on the further steps for metal recovery.

1. Introduction

As a result of the ambitious electrification targets pursued worldwide, it has been estimated that the number of end-of-life (EoL) lithium-ion batteries (LIBs) may increase 700-fold between 2020 and 2040 [1]. Extraction of battery metals, such as lithium and cobalt, has been highly connected with geopolitical supply risks, e.g., conflicting land use, uncertain mineral rights, and political and security risks [2]. Therefore, recycling of LIBs is a necessary activity, enabling the recovery of raw materials to supplement those obtained from extractive activities, and reducing the environmental impact of batteries [2,3]. Generally, the concentration of valuable metals in EoL LIBs is higher than that of virgin raw materials [2]. However, LIBs represent complex material mixtures that would require several unit operations and processes to efficiently recover most of their components [4,5]. Consequently, the recycling processes available are designed to recover a limited number of elements in a simple and economic manner. A recycling facility can be built as a greenfield investment, as an add-on to existing metallurgical plants or fully integrated into the existing industrial sites designed for primary raw material processing. After sorting and dismantling, thermal pretreatment methods or pyrometallurgical processes are often applied before hydrometallurgical refining. Recently, Makuza et al. reviewed the pyrometallurgical options for recycling spent lithium-ion batteries. Pyrometallurgical processes have great potential in LIB recycling, as the processes are often not too sensitive to impurities and can remove or make use of substances that would be challenging for hydrometallurgy [2,3].
The LIB battery cathode is often considered the most valuable part of the battery [6] due to its metals contained in association with lithium. The cathode materials also define the classification of LIBs, with types including NMC, NCA, LNO, LMO, and LFP, in which L stands for lithium, M for manganese, C for cobalt, N for nickel, A for aluminum, F for iron, P for phosphate, and O for oxide [7]. In addition to these metals, LIBs contain, e.g., metallic Cu and Al, as well as carbon usually in the form of graphite [8,9]. The trend in NMC battery cathode types is to increase the Ni/Co ratio [7,10]. This is because of the relatively low cost of Ni compared to Co and lower supply risk, as Co sources are found in politically unstable geographical areas [2,10]. Nevertheless, the batteries reaching EoL in the near future will likely have a high Co content. It is worth noting that the challenges associated with Co are not the only concern. Recently, the European Union added Li to the 2020 EU Critical Raw Materials list as part of a strategy to reduce the reliance on imported supply. Currently, the import reliance for Li in the EU is 100% due to the lack of local refining capabilities, leading to domestic Li reserves being processed elsewhere [1,11]. Nickel is not considered as a Critical Raw Material for EU at the moment; however, its supply is becoming increasingly dependent on areas with higher political risk such as Indonesia and the Philippines [10]. Moreover, the nickel production was recently driven from sulfide ores to laterite ores, which require more complex processing, along with an increase in energy consumption and greenhouse gas emissions [12]. Therefore, as nickel is a strategic component of the batteries and its demand will grow significantly in the near future, it is expected that there will be a significant increase in nickel prices. In summary, recycling is an important part in reducing the supply risk [11].
In order for the European recycling operators to meet the target recoveries outlined by the new Batteries Regulation, research concerning the mechanical preprocessing of battery waste is also necessary [1]. Currently, one substantial challenge in LIB recycling is selectively separating the electrode components into a fraction of their own prior to the chemical separation, in a manner that allows for a high throughput and recovery [13]. Since the electrode materials are considerably finer than the other LIB components, sieving is commonly applied to concentrate the electrodes in the underflow, while the current collector foils (Cu/Al) and other metallic components are mainly separated in the overflow. However, due to the antagonistic effect of the organic PVDF (polyvinylidene fluoride) binder and the cross-contamination produced by the shredding and comminution of the waste battery packs, the electrode materials are not completely liberated and cannot be fully recovered in the sieve underflow [8,14,15]. To increase the recovery, a common practice is to increase the cutoff point of the sieve, resulting in a decreased grade of the electrodes, as more Fe, Cu, and Al are allowed to pass through the sieve. In many of the currently operational hydrometallurgical recycling plants, these elements are considered as impurities that complicate the leaching process [4]. For this reason, research efforts have been made to better optimize leaching operations for mixed feeds involving Fe, Cu, and Al [16,17]. However, as Cu, Al, and Fe are significantly lower in economic value compared to the elements in the electrodes, recovering them by mechanical unit operations would be preferable over the relatively expensive chemical methods. This is especially true for Cu, as 95% recovery will be enforced by the new Regulation. Therefore, studying alternative processes for the recovery of the leftover electrode material in the sieve overflow is vital, as this would enable a more selective first stage separation of the active material. Froth flotation was demonstrated to be a potential process for this purpose in our previous study [8], enabling the recovery of electrode components in the froth fraction, while enriching other metallic components in the tailings. The subsequent recovery of metals can take place using pyrometallurgical processes.
In pyrometallurgical processes, slag design has a crucial role in valuable metal recovery. Conventional slag systems for spent LIB treatment are CaO-SiO2-Al2O3 slag or FeO-CaO-SiO2-Al2O3 [9,18]. According to thermomechanical modeling, fluxes such as Al2O3 and SiO2 improve lithium slagging, whereas the addition of CaO decreases it due to lower lithium solubility. More quartz being added results in lower lithium losses to gas or metal-rich phase [19]. On the other hand, the addition of Al2O3 increases viscosity, which may cause alloy or metal droplets to be entrained in the slag, causing reduced recovery of valuables [3,20]. A slag system based on MnO-SiO2-Al2O3 results in an Mn- and Li-enriched slag from which the metals are more easily extracted by hydrometallurgical treatment, as the concentration of Mn could be high enough [18].
Recently, Sommerfeld et al. and Klimko et al. proposed a combined pyro- and hydrometallurgical approach to recycle pyrolyzed LIB black mass [19,21]. In the first step, a Co-Ni-Cu alloy- and lithium-enriched slag was produced in a laboratory-scale electric arc furnace [19]. In the second step, a hydrometallurgical treatment was proposed for lithium recovery from the slag [21]. Holzer et al. studied a novel pyrometallurgical method in which they recovered 76–97% of lithium from batteries in a gas stream, from which it could be recovered for further processing [3]. Overall, the recycling approach by Sommerfeld et al. and Klimko et al. presented studies in which the pyrometallurgical step was used as a treatment method before hydrometallurgical treatment of the intermediate metal alloy/matte and slag products [19,21].
Pyrometallurgical processes usually consume reductants obtained from fossil fuels, and the estimated global consumption of metallurgical coal rose by 3.8% in 2019 [22]. To further reduce the environmental impact, options for replacing the conventional reductants are being widely researched in both ferrous and nonferrous metal production [23,24,25,26,27]. Al and carbon present in LIBs can act as reductants with Al slagged as Al2O3 and carbon transformed into carbon monoxide [9] or carbon dioxide.
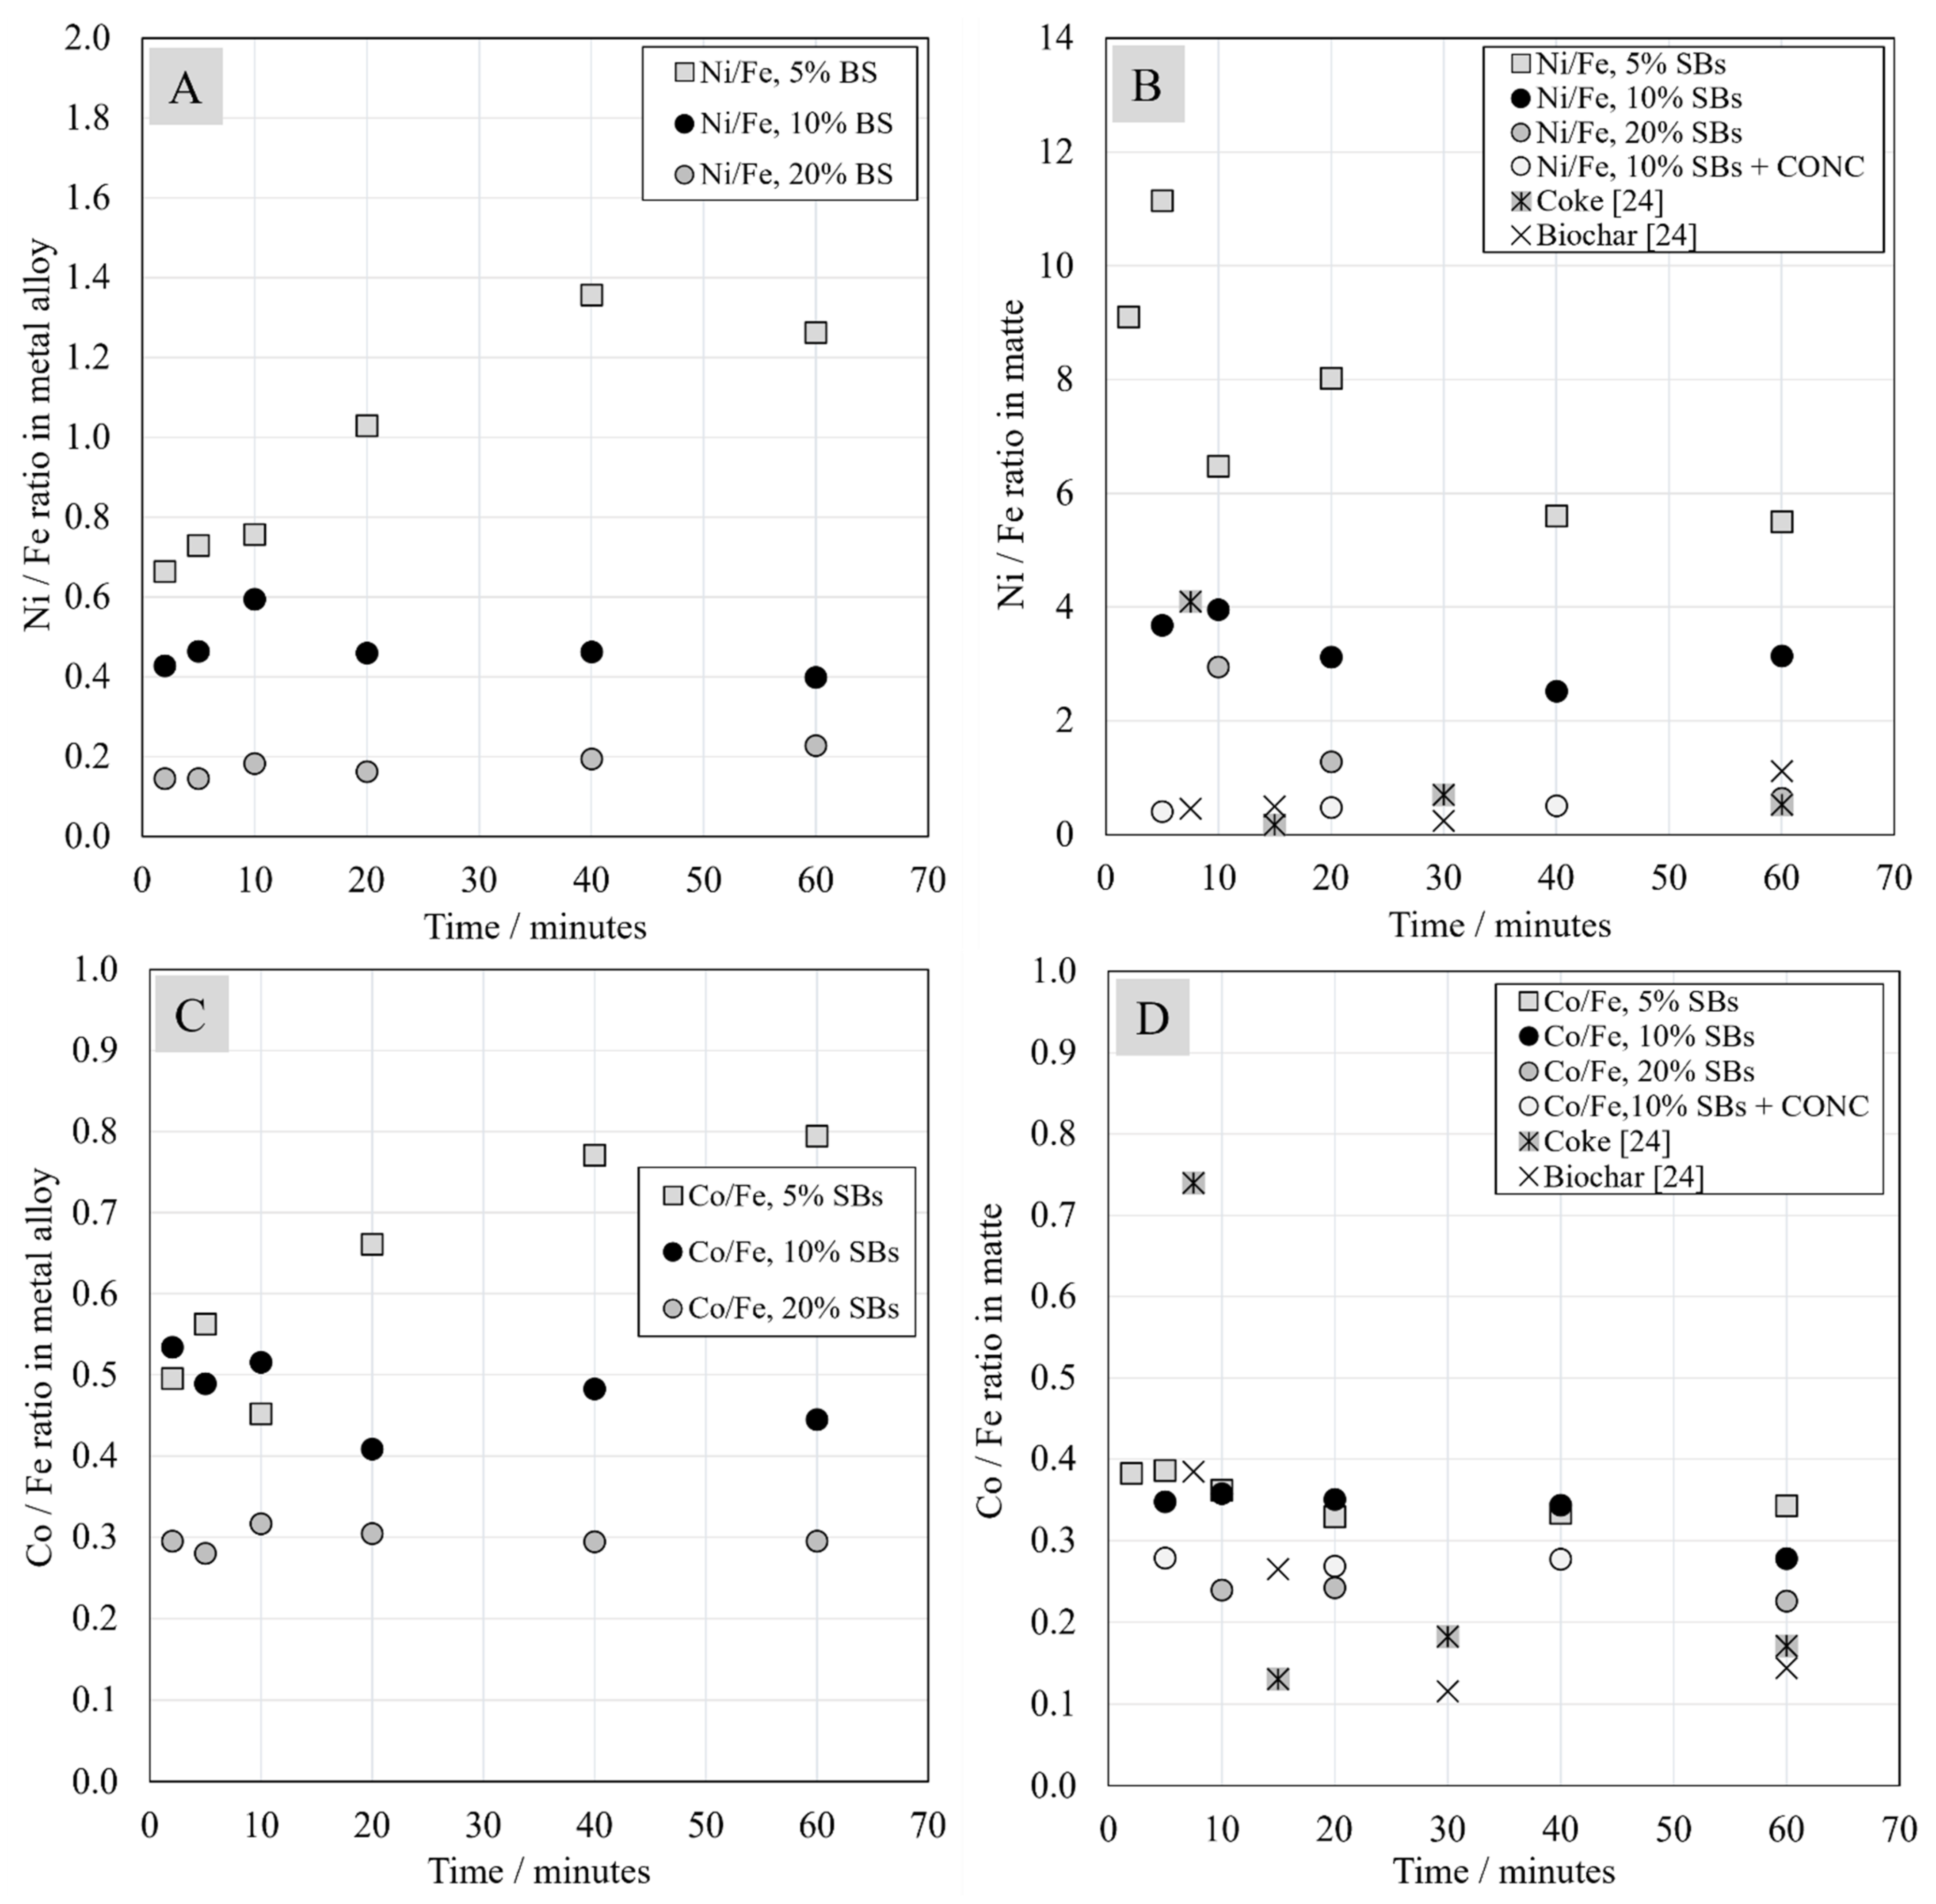
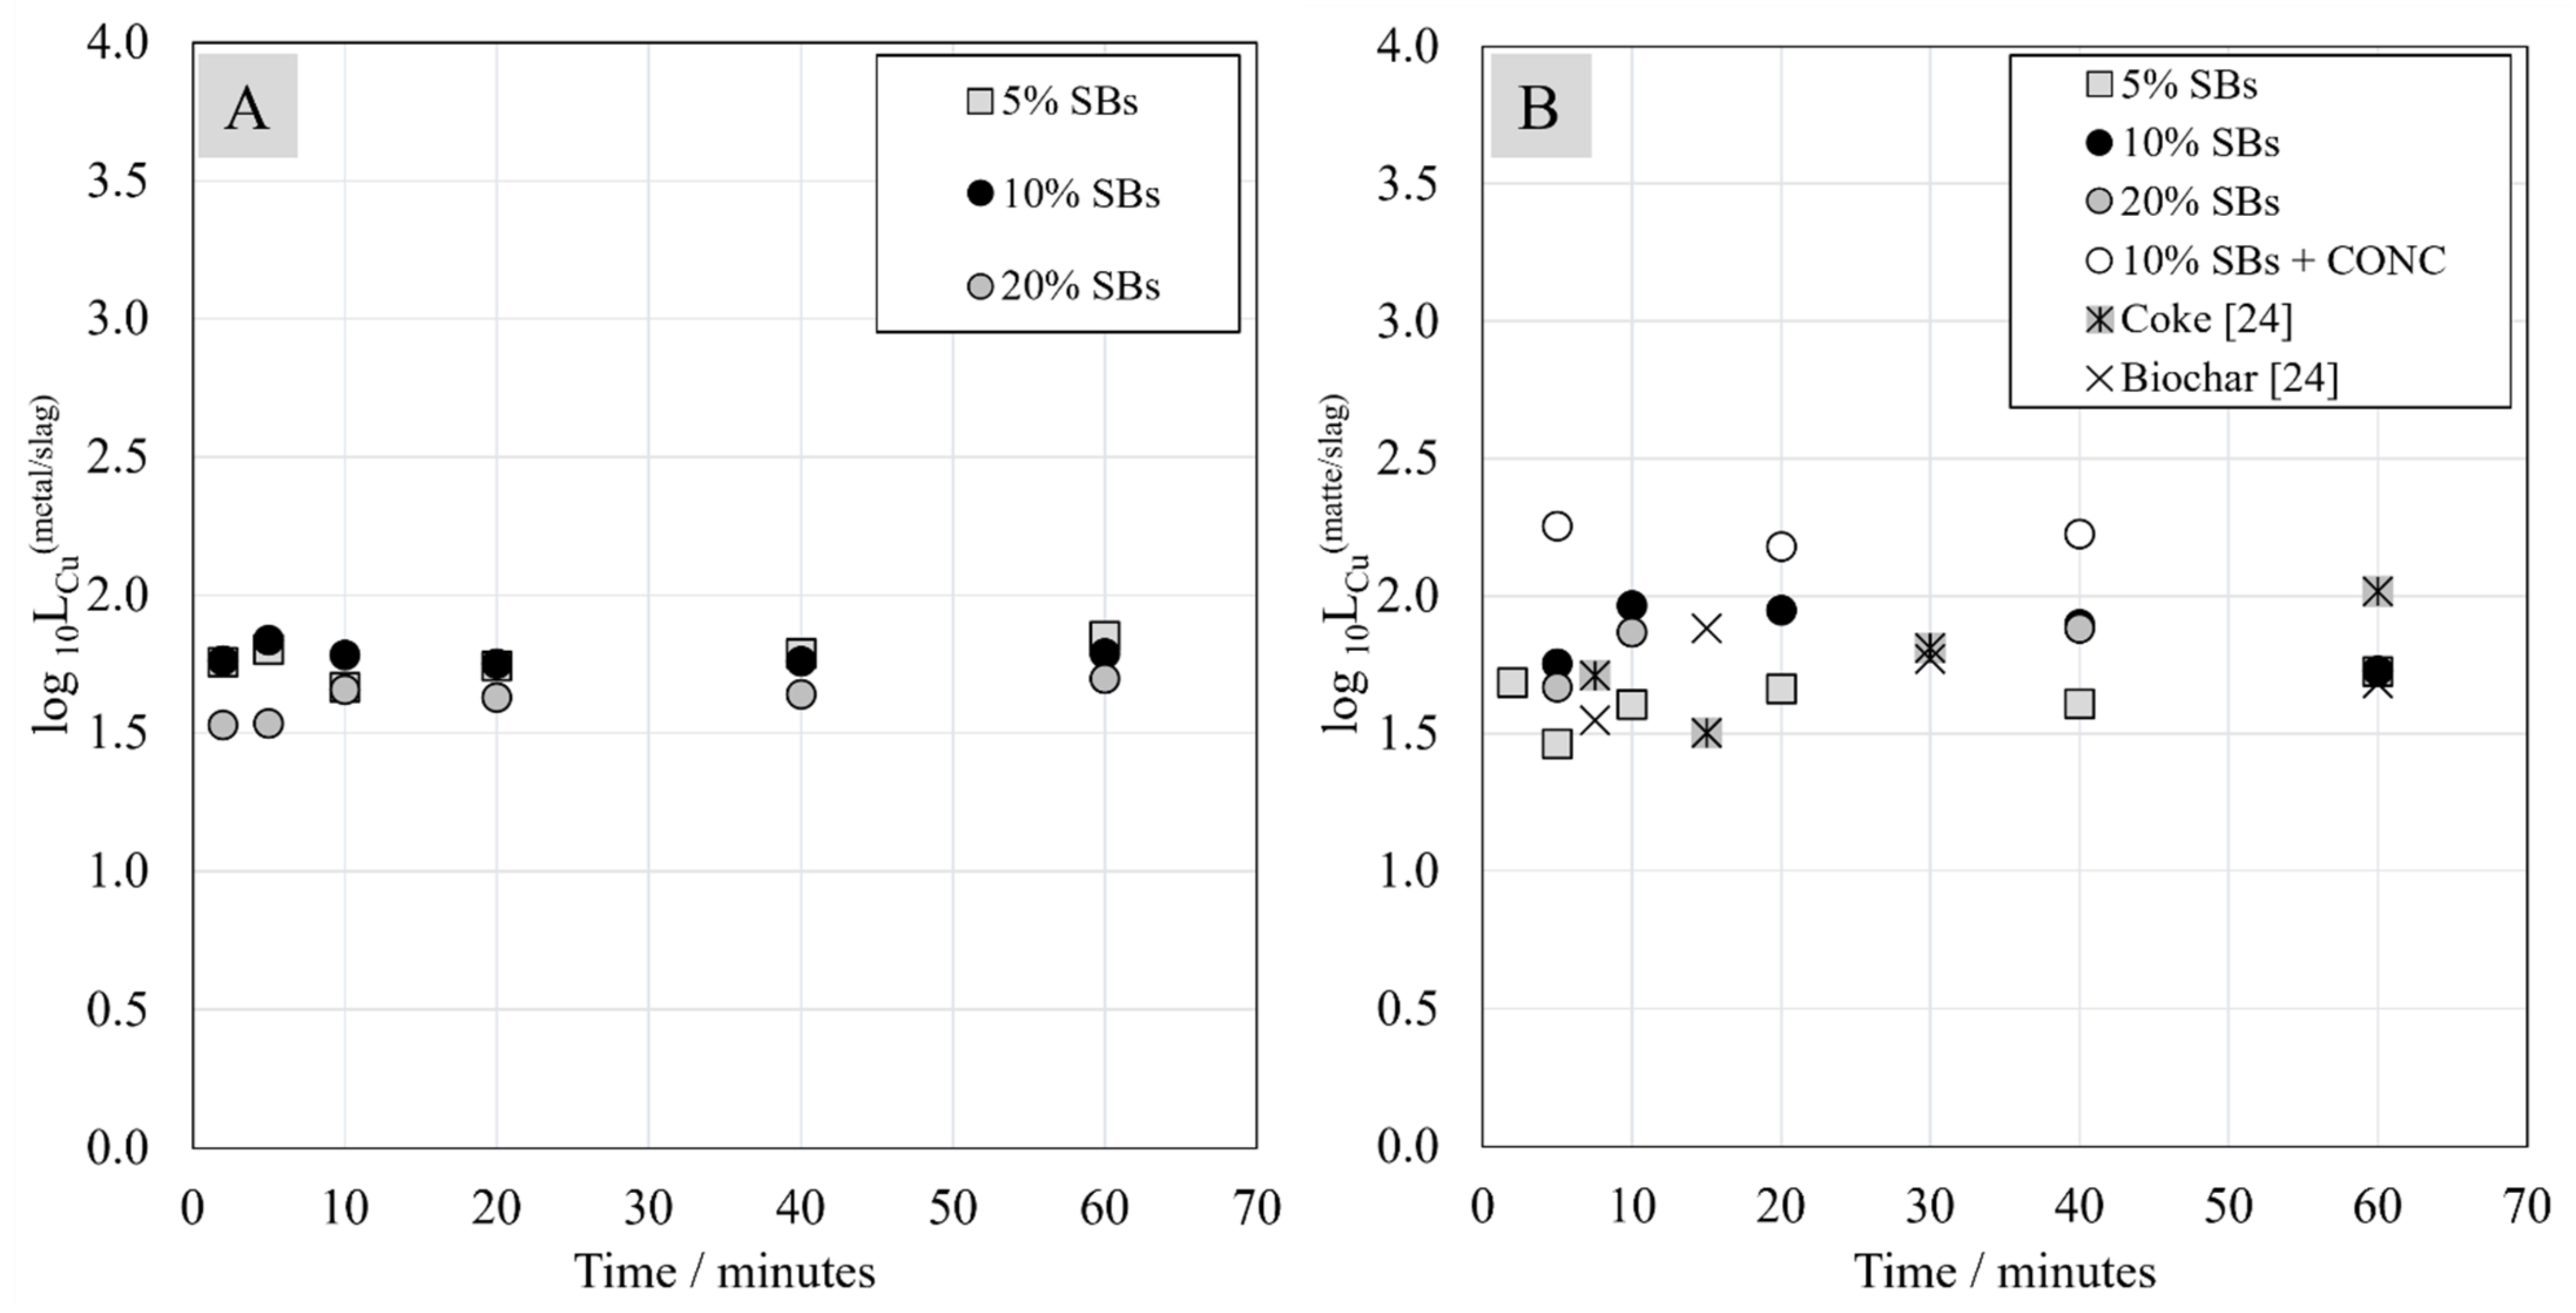
Avarmaa et al. compared coke and biochar as reductants to recover valuable metals from nickel slag. They also studied the effect of adding battery scrap, which contained ~33 wt.% carbon, to the mixture. It was concluded that biochar enhanced reaction kinetics compared to coke [24]. The presence of battery scrap notably increased the distribution coefficients of valuable metals and iron in matte [24].
Yu and Chattopadhyay presented an innovative approach to utilize spent potlining (SPL), a waste product from aluminum smelters containing 14 wt.% graphite, to improve the operating efficiency of Ni converter slag cleaning. In this case, 2 wt.% SPL was sufficient for complete settling of matte and higher additions of the reductant allowed for further reduction of dissolved oxides [25]. The SPL also contained ~24 wt.% Al2O3 [25] and ~33 wt.% SiO2, which increased slag viscosity [28]. Moreover, according to the literature [25,29], siliceous material, such as slags from the slag cleaning process, can stabilize the fluorides present in SPL, which results in low leachability of fluorine from slag when exposed to the environment. Therefore, it can be expected that fluorides from LIBs could also be potentially stabilized.
The aim of this research was to provide a novel approach to battery recycling, building on previous work by our group in which preliminary results from integrating flotation and nickel slag cleaning for recovering valuable metals from battery scrap were provided [8]. This study allows a deeper understanding of the time-dependent behavior of valuable metals Ni, Co, Cu, Li, and Mn in the investigated system. The concentrations of trace elements in the slag were accurately determined using the LA-ICP-MS technique. The goal of the study was also to investigate the effect of Ni-slag/spent battery scrap ratio on valuable metal recoveries by calculating trace-element distribution coefficients between metal/matte and slag phases. The results were compared to the literature to evaluate the reactivity and efficiency of graphite as a reductant in comparison to coke, biochar, and methane. Lastly, this work was aimed at identifying the different factors that may influence the formation of metal alloy and matte during the reduction process.

2. Materials and Methods

2.1. Sample Preparation

The experiments were conducted at simulated nickel-slag cleaning process conditions. The industrial slag from the Direct Outokumpu nickel flash smelting (DON) process contained Fe (35.86 wt.%) in the oxidation state of 2+ and/or 3+, SiO2 (33.86 wt.%), MgO (7.14 wt.%), CaO (1.65 wt.%), S (0.15 wt.%), and valuable metals Ni (3.46 wt.%), Co (0.46 wt.%), Cu (0.52 wt.%), and Zn (0.06 wt.%), mostly in oxidic form.
The spent batteries, referred to hereafter as SBs, utilized in this study came from a Finnish industrial operator and were treated according to the procedure described in detail in our previous study [8]. In the laboratory, the industrially prepared black mass sample (<1000 μm) was sieved using a vibratory sieve shaker (Fritsch, Analysette 3, Idar-Oberstein, Germany)), with a batch size of ca. 190 g, at an amplitude of 5.5 mm, over 10 min. The cutoff point was chosen at 500 μm. The >500 μm fraction, which was rich in Cu and Al but relatively low in its active material content, was then used as feed for froth flotation experiments. The purpose of the flotation treatment was to collect a graphite-rich fraction to be used as a feed for the pyrometallurgical process. The flotation process parameters, such as the choice of chemical reagents, were determined on the basis of previously published results [8]. To ensure the sustainability of the process, reagent concentrations were aimed to be kept at a minimum. When determining the minimum effective dosage of chemicals, the critical coalescence concentration was considered for the frother [30]. For the collector concentration, the previously published results served as a guideline. In order to provide a sufficient amount of material for the slag cleaning experiments, a total of four flotation experiments were carried out with identical parameters described in detail below.
Prior to each flotation experiment, a total of 40 g of feed was milled for 20 min in batches of approximately 13.33 g, using a vibratory micro mill (Fritsch, Pulverisette 0, Idar-Oberstein, Germany) at an amplitude of 6 mm. The milled feed was then poured into a 1 L flotation cell (Lab Cell 60 mm FloatForce mechanism, Metso Outotec, Espoo, Finland), and 1 L of tap water was added. The pulp was stirred for 3 min under 1000 rpm to ensure proper mixing. Then, 150 g/t of kerosene was added as collector, and 3 min of conditioning was allowed. Lastly, 8 ppm of MIBC (methyl isobutyl carbinol, used as frother) was added, followed by 2 min of conditioning. Throughout the chemical additions, the stirring rate was kept at 1000 rpm.
After conditioning the pulp, the air flow was turned on at a rate of 2 L/min, and froth was manually scooped continuously for 1 min. The resulting froth fraction and tailings were dewatered and dried in a convection oven at 40 °C (Memmert UE400, Büchenbach, Germany) for 48 h and characterized for Co, Ni, Mn, and Cu content by X-ray fluorescence (XRF, Oxford Instruments, X-MET 5000, Abingdon, United Kingdom). A modest drying temperature was chosen in order to avoid the possible degradation of fluorine-rich active particle surface (electrolyte, PVDF binder) into hazardous compounds, such as HF [14]. To account for the heterogeneous feed, five XRF measurements were performed for each sample, and an average value was calculated. The XRF values were further adjusted by a linear regression model, similarly to the previous study [8]. The dried 0–1 min fractions were then used as a feed for the Ni slag cleaning experiments. In order to provide sufficient amount of material for the slag cleaning experiments, a total of four flotation experiments were carried out with identical parameters.

2.2. Experimental Procedure of High-Temperature Process

The prepared slag/SBs mixtures in the amount of 1.0 g were weighted into a silica crucible. The crucible with the mixture was placed in a basket-shaped sample holder, made from Kanthal A-wire, which was used for hanging the sample inside the furnace.
Similarly to previous kinetic studies [8,24,31,32], the drop-quench method and an LTF 16/450 single-phase vertical tube furnace (Lenton, Parsons Lane, Hope, UK) were used in the experiments. The furnace parameters are summarized in Table 1, and a detailed schematic of the furnace was presented earlier in the study of Ruismäki et al. [8].
The basket with the sample was attached to Kanthal A-wire hanging from inside the furnace. After lifting the sample to the cold end of the working tube, the lower end of the furnace was closed with a rubber plug and the inert gas flow was turned on (Table 1). After flushing the furnace with argon for approximately 15 min, the sample was lifted into the hot zone. The contact time was measured from the moment the sample reached the hot zone. The samples were kept in the hot zone at 1350 °C for 2, 5, 10, 20, 30, 40, and 60 min. After the required contact time, the sample was quenched to solid state in 2–3 s. A detailed description of the quenching procedure was presented in an earlier equilibrium study [33]. In the next step, the quenched samples were dried, mounted in epoxy (Struers, Denmark), cut in half with a diamond cutting wheel, and mounted in smaller epoxy buttons in order to fit the SEM-EDS and LA-ICP-MS sample holders. The cross-sections of the samples were ground and polished with traditional wet metallographic techniques. The prepared cross-sections were carbon-coated with a vacuum evaporator (JEOL IB-29510VET, Jeol Ltd, Tokyo, Japan).

2.3. Characterization of Sample Composition

A scanning electron microscope (Mira3 SEM, Tescan, Brno, Czech Republic) was used for analysis of sample microstructures, and an UltraDry Silicon Drift energy-dispersive spectrometer (EDS, Thermo Fisher Scientific, Waltham, MA, USA) was applied for determining elemental concentrations in metal alloy and matte, as well as the concentration of major elements in the slag. For each sample, at least eight areas were selected for determining the elemental concentrations in each phase. In the SEM-EDS analysis, the beam current on the sample surface was approximately 11 nA, and the acceleration voltage was 15 kV. Proza-ZAF matrix correction procedure [34] was used for raw data processing. The standards used for the concentration quantifications are listed in Table 2.
The concentrations of trace elements in the slag were under the detection limit of EDS; therefore, laser ablation inductively coupled plasma mass spectrometry (LA-ICP-MS) was used to accurate analyze their concentrations. The analytical system comprised a 193 nm ArF excimer laser (Teledyne CETAC Technologies, Omaha, NE, USA) coupled to a single-collector sector field ICP-MS (Nu Instruments Ltd., Wrexham, UK). The following parameters were applied: laser spot size of 50 µm, laser firing frequency of 10 Hz, laser pulses lasting 4 ns, and fluence of 2.17 J/cm2 on the sample surface. Table 3 shows the standards and obtained detection limits.
The analysis protocol was five preablation pulses, 20 s pause, 20 s of gas background analysis, and 400 laser pulses for concentration quantification. The silicon concentration values, used as the internal standard, were obtained from the EDS. The mass spectrometer was operated in FastScan mode with low resolution for maximum sensitivity, and the time-resolved analysis signals were individually treated with the Glitter software (version 4.5) [35].
Table 3. Standards used and the detection limits obtained in LA-ICP-MS analysis; ppmw = parts per million by weight.
CuCoLiNiMnPbSnZn
External standard for slagNIST610 [36]
Internal standard for slag29Si
Detection limit for slag (ppmw) for the isotope used63Cu: 0.01059Co: 0.0057Li: 0.02560Ni: 0.09355Mn: 0.023208Pb: 0.001118Sn: 0.00868Zn: 0.159
From each sample, 10–12 points were analyzed from the slag, and most points were selected closer to the bottom of the sample, i.e., nearer the matte phase, and 2–3 points were taken closer to the surface, i.e., nearer the metal alloy phase. For most trace elements, concentration gradients existed in the slag, which was expected due to the relatively short high-temperature contact times. For cobalt, nickel, copper, zinc, tin, and lead, the concentrations in slag were generally lower close to the alloy. The lower concentrations obtained closer to the alloy were excluded from the results presented in this work.

3. Results and Discussion

3.1. Production of Graphite-Rich Fraction with Froth Flotation

Table 4 shows the head grade of the feed, as well as the recoveries and grades of Co, Ni, Mn, and Cu in the 0–1 min froth fraction, individually for each experiment. When dealing with real battery waste, instead of mixtures of analytically pure feed materials, some fluctuation in the feed composition is expected. Therefore, instead of using an average head grade value, the head grade values were calculated individually for each experiment on the basis of the recoveries and grades of the froth and tailings fractions. The fractions were first weighed, and grades (G) of Cu, Co, Mn, and Ni were measured directly with XRF and adjusted with ICP-MS. Then, the mass for each chemical species in the froth and tailings fractions was calculated by multiplying the grade with the fraction mass (m). For example, in the case of Cu in the 0–1 min froth fraction, the calculation was performed according to Equation (1).
mCu, Froth = mfroth × GCu, Froth.
By summing the elemental masses in the froth and tailings fractions, the total elemental mass was calculated, as indicated by Equation (2).
mCu, total = mCu, Froth + mCu, Tailings.
The elemental head grade (H) was then finally calculated by dividing the total elemental mass with the total feed mass, as shown in Equation (3).
HCu = mCu, total /mfeed.
The froth flotation fractions from the four flotation experiments were mixed together and homogenized for use in the pyrometallurgical treatment. The chemical composition of the mixture was analyzed by Labtium Oy and ALS Global, and the results are presented in Table 5. In Table 5, C* represents the total carbon concentration in the sample (e.g., graphite, plastics, PVDF, and carbon black), whereas Cg depicts the graphite concentration specifically. The characterization of total carbon content (by Labtium Oy) was carried out via a combustion technique using CS-580 (Eltra, Italy) analyzer. In the graphite characterization (by ALS Global), a combination of HCl leach (50%), roasting, and Leco furnace (Leco, The Nederlands) treatment was applied to remove other forms of carbon and to specifically quantify the graphite content.
In order to investigate the suitable slag/SBs weight ratio, three different starting mixtures with 5, 10, and 20 wt.% of SBs were prepared. The industrial slag was mixed together with the SBs in a mortar. A prepared slag/SBs mixture in the amount of 1.0 g was used in each experiment. According to the compositions of the industrial slag (presented in Section 2.1) and the SBs (Table 5), the chemical compositions of the starting mixtures were calculated as presented in Table 6.
Additionally, a mixture of slag, 10 wt.% of SBs, and an industrial Ni-concentrate was prepared in order to investigate the effect of sulfur addition on the reduction process. The purpose of adding industrial concentrate was also to lower the liquidus temperature of the forming alloy. Sulfur content in the concentrate varied between 22 wt.% and 30 wt.%. As the concentrate contained valuable metals Ni (8.0 wt.%), Co (0.4 wt.%), and Cu (4.2 wt.%), their concentrations in the starting mixture were elevated and estimated to be 3.92 wt.%, 2.46 wt.%, and 1.05 wt.%, respectively (with 10 wt.% of SBs).

3.2. Sample Microstructure

The sample microstructures were monitored with SEM using backscattered electron imaging. The microstructures of the samples with different starting mixtures after 40 min contact time at 1350 °C are presented in Figure 1. Typically, the sample microstructure consisted of the crucible (dark gray), slag (medium gray), and metal alloy (light gray), on the top part of the sample, and the matte phase (light gray), found near the bottom of the sample. The matte phase typically had a round shape, which suggests a high interfacial energy and poor wetting between the slag and matte, whereas the metal alloy formed on top of the slag had an irregular shape. According to Figure 1, it seems that the matte droplet size decreased with increasing battery scrap amount. However, the size of the matte droplet also depended on the sample cross-section.
In all samples with 5 wt.% of SBs in the starting mixture, the presence of slag, metal alloy, and matte was observed, as presented in Figure 2. In the samples with 10 wt.% of SBs, the same phases were found in all samples except the sample after 2 min contact time, where the matte phase could not be located in the existing cross-section.
It seems that, in the case of the samples with 20 wt.% of SBs in the starting mixture, a large “mushy” metal alloy phase, rich in iron, was formed and remained drifting on top of the sample. An example of sample microstructure with 20 wt.% of SBs after 40 min contact time can be seen in Figure 1. The matte phase was found to be present only in three of the samples (10, 20, and 60 min contact time). Similar findings were discovered in the previous study [8], where 20 wt.% of SBs were added to the same slag and the metal alloy did not settle to the bottom of the crucible; hence, no matte was found.
In the case of the sample with the addition of Ni-concentrate in the starting mixture, presented in Figure 1D, a large matte phase was formed at the bottom of the crucible and no metal alloy was formed on the top of the sample. The observed differences in the sample microstructure suggest that the formation and settling of the metal/matte phase depends on the carbon and sulfur contents in the sample.
Reduction of metal oxides by graphite/carbon caused the evolution of CO and CO2 gases. The gases form bubbles, resulting in slag foaming [20]. When the amount of graphite/carbon increased in the system, the overall degree of reduction increased as well. This resulted in much stronger evolution of CO and CO2 gases. The gas bubbles perhaps hindered the settling of the metal/matte toward the bottom of the crucible, as observed in Figure 1 and Figure 2. On the other hand, CO in the gas bubbles may be consumed by reduction reactions [20]. However, when passing the metal/matte-slag interface, any type of bubbles may burst, thereby mixing metal or matte droplets into the slag [28]. It is also possible that, with the increasing addition of battery scrap and graphite, the slag viscosity increased, which in turn decreased the settling rates of metal and matte. In the studies by Yu and Chattopadhyah, fine coke powder (<38 µm) caused foaming of the slag, which enhanced the nucleation of metal droplets, resulting in an overall increase in slag viscosity [25].
Similar phenomena were described in the work of Yu and Chattopadhyah where the effect of spent potlining (SPL) addition to fayalitic nickel converter slag was studied. The SPL used in that study contained approximately 14 wt.% carbon, 4 wt.% NaF, and different metal oxides. The results showed that, with the addition of 2 wt.% SPL in the starting mixture, matte settling was effectively promoted as the SPL addition reduced the slag viscosity [25]. However, with the increasing addition of SPL in the mixture (up to 10 wt.%), the slag viscosity and gas evolution increased, resulting in slag foaming. It was shown that the gas bubbles can carry small metal/alloy droplets to the top of the slag [25]. According to Kucharski et al., foaming increases the surface area for reduction reactions, which plays a crucial role in metal recovery [20]. Excessive carbon floating on top of the molten slag bath causes localized slag reduction and alloy formation [25].
Figure 2 shows microstructures of the samples with 5 wt.% SBs in the starting mixture after 2, 5, 10, and 60 min contact times. After 2 min contact time, small matte droplets were found in the lower part of the slag, and small areas with metal alloy were discovered on top of the slag. After 5 and 10 min contact times, the formed matte phase coalesced into larger droplets. As shown in Figure 1, after 40 min contact time, a bigger matte phase was found on the bottom of the slag similarly to the sample after 60 min contact time. Moreover, the size of the metal alloy phase in the samples seemed to increase along with contact time; however, no definitive conclusions can be drawn regarding the amount of metal alloy on the basis of one sample cross-section only.
Figure 3 presents the typical microstructures of metal alloy and matte phases. The metal alloy was mainly homogeneous; however, similarly to the previous study [8], some darker gray net-like areas containing Ni- and Cu-sulfides were also visible. In the matte phase, the sulfides (darker gray areas) were distributed more evenly withing the matte droplet. Additionally, very small round areas with darker gray color were found in the matte, which were identified with EDS as mostly iron oxides. The chemical compositions of the metal alloy and matte are described in detail in the next section.

3.3. The Concentrations of Major Elements in the Slag

Fe and Si are the major elements in the slag, and their concentrations are presented in Figure 4A,B. Iron concentrations in the starting mixtures were around 34, 32, and 29 wt.% with 5, 10, and 20 wt.% of SBs, and the iron concentration in slag decreased significantly during the first 20 min of reduction. After 60 min contact time, iron concentration in the slag reached around 28 wt.% for the systems with 5 wt.% and 10 wt.% of SBs, and around 20 wt.% for the system with 20 wt.% of SBs. Contrary to iron, silicon concentration in the slag increased with longer contact time. Similarly to the case of iron concentration, the most significant change in Si concentration occurred during the first 20 min. The reason for the increase in Si concentration was the reduction of iron oxide and other metal oxides, as well as the dissolution of silica from the crucibles used in the experiments.
As stated in previous studies [23,33], the Fe/SiO2 ratio is a distinctive parameter of slags, and it is typically used as a control variable in industrial processes. In the industrial nickel-slag cleaning process, the Fe/SiO2 ratio varies between 0.9 and 1.1 [37,38]. In the investigated system, the ratio decreased over time as the Fe concentration in slag decreased, which is fully in line with the previous findings [23,24]. The Fe/SiO2 ratio in the system with 10 wt.% of SBs was slightly lower than in the system with 5 wt.% of SBs and the lowest in the system with 20 wt.% of SBs in the starting mixture. The addition of Ni-concentrate to the samples with 10 wt.% of SBs did not seem to have an influence on the Fe/SiO2 ratio. After 60 min contact time, the Fe/SiO2 ratios were around 0.6 and 0.3 in the systems with 5 wt.% and 20 wt.% of SBs, respectively, which are considerably lower compared to industrial practice due to silica saturation.
Magnesium and aluminum concentrations in the slags are presented in Figure 5. Their concentrations did not significantly change when the reduction proceeded, as MgO and Al2O3 are very stable oxides and do not deport in the matte or alloy phases in the experimental conditions. In the systems with 5 wt.% and 10 wt.% of SBs, Mg concentrations were quite similar and varied between 3.8 wt.% and 4.6 wt.%. The addition of Ni-concentrate slightly increased the concentration of magnesium in the slag. For the system with 20 wt.% of SBs, the concentration values were between 5 wt.% and 6 wt.%.
In the starting slag/SBs mixture, Al was present mostly in oxidic form as it originated from the industrial slag. However, a portion of Al, between 0.14 wt.% and 0.58 wt.%, was present in metallic form (wires from the spent batteries). Due to the high stability of aluminum oxide, in the experimental conditions, metallic Al was oxidized to Al2O3 and remained in the slag. Thus, although present in very low concentrations, metallic Al also acted as a reductant in the system [39]. Al concentration in slag was higher, between 2 wt.% and 3 wt.% in the system with 20 wt.% of SBs, in comparison to systems with lower concentration of 5 wt.% and 10 wt.% of SBs, where the Al concentration varied between 1.1 wt.% and 1.8 wt.%. The higher Mg and Al concentrations in slag with 20 wt.% of SBs can be explained by the increased reduction degree of iron oxides, as well as other less stable metal oxides, i.e., decreased total slag volume, due to the presence of more graphite.

3.4. Trace Elements in the Slag

The concentrations of Li, Mn, Ni, and Co, in the slag, analyzed with LA-ICP-MS, are presented in Figure 6. In the study of Tirronen et al., the distribution of battery elements in the copper converting process was investigated, and Li concentrations in the slag and magnetite were analyzed [40]. In a previous study, the equilibrium Li concentration in the slag obtained during simulated black-copper smelting conditions was analyzed with the same technique [41]. In that work, lithium distribution between copper alloy and the slag was investigated in equilibrium at 1300 °C under reducing conditions, i.e., oxygen partial pressure between 10−11 and 10−8 atm. According to the results in that study, Li deported heavily into the slag phase at 1300 °C in all investigated conditions. Lithium slagging was also studied by Sommerville et al. [14].
In the current study, concentrations of lithium and manganese in the slag, presented in Figure 6A,B, seemed to be relatively constant as a function of time in the systems with 5 wt.% and 10 wt.% of SBs. The addition of Ni-concentrate did not have an effect on Li and Mn concentrations. In the case of the system with 20 wt.% of SBs in the starting mixture, lithium and manganese concentrations increased slightly between 2 and 20-min contact time, before decreasing as the contact time increased from 20 to 60 min. Consequently, at 60 min contact time, lithium and manganese concentrations in the slag were similar to their concentrations after the short 2 min contact time. Therefore, it can be concluded that lithium and manganese deported heavily into the slag phase similarly to the previous equilibrium study [41].
Ni and Co concentrations in slag, presented in Figure 6C,D, decreased as the reduction proceeded. The most significant change in their concentrations occurred within the first 20 min. Nickel concentration in the slag decreased with the increasing addition of battery scrap. In the system with 20 wt.% of SBs, Ni concentration in the slag was especially low, and its value decreased from 0.16 wt.% to 0.005 wt.%. This indicates extremely efficient nickel reduction when the highest amount of graphite was present in the system. The addition of Ni-concentrate decreased the concentrations of Ni and Co in the slag, indicating better recovery of these elements.
The slag from the industrial slag cleaning process contains less than 0.5 wt.% Ni, approximately 0.2 wt.% Co, and approximately 0.2 wt.% Cu [37,38]. In the investigated systems, the nickel concentrations in the slags were below 0.5 wt.% in all samples with 10 and 20 wt.% of SBs, and, in the system with 5 wt.% SBs, Ni concentration reached a value below 0.5 wt.% after 40 min of reduction. However, in the case of cobalt, its concentration in the slag reached reported industrial concentration values only in the system with 20 wt.% of SBs in the starting mixture.
The results showed very low (below 0.2 wt.%) concentrations of copper in the slags and, surprisingly, the concentration did not significantly decrease with increasing time. Copper concentration in the slag, as well as concentrations of lead, tin, and zinc, is presented in the Supplementary Materials (Figure S1). Copper concentration in the slag decreased with the increasing amount of battery scrap in the starting mixture. Zn, Sn, and Pb concentrations in the slag were below 800 ppmw, 35 ppmw, and 80 ppmw, respectively, and their values decreased with the increasing contact time. The addition of Ni-concentrate decreased the concentrations of Cu, Zn, Sn, and Pb in the slag.

3.5. Chemical Composition of Metal and Matte

As presented in Section 3.2, the metal phase was formed on top of the sample, whereas the matte phase settled on the bottom of the crucible. In all samples, both phases contained iron, nickel, cobalt, and copper. The biggest differences in composition of these phases were related to the sulfur and iron contents. The concentration of sulfur in metal alloy was below 0.1 wt.%, whereas its concentration in matte, presented in Figure 7A, was between 3 wt.% and 9 wt.% and between 19.7 wt.% and 21 wt.% in the system with added Ni-concentrate. Therefore, the composition of the metal alloy can be described as Fe-Co-Ni-Cu, whereas the composition of matte can be described as Ni-Fe-Co-Cu-S. The sulfur content in the matte decreased with increasing concentration of battery scrap in the starting mixture. In the industrial slag cleaning process, only the matte phase is formed, and the sulfur content in the final product reaches 6.9 wt.% according to Warner et al. [37].
According to Yu and Chattopadhyay, the degree of sulfur removal significantly affects the composition of the matte phase. Their results showed that the concentration of Co + Ni + Cu increased from around 0 wt.% to 55 wt.% when the sulfur concentration decreased from 38 wt.% to 30 wt.% [25]. Figure 7B shows the concentrations of Ni + Co + Cu in matte as a function of sulfur concentration in the same phase. In the system with Ni-concentrate in the starting mixture, the concentrations of valuable metals were much lower than in the system without it.
Figure 7B shows the results from this study plotted against results from other studies using coke, biochar, and methane as reductants in nickel slag cleaning process conditions. The comparison gives indicative results as the experiments were not conducted identically. In the case of biochar and coke, the exact amount of reductant is unknown [24]. In the methane experiments, the quenching technique and sample size are different [23]. Nevertheless, according to Figure 7B, in general, utilizing biochar, methane, and coke seems to yield the lowest concentration of valuable metals in matte. On the other hand, the sulfur content in matte was also lower than with spent batteries addition. It seems that, when utilizing only battery scrap as the reductant, without addition or coke or biochar, higher contents of sulfur in matte are obtained. It must be noted that only one metallic phase, denoted matte, was detected in samples reduced by coke or biochar, whereas, in this study, in addition to the matte phase, an alloy phase was formed.
Iron concentrations in metal alloy and matte are presented in Figure 8. The iron concentration in the metal alloy formed in the system was much higher than in the matte. In the system with 5 wt.% of SBs, iron concentration in the metal alloy reached 42 wt.% and that in the matte reached around 8 wt.% after 2 min contact time. In metal alloy, the iron concentration decreased to around 30 wt.% after 60 min contact time and that in the matte increased to 12 wt.%. Iron concentration in both metal alloy and matte increased with the increasing fraction of battery scrap in the starting mixture. Consequently, it can be stated that, with the increasing amount of added battery scrap, the concentration of the reductant (graphite) increased as well, resulting in increased iron oxide reduction from the slag.
The total concentration of valuable metals (Ni + Co + Cu) in metal alloy or matte highly depends on the iron concentration in that phase, as presented in Figure 9. The total concentration of these metals in the matte was significantly higher than in the metal alloy, as the iron concentration was much lower in the matte phase. It was observed that the concentration of valuable metals linearly depends on iron concentration; a higher concentration of valuables in matte or metal results in a lower iron concentration. With the increasing addition of a reductant, the concentration of iron in both metal alloy and matte increased, and the concentration of valuable metals decreased. This does not mean that fewer valuable metals were recovered from the slag, only that they were more diluted in the matte or alloy phases as the volume of these phases increased due to increasing iron reduction.
In the DON process, the concentration of valuable metals (Ni + Co + Cu) in the matte is approximately 55–60 wt.%, whereas the iron concentration is approximately 35 wt.% according to Warner et al. [37]. In the present study, the concentration of valuable metals in the matte was much higher in the system with 5 and 10 wt.% of SBs in the starting mixture.
The results from the previous studies of Avarmaa and Ruismäki are also plotted in Figure 10 [23,24]. Utilizing coke as reductant seems the least feasible option in terms of concentration of valuables in matte. Long reduction time allows more iron to deport into alloy and matte. However, one data point with coke indicates similar results to those when utilizing 5 wt.% of battery scrap. Utilizing 20 wt.% of battery scrap yields quite scattered results compared to results utilizing biochar and methane. However, results from using methane were scattered as well, whereas results from 10 wt.% and 5 wt.% of battery scrap fit very well to the linear trend. In the case of using coke and biochar, it should be noted that an excess of reductant was used in the experiments and, therefore, long contact times allowed the reduction to proceed unnecessarily far, i.e., the iron concentration in matte increased significantly beyond the desired level.
Concentrations of nickel and cobalt in metal alloy and matte are presented in Figure 10. Nickel concentration in the metal alloy and in the matte depends significantly on the amount of battery scrap added to the system. In the system with 5 wt.% of SBs, nickel concentration was about three times higher than in the system with 20 wt.% of SBs. In both systems with 5 and 20 wt.% SBs, nickel concentration increased with the increasing contact time. In the case of the system with 10 wt.% of SBs in the starting mixture, the increasing trend was not evident. Similarly to the metal alloy, nickel concentration in the matte decreased with increasing amount of battery scrap added to the system. These decreasing nickel concentrations can be explained by the increasing reduction of iron oxides from the slag.
Cobalt concentration in the metal alloy varied between 18 wt.% and 26 wt.%, whereas its concentration in the matte changed between 2 wt.% and 12 wt.%. It seems that cobalt concentration in matte increased with the increasing addition of battery scrap in the starting mixture, whereas the concentration trend in metal alloy was less evident. However, the cobalt concentration as a function of time remained relatively stable in the alloy.
The concentrations of copper in metal alloy and matte are presented in Figure S2 (Supplementary Materials). Copper concentration was much lower compared to nickel and cobalt, between 2 wt.% and 11 wt.% depending on the mixture. Copper concentration in the metal alloy decreased with an increasing amount of battery scrap in the starting mixture. This trend was not that evident in the sulfide matte. The highest concentration of copper in the matte was reached in the system with Ni-concentrate. It is worth noting that the standard deviations of copper concentration in the matte were higher compared to the standard deviations of nickel and cobalt concentrations, because copper was mostly found as Cu-sulfides in the darker gray net structure presented in Figure 3B.
In the DON process, the electric furnace matte is leached in a separate EF matte leaching circuit in the nickel refinery. The process consists of two leaching steps in which nickel, cobalt, and copper are leached, whereas iron is precipitated in a controlled way [42]. Therefore, the concentration of valuable metals in the matte should be adjusted according to the limitations of hydrometallurgical treatment. Ideally, the nickel/iron and cobalt/iron ratios should be high in order to increase the recovery efficiency and lower the processing costs.
There are several studies [3,8,9,18,19,23] suggesting pyrometallurgical processing of LIBs with subsequent refining of the forming metal alloy/matte. In some cases, the processing is coupled with the recovery of metals from the forming slag. For example, Xiao et al. produced alloy powders from a Co-Ni-Cu-Fe-Mn alloy by fire refining followed by water atomization to enable increased process speed of the consequent rusting–leaching using sulfuric acid as the leaching agent. In this case, 98.7% Cu, 99.8% Co, and 99.8% Ni were recovered by leaching [43].
Figure 11 shows the nickel/iron and cobalt/iron ratios in the metal alloy and matte as a function of time. It is evident that an increase in the amount of battery scrap decreased the ratio of valuable metals to iron, because the concentration of iron increased. Utilizing coke and biochar as reductants yielded Ni/Fe ratios in the matte similar to 10 wt.% of SBs with nickel concentrate addition. With 5 wt.% of SBs, the Ni-, Co-, and Cu-to-Fe ratios in metal increased with increasing reduction time, whereas, with higher battery scrap amounts, the ratios seemed to remain constant or decreased slightly. In matte, the trends seemed to decrease for all valuable metals.

3.6. Distribution Coefficients of Ni, Co, and Cu between Metal, Matte, and Slag

Distribution of metals between different phases in high-temperature processes is typically expressed by the distribution coefficient. The equations used in determining the metal distribution coefficients were described in detail in the study of Sukhomlinov et al. [44]. In the present study, the distribution coefficient of metal Me was expressed as the ratio of its weight concentrations in different phases, according to Equations (4) and (5).
L M e m e t a l / s l a g = w t %   M e   i n   m e t a l   a l l o y w t %   M e   i n   s l a g .
L M e m a t t e / s l a g = w t %   M e   i n   m a t t e w t %   M e   i n   s l a g .
The logarithm of the distribution coefficient of nickel between metal alloy and slag, as well as between matte and slag, as a function of contact time is presented in Figure 12. It is evident that nickel distribution coefficient increased with the increasing amount of the reductant in the starting mixture. The distribution coefficient for Ni between matte and slag reached slightly higher values compared to those between metal and slag. The biggest change in the nickel distribution coefficient occurred during the first 20 min of reduction. After 40 min of reduction time, the distribution coefficient of nickel seemed to remain constant. In the case of systems with 5 wt.% and 10 wt.% of SBs, the logarithms of distribution coefficients between the metal alloy and the slag reached approximately the same value, 2.3, after 40 min of contact time. At the same contact time, the distribution coefficient of nickel between the matte and the slag reached slightly higher values, 2.5 and 2.7 for the systems with 5 wt.% and 10 wt.% of SBs, respectively.
The highest Ni distribution coefficient was reached in the system with 20 wt.% of SBs. After 40 min of contact time, its value between the metal alloy and the slag was 3.1, and that between the matte and the slag was 3.4. The obtained values of nickel distribution coefficient between the matte and slag are similar to those in the experiments utilizing coke and biochar as reductants [24]. In the study of Ruismäki et al., in which methane was used as a reductant, the nickel distribution coefficient between matte and slag was determined only for short contact times, between 1 and 5 min. The values were similar to the current study with 5 wt.% of SBs in the starting mixture after short contact times [23].
Figure 13 shows the logarithm of cobalt distribution coefficient between metal alloy and slag, and between matte and slag. Similarly to the case of nickel, the cobalt distribution coefficient increased with the increasing amount of reductant in the starting mixture. Additionally, the distribution coefficient of cobalt between the metal alloy and slag was higher and, thus, more favorable than its distribution between the matte and slag.
Data from previous studies [23,24] were added for the comparison in Figure 13B. It seems that the highest distribution coefficient values were reached in the system with biochar as the reductant. However, it should be highlighted that, in the study of Avarmaa et al., considerably higher amounts of biochar and coke were added in comparison to the amount of graphite utilized in our study [24]. The exact comparison of results between this study and the studies by Ruismäki et al. [23] and Avarmaa et al. [24] is further complicated by the different analytical techniques used for phase composition analyses (only EDS by Ruismäki et al.; EPMA for matte and slag by Avarmaa et al.).
The distribution coefficient of copper between different phases is presented in Figure 14. These values remained relatively constant over the studied contact times. According to the Ellingham diagram presented in an earlier study [23], copper oxide has high (more positive) Gibbs energy in comparison to nickel and cobalt oxides, which means that it will reduce easier than nickel and cobalt oxides. As the distribution coefficient of copper basically did not change as the contact time increased, it can be concluded that the thermodynamic equilibrium was obtained very rapidly for copper in the investigated systems.
In contrast to nickel and cobalt, the amount of battery scrap addition does not seem to have an influence on the distribution coefficient of copper between the metal alloy and slag. In the case of distribution between the matte and slag, the distribution coefficient values increased slightly with the increasing amount of battery scrap in the starting mixture. Additionally, in the system with the added Ni-concentrate, the distribution coefficient of copper between the matte and slag was higher than in the systems without concentrate. In the study by Avarmaa et al., where biochar and coke were used as reductants, the copper distribution coefficient between the matte and slag reached similar values to the current study [23].

4. Conclusions

In the previous study by our research group [8], graphite from lithium ion-batteries was successfully used as a reductant in the nickel-slag cleaning process conditions. It was also indicated that integrating battery recycling with the existing nickel-slag cleaning process allows the recovery of nickel and cobalt in the form of Fe-Ni-Co-Cu metal alloy. The current study provides further insights into this interesting concept by investigating how different Ni-slag/spent batteries (SBs) ratios influence the distribution of metals into different phases and their recovery possibilities.
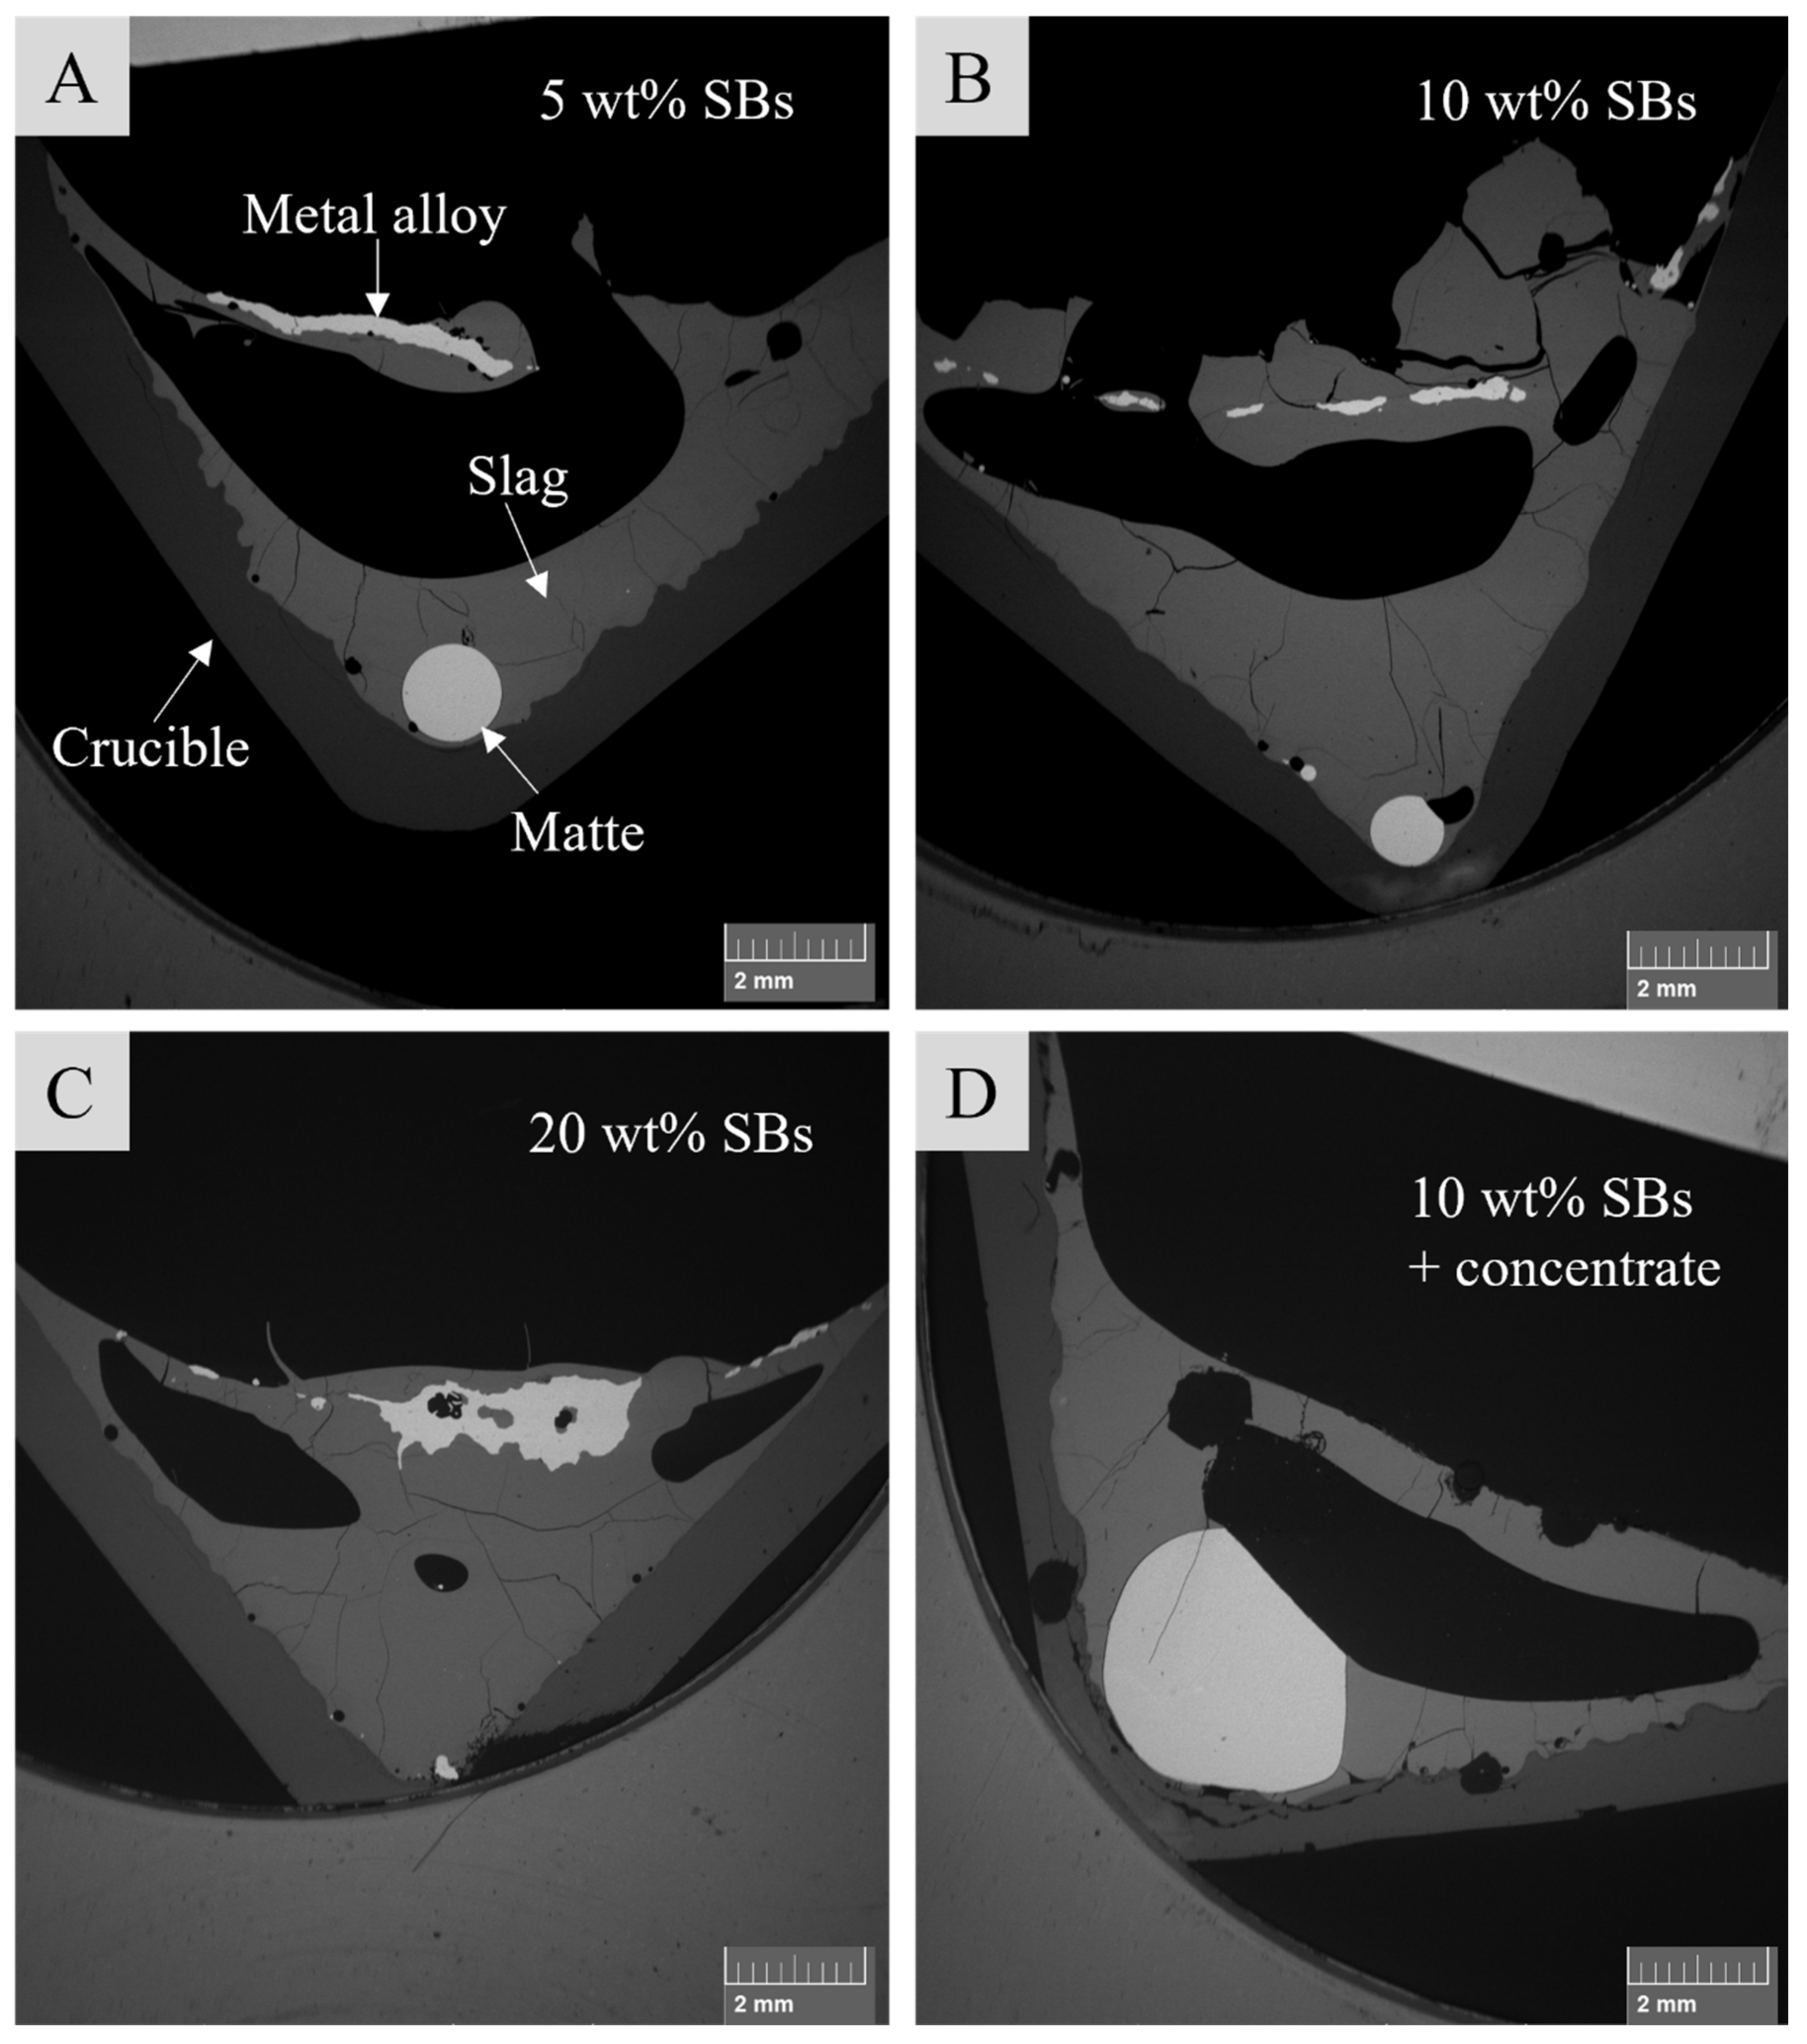
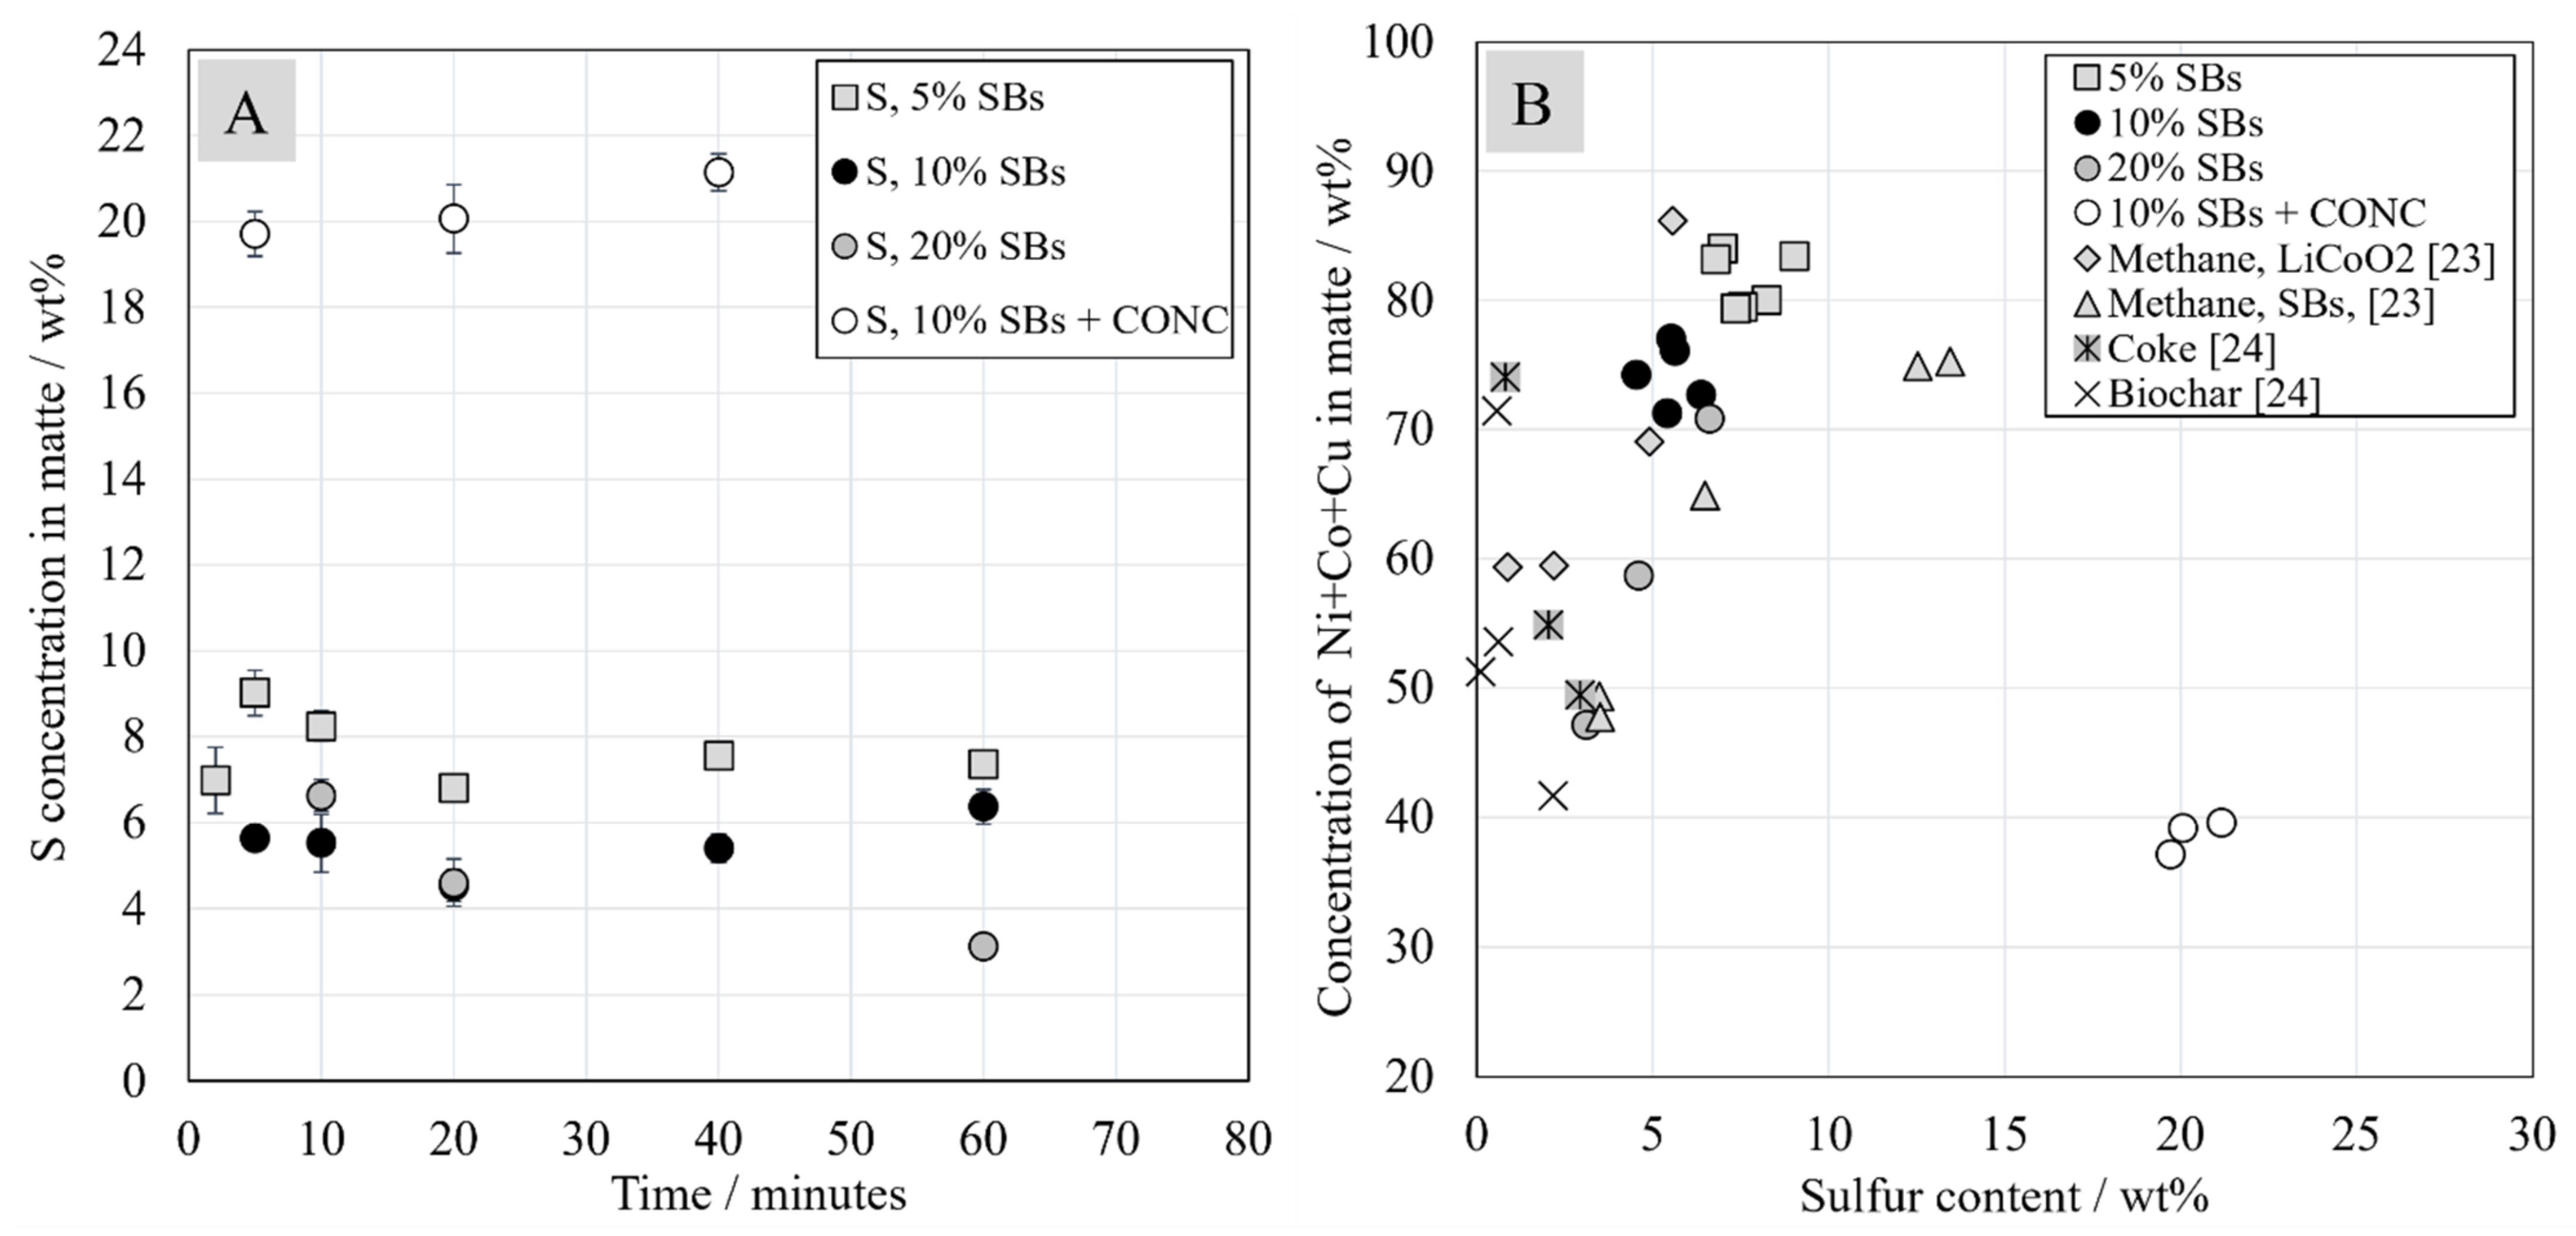
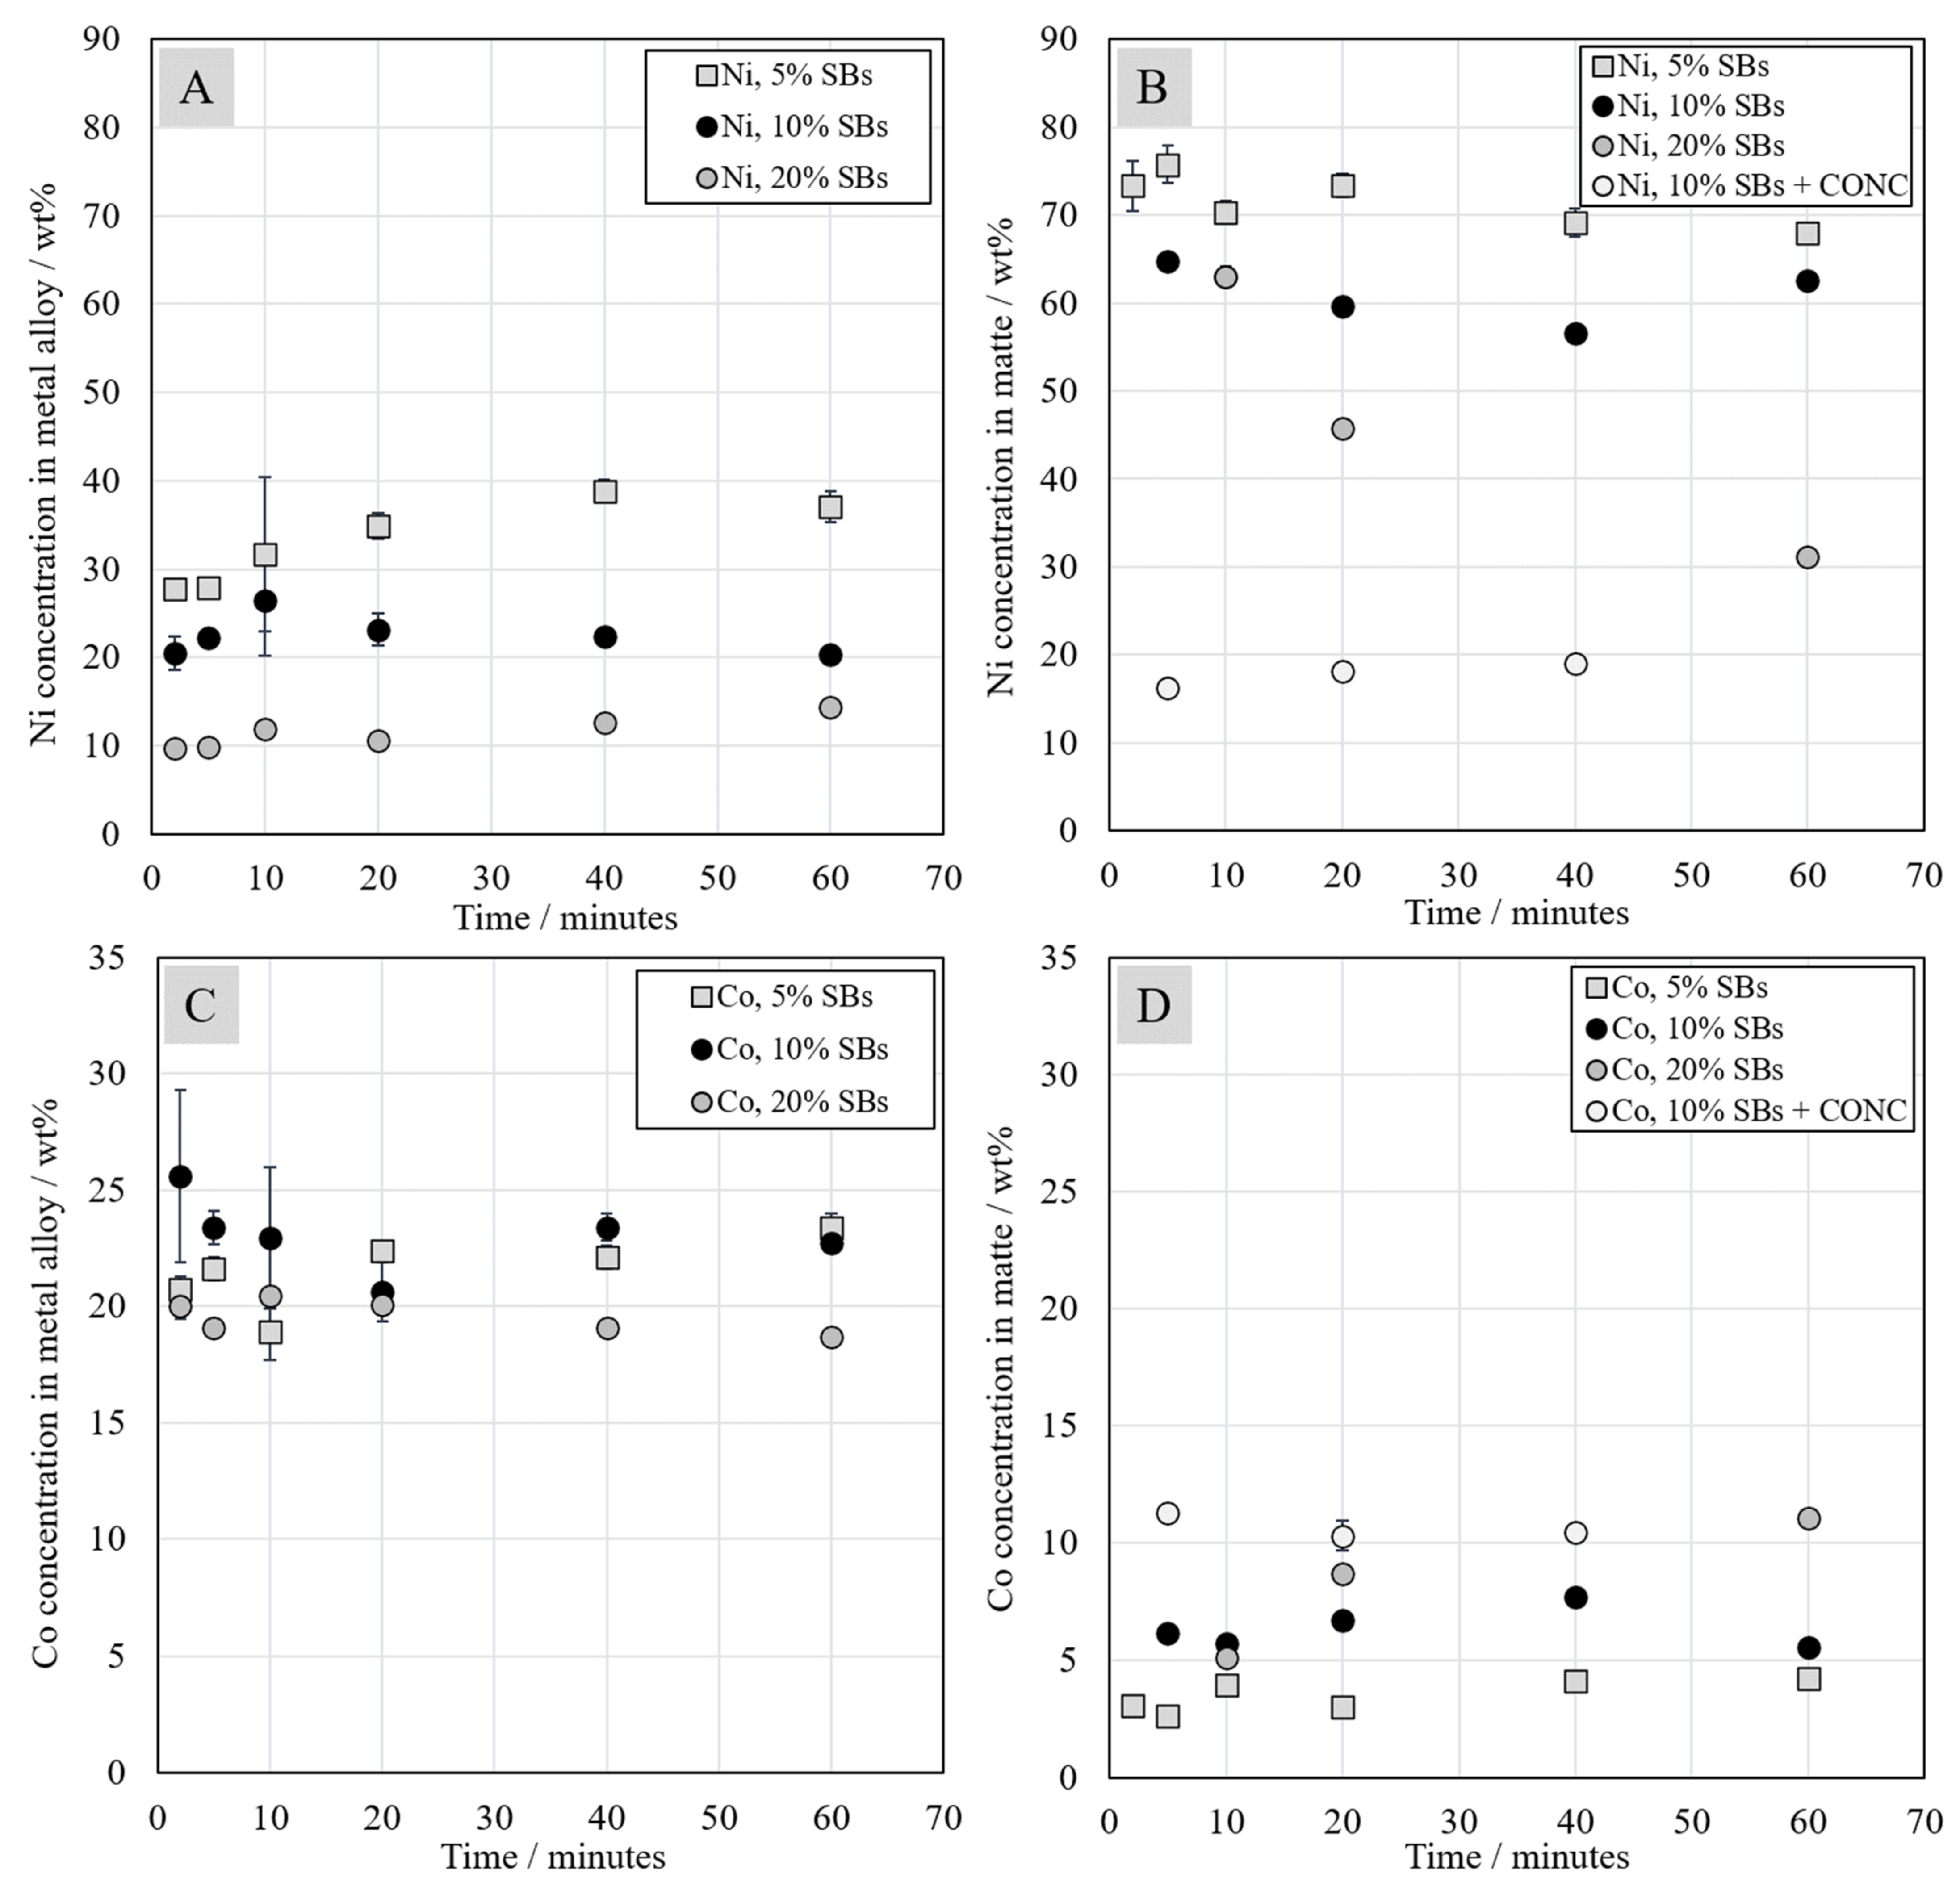
Four starting mixtures with different Ni-slag/SBs ratios were used. Three different phases were formed in the systems after high-temperature reduction: slag, Fe-Co-Ni-Cu metal alloy, and Ni-Fe-Co-Cu-S matte. All three phases were observed in almost all samples with 5 wt.% and 10 wt.% of SBs scrap in the starting mixtures. The matte phase was not found in some of the samples with 20 wt.% of SBs addition. Similarly, it was not observed in the previous study [8]. The addition of the Ni-concentrate resulted in disappearance of the metal alloy phase and its dissolution in the matte, and it greatly enhanced the formation of the matte and its settling toward the bottom of the crucible. These observations are in line with the findings of Yu and Chattopadhyay, which showed that sulfur and graphite concentrations in the starting mixtures have an influence on the metal alloy and matte formation [
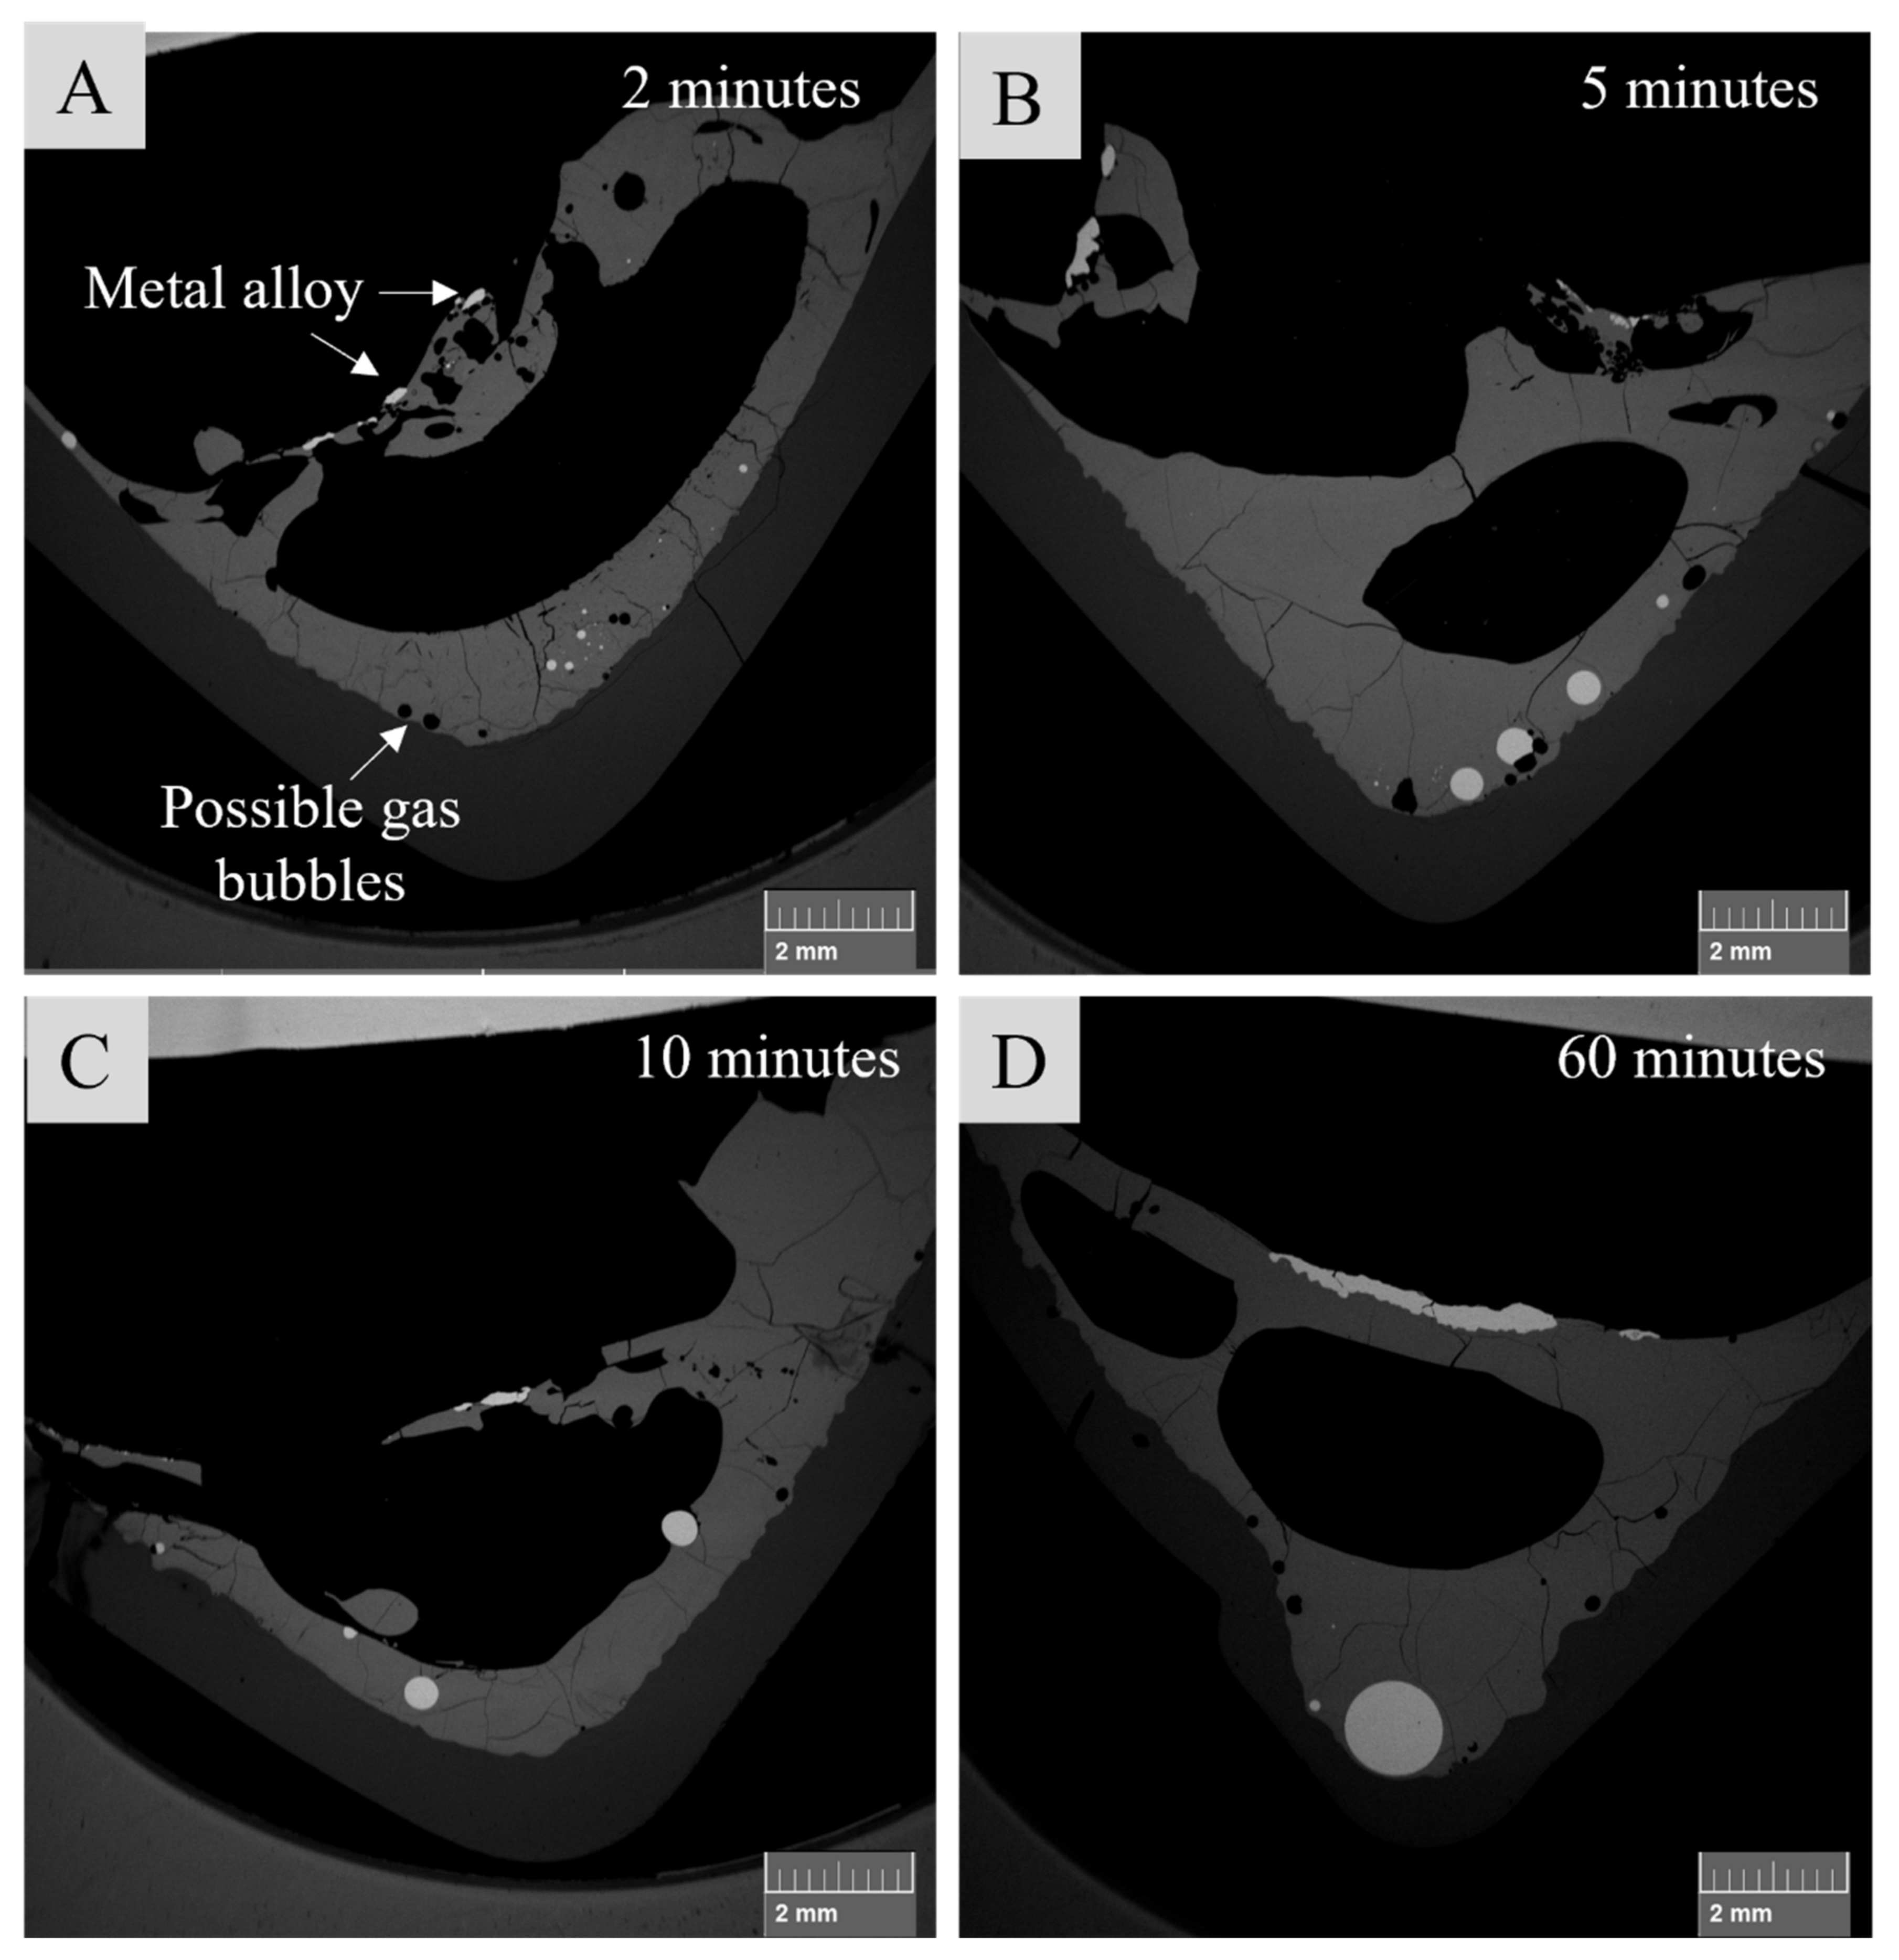
25]. The increasing addition of battery scrap and graphite seemed to prevent the settling of matte and metal, possibly by increasing the slag viscosity. Settling was further slowed due to the buoyancy effects of gas bubbles formed from the reduction reactions. As there are many factors that may influence the metal alloy/matte settling in the investigated systems, further experiments should be conducted on this topic in the future.
In the previous study [
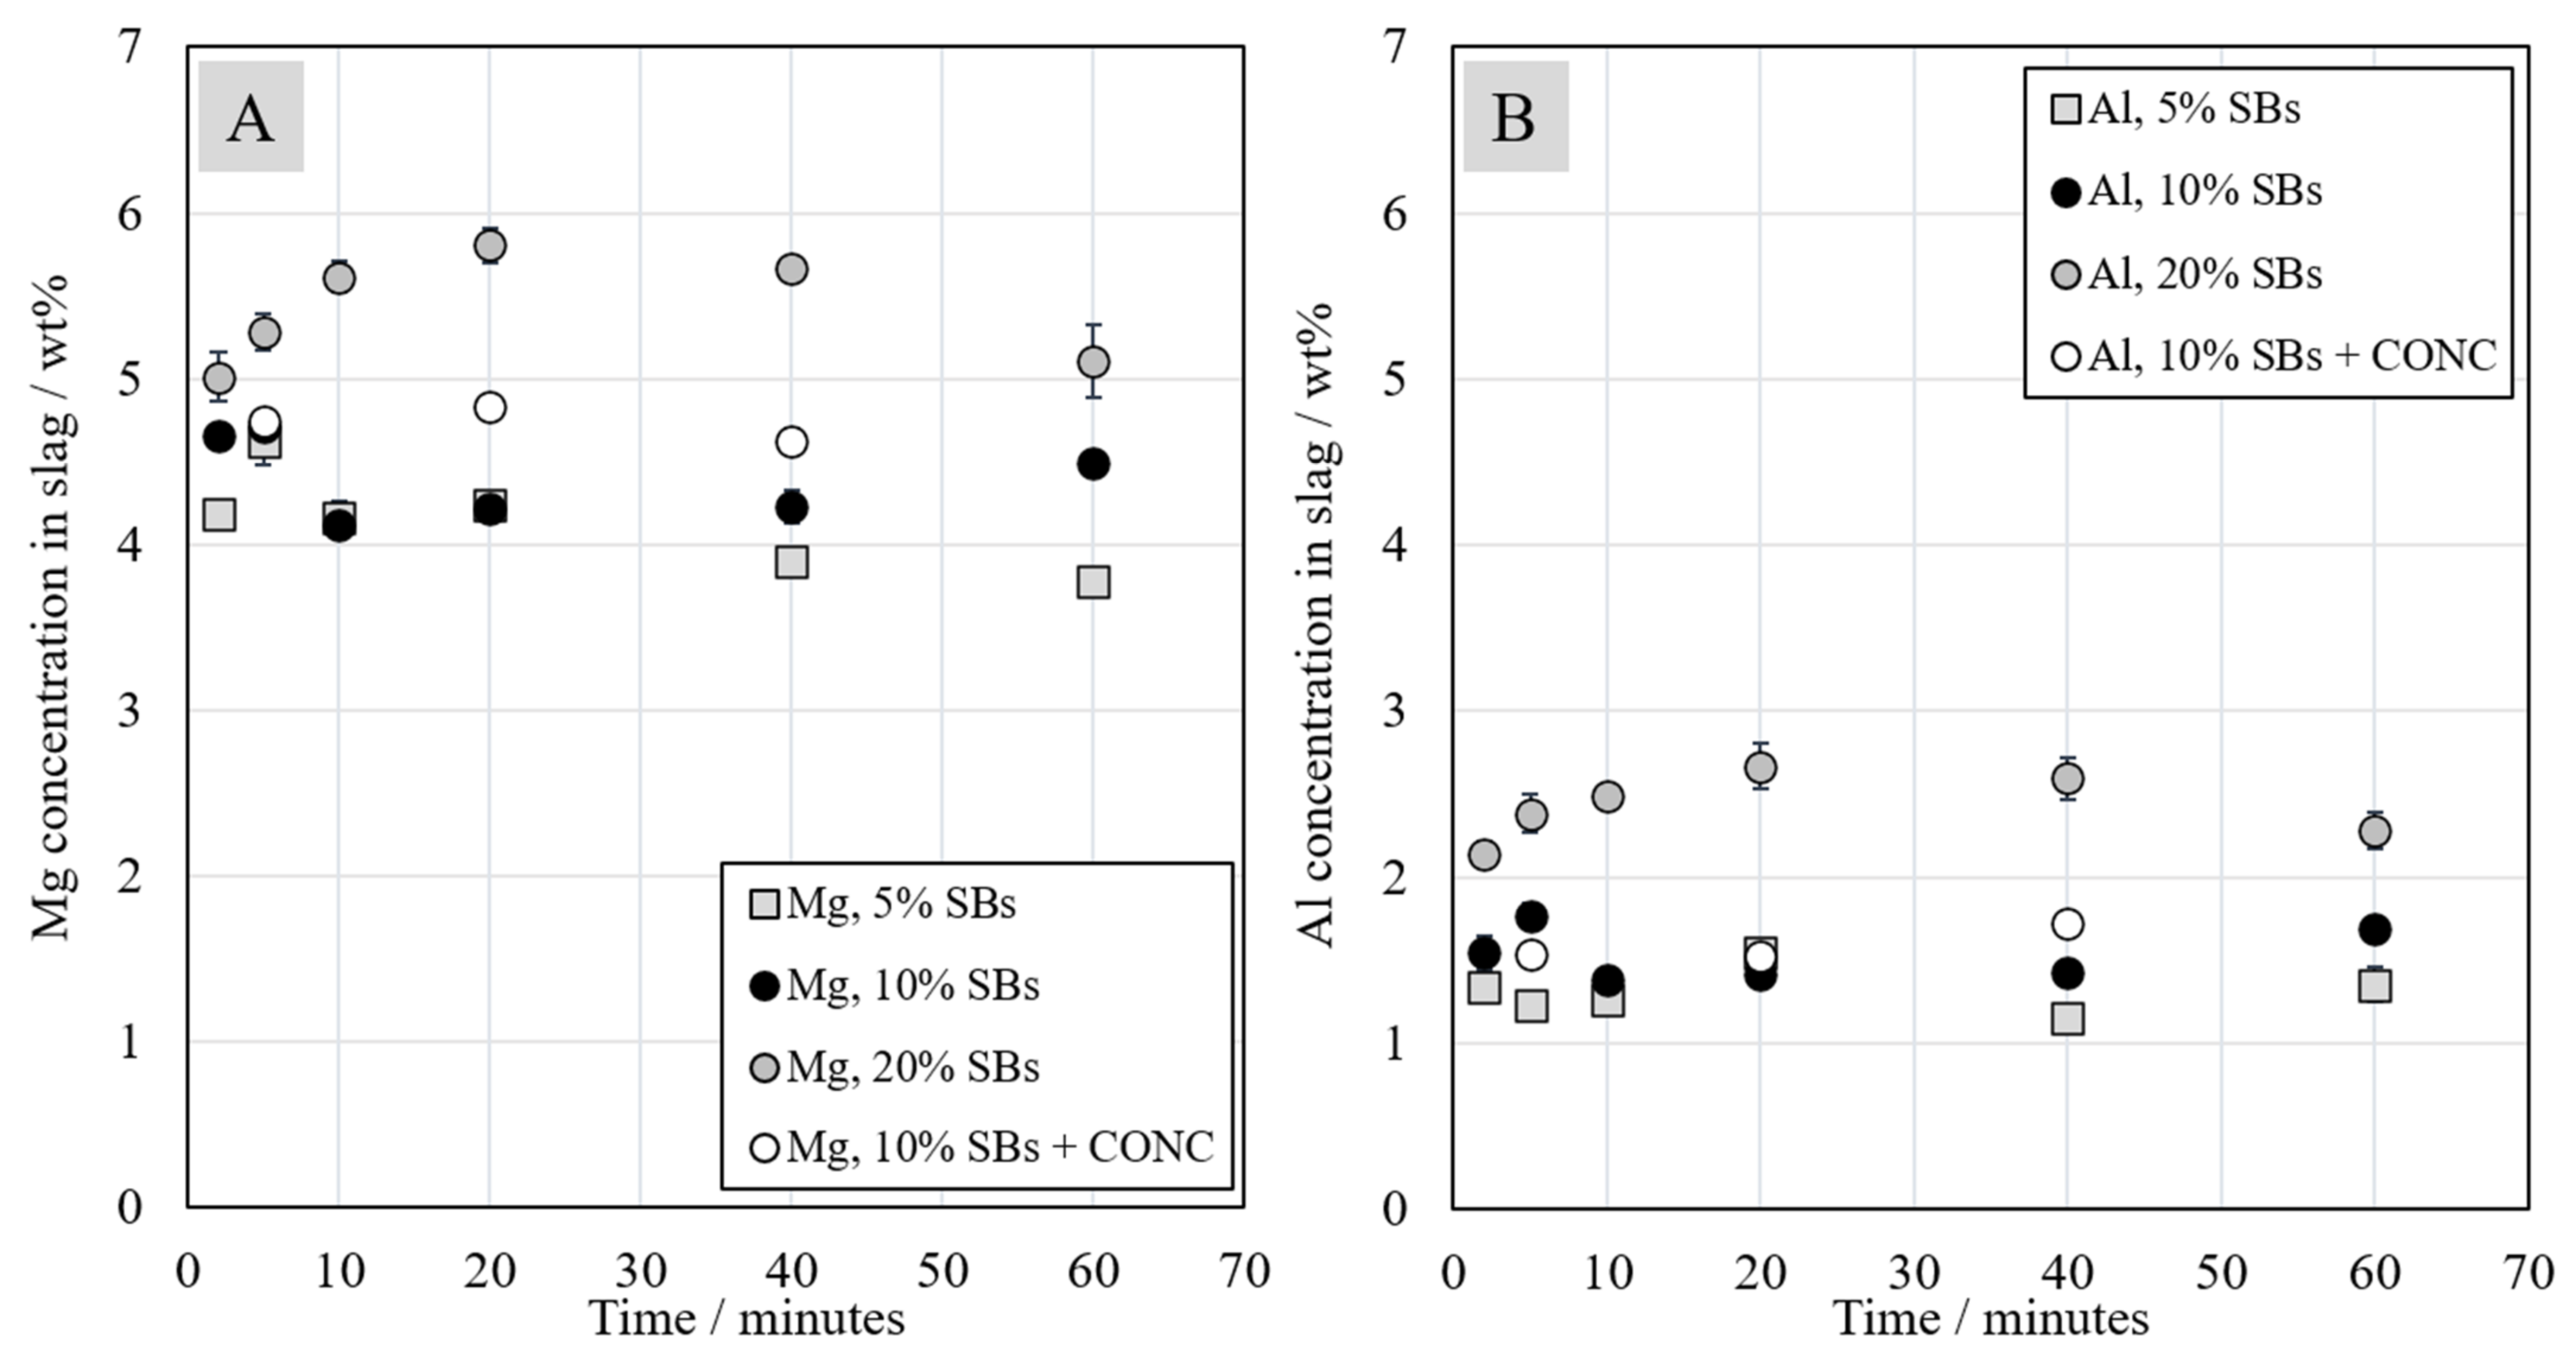
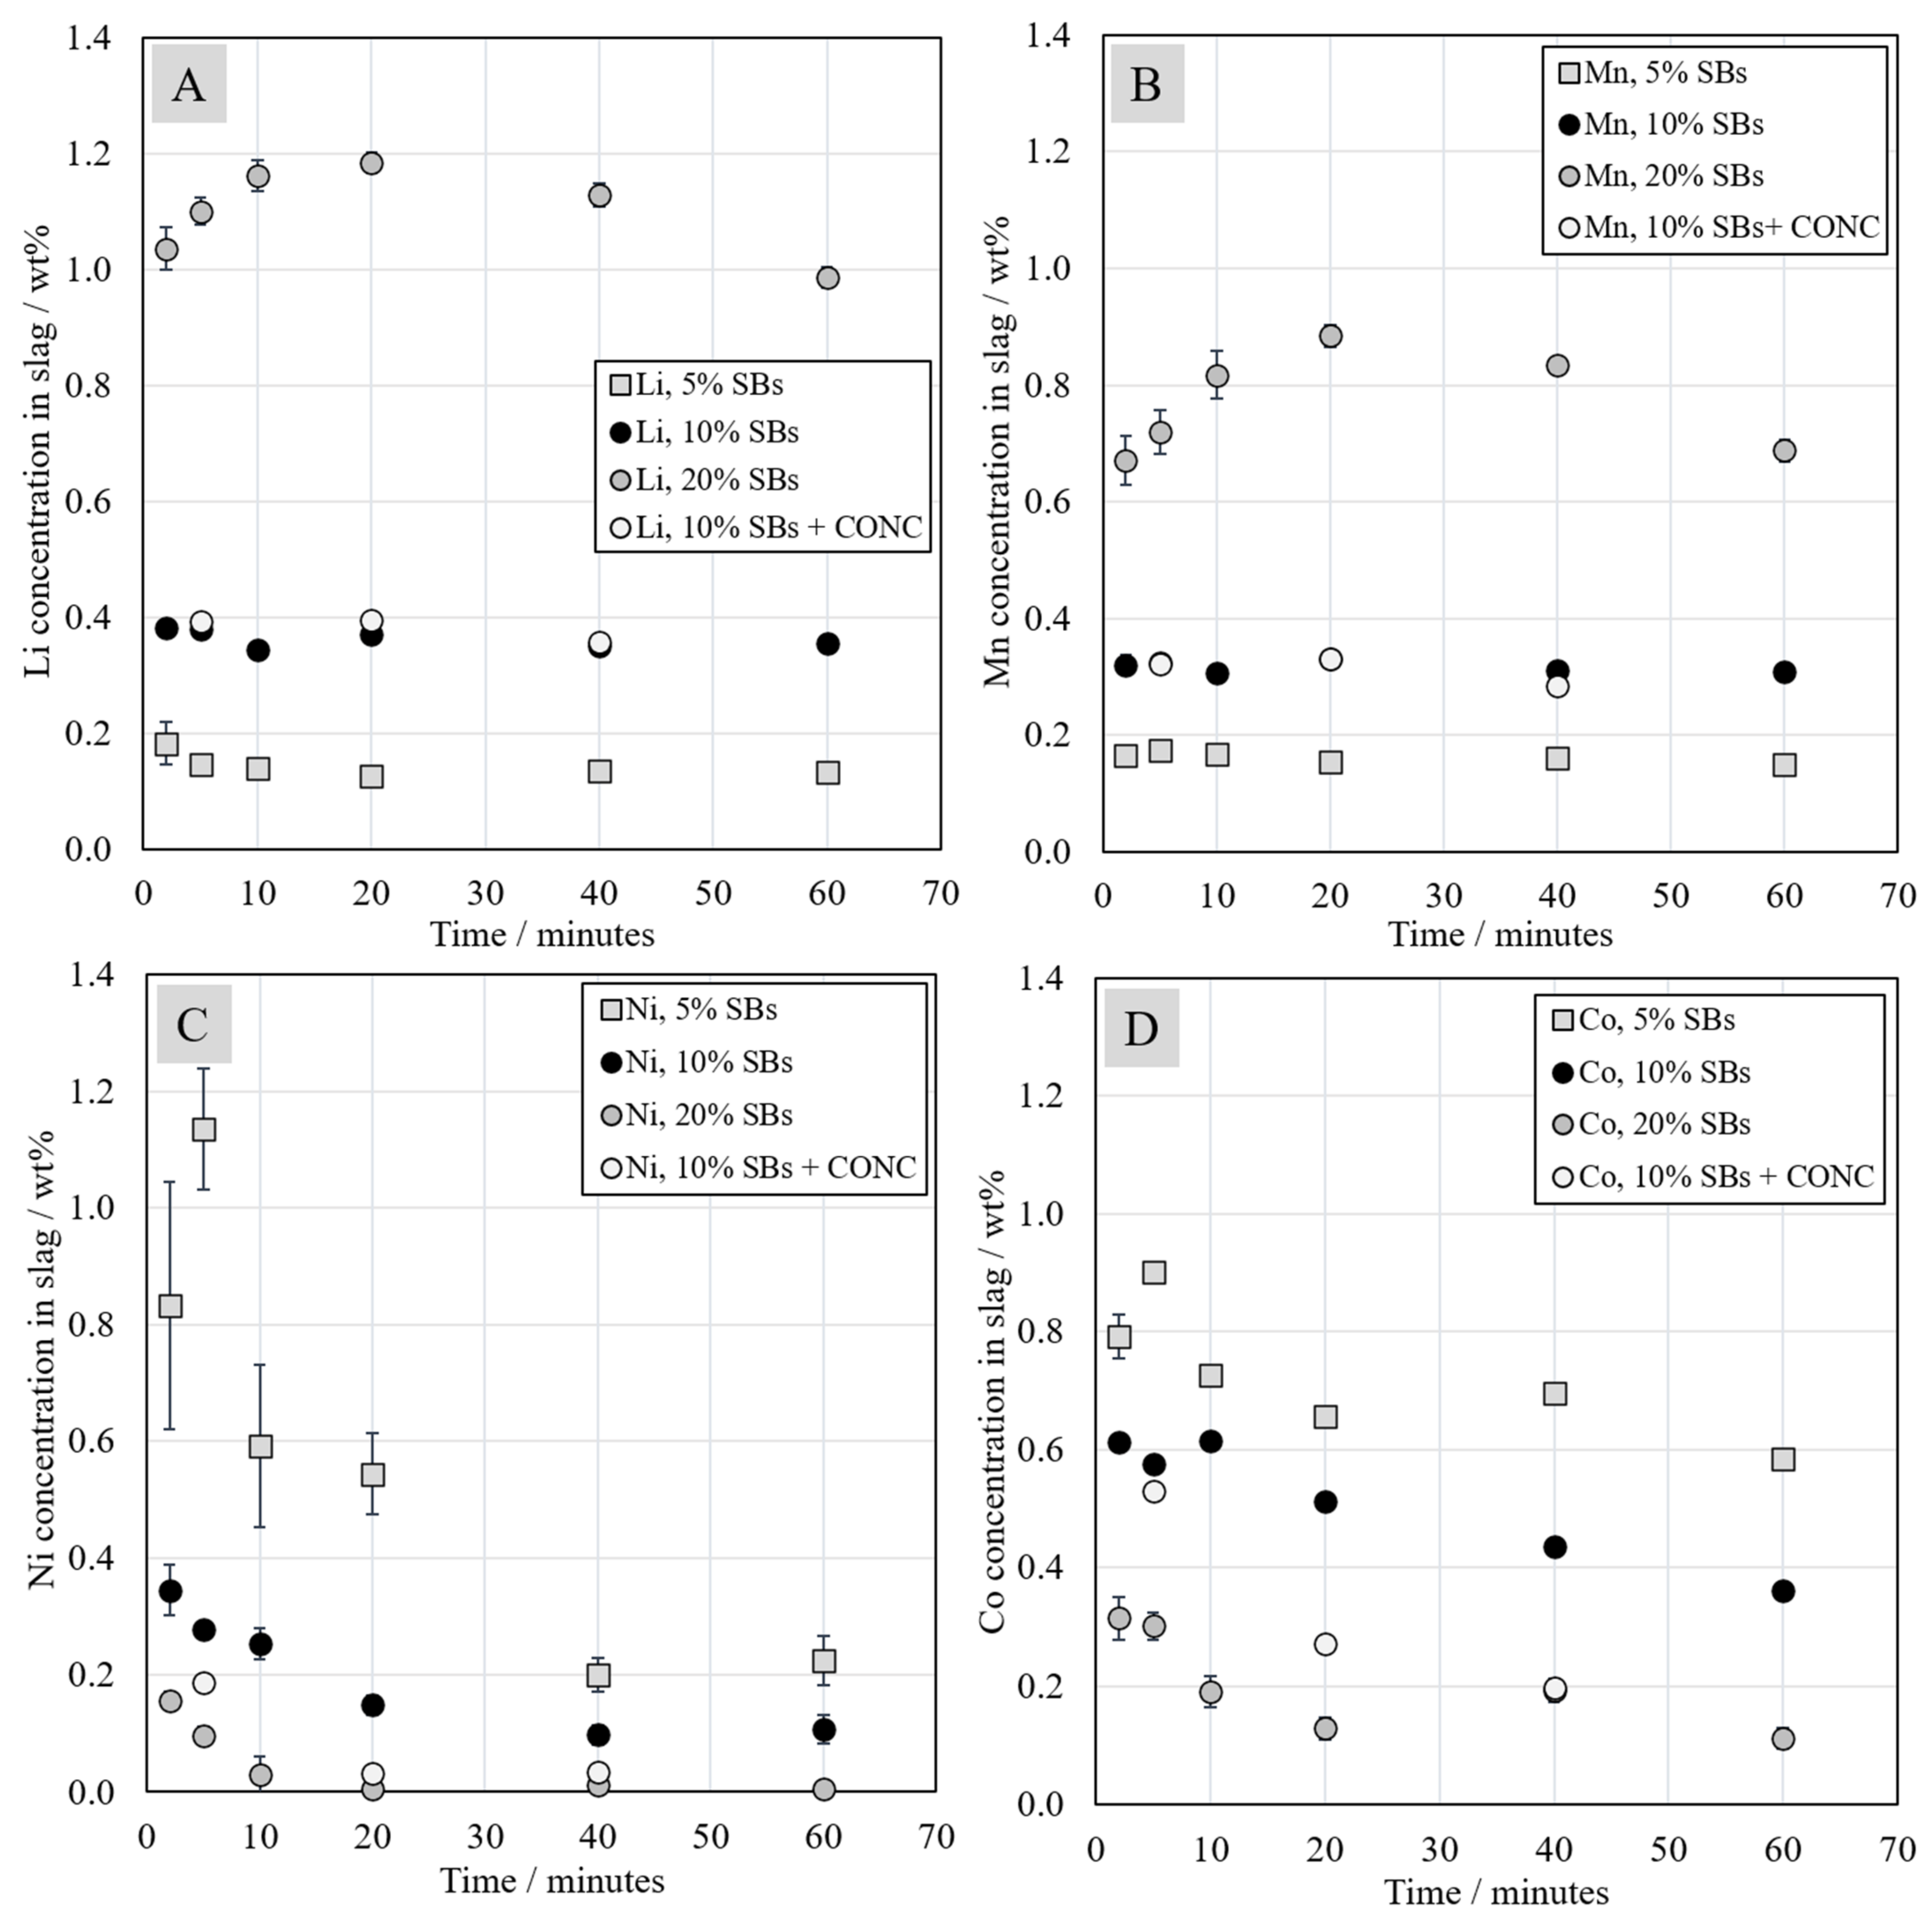
8], all phase composition analyses were conducted using EDS, but LA-ICP-MS was applied in this work to obtain detailed and more accurate data on trace-metal concentrations in the slag, allowing the study of their kinetic behavior. It was shown that lithium and manganese deport heavily to the slag, which is in agreement with the previous findings of Danczak et al. and Sommerfield et al. [19,
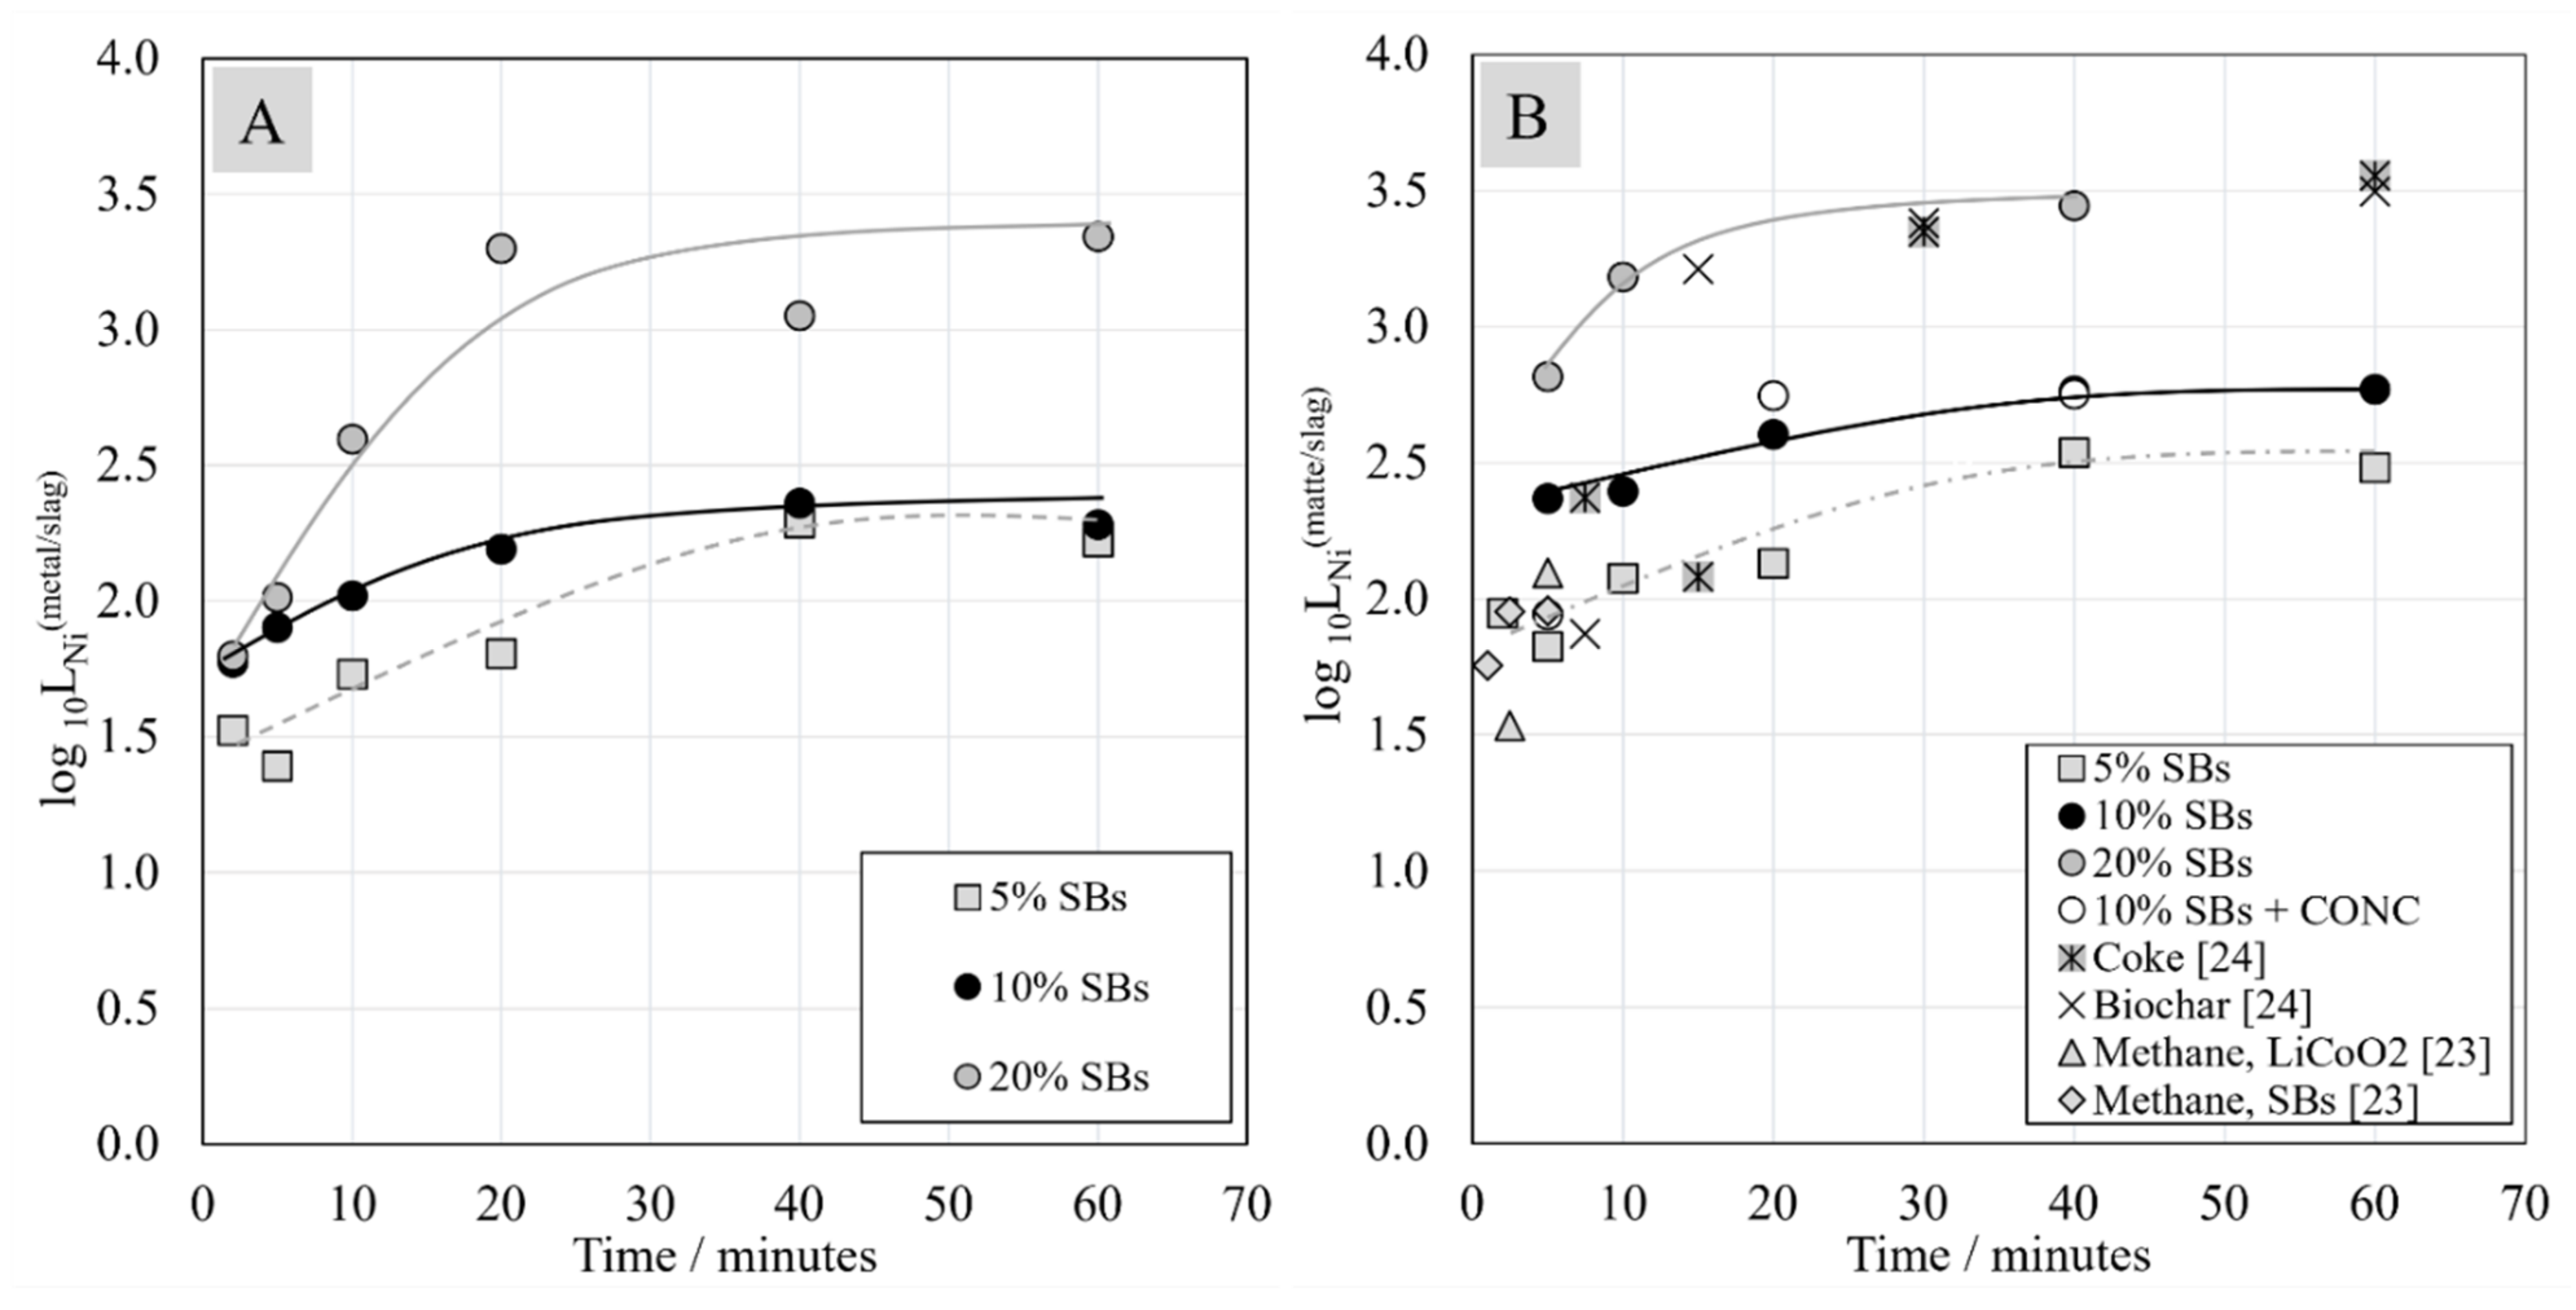
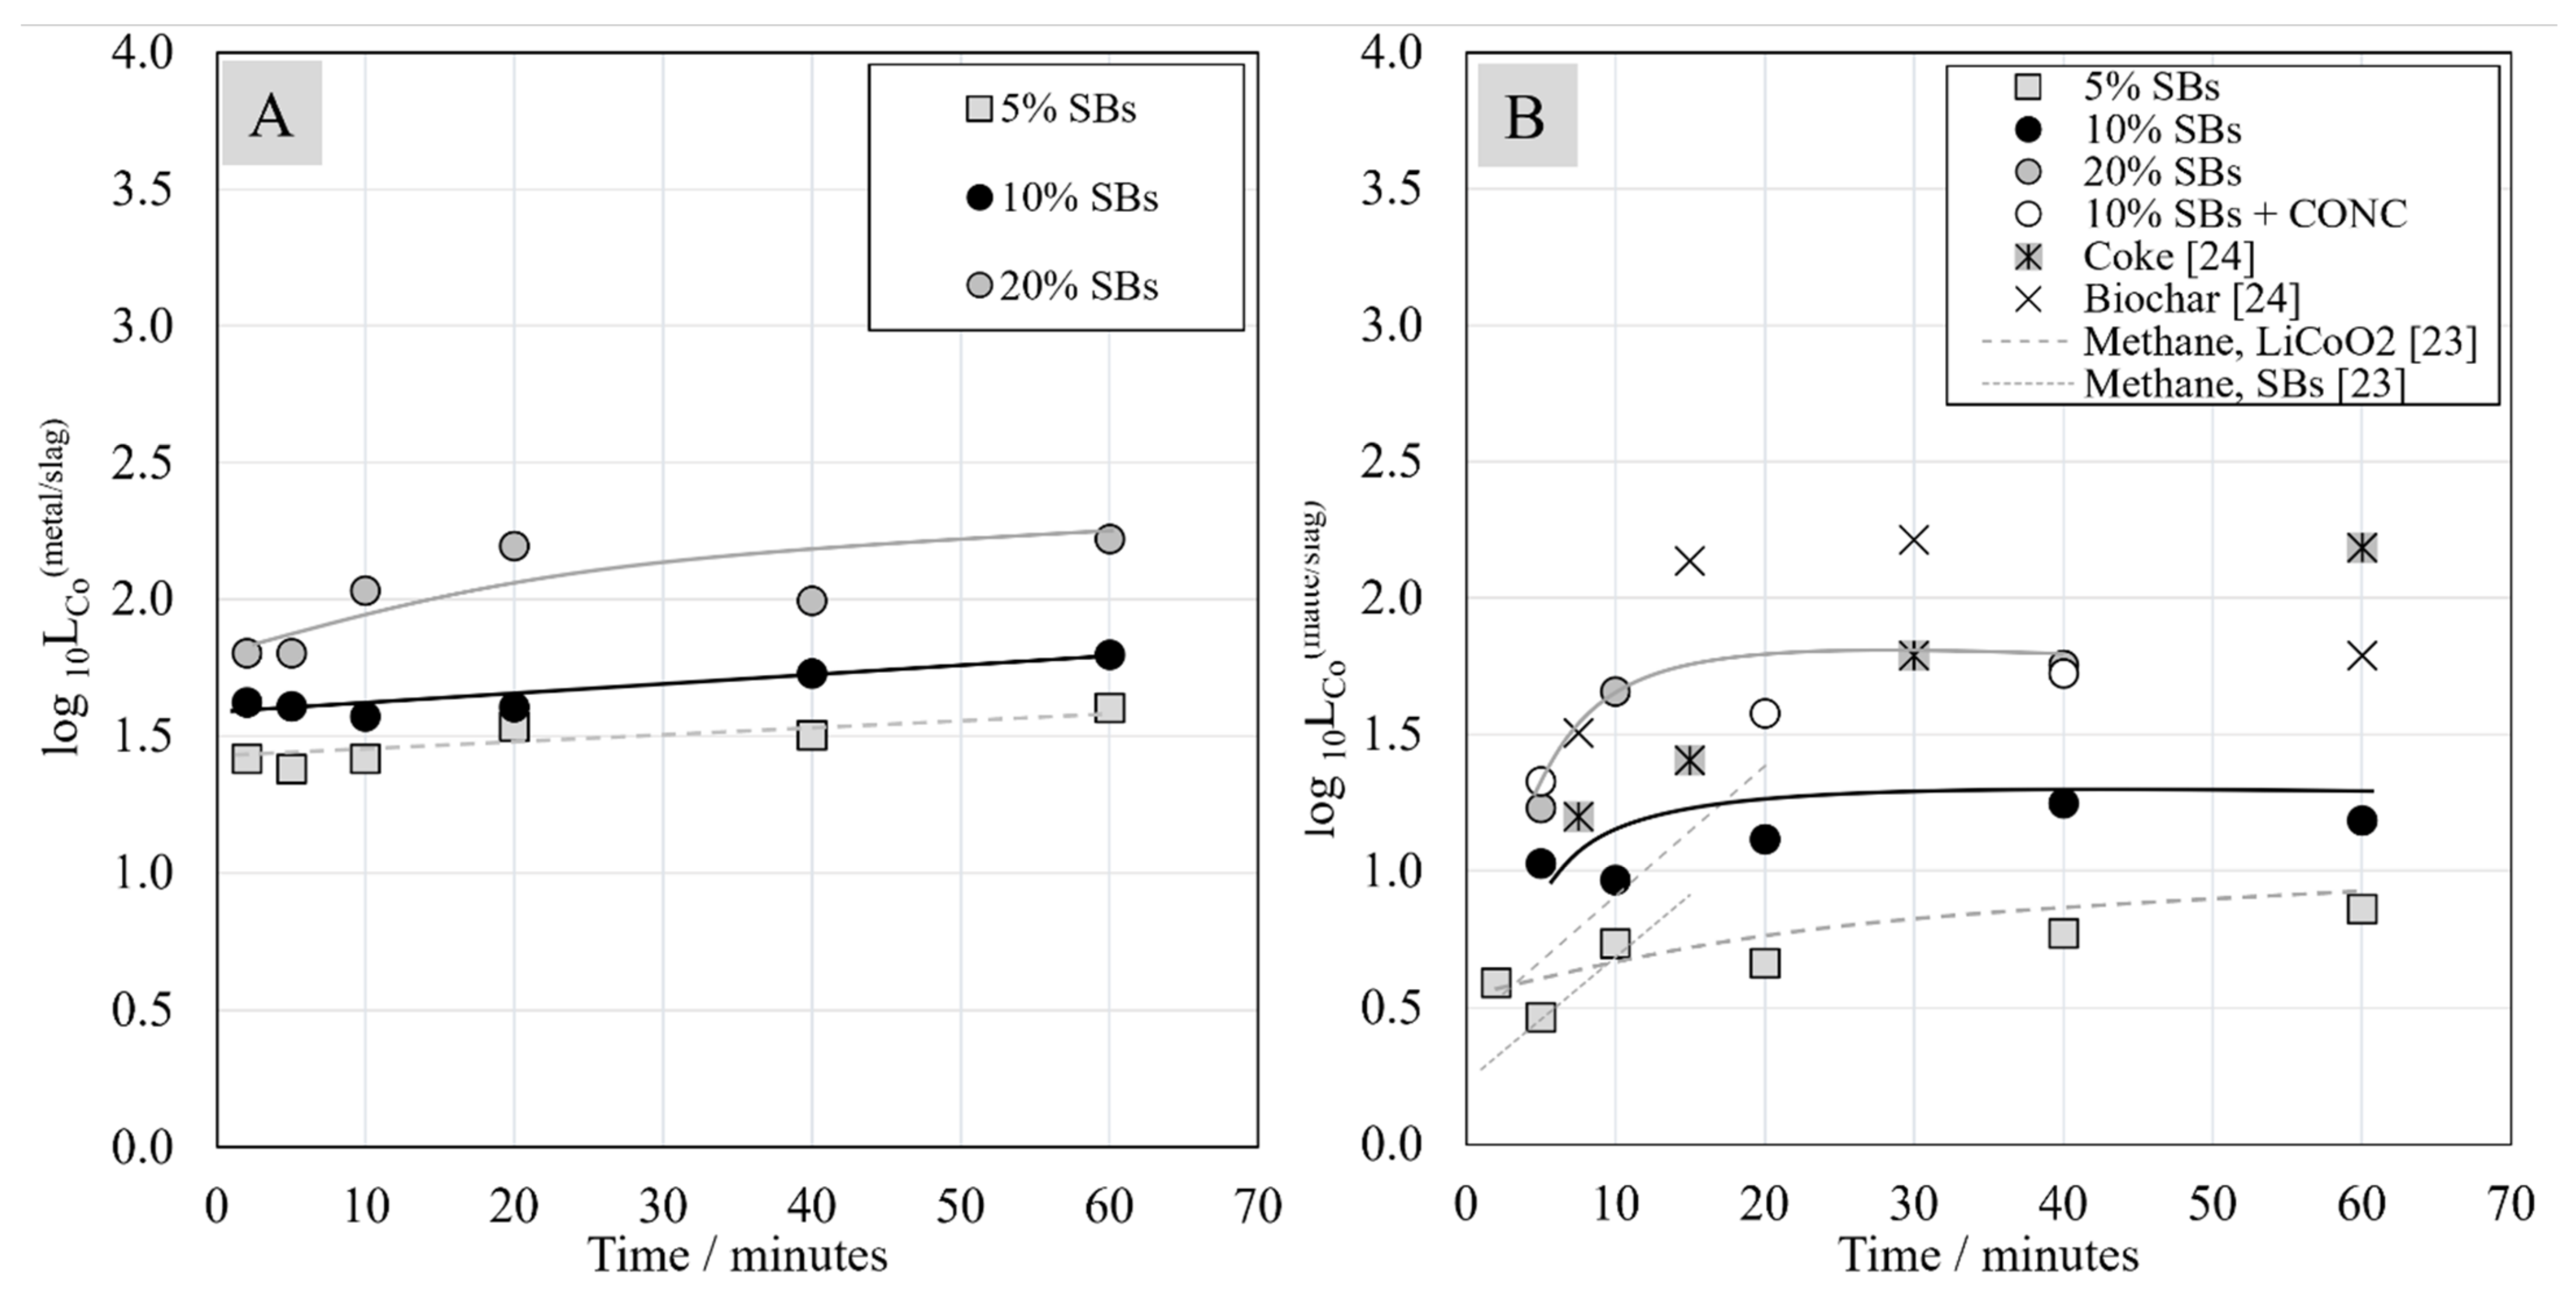
41]. The results suggest that the distribution of nickel and cobalt to the metal/matte phases is enhanced by higher concentration of graphite in the system, which was accomplished by adding a higher amount of battery scrap to the starting mixture. Furthermore, Ruismäki et al. showed that the cobalt distribution to the metal phase increases with the increasing amount of cobalt oxide added to the starting mixture [23].
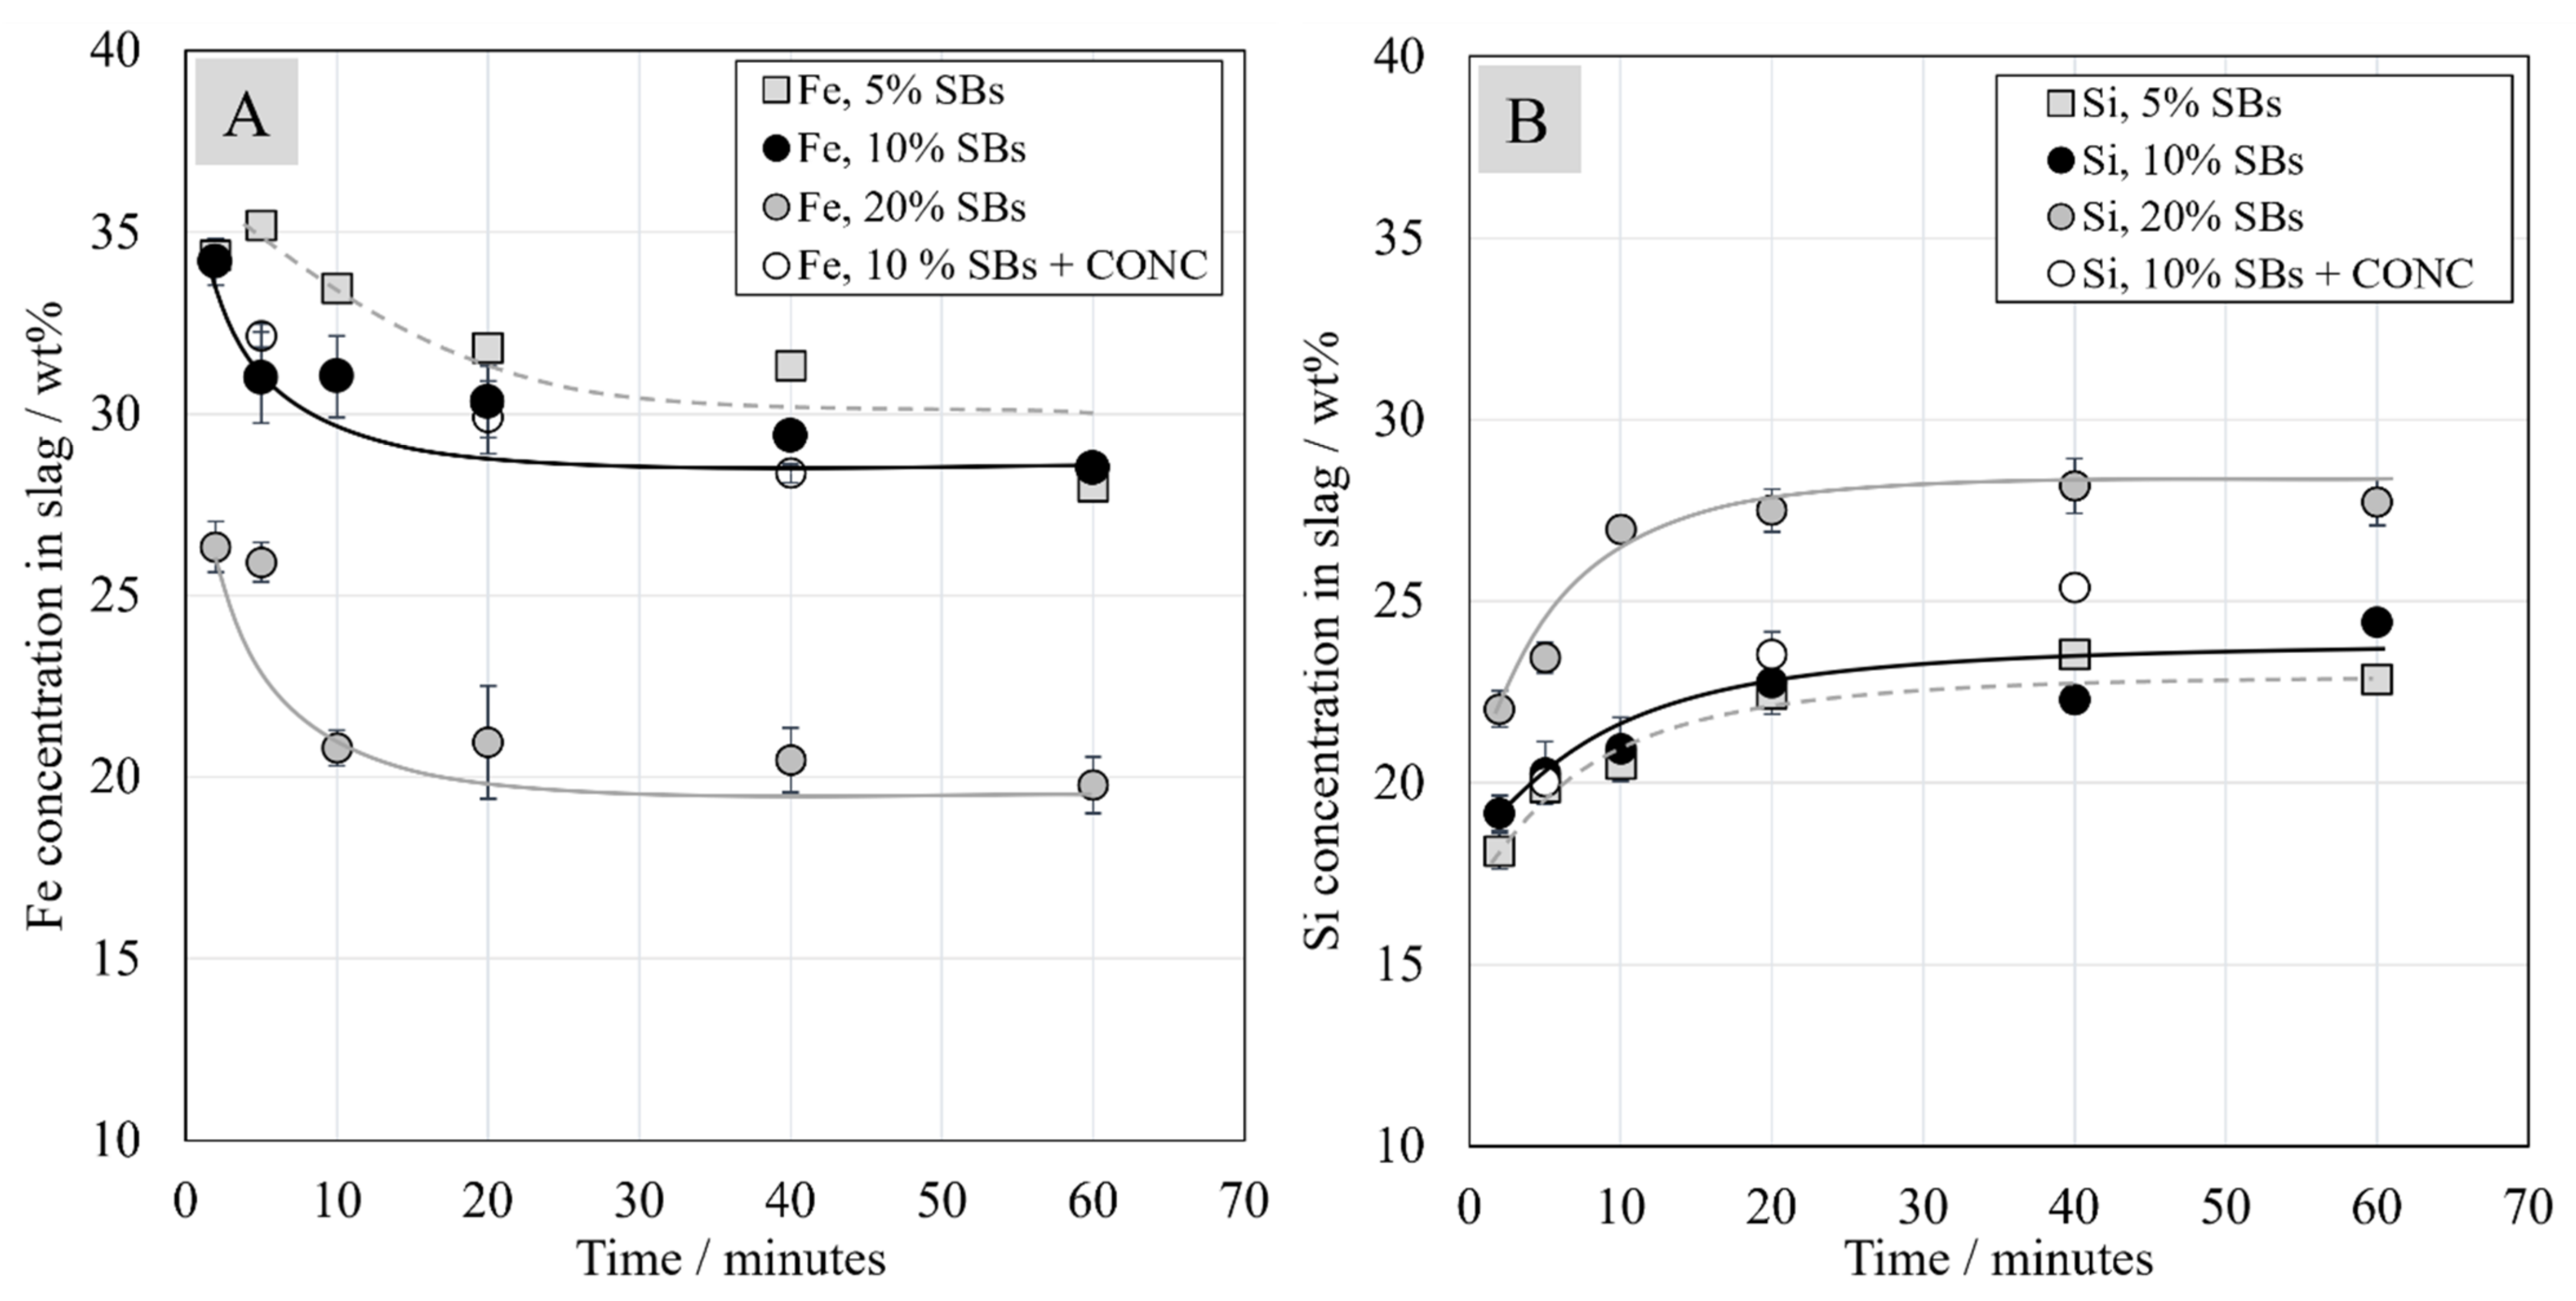
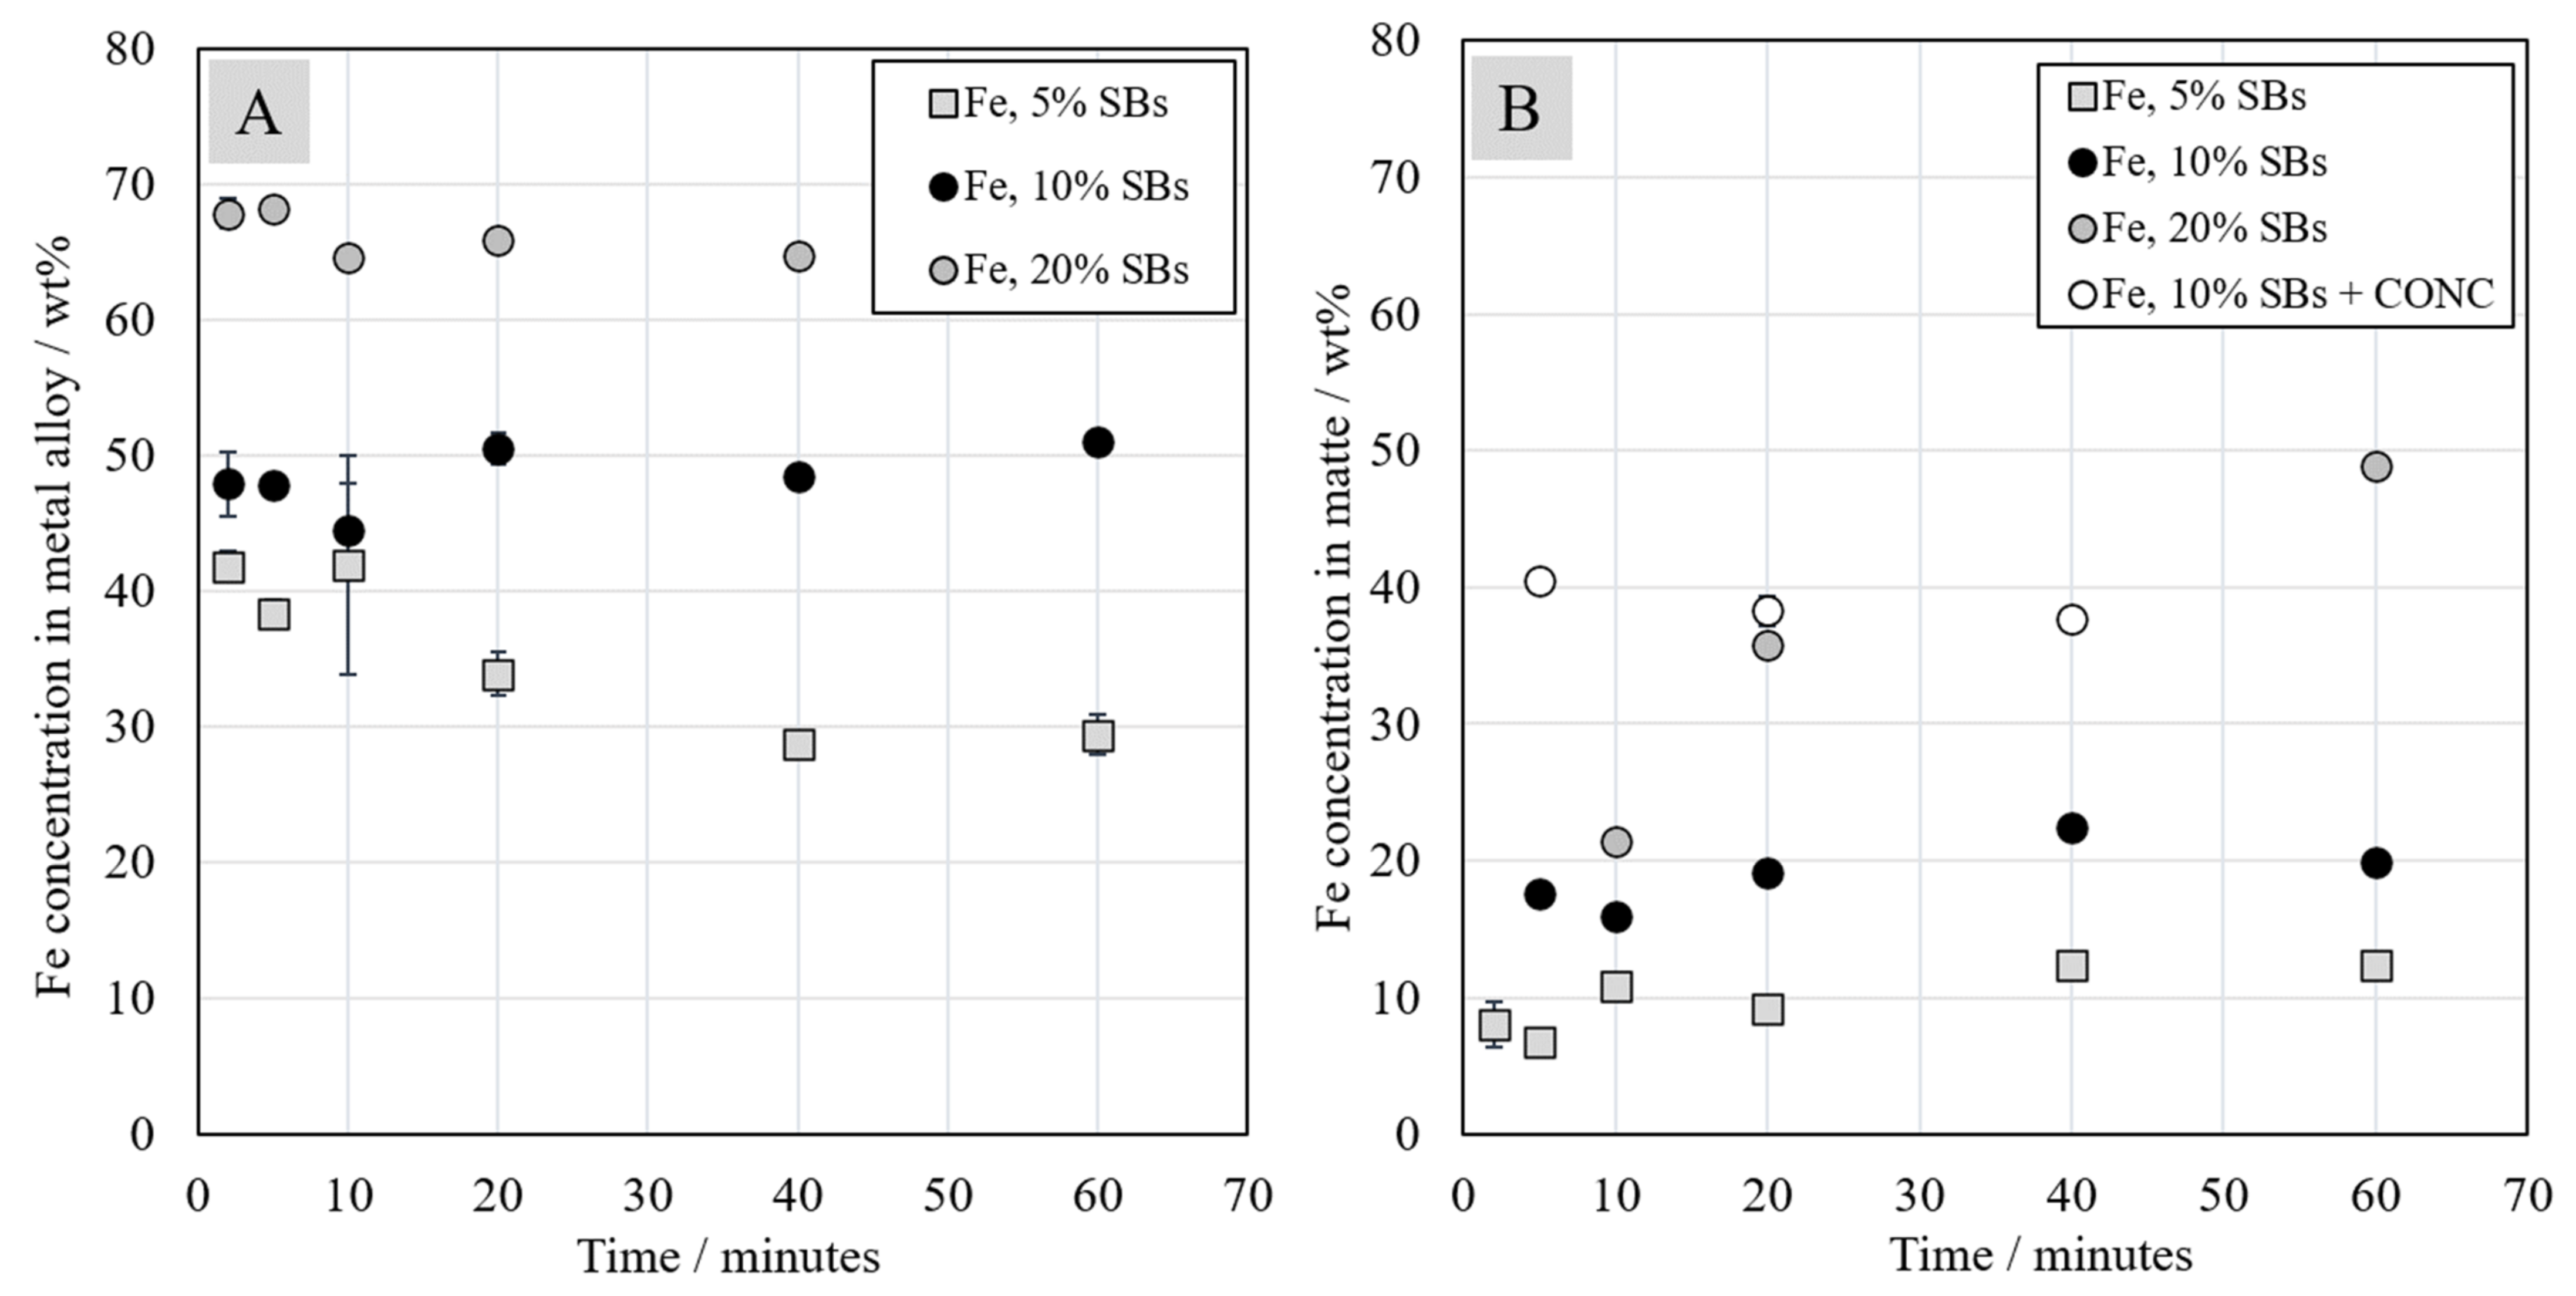
In this study, the Ni-slag/SB ratio was found to significantly influence the composition of the forming metal alloy and matte phases. A higher concentration of the graphite-rich fraction recovered from EoL LiBs allowed reduction of metal oxides from the slag to proceed further. However, at the same time, the iron concentration in both the metal alloy and the matte increased significantly, which may be an issue in consequent processing steps. In conclusion, even though the distribution coefficients of nickel and cobalt between alloy/matte and slag were clearly the highest with 20 wt.% of SBs in the starting mixture, it is likely more beneficial to use 5 wt.% or 10 wt.% of SBs addition from the perspective of the entire metal recovery process. These additions still enable relatively high valuable metal recoveries from the slag and battery scrap, while minimizing the issues during later process steps, e.g., leaching, selective precipitation, ion exchange, or electrolytic deposition [3], caused by excess iron in the alloy/matte phase. As the laboratory-scale results indicate benefits in integrating spent batteries recycling with existing industrial nickel-slag cleaning processes, industrial-scale process tests should be performed in the future to validate these results.

Supplementary Materials

The following are available online at https://0-www-mdpi-com.brum.beds.ac.uk/article/10.3390/min11070784/s1: Figure S1. Chemical concentrations of Cu (A), Zn (B), Sn (C), and Pb (D) in the slags as a function of contact time; Figure S2. Copper concentration in the metal alloy (A) and in the matte (B) as a function of contact time.

Author Contributions

Conceptualization, A.J. and R.S.-G.; methodology, A.D., R.R., T.R., L.K., P.T. and A.J.; software, A.D., T.R. and L.K.; validation, A.D., R.R., T.R., L.K., A.J. and R.S.-G.; formal analysis, A.D., T.R., L.K. and H.O.; investigation, A.D., R.R., T.R. and L.K.; resources, H.O., A.J. and R.S.-G.; data curation, A.D., R.R., T.R. and L.K.; writing—original draft preparation, A.D., R.R. and T.R.; writing—review and editing, L.K., H.O., P.T., A.J. and R.S.-G.; visualization, A.D., R.R., T.R. and L.K.; supervision, A.J. and R.S.-G.; project administration, A.J. and R.S.-G.; funding acquisition, A.J. and R.S.-G. All authors have read and agreed to the published version of the manuscript.

Funding

This research was funded by BATCircle project, grant number 4853/31/2018, BATCircle 2.0 project, grant number 44886/31/2020, and SYMMET project, grant number 3891/31/2018.

Acknowledgments

T.R. thanks the Technology Industries of Finland Centennial Foundation (Steel and Metal Producers Fund) for a doctoral studies scholarship. The authors are grateful Akkuser Oy (Finland) for providing battery scrap. This study utilized the RawMatTERS Finland infrastructure (RAMI, Academy of Finland) in Aalto University, VTT Espoo and GTK Espoo.

Conflicts of Interest

The authors declare no conflict of interest.

References

  1. European Commission. Questions and Answers on Sustainable Batteries Regulation. Available online: https://ec.europa.eu/commission/presscorner/detail/en/QANDA_20_2311 (accessed on 22 February 2021).
  2. Makuza, B.; Tian, Q.; Guo, X.; Chattopadhyay, K.; Yu, D. Pyrometallurgical options for recycling spent lithium-ion batteries: A comprehensive review. J. Power Sources 2021, 491, 229622. [Google Scholar] [CrossRef]
  3. Holzer, A.; Windisch-Kern, S.; Ponak, C.; Raupenstrauch, H. A Novel Pyrometallurgical Recycling Process for Lithium-Ion Batteries and Its Application to the Recycling of LCO and LFP. Metals 2021, 11, 149. [Google Scholar] [CrossRef]
  4. Velázquez-Martínez, O.; Valio, J.; Santasalo-Aarnio, A.; Reuter, M.; Serna-Guerrero, R. A Critical Review of Lithium-Ion Battery Recycling Processes from a Circular Economy Perspective. Batteries 2019, 5, 68. [Google Scholar] [CrossRef] [Green Version]
  5. Velázquez-Martinez, O.; Porvali, A.; Van Den Boogaart, K.G.; Santasalo-Aarnio, A.; Lundström, M.; Reuter, M.; Serna-Guerrero, R. On the use of statistical entropy analysis as assessment parameter for the comparison of lithium-ion battery recycling processes. Batteries 2019, 5, 41. [Google Scholar] [CrossRef] [Green Version]
  6. Wang, X.; Gaustad, G.; Babbitt, C.W. Targeting high value metals in lithium-ion battery recycling via shredding and size-based separation. Waste Manag. 2016, 51, 204–213. [Google Scholar] [CrossRef] [PubMed] [Green Version]
  7. Ball, S.; Clark, J.; Cookson, J. Battery Materials Technology Trends and Market Drivers for Automotive Applications. Johns. Matthey Technol. Rev. 2020, 64, 287–297. [Google Scholar] [CrossRef]
  8. Ruismäki, R.; Rinne, T.; Dańczak, A.; Taskinen, P.; Serna Guerrero, R.; Jokilaakso, A. Integrating Flotation and Pyrometallurgy for Recovering Graphite and Valuable Metals from Battery Scrap. Metals 2020, 10, 680. [Google Scholar] [CrossRef]
  9. Ren, G.; Xiao, S.; Xie, M.; Pan, B.; Chen, J.; Wang, F.; Xia, X. Recovery of valuable metals from spent lithium ion batteries by smelting reduction process based on FeO–SiO2–Al2O3 slag system. Trans. Nonferrous Met. Soc. China 2017, 27, 450–456. [Google Scholar] [CrossRef]
  10. Wentker, M.; Greenwood, M.; Leker, J. A Bottom-Up Approach to Lithium-Ion Battery Cost Modeling with a Focus on Cathode Active Materials. Energies 2019, 12, 504. [Google Scholar] [CrossRef] [Green Version]
  11. European Commission. Critical Raw Materials Resilience: Charting a Path towards Greater Security and Sustainability. Available online: https://eur-lex.europa.eu/legal-content/EN/TXT/?uri=CELEX:52020DC0474 (accessed on 22 February 2021).
  12. Mudd, G.M. Global trends and environmental issues in nickel mining: Sulfides versus laterites. Ore Geol. Rev. 2010, 38, 9–26. [Google Scholar] [CrossRef]
  13. Widijatmoko, S.D.; Fu, G.; Wang, Z.; Hall, P. Recovering lithium cobalt oxide, aluminium, and copper from spent lithium-ion battery via attrition scrubbing. J. Clean. Prod. 2020, 260, 120869. [Google Scholar] [CrossRef]
  14. Sommerville, R.; Shaw-Stewart, J.; Goodship, V.; Rowson, N.; Kendrick, E. A review of physical processes used in the safe recycling of lithium ion batteries. Sustain. Mater. Technol. 2020, 25, e00197. [Google Scholar] [CrossRef]
  15. Porvali, A.; Aaltonen, M.; Ojanen, S.; Velazquez-Martinez, O.; Eronen, E.; Liu, F.; Wilson, B.P.; Serna-Guerrero, R.; Lundström, M. Mechanical and hydrometallurgical processes in HCl media for the recycling of valuable metals from Li-ion battery waste. Resour. Conserv. Recycl. 2019, 142, 257–266. [Google Scholar] [CrossRef]
  16. Porvali, A.; Chernyaev, A.; Shukla, S.; Lundström, M. Lithium ion battery active material dissolution kinetics in Fe (II)/Fe (III) catalyzed Cu-H2SO4 leaching system. Sep. Purif. Technol. 2020, 236, 116305. [Google Scholar] [CrossRef]
  17. Peng, C.; Liu, F.; Aji, A.T.; Wilson, B.P.; Lundström, M. Extraction of Li and Co from industrially produced Li-ion battery waste—Using the reductive power of waste itself. Waste Manag. 2019, 95, 604–611. [Google Scholar] [CrossRef]
  18. Guoxing, R.; Songwen, X.; Meiqiu, X.; Bing, P.; Youqi, F.; Fenggang, W.; Xing, X. Recovery of Valuable Metals from Spent Lithium-Ion Batteries by Smelting Reduction Process Based on MnO-SiO2-Al2O3 Slag System. In Advances in Molten Slags, Fluxes, and Salts, Proceedings of the 10th International Conference on Molten Slags, Fluxes and Salts, Grand Hyatt Seattle, WA, USA, 22 May 2016; Reddy, R.G., Chaubal, P., Pistorius, P.C., Pal, U., Eds.; Springer: Cham, Switzerland, 2016. [Google Scholar] [CrossRef]
  19. Sommerfeld, M.; Vonderstein, C.; Dertmann, C.; Klimko, J.; Oráč, D.; Miškufová, A.; Havlík, T.; Friedrich, B. A Combined Pyro- and Hydrometallurgical Approach to Recycle Pyrolyzed Lithium-Ion Battery Black Mass Part 1: Production of Lithium Concentrates in an Electric Arc Furnace. Metals 2020, 10, 1069. [Google Scholar] [CrossRef]
  20. Kucharski, M.; Sak, T.; Madej, P.; Wedrychowicz, M.; Mroz, W. A Study on the Copper Recovery from the Slag of the Outokumpu Direct-to-Copper Process. Metall. Mater. Trans. B 2014, 45, 590–602. [Google Scholar] [CrossRef]
  21. Klimko, J.; Oráč, D.; Miškufová, A.; Vonderstein, C.; Dertmann, C.; Sommerfeld, M.; Friedrich, B.; Havlík, T. A Combined Pyro- and Hydrometallurgical Approach to Recycle Pyrolyzed Lithium-Ion Battery Black Mass Part 2: Lithium Recovery from Li Enriched Slag—Thermodynamic Study, Kinetic Study, and Dry Digestion. Metals 2020, 10, 1558. [Google Scholar] [CrossRef]
  22. International Energy Agency. Coal 2020. Available online: https://www.iea.org/reports/coal-2020 (accessed on 24 February 2021).
  23. Ruismäki, R.; Dańczak, A.; Klemettinen, L.; Taskinen, P.; Lindberg, D.; Jokilaakso, A. Integrated Battery Scrap Recycling and Nickel Slag Cleaning with Methane Reduction. Minerals 2020, 10, 435. [Google Scholar] [CrossRef]
  24. Avarmaa, K.; Järvenpää, M.; Klemettinen, L.; Marjakoski, M.; Taskinen, P.; Lindberg, D.; Jokilaakso, A. Battery Scrap and Biochar Utilization for Improved Metal Recoveries in Nickel Slag Cleaning Conditions. Batteries 2020, 6, 58. [Google Scholar] [CrossRef]
  25. Yu, D.; Chattopadhyay, K. Enhancement of the nickel converter slag-cleaning operation with the addition of spent potlining. Int. J. Miner. Metall. Mater. 2018, 25, 881–891. [Google Scholar] [CrossRef]
  26. Zhou, S.; Wei, Y.; Bo, L.; Wang, H. Cleaner recycling of iron from waste copper slag by using walnut shell char as green reductant. J. Clean. Prod. 2019, 217, 423–431. [Google Scholar] [CrossRef]
  27. Pei, M.; Petäjäniemi, M.; Regnell, A.; Wijk, O. Toward a Fossil Free Future with HYBRIT: Development of Iron and Steelmaking Technology in Sweden and Finland. Metals 2020, 10, 972. [Google Scholar] [CrossRef]
  28. Bellemans, I.; De Wilde, E.; Moelans, N.; Verbeken, K. Metal losses in pyrometallurgical operations—A review. Adv. Colloid Interface Sci. 2018, 255, 47–63. [Google Scholar] [CrossRef]
  29. Hittner, H.J.; Nguyen, Q.C. Stabilization of Fluorides of Spent Potlining by Chemical Dispersion. U.S. Patent No. 5,024,822, 18 June 1991. [Google Scholar]
  30. Cho, Y.S.; Laskowski, J.S. Bubble coalescence and its effect on dynamic foam stability. Can. J. Chem. Eng. 2002, 80, 299–305. [Google Scholar] [CrossRef]
  31. Klemettinen, L.; Aromaa, R.; Dańczak, A.; O’Brien, H.; Taskinen, P.; Jokilaakso, A. Distribution Kinetics of Rare Earth Elements in Copper Smelting. Sustainability 2020, 12, 208. [Google Scholar] [CrossRef] [Green Version]
  32. Wan, X.; Shen, L.; Jokilaakso, A.; Eriç, H.; Taskinen, P. Experimental Approach to Matte-Slag Reactions in the Flash Smelting Process. Miner. Process. Extr. Metall. Rev. 2021, 42, 231–241. [Google Scholar] [CrossRef]
  33. Dańczak, A.; Klemettinen, L.; O’Brien, H.; Taskinen, P.; Lindberg, D.; Jokilaakso, A. Slag chemistry and behavior of nickel and tin in black copper smelting with alumina and magnesia-containing slags. J. Sustain. Metall. 2021, 7, 1–14. [Google Scholar] [CrossRef]
  34. Bastin, G.F.; Heijligers, H.J.M. Quantitative Electron Probe Microanalysis of Ultralight Elements (Boron-Oxygen). Scanning 1990, 12, 225–236. [Google Scholar] [CrossRef] [Green Version]
  35. Van Achterberg, E.; Ryan, C.G.; Jackson, S.E.; Griffin, W.L. Data reduction software for LA-ICP-MS: Appendix. In Laser Ablation-ICP-Mass Spectrometry in the Earth Sciences: Principles and Applications; Short Course Series; Sylvester, P.J., Ed.; Mineralogical Association of Canada: Ottawa, ON, Canada, 2001; pp. 239–243. [Google Scholar]
  36. Jochum, K.P.; Weiss, U.; Stoll, B.; Kuzmin, D.; Yang, Q.; Raczek, I.; Jacob, D.E.; Stracke, A.; Birbaum, K.; Frick, D.A.; et al. Determination of Reference Values for NIST SRM 610–617 Glasses Following ISO Guidelines. Geostand. Geoanalytical Res. 2011, 35, 397–429. [Google Scholar] [CrossRef]
  37. Warner, A.; Díaz, C.; Dalvi, A.; Mackey, P. JOM World Nonferrous Smelter Survey Part IV: Nickel: Sulfide. JOM 2007, 59, 58–72. [Google Scholar] [CrossRef]
  38. Waanders, F.B.; Nell, J. Phase Chemical Composition of Slag from a Direct Nickel Flash Furnace and Associated Slag Cleaning Furnace. Hyperfine Interact. 2013, 218, 101–105. [Google Scholar] [CrossRef]
  39. Heo, J.H.; Chung, Y.; Park, J.H. Recovery of iron and removal of hazardous elements from waste copper slag via a novel aluminothermic smelting reduction (ASR) process. J. Clean. Prod. 2016, 137, 777–787. [Google Scholar] [CrossRef]
  40. Tirronen, T.; Sukhomlinov, D.; O’Brien, H.; Taskinen, P.; Lundström, M. Distribution of lithium-ion and nickel-metal hydride battery elements in copper converting. J. Clean. Prod. 2017, 168, 399–409. [Google Scholar] [CrossRef]
  41. Dańczak, A.; Klemettinen, L.; Kurhila, M.; Taskinen, P.; Lindberg, D.; Jokilaakso, A. Behavior of Battery Metals Lithium, Cobalt, Manganese and Lanthanum in Black Copper Smelting. Batteries 2020, 6, 16. [Google Scholar] [CrossRef] [Green Version]
  42. Riekkola-Vanhanen, M. Finnish Expert Report on Best Available Techniques in Nickel Production; Finnish Environment Institute: Helsinki, Finland, 1999; pp. 1–66. ISBN 952-11-0507-0. Available online: https://helda.helsinki.fi/bitstream/handle/10138/40684/FE_317.pdf?sequence=1&isAllowed=y (accessed on 8 April 2021).
  43. Xiao, S.; Ren, G.; Xie, M. Recovery of Valuable Metals from Spent Lithium-Ion Batteries by Smelting Reduction Process Based on MnO–SiO2–Al2O3 Slag System. J. Sustain. Metall. 2017, 3, 703–710. [Google Scholar] [CrossRef]
  44. Sukhomlinov, D.; Klemettinen, L.; Avarmaa, K.; O’Brien, H.; Taskinen, P.; Jokilaakso, A. Distribution of Ni, Co, precious and platinum group metals in copper making process. Metall. Mater. Trans. B 2019, 50, 1752–1765. [Google Scholar] [CrossRef] [Green Version]
Figure 1. Microstructures of samples with different starting mixtures (A—5 wt% SBs; B—10 wt% SBs; C—20 wt% SBs; D—10 wt% SBs + concentrate) after 40 min contact time at 1350 °C.
Minerals 11 00784 g001
Figure 2. Microstructures of samples with 5 wt.% of SBs in the starting mixture after 2 (A), 5 (B), 10 (C), and 60 (D) min contact time.
Minerals 11 00784 g002
Figure 3. Microstructures of metal alloy (A) and matte (B) in the sample after 10 min contact time with 10 wt.% of SBs in the starting mixture.
Minerals 11 00784 g003
Figure 4. Chemical concentrations of Fe (A) and Si (B) in the slag as a function of contact time at 1350 °C.
Minerals 11 00784 g004
Figure 5. Magnesium (A) and aluminum (B) concentrations in the slag as a function of contact time at 1350 °C.
Minerals 11 00784 g005
Figure 6. Chemical concentrations of Li (A), Mn (B), Ni (C), and Co (D) in the slags as a function of contact time at 1350 °C.
Minerals 11 00784 g006
Figure 7. Sulfur concentration in matte (A) and total concentration of nickel, cobalt, and copper in the matte (B) as a function of sulfur concentration in the matte.
Minerals 11 00784 g007
Figure 8. Iron concentration in metal alloy (A) and matte (B) as a function of contact time.
Minerals 11 00784 g008
Figure 9. Concentrations of valuable metals (Ni, Co and Cu) in metal (A) and matte (B) as a function of iron concentration in metal and matte, respectively.
Minerals 11 00784 g009
Figure 10. Concentrations of nickel (A,B) and cobalt (C,D) in the metal alloy and in the matte as a function of contact time.
Minerals 11 00784 g010
Figure 11. Ratios of nickel (A) and cobalt (C) to iron in metal alloy, and ratios of nickel (B) and cobalt (D) to iron in matte as a function of contact time.
Minerals 11 00784 g011
Figure 12. Distribution coefficients of nickel between metal alloy and the slag (A) and between matte and the slag (B) as a function of contact time.
Minerals 11 00784 g012
Figure 13. Distribution coefficient of cobalt between metal alloy and the slag (A) and between matte and the slag (B) as a function of contact time.
Minerals 11 00784 g013
Figure 14. Distribution coefficient of copper between metal alloy and slag (A) and between matte and slag (B) as a function of contact time.
Minerals 11 00784 g014
Table 1. The furnace setup.
Part of the SetupDetails, Producer
Heating elementsFour silicon carbide elements, positioned around the work tube, Kanthal
Working tubeImpervious pure alumina, Ø 38 mm ID, Frialit AL23, Friatec AG, Mannheim, Germany
Inner tubeInstalled inside the top part of the work tube through a top screw, impervious pure alumina, Ø 22 mm ID, Frialit AL23, Friatec AG, Mannheim, Germany
ThermocoupleS-type Pt/Pt–10%Rh, Johnson-Matthey Noble Metals, UK, accuracy of ±3 °C
Pt-resistance thermometerUsed for measuring room temperature, Pt100, SKS-Group, Vantaa, Finland, tolerance class B 1/10
MultimetersThe thermocouple was connected to a Keithley 2010 digital multimeter (DMM) and the resistance thermometer was connected to a Keithley 2000 DMM
Temperature loggingLabView software (version 8.6.1)
Gas atmosphereInert, 400–500 mL/min, Ar 5.0 (99.999% purity, AGA Linde, Espoo, Finland)
Table 2. The list of standards used in EDS analysis for concentration quantifications.
ElementStandard Material and X-ray Line Analyzed
Alaluminum, Kα
Caanhydrite, Kα
Cocobalt, Kα
Cucopper, Lα
Ksanidine, Kα
Mgmagnesium, Kα
Mnmanganese, Kα
Ninickel, Kα
Oquartz, Kα
Smarcasite, Kα
Siquartz, Kα
Znzinc, Lα
Table 4. (a) The experimental specific head grades of Co, Ni, Mn, and Cu in the feed. (b) The grades and recoveries for Co, Ni, Mn, and Cu in the 0–1 min froth concentrate.
(a)CoNiMnCu
Head Grade (%)Head Grade (%)Head Grade (%)Head Grade (%)
117.82.061.9223.74
218.12.141.9421.49
318.02.141.8621.97
421.62.532.2018.10
(b)CoNiMnCu
Recovery (%)Grade (%)Recovery (%)Grade (%)Recovery (%)Grade (%)Recovery (%)Grade (%)
131.432.8529.73.6034.33.861.92.71
232.133.8629.63.7034.43.891.72.16
336.436.3732.63.8638.73.992.32.76
437.837.5133.63.9038.23.853.52.91
Table 5. The composition of the spent batteries (SBs) fraction used in the experiments.
ElementAlCoCuFeLiMnNiPFCgC *
wt.%2.8823.351.280.363.012.842.250.212.219.8539.65
* This value represents total carbon concentration in the sample.
Table 6. Chemical composition of the starting mixtures with 5, 10, and 20 wt.% of spent batteries (SBs).
Concentrations (wt.%) in Starting Mixture
SubstanceNi-Slag/5% SBsNi-Slag/10% SBsNi-Slag/20% SBs
Al *0.140.290.58
Al2O32.962.812.50
MgO6.786.435.71
CaO1.571.491.32
SiO232.1730.4727.09
Co1.602.755.04
Cu0.560.600.67
Fe34.0832.3128.76
Ni3.403.343.22
Li0.150.300.60
Zn0.060.050.05
P0.010.020.04
S0.140.140.12
F0.110.220.44
Cg0.991.983.97
C **1.983.977.93
* Al was assumed to be present mostly in metallic form in the SBs; ** Carbon concentration includes all carbon (as graphite and as organic compounds).
Publisher’s Note: MDPI stays neutral with regard to jurisdictional claims in published maps and institutional affiliations.

