
Estimation of Mining-Induced Horizontal Strain Tensor of Land Surface Applying InSAR


Department of Mining Areas Protection, Geoinformatics and Mining Surveying, Faculty of Mining Surveying and Environmental Engineering, AGH University of Science and Technology, 30-059 Cracow, Poland
*
Author to whom correspondence should be addressed.
Minerals 2021, 11(7), 788; https://0-doi-org.brum.beds.ac.uk/10.3390/min11070788
Submission received: 1 June 2021
/
Revised: 16 July 2021
/
Accepted: 18 July 2021
/
Published: 20 July 2021
(This article belongs to the Special Issue Exploring Mining Landscapes: Reconciling Past and Present of Mining Activity)
Abstract
:Horizontal strains related to mining-induced subsidence may endanger infrastructure and surface users’ safety. While directional horizontal strains should be well determined, appropriate solutions for a complete assessment of the terrain surface deformation field are still required. As a result, the presented study examined a new method for calculating horizontal strain tensor based on the decomposition of satellite radar interferometry (InSAR) observations into vertical and azimuth look direction (ALD) displacements. Based on a geometric integral model, we tested our method on experimental data before applying it to an underground copper ore mine in Poland. In the case study, the displacement field was determined using the Multi-Temporal InSAR method on Sentinel-1 data. The model data relative error did not exceed 0.02 at σ = ±0.003. For the case study, land subsidence of up to −167 mm and ALD displacements ranging from −110 mm to +62 mm was obtained, whereas the extreme values of horizontal strains ranged from −0.52 mm/m to +0.36 mm/m at σ = ±0.050 mm/m. Our results demonstrate the high accuracy of the method in determining the horizontal strain tensor. As a result, the approach can broaden the assessment of the environmental impact of land subsidence worldwide.
1. Introduction
Land subsidence can be caused by both natural Earth factors and anthropogenic activities [1,2,3,4,5,6,7,8,9]. This type of phenomenon has been observed in various parts of the world for decades. Land subsidence harms structures, both surface and subsurface, and may endanger the safety of surface users [10,11,12]. As a result, it is critical to constantly seek solutions that allow for the phenomenon’s negative environmental effects to be minimised [1].
Land subsidence due to mining is primarily caused by the displacement of elements of the rock mass above the seam and post-extraction void migration to the terrain surface [13]. These displacements cause continuous surface deformations. Subsidence, tilt, curvature, horizontal displacement, and horizontal strain are common parameters used to describe continuous surface deformations [13,14]. However, strain is the most important subsidence parameter for analysing natural and built surface features. While several well-established methods exist for forecasting mine subsidence [15,16,17,18,19,20,21,22,23,24,25,26], predicting horizontal strain is significantly more difficult since the strain is sensitive to variations in surface features and the presence of near-surface landforms [27,28].
Early strain prediction methods relied on simple empirical relationships with mining geometry or other predicted subsidence parameters [27,29,30]. When the surface and overburden are relatively flat and there are no significant near-surface geological components, these empirical methods provide reasonable predictions of regular ground movements. However, due to irregular movements, the prediction of horizontal strain acquired using these methods is frequently exceeded at distinct points.
Recently, statistical methods have been applied to estimate strain distribution based on regular and irregular movements [27,28,31,32]. These approaches assess the likelihood of exceeding strain limits based on previously recorded ground monitoring data. However, these statistical methods are generally limited to regions where the mining geometry and overburden lithology are comparable to the mining sites where the monitoring data was obtained.
Importantly, whereas directional horizontal strains may be accurately estimated using, for example, precise levelling and Global Navigation Satellite Systems (GNSS) measurements [33,34,35,36], the variance in horizontal stress magnitudes is poorly understood. As a result, new strategies for assessing the terrain surface deformation field are still necessary. A better understanding of how the magnitudes fluctuate would be beneficial in formulating mine design solutions to address horizontal stress-related ground control issues.
In recent years, InSAR can effectively measure ground surface displacement. This technique has a high spatial resolution and accuracy and is not dependent on weather conditions [37]. Therefore, InSAR is now commonly used to assess ground movements caused by natural and anthropogenic phenomena such as seismicity [38], volcano eruptions [39], landslides [40], glacier motions [41], mining activity [42], and tunnelling [43]. The displacements of the land surface using InSAR data are first calculated in the line-of-sight (LOS) direction [44,45]. Determining the values of such movements in different directions necessitates the use of additional satellite data acquisition geometry [46] or physics assumptions about the observed phenomenon [47].
The estimation of a 3D displacement field from InSAR data can be carried out by applying three types of methods [48]. The first group uses a single-geometry InSAR, and thus LOS observation, in conjunction with an established deformation model of the studied phenomenon [49]. This approach has been used for building damage assessment [47]. The authors of the mentioned approach utilised InSAR observations and a prediction model, which required additional information about the deformation process, e.g., geological condition, mining situation, and parametrisation of the theoretical model. Unfortunately, such information is often difficult to obtain with sufficient reliability. Aside from single-geometry InSAR data sets, Multiple-Aperture InSAR (MAI) [50] or Offset-Tracking (OT) [51] methods can be used to estimate a 3D displacement field. However, the MAI and OT methods typically yield less accurate results than the single-geometry InSAR data set approach [48]. The second set of techniques is based on multi-pass LOS displacements combined with MAI or OT methods. However, their use in slow surface deformation regions is limited due to the low accuracy of the multi-pass LOS technique [52]. Finally, the third group of methods includes GNSS observations. Due to the difficulty in obtaining archival or current GNSS data sets and relatively sparse distribution of GNSS observation points in many parts of the world, their use, however, in determining a 3D displacement field in conjunction with InSAR data is highly limited [48].
When observing natural or anthropogenic phenomena, it is necessary to understand a 3D displacement field related to their occurrence and deformation field components such as the horizontal strain tensor and the rotation tensor [42]. Since surface and underground infrastructure is particularly vulnerable to high horizontal strain tensor values, it is critical to recognise their extreme values for risk assessment and mitigation plan implementation in prone areas [47,53]. Furthermore, the impact of high horizontal strain values on infrastructure and surface user safety is particularly important when underground mining is carried out in densely populated urban areas [54]. As a result, numerous approaches have been proposed to address this research problem. One of them used a strain model in conjunction with the MAI technique to determine the displacement field caused by underground mining applying InSAR double geometry [52]. The size of the calculation window determines the accuracy of the component determination in this solution. The greater the window size, the lower the spatial resolution of the data and, as a result, the accuracy of the modelling results. InSAR observations and theoretical model calculations were also used to determine the horizontal strain tensor for a subsidence trough over a coal longwall [47]. Similarly, an InSAR-based damage assessment method was proposed that utilises horizontal strain tensor obtained from InSAR measurements [55]. The presented results, however, are limited to the ground inclination (slope). As a result, there is a need to develop a high accuracy solution for the horizontal strain tensor determination not constrained by strict geometrical limitations or additional model assumptions.
The presented study fills a gap in the current knowledge by proposing a new method for determining horizontal strain tensors based on double-geometry InSAR. The third component of the displacement field, which is needed to calculate the strain tensor, is calculated by assuming that the horizontal displacement field is proportional to the first derivative of the vertical displacement field. This assumption is also used in the theoretical modelling of mining subsidence displacement fields [56]. Moreover, a similar solution is used in gravity-driven phenomena such as landslides or ice velocity, where the first derivative of the land surface elevation is utilised [57,58]. The proposed method is entirely based on the interpretation of InSAR LOS movements. Additionally, geostatistical tools were used to filter InSAR observations for noise reduction [59]. As a result, the derivative of a displacement field can be reliably computed, and therefore, the horizontal strain tensor is accurately determined.
2. Study Area and Input Data
The presented study was conducted on experimental data first and then applied to real-world data.
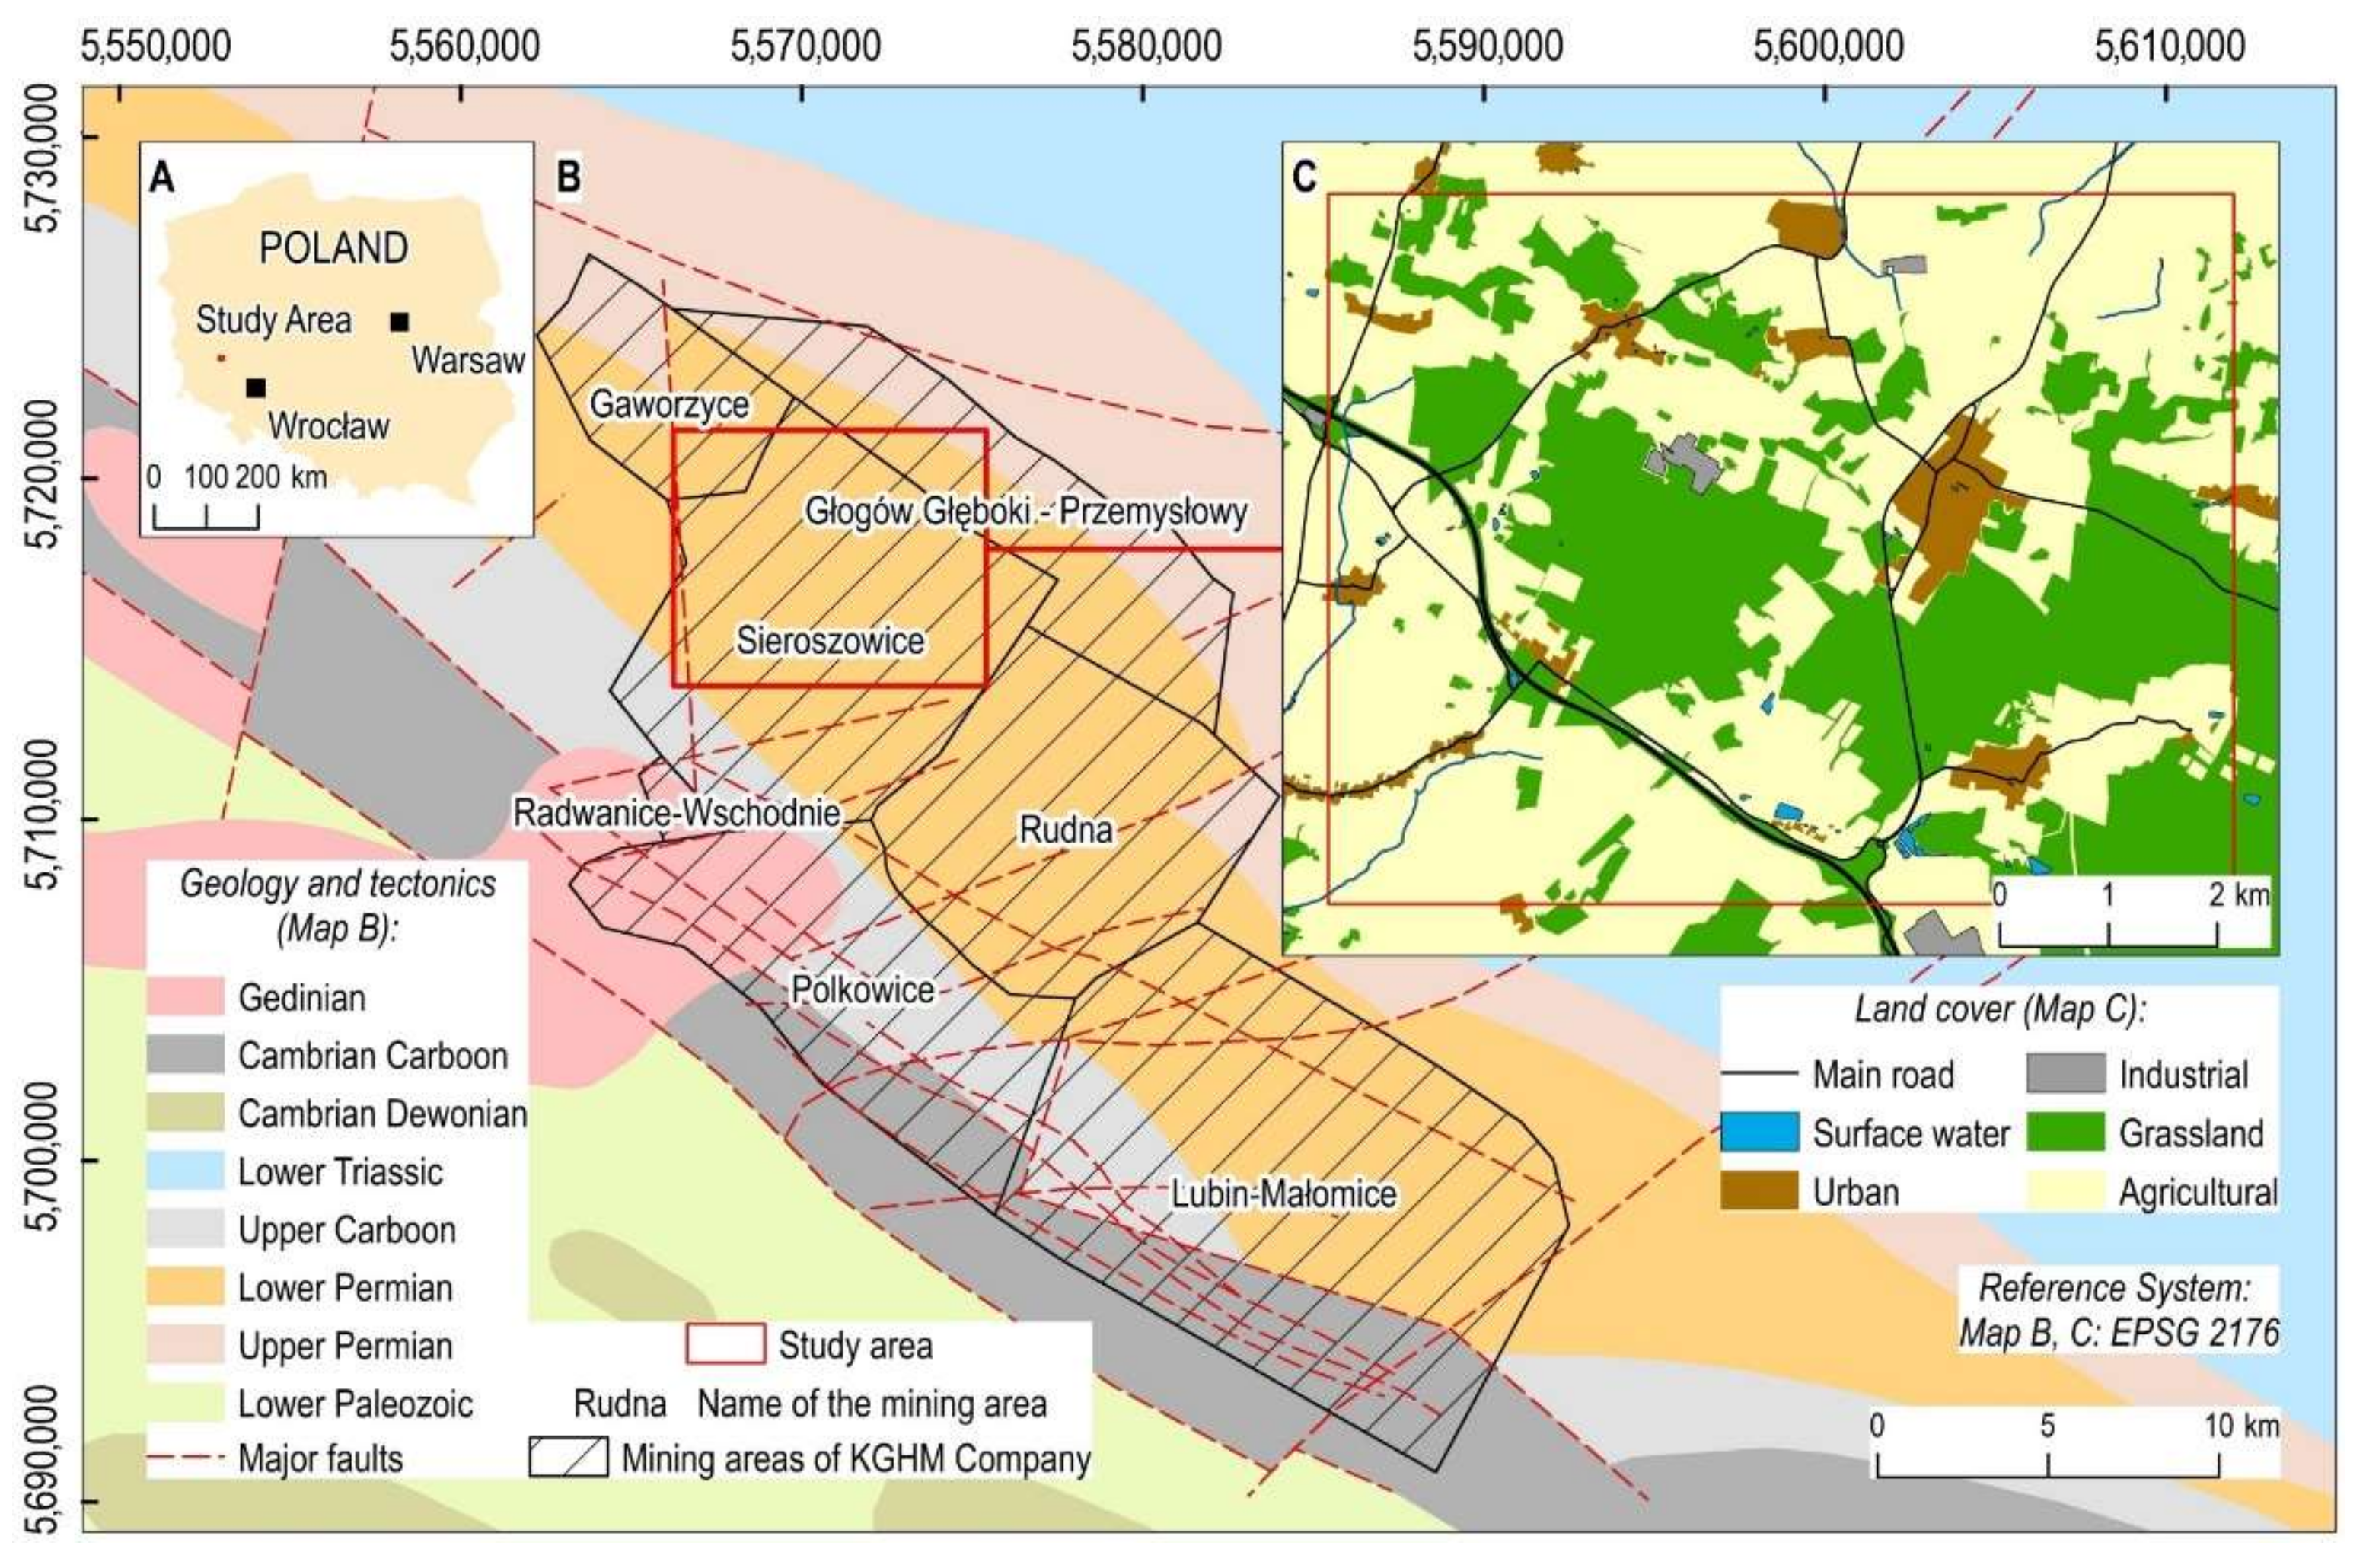
The research was carried out in underground copper ore mining areas in Legnica-Głogów Copper District (LGOM), Poland. The study focused on a 55 km2 area that included sections of the mining sites of “Sieroszowice”, “Głogów Głęboki-Przemysłowy”, and “Gaworzyce” (Figure 1).
The geological and tectonic conditions in the study area are complicated (Figure 1B). The LGOM is located in the Fore-Sudetic Monocline. The Proterozoic crystalline rocks and Carboniferous sandstones form the foundation of this formation [60]. These strata are overlain by Paleozoic sediments that dip down to the northeast at up to 6°. A deep series of Tertiary sediments represent the Rotliegend and Zechstein strata. Sediments from the Neogene and Paleogene periods formed the youngest rock strata [61]. There are numerous fault zones in the study area (Figure 1B). These zones run northwestern to the southeast. The main faults range in inclination from 30° to 90° [61,62,63].
Since the 1980s, copper ore extraction has been carried out in the study area using the pillar-and-chamber method with bending of the roof layer, partially with surface protection [64,65]. As a result, maximum values of land subsidence recorded in the study area reached a few meters. Notably, the entire subsidence trough usually occurs within 5–9 years of the end of mining operations [15,66]. This implies that the expected dynamics of land subsidence is relatively fast, with a maximum of about 30 mm/month [36]. Furthermore, previous mining operations have revealed the risk of high-energy mining tremors occurring in the study area. Every year, at least a few earthquakes with energies greater than 10E7 J are recorded [61,67,68,69,70,71]. Moreover, mining-induced earthquakes in the study area caused much greater velocity and quantity of ground displacements than land subsidence caused directly by the extraction of copper ore deposits [67,72,73,74,75,76,77,78,79,80,81,82,83].
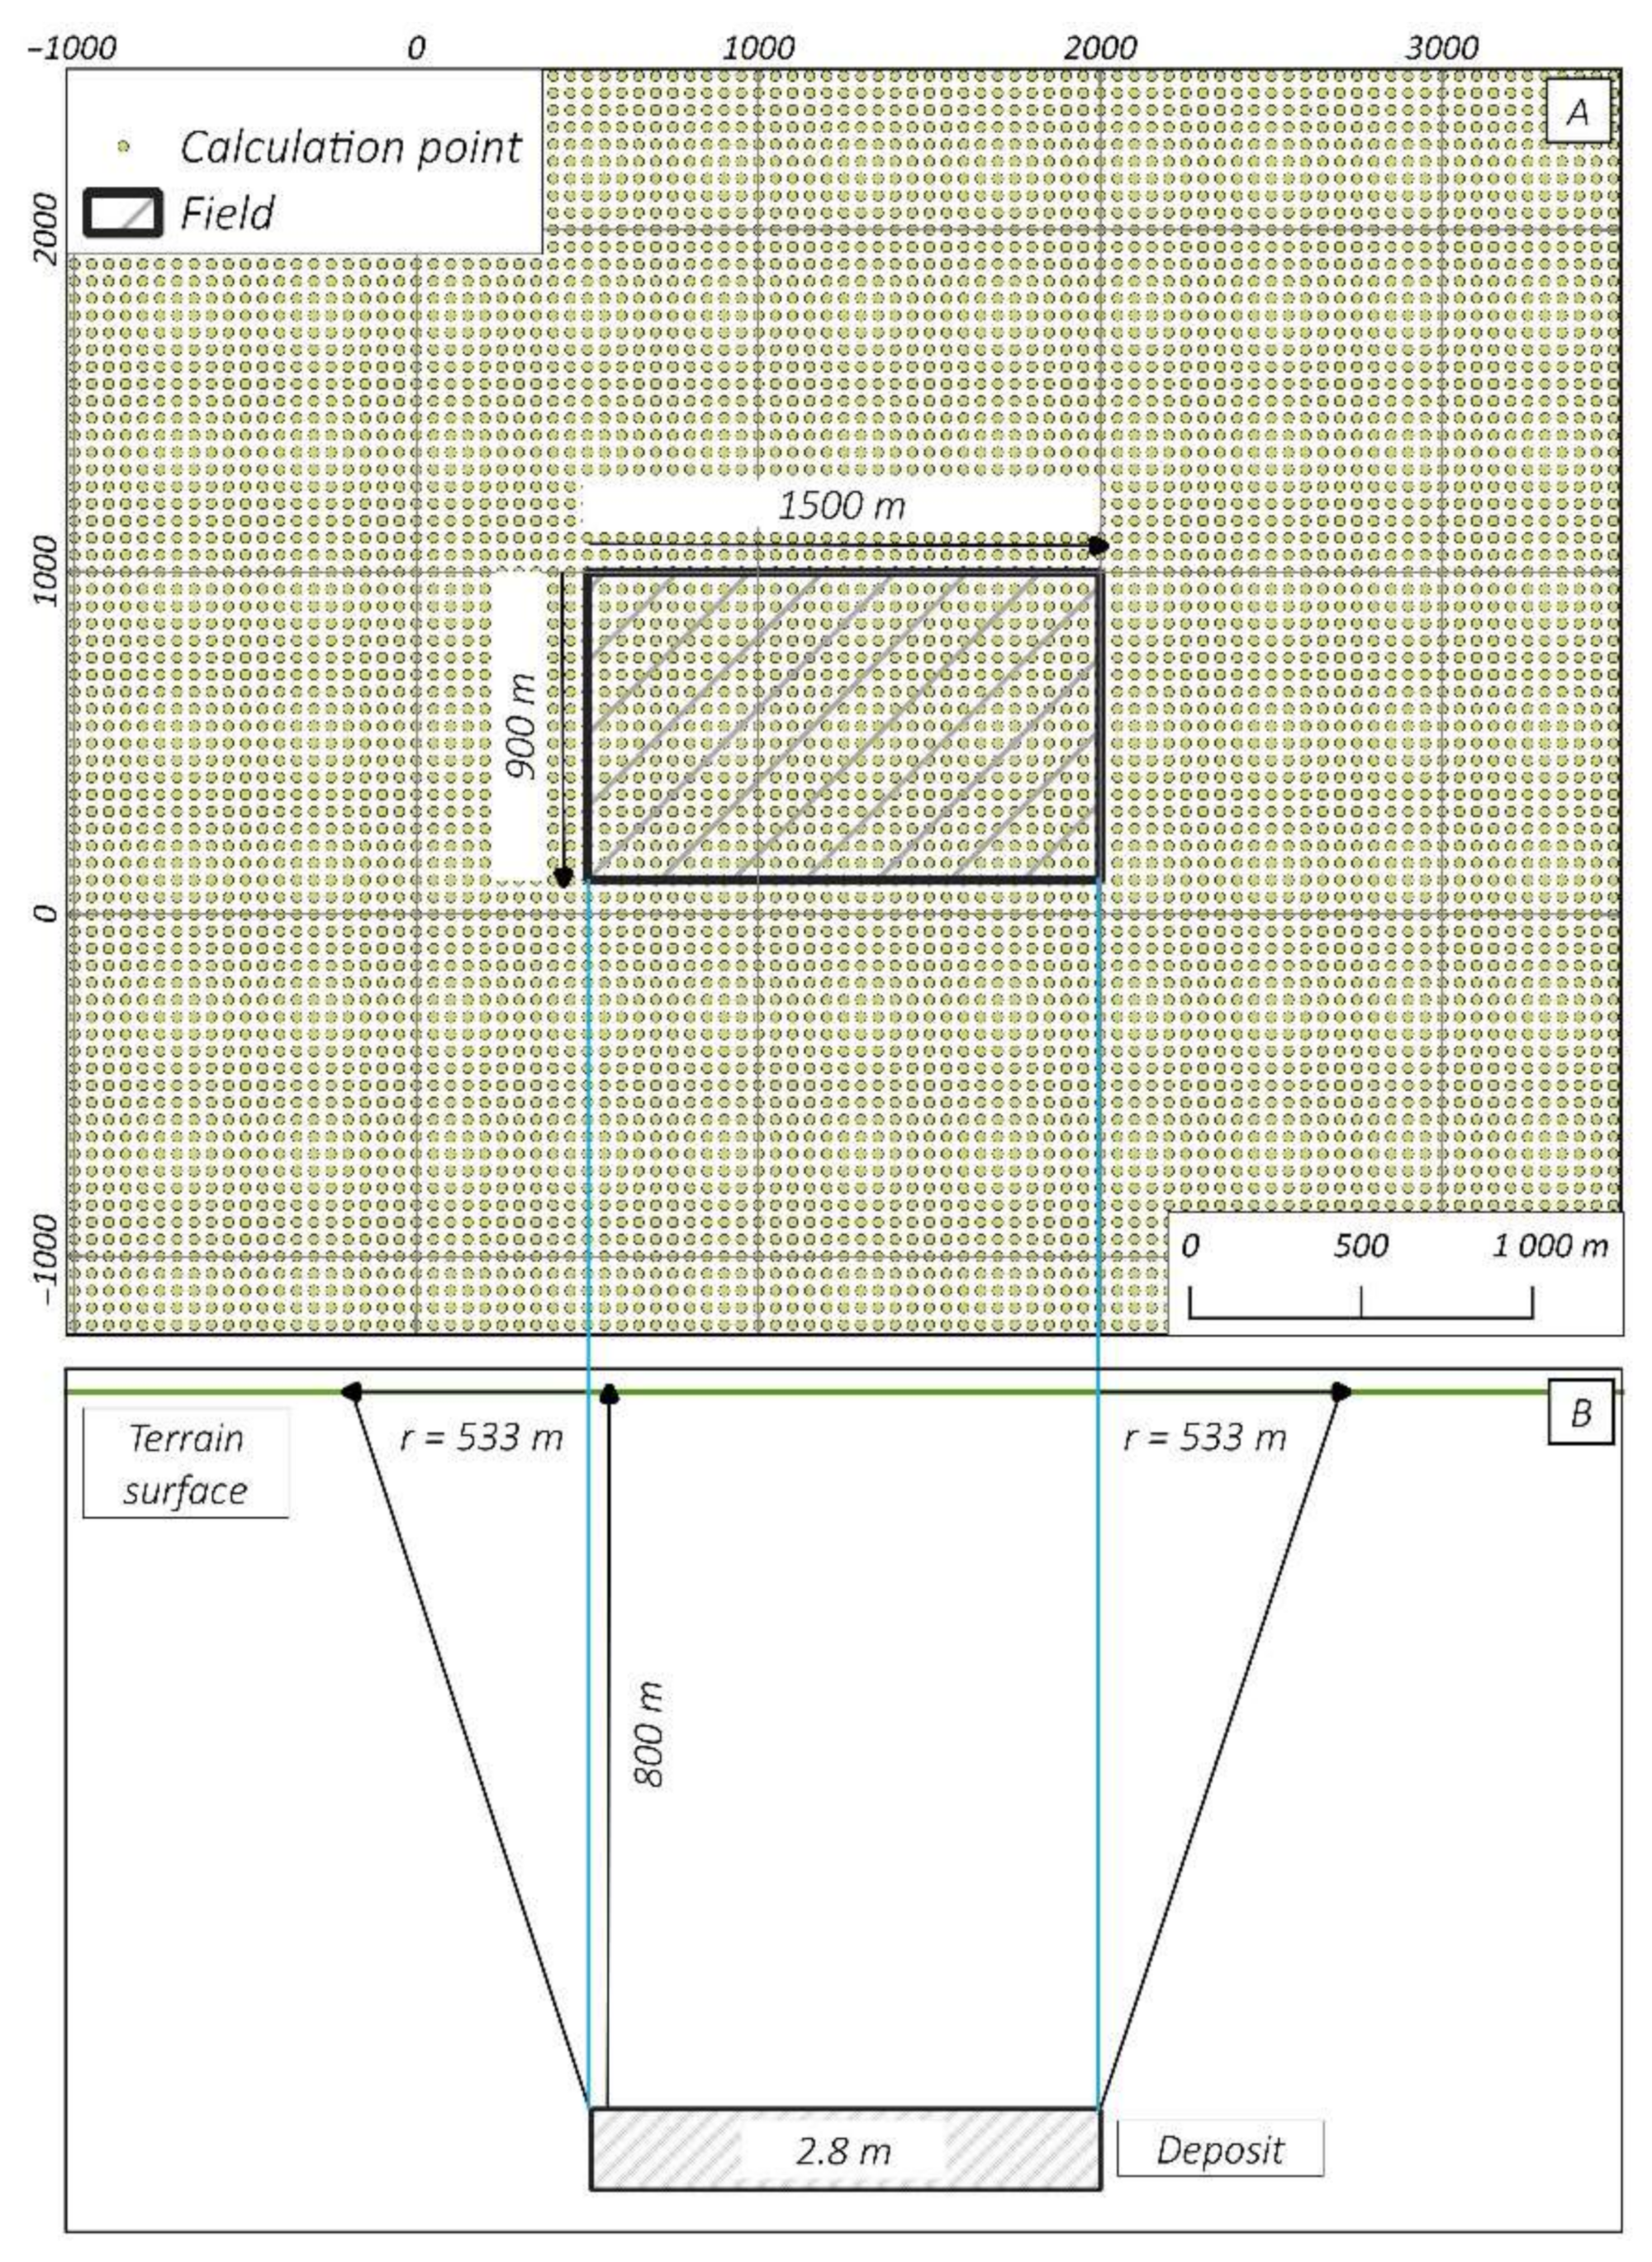
In a computational experiment, a geometric-integral model based on the Knothe-Budryk theory was used [15,84,85]. The displacement field theoretical values for a rectangular disturbance located at a depth of 800 m with dimensions of 1500 m × 900 m were calculated to reflect local mining and geological conditions. The computations assumed a layer thickness of 2.8 m and two model parameters: 0.70 for the influence factor and 1.5 for the layer strength parameter. These parameters, according to a geometric-integral model, allowed to determine the influence radius . The numerical calculations were carried out on a grid of 50 m × 50 m, with the use of SubCom software (v1.0., manufactured by Wojciech Witkowski and Ryszard Hejmanowski, AGH University of Science and Technology, Cracow, Poland) [86] (Figure 2).
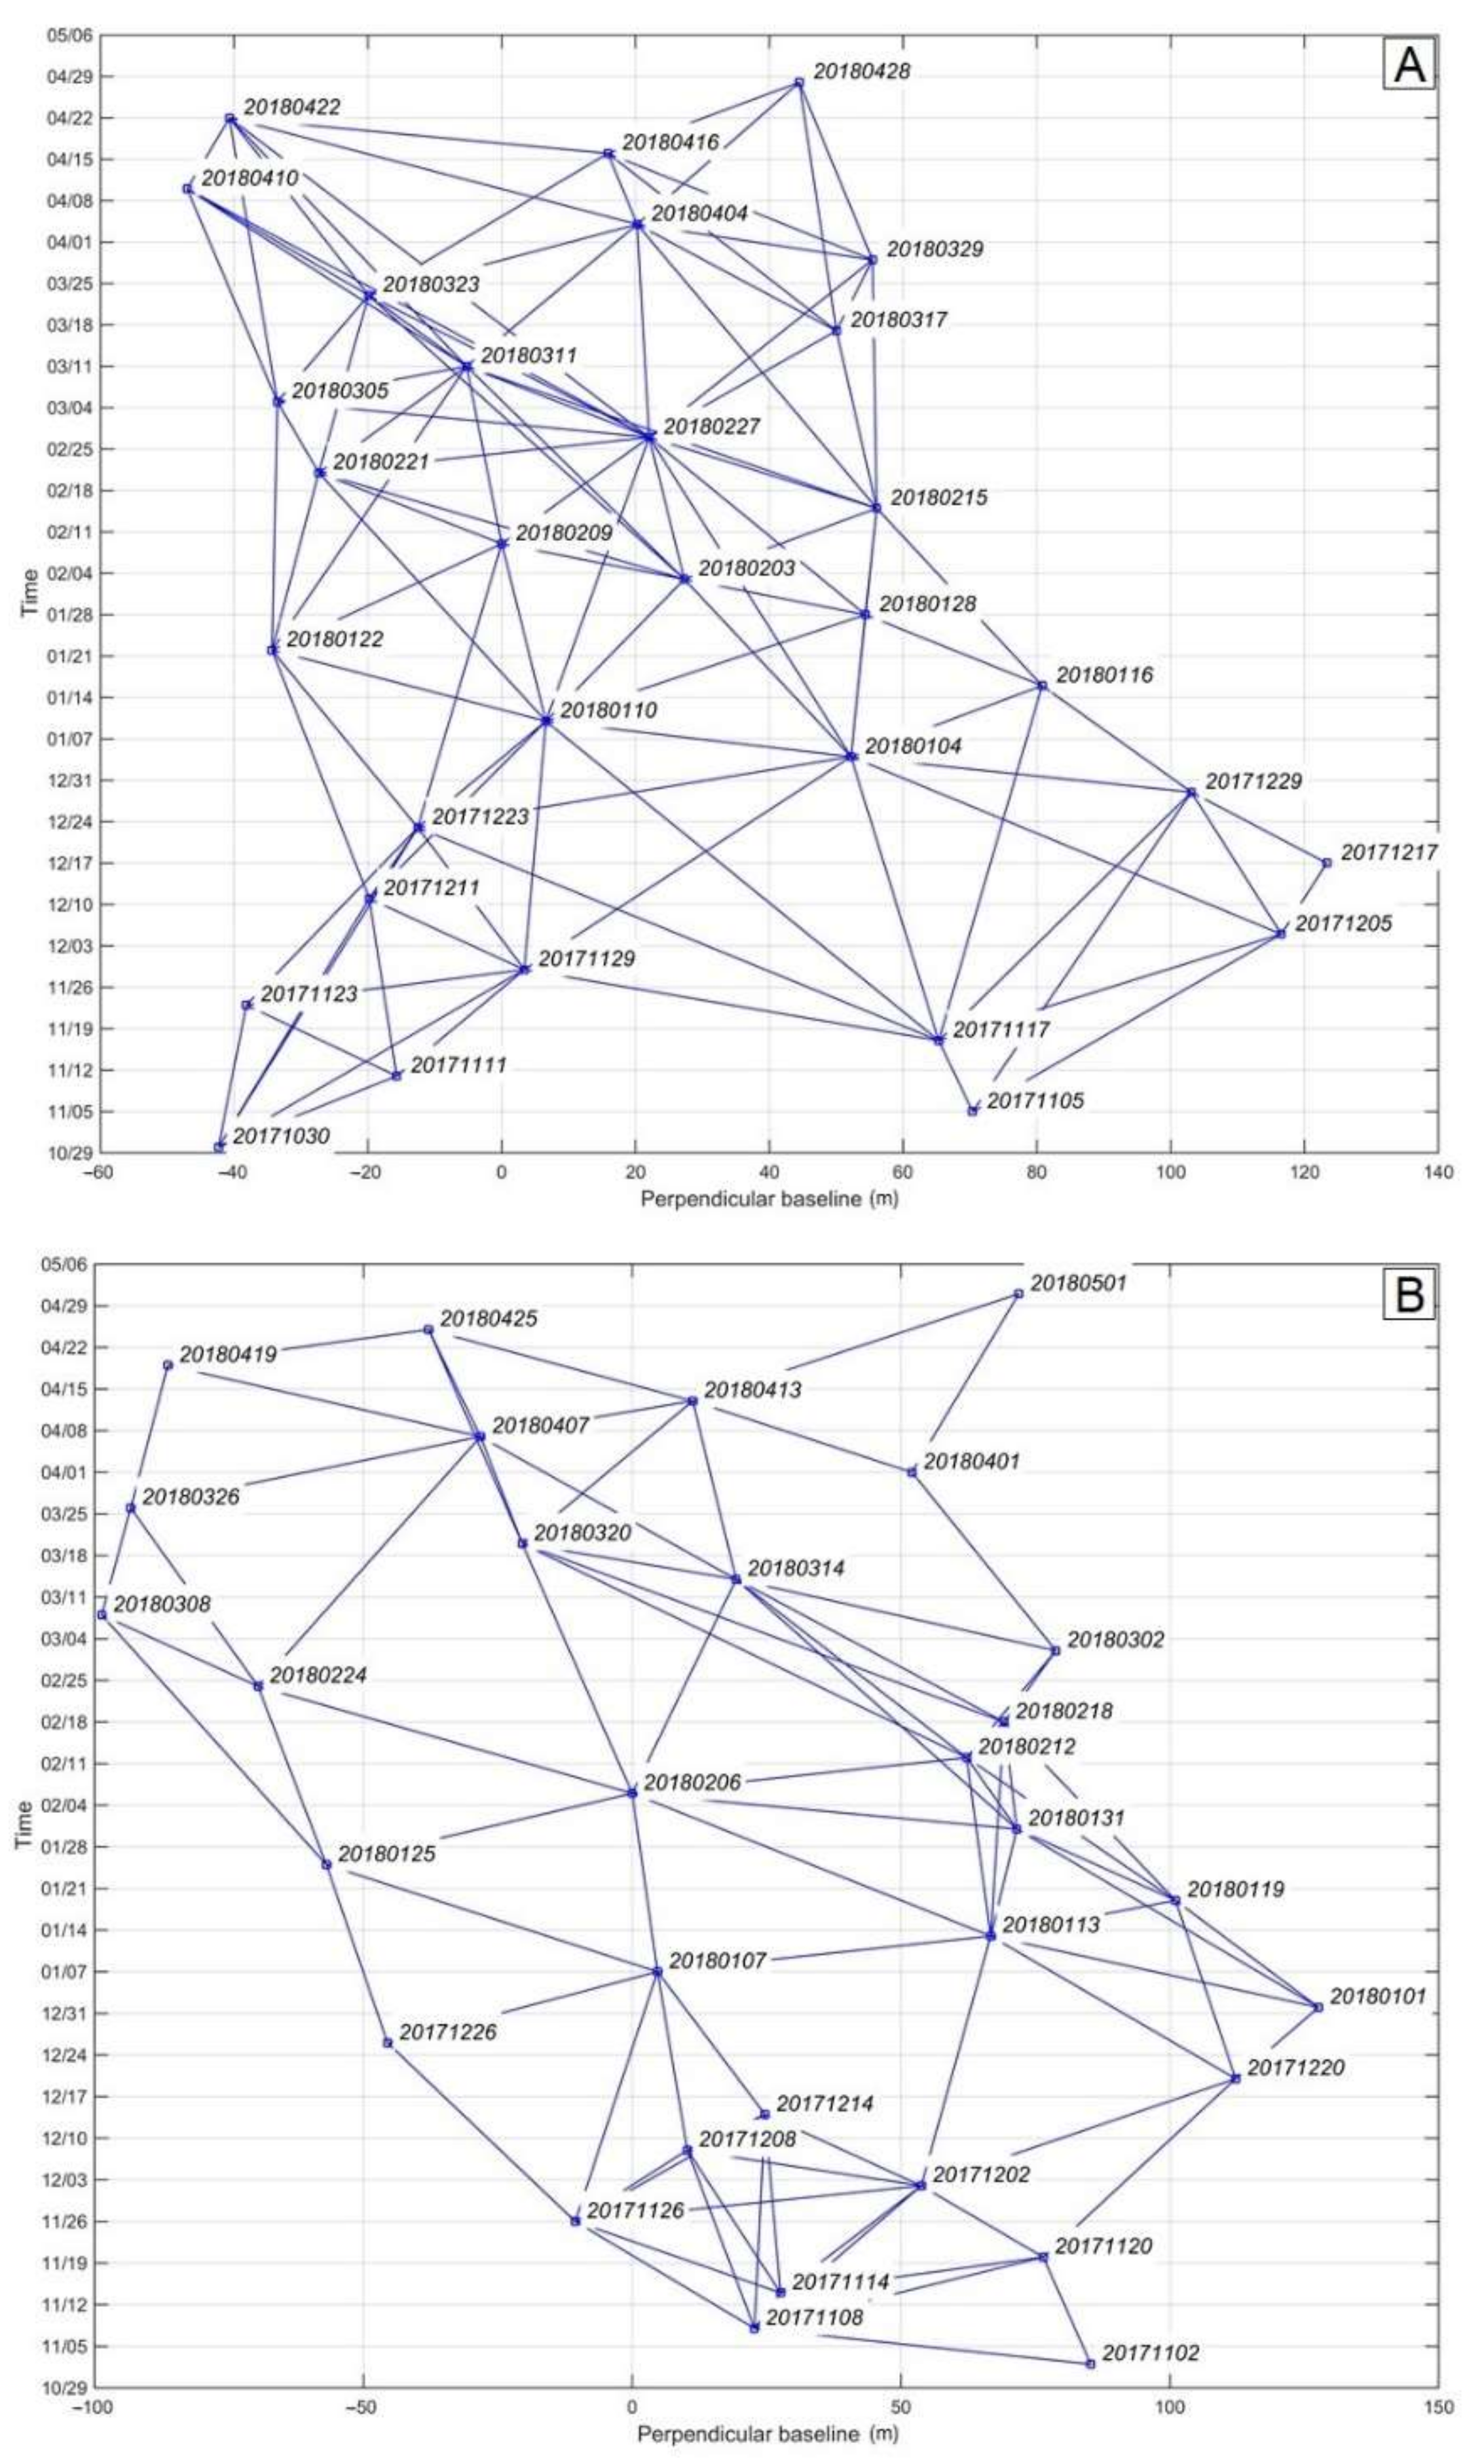
Ground movements were analysed in the presented study using data from Sentinel-1 satellites [87]. The Sentinel-1 acquisitions were obtained between November 2017 and April 2018. The dataset contained 110 ascending geometry interferograms and 86 descending geometry interferograms. The Multi-Temporal InSAR (MT-InSAR) algorithm based on the Small-Baseline (SB) approach was used to process the data (Figure 3) [88]. The MT-InSAR analysis is a type of advanced InSAR data processing technique developed to overcome the limitations of the classical differential InSAR method, such as temporal and geometrical decorrelation, as well as to compensate for errors caused by atmospheric distortions, inaccurate terrain models, and uncertain satellite orbits [89,90,91]. This method’s ability to detect and investigate deformation phenomena has already been demonstrated in various applications [92,93,94,95,96,97,98,99,100]. Furthermore, since our study area is mostly covered by arable fields and forests (Figure 1C), we could retrieve reliable results of ground movements by using the MT-InSAR approach, which can be successfully applied for agricultural and non-urban areas [91].
Interferometric processing was done in Sentinel Application Platform (SNAP v8.0.0, designed by European Space Agency, Paris, France) and StaMPS (v4.1b1, designed by Andy Hooper, University of Leeds, Leeds, UK), whereas modelling and postprocessing of obtained results were carried out in Matlab (vR2021a, designed by Cleve Moler) and ArcGIS (v10.7.1, designed by ESRI, West Redlans, CA, USA). Since the primary goal of the presented research was not to process InSAR data, a more detailed description of MT-InSAR processing was omitted from the article. However, detailed descriptions of these techniques can be found in numerous research papers [88,101,102].
3. Research Methodology
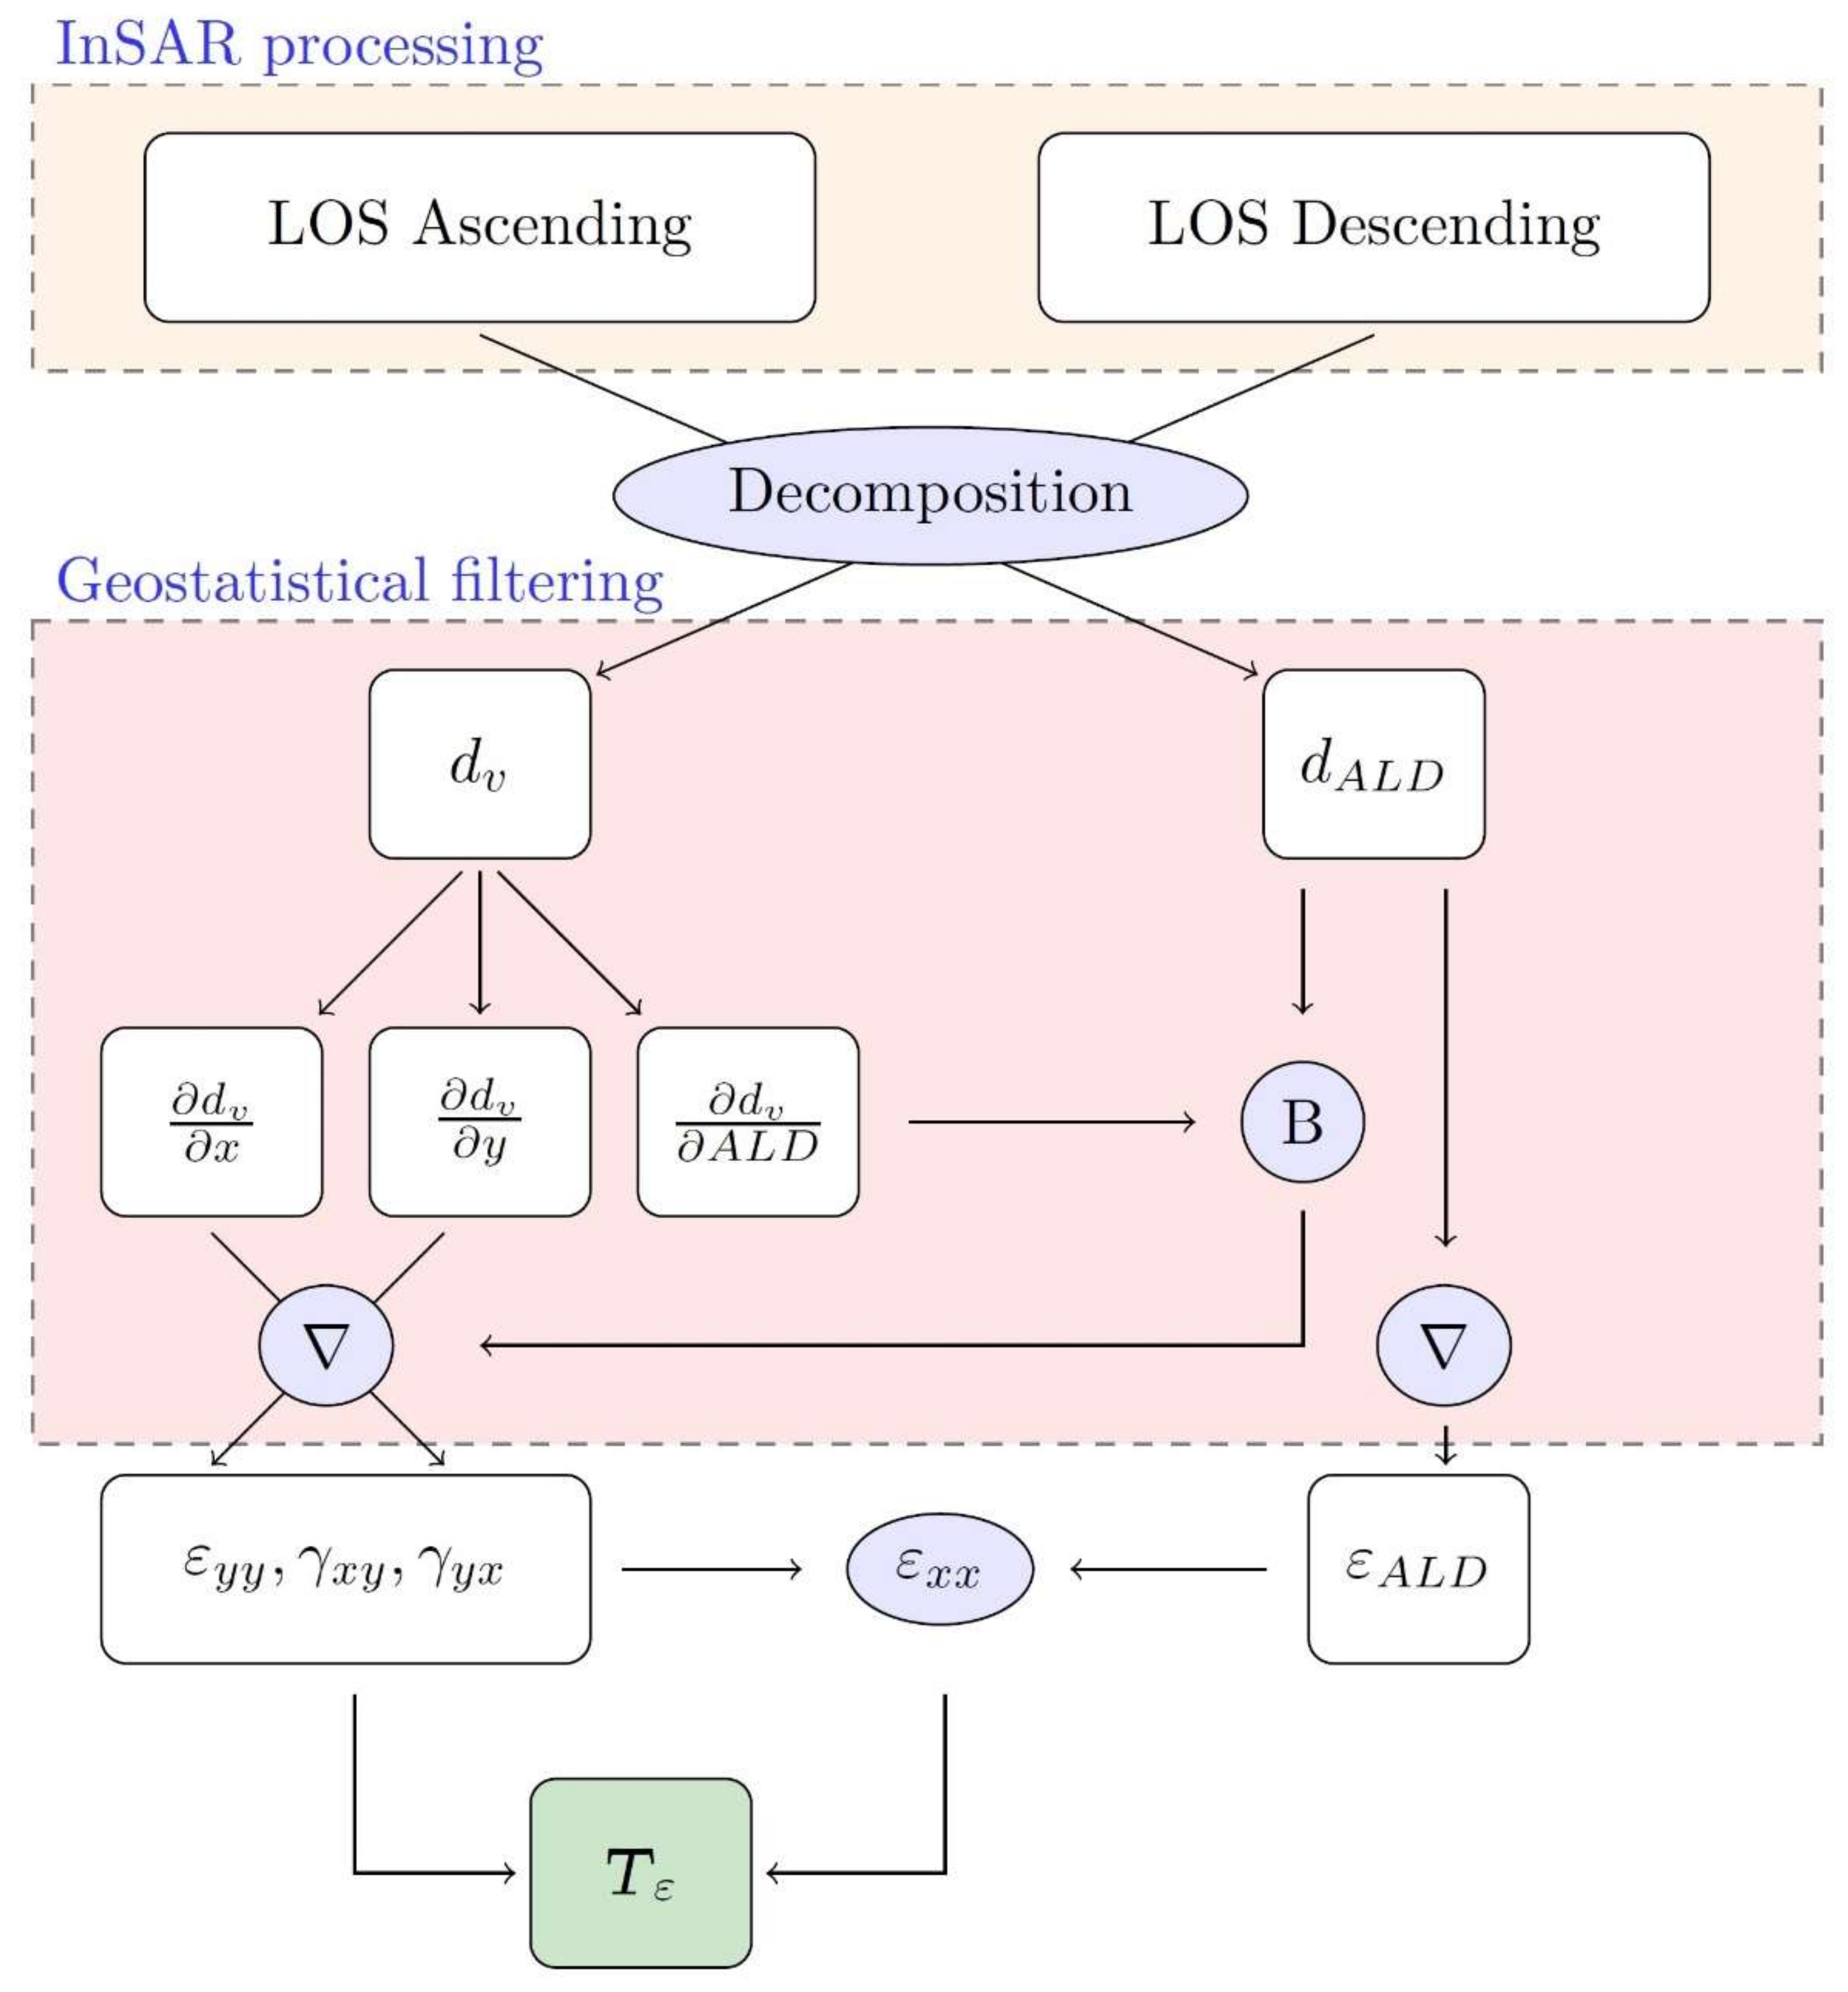
The developed methodology retrieves the results of ascending and descending double geometry InSAR acquisitions (Figure 4) [45]. Based on these observations, the displacement field is decomposed according to Equation (1):
where and are LOS displacements obtained from ascending and descending geometry mode of InSAR, respectively; and are incident angles of ascending and descending InSAR acquisitions, respectively; is the satellite heading difference between ascending and descending acquisitions of InSAR data; is the vertical displacement of the deformation field and is the horizontal displacement of the deformation field in the Azimuth Look Direction.
The horizontal components of the displacement field were determined using the concept of gravity-driven processes. Horizontal displacements are assumed to be proportional to the first derivative of vertical displacements in this principle. According to Equation (2), values in our solution are functionally related to by parameter :
Using the determined parameter , displacements in the directions of the and axes can be calculated using Equations (3) and (4), respectively:
The gradient of the displacement field, however, can be used to compute a horizontal deformation tensor . Because of the information about the plane state of displacements, the considerations can be limited to four components of the matrix , as shown in Equation (5):
where is the matrix of the strain tensor and is the antisymmetric matrix of the rigid body rotation tensor. Since rotations have low importance in the displacement field, the analyses were limited to strain tensor .
In addition, horizontal displacements derived from LOS observations are used in the calculations. By determining the directional derivative, the directional horizontal strain value is obtained. After modifying Equation (5) by entering the symbols , , , the tensor component is determined using Equation (6):
Equation (7) can be used to calculate the extreme values of the horizontal strain tensor after determining the components of the matrix:
Empirical observations are used to calculate derivatives of the displacement field. As a result, the information obtained is susceptible to observational noise. Data filtering tools were included in the method presented to reduce the effect of noise on empirical data. The geostatistical filtering method based on ordinary kriging was used. In the calculations, the semivariance function expressed by Equation (8) was used. The value differences (, ) between the points in the space are counted by this function. All pairs of points separated by the vector are analysed in the calculations. Semivariance analysis enables the solution of kriging equations and the reduction of system variance. As a result, it is possible to obtain quasi-smooth displacement field distributions and data standard deviation information.
4. Results and Discussion
4.1. Experimental Data
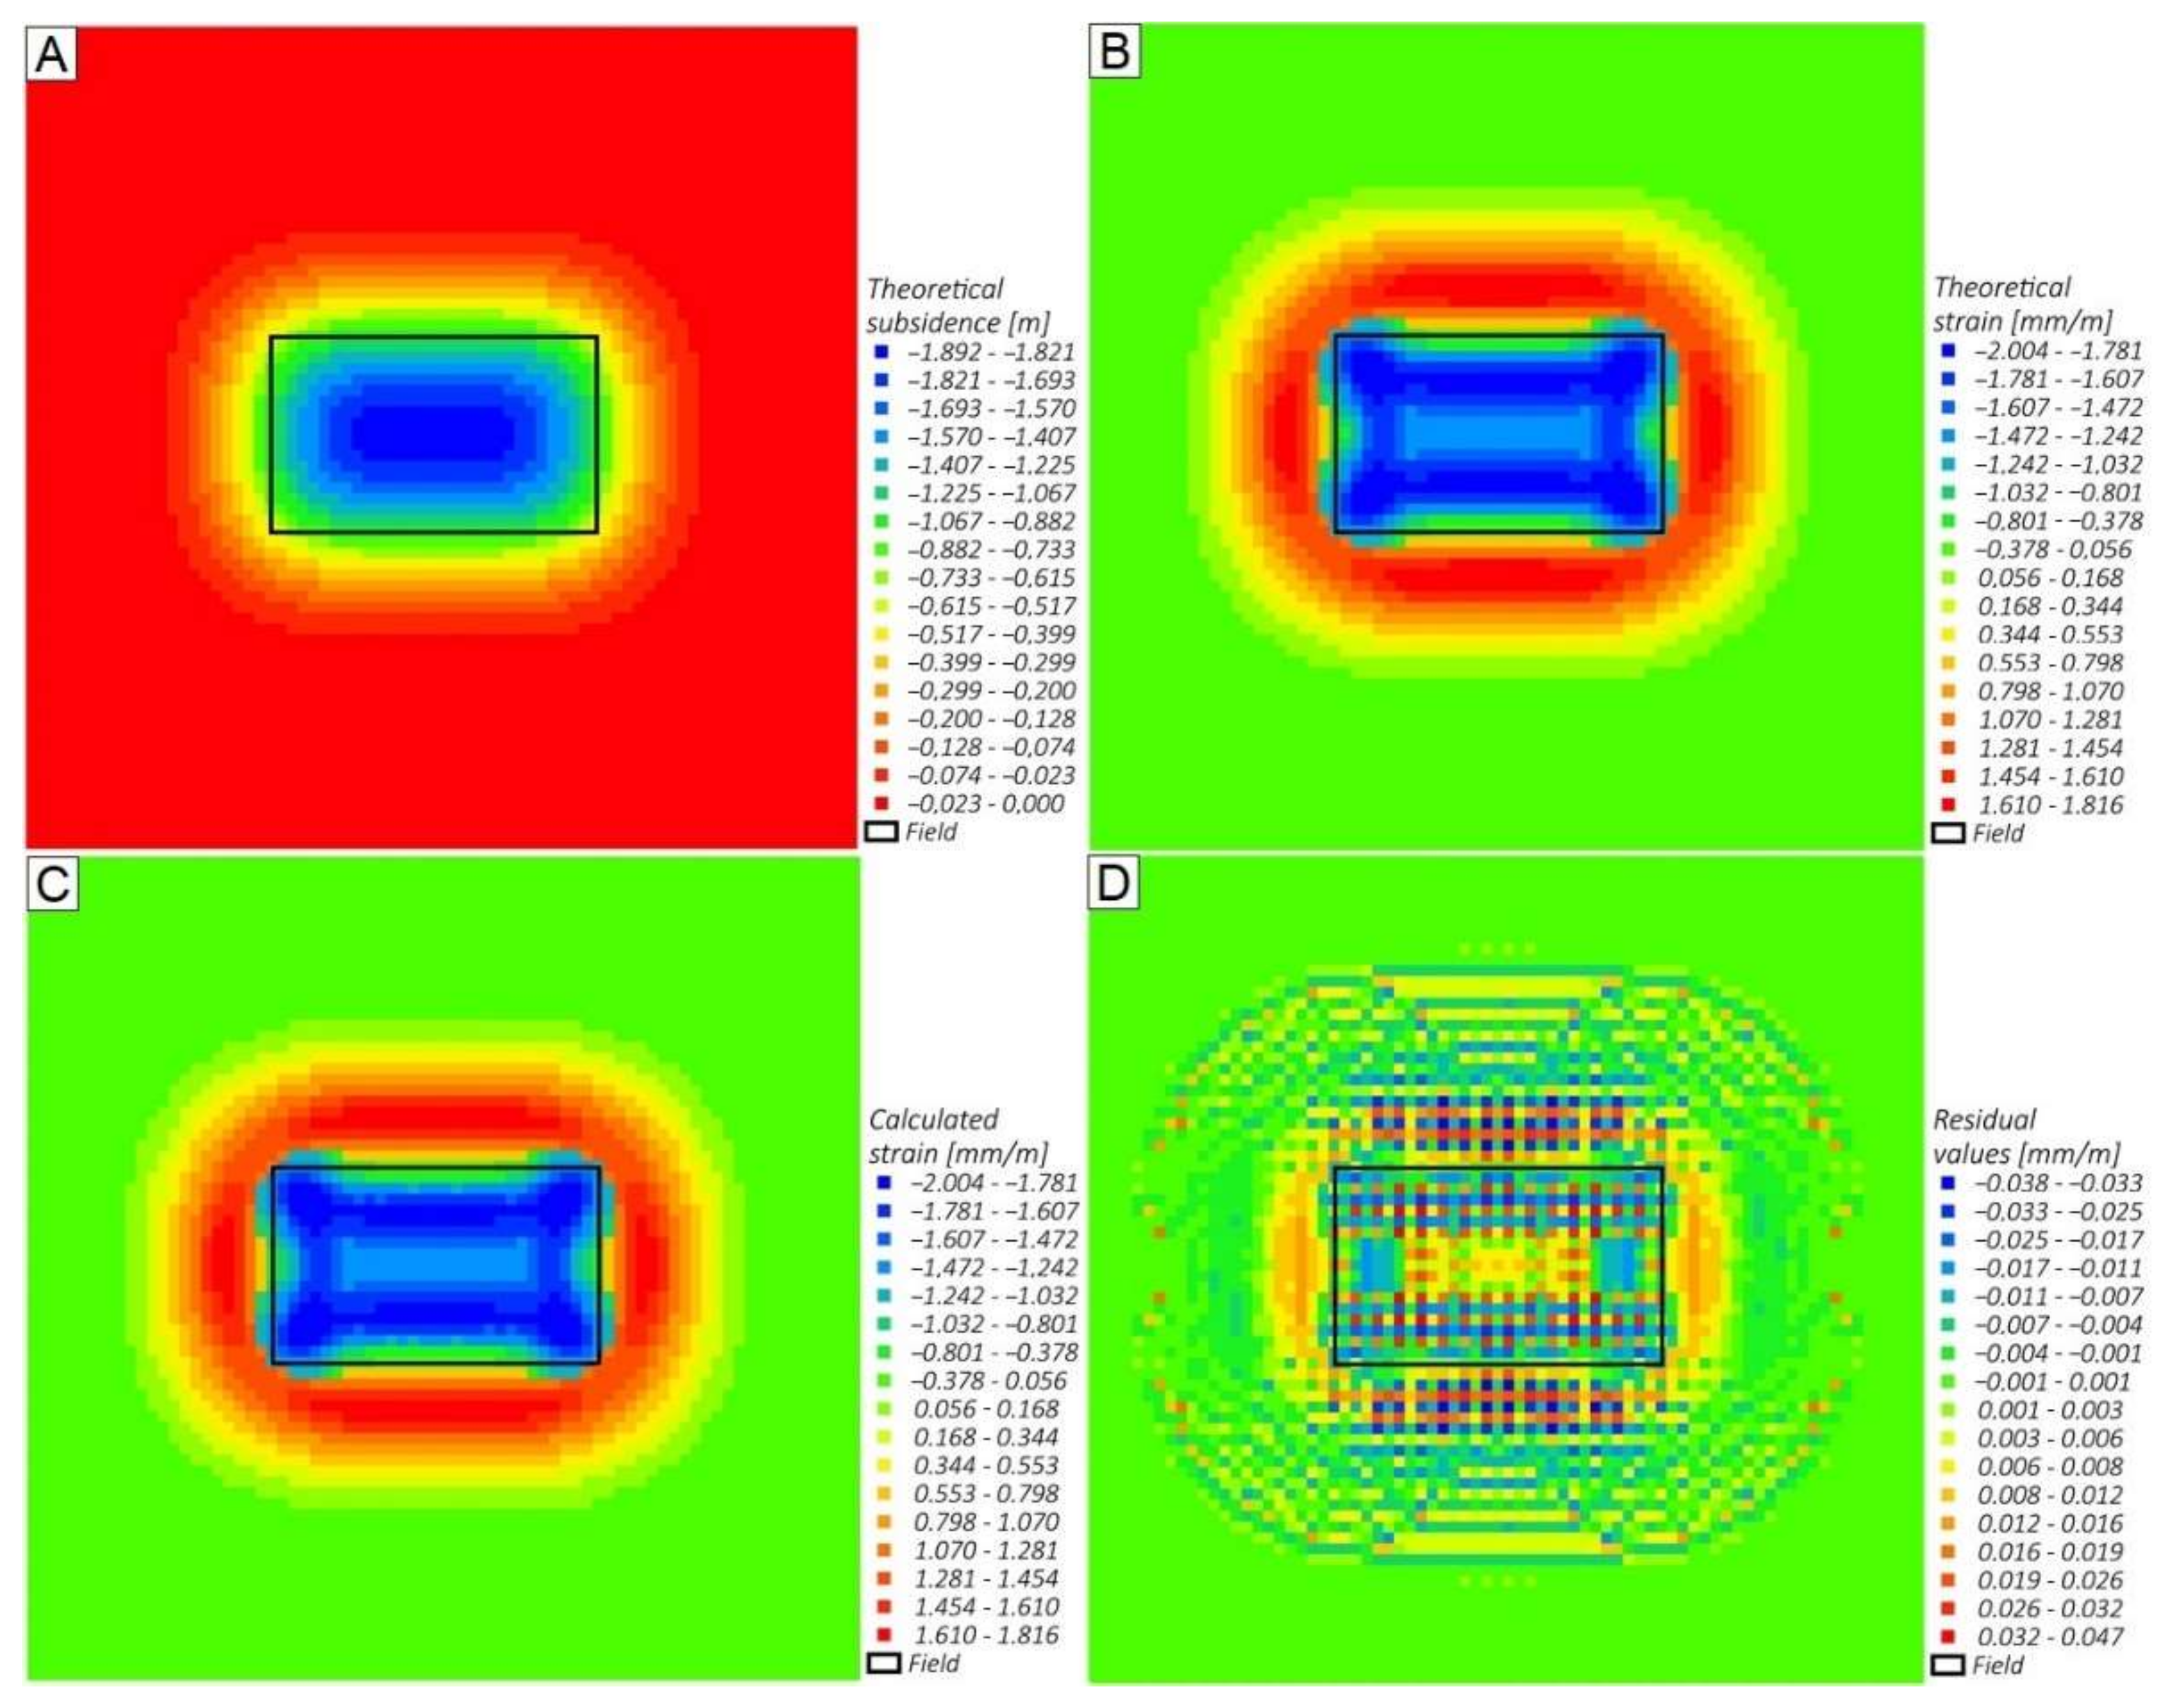
For the experimental data (see Section 2), the calculated maximum land subsidence is 1.892 m, which occurs in the centre of the analysed deformation field (Figure 5A). Land subsidence causes horizontal strains ranging from −2.00 mm/m to +1.82 mm/m. The asymmetric distribution of these values results from the accumulation of compression zones in the centre of the analysed field. By examining the spatial distribution of the calculated horizontal strains, we can conclude that tension zones are located outside the deformation field boundary, whereas compression zones are located within the deformation field. Furthermore, the extreme horizontal strain values occur near the boundary vertices of the field (Figure 5B).
The proposed methodology is based on two parameters derived from the decomposition vector of the displacement field. As a result, the model values of the vertical axis movements and the calculated directional horizontal displacement were used to determine the components of the strain tensor . These components were obtained at each point of the computational grid. Finally, the extreme horizontal strain values (Figure 5C) were calculated and compared to the model values (Figure 5D). The average difference between the model and the calculated extreme deformation values was equal to 0.00 mm/m, with σ = ±0.007 mm/m. For the model calculations, the relative error did not exceed 0.02, with σ = ±0.003.
The experiment results demonstrated that the proposed method is correct and accurate. However, the accuracy of the results depends on the quality of the InSAR data processing and the real-life geological and mining conditions in subsidence areas (e.g., anomaly in terrain ground deformation). As a result, if the above assumptions are met, our approach can successfully assess the land surface deformation fields associated with processes characterised by gravity-driven mechanisms.
4.2. Real-World Case Study
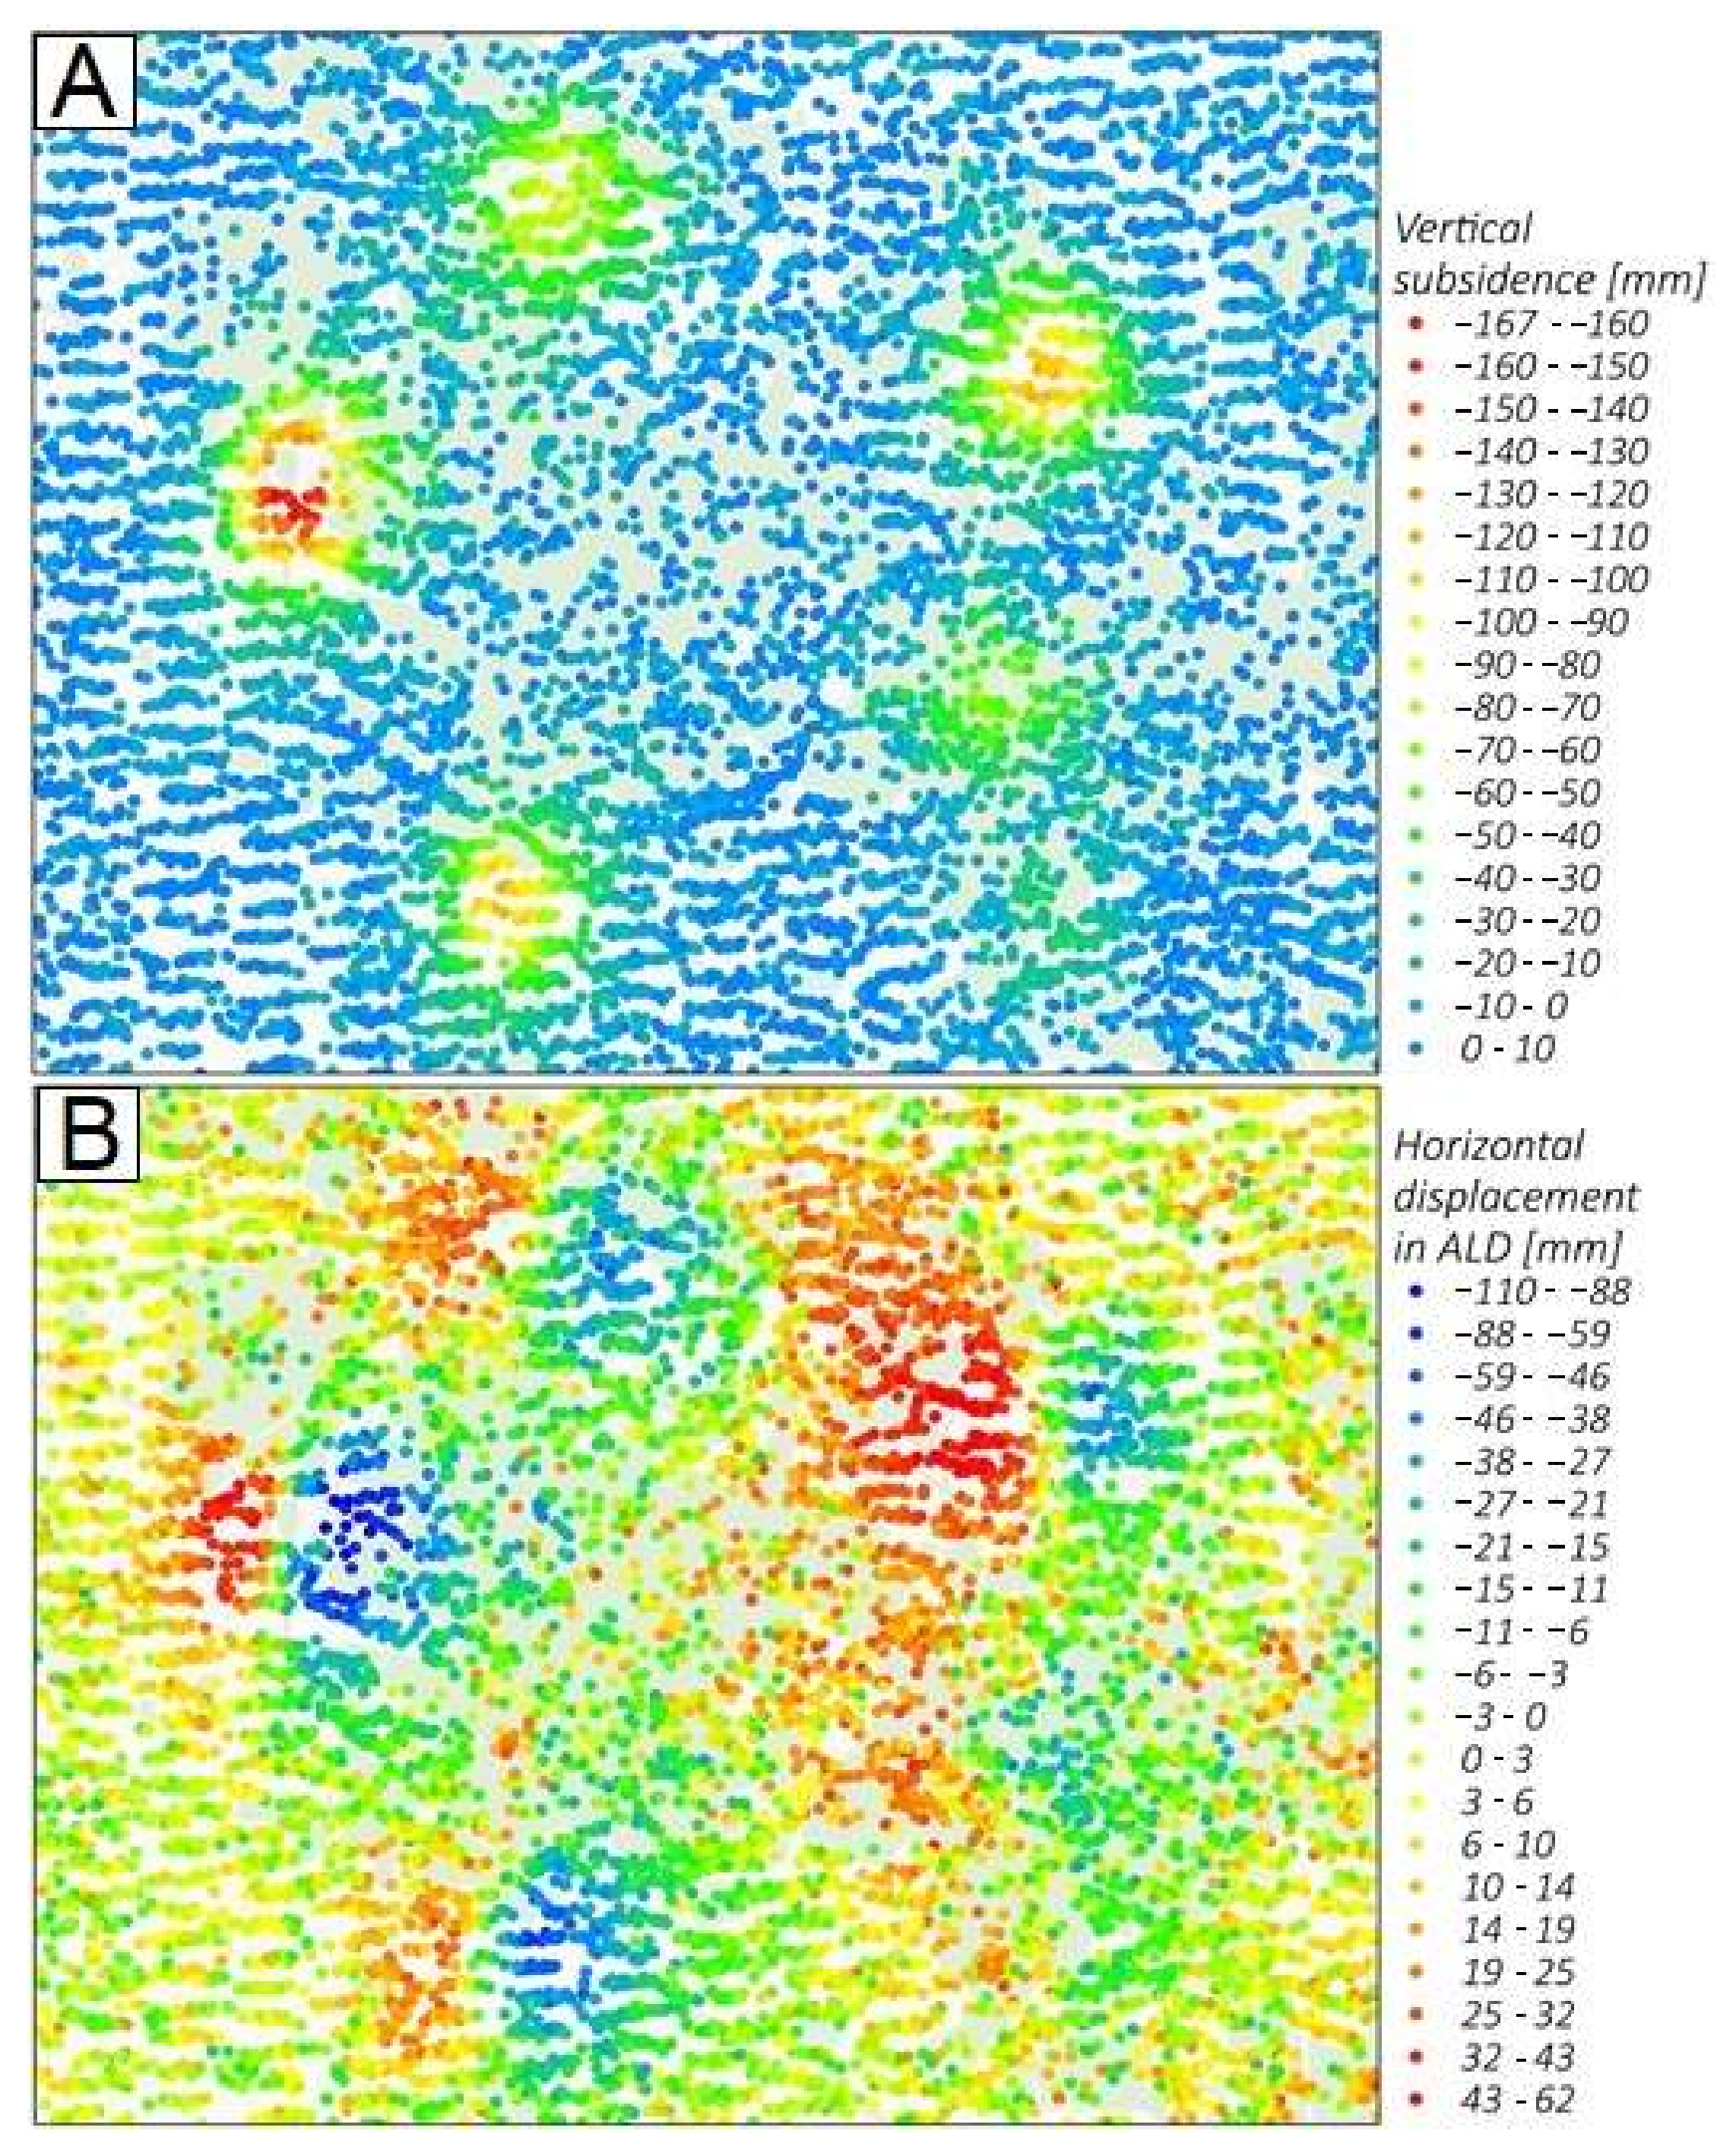
Based on InSAR observations, six subsidence troughs were detected in the case study area. The following analyses were carried out for centroids determined for common PS points from two geometries (ascending and descending). As a result, we obtained the density of the observations of approximately 232 points/km2. The maximum vertical displacements reached −167 mm with σ = ± ranged from −110 mm to +62 mm with σ = ±8 mm. The detected land subsidence has a symmetrical distribution, with the highest values located in the centre of each subsidence trough (Figure 6A). The least visible trough is in the study area’s displacements (Figure 6B). The negative horizontal displacement values reflect westward movement while the positive values show movement into the east. Thus, the eastern parts of each trough have negative horizontal displacement values (displacements towards the centre of land subsidence trough), whereas the western parts have positive displacement values (displacements also towards the centre of land subsidence trough). This demonstrates that the land subsidence in the case study is a gravity-driven process.
Based on the InSAR-retrieved ground movements in the case study area, Equation (2) was used to determine the relationship between the horizontal directional displacement and the first derivative of the vertical displacements (Figure 7). As a result, the proportionality coefficient equal to −308.9 m was obtained. The outcome of the calculations is characterised by a strong correlation coefficient R2 of 0.805. In general, the region with the greatest absolute horizontal displacements corresponds to the highest values of the first derivative of vertical displacement (Figure 7).
The remaining distributions for and values were determined using the parameter. Geostatistical filtering was used to denoise the data before the derivative calculation stage. The most reliable theoretical model for semivariogram function was the Gaussian model with nugget effect in all analysed data. The established relationship between the directional strain and the horizontal tensor strain components allowed the displacement value in to be used and the last strain tensor element related to the axis to be calculated. As a result, the horizontal strain tensor for each site point determined by the MT-InSAR method was obtained. Moreover, the spatial resolution of interferometric analysis data was preserved.
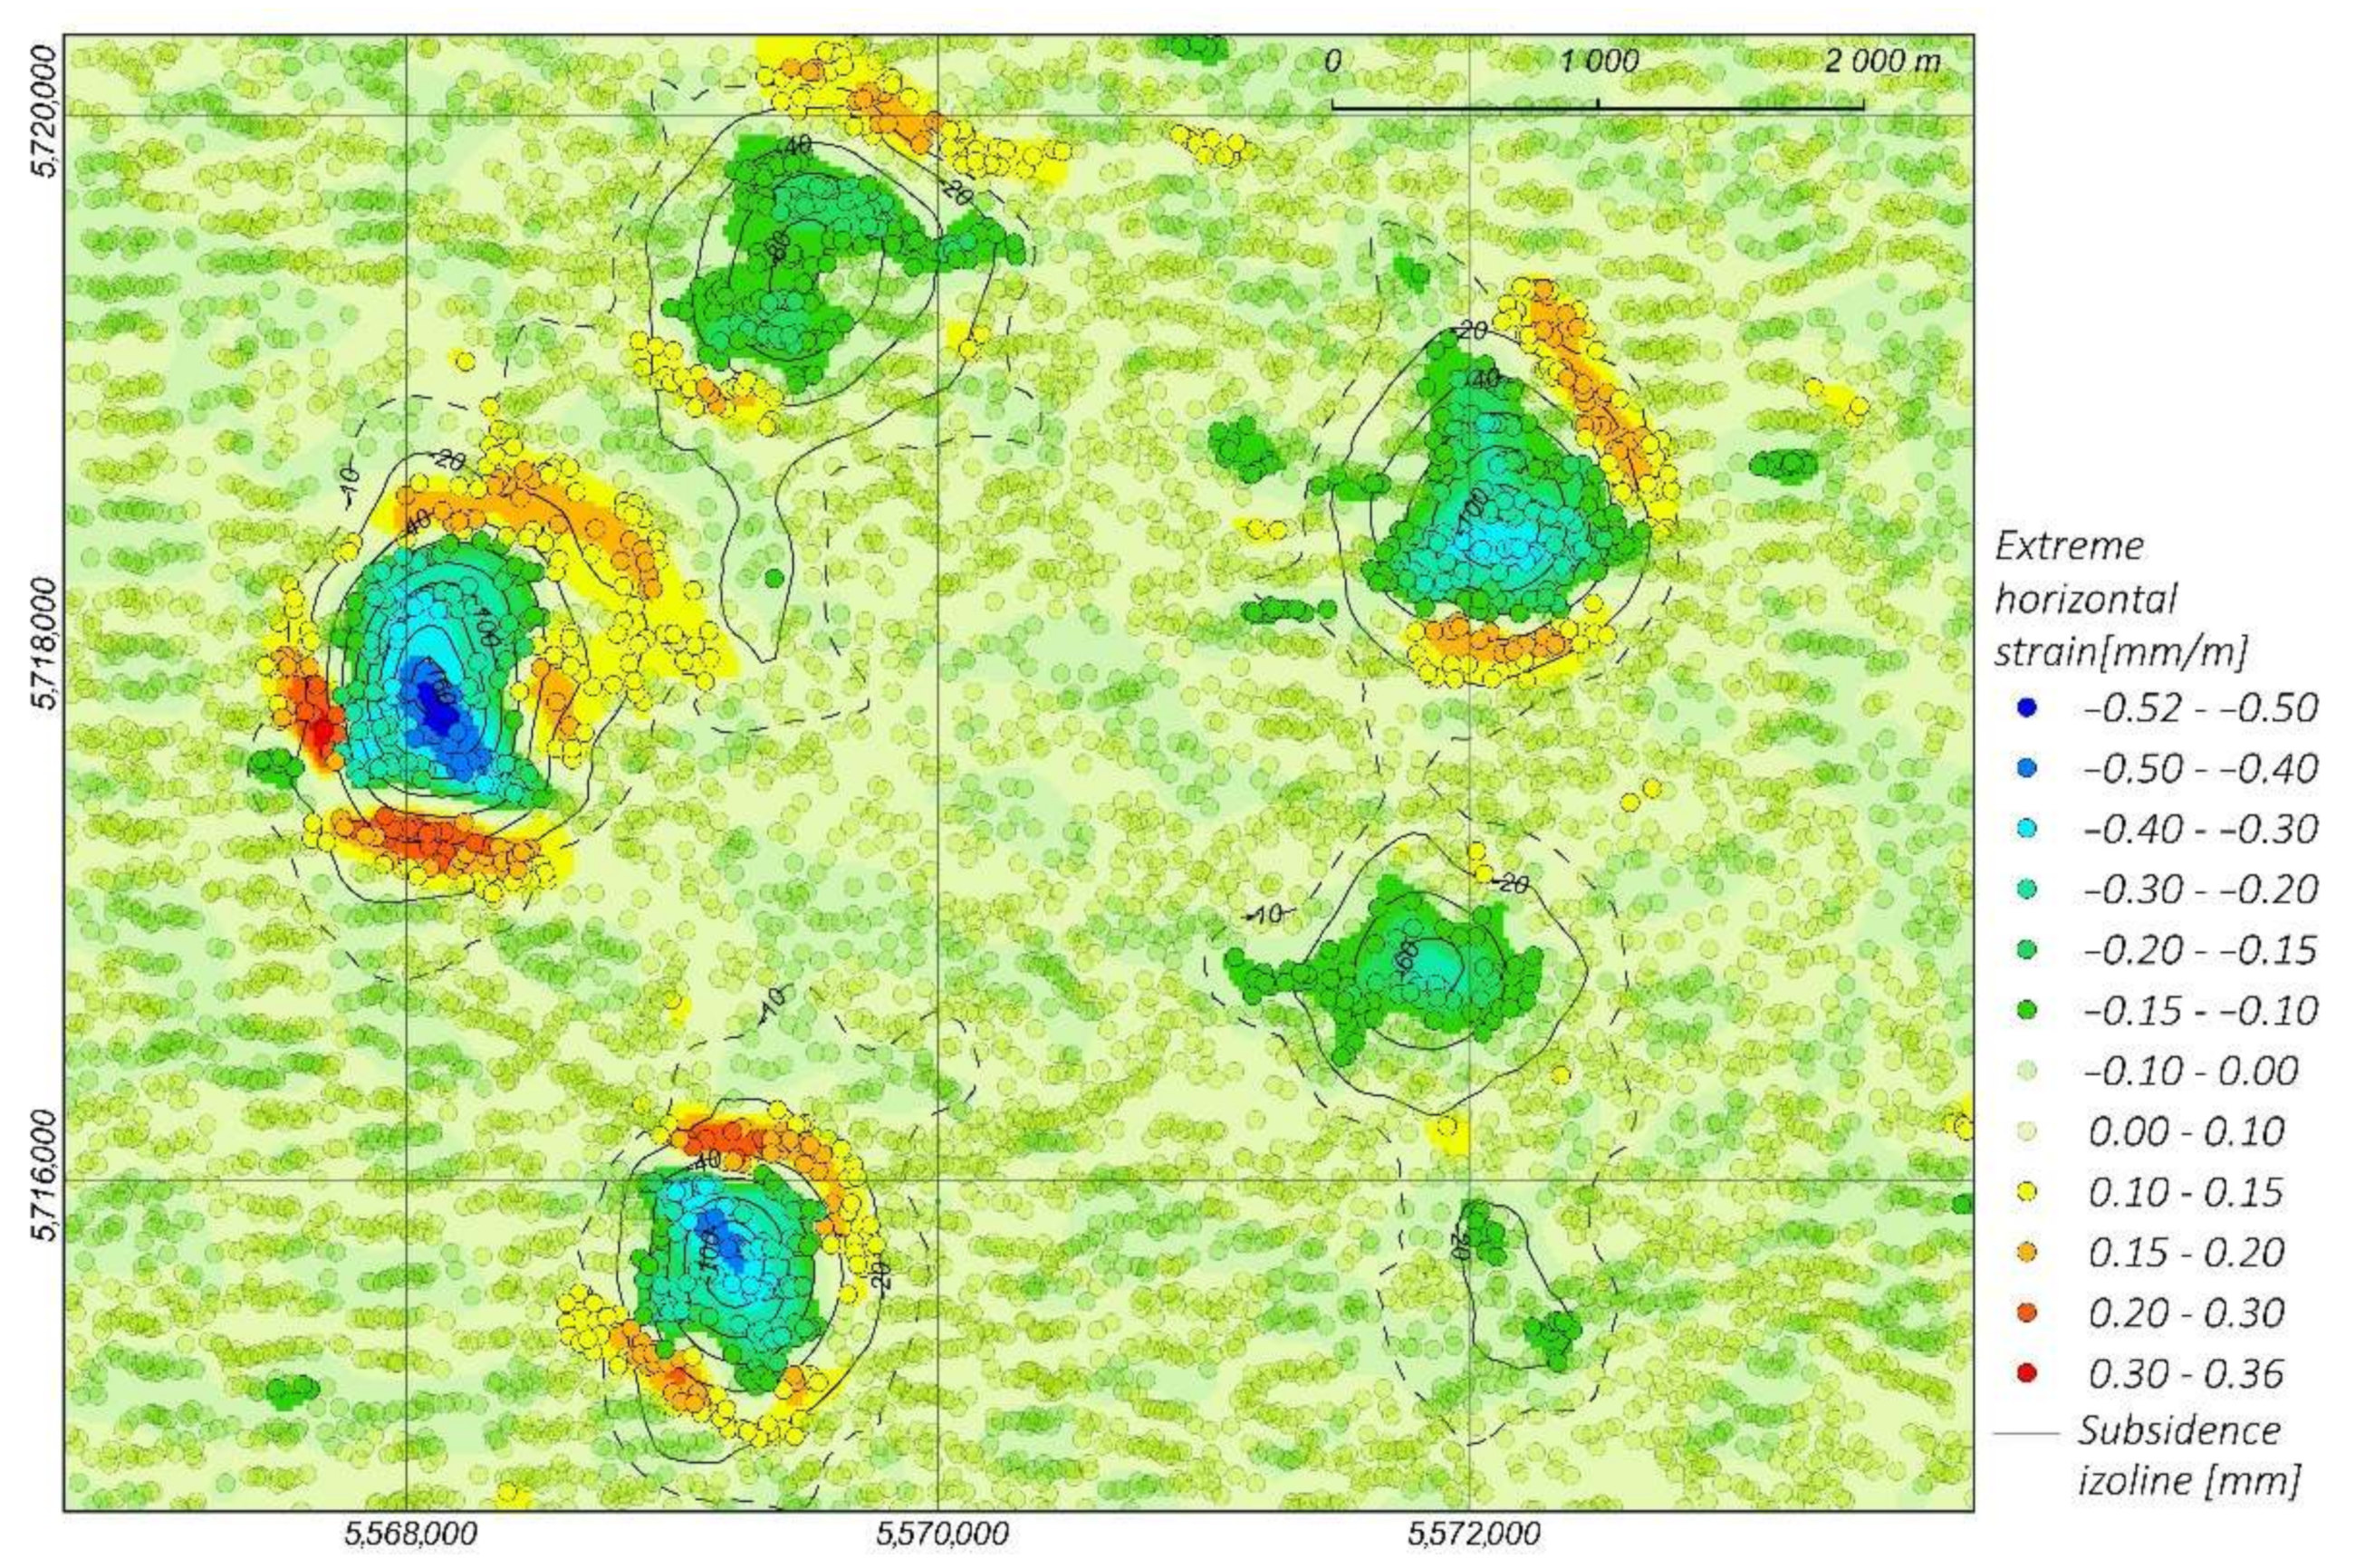
The final stage of the calculations was to determine the maximum and minimum values of horizontal strains in the case study area (Figure 8). Based on these findings, it is possible to conclude that the centres of land subsidence troughs have extreme compressive strains of −0.52 mm/m. In addition, extreme tensile strains of up to +0.36 mm/m occur at the trough’s edge. The asymmetry of these values is related to the accuracy of LOS observations and the physics of the observed phenomenon.
The accuracy of the results was calculated in the potentially stable region, outside the subsidence troughs, considering the variability of these observations. The −10 mm contour was used to establish the border of the land subsidence troughs initially. This value is defined by the vertical displacement accuracy at the level of 2σ of determined vertical displacements. For the following calculations, points from outside the observed troughs were chosen (Figure 8). The average horizontal strain value for these selected points was +0.01 mm/m, with σ = ±0.050 mm/m. Therefore, assuming a 95% confidence level, observations with an accuracy greater than 2σ, namely ±0.100 mm/m, are considered reliable.
5. Conclusions
Land subsidence is a common occurrence worldwide, causing infrastructure damage and posing a direct threat to residents in vulnerable areas. However, since the rock mass and terrain surface deformation process is a complicated research subject reliant on numerous geological, hydrogeological, and geomechanical variables, the spatial extent and values of the phenomenon, and thus its environmental impact, vary significantly.
There are numerous methods for estimating ground surface movements in the case of mining-induced land subsidence. Nevertheless, the horizontal strains that appear in mining areas may also cause significant damage to surface objects. So far, the accurate determination of these values remains a difficult scientific problem. As a result, solutions that allow for the effective determination of the full deformation field of the terrain surface are required. Therefore, the goal of the presented study was to propose a novel method for the reliable estimation of horizontal strains related to the occurrence of land subsidence. Based on double-geometry InSAR and the assumption that the horizontal displacement field is proportional to the first derivative of the vertical displacement field, this method was developed.
It should be noted that in the real-world case study presented in this study, the land surface displacements determined using MT-InSAR were relatively small, ranging from a few milimetres to a few centimetres. As a result, the deformation values of the terrain surface were also small, rarely exceeding 1 mm/m. Nonetheless, the computation results for the real-world case study confirm that the proposed algorithm can determine reliable modelling results with high accuracy even when horizontal strains are small.
Furthermore, since InSAR observations cover large parts of the Earth’s surface and modern satellites, including Sentinel-1, and are characterised by a short revisit time, the method can be successfully applied to gravity-driven phenomena worldwide. As a result, the research presented here may contribute to increased safety in areas of land subsidence caused by various natural and anthropogenic phenomena around the world.
Author Contributions
Conceptualisation, W.T.W. and R.H.; methodology, W.T.W.; software, W.T.W.; validation, W.T.W.; formal analysis, W.T.W.; investigation, W.T.W.; resources, W.T.W.; data curation, W.T.W.; writing—original draft preparation, W.T.W., A.G., M.Ł. and R.H.; writing—review and editing, A.G. and M.Ł.; visualisation, W.T.W. and A.G.; supervision, R.H.; project administration, W.T.W.; funding acquisition, A.G., R.H. and W.T.W. All authors have read and agreed to the published version of the manuscript.
Funding
The APC was funded by A.G., R.H. and W.T.W.
Data Availability Statement
Satellite data used in the study are available for free from the European Space Agency through the Copernicus Open Access Hub at www.scihub.copernicus.eu.
Acknowledgments
We would like to thank the European Space Agency for providing the Sentinel-1 data used in this study. We would also like to thank the anonymous reviewers who contributed significantly to improving the quality of the original paper. The presented research project was supported by the program “Excellence initiative—Research University” for the AGH University of Science and Technology.
Conflicts of Interest
The authors declare no conflict of interest. The funders had no role in the design of the study, in the collection, analyses, or interpretation of data, in the writing of the manuscript, or in the decision to publish the results.
References
- Daito, K.; Galloway, D.L. Preface: Prevention and Mitigation of Natural and Anthoropogenic Hazards Due to Land Subsidence. In Proceedings of the International Association of Hydrological Sciences; Copernicus GmbH: Göttingen, Germany, 2015; Volume 372, pp. 555–557. [Google Scholar] [CrossRef]
- Shi, X.; Fang, R.; Wu, J.; Xu, H.; Sun, Y.Y.; Yu, J. Sustainable Development and Utilization of Groundwater Resources Considering Land Subsidence in Suzhou, China. Eng. Geol. 2012, 124, 77–89. [Google Scholar] [CrossRef]
- Rateb, A.; Abotalib, A.Z. Inferencing the Land Subsidence in the Nile Delta Using Sentinel-1 Satellites and GPS between 2015 and 2019. Sci. Total Environ. 2020, 729, 138868. [Google Scholar] [CrossRef]
- Oh, H.J.; Lee, S. Assessment of Ground Subsidence Using GIS and the Weights-of-Evidence Model. Eng. Geol. 2010. [Google Scholar] [CrossRef]
- Galloway, D.L. Subsidence Induced by Underground Extraction. In Encyclopedia of Earth Sciences Series; Springer: Dordrecht, The Netherlands, 2013; pp. 979–985. [Google Scholar] [CrossRef]
- Galloway, D.L.; Burbey, T.J. Review: Regional Land Subsidence Accompanying Groundwater Extraction. Hydrogeol. J. 2011, 19, 1459–1486. [Google Scholar] [CrossRef]
- Guzy, A.; Ahmed, A.W.; Malinowska, A. Spatio-Temporal Distribution of Land Subsidence and Water Drop Caused by Underground Exploitation of Mineral Resources. In International Multidisciplinary Scientific GeoConference Surveying Geology and Mining Ecology Management; SGEM: Vienna, Austria, 2018. [Google Scholar] [CrossRef]
- International Association of Scientific Hydrology. Land Subsidence: Proceedings of the Tokyo Symposium September 1969. Affaissement Du Sol; Actes Du Colloque de Tokyo Septembre 1969; IASH/AIHS-Unesco: Amsterdam, The Netherlands, 1970. [Google Scholar]
- Jones, C.E.; An, K.; Blom, R.G.; Kent, J.D.; Ivins, E.R.; Bekaert, D. Anthropogenic and Geologic Influences on Subsidence in the Vicinity of New Orleans, Louisiana. J. Geophys. Res. Solid Earth 2016. [Google Scholar] [CrossRef]
- Pacheco-Martínez, J.; Hernandez-Marín, M.; Burbey, T.J.; González-Cervantes, N.; Ortíz-Lozano, J.Á.; Zermeño-De-Leon, M.E.; Solís-Pinto, A. Land Subsidence and Ground Failure Associated to Groundwater Exploitation in the Aguascalientes Valley, México. Eng. Geol. 2013, 164, 172–186. [Google Scholar] [CrossRef]
- Feng, Q.Y.; Liu, G.J.; Lei, M.E.N.G.; Fu, E.J.; Zhang, H.R.; Zhang, K.F. Land Subsidence Induced by Groundwater Extraction and Building Damage Level Assessment—A Case Study of Datun, China. J. China Univ. Min. Technol. 2008, 18, 556–560. [Google Scholar] [CrossRef]
- Riesgo Fernández, P.; Rodríguez Granda, G.; Krzemień, A.; García Cortés, S.; Fidalgo Valverde, G. Subsidence versus Natural Landslides When Dealing with Property Damage Liabilities in Underground Coal Mines. Int. J. Rock Mech. Min. Sci. 2020, 126. [Google Scholar] [CrossRef]
- Whittaker, B.N.; Reddish, D.J. Subsidence: Occurrence, Prediction, and Control; Elsevier: Amsterdam, The Netherlands, 1989. [Google Scholar]
- Kratzsch, H. Introduction; Springer: Berlin/Heidelberg, Germany, 1983. [Google Scholar] [CrossRef]
- Hejmanowski, R.; Malinowska, A.A.; Kwinta, A.; Patykowski, G. Prediction of Land Subsidence and Deformations at Copper Ore Underground Mining Site: Experiences and Verification Based on KGHM Mines in Poland. In Proceedings of the 16th International Congress for Mine Surveying, Brisbane, Australia, 12–16 September 2016; pp. 183–186. [Google Scholar]
- Singh, R.P.; Yadav, R.N. Prediction of Subsidence Due to Coal Mining in Raniganj Coalfield, West Bengal, India. Eng. Geol. 1995. [Google Scholar] [CrossRef]
- Lee, S.; Park, I. Application of Decision Tree Model for the Ground Subsidence Hazard Mapping near Abandoned Underground Coal Mines. J. Environ. Manag. 2013, 127, 166–176. [Google Scholar] [CrossRef] [PubMed]
- Cheng, J.; Liu, F.; Li, S. Model for the Prediction of Subsurface Strata Movement Due to Underground Mining. J. Geophys. Eng. 2017, 14, 1608–1623. [Google Scholar] [CrossRef] [Green Version]
- Ambrožič, T.; Turk, G. Prediction of Subsidence Due to Underground Mining by Artificial Neural Networks. Comput. Geosci. 2003, 29, 627–637. [Google Scholar] [CrossRef] [Green Version]
- Zhang, L.; Cheng, H.; Yao, Z.; Wang, X. Application of the Improved Knothe Time Function Model in the Prediction of Ground Mining Subsidence: A Case Study from Heze City, Shandong Province, China. Appl. Sci. 2020, 10, 3147. [Google Scholar] [CrossRef]
- Hebblewhite, B. Fracturing, Caving Propagation and Influence of Mining on Groundwater above Longwall Panels—A Review of Predictive Models. Int. J. Min. Sci. Technol. 2020. [Google Scholar] [CrossRef]
- Truplett, T.; Yurchak, D. Determination of Intensity Functions for Predicting Subsidence from Coal Mining, Potash Mining, and Groundwater Withdrawal Using the Influence Function Technique. In Proceedings of the 6th International FIG Symposium on Deformation Measurements: Measurement, Modeling and Prediction, Hannover, Germany, 12–13 May 1996; pp. 761–773. [Google Scholar]
- Díaz-Fernández, M.E.; Álvarez-Fernández, M.I.; Álvarez-Vigil, A.E. Computation of Influence Functions for Automatic Mining Subsidence Prediction. Comput. Geosci. 2010. [Google Scholar] [CrossRef]
- Suh, J. An Overview of GIS-Based Assessment and Mapping of Mining-Induced Subsidence. Appl. Sci. 2020, 10, 7845. [Google Scholar] [CrossRef]
- Hejmanowski, R. Modeling of Time Dependent Subsidence for Coal and Ore Deposits. Int. J. Coal Sci. Technol. 2015. [Google Scholar] [CrossRef] [Green Version]
- Wang, B.; Xu, J.; Xuan, D. Time Function Model of Dynamic Surface Subsidence Assessment of Grout-Injected Overburden of a Coal Mine. Int. J. Rock Mech. Min. Sci. 2018, 104, 1–8. [Google Scholar] [CrossRef]
- Barbato, J.; Hebblewhite, B.; Mitra, R.; Mills, K. Prediction of Horizontal Movement and Strain at the Surface Due to Longwall Coal Mining. Int. J. Rock Mech. Min. Sci. 2016, 84, 105–118. [Google Scholar] [CrossRef]
- Fan, L.; Liu, S. Numerical Prediction of in Situ Horizontal Stress Evolution in Coalbed Methane Reservoirs by Considering Both Poroelastic and Sorption Induced Strain Effects. Int. J. Rock Mech. Min. Sci. 2018, 104, 156–164. [Google Scholar] [CrossRef]
- Ewy, R.T.; Hood, M. Surface Strain over Longwall Coal Mines: Its Relation to the Subsidence Trough Curvature and to Surface Topography. Int. J. Rock Mech. Min. Sci. 1984, 21, 155–160. [Google Scholar] [CrossRef]
- Sheorey, P.R.; Loui, J.P.; Singh, K.B.; Singh, S.K. Ground Subsidence Observations and a Modified Influence Function Method for Complete Subsidence Prediction. Int. J. Rock Mech. Min. Sci. 2000, 37, 801–818. [Google Scholar] [CrossRef]
- Marino, G.; Zamiran, S.; Talebi, M. Investigation of the Horizontal Displacement of Ground Surface Due to Longwall Mining. Geotech. Geol. Eng. 2020, 38, 5373–5387. [Google Scholar] [CrossRef]
- Dolinar, D.R. Variation of Horizontal Stresses and Strains in Mines in Bedded Deposits in the Eastern and Midwestern United States. In Proceedings of the 22nd International Conference on Ground Control in Mining, Morgantown, WV, USA, 5–7 August 2003; pp. 178–185. [Google Scholar]
- Sopata, P. Horizontal Strains over the Length of Single Section of Observation Line—Problem Analysis. Geoinformatica Pol. 2020, 19, 31–35. [Google Scholar] [CrossRef]
- Yavaşoğlu, H.H.; Kalkan, Y.; Tiryakioğlu, İ.; Yigit, C.O.; Özbey, V.; Alkan, M.N.; Bilgi, S.; Alkan, R.M. Monitoring the Deformation and Strain Analysis on the Ataturk Dam, Turkey. Geomat. Nat. Hazards Risk 2018, 9, 94–107. [Google Scholar] [CrossRef] [Green Version]
- Kłeczek, Z.; Niedojadło, Z.; Popiołek, E.; Skobliński, W.; Sopata, P.; Stoch, T.; Wójcik, A.; Zeljas, D. Mining Hazards Analysis with Simultaneous Mining Copper Ores and Salt Deposits in LGOM (Legnica-Głogów Copper Belt) Mines with Regard to Dynamic Influences. Arch. Min. Sci. 2016, 61, 553–570. [Google Scholar] [CrossRef] [Green Version]
- Hejmanowski, R.; Malinowska, A.; Stoch, T.; Pluciński, P.; Warchała, M.; Kosior, R. New Interpretation of GPS Measurements Results. Gospod. Surowcami Miner. 2008, 24, 197–204. [Google Scholar]
- Minh, D.H.T.; Hanssen, R.; Rocca, F. Radar Interferometry: 20 Years of Development in Time Series Techniques and Future Perspectives. Remote Sens. 2020, 12, 1364. [Google Scholar] [CrossRef]
- Steinberg, A.; Sudhaus, H.; Heimann, S.; Krüger, F. Sensitivity of InSAR and Teleseismic Observations to Earthquake Rupture Segmentation. Geophys. J. Int. 2020, 223, 875–907. [Google Scholar] [CrossRef]
- Parker, A.L.; Biggs, J.; Lu, Z. Time-Scale and Mechanism of Subsidence at Lassen Volcanic Center, CA, from InSAR. J. Volcanol. Geotherm. Res. 2016, 320, 117–127. [Google Scholar] [CrossRef] [Green Version]
- Wasowski, J.; Pisano, L. Long-Term InSAR, Borehole Inclinometer, and Rainfall Records Provide Insight into the Mechanism and Activity Patterns of an Extremely Slow Urbanized Landslide. Landslides 2020, 17, 445–457. [Google Scholar] [CrossRef]
- Liu, L.; Jiang, L.; Jiang, H.; Wang, H.; Ma, N.; Xu, H. Accelerated Glacier Mass Loss (2011–2016) over the Puruogangri Ice Field in the Inner Tibetan Plateau Revealed by Bistatic InSAR Measurements. Remote Sens. Environ. 2019, 231, 111241. [Google Scholar] [CrossRef]
- Yang, Z.; Li, Z.; Zhu, J.; Wang, Y.; Wu, L. Use of SAR/InSAR in Mining Deformation Monitoring, Parameter Inversion, and Forward Predictions: A Review. IEEE Geosci. Remote Sens. Mag. 2020, 8, 71–90. [Google Scholar] [CrossRef]
- Strozzi, T.; Caduff, R.; Wegmüller, U.; Raetzo, H.; Hauser, M. Widespread Surface Subsidence Measured with Satellite SAR Interferometry in the Swiss Alpine Range Associated with the Construction of the Gotthard Base Tunnel. Remote Sens. Environ. 2017, 190, 1–12. [Google Scholar] [CrossRef]
- Thomas, A. Mapping of Surface Deformation and Displacement Associated with the 6.5 Magnitude Botswana Earthquake of 3 April 2017 Using Dinsar Analysis. Geomat. Environ. Eng. 2020, 14, 81–100. [Google Scholar] [CrossRef]
- Hanssen, R. Radar Interferometry—Data Interpretation and Error Analysis, 1st ed.; Remote Sensing and Digital Image Processing; Springer: Dordrecht, The Netherlands, 2001; Volume 2. [Google Scholar] [CrossRef] [Green Version]
- Wright, T.J.; Parsons, B.E.; Lu, Z. Toward Mapping Surface Deformation in Three Dimensions Using InSAR. Geophys. Res. Lett. 2004, 31. [Google Scholar] [CrossRef] [Green Version]
- Yang, Z.; Li, Z.; Zhu, J.; Preusse, A.; Hu, J.; Feng, G.; Wang, Y.; Papst, M. An InSAR-Based Temporal Probability Integral Method and Its Application for Predicting Mining-Induced Dynamic Deformations and Assessing Progressive Damage to Surface Buildings. IEEE J. Sel. Top. Appl. Earth Obs. Remote Sens. 2018, 11, 472–484. [Google Scholar] [CrossRef]
- Hu, J.; Li, Z.W.; Ding, X.L.; Zhu, J.J.; Zhang, L.; Sun, Q. Resolving Three-Dimensional Surface Displacements from InSAR Measurements: A Review. Earth-Sci. Rev. 2014, 133, 1–17. [Google Scholar] [CrossRef]
- Fan, H.; Wang, L.; Wen, B.; Du, S. A New Model for Three-Dimensional Deformation Extraction with Single-Track InSAR Based on Mining Subsidence Characteristics. Int. J. Appl. Earth Obs. Geoinf. 2021, 94, 102223. [Google Scholar] [CrossRef]
- Ren, H.; Feng, X. Calculating Vertical Deformation Using a Single InSAR Pair Based on Singular Value Decomposition in Mining Areas. Int. J. Appl. Earth Obs. Geoinf. 2020, 92, 102115. [Google Scholar] [CrossRef]
- Yang, Z.; Li, Z.; Zhu, J.; Preusse, A.; Yi, H.; Hu, J.; Feng, G.; Papst, M. Retrieving 3-D Large Displacements of Mining Areas from a Single Amplitude Pair of SAR Using Offset Tracking. Remote Sens. 2017, 9, 338. [Google Scholar] [CrossRef] [Green Version]
- Liu, J.H.; Hu, J.; Li, Z.W.; Zhu, J.J.; Sun, Q.; Gan, J. A Method for Measuring 3-D Surface Deformations with InSAR Based on Strain Model and Variance Component Estimation. IEEE Trans. Geosci. Remote Sens. 2018, 56, 239–250. [Google Scholar] [CrossRef]
- Kwinta, A. Prediction of Strain in a Shaft Caused by Underground Mining. Int. J. Rock Mech. Min. Sci. 2012, 55, 28–32. [Google Scholar] [CrossRef]
- Malinowska, A.; Hejmanowski, R. Building Damage Risk Assessment on Mining Terrains in Poland with GIS Application. Int. J. Rock Mech. Min. Sci. 2010, 47, 238–245. [Google Scholar] [CrossRef]
- Diao, X.; Bai, Z.; Wu, K.; Zhou, D.; Li, Z. Assessment of Mining-Induced Damage to Structures Using InSAR Time Series Analysis: A Case Study of Jiulong Mine, China. Environ. Earth Sci. 2018, 77, 166. [Google Scholar] [CrossRef]
- Yang, Z.; Li, Z.; Zhu, J.; Feng, G.; Wang, Q.; Hu, J.; Wang, C. Deriving Time-Series Three-Dimensional Displacements of Mining Areas from a Single-Geometry InSAR Dataset. J. Geod. 2018, 92, 529–544. [Google Scholar] [CrossRef]
- Samsonov, S.; Dille, A.; Dewitte, O.; Kervyn, F.; D’Oreye, N. Satellite Interferometry for Mapping Surface Deformation Time Series in One, Two and Three Dimensions: A New Method Illustrated on a Slow-Moving Landslide. Eng. Geol. 2020, 266, 105471. [Google Scholar] [CrossRef]
- Gourmelen, N.; Kim, S.W.; Shepherd, A.; Park, J.W.; Sundal, A.V.; Björnsson, H.; Pálsson, F. Ice Velocity Determined Using Conventional and Multiple-Aperture InSAR. Earth Planet. Sci. Lett. 2011, 307, 156–160. [Google Scholar] [CrossRef] [Green Version]
- Ligas, M.; Kulczycki, M. Kriging and Moving Window Kriging on a Sphere in Geometric (GNSS/Levelling) Geoid Modelling. Surv. Rev. 2018, 50, 155–162. [Google Scholar] [CrossRef]
- Kaczmarek, W.; Rożek, R. Budowa Geologiczna i Zagospodarowanie Złoża Głogów Głęboki-Przemysłowy (KGHM Polska Miedź S.A.). Gospod. Surowcami Miner. 2008, 24, 129–141. [Google Scholar]
- Burtan, Z. The Influence of Regional Geological Settings on the Seismic Hazard Level in Copper Mines in the Legnica-Głogów Copper Belt Area (Poland). In E3S Web of Conferences; EDP Sciences: Les Ulis, France, 2017; Volume 24, p. 01004. [Google Scholar] [CrossRef] [Green Version]
- Oszczepalski, S.; Speczik, S.; Zieliński, K.; Chmielewski, A. The Kupferschiefer Deposits and Prospects in SW Poland: Past, Present and Future. Minerals 2019, 9, 592. [Google Scholar] [CrossRef] [Green Version]
- Copper and Silver Resources in Poland—Polish Geological Institute-National Research Institute. Available online: https://www.pgi.gov.pl/en/psg-1/psg-2/informacja-i-szkolenia/wiadomosci-surowcowe/10934-copper-and-silver-resources-in-poland.html (accessed on 30 May 2021).
- Cieślik, J.; Burtan, Z.; Chlebowski, D.; Zorychta, A. Geomechanical Analysis of Location and Conditions for Mining-Induced Tremors in LGOM Copper Mines. J. Sustain. Min. 2017, 16, 94–103. [Google Scholar] [CrossRef]
- KGHM Corporate Website. Available online: https://kghm.com/en (accessed on 30 May 2021).
- Krawczyk, A.; Perski, Z. Application of Satellite Radar Interferometry on the Areas of Underground Exploitation of Copper Ore in LGOM—Poland. In Proceedings of the 11th International Congress of the International Society for Mine Surveying, Cracow, Poland, 5–10 September 2000; pp. 209–218. [Google Scholar]
- Zembaty, Z. Rockburst Induced Ground Motion-a Comparative Study. Soil Dyn. Earthq. Eng. 2004, 24, 11–23. [Google Scholar] [CrossRef]
- Kozłowska, M. Analysis of Spatial Distribution of Mining Tremors Occurring in Rudna Copper Mine (Poland). Acta Geophys. 2013, 61, 1156–1169. [Google Scholar] [CrossRef]
- Caputa, A.; Rudziński, Ł. Source Analysis of Post-Blasting Events Recorded in Deep Copper Mine, Poland. Pure Appl. Geophys. 2019, 176, 3451–3466. [Google Scholar] [CrossRef] [Green Version]
- Kozłowska, M.; Jamroz, M.; Olszewska, D. On the Aftershock Productivity in Mining-Induced Seismicity-Insight into Seismicity of Rudna Copper Ore Mine, Poland. Geophys. J. Int. 2021, 225, 1258–1270. [Google Scholar] [CrossRef]
- Kwiatek, G. A Search for Sequences of Mining-Induced Seismic Events at the Rudna Copper Mine in Poland. Acta Geophys. Pol. 2004, 52, 155–171. [Google Scholar]
- Owczarz, K.; Blachowski, J. Application of DInSAR and Spatial Statistics Methods in Analysis of Surface Displacements Caused by Induced Tremors. Appl. Sci. 2020, 10, 7660. [Google Scholar] [CrossRef]
- Milczarek, W. Investigation of Post Inducted Seismic Deformation of the 2016 Mw4.2 Tarnowek Poland Mining Tremor Based on DInSAR and SBAS Methods. Acta Geodyn. Geomater. 2019, 16, 183–193. [Google Scholar] [CrossRef]
- Tama, A.; Guzy, A.; Witkowski, W.; Hejmanowski, R.; Malinowska, A. Mapping Vertical Ground Movement Caused by Human-Induced Seismicity Applying Satellite Radar Interferometry and Geostatistics. In International Multidisciplinary Scientific GeoConference Surveying Geology and Mining Ecology Management; SGEM: Vienna, Austria, 2018; Volume 18, pp. 155–162. [Google Scholar] [CrossRef]
- Marcak, H.; Pilecki, Z. Assessment of the Subsidence Ratio Be Based on Seismic Noise Measurements in Mining Terrain. Arch. Min. Sci. 2019, 64, 197–212. [Google Scholar] [CrossRef]
- Ilieva, M.; Rudziński, Ł.; Pawłuszek-Filipiak, K.; Lizurek, G.; Kudłacik, I.; Tondaś, D.; Olszewska, D. Combined Study of a Significant Mine Collapse Based on Seismological and Geodetic Data-29 January 2019, Rudna Mine, Poland. Remote Sens. 2020, 12, 1570. [Google Scholar] [CrossRef]
- Owczarz, K.; Blachowski, J. Analysis of the Geometry of Surface Deformations Caused by Induced Tremors in the Area of Underground Copper Mining. In ISPRS Annals of the Photogrammetry, Remote Sensing and Spatial Information Sciences; Copernicus GmbH: Göttingen, Germany, 2020; Volume 5, pp. 149–156. [Google Scholar] [CrossRef]
- Hejmanowski, R.; Malinowska, A.A.; Witkowski, W.T.; Guzy, A. An Analysis Applying InSAR of Subsidence Caused by Nearby Mining-Induced Earthquakes. Geosciences 2019, 9, 490. [Google Scholar] [CrossRef] [Green Version]
- Milczarek, W.; Kopeć, A.; Głąbicki, D.; Bugajska, N. Induced Seismic Events—Distribution of Ground Surface Displacements Based on InSAR Methods and Mogi and Yang Models. Remote Sens. 2021, 13, 1451. [Google Scholar] [CrossRef]
- Bugajska, N.J.; Milczarek, W.J. Remote Sensing Monitoring of Influence of Underground Mining in the Area of the S3 Express Road. IOP Conf. Ser. Earth Environ. Sci. 2021, 684, 012028. [Google Scholar] [CrossRef]
- Malinowska, A.A.; Witkowski, W.T.; Guzy, A.; Hejmanowski, R. Mapping Ground Movements Caused by Mining-Induced Earthquakes Applying Satellite Radar Interferometry. Eng. Geol. 2018, 246, 402–411. [Google Scholar] [CrossRef]
- Hejmanowski, R.; Witkowski, W.T.; Guzy, A.; Malinowska, A. Identification of the Ground Movements Caused by Mining-Induced Seismicity with the Satellite Interferometry. Proc. Int. Assoc. Hydrol. Sci. 2020, 382, 297–301. [Google Scholar] [CrossRef]
- Milczarek, W. Application of a Small Baseline Subset Time Series Method with Atmospheric Correction in Monitoring Results of Mining Activity on Ground Surface and in Detecting Induced Seismic Events. Remote Sens. 2019, 11, 1008. [Google Scholar] [CrossRef] [Green Version]
- Malinowska, A.; Hejmanowski, R.; Dai, H.Y. Ground Movements Modeling Applying Adjusted Influence Function. Int. J. Min. Sci. Technol. 2020, 30, 243–249. [Google Scholar] [CrossRef]
- Knothe, S. Equation of the Subsidence Profile. Arch. Min. Metall. 1953, 1, 22–38. [Google Scholar]
- Witkowski, W.T.; Hejmanowski, R. Software for Estimation of Stochastic Model Parameters for a Compacting Reservoir. Appl. Sci. 2020, 10, 3287. [Google Scholar] [CrossRef]
- European Space Agency. Open Access Hub. Available online: https://scihub.copernicus.eu/ (accessed on 16 July 2021).
- Berardino, P.; Fornaro, G.; Lanari, R.; Sansosti, E. A New Algorithm for Surface Deformation Monitoring Based on Small Baseline Differential SAR Interferograms. IEEE Trans. Geosci. Remote Sens. 2002, 40, 2375–2383. [Google Scholar] [CrossRef] [Green Version]
- Pepe, A.; Calò, F. A Review of Interferometric Synthetic Aperture RADAR (InSAR) Multi-Track Approaches for the Retrieval of Earth’s Surface Displacements. Appl. Sci. 2017, 7, 1264. [Google Scholar] [CrossRef] [Green Version]
- Del Soldato, M.; Confuorto, P.; Bianchini, S.; Sbarra, P.; Casagli, N. Review of Works Combining GNSS and InSAR in Europe. Remote Sens. 2021, 13, 1684. [Google Scholar] [CrossRef]
- Hooper, A.J. A Multi-Temporal InSAR Method Incorporating Both Persistent Scatterer and Small Baseline Approaches. Geophys. Res. Lett. 2008, 35. [Google Scholar] [CrossRef] [Green Version]
- Pawluszek-Filipiak, K.; Borkowski, A. Integration of DInSAR and SBAS Techniques to Determine Mining-Related Deformations Using Sentinel-1 Data: The Case Study of Rydułtowy Mine in Poland. Remote Sens. 2020, 12, 242. [Google Scholar] [CrossRef] [Green Version]
- Singh Virk, A.; Singh, A.; Mittal, S.K. Advanced MT-InSAR Landslide Monitoring: Methods and Trends. J. Remote Sens. GIS 2018, 7. [Google Scholar] [CrossRef]
- Mahmud, M.U.; Yakubu, T.A.; Oluwafemi, O.; Sousa, J.J.; Ruiz-Armenteros, A.M.; Arroyo-Parras, J.G.; Bakoň, M.; Lazecky, M.; Perissin, D. Application of Multi-Temporal Interferometric Synthetic Aperture Radar (MT-InSAR) Technique to Land Deformation Monitoring in Warri Metropolis, Delta State, Nigeria. In Procedia Computer Science; Elsevier B.V.: Amsterdam, The Netherlands, 2016; Volume 100, pp. 1220–1227. [Google Scholar] [CrossRef] [Green Version]
- Devara, M.; Tiwari, A.; Dwivedi, R. Landslide Susceptibility Mapping Using MT-InSAR and AHP Enabled GIS-Based Multi-Criteria Decision Analysis. Geomat. Nat. Hazards Risk 2021, 12, 675–693. [Google Scholar] [CrossRef]
- Wu, S.; DIng, X.; Zhang, B. Continuous Monitoring the Ground Deformation by a Step-by-Step Estimator in MTInSAR. In International Geoscience and Remote Sensing Symposium (IGARSS); Institute of Electrical and Electronics Engineers Inc.: Piscataway, NJ, USA, 2019; pp. 1994–1997. [Google Scholar] [CrossRef]
- Gatsios, T.; Cigna, F.; Tapete, D.; Sakkas, V.; Pavlou, K.; Parcharidis, I. Copernicus Sentinel-1 MT-InSAR, GNSS and Seismic Monitoring of Deformation Patterns and Trends at the Methana Volcano, Greece. Appl. Sci. 2020, 10, 6445. [Google Scholar] [CrossRef]
- Luo, Q.; Zhou, G.; Perissin, D. Monitoring of Subsidence along Jingjin Inter-City Railway with High-Resolution TerraSAR-X MT-InSAR Analysis. Remote Sens. 2017, 9, 717. [Google Scholar] [CrossRef] [Green Version]
- Peng, M.M.; Zhao, C.Y.; Zhang, Q.; Zhang, J.; Liu, Y.Y. Ground Subsidence Monitoring with MT-InSAR and Mechanism Inversion over Xi’an, China. In International Archives of the Photogrammetry, Remote Sensing and Spatial Information Sciences—ISPRS Archives; International Society for Photogrammetry and Remote Sensing: Hannover, Germany, 2018; Volume 42, pp. 1375–1380. [Google Scholar] [CrossRef] [Green Version]
- Fatholahi, S.N.; He, H.; Wang, L.; Syed, A.; Li, J. Monitoring Surface Deformation over Oilfield Using MT-InSAR and Production Well Data. arXiv 2021, arXiv:2103.10985. [Google Scholar]
- Lanari, R.; Mora, O.; Manunta, M.; Mallorquí, J.J.; Berardino, P.; Sansosti, E. A Small-Baseline Approach for Investigating Deformations on Full-Resolution Differential SAR Interferograms. IEEE Trans. Geosci. Remote Sens. 2004, 42, 1377–1386. [Google Scholar] [CrossRef]
- Lanari, R.; Casu, F.; Manzo, M.; Zeni, G.; Berardino, P.; Manunta, M.; Pepe, A. An Overview of the Small BAseline Subset Algorithm: A DInSAR Technique for Surface Deformation Analysis. Pure Appl. Geophys. 2007, 164, 637–661. [Google Scholar] [CrossRef]
Figure 1.
(A) Location of the case study area in the map of Poland; (B) mining areas belonging to the Kombinat Górniczo-Hutniczy Miedzi (KGHM) Company in the area of interest; (C) main built-up areas and surface infrastructure in the case study.
Figure 1.
(A) Location of the case study area in the map of Poland; (B) mining areas belonging to the Kombinat Górniczo-Hutniczy Miedzi (KGHM) Company in the area of interest; (C) main built-up areas and surface infrastructure in the case study.

Figure 2.
(A) 3-D overview of the model data used in the study during the theoretical computational experiment; (B) vertical cross-section of the model.
Figure 2.
(A) 3-D overview of the model data used in the study during the theoretical computational experiment; (B) vertical cross-section of the model.

Figure 3.
The configuration of interferograms used in the investigation on a time plot, with the perpendicular baseline for Sentinel-1 satellite acquisitions in ascending (A) and descending (B) mode.
Figure 3.
The configuration of interferograms used in the investigation on a time plot, with the perpendicular baseline for Sentinel-1 satellite acquisitions in ascending (A) and descending (B) mode.

Figure 4.
The flowchart of the research methodology.

Figure 5.
The vertical displacements (A) and the horizontal strains (B) obtained from model data. The calculated deformation values (C) follow the same colour scheme as the model values. The disparity between theoretical and calculated values is displayed in (D).
Figure 5.
The vertical displacements (A) and the horizontal strains (B) obtained from model data. The calculated deformation values (C) follow the same colour scheme as the model values. The disparity between theoretical and calculated values is displayed in (D).

Figure 6.
The results of the LOS decomposition into the vertical (A) and ALD horizontal (B) components of the land surface displacement field in the case study.
Figure 6.
The results of the LOS decomposition into the vertical (A) and ALD horizontal (B) components of the land surface displacement field in the case study.

Figure 7.
The relationship between ALD horizontal displacements and the directional derivative of the vertical displacement field in the case study.
Figure 7.
The relationship between ALD horizontal displacements and the directional derivative of the vertical displacement field in the case study.

Figure 8.
The distribution of extreme horizontal strain values and isolines of vertical displacements in the case study. The ‘−10 mm’ isoline is represented by the dashed line, whereas isolines between ‘−20 mm’ and ’20 mm’ are denoted by continuous lines every ’20 mm’.
Figure 8.
The distribution of extreme horizontal strain values and isolines of vertical displacements in the case study. The ‘−10 mm’ isoline is represented by the dashed line, whereas isolines between ‘−20 mm’ and ’20 mm’ are denoted by continuous lines every ’20 mm’.

Publisher’s Note: MDPI stays neutral with regard to jurisdictional claims in published maps and institutional affiliations. |
© 2021 by the authors. Licensee MDPI, Basel, Switzerland. This article is an open access article distributed under the terms and conditions of the Creative Commons Attribution (CC BY) license (https://creativecommons.org/licenses/by/4.0/).
Share and Cite
MDPI and ACS Style
Witkowski, W.T.; Łukosz, M.; Guzy, A.; Hejmanowski, R. Estimation of Mining-Induced Horizontal Strain Tensor of Land Surface Applying InSAR. Minerals 2021, 11, 788. https://0-doi-org.brum.beds.ac.uk/10.3390/min11070788
AMA Style
Witkowski WT, Łukosz M, Guzy A, Hejmanowski R. Estimation of Mining-Induced Horizontal Strain Tensor of Land Surface Applying InSAR. Minerals. 2021; 11(7):788. https://0-doi-org.brum.beds.ac.uk/10.3390/min11070788
Chicago/Turabian StyleWitkowski, Wojciech T., Magdalena Łukosz, Artur Guzy, and Ryszard Hejmanowski. 2021. "Estimation of Mining-Induced Horizontal Strain Tensor of Land Surface Applying InSAR" Minerals 11, no. 7: 788. https://0-doi-org.brum.beds.ac.uk/10.3390/min11070788
Note that from the first issue of 2016, this journal uses article numbers instead of page numbers. See further details here.